26
Chad Dechow Penn State University SIRE SELECTION CONSIDERATIONS FOR DAIRY PRODUCERS

Chad Dechow
Penn State University
SIRE SELECTION
CONSIDERATIONS FOR DAIRY PRODUCERS

Adoption of genomicsProgress versus lagSelection indexes Breeding for healthier cows
OUTLINE

NUMBER GENOTYPED
1-200
99-2
0109-2
0119-2
0129-2
0139-2
0149-2
015
05,000
10,00015,00020,00025,00030,000
Females
1-200
9
11-20
101-2
0123-2
0135-2
0147-2
015
02,0004,0006,0008,000
10,00012,00014,000
Males
HolsteinJersey
CDCB; 2016

GENERATION INTERVAL
2005 2006 2007 2008 2009 2010 2011 2012 2013012345678
Sire Dam
Age
whe
n so
n bo
rn
Norman et al., 2014.

GENOMIC EFFECT
Number of bulls entering AI has not shifted dramaticallyUsed differently
Generation interval halved for siresDams also lower
Accelerated rate of genetic progress Degree is uncertain

GENETIC PROGRESS ASSUMPTION
Interval Generation Dev.St. Genetic*Intensity Selection*yreliabilit
ΔG/Year
1975
1978
1981
1984
1987
1990
1993
1996
1999
2002
2005
2008
2011
-800-600-400-200
0200400
Net Merit
Sire BVCow BVLong lagShort lag
Birth Year
$

UNFAVORABLE TREND AND LAG
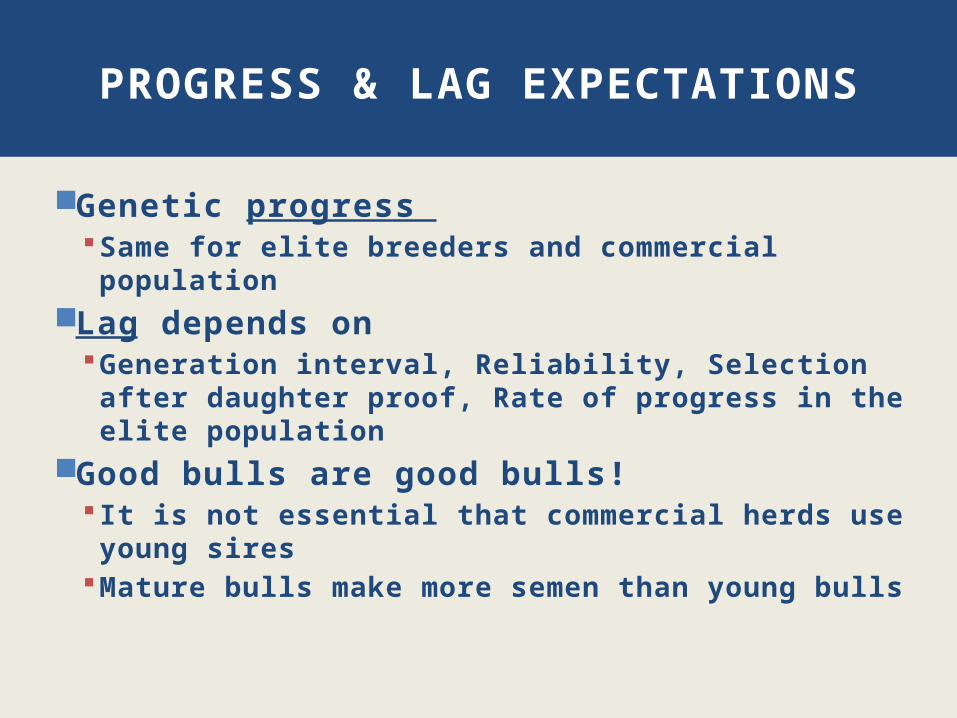
PROGRESS & LAG EXPECTATIONS
Genetic progress Same for elite breeders and commercial population
Lag depends onGeneration interval, Reliability, Selection after
daughter proof, Rate of progress in the elite population
Good bulls are good bulls! It is not essential that commercial herds use young
siresMature bulls make more semen than young bulls

Young siresBorn 2008 to 2009 0 daughters in
2012 ≥100 daughters in
2015DPR
Top 25%Protein lbs
Top 10%
Proven BullsBorn 2000 to 2007 ≥100 daughters in
2012 ≥100 added by
2015DPR
Top 10%Protein lbs
Top 5%
2012 V. 2015

Young Proven0
0.5
1
1.5
2
2.5
3
3.5
20122015
DPR

Young Proven05
1015202530354045
20122015
PROTEIN LBS

We evaluate bulls for more than 40 traits!Time consumingEasy to lose focus on most important traits
Start with a selection index
HOW MANY TRAITS?

Protein yield exampleProtein price projection = $2.48/pound Increased feed required = $0.90/poundHealth costs = $0.09/pound
[$2.48/pound - $0.90 additional feed - $0.09 additional health] * 2.78 lactations = $4.14/pound
HOW IS AN INDEX VALUE DERIVED?
"Parmigiano reggiano factory". CC BY-SA 3.0 via Wikimedia Commons

Protein20%
Fat22%
Milk1%PL
19%
SCS7%
Udder8%
Feet/legs3%
Body size5%
Fertility10%
Calving ability5%
EMPHASIS IN $NM

Holstein TPI Jersey JPI Brown Swiss PPR
Lifetime Net Merit
0%20%40%60%80%
100%
Protein Fat Fertility Productive lifeMastitis resistance Other
Emph
asis
INDEX COMPARISON
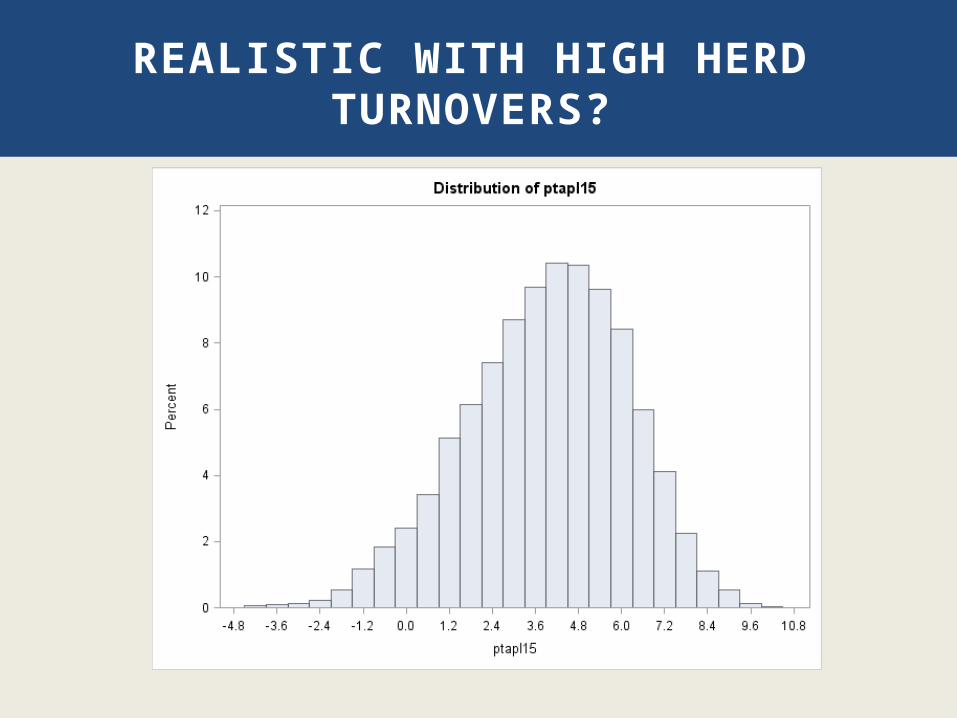
REALISTIC WITH HIGH HERD TURNOVERS?

Died, High Mortality
Herds
Died, Low Mortality
Herds
60-d, High Mortality
Herds
60-d, Low Mortality
Herds
0123456789
10
Low PL High PL
% d
ied
/ cul
led
HERD ENVIRONMENT & PRODUCTIVE LIFE
*
*
*P<0.05 Dechow et al., 2012
*
*

MASTITIS EXAMPLE
-2.5 -1.5 -0.5 0.5 1.5 2.5 3.5-2
-1.5-1
-0.50
0.51
1.52
2.5
Udder Depth
STA
Mas
titis
2.4 2.8 3.2 3.6SCS

KETOSIS EXAMPLE
-2.5 -1.5 -0.5 0.5 1.5 2.5 3.5-2
-1.5-1
-0.50
0.51
1.52
2.5
Dairy Form
STA
Ket
osis
-5 -3 -1 1 3 5PL
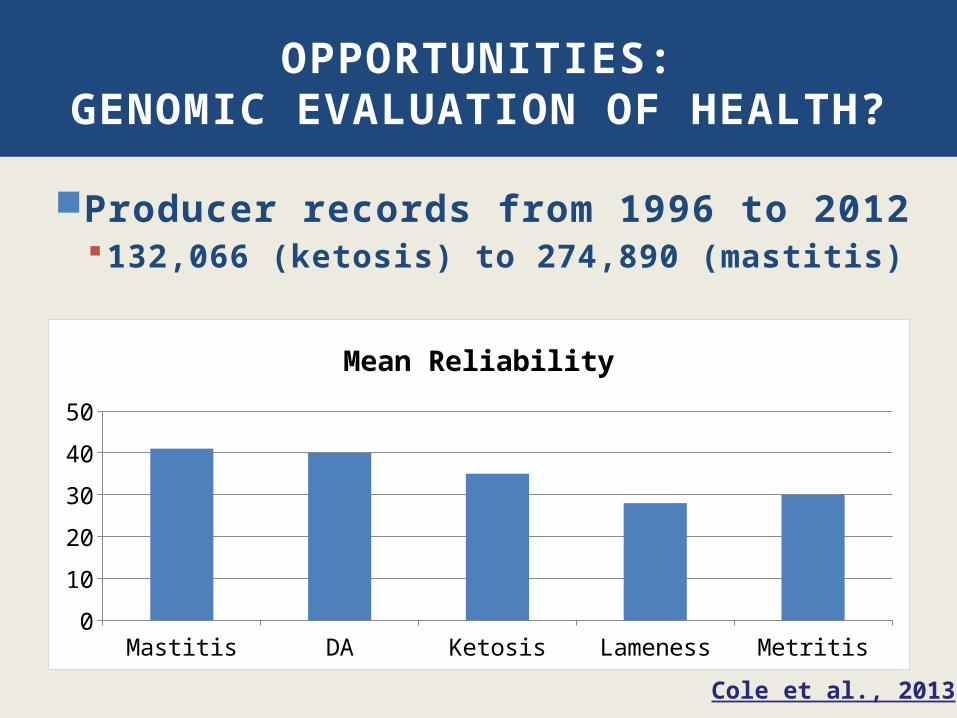
OPPORTUNITIES:GENOMIC EVALUATION OF HEALTH?
Producer records from 1996 to 2012132,066 (ketosis) to 274,890 (mastitis)
Mastitis DA Ketosis Lameness Metritis0
1020304050
Mean Reliability
Cole et al., 2013

Breed for extremes, or optimal?Be realistic about your
management systemPSU trial herds
Split into high/low for dry matter refusals How much was left in front of the cow
MATCH GENOTYPE TO ENVIRONMENT

SIRE REGRESSION COEFFICIENTS
Milk Fat Protein0
0.2
0.4
0.6
0.8
1
1.2
1.4
High DMRLow DMR
(Dekleva, 2012)

GENETIC CORRELATIONS WITH YIELD
BW BCS
-0.9
-0.8
-0.7
-0.6
-0.5
-0.4
-0.3
-0.2
-0.1
0
High DMRLow DMR
Dekleva et al., 2012

Use good siresMarketing?
Use young siresCommercial producers?
Young and daughter proven are both good options Head-to-head proof comparisons not recommended
TAKE HOME MESSAGE

Start with a selection indexMatch the genotype of your cows to your
management levelHerds that struggle with cow health
Avoid HIGH dairy form Use high PL sires Look for new health evaluations $Net Merit places more emphasis on productive life
Herds maximizing production Less emphasis on PL if cow health is not a concern
TAKE HOME MESSAGE
Thanks for joining us today!
QUESTIONS?


