Geotechnical Site Investigation
measured & derived geotechnical parameters
Part ONE
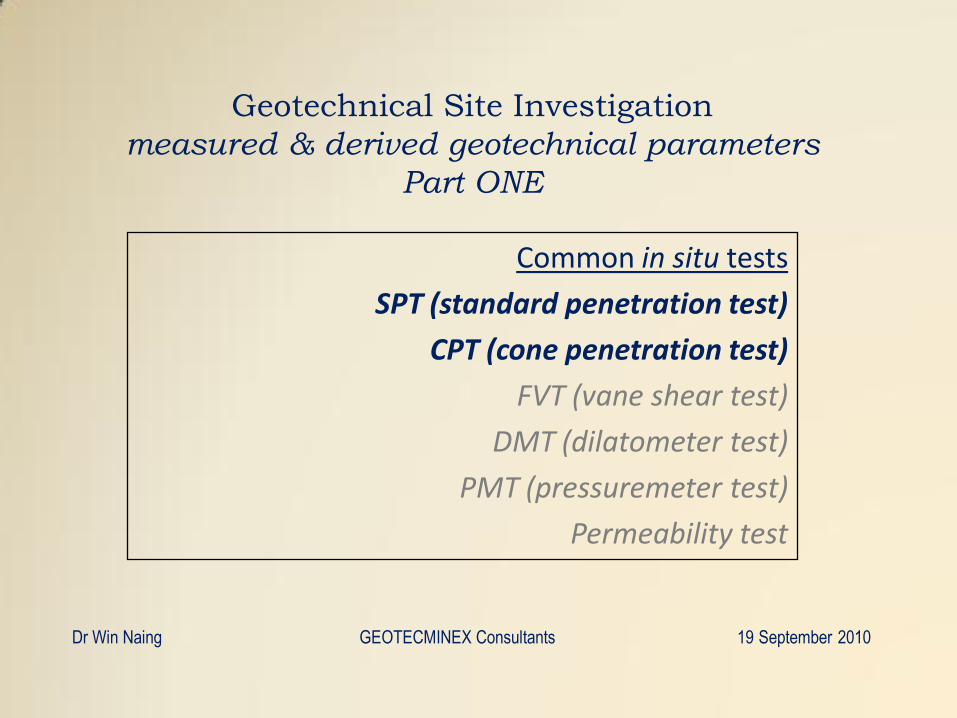
Common in situ tests
SPT (standard penetration test)
CPT (cone penetration test)
FVT (vane shear test)
DMT (dilatometer test)
PMT (pressuremeter test)
Permeability test
Dr Win Naing GEOTECMINEX Consultants 19 September 2010
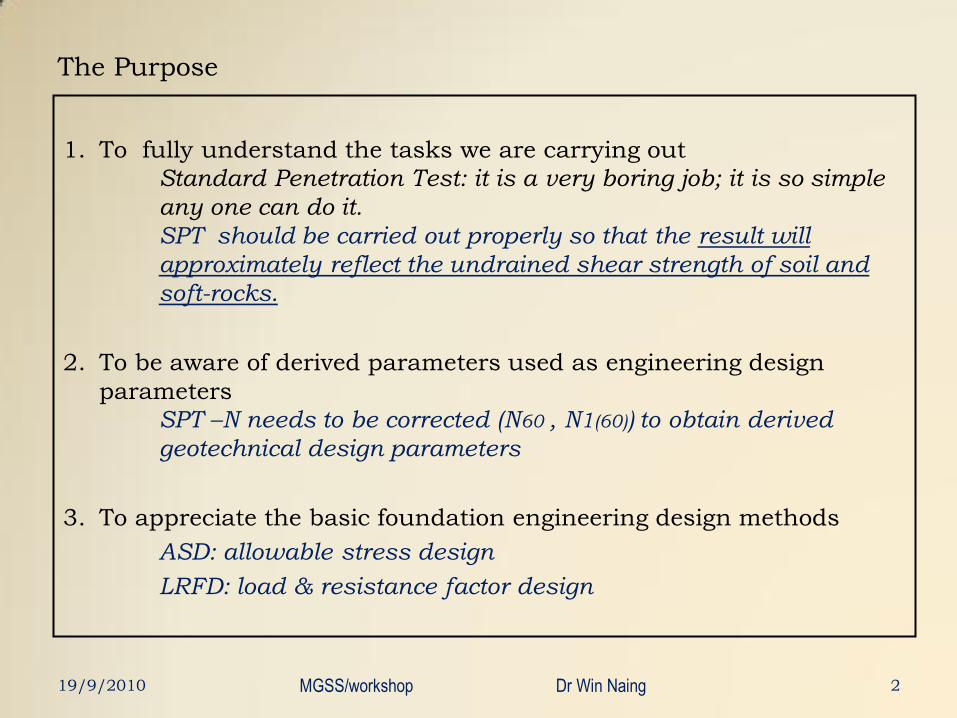
The Purpose
1. To fully understand the tasks we are carrying out
Standard Penetration Test: it is a very boring job; it is so simple
any one can do it.
SPT should be carried out properly so that the result will
approximately reflect the undrained shear strength of soil and
soft-rocks.
2. To be aware of derived parameters used as engineering design
parameters
SPT –N needs to be corrected (N60 , N1(60)) to obtain derived
geotechnical design parameters
3. To appreciate the basic foundation engineering design methods
ASD: allowable stress design
LRFD: load & resistance factor design
219/9/2010 MGSS/workshop Dr Win Naing
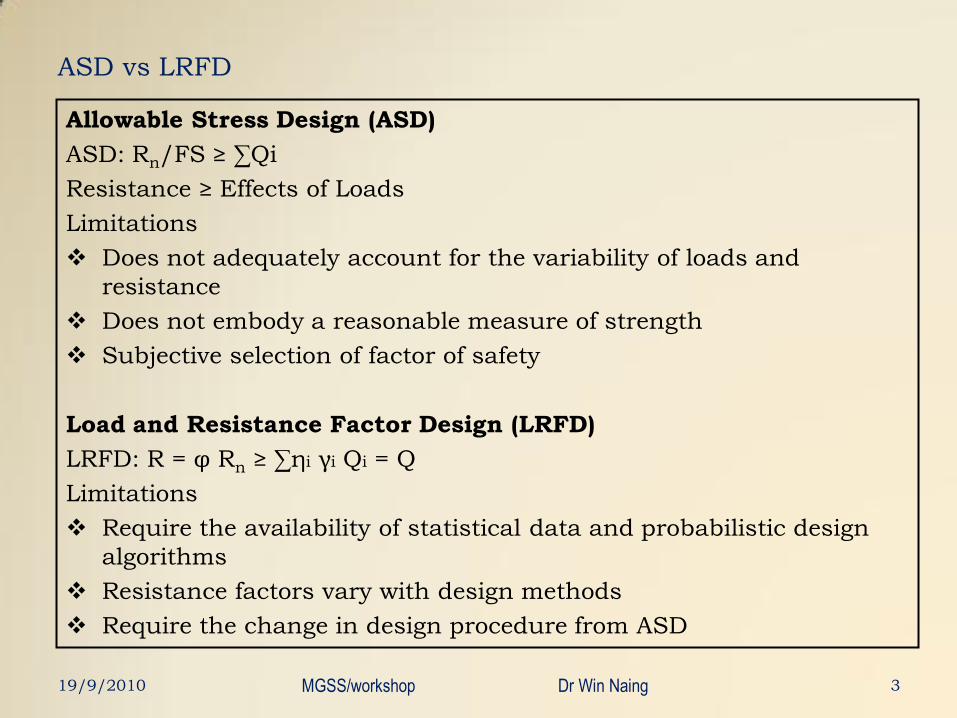
ASD vs LRFD
Allowable Stress Design (ASD)
ASD: Rn/FS ≥ ∑Qi
Resistance ≥ Effects of Loads
Limitations
Does not adequately account for the variability of loads and
resistance
Does not embody a reasonable measure of strength
Subjective selection of factor of safety
Load and Resistance Factor Design (LRFD)
LRFD: R = φ Rn ≥ ∑ηi γi Qi = Q
Limitations
Require the availability of statistical data and probabilistic design
algorithms
Resistance factors vary with design methods
Require the change in design procedure from ASD
19/9/2010 3MGSS/workshop Dr Win Naing
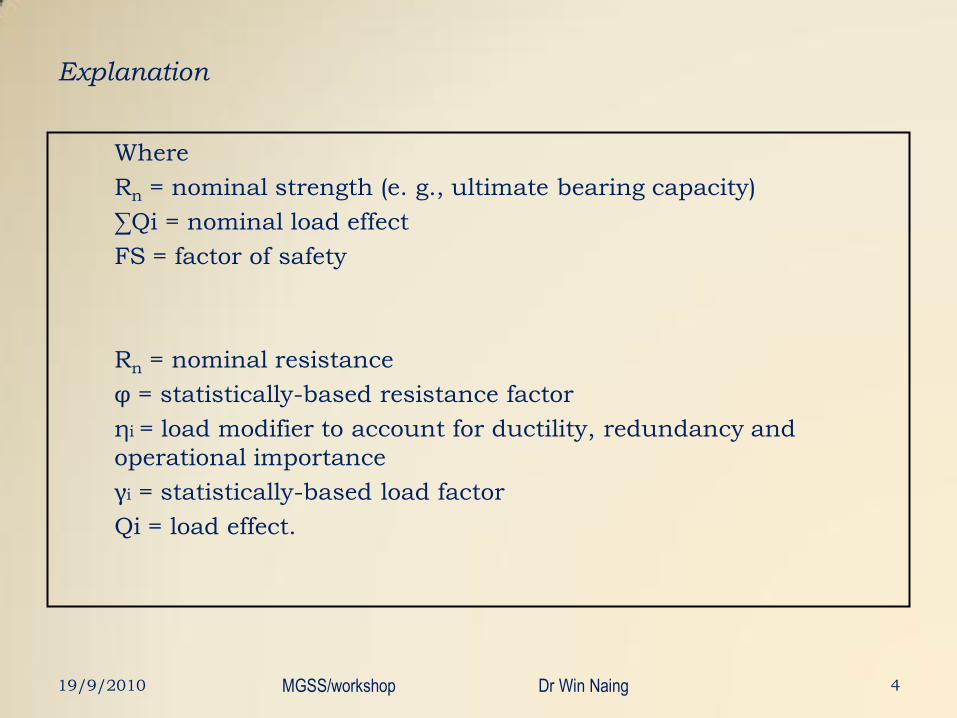
Explanation
Where
Rn = nominal strength (e. g., ultimate bearing capacity)
∑Qi = nominal load effect
FS = factor of safety
Rn = nominal resistance
φ = statistically-based resistance factor
ηi = load modifier to account for ductility, redundancy and
operational importance
γi = statistically-based load factor
Qi = load effect.
19/9/2010 4MGSS/workshop Dr Win Naing
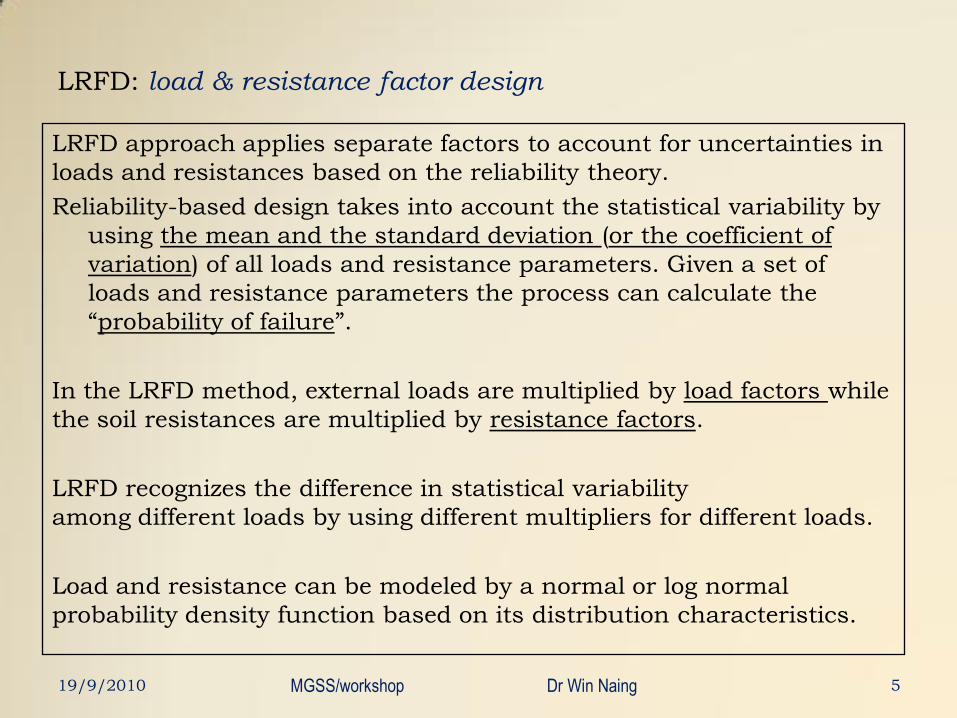
LRFD: load & resistance factor design
LRFD approach applies separate factors to account for uncertainties in
loads and resistances based on the reliability theory.
Reliability-based design takes into account the statistical variability by
using the mean and the standard deviation (or the coefficient of
variation) of all loads and resistance parameters. Given a set of
loads and resistance parameters the process can calculate the
“probability of failure”.
In the LRFD method, external loads are multiplied by load factors while
the soil resistances are multiplied by resistance factors.
LRFD recognizes the difference in statistical variability
among different loads by using different multipliers for different loads.
Load and resistance can be modeled by a normal or log normal
probability density function based on its distribution characteristics.
519/9/2010 MGSS/workshop Dr Win Naing
SPT-N, N60, N1(60), N1(60)sc
&
derived parameters
619/9/2010 MGSS/workshop Dr Win Naing
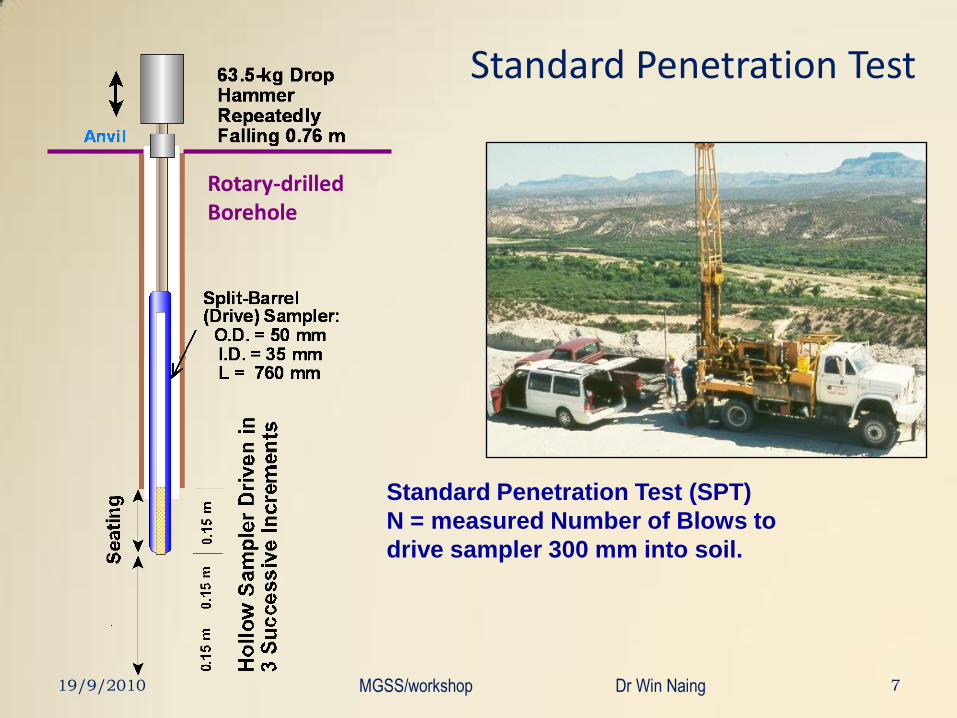
Standard Penetration Test
Rotary-drilledBorehole
Standard Penetration Test (SPT)
N = measured Number of Blows to
drive sampler 300 mm into soil.
19/9/2010 7MGSS/workshop Dr Win Naing
819/9/2010 MGSS/workshop Dr Win Naing
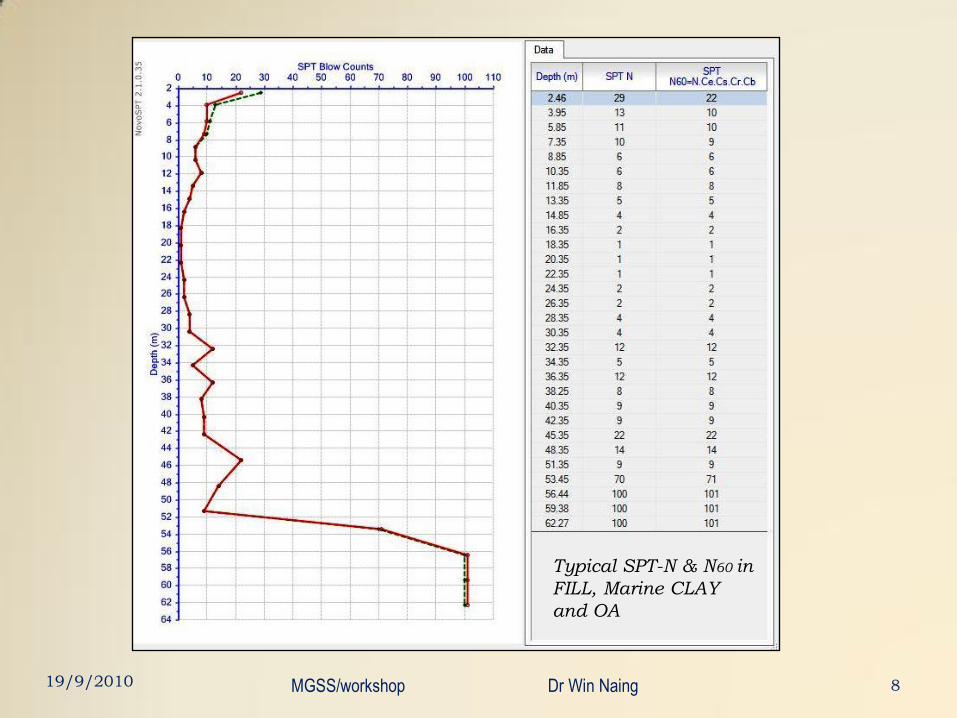
Typical SPT-N & N60 in
FILL, Marine CLAY
and OA
919/9/2010 MGSS/workshop Dr Win Naing
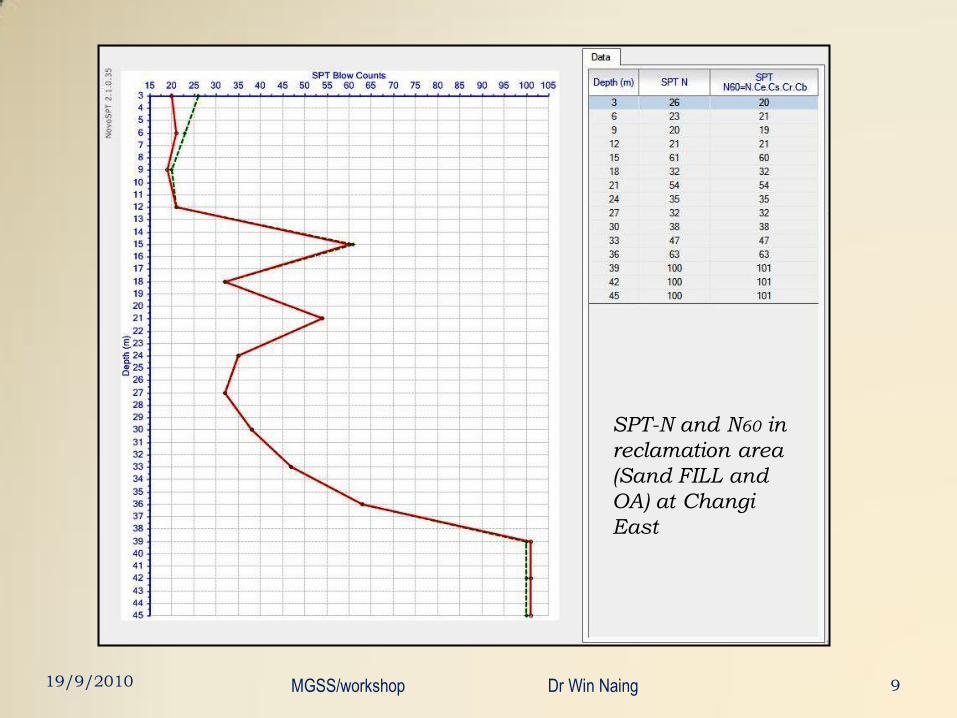
SPT-N and N60 in
reclamation area
(Sand FILL and
OA) at Changi
East
19/9/2010 MGSS/workshop Dr Win Naing 10
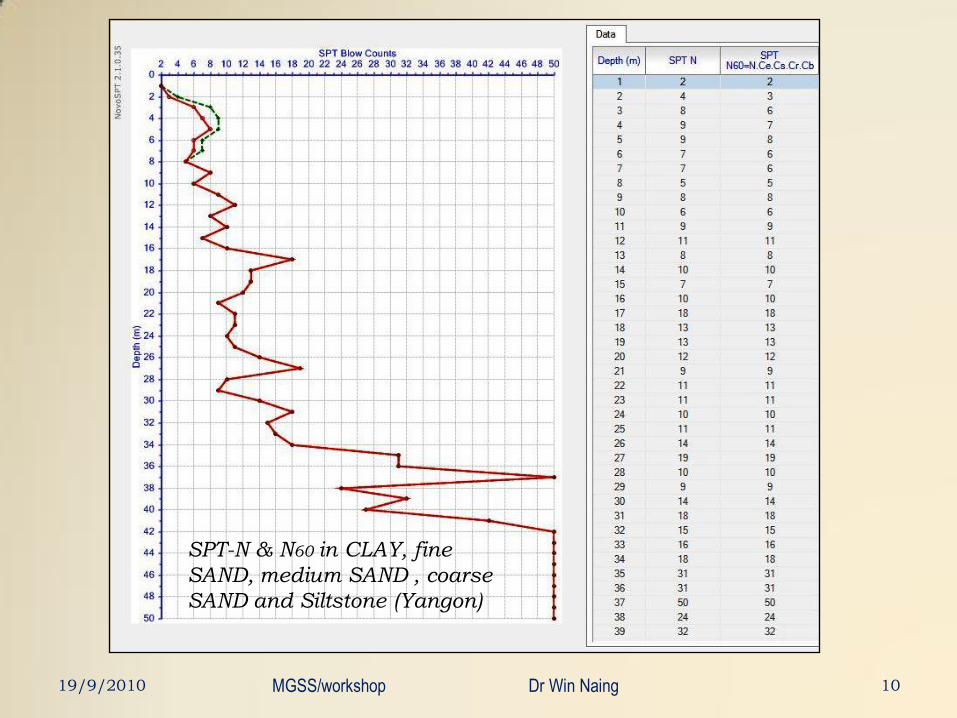
SPT-N & N60 in CLAY, fine
SAND, medium SAND , coarse
SAND and Siltstone (Yangon)
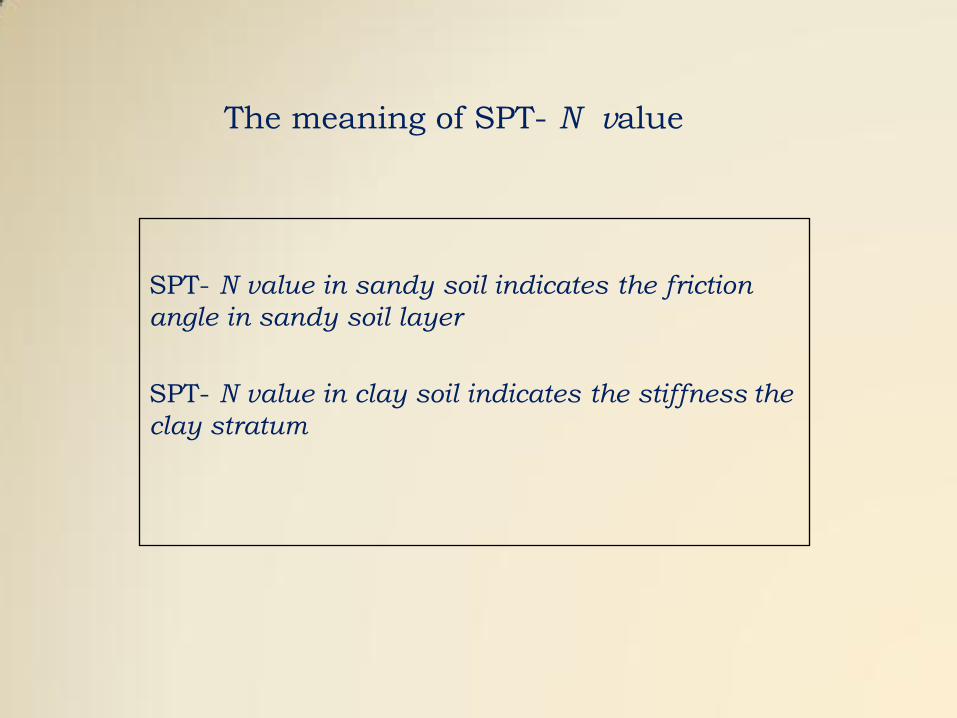
The meaning of SPT- N value
SPT- N value in sandy soil indicates the friction
angle in sandy soil layer
SPT- N value in clay soil indicates the stiffness the
clay stratum
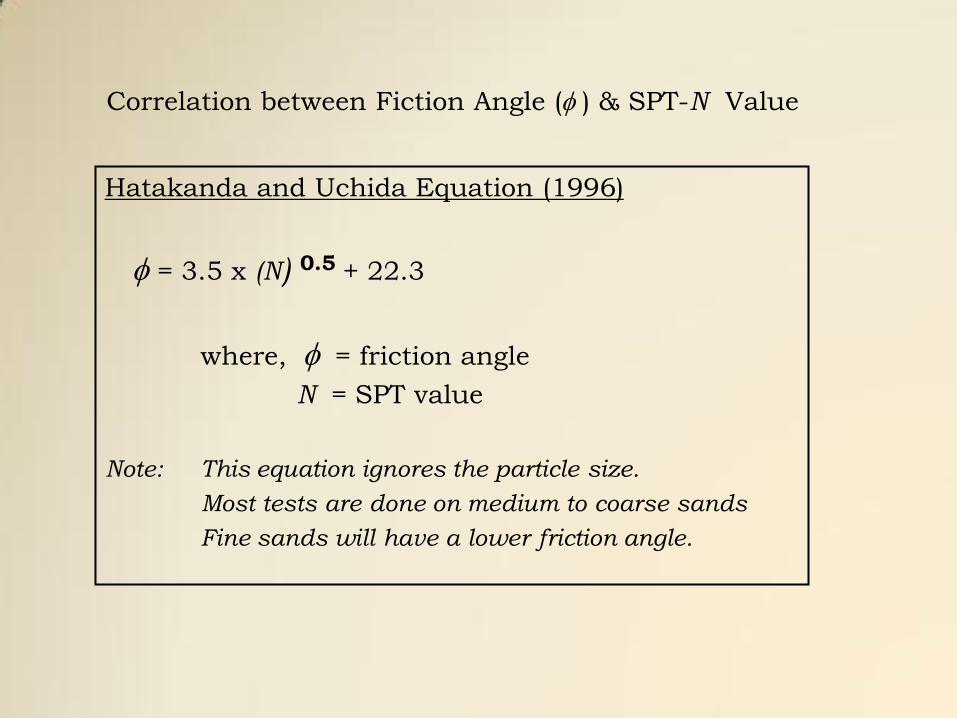
Correlation between Fiction Angle (f ) & SPT-N Value
Hatakanda and Uchida Equation (1996)
f = 3.5 x (N) 0.5 + 22.3
where, f = friction angle
N = SPT value
Note: This equation ignores the particle size.
Most tests are done on medium to coarse sands
Fine sands will have a lower friction angle.
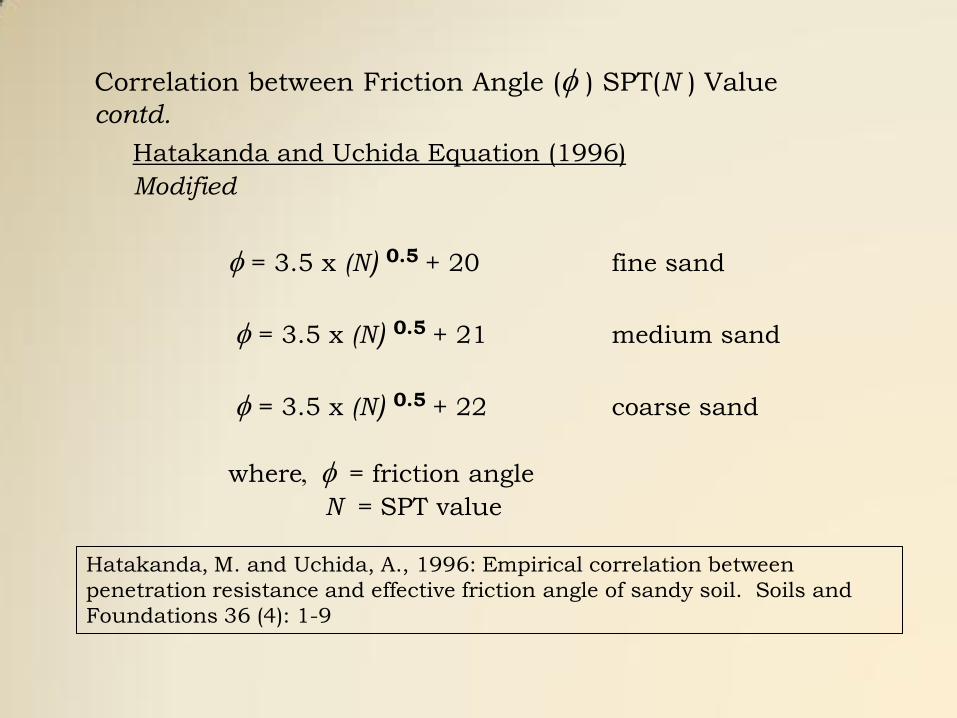
Correlation between Friction Angle (f ) SPT(N ) Value
contd.
Hatakanda and Uchida Equation (1996)
Modified
f = 3.5 x (N) 0.5 + 20 fine sand
f = 3.5 x (N) 0.5 + 21 medium sand
f = 3.5 x (N) 0.5 + 22 coarse sand
where, f = friction angle
N = SPT value
Hatakanda, M. and Uchida, A., 1996: Empirical correlation between
penetration resistance and effective friction angle of sandy soil. Soils and
Foundations 36 (4): 1-9
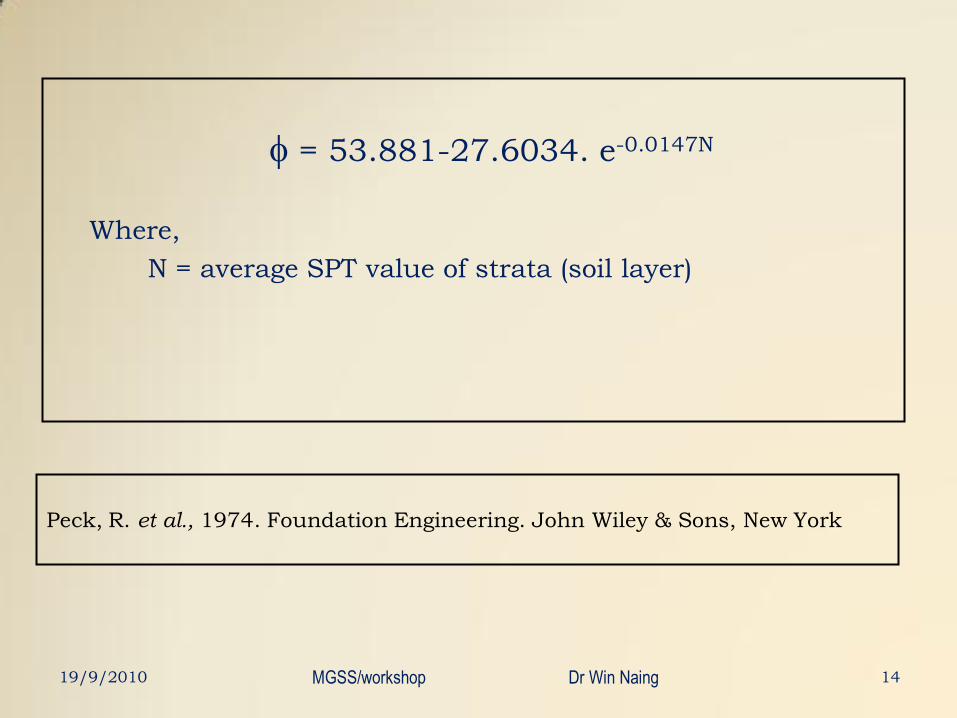
Peck, R. et al., 1974. Foundation Engineering. John Wiley & Sons, New York
f = 53.881-27.6034. e-0.0147N
Where,
N = average SPT value of strata (soil layer)
19/9/2010 14MGSS/workshop Dr Win Naing
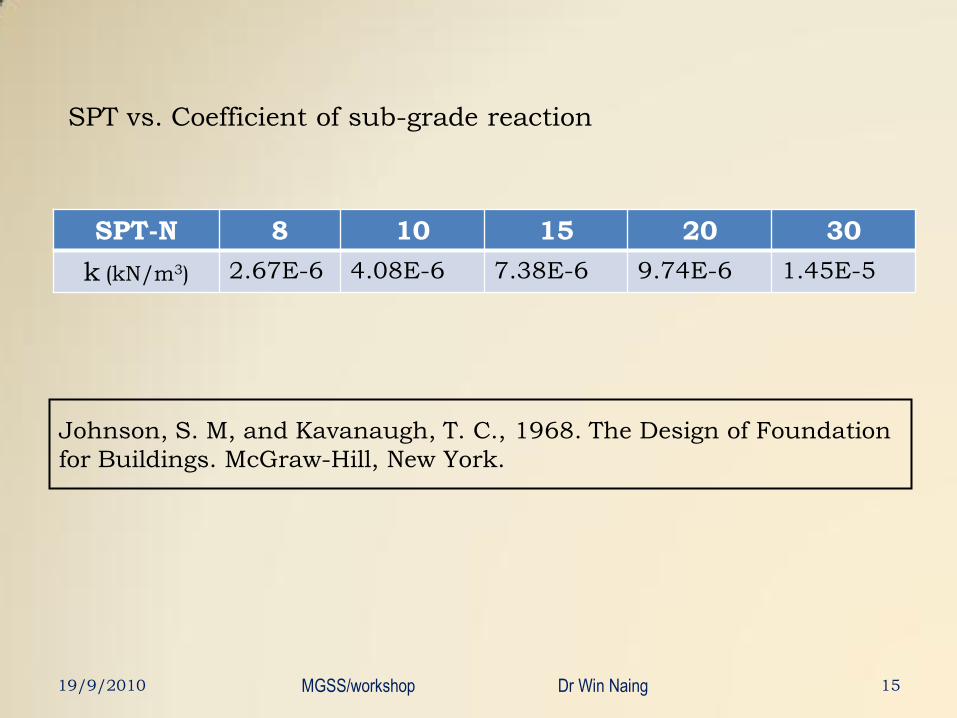
Johnson, S. M, and Kavanaugh, T. C., 1968. The Design of Foundation
for Buildings. McGraw-Hill, New York.
SPT-N 8 10 15 20 30
k (kN/m3) 2.67E-6 4.08E-6 7.38E-6 9.74E-6 1.45E-5
19/9/2010 15
SPT vs. Coefficient of sub-grade reaction
MGSS/workshop Dr Win Naing
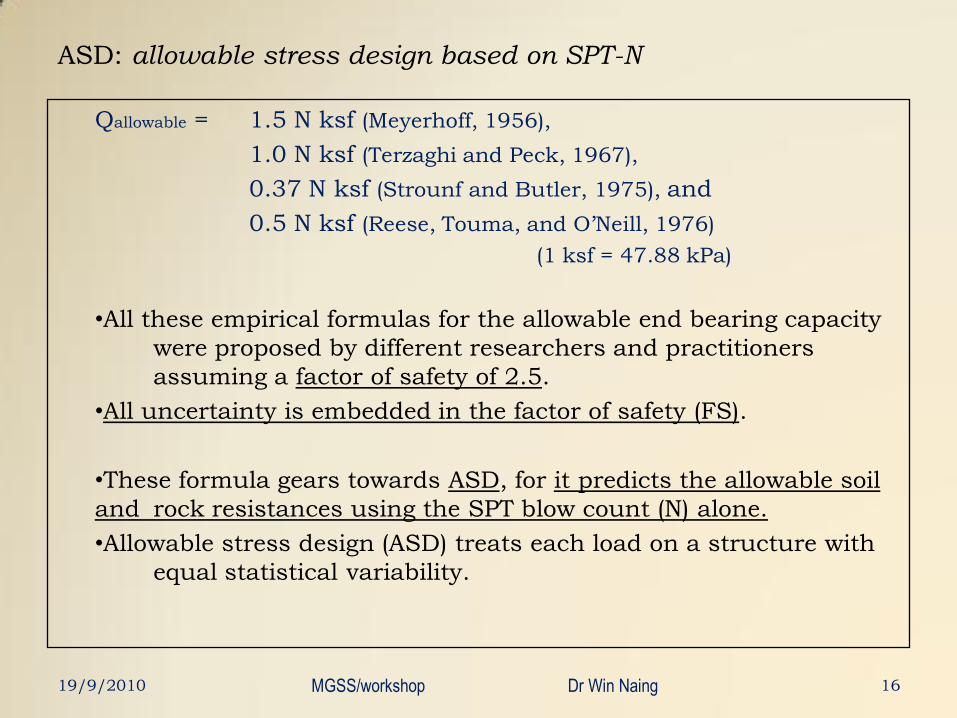
ASD: allowable stress design based on SPT-N
Qallowable = 1.5 N ksf (Meyerhoff, 1956),
1.0 N ksf (Terzaghi and Peck, 1967),
0.37 N ksf (Strounf and Butler, 1975), and
0.5 N ksf (Reese, Touma, and O’Neill, 1976)
(1 ksf = 47.88 kPa)
•All these empirical formulas for the allowable end bearing capacity
were proposed by different researchers and practitioners
assuming a factor of safety of 2.5.
•All uncertainty is embedded in the factor of safety (FS).
•These formula gears towards ASD, for it predicts the allowable soil
and rock resistances using the SPT blow count (N) alone.
•Allowable stress design (ASD) treats each load on a structure with
equal statistical variability.
1619/9/2010 MGSS/workshop Dr Win Naing
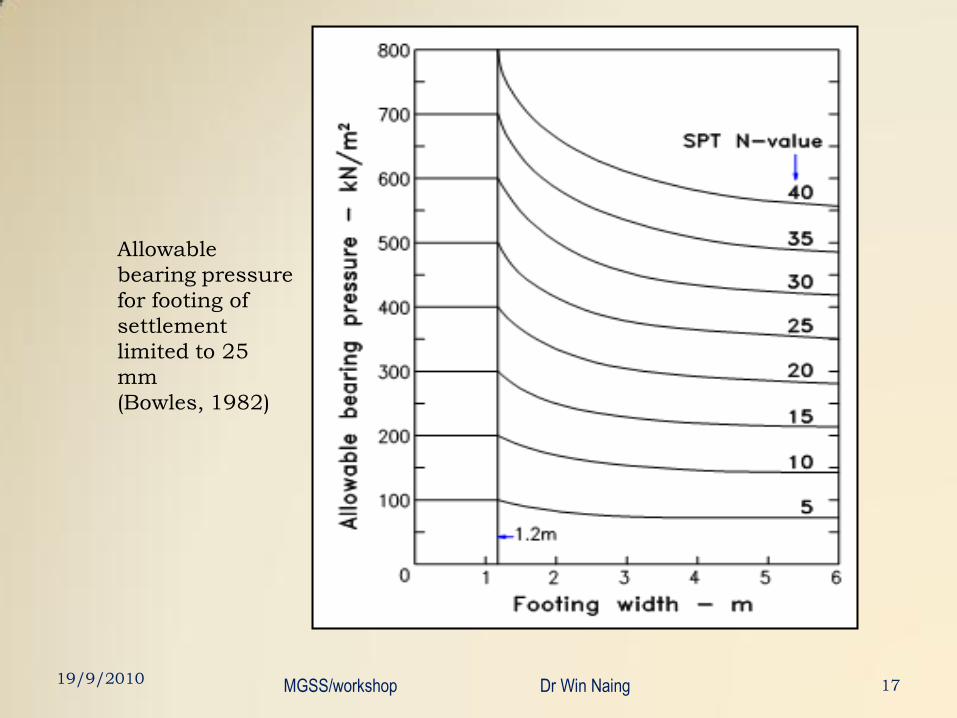
Allowable
bearing pressure
for footing of
settlement
limited to 25
mm
(Bowles, 1982)
1719/9/2010 MGSS/workshop Dr Win Naing
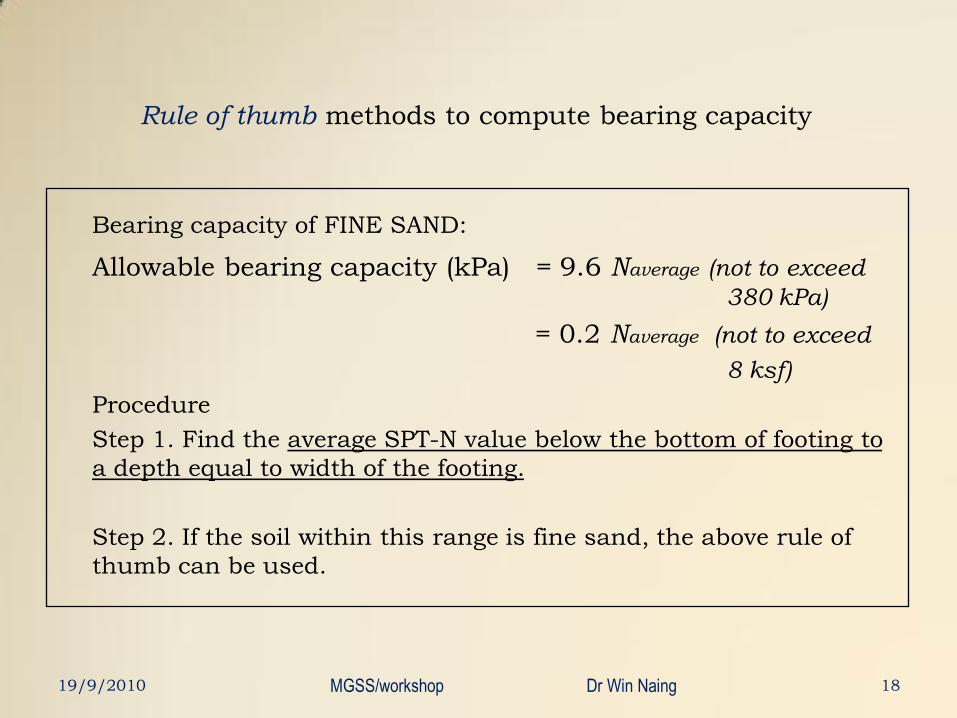
Rule of thumb methods to compute bearing capacity
Bearing capacity of FINE SAND:
Allowable bearing capacity (kPa) = 9.6 Naverage (not to exceed
380 kPa)
= 0.2 Naverage (not to exceed
8 ksf)
Procedure
Step 1. Find the average SPT-N value below the bottom of footing to
a depth equal to width of the footing.
Step 2. If the soil within this range is fine sand, the above rule of
thumb can be used.
1819/9/2010 MGSS/workshop Dr Win Naing
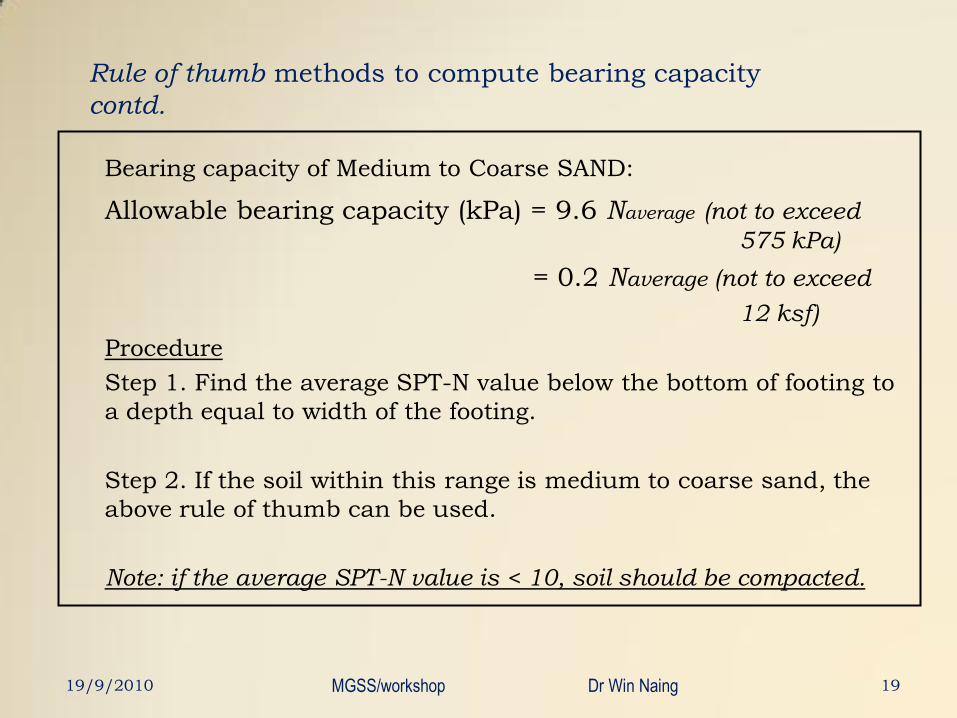
Rule of thumb methods to compute bearing capacity
contd.
Bearing capacity of Medium to Coarse SAND:
Allowable bearing capacity (kPa) = 9.6 Naverage (not to exceed
575 kPa)
= 0.2 Naverage (not to exceed
12 ksf)
Procedure
Step 1. Find the average SPT-N value below the bottom of footing to
a depth equal to width of the footing.
Step 2. If the soil within this range is medium to coarse sand, the
above rule of thumb can be used.
Note: if the average SPT-N value is < 10, soil should be compacted.
1919/9/2010 MGSS/workshop Dr Win Naing
SPT-N corrections
19/9/2010 MGSS/workshop Dr Win Naing 20
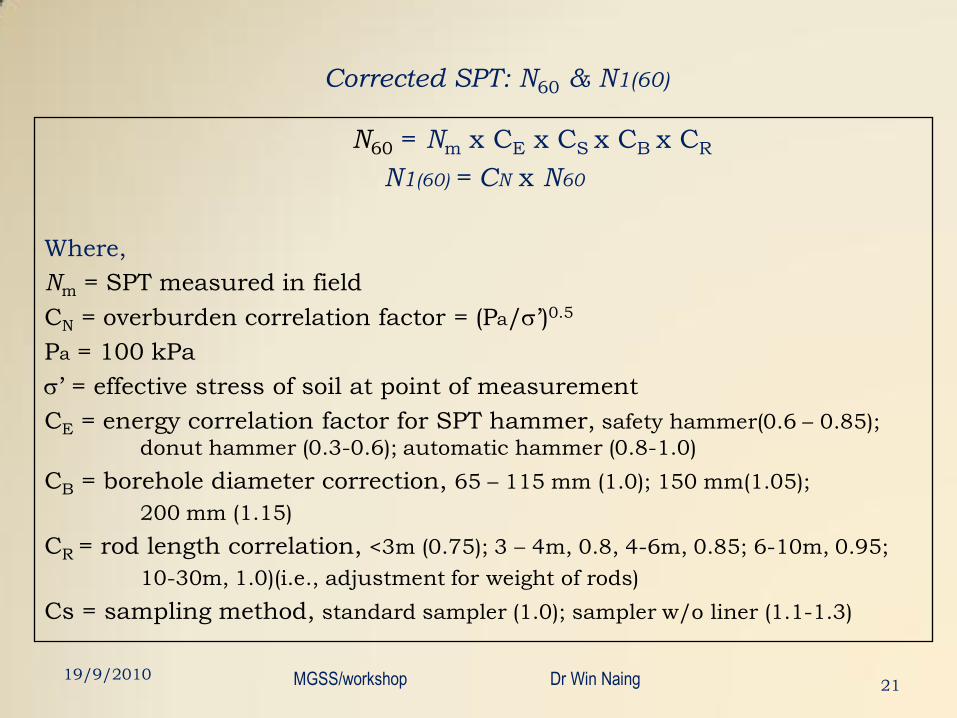
Corrected SPT: N60 & N1(60)
N60 = Nm x CE x CS x CB x CR
N1(60) = CN x N60
Where,
Nm = SPT measured in field
CN = overburden correlation factor = (Pa/s’)0.5
Pa = 100 kPa
s’ = effective stress of soil at point of measurement
CE = energy correlation factor for SPT hammer, safety hammer(0.6 – 0.85);
donut hammer (0.3-0.6); automatic hammer (0.8-1.0)
CB = borehole diameter correction, 65 – 115 mm (1.0); 150 mm(1.05);
200 mm (1.15)
CR = rod length correlation, <3m (0.75); 3 – 4m, 0.8, 4-6m, 0.85; 6-10m, 0.95;
10-30m, 1.0)(i.e., adjustment for weight of rods)
Cs = sampling method, standard sampler (1.0); sampler w/o liner (1.1-1.3)
2119/9/2010 MGSS/workshop Dr Win Naing
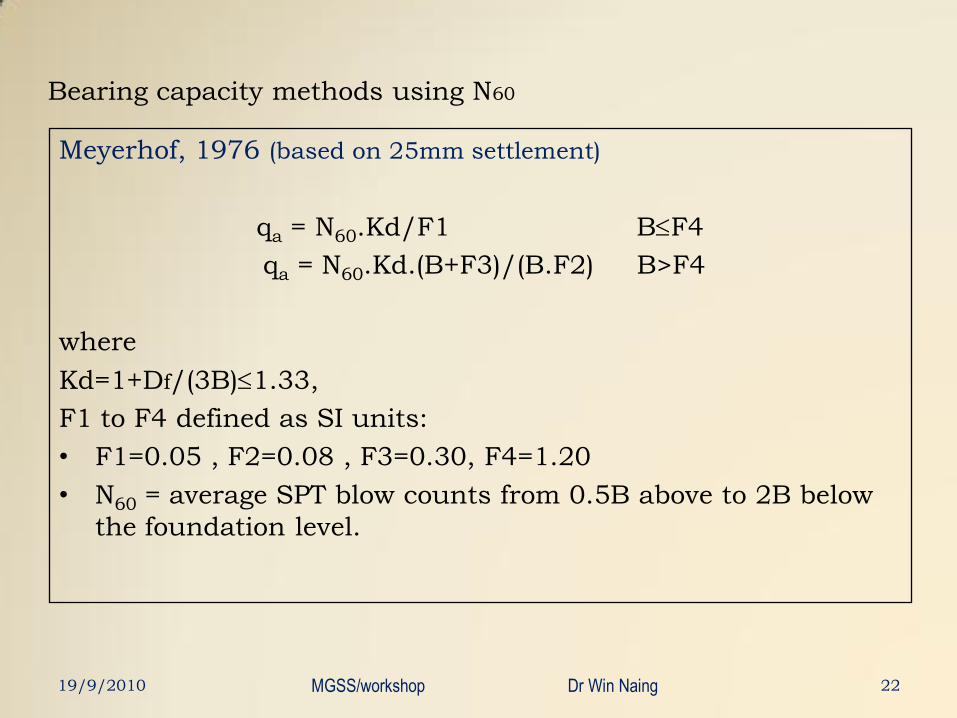
Bearing capacity methods using N60
Meyerhof, 1976 (based on 25mm settlement)
qa = N60.Kd/F1 BF4
qa = N60.Kd.(B+F3)/(B.F2) B>F4
where
Kd=1+Df/(3B)1.33,
F1 to F4 defined as SI units:
• F1=0.05 , F2=0.08 , F3=0.30, F4=1.20
• N60 = average SPT blow counts from 0.5B above to 2B below
the foundation level.
19/9/2010 MGSS/workshop Dr Win Naing 22
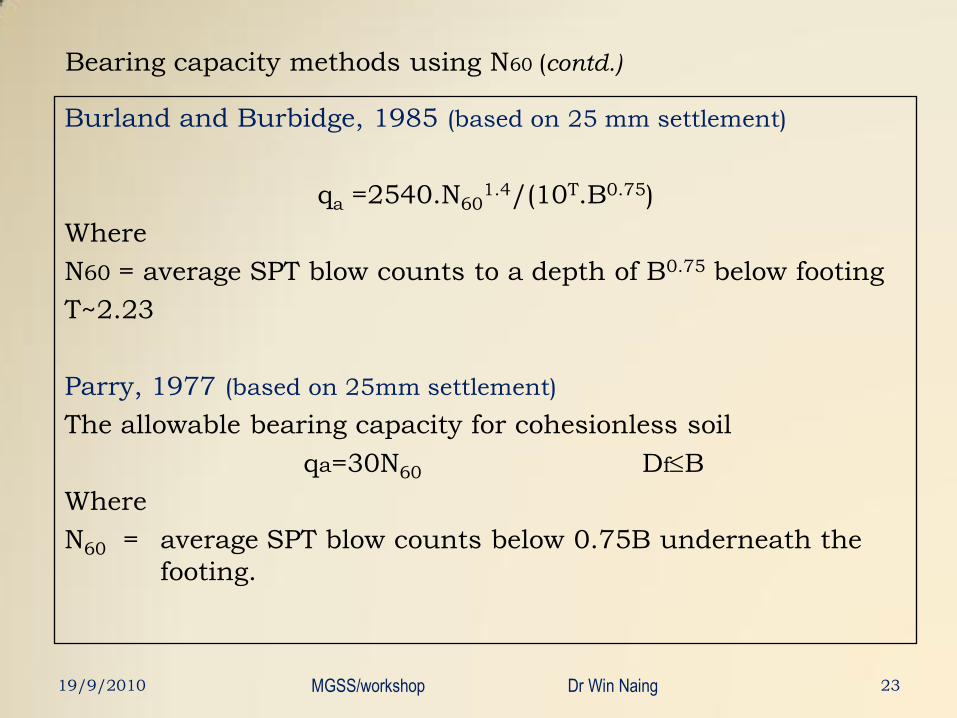
Bearing capacity methods using N60 (contd.)
Burland and Burbidge, 1985 (based on 25 mm settlement)
qa =2540.N601.4/(10T.B0.75)
Where
N60 = average SPT blow counts to a depth of B0.75 below footing
T~2.23
Parry, 1977 (based on 25mm settlement)
The allowable bearing capacity for cohesionless soil
qa=30N60 DfB
Where
N60 = average SPT blow counts below 0.75B underneath the
footing.
19/9/2010 MGSS/workshop Dr Win Naing 23
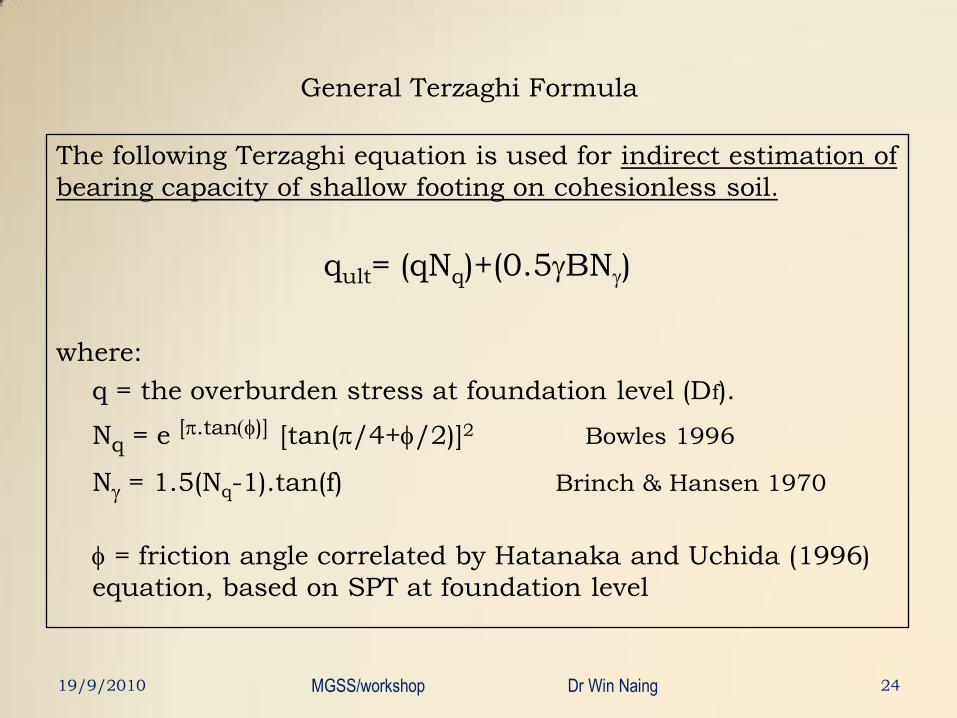
General Terzaghi Formula
The following Terzaghi equation is used for indirect estimation of
bearing capacity of shallow footing on cohesionless soil.
qult= (qNq)+(0.5gBNg)
where:
q = the overburden stress at foundation level (Df).
Nq = e [p.tan(f)] [tan(p/4+f/2)]2 Bowles 1996
Ng = 1.5(Nq-1).tan(f) Brinch & Hansen 1970
f = friction angle correlated by Hatanaka and Uchida (1996)
equation, based on SPT at foundation level
19/9/2010 MGSS/workshop Dr Win Naing 24
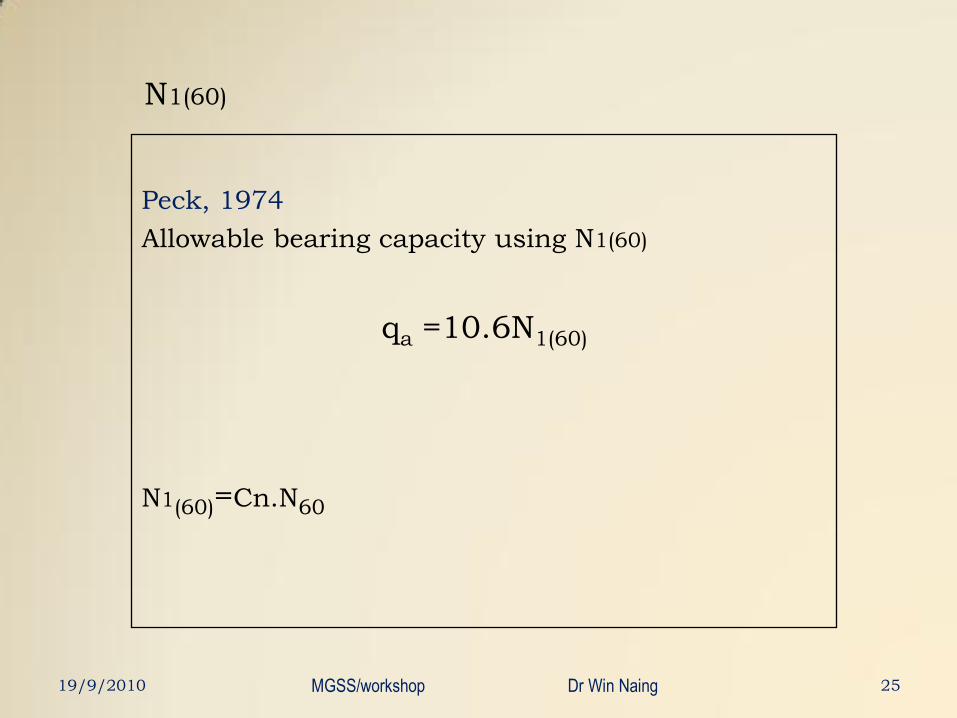
N1(60)
Peck, 1974
Allowable bearing capacity using N1(60)
qa =10.6N1(60)
N1(60)=Cn.N60
19/9/2010 MGSS/workshop Dr Win Naing 25
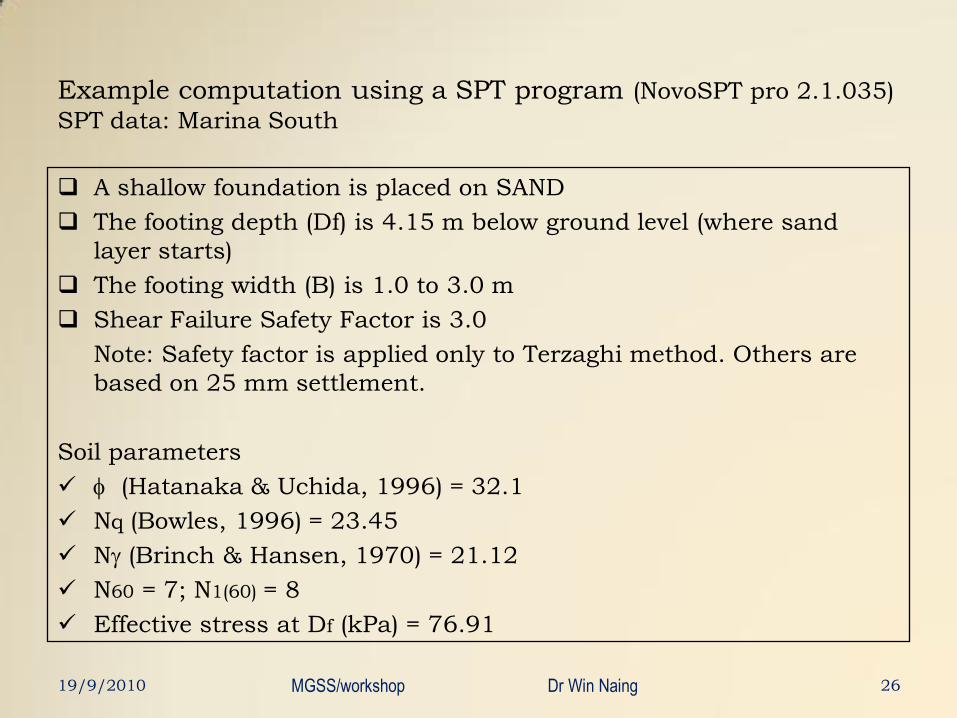
Example computation using a SPT program (NovoSPT pro 2.1.035)
SPT data: Marina South
A shallow foundation is placed on SAND
The footing depth (Df) is 4.15 m below ground level (where sand
layer starts)
The footing width (B) is 1.0 to 3.0 m
Shear Failure Safety Factor is 3.0
Note: Safety factor is applied only to Terzaghi method. Others are
based on 25 mm settlement.
Soil parameters
f (Hatanaka & Uchida, 1996) = 32.1
Nq (Bowles, 1996) = 23.45
Ng (Brinch & Hansen, 1970) = 21.12
N60 = 7; N1(60) = 8
Effective stress at Df (kPa) = 76.91
2619/9/2010 MGSS/workshop Dr Win Naing
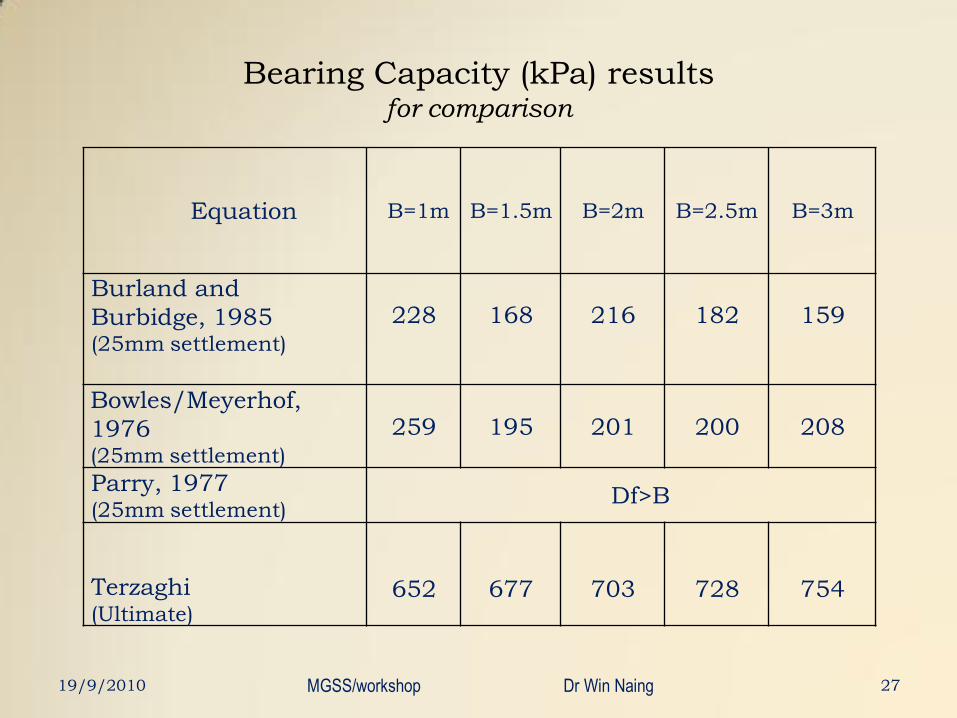
Bearing Capacity (kPa) resultsfor comparison
19/9/2010 MGSS/workshop Dr Win Naing 27
Equation B=1m B=1.5m B=2m B=2.5m B=3m
Burland and
Burbidge, 1985 (25mm settlement)
228 168 216 182 159
Bowles/Meyerhof,
1976(25mm settlement)
259 195 201 200 208
Parry, 1977 (25mm settlement)
Df>B
Terzaghi(Ultimate)
652 677 703 728 754
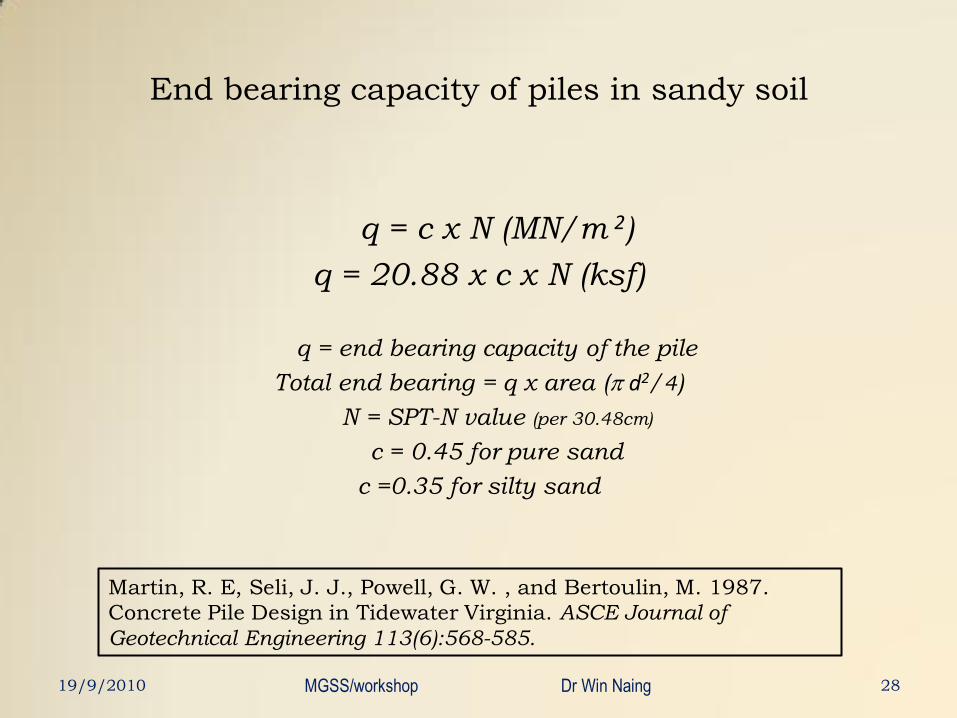
End bearing capacity of piles in sandy soil
q = c x N (MN/m 2)
q = 20.88 x c x N (ksf)
q = end bearing capacity of the pile
Total end bearing = q x area (p d2/4)
N = SPT-N value (per 30.48cm)
c = 0.45 for pure sand
c =0.35 for silty sand
2819/9/2010 MGSS/workshop Dr Win Naing
Martin, R. E, Seli, J. J., Powell, G. W. , and Bertoulin, M. 1987.
Concrete Pile Design in Tidewater Virginia. ASCE Journal of
Geotechnical Engineering 113(6):568-585.
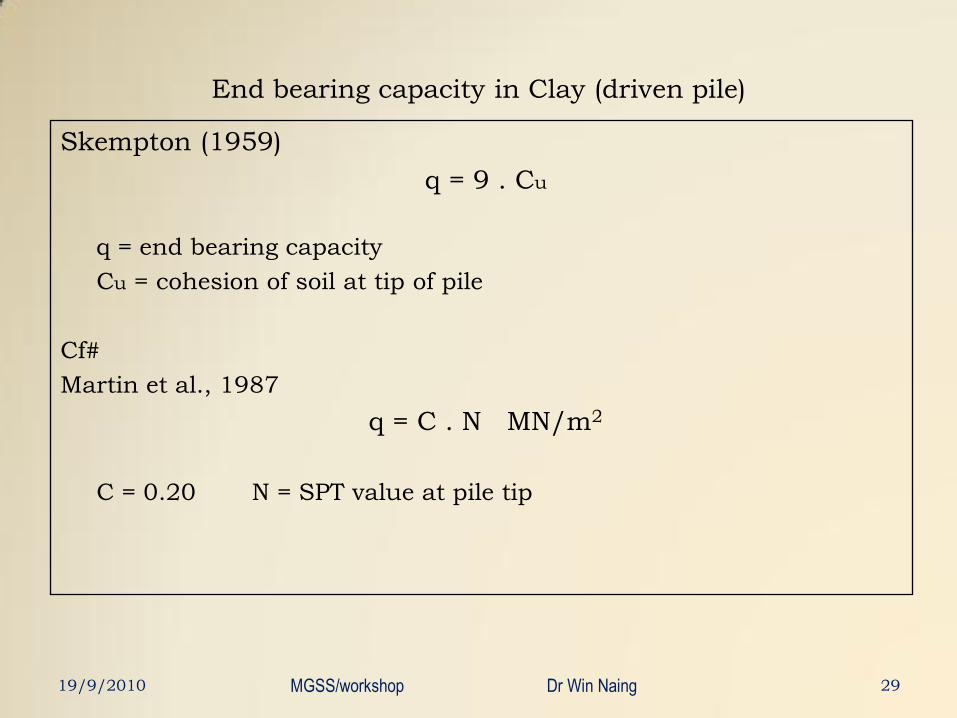
End bearing capacity in Clay (driven pile)
Skempton (1959)
q = 9 . Cu
q = end bearing capacity
Cu = cohesion of soil at tip of pile
Cf#
Martin et al., 1987
q = C . N MN/m2
C = 0.20 N = SPT value at pile tip
19/9/2010 MGSS/workshop Dr Win Naing 29
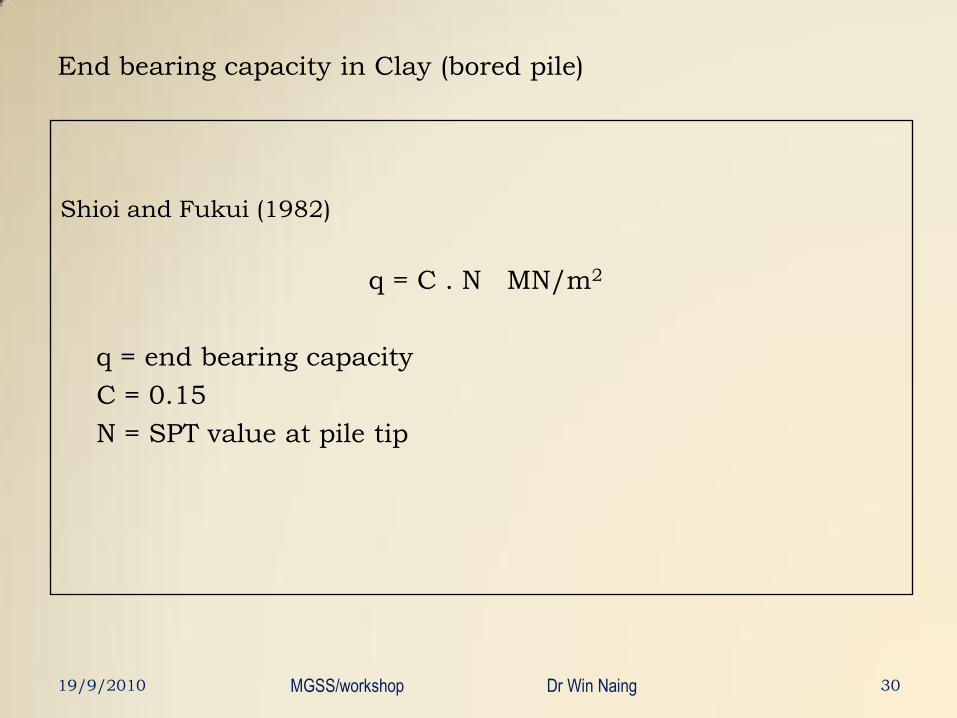
End bearing capacity in Clay (bored pile)
Shioi and Fukui (1982)
q = C . N MN/m2
q = end bearing capacity
C = 0.15
N = SPT value at pile tip
19/9/2010 MGSS/workshop Dr Win Naing 30
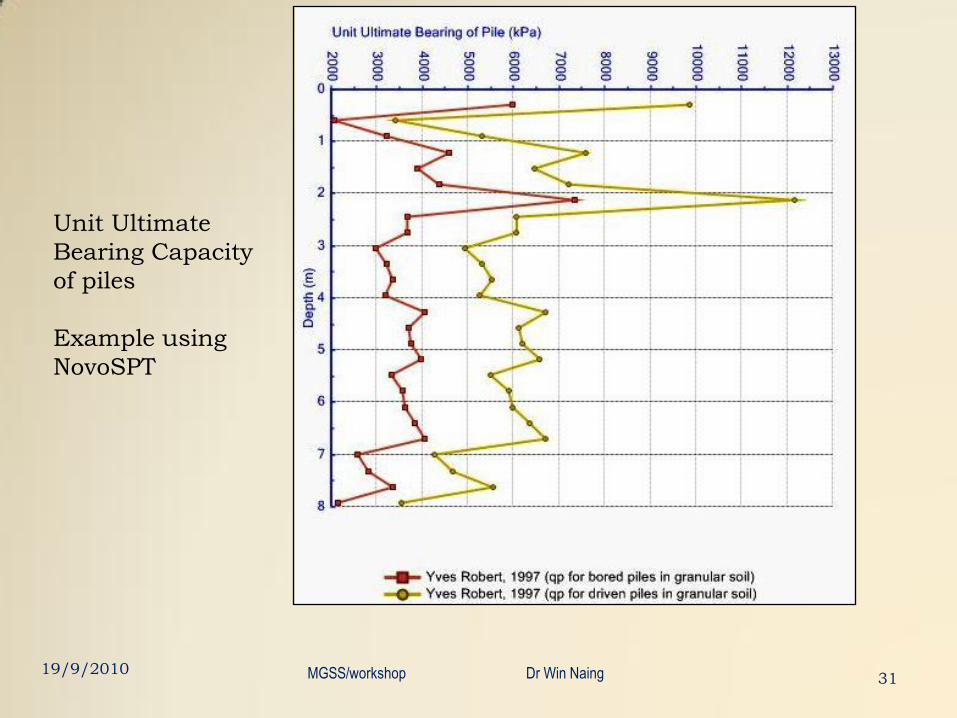
Unit Ultimate
Bearing Capacity
of piles
Example using
NovoSPT
3119/9/2010 MGSS/workshop Dr Win Naing
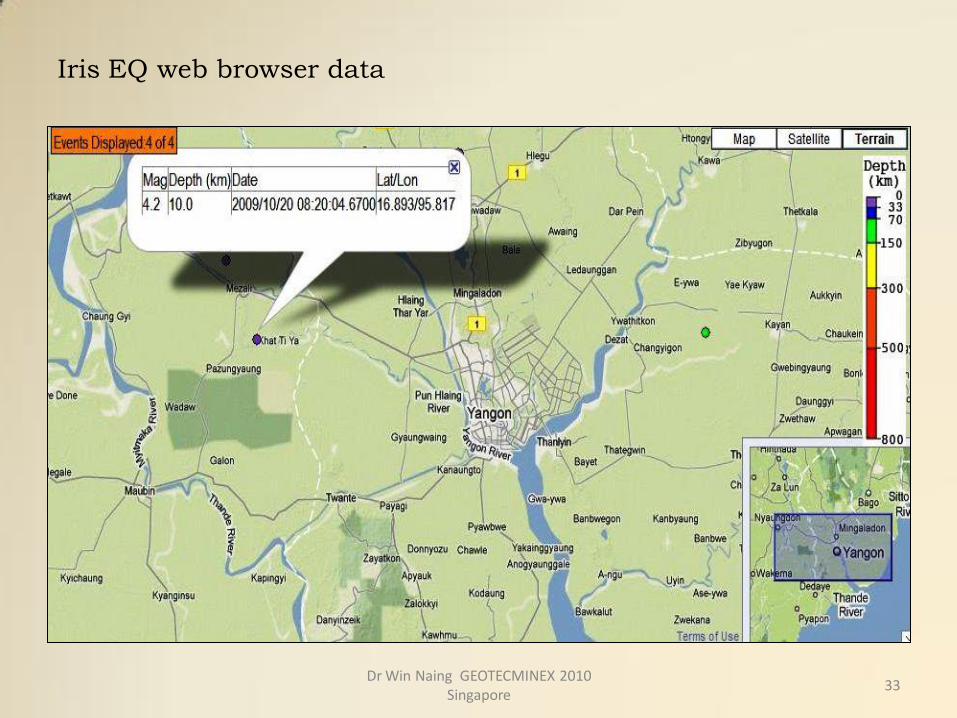
Liquefaction
Sandy and silty soils have tendency to lose strength
and turn into a liquid-like state during earthquakes.
This is due to increase in pore pressure in the soil
caused by seismic waves.
3219/9/2010 MGSS/workshop Dr Win Naing
Iris EQ web browser data
33Dr Win Naing GEOTECMINEX 2010
Singapore
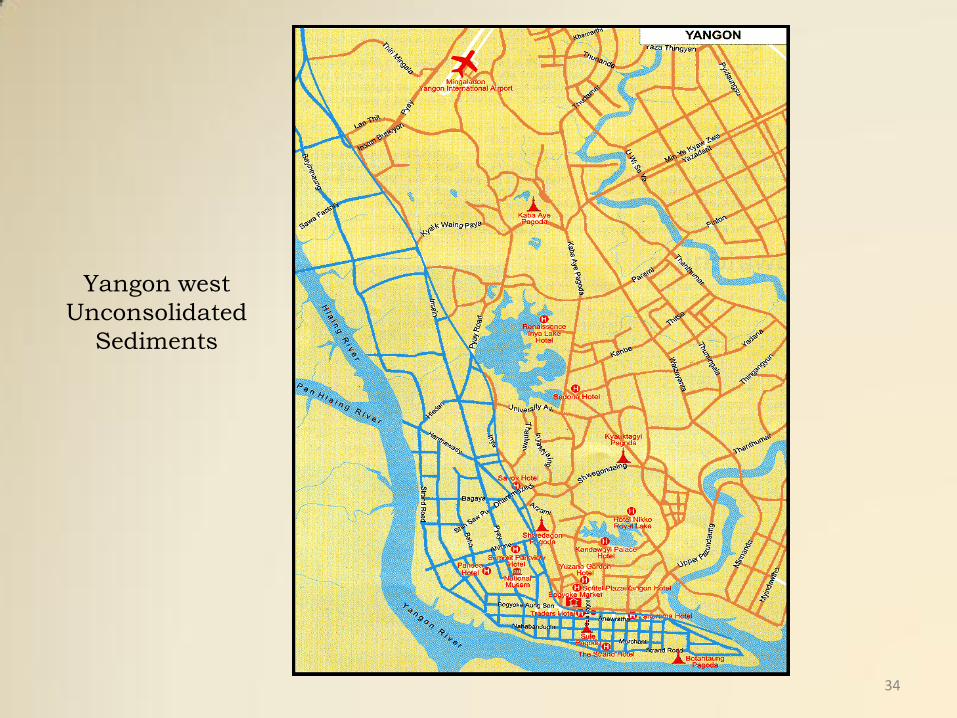
Yangon west
Unconsolidated
Sediments
34
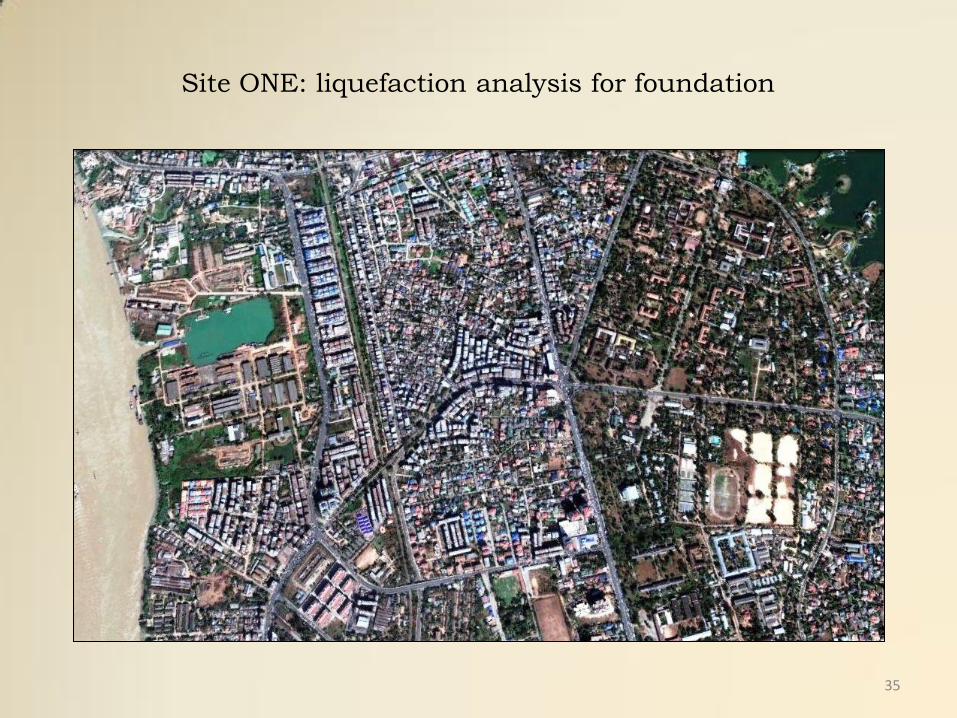
Site ONE: liquefaction analysis for foundation
35
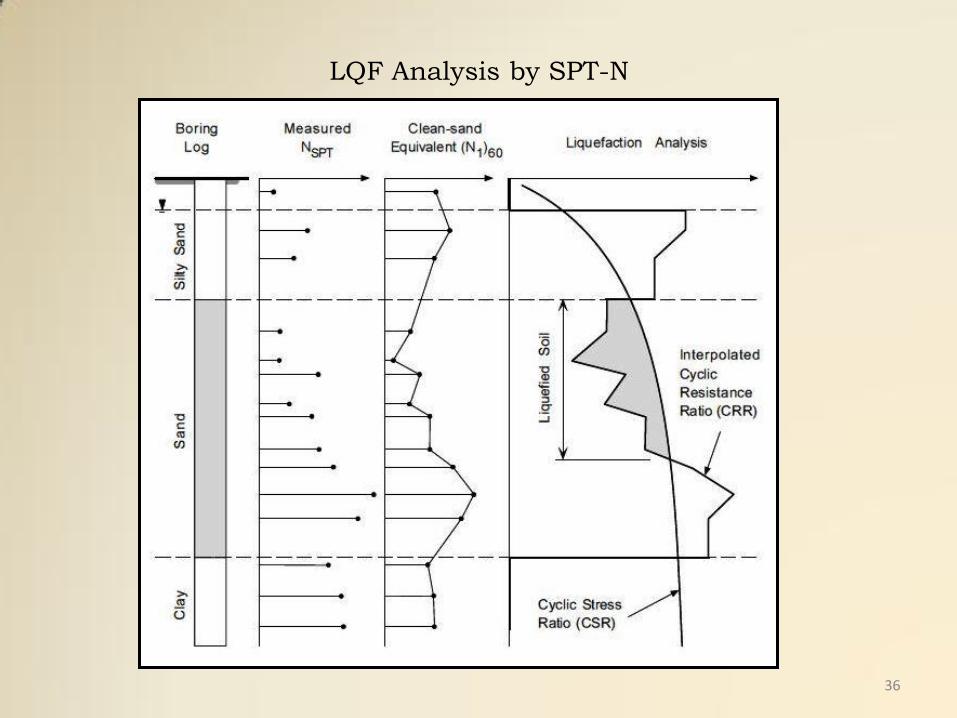
LQF Analysis by SPT-N
36
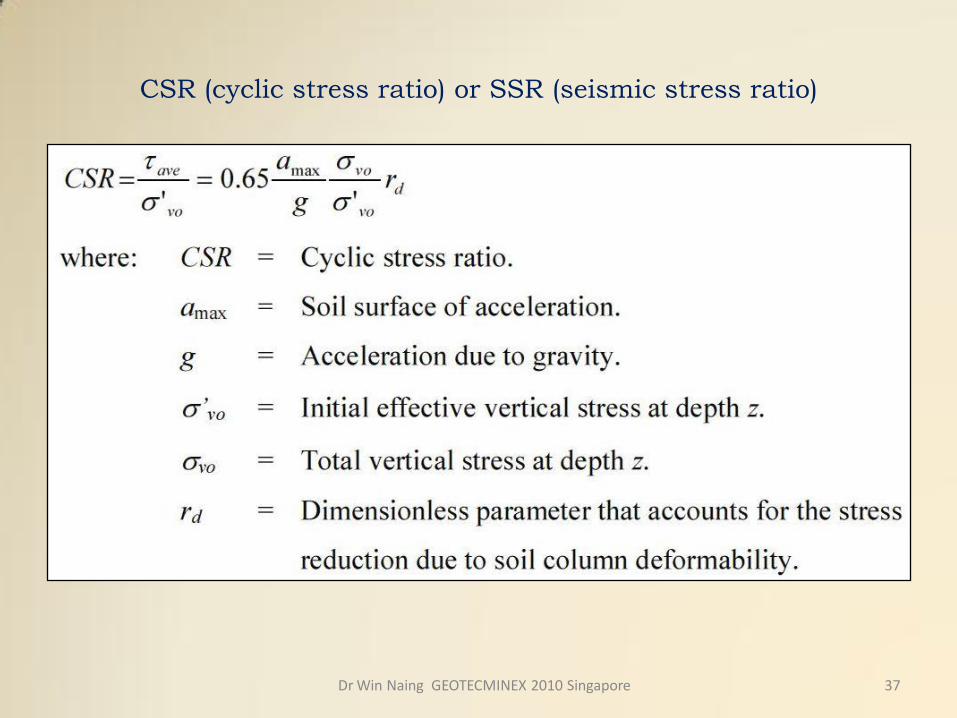
CSR (cyclic stress ratio) or SSR (seismic stress ratio)
Dr Win Naing GEOTECMINEX 2010 Singapore 37
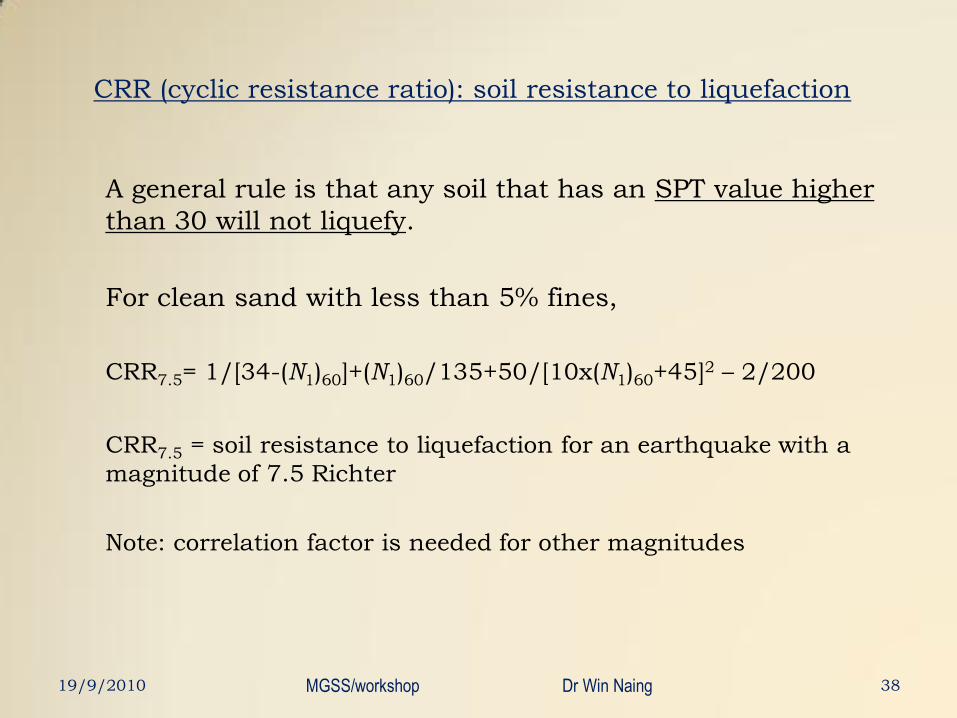
CRR (cyclic resistance ratio): soil resistance to liquefaction
A general rule is that any soil that has an SPT value higher
than 30 will not liquefy.
For clean sand with less than 5% fines,
CRR7.5= 1/[34-(N1)60]+(N1)60/135+50/[10x(N1)60+45]2 – 2/200
CRR7.5 = soil resistance to liquefaction for an earthquake with a
magnitude of 7.5 Richter
Note: correlation factor is needed for other magnitudes
3819/9/2010 MGSS/workshop Dr Win Naing
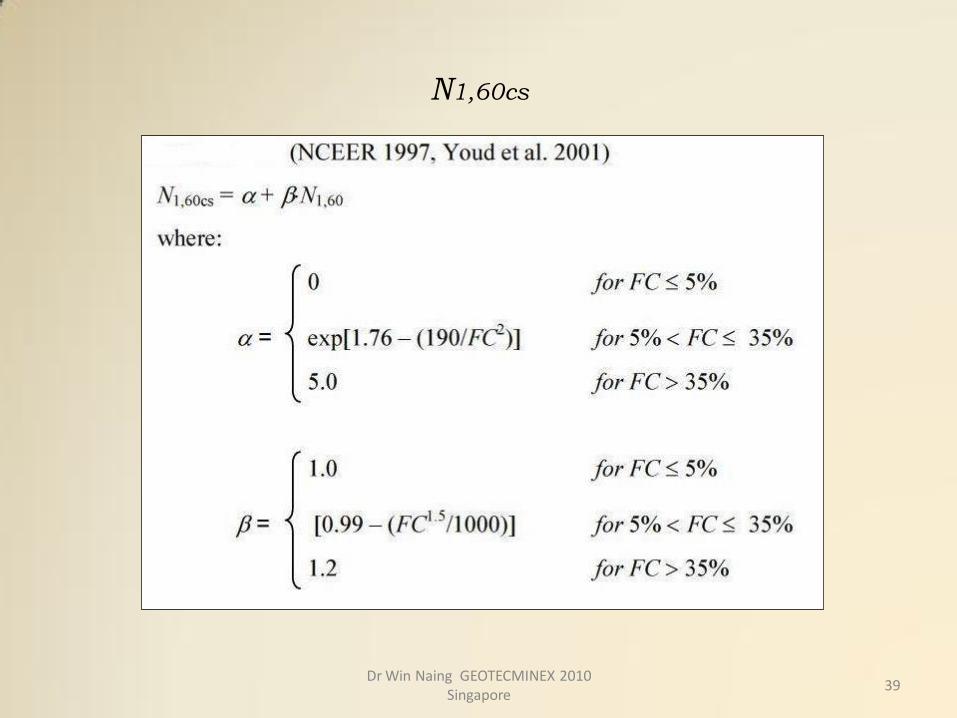
N1,60cs
Dr Win Naing GEOTECMINEX 2010 Singapore
39
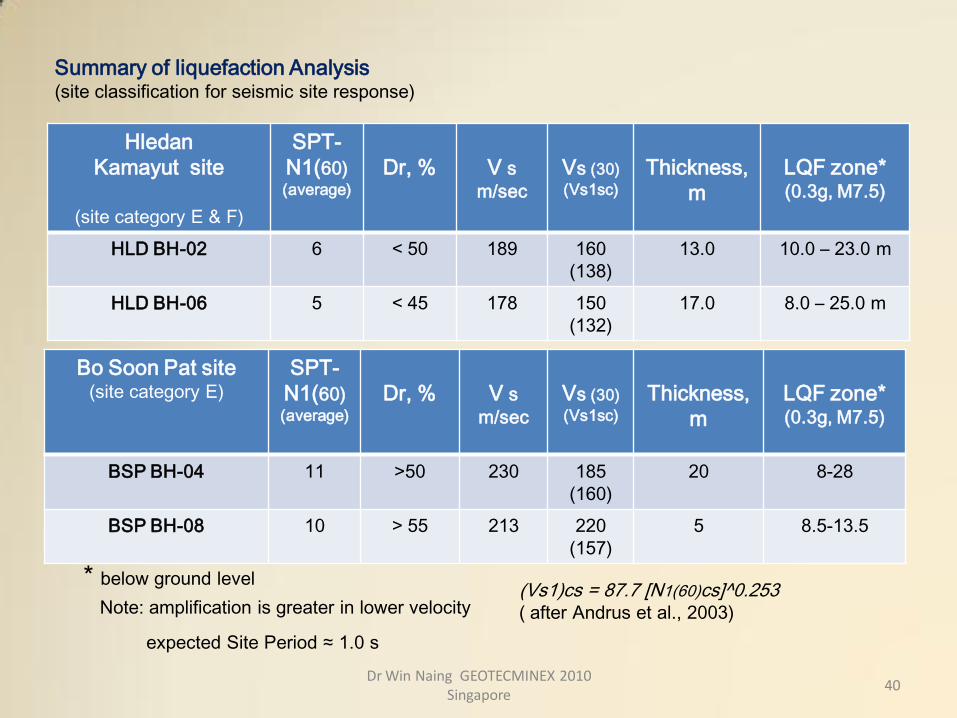
Summary of liquefaction Analysis(site classification for seismic site response)
Hledan
Kamayut site
(site category E & F)
SPT-
N1(60)(average)
Dr, % V sm/sec
Vs (30)
(Vs1sc)
Thickness,
m
LQF zone*(0.3g, M7.5)
HLD BH-02 6 < 50 189 160
(138)
13.0 10.0 – 23.0 m
HLD BH-06 5 < 45 178 150
(132)
17.0 8.0 – 25.0 m
Bo Soon Pat site(site category E)
SPT-
N1(60)(average)
Dr, % V sm/sec
Vs (30)
(Vs1sc)
Thickness,
m
LQF zone*(0.3g, M7.5)
BSP BH-04 11 >50 230 185
(160)
20 8-28
BSP BH-08 10 > 55 213 220
(157)
5 8.5-13.5
* below ground level
Note: amplification is greater in lower velocity
40Dr Win Naing GEOTECMINEX 2010
Singapore
expected Site Period ≈ 1.0 s
(Vs1)cs = 87.7 [N1(60)cs]^0.253( after Andrus et al., 2003)
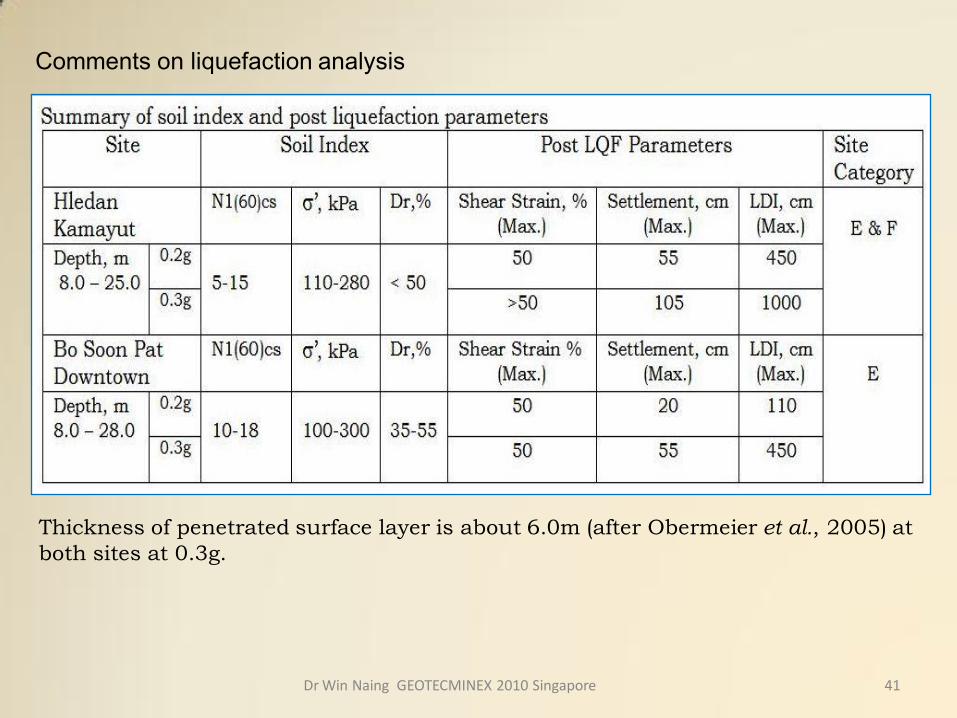
Comments on liquefaction analysis
41Dr Win Naing GEOTECMINEX 2010 Singapore
Thickness of penetrated surface layer is about 6.0m (after Obermeier et al., 2005) at
both sites at 0.3g.
CPT: cone penetration test
19/9/2010 42MGSS/workshop Dr Win Naing
4319/9/2010 MGSS/workshop Dr Win Naing
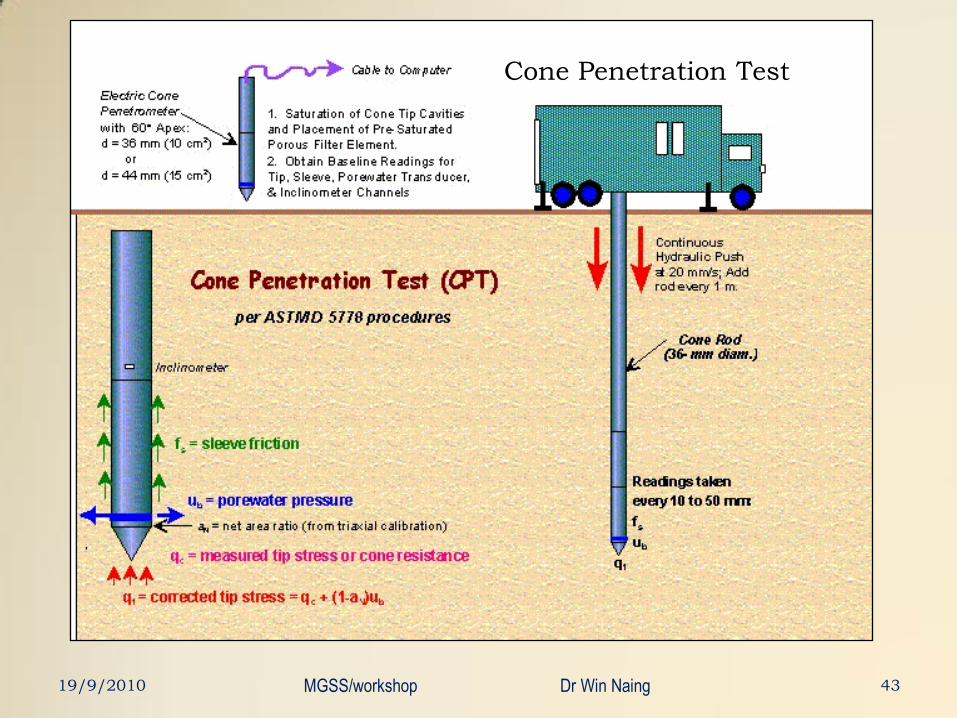
Cone Penetration Test
4419/9/2010 MGSS/workshop Dr Win Naing
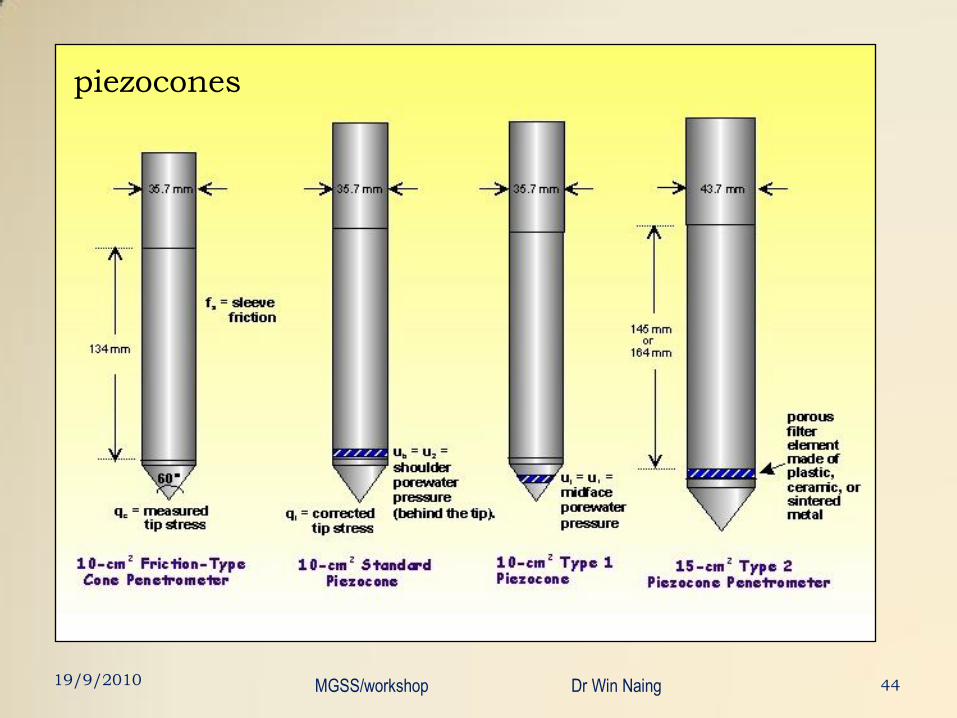
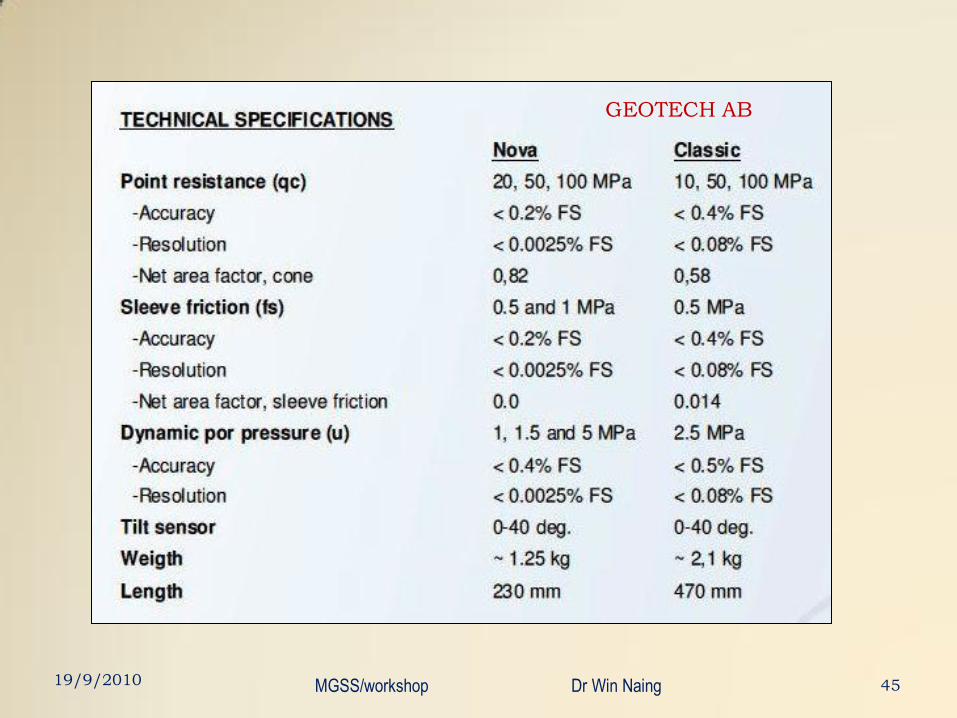
piezocones
4519/9/2010 MGSS/workshop Dr Win Naing
GEOTECH AB
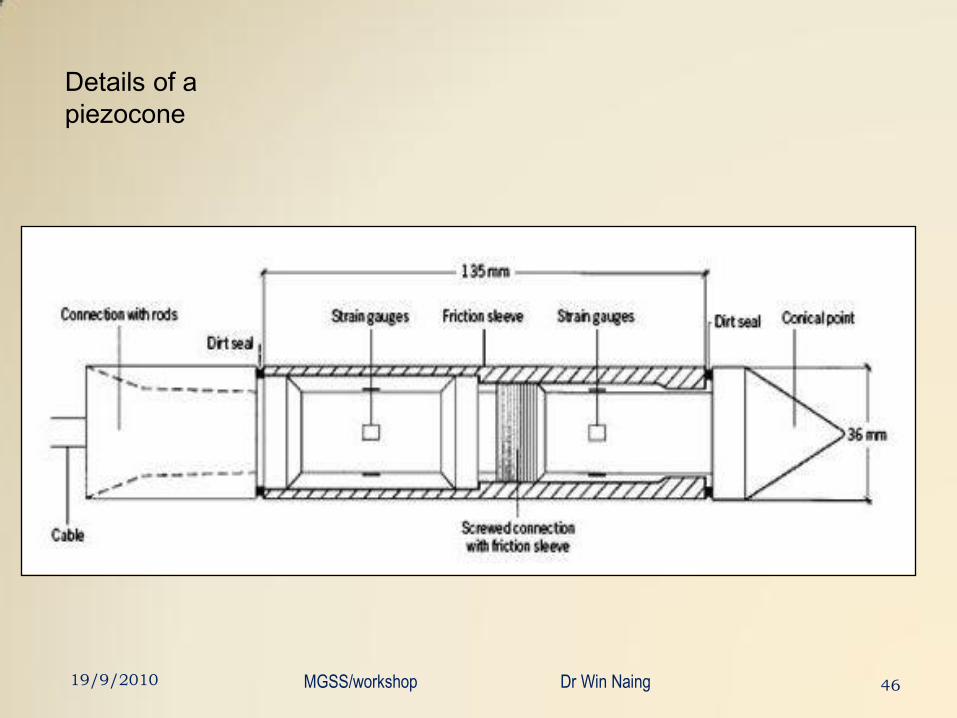
Details of a
piezocone
4619/9/2010 MGSS/workshop Dr Win Naing
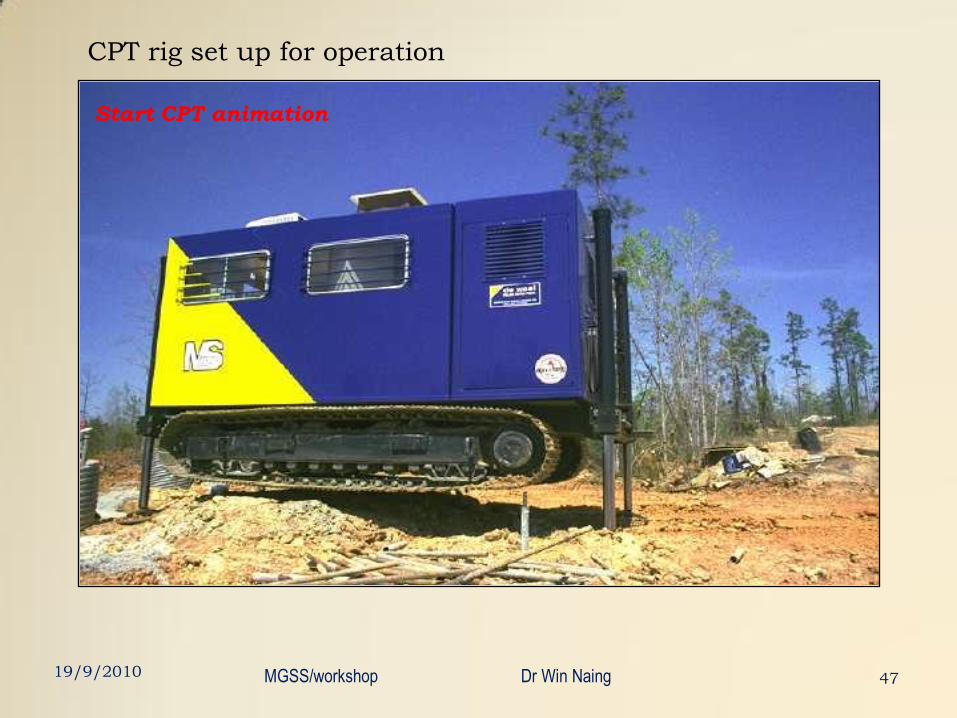
CPT rig set up for operation
4719/9/2010 MGSS/workshop Dr Win Naing
Start CPT animation
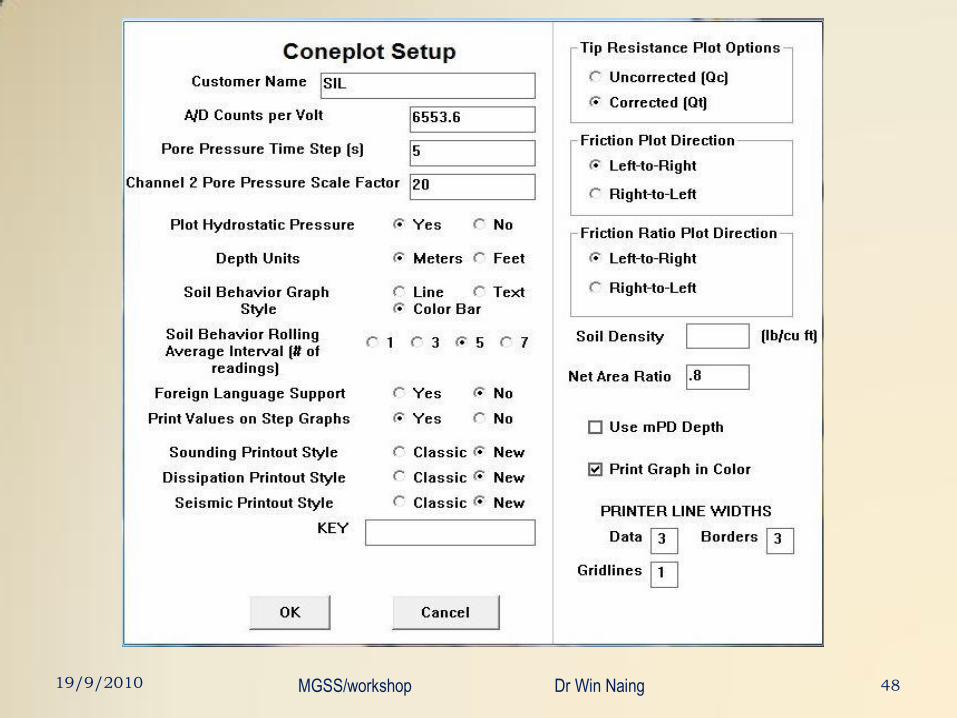
4819/9/2010 MGSS/workshop Dr Win Naing
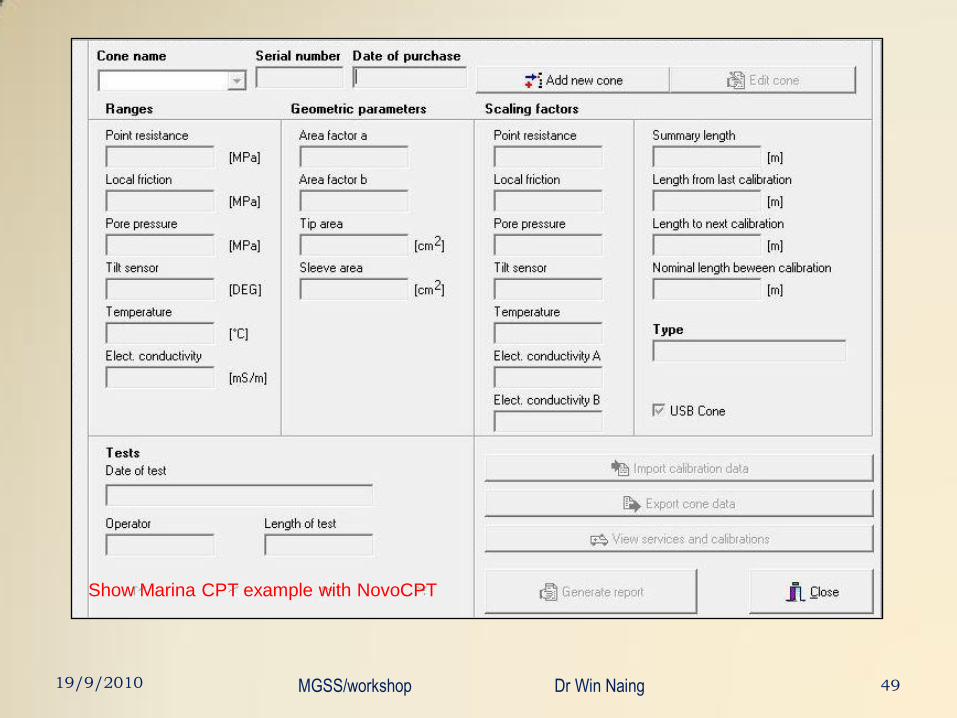
4919/9/2010 MGSS/workshop Dr Win Naing
Show Marina CPT example with NovoCPT
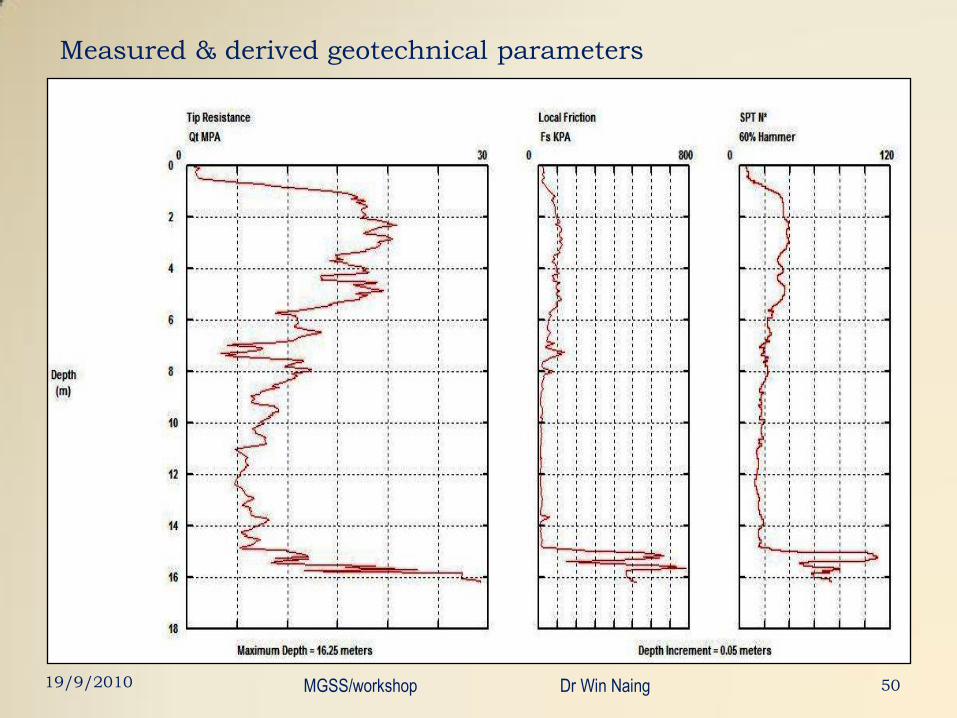
Measured & derived geotechnical parameters
5019/9/2010 MGSS/workshop Dr Win Naing
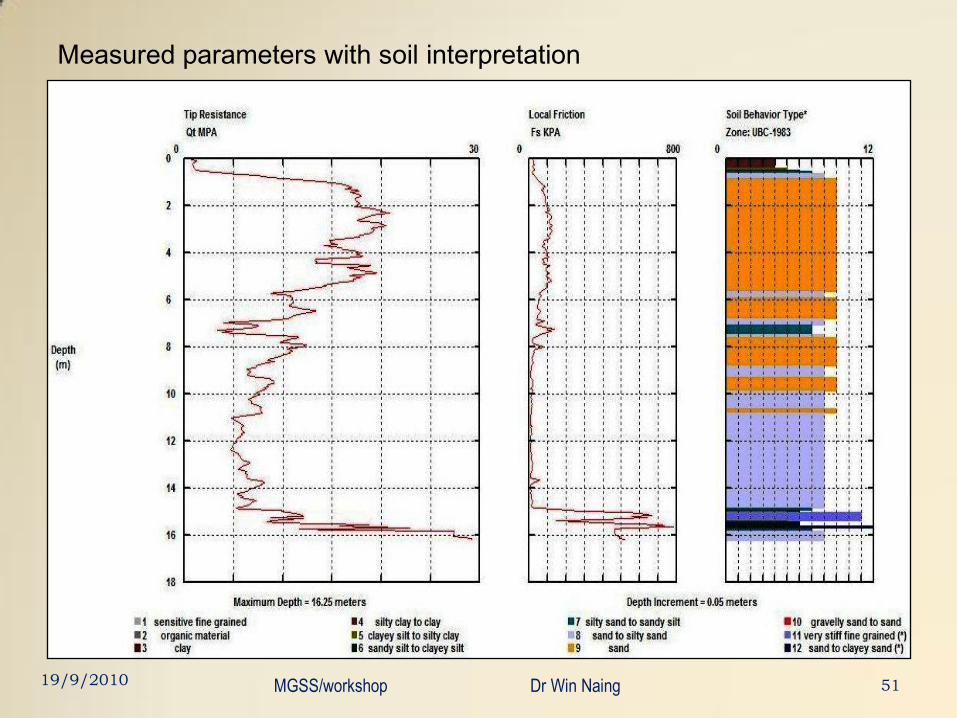
Measured parameters with soil interpretation
5119/9/2010 MGSS/workshop Dr Win Naing
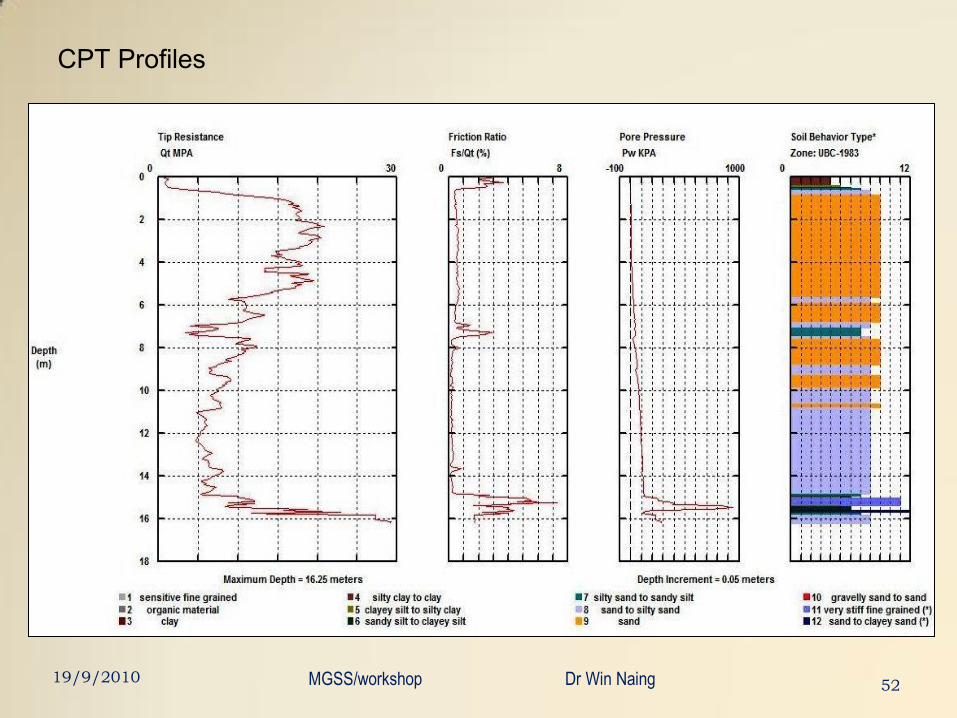
CPT Profiles
5219/9/2010 MGSS/workshop Dr Win Naing
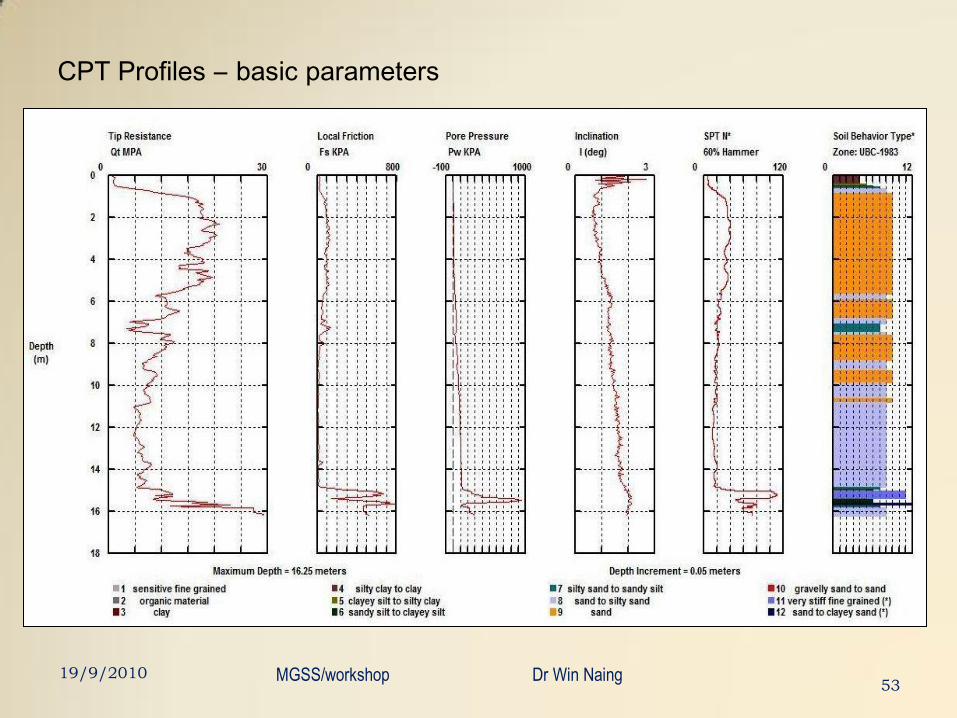
CPT Profiles – basic parameters
5319/9/2010 MGSS/workshop Dr Win Naing
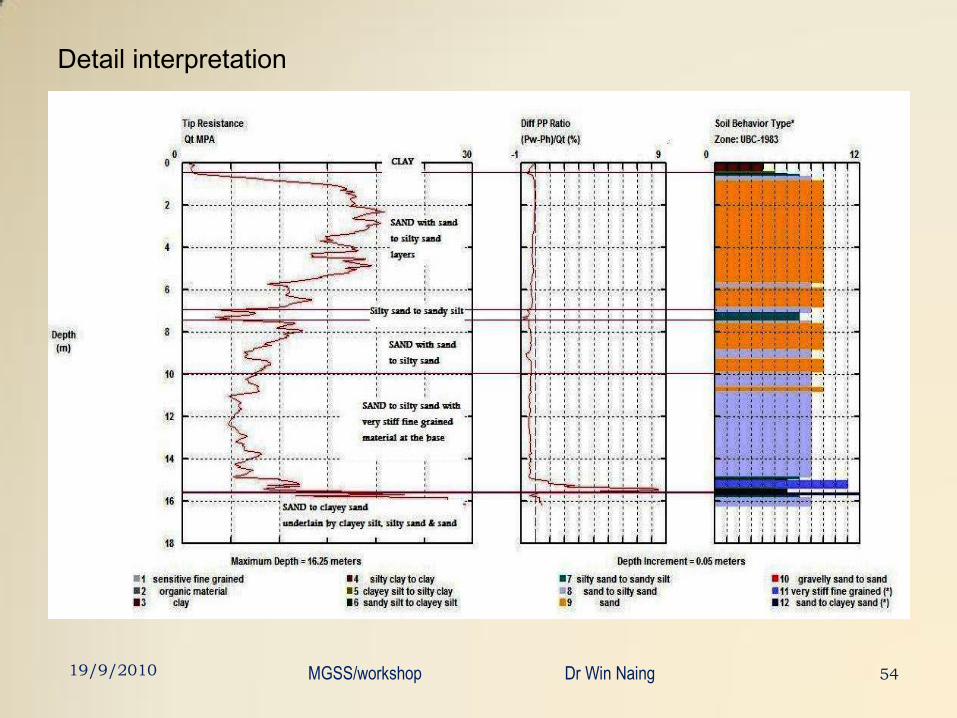
Detail interpretation
5419/9/2010 MGSS/workshop Dr Win Naing
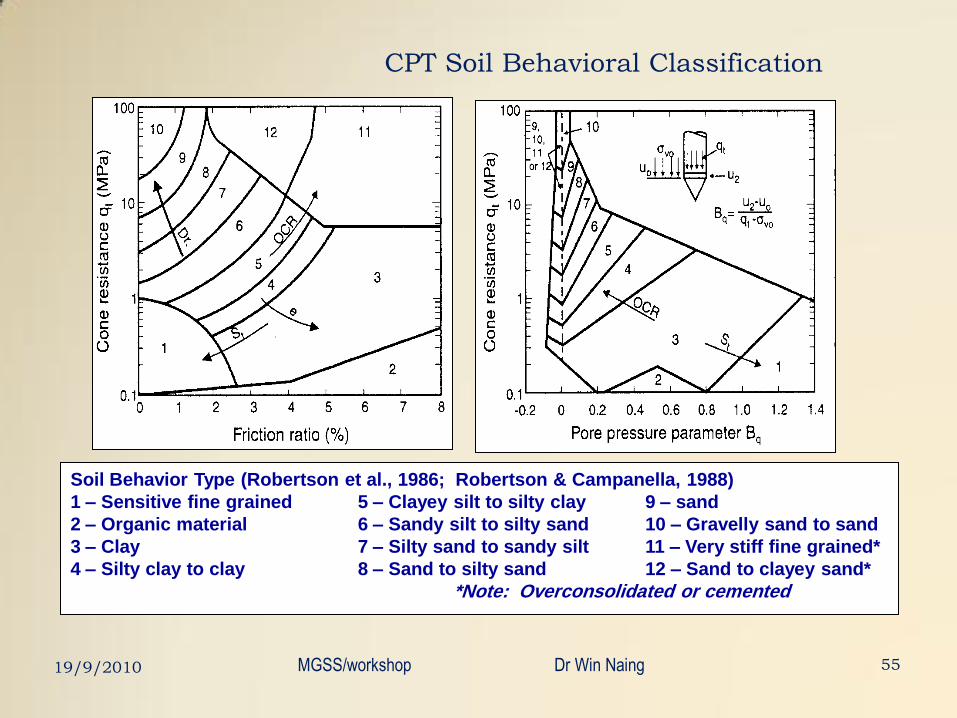
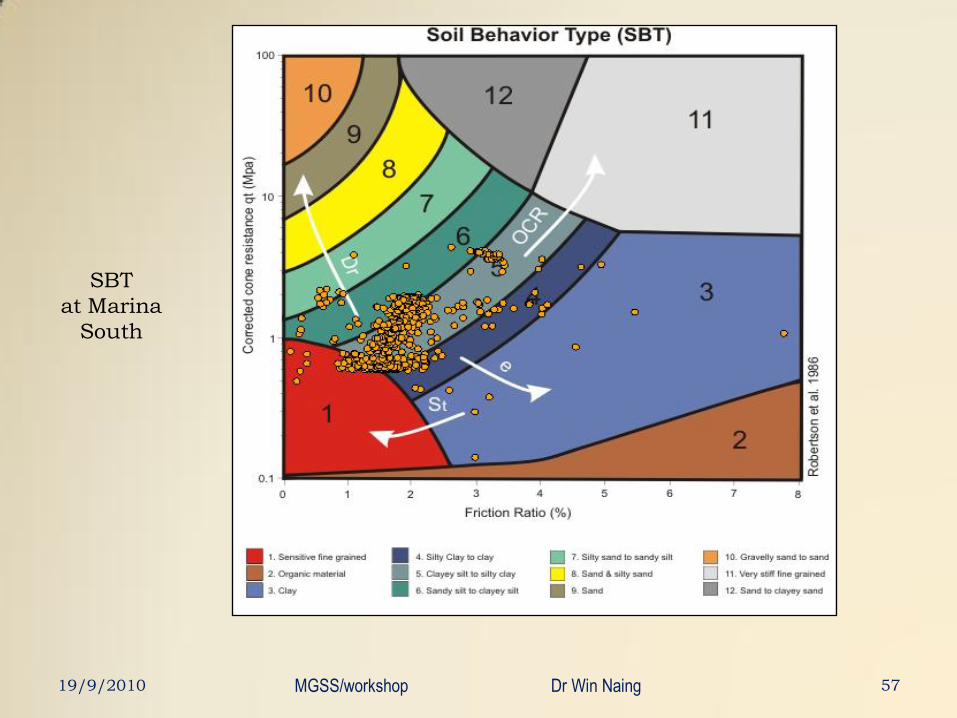
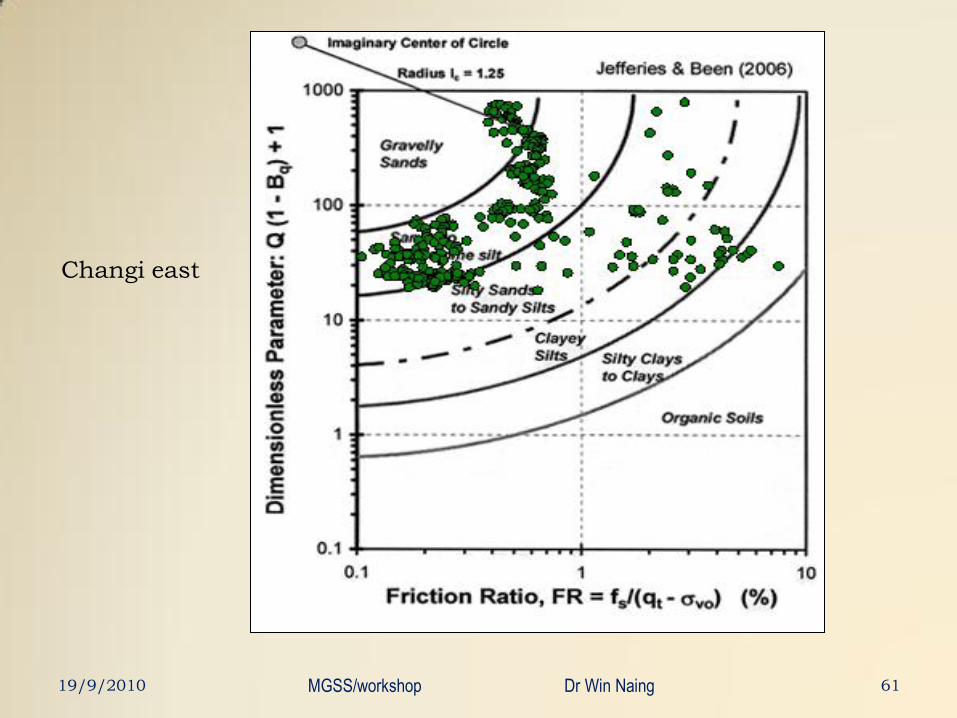
CPT Soil Behavioral Classification
Soil Behavior Type (Robertson et al., 1986; Robertson & Campanella, 1988)
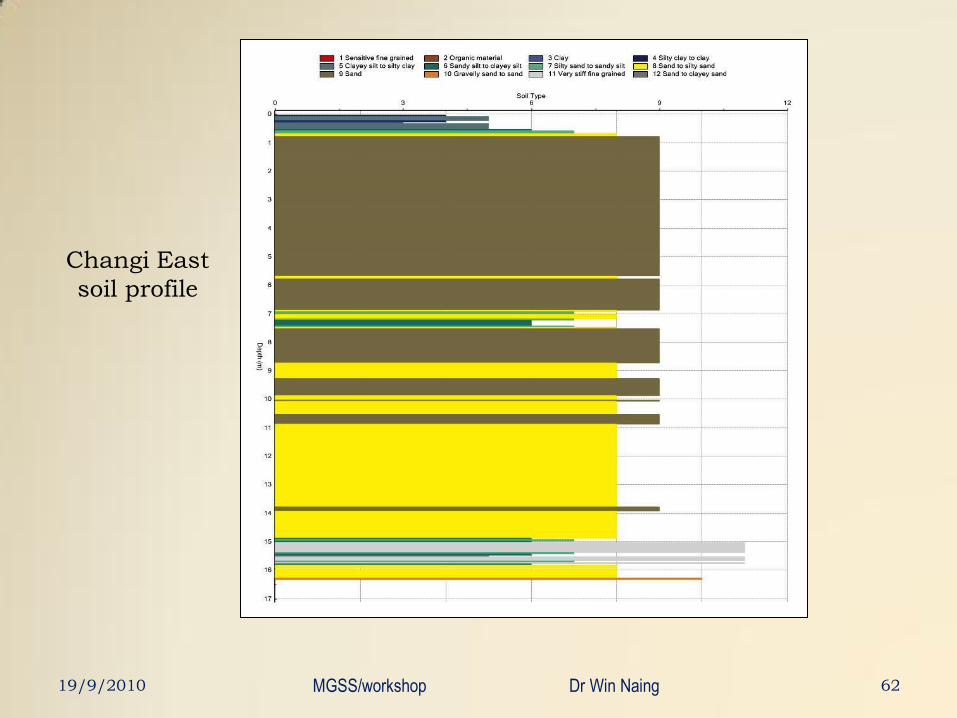
1 – Sensitive fine grained 5 – Clayey silt to silty clay 9 – sand
2 – Organic material 6 – Sandy silt to silty sand 10 – Gravelly sand to sand
3 – Clay 7 – Silty sand to sandy silt 11 – Very stiff fine grained*
4 – Silty clay to clay 8 – Sand to silty sand 12 – Sand to clayey sand*
*Note: Overconsolidated or cemented
19/9/2010 55MGSS/workshop Dr Win Naing
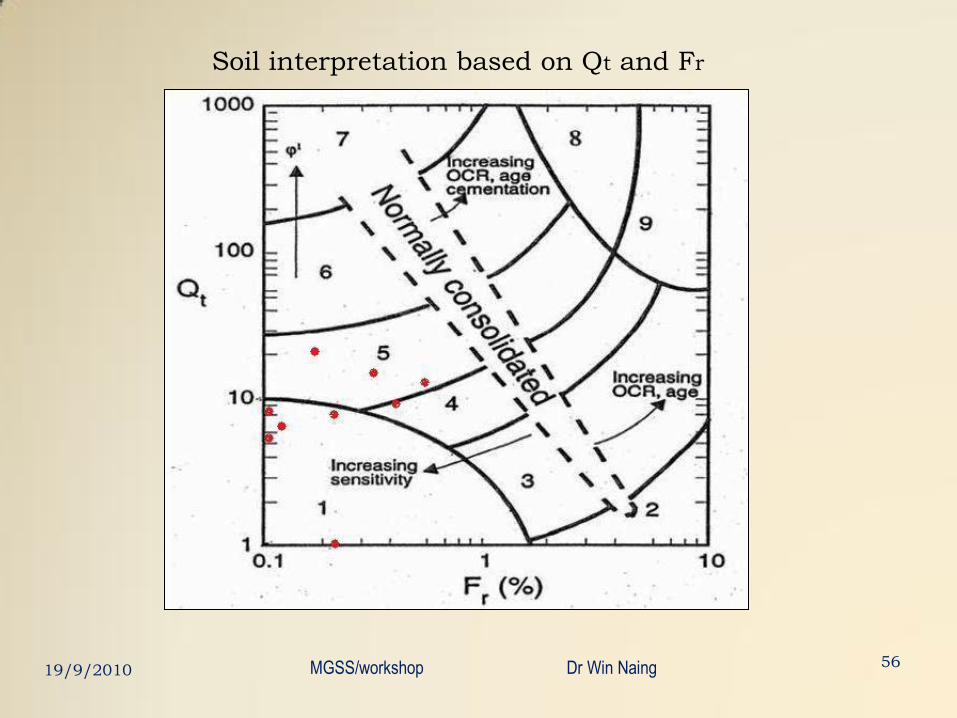
Soil interpretation based on Qt and Fr
5619/9/2010 MGSS/workshop Dr Win Naing
SBT
at Marina
South
5719/9/2010 MGSS/workshop Dr Win Naing
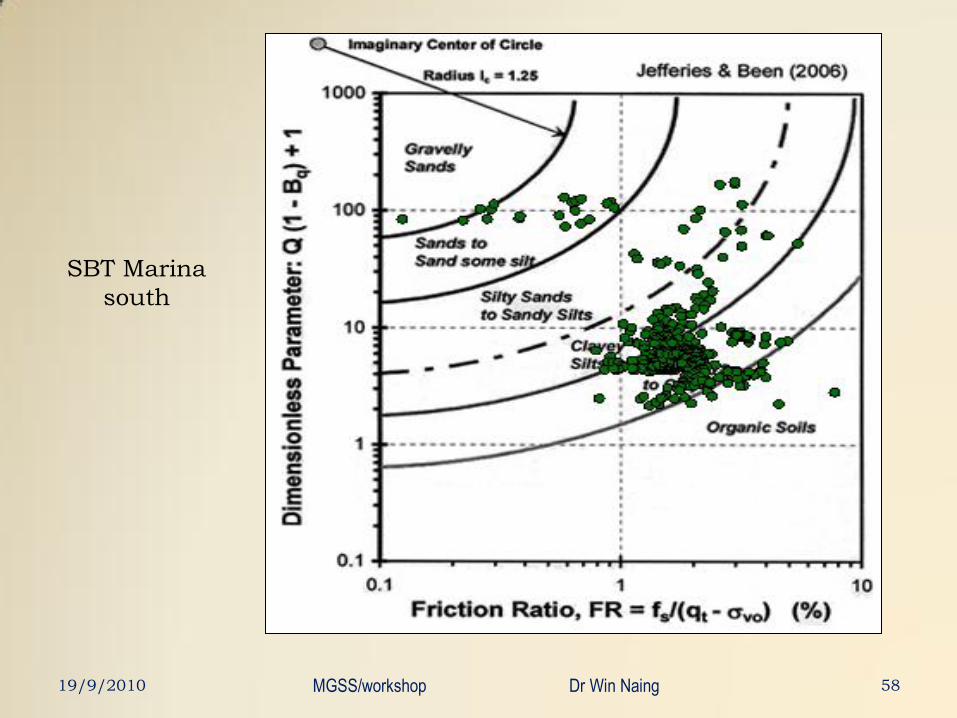
SBT Marina
south
5819/9/2010 MGSS/workshop Dr Win Naing
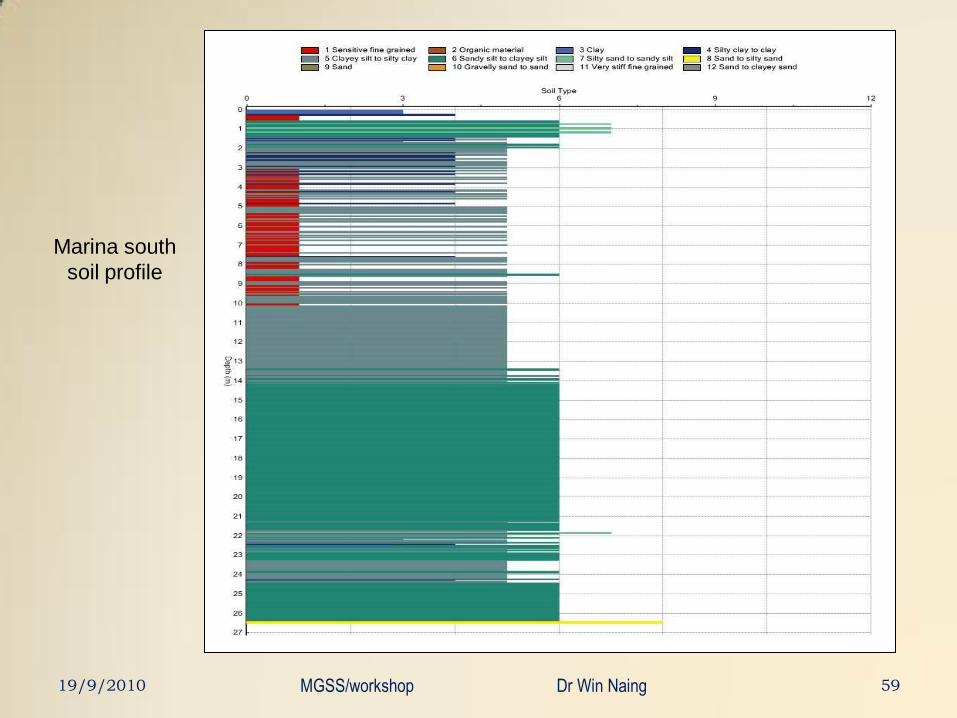
Marina south
soil profile
5919/9/2010 MGSS/workshop Dr Win Naing
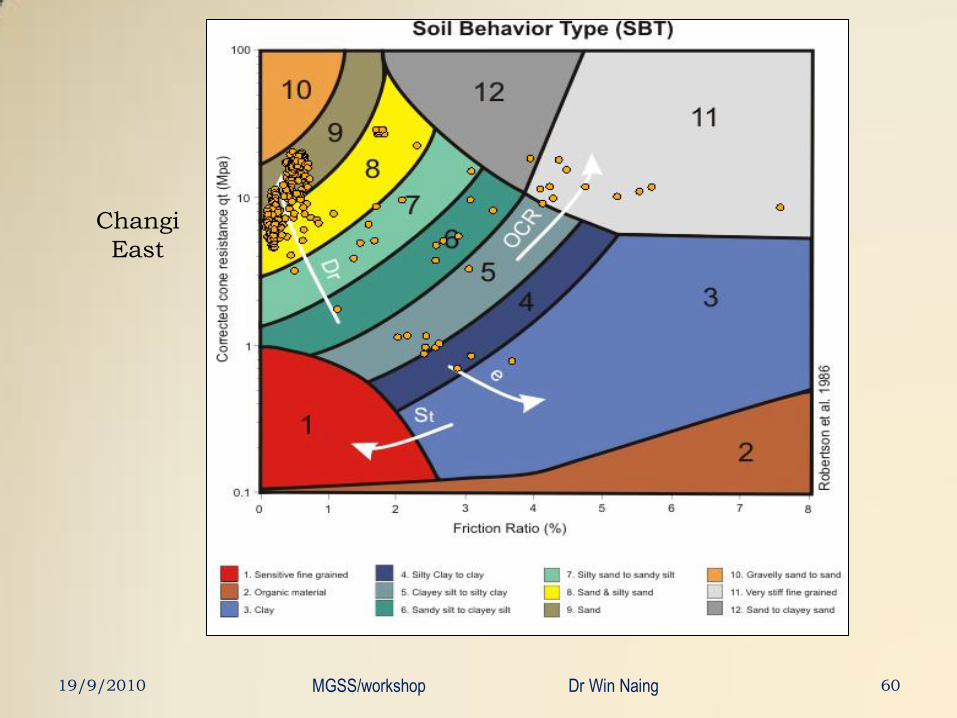
Changi
East
6019/9/2010 MGSS/workshop Dr Win Naing
Changi east
6119/9/2010 MGSS/workshop Dr Win Naing
Changi East
soil profile
6219/9/2010 MGSS/workshop Dr Win Naing
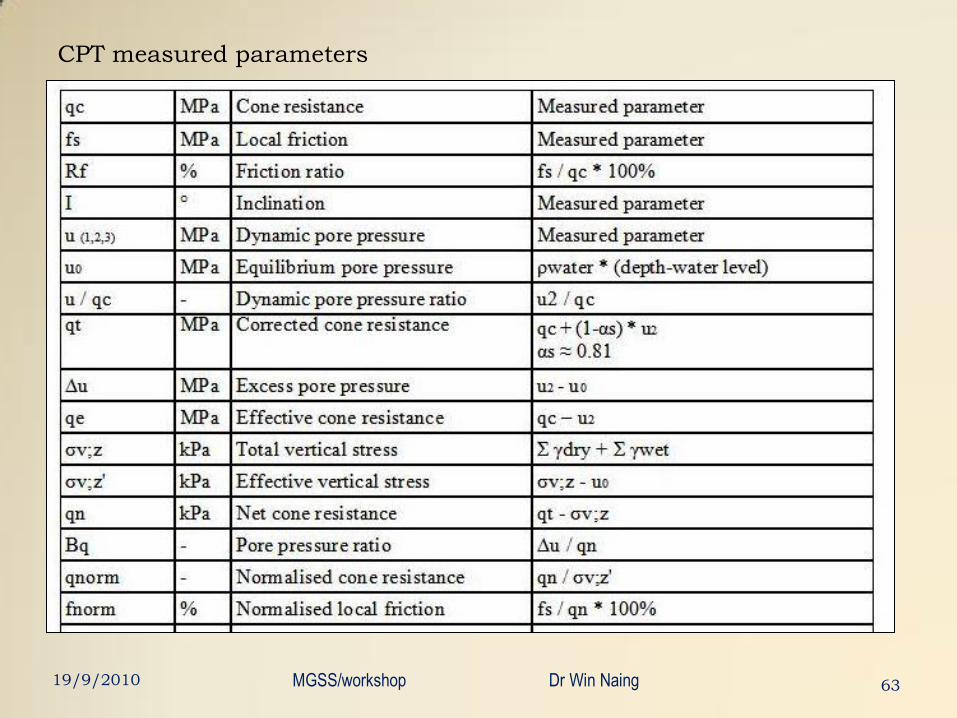
CPT measured parameters
6319/9/2010 MGSS/workshop Dr Win Naing
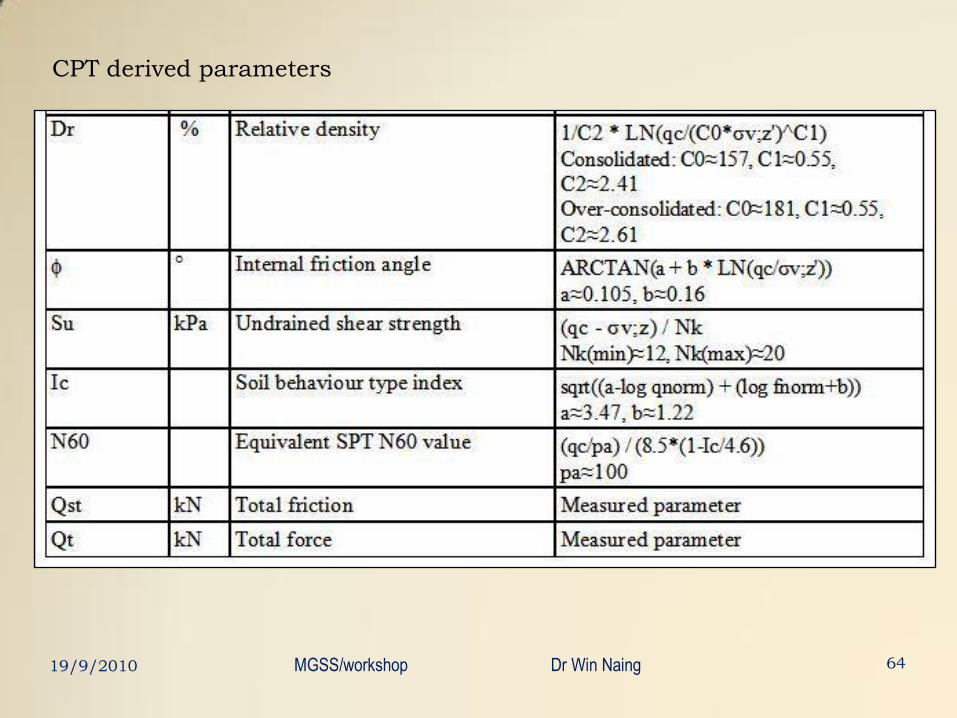
CPT derived parameters
6419/9/2010 MGSS/workshop Dr Win Naing
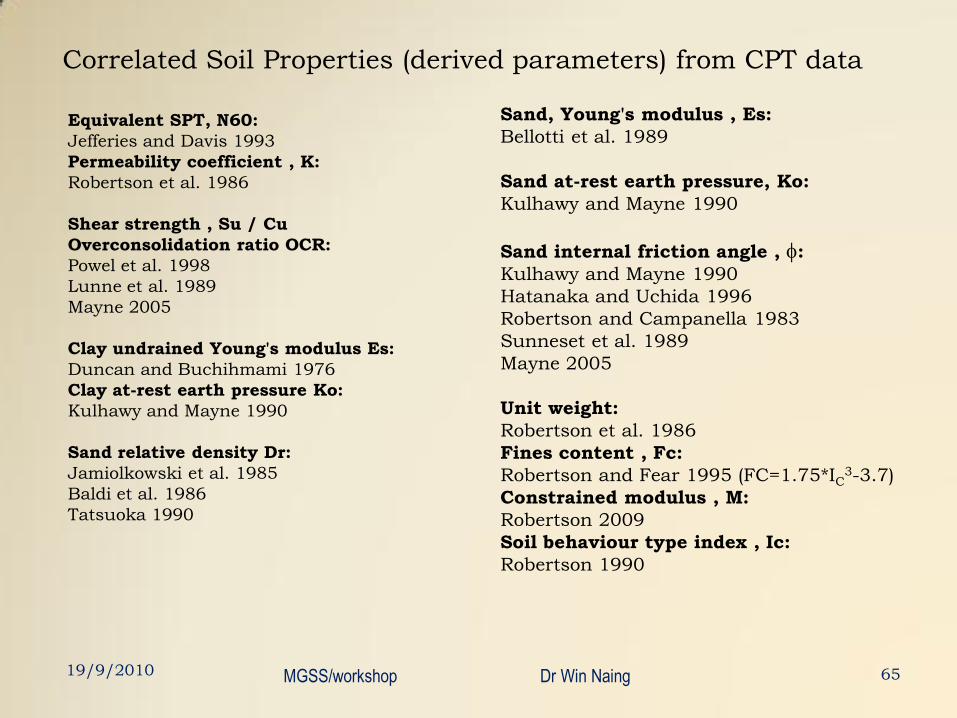
Correlated Soil Properties (derived parameters) from CPT data
Equivalent SPT, N60:
Jefferies and Davis 1993
Permeability coefficient , K:
Robertson et al. 1986
Shear strength , Su / Cu
Overconsolidation ratio OCR:
Powel et al. 1998
Lunne et al. 1989
Mayne 2005
Clay undrained Young's modulus Es:
Duncan and Buchihmami 1976
Clay at-rest earth pressure Ko:
Kulhawy and Mayne 1990
Sand relative density Dr:
Jamiolkowski et al. 1985
Baldi et al. 1986
Tatsuoka 1990
65
Sand, Young's modulus , Es:
Bellotti et al. 1989
Sand at-rest earth pressure, Ko:
Kulhawy and Mayne 1990
Sand internal friction angle , f:
Kulhawy and Mayne 1990
Hatanaka and Uchida 1996
Robertson and Campanella 1983
Sunneset et al. 1989
Mayne 2005
Unit weight:
Robertson et al. 1986
Fines content , Fc:
Robertson and Fear 1995 (FC=1.75*IC3-3.7)
Constrained modulus , M:
Robertson 2009
Soil behaviour type index , Ic:
Robertson 1990
19/9/2010 MGSS/workshop Dr Win Naing
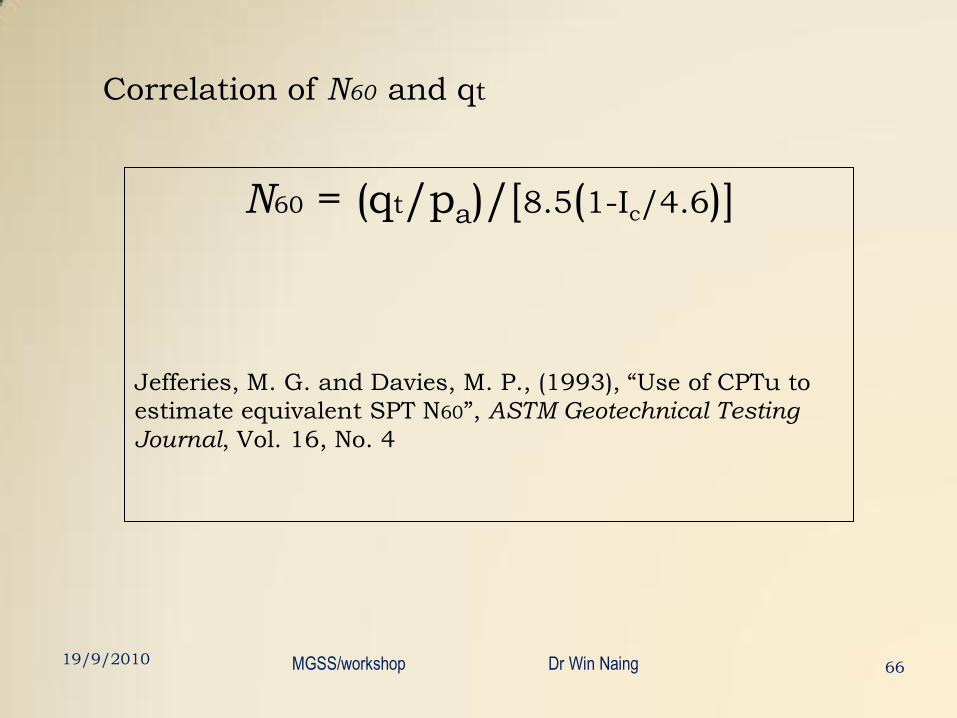
Correlation of N60 and qt
N60 = (qt/pa)/[8.5(1-Ic/4.6)]
Jefferies, M. G. and Davies, M. P., (1993), “Use of CPTu to
estimate equivalent SPT N60”, ASTM Geotechnical Testing
Journal, Vol. 16, No. 4
6619/9/2010 MGSS/workshop Dr Win Naing
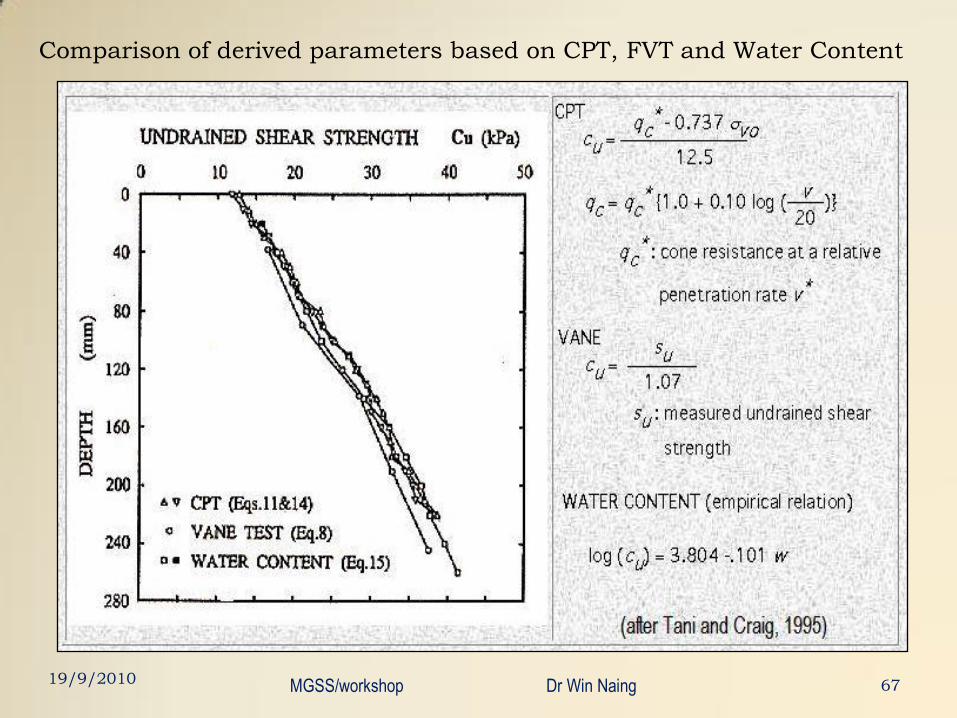
Comparison of derived parameters based on CPT, FVT and Water Content
6719/9/2010 MGSS/workshop Dr Win Naing
Shallow Foundation, Settlement & Pile Capacity
examples using NovoCPT
68
19/9/2010 MGSS/workshop Dr Win Naing
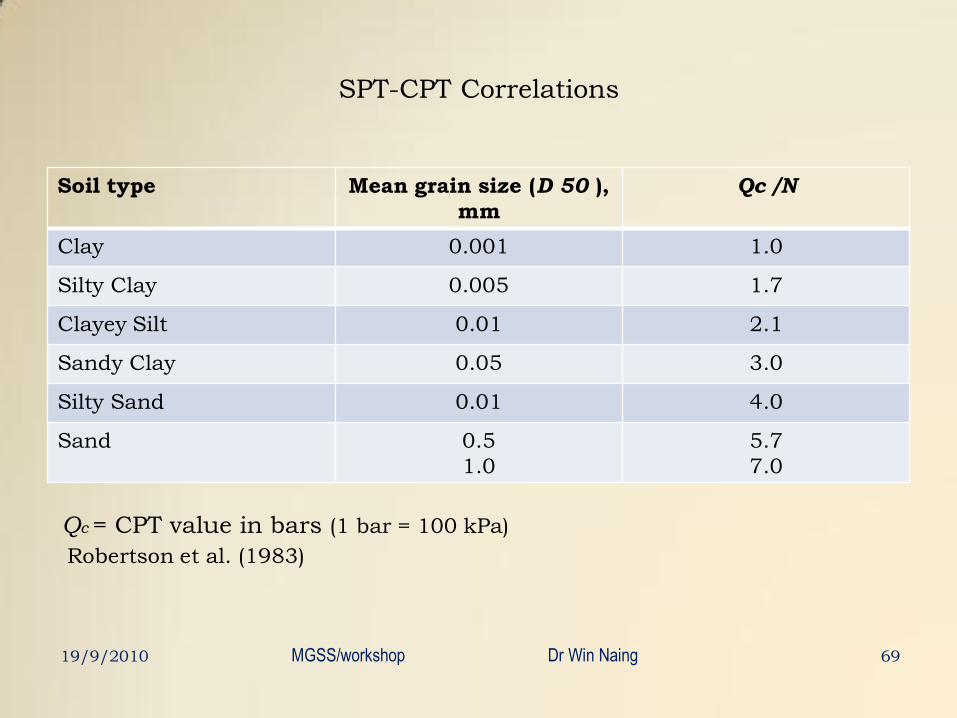
SPT-CPT Correlations
69
Soil type Mean grain size (D 50 ),
mm
Qc /N
Clay 0.001 1.0
Silty Clay 0.005 1.7
Clayey Silt 0.01 2.1
Sandy Clay 0.05 3.0
Silty Sand 0.01 4.0
Sand 0.5
1.0
5.7
7.0
Robertson et al. (1983)
Qc = CPT value in bars (1 bar = 100 kPa)
19/9/2010 MGSS/workshop Dr Win Naing
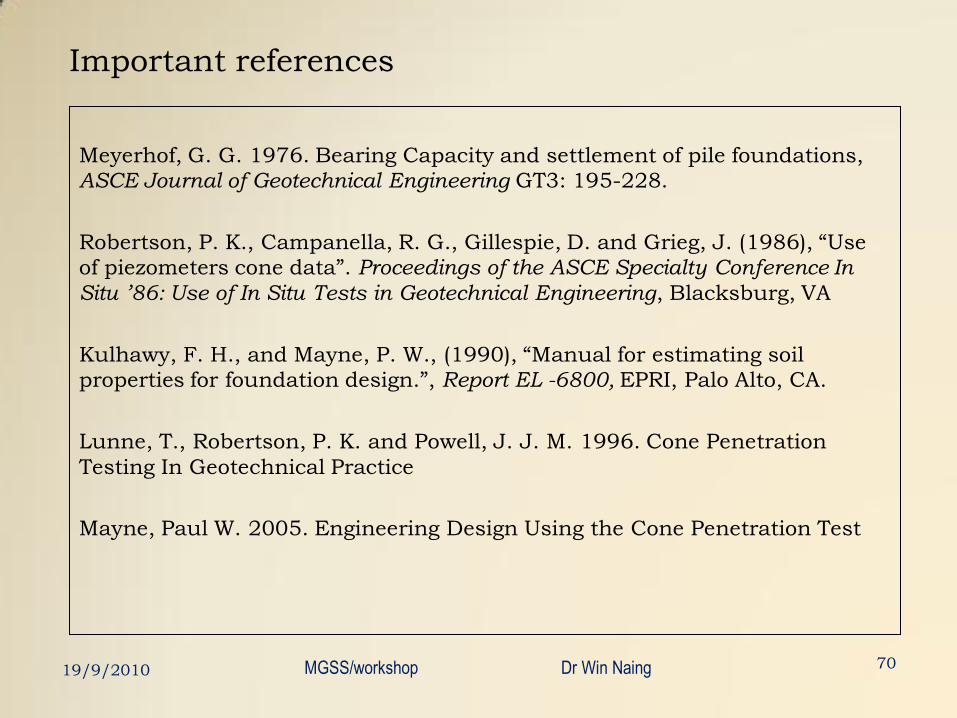
Important references
Meyerhof, G. G. 1976. Bearing Capacity and settlement of pile foundations,
ASCE Journal of Geotechnical Engineering GT3: 195-228.
Robertson, P. K., Campanella, R. G., Gillespie, D. and Grieg, J. (1986), “Use
of piezometers cone data”. Proceedings of the ASCE Specialty Conference In
Situ ’86: Use of In Situ Tests in Geotechnical Engineering, Blacksburg, VA
Kulhawy, F. H., and Mayne, P. W., (1990), “Manual for estimating soil
properties for foundation design.”, Report EL -6800, EPRI, Palo Alto, CA.
Lunne, T., Robertson, P. K. and Powell, J. J. M. 1996. Cone Penetration
Testing In Geotechnical Practice
Mayne, Paul W. 2005. Engineering Design Using the Cone Penetration Test
19/9/2010 MGSS/workshop Dr Win Naing 70
Thank you all for your patience
&
deeply appreciate EC of MGSS for their
devotion and kind effort in propagation
of knowledge in engineering geology &
geotechnical engineering
WISHING YOU ALL THE BEST IN WHATEVER YOU DO!
19 SEPTEMBER 2010
SINGAPORE
19/9/2010 MGSS/workshop Dr Win Naing 71