60
Six Sigma in a Sales & Marketing Environment
| Date post: | 01-Jul-2015 |
| Category: |
Documents |
| Upload: | vijaybijaj |
| View: | 779 times |
| Download: | 4 times |

Six Sigma in a Sales & Marketing Environment

2 9/16/2008
2
Where are You on a Six Sigma Continuum?
5.Coordinated
Enterprise that is Measuring the sameMarketing activitiesto drive towardsA common goal
2.Measuring
some activities
3.Measuring
and OptimizingWithin a group
1.Working to Understand
How to engageThe marketingOrganization in Six SigmaPractices
4.Measuring
and OptimizingEnterprise wide
3 9/16/2008
3
Six Sigma Process is Not How Most Marketers Operate
� Demands high level executive sponsorship and overall alignment
� Disciplined data collection for statistically-based decision making
� Cross functional team participation
� Documentation of the reduction of “defects”
� Quantification of financial benefits achieved through improvements
4 9/16/2008
4
Low Budgets
Low Budgets
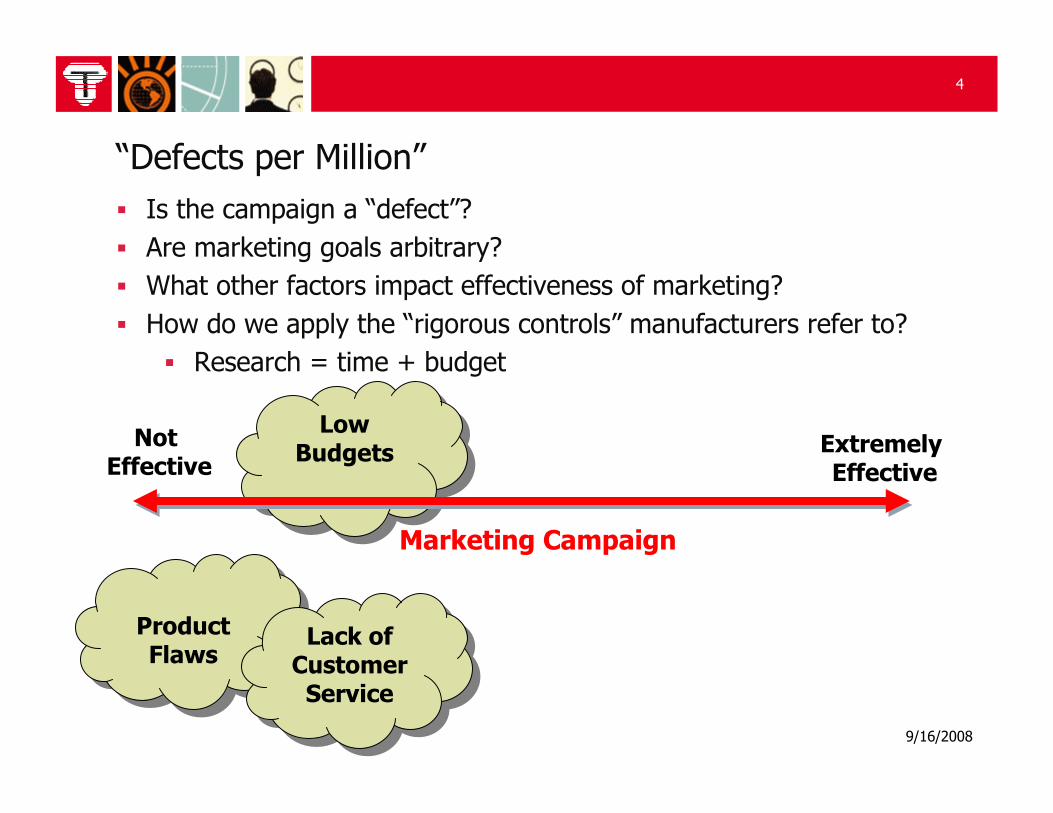
“Defects per Million”
� Is the campaign a “defect”?
� Are marketing goals arbitrary?
� What other factors impact effectiveness of marketing?
� How do we apply the “rigorous controls” manufacturers refer to?
� Research = time + budget
Marketing Campaign
Not Effective
Extremely Effective
Product Flaws
Product Flaws Lack of
Customer Service
Lack of Customer Service

5 9/16/2008
5
Cost Cutting vs. Revenue Growth
How much can you save the company?
How much can you earn the company?
Sales increasesCustomer acquisitionCustomer loyalty

6 9/16/2008
6
The Five Ws of Marketing Metrics
� Who is your audience? All marketing metrics begin with an awareness of a person or persons you are trying to influence. Who is this person?
� What are you trying to measure? You should avoid measuring page views, impressions or hits. Instead, look at qualified leads or sales of products. Measure the effectiveness of your call to action.
� When were the metrics captured, and what time period do they cover?Do they relate to previous metrics? Knowing not just when they were captured, but relating them to previous efforts puts the metrics in a big-picture context.
� Where did these metrics come from? What methods, techniques or organization created and analyzed them? The first question a skeptical audience asks is “where did you get these numbers.” Anticipate it and be prepared!
� Why are these metrics important? How are they relevant to your business? Do they tie to your enterprise map? How did this investment in marketing pay off?

Define Your Goals, Strategies, Customer, Prospect, Processes and Measures

8 9/16/2008
8

9 9/16/2008
9
What is Marketing’s Mission?
Brand Equity Customer Value Shareholder Value
Marketers CEO/CFO
10 9/16/2008
10
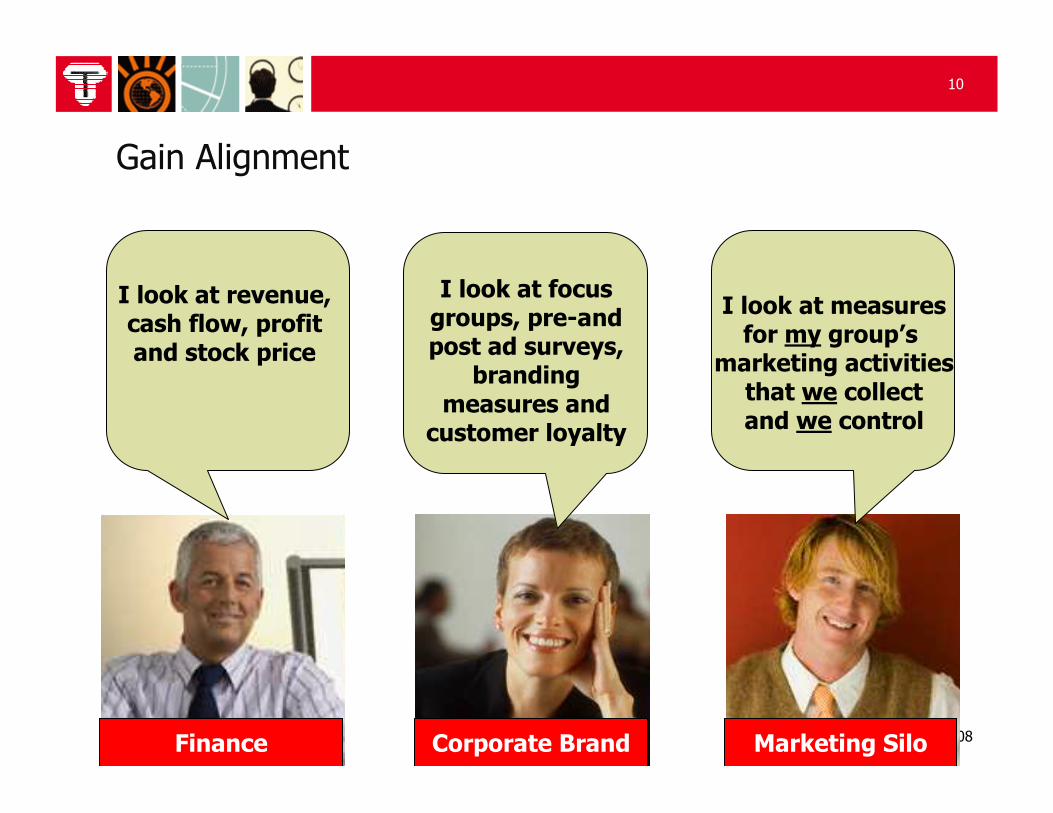
Gain Alignment
I look at measuresfor my group’s
marketing activitiesthat we collectand we control
I look at focus groups, pre-and post ad surveys,
branding measures and
customer loyalty
I look at revenue, cash flow, profit and stock price
Finance Corporate Brand Marketing Silo

11 9/16/2008
11
Enterprise Map Example: Acquisition
12 9/16/2008
12
Enterprise Mapping: Benefits
� Encompasses all areas marketing, providing a holistic framework
� Eliminates disparate, non-synergistic, “one-off” marketing efforts
� Provides a singular, shared-vision and alignment within the organization
� Clearly indicates how each tactic ladders back up to the agreed upon goals
� From the top of the diagram down, the Enterprise Map outlines:
� The organization’s goals
� Marketing objectives
� Strategies
� Tactics

13 9/16/2008
13
Enterprise Mapping Process
� Conduct an audit of the organization’s current activities
� Conduct a planning session with key stakeholders within the organization in order to clearly articulate and agree upon the goals, objectives and marketing vision
1. Obtain agreement on (or develop) tactics, strategies, and goals throughout the chain of command (vertical alignment)
2. Define benchmarks and metrics for tactics, strategies, and goals
3. Create consistency, coordination, communication, and common culture among (horizontal alignment):
� Departments
� Contractors
� Agencies
� Channel
TM

14 9/16/2008
14
Enterprise MaptmMetricsDNAtm
Revenue
CLV
Brand Value
Market Share
ROMI
Retention
Awareness
Distribution
CPM
CPA
Usability
Response Rate

15 9/16/2008
15
Revenue Growth
New Product Profit Margin
Customer Lifetime Value
Acquired Customers
Acquired Preferred Customers
Share of Wallet
Product Time to Market
Event Metrics
Cost Per X
# of Leads
Reach
Manufacturing

16 9/16/2008
16
To Define CTQ’s You Must Define Your Customer
� Voice of customer: gives visibility and legitimacy to customer research
� Focus groups don’t provide randomly sampled, statistically projectable studies

17 9/16/2008
17
PresidentChancellor
Chief Executive
Board Of
Trustees
Vice PresidentStudent Affairs
ChiefInformationOfficer
AdministrativeComputingDepartment
AcademicComputingDepartment
Vice PresidentPurchasing
Vice PresidentFacilities
PurchasingDepartment
Faculty MembersProfessors
DeanDepartment Chair
Within System/University/College Within Schools/Departments
Influencer
Decision Maker
Influencer
Influencer
Decision Maker
Technical Buyer
Technical Buyer
Financial Buyer Financial Buyer
Deal Maker/Breaker
Influencer/TransactionalBuyer
• One per segment
• Mapped to account purchase drivers
Defining the CustomerIdentify & Segment the Audience: Key Player Map
• Determine communications that will
drive revenue and build relationships

18 9/16/2008
18
Understand Your Audience
PersonasHelp Identify Who Your CompanyIs Communicating With

19 9/16/2008
19
20 9/16/2008
20

21 9/16/2008
21

22 9/16/2008
22
Define How You Will Speak To Your Audiences
23 9/16/2008
23
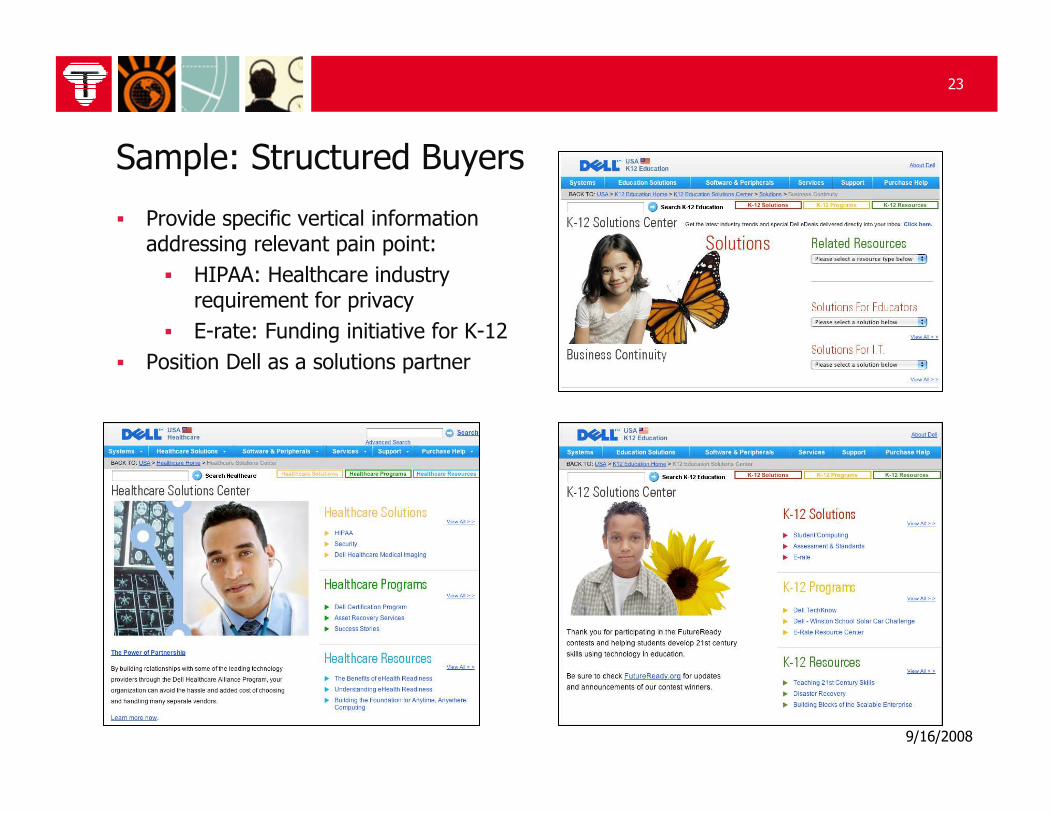
Sample: Structured Buyers
� Provide specific vertical information addressing relevant pain point:
� HIPAA: Healthcare industry requirement for privacy
� E-rate: Funding initiative for K-12
� Position Dell as a solutions partner

24 9/16/2008
24
Sample: Opportunistic Buyers
� Drive revenue utilizing highly promotional direct marketing vehicles including:
� Postcard mailers
� Promotional emails
� Catalogs

Measure only what matters

26 9/16/2008
26
27 9/16/2008
27
28 9/16/2008
28
Metrics Categories
� Efficiency Metrics
� Brand Metrics
� Revenue Metrics
� Sales and Channel
� Customer Metrics
� Market and Economic
29 9/16/2008
29
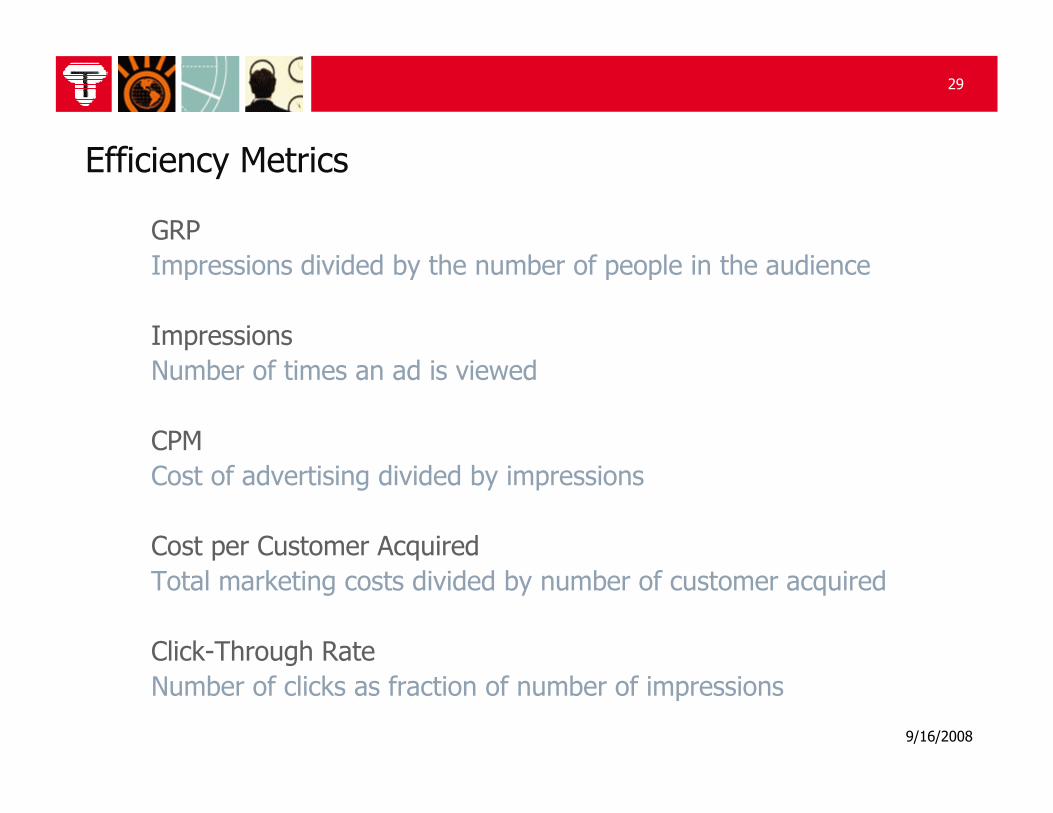
Efficiency Metrics
GRP
Impressions divided by the number of people in the audience
Impressions
Number of times an ad is viewed
CPM
Cost of advertising divided by impressions
Cost per Customer Acquired
Total marketing costs divided by number of customer acquired
Click-Through Rate
Number of clicks as fraction of number of impressions

30 9/16/2008
30
Brand Metrics
Brand Associations
� Awareness
� Quality
� Loyalty
Brand Assets
� Intellectual Property
� Business Process
� Distribution Reach
Market Fundamentals
� Legal
� Political
� Pricing
31 9/16/2008
31
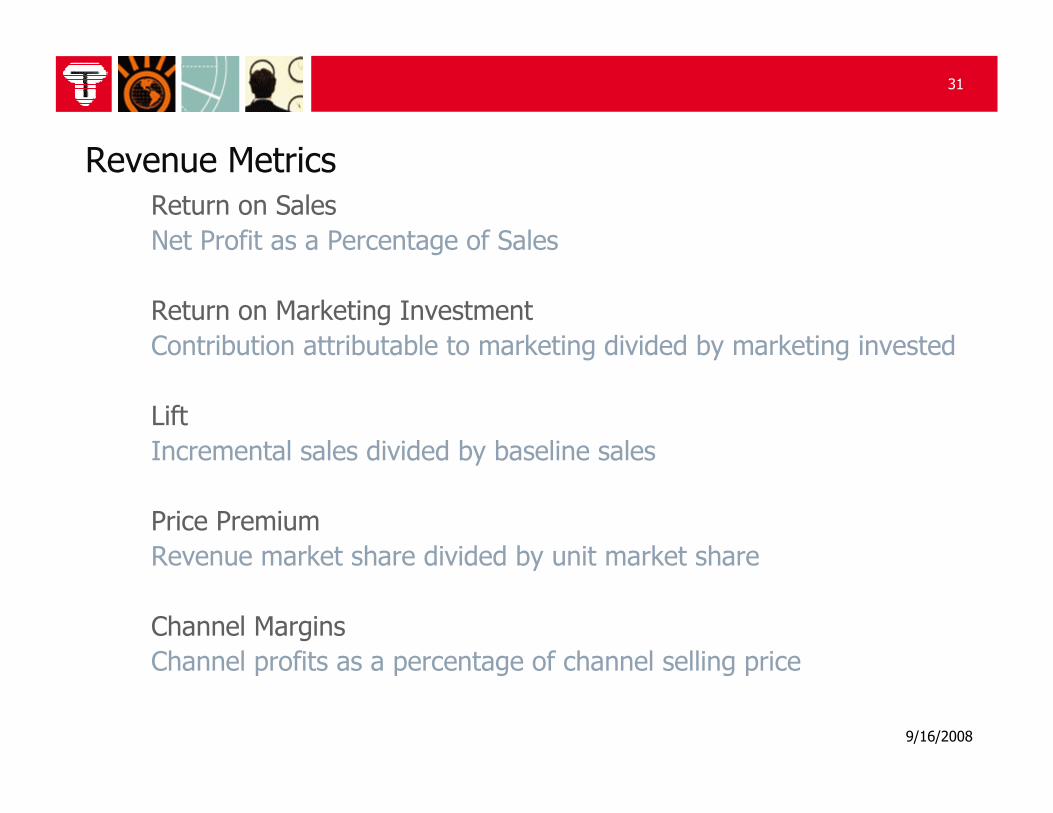
Revenue Metrics
Return on Sales
Net Profit as a Percentage of Sales
Return on Marketing Investment
Contribution attributable to marketing divided by marketing invested
Lift
Incremental sales divided by baseline sales
Price Premium
Revenue market share divided by unit market share
Channel Margins
Channel profits as a percentage of channel selling price

32 9/16/2008
32
Sales and Channel Metrics
Sales Force Turnover
Departing salespersons as a percentage of total sales force
Sales Force Effectiveness
Total sales divided by number of client contacts
Numeric Distribution
Number of outlets carrying brand divided by total number of outlets
Out-of-Stocks
Outlets where the brand is sold but unavailable divided by totalnumber of outlets carrying the brand

33 9/16/2008
33
Market and Economic
Revenue Market Share
Sales revenue as a percentage of market share revenues
Unit Market Share
Unit sales as a percentage of market unit sales
Market Penetration
Purchasers of a product category as a percentage of total population
Consumer Price Index
Index of Consumer Confidence
Prime Interest Rate

34 9/16/2008
34
Customer Metrics
Share of Wallet
Customer purchases of a brand as a percentage of total category purchases
Retention Rate
Calculated different for contractual and non-contractual customers
Customer Lifetime Value
Monetary value of customer relationship
Value Segmentation
Market segmentation based on prospect and customer lifetime value
Demographic Segmentation
Market segmentation based on customer demographics

Analyze the results that are meaningful
36 9/16/2008
36
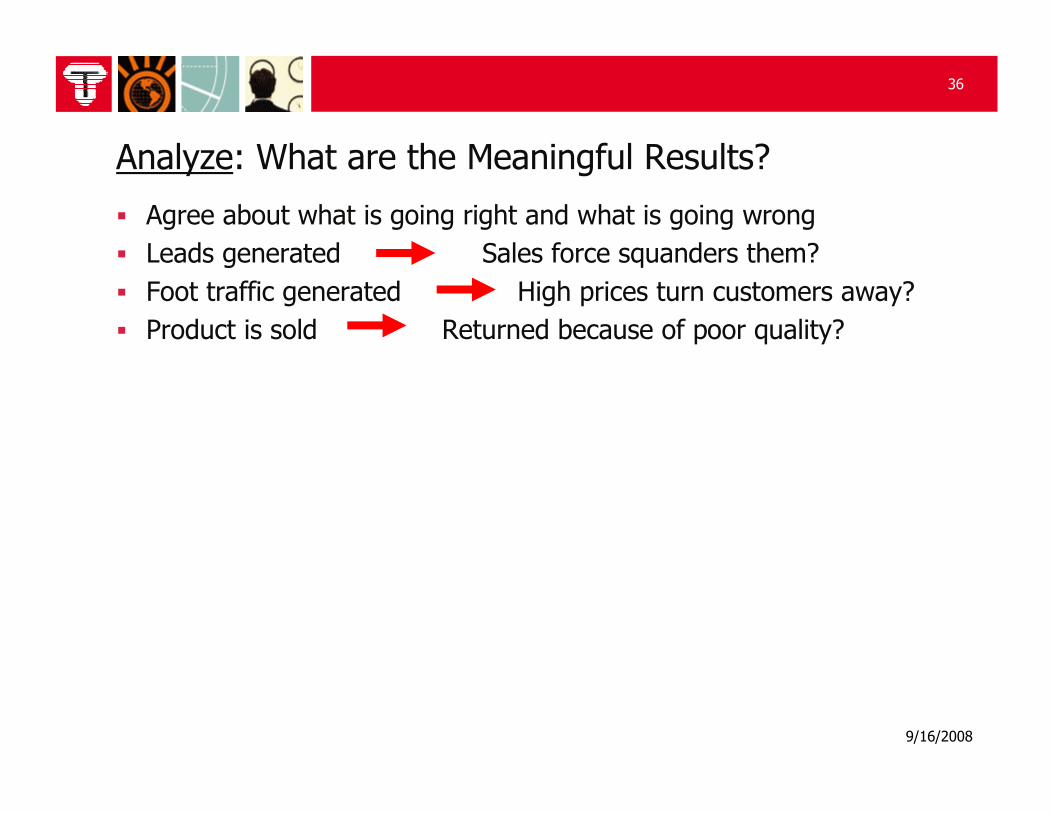
Analyze: What are the Meaningful Results?
� Agree about what is going right and what is going wrong
� Leads generated Sales force squanders them?
� Foot traffic generated High prices turn customers away?
� Product is sold Returned because of poor quality?

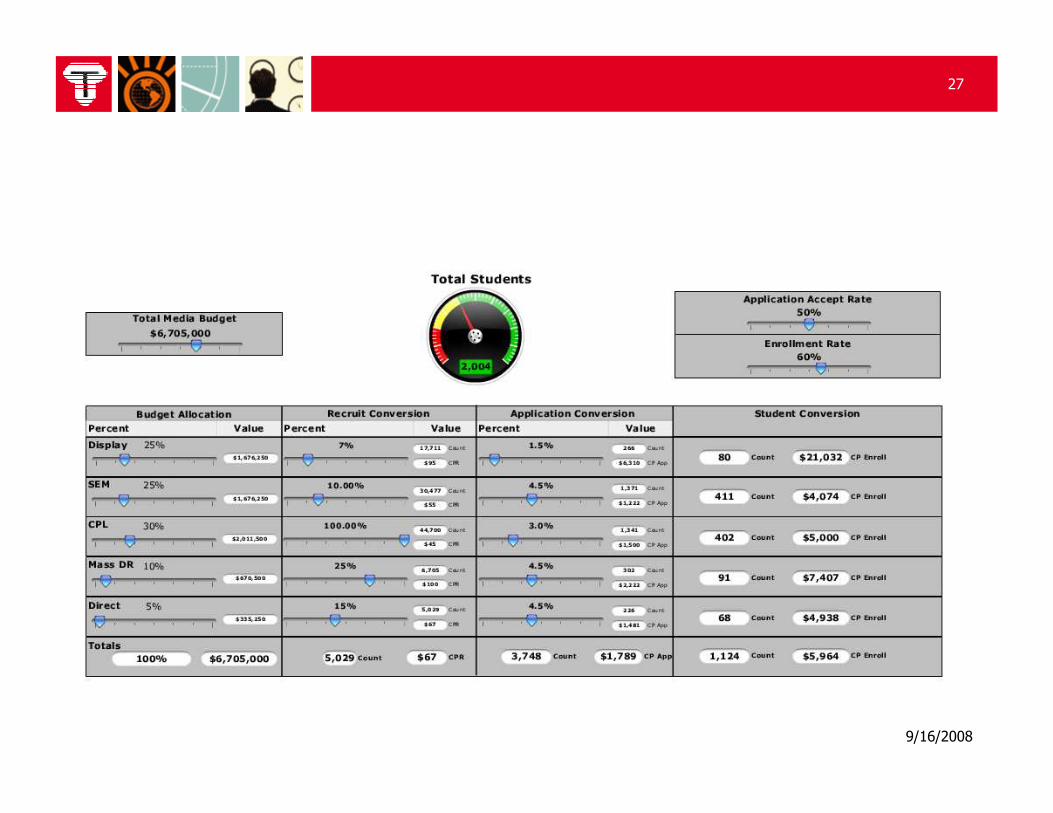
Sample Analysis

38 9/16/2008
38

39 9/16/2008
39
Two Ways to Show Up Using Search: SEO and SEM
INTERNAL
FREE/ORGANIC
PAID (SEM)
(SEO)

40 9/16/2008
40
Comparison of Organic Search Results
In just the first 5 pages of Google, BOA gets 10,000 results while Compass gets less than 1,000.
What this means: Compass Bank will be
invisible to customers who are actively seeking a bank service due to higher visibility of competitive banks.
0
2,000
4,000
6,000
8,000
10,000
12,000
Number of Results Compass Bank
Bank of America
Wells Fargo
Frost Bank
Regions
Zions Bank
How does your online organic visibility compare to your competitors?

41 9/16/2008
41
Comparison of Monthly Paid Search Budgets
Bank of America is diverting additional traffic away from Compass Bank by spending more on paid search.
$0
$10,000
$20,000
$30,000
$40,000
$50,000
$60,000
$70,000
$80,000
$90,000
$100,000
Estimated Budget Compass Bank
Bank of America
Wells Fargo
Frost Bank
Regions
Zions Bank
How does your online paid visibility compare to your competitors?

42 9/16/2008
42
What This Means: Missed Opportunities for Compass Bank
Potential customers search for “Online Banking”556,260 times per year.
Compass Bank is almost invisible in organic search results.
Paid search position #8 receives 10% of potential customers.
43 9/16/2008
43
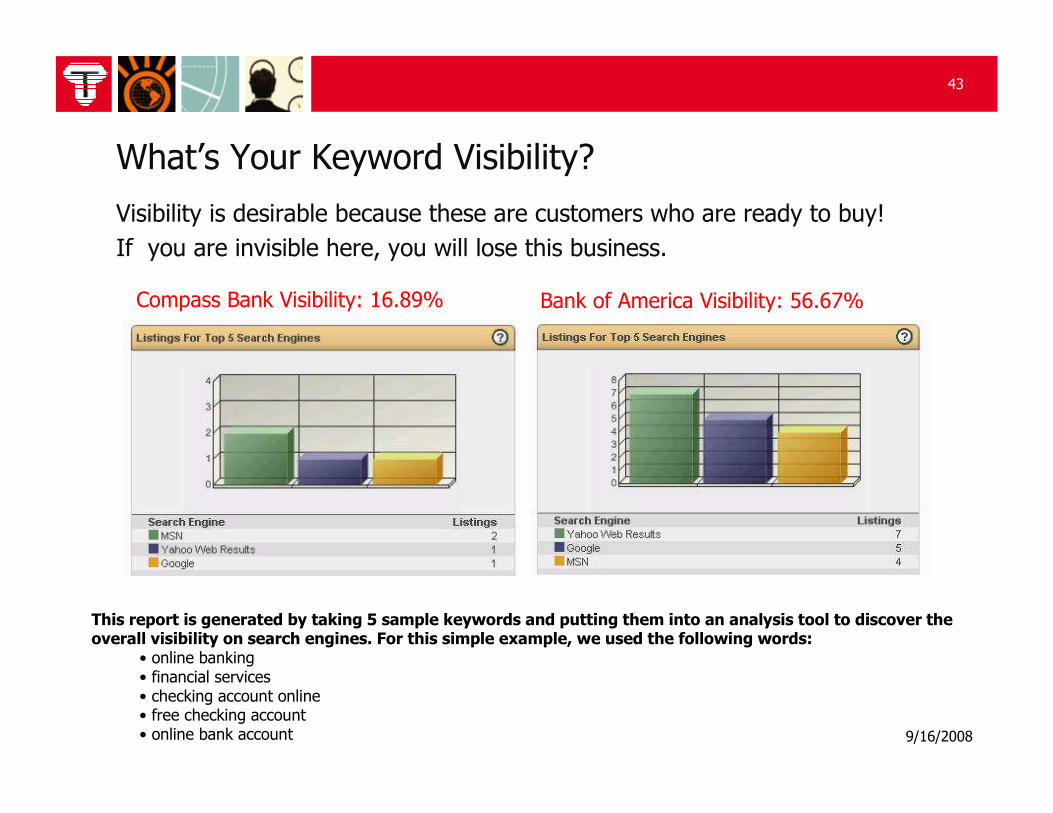
What’s Your Keyword Visibility?
Visibility is desirable because these are customers who are ready to buy!
If you are invisible here, you will lose this business.
Bank of America Visibility: 56.67%Compass Bank Visibility: 16.89%
This report is generated by taking 5 sample keywords and putting them into an analysis tool to discover the overall visibility on search engines. For this simple example, we used the following words:
• online banking• financial services• checking account online• free checking account• online bank account
44 9/16/2008
44
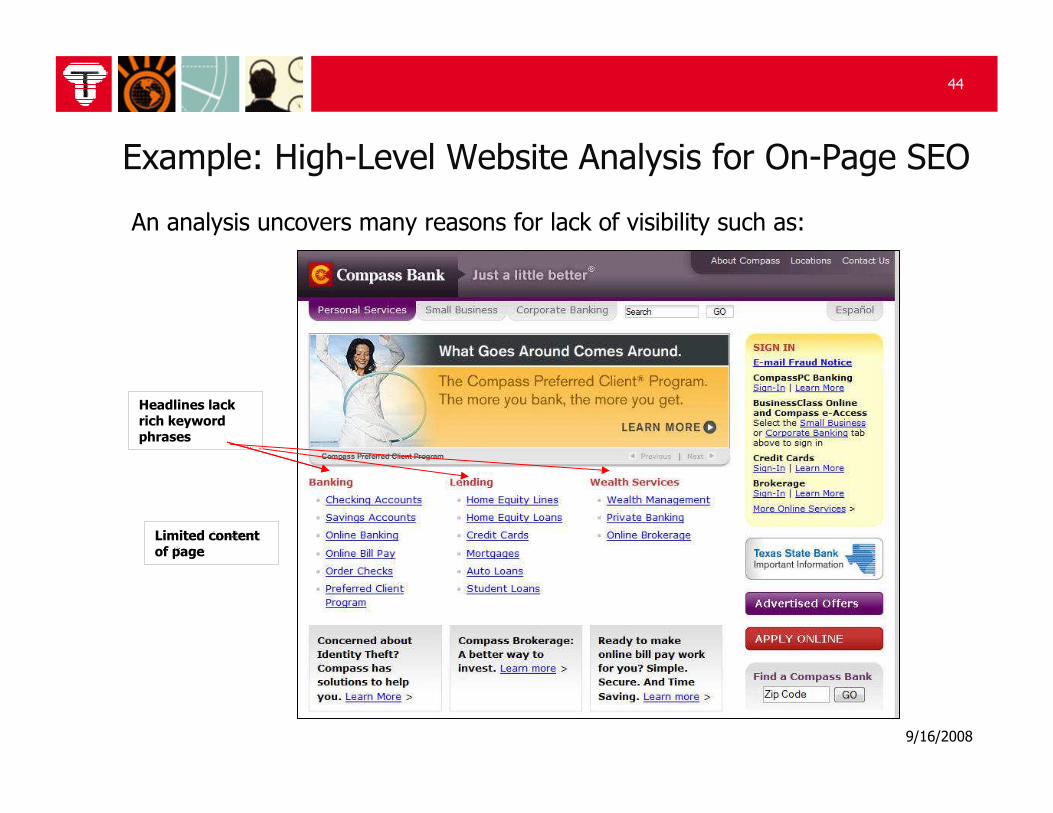
Example: High-Level Website Analysis for On-Page SEO
Limited Content of Page
Headlines lack rich keyword phrases
Limited content of page
An analysis uncovers many reasons for lack of visibility such as:

45 9/16/2008
45
Example of On-Page Meta Tag Analysis Insights
Meta tag analysis uncovers problems with the website and the way it ranks.
For instance, this title tag is too long and has poor keyword phrases.
The description tag is too long and does not invite a potential customer to visit.

46 9/16/2008
46
Example of On-Page Meta Tag Analysis Insights
� Too many keywords in the site dilute page content.
� Marketing departments often don’t know that they should look for this, and the responsibility falls to the IT dept. or web developers.
� The web developers don’t understand marketing.
compass bank, cbss, compass bancshares, home equity, home equity loan, home equity line, texas home equity, texas home equity line, free checking, free atms, online banking, internet banking, pc banking, compass, compas, compas bank, compass banks, compasspc, alabama, arizona, colorado, florida, new mexico, texas, al, az, fl, co, nm, tx, dallas, houston, birmingham, austin, gainesville, jacksonville, phoenix, tucson, denver, albuquerque, san antonio, waco, huntsville, montgomery, megabank, arizona bank
Potential customers do not search for single words like “montgomery” when locating a bank service.
47 9/16/2008
47
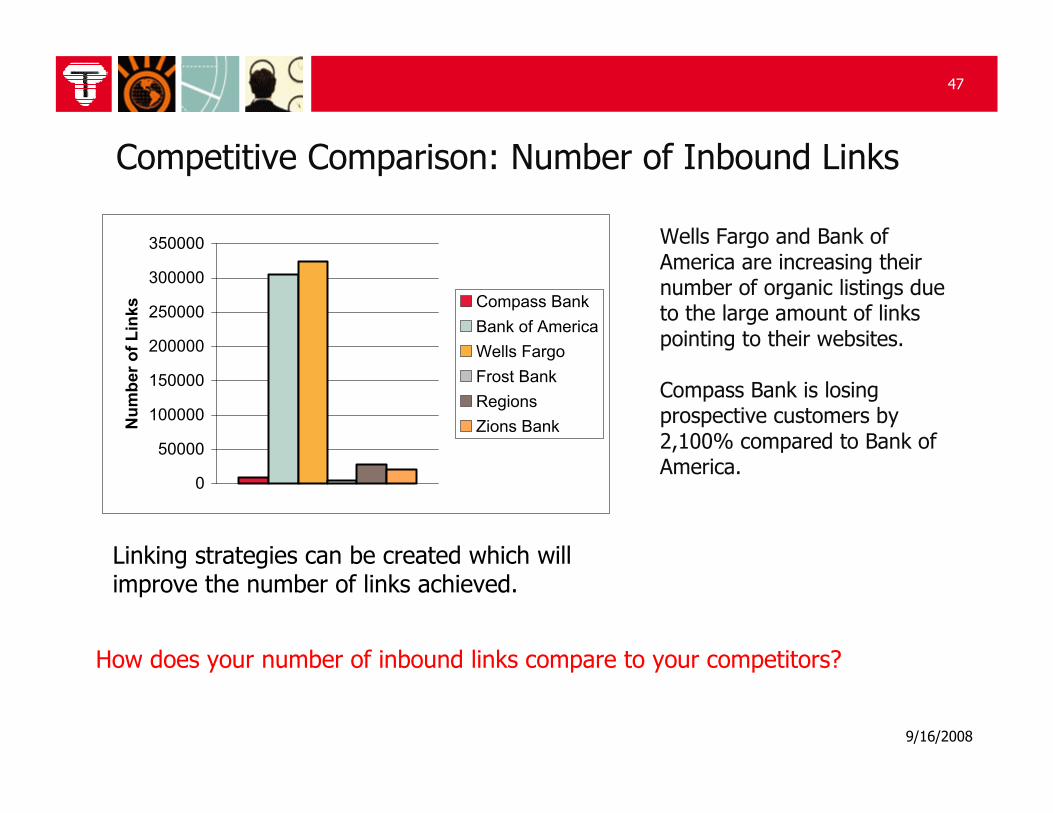
Competitive Comparison: Number of Inbound Links
0
50000
100000
150000
200000
250000
300000
350000
Number of Links Compass Bank
Bank of America
Wells Fargo
Frost Bank
Regions
Zions Bank
Wells Fargo and Bank of America are increasing their number of organic listings due to the large amount of links pointing to their websites.
Compass Bank is losing prospective customers by 2,100% compared to Bank of America.
Linking strategies can be created which will improve the number of links achieved.
How does your number of inbound links compare to your competitors?

48 9/16/2008
48
Competitive Comparison: Google-Indexed Pages
0
1000
2000
3000
4000
5000
6000
7000
8000
9000
10000
Number of Pages Compass Bank
Bank of America
Wells Fargo
Frost Bank
Regions
Zions Bank
This tells us how many pages Google sees on your website. This produces visibility for your bank.
Wells Fargo and Bank of America have the most pages on their websites.
Compass Bank is losing prospective customers by offering fewer entrances into their website.
Web pages can be optimized to improve this.
How does your number of indexed pages compare to your competitors?

49 9/16/2008
49
Competitive Comparison: Total Google Search Results
When people are searching for anything bank related, BOA will show up first.
Bank of America and Wells Fargo have large leads in brand visibility.
Compass Bank will not be considered an industry leader without online brand visibility.
0
5,000,000
10,000,000
15,000,000
20,000,000
25,000,000
Total Results
Compass Bank
Bank of America
Wells Fargo
Frost Bank
Regions
Zions Bank
You can make your pages desirable to link to. Sample tactics: sponsor a non-profit and link from there, link from press releases, add content to your site (i.e. how to get a loan on line, or tips to refinancing a home, etc.), add pages to your site for each bank location.
How does your company compare to competitors in overall Google search results?

ImproveMarketing by Testing and Optimizing

51 9/16/2008
51
Multivariate Optimization Tools for Website Improvement
Capabilities
� Allows testing many simultaneous variables vs. manual A/B tests
� Delivers test results much more quickly with less site traffic
� Maximizes the ability to precisely target content and offers
� Delivers measurement test results real time to the desktop
� Helps to definitively answer why changes are better or worse
� Allows for greater targeting to different audience segments
Benefits
� Increases the performance of websites and landing pages
� Removes constrained developer resources from optimization
� Saves time and resources dedicated to site optimization

52 9/16/2008
52
Multivariate Optimization - Vendors in the Space
53 9/16/2008
53
Ad Serving Tools for Improving On-line Ad Performance
Capabilities
� Delivers communication and measures response and conversion
� Tracks most marketing channels including display, email, search
� Rotates and sequentially serves creative for testing purposes
� Reports performance metrics near real time to the desktop
� Serves media codes downstream connecting data to other tools
Benefits
� Enables the testing and precise measurement of:
� Sites and placement
� Offer, price and premium
� Creative concept and message
� Landing pages and conversion funnel
� Allows for more rapid deployment and analysis of results
54 9/16/2008
54

Control

56 9/16/2008
56
Common Performance Issues
� Want to be thinkers, not doers
� Poor time management; missed deadlines; late nights
� Difficulty collaborating with team
� Lack of tolerance for those who are not as technical
� Make it a mystery rather than train and mentor team
� Want to be selective about what they do:
� “Can’t someone else fill out my time sheets?”
� “and keep track of my account finances?”
� “…and manage those details?”

57 9/16/2008
57
“You’ve Got to Eat Your Green Beans”
58 9/16/2008
58
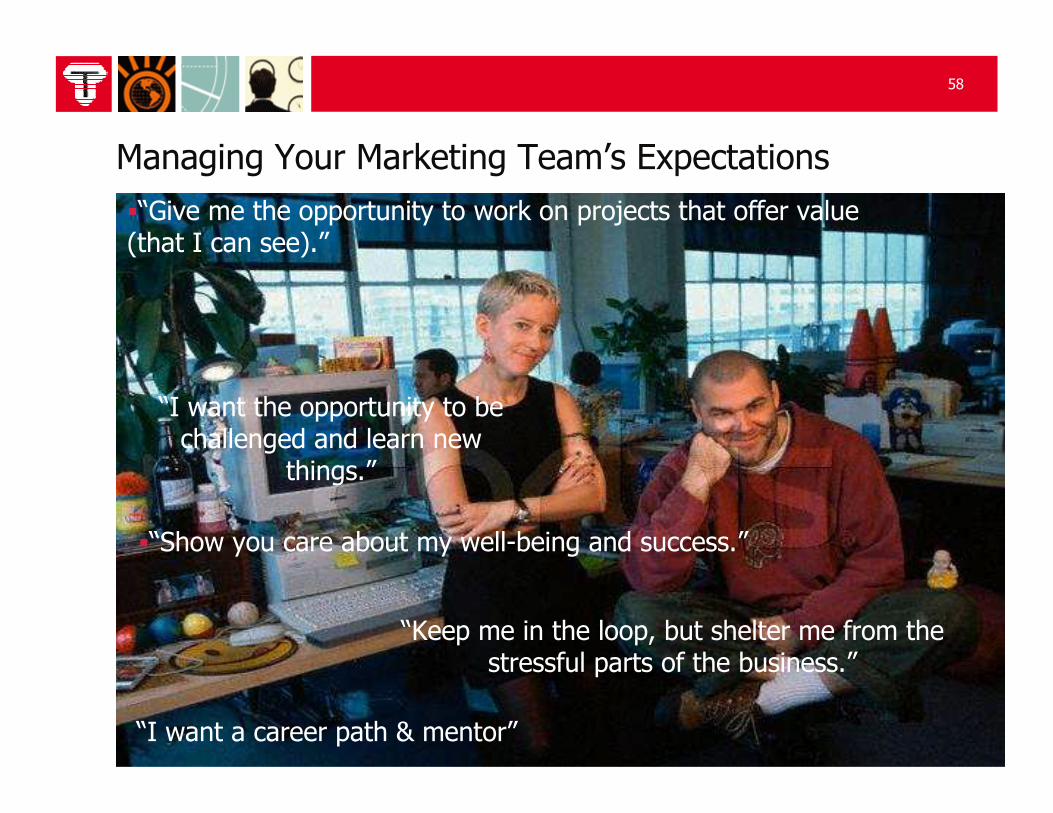
Managing Your Marketing Team’s Expectations
�“Show you care about my well-being and success.”
“Keep me in the loop, but shelter me from the stressful parts of the business.”
�“Give me the opportunity to work on projects that offer value (that I can see).”
“I want a career path & mentor”
“I want the opportunity to be challenged and learn new
things.”
59 9/16/2008
59
Control: Marketing Operations
� How will you define roles and responsibilities for your team?
� How is performance of the group measured?
� How is performance of individuals measured?
� How is your digital marketing team regarded by other parts of the company?
� To what extent is your digital marketing integrated with the organization’s strategy, IT strategy, marketing strategy, etc.?
� How will you handle annual planning process for your group? Who is involved? What objectives will be set?


