144
SKANSKA ANNUAL REPORT 2005

SKANSKA ANNUAL REPORT 2005
SK
AN
SKA
AN
NU
AL
REP
OR
T 2
00
5

Production: Skanska AB, Investor Relations in collaboration with Addira, Enell and Suscom. Translated by: Victor Kayfetz, Scan Edit, Oakland, CA.Printed by: Arkpressen, Västerås, Sweden, 2006.
Addresses
Skanska ABSE-169 83 SolnaSwedenStreet address: Råsundavägen 2Tel: +46 8 753 88 00Fax: +46 8 755 12 56
Skanska SwedenSE-169 83 SolnaSwedenStreet address: Råsundavägen 2Tel: +46 8 504 350 00 Fax: +46 8 755 63 17Kundtjänst: 020-30 30 40www.skanska.se
Skanska NorwayPostbox 1175 SentrumNO-0107 OsloNorwayStreet address: Drammensveien 60Tel: +47 40 00 64 00 Fax: +47 23 27 17 30 www.skanska.no
Skanska DenmarkBaltorpvej 158DK-2750 BallerupDenmarkTel: +45 44 77 99 99 Fax: +45 44 77 98 99www.skanska.dk
Skanska FinlandP.O.Box 114FI-00101 HelsinkiFinlandStreet address: Paciuksenkatu 25Tel: +358 9 6152 21 Fax: +358 9 6152 2271 www.skanska.fi
Skanska Poland Gen. J. Zajaczka 9PL-01-518 WarsawPolandTel: +48 22 561 3000Fax: +48 22 561 3001www.skanska.pl
Skanska Czech Republic Kubánské námesti 1391/11CZ-100 05 Prague 10 Czech RepublicTel: +420 2 67 310 476Fax: +420 2 67 310 644www.skanska.cz
Skanska UK Maple Cross HouseDenham Way, Maple CrossRickmansworthHertfordshire WD3 9SWUnited KingdomTel: +44 1923 776 666 Fax: +44 1923 423 900www.skanska.co.uk
Skanska USA Building1633 Littleton RoadParsippany, NJ 07054U.S.A.Tel: +1 973 656 65 00Fax: +1 973 334 5376www.skanskausa.com
Skanska USA Civil16-16 Whitestone ExpresswayWhitestone NY 11357 U.S.A.Tel: +1 718 747 34 54 Fax: +1 718 747 34 58 www.usacivil.skanska.com
Skanska Latin AmericaAv. Pte. Roque S. Peña 555-8 Piso(C1035AAA) Buenos AiresArgentina Tel: +54 11 4341 7000 Fax: +54 11 4341 7503 www.skanska.com.ar
Skanska Residential Development NordicSE-169 83 SolnaSwedenStreet address: Råsundavägen 2Tel: +46 8 504 350 00 Fax: +46 8 504 361 99www.skanska.com/residentialnordic
Skanska InternationalSE-169 83 SolnaSwedenStreet address: Råsundavägen 2Tel: +46 8 504 350 00Fax: +46 8 504 361 99www.skanska.com/residentialnordic
Skanska Commercial Development NordicSE-169 83 SolnaSwedenStreet address: Råsundavägen 2Tel: +46 8 504 350 00 Fax: +46 8 504 361 99www.skanska.se/fastigheter
Skanska Commercial Development EuropeSE-169 83 SolnaSwedenStreet address: Råsundavägen 2Tel: +46 8 504 350 00 Fax: +46 8 504 361 99www.skanska.com/property
Skanska Infrastructure DevelopmentSE-169 83 SolnaSwedenStreet address: Råsundavägen 2Tel: +46 8 504 350 00 Fax +46 8 755 13 96www.skanska.com/id
Skanska Financial ServicesSE-169 83 SolnaSwedenStreet address: Råsundavägen 2Tel: +46 8 504 350 00 Fax: +46 8 753 18 52
Skanska Project SupportSE-169 83 SolnaSwedenStreet address: Råsundavägen 2Tel: +46 8 504 350 00Fax: +46 8 753 48 42www.skanska.com/projectsupport
For other addresses:www.skanska.com
Contents 1 n Business streams and organization
2 n Comments by the President and CEO
4 n Mission, vision, goals and strategy
7 n Financial targets
8 n Construction
16 n Residential Development
23 n Commercial Development
30 n Infrastructure Development
38 n Sustainable development
40 n Environmental management
42 n Social responsibility
43 n Economic progress
44 n Management development
45 n Risk management
48 n Share data
50 n Report of the Directors
58 n Consolidated income statement
59 n Consolidated balance sheet
60 n Consolidated statement of recognized
income and expenses
61 n Consolidated cash flow statement
62 n Parent Company income statement
63 n Parent Company cash flow statement
64 n Parent Company balance sheet
64 n Parent Company changes in equity
65 n Notes including accounting and
valuation principles
130 n Proposed allocation of earnings
131 n Auditors’ Report
132 n Corporate governance report
134 n Board of Directors
135 n Senior Executive Team
136 n Annual Shareholders´ Meeting
136 n More information about Skanska
137 n Abbreviations and definitions
Cover:The Cooper River Bridge in South Carolina is the longest cable-stay bridge in North America.
This document is in all respects a translation of the Swedish original Annual Report. In the event of any differences between this translation and the Swedish original, the latter shall prevail.
��������������������������������
�������������������������������������
���� ���� ����
���������������������������������������
��
��
�
�
�
�
�
��
������������������������
���� ������
�������������������������������
������������������������������������
���� ���� ����
������������������������
���� �����
��
���
����������������������
�������������������������������������
��
��
�
�
�
�
�
��
• Revenue in 2005 amounted to SEK 124.7 billion.
• Skanska Group operating income totaled SEK 5.0 billion, and after-tax profit was SEK 3.9 billion. Earnings per share amounted to SEK 9.27. The Board of Directors is proposing a regular dividend of SEK 4.50 and an extra dividend of SEK 2.00 per share for 2005.
• Operating margins rose in most Construction business units. This improvement was a result of greater focus on quality in project implementation and a stricter risk management and selection process. Sweden, Norway, the United Kingdom and Latin Ameri-can have already achieved their “Outperform” targets for 2007.
• Skanska sold a number of properties in Warsaw, Budapest, Stockholm, Copenhagen and elsewhere. Divestment volume totaled SEK 4.4 billion, with capital gains of SEK 1.6 billion. Sale prices exceeded estimated market values by an average of 11 percent.
• Year-end market appraisals indicate unrealized development gains of SEK 1.9 billion in Commercial Development and SEK 2.7 billion in Infrastructure Development.
• Skanska will develop, build and manage rental apartments in Sweden for its own account. The Group will respond to heavier demand for reasonably priced rental housing by industrializing its construction process and streamlining purchases. A new company, Skanska Hyresbostäder, will enable the Group to build about 1,000 rental apartments per year.
• Skanska’s successful development of housing units for sale in Sweden, Norway, Finland and the Czech Republic is now also expanding to Denmark. The main focus will be on the Copen-hagen and Århus regions, where the demand and population base are the largest.
HIGHLIGHTS
SEK M EUR M
Revenue 124,667 13,434
Operating income 5,000 539
Income after financial items 5,120 552
Earnings per share, SEK/EUR 9.27 1.00
Return on equity, % 22.4 22.4
Return on capital employed, % 23.3 23.3
Order bookings1 116,553 12,559
Order backlog1 128,572 13,692
1 Refers to Construction operations.
Skanska 2005

Skanska Annual Report 2005 1
Construction refers to build-ing construction (both non-residential and residential) and civil construction. It is Skanska’s largest business stream in terms of revenue and employees. The Construction business stream operates through ten business units in selected home markets – Sweden, Norway, Denmark, Finland (and Estonia), the Czech Republic (and Slovakia), the United Kingdom, the United States and Latin America.
The Residential Development business stream (formerly Residential Project Develop-ment) develops residential projects for sale. Housing units are tailored for selected customer categories. Skanska is one of the lead-ing residential developers in the Nordic countries and also has a sizable presence in the Czech Republic and in St. Petersburg, Russia. The business stream oper-ates through a special Nordic business unit and as part of Construction in the Czech Republic.
Commercial Development (formerly Commercial Project Development) initiates, develops, leases and divests commercial property projects, with a focus on office buildings, shopping malls and logistics properties. The business stream works through two business units: Skanska Commercial Develop-ment Nordic – Stockholm, Gothenburg, Öresund (Malmö and Copenhagen) and Skanska Commercial Develop-ment Europe – Warsaw, Wroclaw, Prague and Budapest.
In Infrastructure Development (formerly BOT), Skanska develops and invests in privately financed infrastruc-ture projects such as roads, hospitals, schools and power generating plants. The business stream focus-es on creating new potential for projects in markets where Skanska has construction busi-ness units. It works through the Skanska Infrastructure Development business unit.
Business streams and organization
United States
Latin America
USA
Argentina
Brasilien
Venezuela
Chile
Bolivia
Peru
Ecuador
Mexico
Norway
United Kingdom
Denmark
Sweden
Poland
Czech Republic Slovakia
Hungary
Estonia
Finland
REVENUE BY GEOGRAPHIC AREA
%
Sweden 20
Other Nordic countries 21
Other European countries 23
United States 32
Other markets 4
Business streams and organizat ion
Bu
sin
ess
stre
ams
and
org
aniz
atio
n
Skanska Sweden
Construction
Skanska Norway
Skanska Denmark
Skanska Finland
Skanska Poland
Skanska Czech Republic
Skanska UK
Residential Development
Senior Executive TeamSkanska F inancial Services
Skanska Project SupportGroup staff units
Skanska CommercialDevelopment Nordic
Skanska ResidentialDevelopment Nordic
Commercial Development
Skanska Commercial Development Europe
Infrastructure Development
Skanska USA Building
Skanska USA Civil
Skanska Latin America
Skanska InfrastructureDevelopment
��������������
�������������� �������
������������������� ���
��������������������� ������
������������������� ���
�����������������
�������������� �����
������������������� ��
��������������������� ���
������������������� ���
����������������������
�������������� �����
������������������� ��
��������������������� �����
������������������� ���
�����������������������
�������������� ��
������������������� ��
��������������������� ��
������������������� ��
������������
��������������� �������
��������������� ���
������������������������ �����
��������������� ���
�����������������������
��������������� �����
��������������� ��
������������������������ ���
��������������� ���
����������������������
��������������� �����
��������������� ��
������������������������ �����
��������������� ���
��������������������������
���������������� ��
���������������� ��
������������������������ ��
��������������� ��
������������������������

2 Skanska Annual Report 2005
Comments by the President and CEO
In 2005 we began to realize the potential envisioned in the “Outperform” strategy. Some, but not all, business units achieved improvement in margins and returns in line with the year 2007 targets. The earnings potential when all of Skanska “Outperforms” is exciting.
The benefit of organizing operations in four distinct business streams – Construction, Residential Development, Commercial Development and Infrastructure Development – is evident. Not only is focus clearly sharper, but we are also able to vary specific strategic levers among the business streams. For example, we con-tinue to focus on reducing risk and increasing margins rather than growth in Construction while pursuing growth in the Residential and Infrastructure Development business streams. But in every business the primary objective is to deliver higher profitability, measured by margin and/or return on capital employed. And in all businesses we target the Skanska 4 zeros (zero loss-making projects, zero work place accidents, zero environmental incidents and zero ethical breaches) aimed at further strengthening our brand among employees, customers and the public. Skanska’s Outperform strategy also applies to sustainable development. Through a balance of economic progress, social responsibility and environmental considerations, we are building a robust foundation for continued prosperity. This is a sound approach not only for Skanska as a company, but also for the communities where Skanska is active.
ConstructionIn Construction the greatest opportunity is still in higher mar-gins, eliminating loss-making projects and maintaining a strong cash flow, more than revenue growth. There are certain home markets where the combination of consistent performance and market conditions make us ready and able to grow. Stable to good conditions in most home markets provide ample opportunity to increase profitability, and increasingly we are finding opportuni-ties for higher margins where customers value our skill and finan-cial strength. Managing contract risk and having the right person-nel for the projects are the reasons we will achieve our targets in construction.
Residential DevelopmentThe Residential Development business stream showed marked improvement in 2005. We achieved the margin target for 2007 and exceeded the target for return on capital employed. Robust market conditions clearly helped. But emphasis on customer needs and sticking to our strict financial standards for investment despite the hot market will enable us to prosper, even when the inevitable downturn occurs.
At the end of 2005 we established our presence in the Danish residential development business, where we will focus on the market in Copenhagen.
In the next few years we will strengthen our land bank through a combination of options and staged payments in order to position Skanska for future growth. On the operations side we are further developing industrialization and standardization of construction to reduce cost and speed up delivery.
In 2006 we will begin an initiative to invest in the develop-ment of rental apartments in Sweden. There is a significant long-term demand for affordable rental units, which can only be met by reducing cost through industrialization and bulk purchasing.
Commercial DevelopmentCommercial Development enjoyed another good year with strong earnings driven by the gain on sale of development properties in line with the strategy for this business stream. We reached a rolling 17 percent return on capital employed over the defined nine-year business cycle, a result that leads the industry in our home markets.
In 2006 we will seek to increase investment in new com-mercial developments of office, retail and logistics centers. Our management team in this business is second to none as evidenced by the track record over the past 10 years. In today’s environ-ment, creating innovative solutions for tenants is more the norm than just developing new buildings. We are confident that capital
Comments by the Pres ident and CEO
Co
mm
ents
by
the
Pres
iden
t an
d C
EO

Skanska Annual Report 2005 3
employed in this business stream will continue to generate above market returns in the years to come.
Infrastructure DevelopmentThe Infrastructure Development business stream is growing. The number of projects is increasing, investor interest is high and Skanska is well positioned to participate as a developer, investor and constructor. The value of our infrastructure assets shows significant appreciation at this early stage. Valuation in this industry is based on a discount rate applied to a very long and quite secure cash flow resulting in a net present value of that cash flow. Increased construction margins earned in arms-length transactions with the Infrastructure Development special purpose companies are compensating us well for the risk undertaken and the management skill employed. As we ramp up the Infrastructure Development business, increased tendering and project start-up costs will result in operating losses. However, the value growth of the project portfolio will outweigh by far the reported results. Over time, as the portfolio matures, earnings will be increasingly positive.
InitiativesSkanska continues to take initiatives to enhance our three primary assets: our brand, our financial strength and our people. In 2005 we developed a concept for industrialization and standardization of apartment houses. Based on lessons learned in this sector we will transfer the knowledge to other types of construction. The idea is to move construction off-site and into factories and to standardize processes and components resulting in faster completion, better quality and lower cost.
We have also taken further steps in the global procurement initia-tive. We are sourcing new lower cost markets and consolidating procurement rather than buying on the traditional project-by-project basis. The opportunity and the challenges are significant.
Skanska peopleAll of our business streams are project-based. Each project is a discreet business unto itself. We have streamlined operations and introduced and implemented controls, but the single most impor-tant difference between success and failure is our people. Strategy is important, but execution is more important – and execution depends on thousands of managers spread across Europe and the Americas. This is why the number one priority is to have the right people for the job. In 2005 we strengthened our management development; in 2006 we will redouble the effort.
Without doubt the Outperform strategy is right for Skanska and it is succeeding because of the hard work of my 54,000 col-leagues. Thank you all for your enthusiastic commitment to our great company.
Solna, March 2006
STUART E. GRAHAMPresident and CEO
Comments by the Pres ident and CEO
Without doubt the Outperform strategy is right for Skanska
Co
mm
ents
by
the
Pres
iden
t an
d C
EO

4 Skanska Annual Report 2005
Strategy for profitability
MissionSkanska’s mission is to develop, build and maintain the physical environment for living, traveling and working.
VisionSkanska shall be a leader in its home markets – the custom-er’s first choice – in construction and project development.
GoalsSkanska’s overall goal is to generate customer and share-holder value. Projects are the core of Group operations and value is generated in well-implemented and profitable projects.
Skanska will strive to be a leader, in terms of size and prof-itability, in the home markets of its construction business units, focusing on outperform margins and cash flow.
Skanska shall be the leading project developer in local markets and in selected product areas such as residential, office, retail and selected types of infrastructure develop-ment projects.
The Group’s financial targets are described on page 7.
SKANSKA’S STRATEGY FOR ACHIEVING ITS OPERATIVE AND FINANCIAL TARGETS IS TO:
• focus on the core business carried out in four business streams – Construction, Residential Development, Com-mercial Development and Infrastructure Development
• be an international company with local businesses that have leading positions in selected home markets
• take advantage of the collective resources and strengths of the Group – brand, employee expertise and financial strength
• foresee and manage risks in its business with the help of well-functioning risk management systems
• be an industry leader in sustainability, particularly in safety, ethics and the environment
• take advantage of the existing potential to coordinate the Group’s purchasing as well as the efficiency gains that can be achieved through greater industrialization
Construction and project development – complex businessesUnlike industrial production at fixed plants, in construction most projects are unique. In principle, each project is implemented in a new location, in a new environment and with a unique design. Many projects are carried out for new customers. Market condi-tions also vary between both countries and regions. As a rule, construction projects are large. It is not unusual for them to be the customer’s largest single investment. Another distinguising feature of the operations is the large number of local players involved in each project – public agencies, architects and engineers, financiers, consultants, suppliers and subcontractors. This is why Skanska consists of local units in a global network.
Miss ion, v is ion, goals and strategy
Mis
sio
n, v
isio
n, g
oal
s an
d s
trat
egy
The E39 European highway project south of Trondheim, Norway is an example of the growing international market for public-private partnerships. Skanska is respon-sible for developing, designing, building and operating large infrastructure facilities like this. Skanska also participates as an investor in this type of project.

Skanska Annual Report 2005 5
Mis
sio
n, v
isio
n, g
oal
s an
d s
trat
egySkanska’s core businesses
Skanska operates in four business streams.• Construction handles construction of non-residential and
residential buildings as well as civil construction projects. It is Skanska’s largest business stream, performing construction assignments for external customers as well as Skanska’s other business streams and operating in selected home markets: Sweden, Norway, Denmark, Finland (and Estonia), Poland, the Czech Republic (and Slovakia), the United Kingdom, the United States and Latin America.
• Residential Development develops residential projects for sale. It tailors homes to fit selected customer categories and focuses on selected markets where Skanska has a permanent presence: Sweden, Norway, Denmark, Finland (and Estonia) and the Czech Republic as well as St. Petersburg, Russia. Skanska is one of the leading residential developers in the Nordic countries. Operations focus primarily on small and medium-sized resi-dential units in attractive locations. Since 2005, Nordic opera-tions have been gathered in a new business unit, Residential Development Nordic. In the Czech Republic, the local business units carry out residential development.
• Commercial Development initiates, develops, leases and divests commercial real estate projects, with a focus on office space, shopping malls and logistics properties in Stockholm, Gothenburg, Öresund (Malmö and Copenhagen), Warsaw, Wroclaw, Prague and Budapest. These selected markets are expected to offer a continuous flow of tenants and investors, the latter as buyers of completed projects.
• Infrastructure Development develops, invests in, operates and divests privately financed infrastructure projects, for example roads, hospitals, schools and power generation plants. The oper-ations of this business stream focus on selected home markets.
Collaboration creates leverageThe units of the Skanska Group collaborate in their specialized roles – as project developers, investors and builders. In this way, the Group’s strategy can be maximized, both in terms of customer focus and the Group’s capital, employee resources and synergies. By being active in several roles in the development process, Skanska can minimize risks and improve both quality and financial results. This collaboration leverages both earning potential and the ability of the Group to satisfy the needs of its customers. Investment operations – development of commercial, resi-dential and privately financed infrastructure projects – take place in most of the geographic markets where Skanska is engaged in construction work.
In these projects, Skanska assumes a comprehensive respon-sibility, from concept and design to land purchase, construction and finally divestment of the project. Skanska’s local construc-tion companies are hired to build the projects. Construction and investment operations must each yield a good economic return.
Size provides competitive advantagesBeing a market leader positions Skanska well with the most demanding customers. Its position also provides access to the best suppliers, which can live up to Skanska’s promises to customers regarding project dates and quality as well as safety and ethics. Skanska’s size gives it an advantage in the most complex assign-ments, where it uses its collective experience and know-how to meet the demands of customers. Only a few companies can com-pete for the type of project where, aside from price, comprehensive solutions and life-cycle costs are of crucial importance.
Both a local and a global playerThe Group’s operations are based on local business units, which have good knowledge of their respective markets, customers and suppliers. These local units are backed by Skanska’s brand, finan-cial strength and Groupwide experience. Skanska is thereby both a local construction company with global strength and an interna-tional builder with strong local roots. The organization works both in a decentralized and integrated way.
Miss ion, v is ion, goals and strategy
Privately financed but toll-free. Skanska is paid by Norway’s Public Roads Administration to operate and maintain the E39 highway in a public-private partnership. The construction project was completed ahead of the original schedule, with no work site accidents at all.

6 Skanska Annual Report 2005
Mis
sio
n, v
isio
n, g
oal
s an
d s
trat
egy
Skanska’s strengthsThe Group’s collective resources and strengths are:• The Skanska brand, built up in more than a century of work-
ing in many different countries. One important element of the brand is the Group’s Code of Conduct, which includes policies on employee relations, health and safety, the environment and business ethics.
• Skanska’s highly skilled, dedicated employees, who combine expertise with the Group’s overall focus on sustainable develop-ment in order to successfully deliver projects to customers. The Group’s ability to transfer knowledge between different geo-graphic markets also contributes to its strength.
• Financial strength, an important factor in maintaining the confidence of customers and capital markets in Skanska. It also enables the Group to invest in project development and assume responsibility for and invest in major privately financed infra-structure projects.
Leadership development vitalA good reputation is an important factor in attracting the best employees. To achieve its strategic goals, Skanska must ensure its supply of future managers. Identifying and developing the lead-ers of tomorrow is a core issue for both local units and the Group. This is why Skanska continuously measures and assesses employ-ees with leadership potential. A substantial proportion of execu-tive time and resources is devoted to employee development. (See “Management development” on page 44.)
Risk management systemConstruction work involves various risks of a technical, legal, financial or personnel-related nature. The ability to manage these risks is crucial to the Group’s success and an important prerequi-site for achieving its strategic goals. Unforeseen risks may have a substantial adverse impact on profits. This is why the Group’s risk management system, which is continuously being refined, is of key importance. (See “Risk management” on page 46.)
Laying the groundwork for profitabilitySkanska’s earnings are achieved through well-implemented, profit-able projects. The right market, the right projects and the right project teams are fundamental to success. The groundwork is laid by the Group’s strategic planning, which identifies selected mar-kets. Skanska continuously builds up knowledge of its customers through a permanent presence in these markets. It ensures a high-ly skilled project organization by means of local and Groupwide talent management programs.
Profitability, safety, ethics and the environmentSkanska must act in ways that are sustainable and responsible in the long term and meet the demands of shareholders, customer and employees, as well as society at large. All Skanska projects must be profitable, as well as being implemented without envi-ronmental incidents, work site accidents or ethical breaches. The market- and customer-specific expertise of local units, combined with Skanska’s corporate business and control systems, the Group’s Code of Conduct and Groupwide risk management procedures, provide support for achieving the highest level of performance.
Miss ion, v is ion, goals and strategy
1887AB Skånska Cement-gjuteriet established
1897First order from outside Sweden
1930—50More residential and industrial construction
1965Skanska gains stock exchange listing
1971First assignment in the United States
1998-2001Expansion – new home markets
2002Four business streams
Opened in time for the 2005 Christmas rush, Prague’s most modern (and the Czech Republic’s largest) shopping mall, Chodov Center, is 55,000 sq. m (592,000 sq. ft.) in size and accommodates 210 stores as well as restaurants and 2,600 parking spaces. Skanska built the mall on behalf of Rodamco Europe.

Skanska Annual Report 2005 7
Ambitious financial and qualitative targets
Skanska’s financial targets for the period through 2007 are based on an ambition that exceeds the industry norm for what can be re-garded as good performance in the Group’s respective geographic markets and specific segments. In each market, Skanska has estab-lished “Outperform” targets. These targets provide the basis for incentive systems at various levels of the organization.
Operating marginOperating margin is an important yardstick of performance. The optimal margin may vary, depending on the market and what type of business is being carried out. For the Construction business stream, the target is to achieve an overall average operating mar-gin of 3.3 percent, given the allocation of business the Group had at the end of 2004, when the target was set. This target is based on a 4.0 percent average operating margin in contracting opera-tions excluding construction management assignments, and a 1.2 percent operating margin in construction management. During 2005, the operating margin amounted to 2.5 percent, compared to a target of 3.1 percent for the year. However, several business units achieved their individual targets.
In the Residential Development business stream, the target is to achieve an operating margin of 10.0 percent, which was also fulfilled during 2005. The target for the year was to reach an oper-ating margin of 9.4 percent.
Return In the Residential Development business stream, the target is to achieve an adjusted return on capital employed of 18.0 percent. During 2005, return on capital employed amounted to 23.8 percent.
In Commercial Development, the target is to achieve an adjusted return on capital employed of 15.0 percent over a business cycle for the industry. This return is based on operating net, unrealized development gains and changes in market value. During 2005, return calculated in this way amounted to 16.7 percent, and over a nine-year business cycle it was 16.8 percent.
In the Infrastructure Development business stream, the target is to achieve a return on capital employed of 16.0 percent, including unrealized development gains and changes in market value but excluding exchange rate effects. During 2005, return
Financial ”Outperform” targets, 2007 Construction excluding Construction construction Construction Residential Commercial Infrastructure combined management management Development Development2 Development3 Group
Operating margin, %, 3.31 4.0 1.2 10.0 – – –
Return on capital employed, % – – – 18.0 15.0 16.0 –
Return on equity, % – – – – – – 18.0
1 Given the distribution of operations that the Group had during 20042 Including unrealized development profits and change in market value3 Including unrealized development gains and changes in market value but excluding exchange rate effects
calculated in this way amounted to 36.0 percent. For the Skanska Group as a whole, the target is to achieve a return on equity of 18.0 percent. During 2005, return on equity amounted to 22.4 percent.
Qualitative targetsIn addition to these financial targets, Skanska has also adopted qualitative targets. These targets are based on a vision of opera-tions taking place with:• zero loss-making projects• zero environmental incidents• zero work site accidents• zero ethical breaches.
Some of these targets are based on specific levels to be achieved in a given year, while others have absolutely zero tolerance. This applies, for example, to the “zero ethical breaches” target. In addi-tion to these zero visions, there are also management development targets.
Capital structureThe equity requirement varies between Skanska’s business streams. In the Construction business stream, the requirement is related to business volume and to the risks inherent in the various types of construction assignments carried out. The model also takes business goodwill into account. In Residential Development, the estimated equity requirement amounts to 50 percent of capital employed. In Commercial Development, the equity requirement is based on the distribution between completed properties, ongoing projects, undeveloped land and development properties. For Infrastructure Development, Skanska allocates equity equivalent to capital employed for projects under construction and 25 percent of capital employed for projects in full operation. It is the Board’s judgment that during 2006, equity needs to total about SEK 16 billion. This judgment is based on the operations that Skanska carries out but also takes into account the investments it is expected to make during 2006. This applies, for example, to land for residential development and new projects in Commercial Development and Infrastructure Development.
Fin
anci
al t
arg
ets
Financial targets

8 Skanska Annual Report 2005
Order backlog, SEK 129 bn
Construction is Skanska’s largest business stream in terms of revenue and number of employees. In addition to projects for external customers, its business units perform contracting assignments for Skanska’s other business streams.
������������
����������������
�������������������������
������������
�����������
��������������������
��������������������
������������
���������������������������������������
������������
����������
��������������������������������������������������
������������
������������������
������������������
��������
��������������������
����������������
��������������
��������������������������
��������������������
��������������������
������������
����������
���������������
�������������������
���������������������
��������������������������
���������������
���������
���������������������������������������������������������
��������
�������������������������
��������������������������
���������������
������������������
�����������
���������������������������
�����������������������������
������������������
�����������������
��������������������������
����������������������
���������������
�����������
SEK M 2005 2004
Revenue 115,955 107,977
Operating income 2,871 1,512
Operating margin, % 2.5 1.4
Capital employed 4,410 3,697
Return on capital employed, % 56.1 25.6
Operating cash flow 3,162 3,952
Order bookings 116,553 116,008
Order backlog 128,572 113,498
Employees 52,533 51,583
ConstructionSkanska undertakes complex, demanding assignments
12,000 ongoing projects
Order backlog totals SEK 129 bn Co
nst
ruct
ion
Construct ion
Non-residential building and civil construction, as well as residen-tial construction, are the core of Skanska’s Construction business stream, which also includes construction-related and maintenance services. Non-residential building construction accounts for 55 percent, civil construction 38 percent, residential construction 4 percent and service 3 percent of order backlog for the business stream. In its selected markets (see page 10-13), the Group is among the leaders in terms of size and profitability. Skanska also endeav-ors to be the industry leader in ethics, safety and environment. By virtue of its size and leading position, Skanska can undertake the largest, most complex assignments for the most demanding customers. Working together with development business streamsTo a large extent, Skanska’s construction units work together with the Group’s development business streams, which generate con-struction assignments for residential projects, commercial space, and privately financed infrastructure. Some project opportunities are also created by taking advan-tage of the Group’s financial expertise. Skanska Financial Services can help arrange financing solutions as a value added service. Customers that operate in more than one market, such as the
pharmaceutical company Pfizer and the oil and gas company Hydro, can be offered the same service in all of the Group’s home markets via the Skanska network. Skanska’s Construction business stream also carries out assignments of a service nature: construc-tion-related services, repairs and the like as well as operation and maintenance of industrial and transportation facilities.
Margins vary with the product mixThe construction business is largely about risk management. Practically every project is unique. Size, shape, environment –everything varies for each new assignment. Construction differs in this way from typical manufacturing industry that has perma-nent facilities (see also “Risk management,” page 46). Non-resi-dential and residential building construction is generally charac-terized by high capital turnover, limited capital employed and low margins. Civil construction usually goes on for a longer period, has a higher risk profile and is more capital-intensive, which requires a somewhat higher margin. Infrastructure Development projects often have a higher margin, since Skanska controls the entire process including operation and maintenance and must receive compensation for the risks this entails. Local business units have different product mixes. This is one of the main reasons why margins vary between different

Skanska Annual Report 2005 9Construct ion
Co
nst
ruct
ion
business units. Some specialize in specific market sectors, while others operate in a broader spectrum. The earnings at Skanska’s construction units must be evaluated in light of the changing con-ditions that apply to the operations of each respective unit. Aside from products, these units may work with varying contractual mechanisms, regulations, customer demands or responsibility commitments, for example varying design input.
Specialization within home markets Construction operations in Sweden, Norway, Denmark, Finland, Poland, the Czech Republic and the United Kingdom comprise both building and civil construction. In the U.S. market, Skanska has two separate, specialized business units. USA Building con-structs facilities throughout the United States for the pharmaceu-tical, biotechnology, high technology and educational sectors as well as for public organizations and agencies. USA Civil builds transportation infrastructure and facilities for energy and water supply as well as wastewater treatment in the most heavily popu-lated regions of the eastern United States as well as in Colorado and California. In Latin America, Skanska primarily builds energy-related infrastructure and performs construction and related services in the oil & gas sector. Its operations focus on the markets in Argentina, Brazil, Chile, Mexico and Peru. In several Skanska home markets, the Group’s construction units deliver construction services to Commercial Development business units. This is true in Sweden, Denmark, Poland and the Czech Republic. In Sweden, Norway, Denmark, Finland and the Czech Republic, these units also provide construction services to
the Residential Development business stream. In Norway, Finland, the United Kingdom, Poland and Latin America, the Group’s construction units work together with Skanska Infrastructure Development, which invests in public-private partnership projects.
The top Nordic contractors – Total sales, 2004 Company Country SEK bn EUR bn
Skanska Sweden 121.3 13.3
NCC Sweden 46.5 5.1
YIT Finland 25.4 2.8
PEAB Sweden 22.0 2.4
Veidekke Norway 14.0 1.5
Lemminkäinen Finland 14.0 1.5
MT Højgaard Denmark 9.0 1.0Sources: Annual reports of each respective company.
The top global contractors1 – Total sales,2 2004 Company Country SEK bn EUR bn
Bouygues France 190.8 20.9
VINCI France 178.2 19.5
Bechtel United States 127.9 14.0
Skanska Sweden 121.3 13.3
Hochtief Germany 109.0 11.9
Grupo ACS Spain 100.1 11.0
Centex, Dallas United States 76.2 8.3
Royal BAM Group The Netherlands 57.9 6.3
1 Excluding Asian construction companies 2 Including non-construction-related operations Sources: Reuters Company Views, annual reports of each respective company.
About half of Skanska’s Czech construction operations consist of large infrastructure projects for public sector customers. These projects often receive grants from European Union infrastructure funds. Skanska Czech Republic has highly specialized units, for example to build railroads like this one in Prague.

10 Skanska Annual Report 2005Construct ion
whole for the second straight year, is expected to cool during 2006. This downturn may be offset by an upswing in commercial con-struction for both private and public sector customers. The good civil construction market is projected to remain strong in 2006. In the oil and gas sector, Skanska has ongoing assignments worth more than SEK 2 billion. Skanska is Norway’s largest construction company, with Veidekke and NCC as major competitors.
DENMARKSEK M 2005 2004
Revenue 4,385 3,636
Operating income 50 53
Operating margin, % 1.1 1.5
Order bookings 3,902 3,518
Order backlog 2,172 2,157
The Danish construction market grew rapidly during 2005 and is expected to perform favorably in 2006 as well. The housing market is strong, especially in areas around major cities, and in 2006 this market is expected to show continued good growth. The same is true of the markets for retail and logistics facilities. In Denmark, Skanska competes with the larger construction companies MT Højgaard and NCC, among others.
MARKETSSWEDENSEK M 2005 2004
Revenue 22,141 20,519
Operating income 887 579
Operating margin, % 4.0 2.8
Order bookings 22,087 23,039
Order backlog 16,004 15,485
The Swedish construction market is projected to maintain a good level and will probably grow slightly in 2006. Housing, the largest single market segment, is expected to remain strong, with contin-ued high activity despite somewhat higher interest rates. Demand for commercial space remains weak, and industrial construction is projected to stay at the 2005 level. The civil construction market is strong and is also expected to increase somewhat. Among major contracts awarded to Skanska in 2005 were expansion of the Forum Nacka shopping mall, worth about SEK 1 billion; construction of the Södertörn District Court and renovation of the former Stockholm Tax Authority skyscraper into student housing, each worth about SEK 400 M. Skanska is Sweden’s largest construction company and com-petes at the national level with NCC and Peab, among others.
NORWAY SEK M 2005 2004
Revenue 10,502 8,640
Operating income 422 215
Operating margin, % 4.0 2.5
Order bookings 11,353 10,195
Order backlog 8,631 7,371
During 2006 the Norwegian construction market is projected to remain at the stable high level that characterized 2005. Housing construction, which reached nearly 30,000 units in Norway as a
�������
����������������������
�����
�������
�������
�����
��������
��������������
������������
���������
������������
�������������
Co
nst
ruct
ion
In September 2005, Skanska-Vinci began testing a tunnel boring machine (TBM) custom-built for the varied, complex conditions inside southern Sweden’s Halland Ridge, where the consortium is building two rail tunnels. The TBM has different operating modes for hard and fractured rock and for coping with high water pressure. As it moves forward, it erects concrete lining elements behind it to form a permanent water-tight bore. Certain geologically complex sections will be frozen in preparation for the TBM.
The pie charts provide a breakdown of order backlog: • Building construction • Civil construction • Service
�������
����������������������
�����
�������
�������
�����
��������
��������������
������������
���������
������������
�������������
�������
����������������������
�����
�������
�������
�����
��������
��������������
������������
���������
������������
�������������

Skanska Annual Report 2005 11Construct ion
FINLAND AND ESTONIASEK M 2005 2004
Revenue 8,366 7,623
Operating income 222 263
Operating margin, % 2.7 3.5
Order bookings 9,082 7,316
Order backlog 5,879 4,854
The Finnish construction market is strong. All sectors have per-formed well, and activity is expected to remain high in both com-mercial and residential construction. This applies both to Finland and Estonia, where low interest rates combined with population trends have resulted in heavy demand for housing and retail facili-ties. In the housing sector, however, some leveling off is expected during 2006. The civil construction market was vigorous and is projected to remain stable in Finland. In Estonia, strong growth in this seg-ment is expected to continue. During 2005, Skanska Finland landed its largest-ever contract, worth SEK 1.5 billion, for the Muurla-Lohja portion of the E18 European highway between Turku and Helsinki. In Finland, Skanska competes with the country’s two larg-est construction companies, YIT and Lemminkäinen. In Estonia, where Skanska is the second largest construction company, its com-petitors are Merko and YIT.
POLANDSEK M 2005 2004
Revenue 5,082 3,970
Operating income 146 101
Operating margin, % 2.9 2.5
Order bookings 7,625 4,559
Order backlog 7,143 3,844
During 2005 the Polish economy improved somewhat. Interest rates fell and inflation remained low. The Polish zloty was largely stable against the euro. The construction market recovery that
began in 2004 after Poland joined the EU continued and offered good opportunities to build up more order backlog, despite a continued strongly price-focused competitive situation. The civil construction market remains good but is characterized by low margins and stiff competition. A shortage of qualified labor as well as subcontractors is noticeable nationwide. During the year Skanska Poland, in partnership with Skanska Infrastructure Development, began constructing the A1 highway south of Gdansk. The 90 km (56 mi.) public-private partnership project is one of Skanska’s largest-ever assignments in Poland. The largest construction companies in Poland aside from Skanska are Budimex (with Ferrovial as the main owner) and Hochtief.
CZECH REPUBLIC AND SLOVAKIASEK M 2005 2004
Revenue 10,303 7,906
Operating income 466 368
Operating margin, % 4.5 4.7
Order bookings 8,567 12,910
Order backlog 12,493 13,047
Both the Czech and Slovakian construction markets continued to grow in all sectors during 2005. In Slovakia, growth was extremely good. During 2006, the markets in both countries are expected to show continued growth, especially in the civil and residential sectors. Skanska was awarded a number of major contracts in 2005, among them a railroad project worth SEK 700 M and a residential project worth SEK 620 M. Skanska is the Czech Republic’s largest construction com-pany. Major competitors in the Czech Republic are Metrostav and SSZ (subsidiary of VINCI) and in Slovakia Doprastav and Zipp (subsidiary of Strabag).
Co
nst
ruct
ion
The pie charts provide a breakdown of order backlog: • Building construction • Civil construction • Service
Poland has major infrastructure needs. The 600 m (1,968 ft.) long Milówka Bridge is part of an expressway in southern Poland. Skanska is the only construction company in Poland with access to the rolling scaffolding shown here, used in formwork of permanent bridge structures. Skanska is also responsible for building 90 km (56 mi.) of the A1 highway in northern Poland as part of a public-private partnership.
�������
����������������������
�����
�������
�������
�����
��������
��������������
������������
���������
������������
�������������
�������
����������������������
�����
�������
�������
�����
��������
��������������
������������
���������
������������
�������������
�������
����������������������
�����
�������
�������
�����
��������
��������������
������������
���������
������������
�������������

12 Skanska Annual Report 2005Construct ion
Co
nst
ruct
ion
The pie charts provide a breakdown of order backlog: • Building construction • Civil construction • Service
In recent years, Skanska has completed some 200 construction projects in the U.S. higher education sector. At Duke University in Durham, North Carolina, it has built a series of new research and teaching facilities since 2002.
central Boston, Massachusetts including both a hotel and high-end housing. At the national level, USA Building competes mainly with companies like Turner (a subsidiary of Germany’s Hochtief) and Bovis Lend Lease, as well as with numerous local players in their geographic markets.
USA CIVILSEK M 2005 2004
Revenue 9,415 12,406
Operating income –99 218
Operating margin, % –1.1 1.8
Order bookings 13,179 8,242
Order backlog 18,381 12,116
Despite relatively weak market growth, in 2005 Skanska was awarded a number of major projects, including several wastewater plants. Two large assignments were related to the reconstruction of Lower Manhattan’s infrastructure following the 2001 terrorist attacks: the new World Trade Center Transportation Hub and the underground Dey Street Concourse pedestrian link. These proj-ects are worth about SEK 2.7 billion. During 2005, the U.S. Congress finally approved new federal funding act for transportation infrastructure, known as SAFE-TEA-LU, retroactive to 2004 and running until 2009. It appropria-tions total USD 286.5 billion. Of this amount, USD 106.6 billion has been earmarked for states where Skanska has operations. USD 66 billion is reserved for California, New York, Texas, Florida and Georgia, where Skanska has strong market positions in civil construction. In addition, many states and local governments have initiated alternative financing solutions, often using bond loans. This, together with greater interest in public-private partner-ship solutions, will mean that opportunities will increase in the civil construction markets where Skanska is active. USA Civil competes with a few large national players, among them Kiewit, Fluor, Bechtel and Granite, as well as with numerous players in the respective local geographic markets.
UNITED KINGDOMSEK M 2005 2004
Revenue 10,761 11,024
Operating income 346 52
Operating margin, % 3.2 0.5
Order bookings 13,815 10,850
Order backlog 17,412 13,318
The segments in which Skanska operates showed no real growth in 2005. Nevertheless, Skanska UK performed favorably during the year and reported strong earnings. During 2005, Skanska was awarded its first contracts in a new, large-scale school renovation and expansion program, a market that is expected to grow sig-nificantly in the next few years. The first contract was for school construction in Bristol worth SEK 1.5 billion. In the hospital sector, Skanska signed contracts to build three hospitals in Nottinghamshire. The assignment is worth about SEK 4 billion. Skanska is very well positioned in the markets for schools, hospitals, utility networks and other public infrastructure. Skanska, which is the market leader in its segments, competes with Balfour Beatty, Bovis, Amec and Carillion, among others.
USA BUILDINGSEK M 2005 2004
Revenue 29,944 27,601
Operating income 239 –413
Operating margin, % 0.8 –1.5
Order bookings 23,158 29,699
Order backlog 36,663 36,577
The prevailing trend toward larger growth in both population and business in the southern parts of the country is providing the company with a stable foundation for the future. USA Building’s main markets − construction for customers in the healthcare, higher education and biotechnology sectors − remains strong, with expected satisfactory annual growth. Major assignments in 2005 included an advanced cancer clinic in North Carolina and a building construction project in
�������
����������������������
�����
�������
�������
�����
��������
��������������
������������
���������
������������
�������������
�������
����������������������
�����
�������
�������
�����
��������
��������������
������������
���������
������������
�������������
�������
����������������������
�����
�������
�������
�����
��������
��������������
������������
���������
������������
�������������

Skanska Annual Report 2005 13Construct ion
operations run by International Projects have been discontinued. Operations are now focusing on completing the ongoing projects according to the established program. By forming Skanska Project Support, Skanska is taking advan-tage of the unique expertise and experience that exists among the unit’s employees to promote Skanska’s operations in its home markets
Discontinued operations In 2005 Skanska completed the process of narrowing its focus by selling or closing down operations that fall outside its core business or home markets. During the year, the Group sold the last of the units in Skanska Sweden identified for divestment. Skanska Prefab Mark was sold during the second quarter and Skanska Modul with the companies Flexator and Temporent were sold during the fourth quarter. Operating income from discontinued operations included capital gains of SEK 184 M related to these divestments
Skanska’s home markets 2004 GDP/ Construction/ ConstructionUSD Capita Capita as % of GDP
Sweden 35,929 2,625 7.3
Norway 58,046 6,151 10.6
Denmark 45,022 5,253 11.7
Finland 35,587 4,329 12.2
Poland 7,397 342 4.6
Czech Republic 11,213 1,608 14.3
United Kingdom 33,140 3,089 9.3
United States 40,935 3,663 8.9
Argentina 15,289 261 1.7
Sources: The Swedish Construction Federation, EcoWin
Co
nst
ruct
ion
The pie charts provide a breakdown of order backlog: • Building construction • Civil construction • Service
In Latin America, Skanska focuses on customers in the oil, gas and energy sectors. One of the largest new construction projects completed during 2005 is a 153 km (95 mi.) long gas pipeline in southern Argentina. Miguel Ortíz is Skanska’s project manager.
LATIN AMERICASEK M 2005 2004
Revenue 3,579 2,785
Operating income 154 118
Operating margin, % 4.3 4.2
Order bookings 3,080 3,924
Order backlog 3,138 2,885
Continued economic growth in the region characterized busi-ness during 2005. Skanska secured several strategically important contracts in Brazil, Argentina and elsewhere in tough competi-tion. Earnings, revenue and order backlog improved for the third straight year. Through a consistent, sustained focus on selected customer and product areas in the energy sector, mainly construction, oper-ation and services related to production and distribution facilities for the oil, gas and power industries, Skanska Latin America has achieved a leading position in these market segments. The outlook for 2006 is expected to remain positive. Aside from local market players, Skanska competes with such major companies as Brazilian-based Odebrecht and Argen-tine-based Technint.
INTERNATIONAL PROJECTS1
SEK M 2005 2004
Revenue 1,477 1,867
Operating income 38 –42
Operating margin, % 2.6 –2.2
Order bookings 705 1,756
Order backlog 656 1,844
1 International includes operations in Russia, International Projects and UK International.
International includes operations in Russia as well as Interna-tional Projects and UK International. As one element of Skanska’s strategic concentration on its home markets, the project export
�������
����������������������
�����
�������
�������
�����
��������
��������������
������������
���������
������������
�������������
�������
����������������������
�����
�������
�������
�����
��������
��������������
������������
���������
������������
�������������

14 Skanska Annual Report 2005
Co
nst
ruct
ion

Skanska Annual Report 2005 15
DESIGN IMPROVEMENTS SHORTENED THE CONSTRUCTION TIME
Construct ion
Co
nst
ruct
ion
The longest cable-stay bridge in North America, the Cooper River Bridge was completed in the spring of 2005. Skanska’s American bridge building team, backed by Swedish internal experts, finished the project one year ahead of schedule. The Cooper River Bridge was designed as a longer, taller and wider version of the Uddevalla Bridge in western Sweden, which Skanska built in 1997–2000.
With its 174-meter (571 ft.) tall towers, or pylons, the bridge has given the neighboring
cities of Charleston and Mount Pleas-ant, South Carolina a new landmark. The bridge’s 464-meter (1,522 ft.) long main span and the approximately 4 km (2.5 mi.) of approaches are an impressive sight. And with eight lanes, it has freed local residents from frequent traffic jams. Skanska was awarded this USD 530 M contract by presenting an alternative design and by utilizing its col-lective expertise in building large bridges. Skanska’s proposal to build a single wide
bridge instead of two narrower ones won the customer’s approval, especially because Skanska could also show its doc-umented experience of the latest major Swedish bridge projects – the High Coast Bridge over the Ångermanälven River, the Öresund Bridge to Denmark and the Uddevalla Bridge. With Skanska’s Ameri-can know-how as the base, this Swedish expertise was integrated into the bridge building team. The bridge’s two diamond-shaped pylons are the most visible evidence of its kinship with the Uddevalla Bridge. In the process of creating the final structure, Skanska took advantage of numerous lessons from its Swedish projects, for example when it came to improving construction efficiency by modifying the design. A number of design improvements helped shorten the construction time while boosting wind stability, which is vital on the hurricane-prone southeast-ern coast of the United States. Swedish expertise was also utilized in the actual construction of the cable-stay bridge. Pylon construction using “climb-ing forms” and phased expansion of the bridge deck including assembly of cables and installation of steel and concrete deck elements were supervised by Swedish employees. At the same time, it is an American
With its 464 m (1,522 ft.) span, the Cooper River Bridge is North America’s longest cable-stay bridge. Its approaches are about 4 km (2.5 mi.) long and the 174 m (571 ft.) tall towers, or pylons, have given neighboring Charleston and Mount Pleasant, South Carolina a new landmark.
bridge in many respects. Nearly all the elements in the approaches are pre-fabricated. The steel structure is bolted together, not welded according to the most common technique in Sweden. From start to finish, construction took 47 months. The bridge was opened one year earlier than originally agreed, despite the fact that on several occa-sions, construction had to be halted completely due to the hurricane danger. Skanska’s contributions were publicly commended by the mayors of Charleston and Mount Pleasant as well as by the customer, the South Carolina Department of Transportation. “It is unusual for a project this large to be completed in time,” was one of the comments. The inauguration, which was broad-cast on live television in June 2005, had a carnival theme and included fireworks and a marathon race across the bridge.
Sweden’s Uddevalla Bridge served as a model for the longer, taller and wider Cooper River Bridge.
16 Skanska Annual Report 2005Resident ial Development
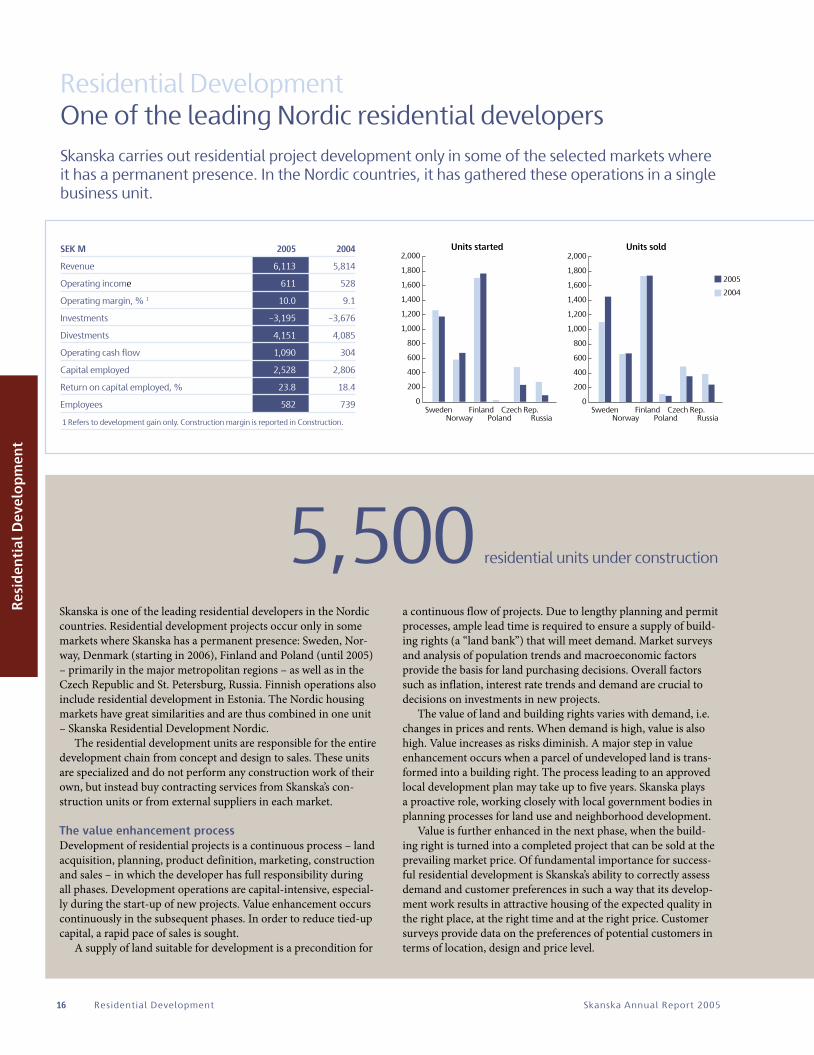
Skanska carries out residential project development only in some of the selected markets where it has a permanent presence. In the Nordic countries, it has gathered these operations in a single business unit.
Residential DevelopmentOne of the leading Nordic residential developers
Skanska is one of the leading residential developers in the Nordic countries. Residential development projects occur only in some markets where Skanska has a permanent presence: Sweden, Nor-way, Denmark (starting in 2006), Finland and Poland (until 2005) – primarily in the major metropolitan regions – as well as in the Czech Republic and St. Petersburg, Russia. Finnish operations also include residential development in Estonia. The Nordic housing markets have great similarities and are thus combined in one unit – Skanska Residential Development Nordic.
The residential development units are responsible for the entire development chain from concept and design to sales. These units are specialized and do not perform any construction work of their own, but instead buy contracting services from Skanska’s con-struction units or from external suppliers in each market.
The value enhancement processDevelopment of residential projects is a continuous process – land acquisition, planning, product definition, marketing, construction and sales – in which the developer has full responsibility during all phases. Development operations are capital-intensive, especial-ly during the start-up of new projects. Value enhancement occurs continuously in the subsequent phases. In order to reduce tied-up capital, a rapid pace of sales is sought.
A supply of land suitable for development is a precondition for
a continuous flow of projects. Due to lengthy planning and permit processes, ample lead time is required to ensure a supply of build-ing rights (a “land bank”) that will meet demand. Market surveys and analysis of population trends and macroeconomic factors provide the basis for land purchasing decisions. Overall factors such as inflation, interest rate trends and demand are crucial to decisions on investments in new projects.
The value of land and building rights varies with demand, i.e. changes in prices and rents. When demand is high, value is also high. Value increases as risks diminish. A major step in value enhancement occurs when a parcel of undeveloped land is trans-formed into a building right. The process leading to an approved local development plan may take up to five years. Skanska plays a proactive role, working closely with local government bodies in planning processes for land use and neighborhood development.
Value is further enhanced in the next phase, when the build-ing right is turned into a completed project that can be sold at the prevailing market price. Of fundamental importance for success-ful residential development is Skanska’s ability to correctly assess demand and customer preferences in such a way that its develop-ment work results in attractive housing of the expected quality in the right place, at the right time and at the right price. Customer surveys provide data on the preferences of potential customers in terms of location, design and price level.
5,500 residential units under construction
SEK M 2005 2004
Revenue 6,113 5,814
Operating income 611 528
Operating margin, % 1 10.0 9.1
Investments –3,195 –3,676
Divestments 4,151 4,085
Operating cash flow 1,090 304
Capital employed 2,528 2,806
Return on capital employed, % 23.8 18.4
Employees 582 739
1 Refers to development gain only. Construction margin is reported in Construction.
����������������
�
���
���
���
���
�����
�����
�����
�����
������
������������������
�
���
���
���
���
�����
�����
�����
�����
�����
�����
������������
�������������
����������������
������������
�������������
����������������
�������������
�
���
���
���
���
�����
�����
�����
�����
������
���������������
�
���
���
���
���
�����
�����
�����
�����
�����
�����
������������
������������������������
������������
��������������
����������������
������
�������������������������
����
����
����
����
Res
iden
tial
Dev
elo
pm
ent

Skanska Annual Report 2005 17
Risk managementThere are risks in all stages of operations. Such external factors as interest rates and the willingness of customers to buy housing units are of crucial importance to all decisions in the process. Housing units are built to be sold individually. To minimize risks, the goal is to completely develop and sell the units in a given project during a single economic cycle, when variations in market conditions are small or predictable. New projects are only started after a certain percentage of units is sold or pre-booked. Sales and pre-bookings are followed up monthly.
Projects are usually divided up in phases. To avoid building up an inventory of unsold units, the sale of units in a new phase begins only when the preceding one is nearly sold out or pre-booked. Increased standardization, with shorter lead times, also boosts efficiency while reducing tied-up capital and exposure to market fluctuations.
Ownership mechanisms vary in different marketsIn Sweden and Finland, sales occur largely in the form of coopera-tive housing associations, ownership titles or housing corporations. When Skanska acquires land, it is reported in the balance sheet. The land is then sold to a customer, for example a cooperative housing association that has been formed by Skanska. Construc-tion does not begin until contracts have been signed for about half the units in a project phase. The customer buys the building right and construction services from Skanska, which then invoices the customer – such as a cooperative housing association or housing corporation – regularly as the phases are completed.
In Norway, Denmark, the Czech Republic and St. Petersburg, development occurs mainly for Skanska’s own account. The resi-dential units are sold individually as ownership units. Here, too, Skanska aims at a certain percentage of pre-booked sales before
making a decision to start construction. In St. Petersburg, most sales traditionally occur only after completion. Unlike other mar-kets, residential units are sold as completed frames, while the cus-tomers themselves are responsible for exterior finish and interior fixtures.
IndustrializationIn residential construction, as in nearly all construction opera-tions, there is great potential for increasing the degree of industri-alization. Each project is still largely unique and builders do not fully take advantage of repetition effects.
Development work is currently underway to create more industrialized and standardized residential construction. The aim is to create a platform that can be used as the basis for most proj-ects. Aesthetic design, adaptation to the environment and specific customer wishes are satisfied through various choices, for example a fixed number of different types of façade elements, windows, parquet floors, wet rooms and kitchen modules.
Standardization and greater industrialization are preconditions for residential construction with lower costs, higher quality and shorter development and construction times.
As part of its sustainability efforts, Skanska can now offer Sweden’s first Swan-labeled residential buildings. The Uniqhus concept for sustainable housing has been granted a Swan-labeling license. Using environmentally friendly materials and methods, combined with low energy consumption, Uniqhus has a low life-cycle cost. Generally speaking, the energy requirements of the residential units developed in-house by Skanska average ten per-cent better than the standards set by the Swedish National Board of Housing, Building and Planning.
Resident ial Development
Res
iden
tial
Dev
elo
pm
ent
The former Torslanda Airport in Gothenburg, Sweden is being transformed into a modern residential area. Homes in Snäckeberget will be bright and airy, with window designs that blur the boundary between outdoors and indoors.

18 Skanska Annual Report 2005
Resident ial Development
Res
iden
tial
Dev
elo
pm
ent
Silverdal is a 21st century garden suburb close to natural scenery as well as to the workplaces and services of Kista, Sollentuna and downtown Stockholm. With its easy access to the E4 highway, commuter trains and Stockholm-Arlanda Airport, Silverdal has become one of the most popular neighborhoods in Greater Stockholm. Future expansion plans include single-family homes and various types of attached homes. Twelve single-family homes in the new Silverdal Ekbacke area go on sale during 2006.
Number of unutilized building rights Local plan Local plan Building Total Market Master plan underway approved permit stage building rights1 Options
Sweden 4 ,700 2,400 2,700 300 10,100 1,100
Norway 500 200 2,400 200 3,300 1,400
Finland incl. Estonia 200 1,200 2,300 600 4,300 5,400
Poland 100 200 100 400
Czech Republic 1,100 700 1,800 600
Russia 700 700
Total 5,500 5,600 8,300 1,200 20,600 8,500
Residential Development, number of units
Under Total units Completed Market Units started construction Pre-sold, % sold, 2005 unsold
Sweden 1,173 1,608 90 1,450 11
Norway 672 714 88 669 13
Finland incl. Estonia 1,764 1,739 71 1,737 70
Poland 86 26
Czech Republic 233 424 48 355 22
Russia 89 1,040 74 239 6
Total 3,931 5,525 78 4,536 148 1 Including building rights in associated companies
BoKlok customer number 2,000 was Johanna Håkansson, now a happy resident of the garden suburb of Silverdal, just north of Stockholm.
2,000 smart customersMore than 2,000 satisfied customers have chosen BoKlok homes since the start. The 2,000th was Johanna Håkansson, who received a gift of SEK 10,000 from Skanska and IKEA.
Early in December 2005, she moved into a 76 sq. m (818 sq. ft.) three-
bedroom apartment in the Stockholm garden suburb of Silverdal with
her family. In Silverdal, Skanska has built 30 apartments in five two-
story buildings. The family won a lottery in competition with about
700 people who signed up for BoKlok apartments. “I’m very pleased
with the apartment. It has a good floor plan and fits our needs per-
fectly. It’s also a short ride to downtown, but still close to nature,”
Ms Håkansson says.

Skanska Annual Report 2005 19
MARKETSSWEDEN SEK M 2005 2004
Revenue 2,394 2,046
Operating income 196 136
Operating margin, % 8.2 6.6
Capital employed –210 539
Return on capital employed, % 108.1 25.4
During 2005, residential construction in Sweden continued to climb from historically very low levels. The supply of new hous-ing units increased mainly in the country’s growth regions. This is projected to continue in 2006 as a number of new areas are established in the market. Underlying strong demand in growth regions, together with increasing disposable household income, are expected to help fuel a continued rise in project starts. However, due to gradual interest rate hikes, somewhat slower price increases are expected in the housing market.
NORWAY SEK M 2005 2004
Revenue 1,343 1,234
Operating income 132 122
Operating margin, % 9.8 9.9
Capital employed 1,227 1,175
Return on capital employed, % 12.0 9.7
Norwegian residential construction in 2005 was again at a his-torically high level. The supply of newly built housing units rose. Prices climbed an average of 9-10 percent. The outlook for contin-ued good economic growth and increasing disposable household income is considered good, which will have a positive impact on the housing market in 2006 as well. Competition for building rights stiffened during 2005, and new local players have entered the market. Some increase in construction costs at the subcontrac-tor level was also noticeable during the year.
Resident ial Development
Res
iden
tial
Dev
elo
pm
ent
In Tullinge Trädgårdsstad, Skanska has re-created a Swedish small town with sturdy wooden houses in pleasant neighborhoods, a short commuting distance from both Södertälje and Stockholm.
DENMARK The demand for newly constructed housing in Copenhagen, Skanska’s most recently established Nordic residential develop-ment venue, was very high in 2005. Prices climbed sharply, which affected pricing in the vicinity as well. The central bank’s much-expected key interest rate hike in December has not yet had any major impact on demand and prices. The volume of project starts is expected to remain steady in 2006, and competition for building rights is expected to intensify.
FINLAND SEK M 2005 2004
Revenue 1,616 1,609
Operating income 195 151
Operating margin, % 12.1 9.4
Capital employed 908 670
Return on capital employed, % 27.5 24.0
The Finnish housing market has been stable for the past decade. One contributing factor is increasing mobility in the housing market caused by migration to major cities. In 2005 there were about 33,000 housing starts in Finland as a whole, and demand remained strong. According to available data, euro zone inter-est rates will stay at relatively low levels. This is expected to help keep housing demand in 2006 at the level of the preceding years. Estonia (Tallinn), which is reported as part of Skanska’s Finnish residential development, is experiencing rapid economic growth, low interest rates and rising prosperity. This is reflected in a very hot housing market, but price increases are expected to level off during 2006, because housing expenditures are absorbing a higher proportion of Estonians’ disposable income.

20 Skanska Annual Report 2005Resident ial Development
Residential Development 2005Further information about Skanska’s housing construction can be found in “Skanska Residential Development 2005,” which can be downloaded from Skanska’s website, www.skanska.com (click on “Investors” and “Reports”). The publication can also be ordered from Skanska AB, Investor Relations.
Res
iden
tial
Dev
elo
pm
ent
Kartanonruova in Vanta, near Finland’s capital of Helsinki, is a garden suburb with distinctive architecture. Skanska’s latest project, shown here, consists of 4-story buildings with 27 owner-occupied apartments.
POLANDSEK M 2005 2004
Revenue 114 116
Operating income 16 10
Operating margin, % 14.0 8.6
Capital employed 45 105
Return on capital employed, % 21.5 7.7
During 2005, Skanska continued to sell the completed apartments it had previously developed. Skanska is not currently pursuing any new residential development in Poland. At the end of 2005, there were 26 unsold units left, and during 2006 Poland will no longer be reported as a separate Residential Development market.
CZECH REPUBLICSEK M 2005 2004
Revenue 416 523
Operating income 86 105
Operating margin, % 20.7 20.1
Capital employed 298 235
Return on capital employed, % 31.8 48.6
In the Czech Republic, vigorous economic growth and low inter-est rates led to continued strong demand for newly constructed housing units, especially 30–40 km (about 20–25 mi.) outside of Prague. Prices rose 5–10 percent in 2005, depending on location, but are expected to stabilize. Competition has intensified. Due to a large supply of newly constructed housing, customers are invest-ing in projects that are completed or under construction. Prices of building rights are expected to rise during 2006.
Nordic residential development under one roof Since January 1, 2005, Skanska has gathered all residential devel-opment in Sweden, Finland and Norway into a single business unit, Skanska Residential Development Nordic. Starting in 2006, the unit will also include Denmark. As a consequence, residential development has been decoupled from Skanska’s local construc-tion units in the Nordic countries, which thus only perform the actual construction assignment. The change is one element of Skanska’s intensified effort to respond to demand and become the leading residential developer in the Nordic countries. Skanska’s residential development has shown a positive profitability trend, due to improved customer focus and increased adaptation to demand. The aim is to further improve efficiency and the potential for organic growth in this business. Bringing together expertise will create greater possible synergies, among other things through integrated procurement, standardization, customer knowledge, segmentation, personnel and business development.
������������������
�
�����
�����
�����
�����
�����
�������������
�� ��� �������
�������������������������
�
�����
�����
�����
�����
�����
�� ��� �������
�
�����
�����
�����
�����
�����
�� ��� ��������
�����
�����
�����
�����
�����
�� ��� �������
�������������������������������������������
�������������������������������������
����������������������
��
���������������������������������������
�������������� �����������

Skanska Annual Report 2005 21Resident ial Development
Sweden’s first Swan-labeled home is now being built in Malmö. Skanska’s Uniqhus con-cept for environmentally sustainable, low energy housing has received a Swan-labeling license.
Uniqhus is Sweden’s first environmentally labeled hous-ing. Skanska’s concept received a Swan-labeling license in 2005. Uniqhus was examined and environmentally
certified by SIS Ecolabelling AB. Using environmentally friendly materials and construction methods combined with low energy consumption, Uniqhus has a low life-cycle cost. The first Swan-labeled Uniqhus homes were built in Malmö, with a February 2006 move-in date. Skanska previously built Uniqhus homes in nearby Lomma and Ystad. To meet strict environmental standards, a Swan-labeled home must take into account the entire production process, from materials to finished home. Among other things, the home must be capable of energy consumption at least 30 per-cent lower than a standard home. The labeling standards also specify that the wood must come from certified forests, that all chemicals have been examined and hazardous substances eliminated, and that the home comes with an operation and maintenance plan. Environmental labeling is also a seal of quality, since environment and quality go hand in hand.
SWAN-LABELED HOUSING
Uniqhus is Sweden’s first environmentally labeled home. The whole process and all materials were examined from an environmental perspective. A Uniqhus home has at least 30 percent lower energy consumption than a standard home.
Res
iden
tial
Dev
elo
pm
ent
Now more and more people can buy the single-family home of their dreams. Skanska and IKEA’s BoKlok (LiveSmart) apartment living concept is now also available as a single family home. The first cluster of 25 such “Villa BoKlok” homes will be completed in spring 2006 in Karlstad, Sweden.
BoKlok (LiveSmart) − Skanska’s and IKEA’s concept for mod-ern, economical apartment living − has been successful throughout the Nordic region for years. Since 1996, 2,000
such apartments have been sold in Sweden. Now BoKlok is also available as a single-family home. The first 25 “Villa BoKlok” homes are being completed in Karlstad. Skanska builds Villa BoKlok, and IKEA developed the floor plan and suggestions for interior fittings. This home is delivered in a basic design in which the ground floor, which is 92 sq. m (990 sq. ft.) in area, has three bedrooms. The upper floor is sold bare but is ready for interior fittings since electricity, heating and water systems have been installed throughout the house. Buyers themselves may also choose to paint, lay flooring and install appliances. Villa BoKlok features vertical or horizontal wood panel façades. Villa BoKlok is being sold only in clusters, where Skanska creates a pleasant living environment with eight to 25 homes. The homes are factory-built and are assembled on a foundation at the home site. Factory production means that quality can be assured and prices kept low. The price varies with land prices but is intended to be the lowest in the local market.
VILLA BOKLOK FOR EVERY WALLET
Villa BoKlok expands Skanska’s and IKEA’s BoKlok (LiveSmart) concept for low-cost modern housing to single-family homes. These homes will be the lowest-priced in their market.

22 Skanska Annual Report 2005Resident ial Development
Res
iden
tial
Dev
elo
pm
ent
The Badedammen residential project in Stavanger, Norway offers both nature and city life. Its seafront location has contributed to its success, now being repeated for the fourth time. The final phase will soon sell out.
The Badedammen residential project in Stavanger got its name from a century-old seaside bathing resort located next to it. Its maritime location is not only attractive and
a strong sales argument, but the sea also provides some of the heating, which has both economic and environmental advan-tages. This is because in partnership with Statoil, Skanska has developed a seawater-based residential heating system. After three successful sold-out phases, the Badedammen project is now in its final phase. Located on the seafront in Norway’s expansive oil metropolis, the final 74-apartment phase will be completed in 2006. The area has been planned to take maximum advantage of its location. The open, bright apartments have been integrated into their maritime setting and are also close to recreation areas and city life. At year-end 2005 only a few apartments were unsold. Badedammen con-sists of 320 apartments in all.
MARITIME LIVING IN STAVANGER
Skanska’s apartments in the Czech Republic remain in heavy demand, both in the capital of Prague and the country’s second-largest city, Brno. Many are reserved even before ground-breaking, and by the end of construction all apartments are sold.
In the Czech Republic, Skanska focuses its residential devel-opment on the middle or upper middle price segment. Skill-fully executed development and construction that takes
advantage of repetitive effects and large-company economies of scale enable Skanska to create housing at competitive prices. Meanwhile the projects generate a good return on investment. But the Nový Prosek II residential project in Prague did not sell out quickly merely because of its attractive prices. Customers also appreciated the excellent location, close to both nature and the city center. The consistently high quality of Skanska’s apartments was another attraction, along with access to a basement level garage. The project was developed and built entirely by Skanska Czech Republic, which began work late in 2003. It was ready for occupancy and sold out by mid-2005. In the Czech Republic, customers themselves ordinarily supply the fittings in apartment kitchens. Customers have access to a large selection of optional fittings through Skan-ska’s purchasing channels and well-developed supplier net-work. Skanska also arranges discounted prices for those who buy such extra fittings. Most of Skanska’s Czech residential development takes place in Prague. But the growth of the Czech economy has also generated heavier demand for housing in a number of other cities. In the country’s second-largest city, Brno, the Palouček residential area has been completed. The project, consisting of 200 apartments in eight five-story buildings, is Skanska Czech Republic’s largest residential project to date outside Prague. Begun in 2003, it took place in several phases. The final phase was completed in March 2005 and all units have been sold.
ALL SOLD OUT IN PRAGUE
Four successful phases of the Badedammen residential project in Stavanger, Norway have been completed. The adjacent sea provides views and recreational opportunities as well as space heating.
Residential units developed, built and sold by Skanska in the Czech Republic are in heavy demand due to their quality and standards. All apartments in the Novy Prosek II project in Prague were quickly sold.

Skanska Annual Report 2005 23
In Commercial Development, Skanska assumes responsibility for the whole process from land purchase, permit matters and design to the construction, leasing and divestment of completed projects.
Commercial Development
Commercial DevelopmentSkanska takes responsibility for the whole process
Co
mm
erci
al D
evel
op
men
t
SEK1.6 bn in divestment gain
Commercial Development is one of Skanska’s investment opera-tions. It generates value both by developing new projects and by upgrading and improving a property portfolio. It also provides building assignments for the Group’s construction units. In Commercial Development, Skanska assumes overall responsibility for the entire development cycle of a project – land purchase, planning, zoning and permitting, pre-construction design, leasing, construction, management and divestment.
Selected markets Skanska performs commercial development in seven markets in Scandinavia and Central Europe – the Swedish cities of Stockholm and Gothenburg, Öresund (Malmö, Sweden/Copenhagen, Den-mark), Warsaw and Wroclaw (Poland), Prague (Czech Republic) and Budapest (Hungary). Local roots in the various markets are necessary in order to identify both tenants and investors, the latter as future buyers of projects. Operations take place in two business units: Skanska Com-mercial Development Nordic and Skanska Commercial Develop-ment Europe. About 80 percent of capital employed is attributable to commercial development in Scandinavia and 20 percent in Central Europe. Skanska’s commercial development focuses on three types of products – office space, shopping malls and logistics properties
(distribution centers). The allocation between them varies with economic cycles and demand for each respective type of product.
Tenants or investorsCommercial property operations target two different customer categories with the same product. The primary customer is the tenant, which has certain expectations and requirements regard-ing the premises. The second customer is the investor, which finally buys the property in order to own and manage it for a long period, with a certain targeted return. This dual customer relationship means that the product, as well as the services that go with it, must be adapted to be attractive to both customer catego-ries. In some cases, the tenant and the buyer of the property are the same.
Focus on the value enhancement processSkanska starts new projects at the pace the market situation allows and when the risk-return ratio is deemed to fulfill the require-ments established for these operations. Commercial development is a continuous process in which the developer has full responsibility during all phases. The focus is on those stages of the process that generate the greatest value, that is, planning, leasing and divestment.
SEK M 2005 2004
Revenue 5,075 5,584
Operating income 1,740 1,617
of which gain from divestments of properties1 1,551 1,422
of which operating net, completed properties2 x350 504
of which impairment losses/reversals of same 0 –98
Investments x–1,138 –1,336
Divestments 4,430 4,715
Operating cash flow 3,593 3,345
Capital employed 6,035 7,718
Return on capital employed 25.1 17.7
Return on capital employed, %3 16,7 11.0
Employees 125 129
1 Additional gain included in eliminations 75 722 After selling and administrative expenses3 Calculated in accordance with the definition of financial targets
����������������������������������������������������������������
��
��
�
�
�
�
�
���� ���� ���� ��������
������������� ������������� �������������������
������
����������������������������������������������������
��
��
�
�
�
�
�
���� ���� ���� ��������
������
������������������������������
����������� ����������� ��������������

24 Skanska Annual Report 2005Commercial Development
Co
mm
erci
al D
evel
op
men
t
Risk managementThere are risks in all stages of operations. Such external factors as interest rates, customers’ rental needs and the willingness of inves-tors to buy commercial projects are of crucial importance to all decisions in the process. By means of frequent customer contacts, Skanska tracks the leasing requirements of customers continuous-ly. The occupancy level in completed projects and the pre-leasing level in ongoing projects are carefully monitored.
Energy-efficent solutionsSkanska’s sustainability efforts leads to added value for both users and investors. Energy is one focus of these efforts. For some years, Skanska has worked to develop energy-efficient solutions. As a result, by using such techniques as improved insulation and heat recycling, Skanska can lower energy consumption by 20–30 per-cent in renovation projects and by at least 30 percent in new-con-struction. Buildings account for an estimated 32 percent of carbon dioxide emissions in the European Union.
New projects in 2005During 2005, Skanska started eight commercial projects, of which two were divested even before completion. During the year, a contract was signed with the Swedish engineering consultant group Ångepanneföreningen (ÅF) concerning the development, construction and leasing of a new company headquarters build-ing in Solna, outside Stockholm. Skanska carried out its first land purchase in Wroclaw, Poland’s fourth largest city. In Skanska’s judgment, Wroclaw offers good potential for continuous project development. During 2005, Skanska sold completed properties and proj-ects for a total of SEK 4.4 billion. The operating income of Skans-ka’s two commercial development units totaled SEK 1.7 billion, of which SEK 1.6 billion stemmed from property divestments. At year-end 2005, Skanska had a portfolio of completed proj-ects with an externally appraised market value of SEK 4.8 billion (including projects completed in 2005), equivalent to a surplus value of SEK 1.5 billion.
Land and building rights are the basis for commercial develop-ment operations. A supply of land suitable for development is a precondition for a continuous flow of projects. Due to lengthy planning and permit processes, ample lead-time is required to ensure a supply of building rights (a “land bank”) that will meet demand. The average development cycle – from concept to divestment of the fully developed project – is three years. In order to reduce tied-up capital and enable the development of new projects, a rapid pace of sales is sought. Market surveys provide data on the preferences of potential customers concerning location, design and price level. The value of land and building rights varies with demand, i.e. changes in prices and rents. When demand is high, land value also rises. Land value can be described as the difference between con-struction cost and market value of a given project, minus the risk that is related to the project phase. Value increases as risks diminish. A major step in value enhancement occurs when a parcel of undeveloped land is trans-formed into a building right. The process leading to an approved commercial development plan may take up to three years. Skanska plays a proactive role, working closely with local government bodies in planning processes for land use, zoning and commercial development. Value increases further in the next phase, when the build-ing right is turned into a completed project that generates rental income and/or can be sold at the prevailing market price. To ensure that the development process results in appropriate and efficient commercial space, Skanska collaborates closely in its design and planning work with tenants and potential buyers. Carrying out commercial development work successfully on a long-term basis also requires a portfolio of completed projects. Managing these properties provides daily contact with the leasing market. This, in turn, offers insights about changes in customer preferences and also generates new projects. Owning a portfolio of completed properties also lends flexibility to the divestment process, because it enables Skanska to time the divestment of these properties based on market conditions.
Swedish telecom giant TeliaSonera, which previously had more than a dozen addresses around Gothenburg, has gathered its forces under one roof in the Ceres city block. Skan-ska developed and constructed the building, with space for 1,500 employees. Completed within a very tight time frame, it received Skanska’s internal 2005 Project of the Year award in the “Project Development and Services” category.

Skanska Annual Report 2005 25Commercial Development
Ongoing projects Leasable Type of area, Completion Occupancy project City 000 m2 year rate, %
Commercial Development Nordic Gångaren 16, building 18 Office Stockholm 15 2007 29
Stora Frösunda,
Hagaporten phase III Office Stockholm 46 2008 64
Backa 23:1-2 Retail Gothenburg 7 2006 41
Scylla II Office Malmö 10 2006 46
Burlöv, Sunnanå 12:3 Logistics Malmö 10 2006 100
Gladsaxe Office Copenhagen 8 2006 90
Commercial Development EuropeMarynarska Point Office Warsaw 14 2007 0
Total 110 48
Co
mm
erci
al D
evel
op
men
t
When Danish furniture chain ILVA expanded to Malmö, Skanska was its natural choice. Skanska not only developed and built its first store in Sweden, but was also responsible for land purchase and contacts with the City of Malmö. ILVA leases the building from Skanska.
BUSINESS UNITSSKANSKA COMMERCIAL DEVELOPMENT NORDIC SEK M 2005 2004
Revenue 3,980 4,174
Operating income 1,531 1,264
Capital employed 4,933 6,569
Return on capital employed, %1 17.0 10.8
1 Calculated In accordance with the definition of financial targets
Operations focus on initiating, developing, leasing and divesting commercial real estate projects, with an emphasis on office space, shopping malls and logistics properties in Stockholm, Gothenburg and the Öresund region. The business unit sold 26 properties in 17 transactions dur-ing 2005. Of these, seven were projects completed in 2004–2005 with a total area of 74,000 sq. m (797,000 sq. ft.), 100 percent leased. Total divestment volume during the year was SEK 3.4 billion, with a capital gain of SEK 1.3 billion. Among the year’s transactions, special mention can be made of two property portfolios in Stockholm and Copenhagen, respec-tively, totaling about SEK 2 billion. In Stockholm, the capital gain amounted to SEK 555 M, while the capital gain from the Danish divestment was SEK 225 M. The seven completed projects sold for a total of SEK 500 M, with a gain of SEK 168 M. International investors remain interested in the Swedish market, with Danish and Norwegian investors in particular show-ing greater interest. The demand for newly constructed properties remains strong, leading to generally higher demand for properties, since newly constructed projects have become scarce in the mar-ket. This strong interest is expected to continue during 2006. The rental market stabilized during 2005, and demand is likely to rise somewhat during 2006.
Budejovická alej is Skanska Commercial Development’s fourth project in Prague. Completed in 2005, it is fully leased. Shell, the largest tenant, chose Skanska’s building because of its environmentally sound solutions.
The market value of identical properties rose by 7 percent during the year. During 2005, Skanska sold properties at prices that aver-aged 11 percent higher than their appraised market values at the end of 2004. At the end of 2005, Commercial Development had seven projects underway, six of them in Sweden. Ongoing projects represented leasable space of about 110,000 sq. m (1,184,400 sq. ft.) and were 48 percent pre-leased, measured in rent. In addition to these projects, during 2005 four projects with leasable space totaling 26,000 sq. m (280,000 sq. ft.) were sold before completion, with a pre-leasing level of 100 percent on the divestment date.

26 Skanska Annual Report 2005Commercial Development
Commercial Development 2005Further information about Skanska’s Commercial Development operations and about the property portfolio can be found in “Skanska Commercial Development 2005,” which can be downloaded from the Group’s website, www.skanska.com (click “Investors” and “Reports”). The publication can also be ordered from Skanska AB, Investor Rela-tions.
Co
mm
erci
al D
evel
op
men
t
SKANSKA COMMERCIAL DEVELOPMENT EUROPESEK M 2005 2004
Revenue 1,095 1,410
Operating income 209 353
Capital employed 1,103 1,211
Return on capital employed, %1 15.1 12.1
1 Calculated in accordance with the definition of financial targets
Operations focus on initiating, developing, leasing and divesting commercial real estate projects, with office and retail space as well as logistics propertiesas specialties. The emphasis is on Budapest, Prague and Warsaw. After several years of an office space oversup-ply in Warsaw, the market turned around in 2005. Office vacan-cies fell due to heavier demand, while supply of newly completed properties was limited. Budapest also showed a falling vacancy level and a well-balanced rental market. In Prague, vacancies have risen and rents have fallen in recent years. Late in 2005, however, demand rose again. For several consecutive years, investors’ yield requirement has fallen, and interest in acquiring fully developed properties is very strong in all three markets. The buyers of Skanska’s projects are primarily institutional real estate investors.
During 2005, property divestments totaled SEK 1,055 M, with capital gains of SEK 232 M. The ongoing Light Corner office building proj-ect in Budapest was 87 percent completed at the end of 2005 and was sold during the year. Based on degree of completion, this divestment yielded a gain of SEK 95 M. The largest transaction was the divest-ment of the Atrium Plaza and Atrium Centrum properties for a price of SEK 799 M and a gain of SEK 137 M. The Budejovika Alej office building project in Prague was com-pleted in 2005 and had a 99 percent occupancy level by year-end. Another office project, Marynarska Point in Warsaw, started during the year and will be completed in 2007. Investments in land and ongoing projects totaled about SEK 380 M in 2005. This included an initial land purchase in a new market: Wroclaw, Poland. The Warsaw rental market is projected to show continued fall-ing vacancy levels and strong demand for office space in 2006. In Budapest, the market is expected to remain stable, with good balance between supply and demand. The Prague market is characterized by relatively high vacancies, but market rents have stopped falling and the projection for 2006 is that the market will stabilize somewhat. The very strong demand in the investment market is expected to continue and targeted return will fall further during the year.
Generating value, step by step1. Macroeconomic and market analyses precede a
land purchase, which is the foundation for the value-generating process. A major step in value enhancement occurs when undeveloped land is transformed into a building right.
2. Suitable premises are designed, in close collaboration with tenants and potential buyers.
3. Successful leasing work is a precondition for breaking ground. Larger tenants are contracted at an early stage.
4. The project developer orders construction services, as a rule from Skanska’s own construction units.
5. A certain portfolio of completed projects is retained, in order to create flexibility in leasing work and broaden the range of choices for customers.
6. New projects are developed with an eye to future divestment. Sometimes a project can be sold while still in the construction phase.
Värdeskapande i Projektutveckling
18–36 månader
Tid
Värde
1. Planläggning / Bygglov
2. Design/Projektering
3. Uthyrning
4. Byggande
5. Förvaltning
6. Försäljning
Value creation in Project Development
18–36 months
Time
Value
1. Planning/zoning
2. Design/pre-construction
3. Leasing
4. Construction 5. Property management
6. Divestment
The development of commercial projects is a continuous process, with several clearly defined phases: planning/permitting, design/pre-construction engineering, leasing, construction, management and divestment. The average investment cycle is 18-36 months.
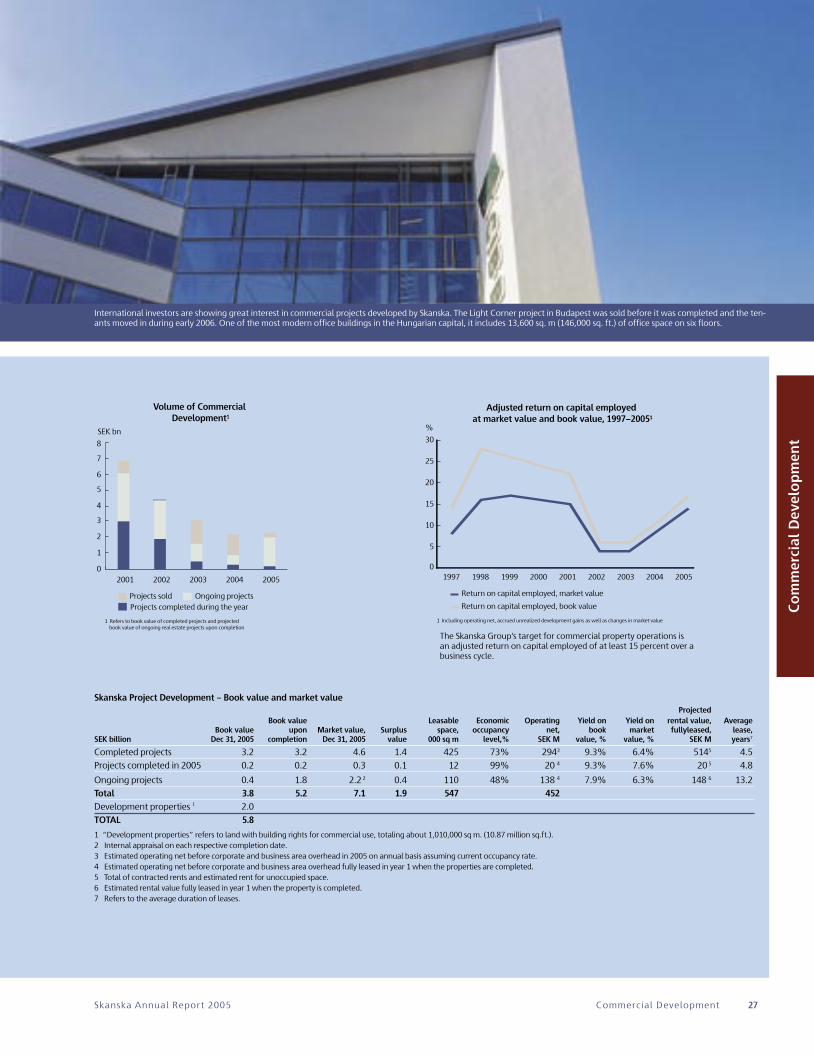
Skanska Annual Report 2005 27Commercial Development
Co
mm
erci
al D
evel
op
men
t
�
�
��
��
��
��
��
�
���� ���� ���� ���� ���� ���� ���� ��������
������������������������������������������������������������������������������������������
�����������������������������������������������
�����������������������������������������������
������������������������������������������������������������������������������������������������������
�������������������������������������������������������
���� ���� ���� ���������
�
�
�
�
�
�
�
�
������������� ����������������
���������������������
������
�������������������������������������������������������������������������������������������������������������������������
��������������������������
�
�
��
��
��
��
��
�
���� ���� ���� ���� ���� ���� ���� ��������
������������������������������������������������������������������������������
����������������������������������������
��������������������������������������
���������������������������������������������������������������������������������������������������
���������������������������������
������������� �������������������������������������������������������������������
����������������������������������������������������������������������������������������������������������������������
���� ���� ���� ���������
�
�
�
�
�
�
�
�
������
��������������������������
Skanska Project Development – Book value and market value Projected Book value Leasable Economic Operating Yield on Yield on rental value, Average Book value upon Market value, Surplus space, occupancy net, book market fullyleased, lease, SEK billion Dec 31, 2005 completion Dec 31, 2005 value 000 sq m level,% SEK M value, % value, % SEK M years7
Completed projects 3.2 3.2 4.6 1.4 425 73% 2943 9.3% 6.4% 5145 4.5
Projects completed in 2005 0.2 0.2 0.3 0.1 12 99% 20 4 9.3% 7.6% 20 5 4.8
Ongoing projects 0.4 1.8 2.2 2 0.4 110 48% 138 4 7.9% 6.3% 148 6 13.2
Total 3.8 5.2 7.1 1.9 547 452Development properties 1 2.0
TOTAL 5.8
1 “Development properties” refers to land with building rights for commercial use, totaling about 1,010,000 sq m. (10.87 million sq.ft.).2 Internal appraisal on each respective completion date. 3 Estimated operating net before corporate and business area overhead in 2005 on annual basis assuming current occupancy rate.4 Estimated operating net before corporate and business area overhead fully leased in year 1 when the properties are completed.5 Total of contracted rents and estimated rent for unoccupied space.6 Estimated rental value fully leased in year 1 when the property is completed.7 Refers to the average duration of leases.
International investors are showing great interest in commercial projects developed by Skanska. The Light Corner project in Budapest was sold before it was completed and the ten-ants moved in during early 2006. One of the most modern office buildings in the Hungarian capital, it includes 13,600 sq. m (146,000 sq. ft.) of office space on six floors. �
�
��
��
��
��
��
�
���� ���� ���� ���� ���� ���� ���� ��������
������������������������������������������������������������������������������������������
�����������������������������������������������
�����������������������������������������������
������������������������������������������������������������������������������������������������������
�������������������������������������������������������
���� ���� ���� ���������
�
�
�
�
�
�
�
�
������������� ����������������
���������������������
������
�������������������������������������������������������������������������������������������������������������������������
��������������������������
�
�
��
��
��
��
��
�
���� ���� ���� ���� ���� ���� ���� ��������
������������������������������������������������������������������������������
����������������������������������������
��������������������������������������
���������������������������������������������������������������������������������������������������
���������������������������������
������������� �������������������������������������������������������������������
����������������������������������������������������������������������������������������������������������������������
���� ���� ���� ���������
�
�
�
�
�
�
�
�
������
��������������������������
The Skanska Group’s target for commercial property operations is an adjusted return on capital employed of at least 15 percent over a business cycle.

28 Skanska Annual Report 2005
Co
mm
erci
al D
evel
op
men
t

Skanska Annual Report 2005 29Commercial Development
Co
mm
erci
al D
evel
op
men
t
A SHOWCASE FOR SUSTAINABLE DEVELOPMENT
Around the turn of the millennium, the area was on its way toward becoming Big Business Boulevard,
with nothing but major companies lining the street. Then the world’s stock mar-kets declined following the bubble and the 2001 terrorist attacks, and develop-ment activity temporarily stopped. But now construction has resumed − with both housing and office space. And the two first buildings, constructed in 1999 and 2001, are simmering with life.Both the mobile media company 3 and Stockholm Transport (Storstockholms Lokaltrafik, SL) have established their new headquarters at Lindhagensterrassen. Modern design and energy-efficient solutions, together with an attractive location, have helped fill up the buildings. Stockholm still has a certain oversupply of office space, but there is a demand for modern, flexible premises. ”We are pleased with the great interest in Skanska’s newly developed office space. We are now continuing the intensive task of leasing so that we can further develop one of Stockholm’s best locations,” says Håkan Danielsson, Presi-dent of Skanska Real Estate Stockholm. Today the construction cranes are again hovering above Lindhagensterras-sen. Both the builders and leasing agents are working with the next large office building. SL will be expanding, leasing one third of the approximately 10,000 sq. m (108,000 sq. ft.) now under con-struction. The foundation and basement level were completed earlier, before the project came to a halt when the market
plunged in 2001. So now the building can be completed in a short period. Since construction resumed, there has been intensive activity. In 2007 this work will result in yet another build-ing that reflects Skanska’s sustainability efforts. Like all Skanska projects, it is being developed in a life-cycle perspec-tive, with sustainable solutions and energy consumption at least 30 percent below the average for commercial properties. “Skanska’s buildings are very impor-tant because they function as a show-case to demonstrate that this whole new area maintains the highest quality. It is very gratifying that Skanska is starting up construction again. It proves that they, like us, believe in this new neigh-borhood, which will expand downtown Stockholm. An out-of-the-way part of the city is being transformed into a new public space that will be lively around the clock,” says Ingela Lindh, Executive Director of Stockholm’s City Planning Administration. Turning western Kungsholmen into a lively neighborhood will also require housing. Residential construction is an important element of the city’s plans, and Skanska is come a long way in this area as well. An initial 160-apartment project began during 2005. All the apartments have been sold. The two 18-story build-ings will be like exclamation points next
to the lower, cubic office buildings. Residents on the upper floors will enjoy a view of large portions of Stockholm. The apartments will be ready for occu-pancy starting in the autumn of 2006. During 2006, work on another 260-apartment phase will begin. Exactly when this can happen will depend on the date when the amended neigh-borhood plan can be approved by the Stockholm City Council. Both residents and companies will also have access to the area’s under-ground garage. When fully expanded, it will offer parking for about 1,000 cars. Skanska’s building rights on Lind-hagensterrassen total about 95,000 sq. m (1.02 million sq. ft.) of office and other commercial space and some 400 apartments. Skanska has started or com-pleted 33,000 sq. m of office space as well as 160 apartments in the residential buildings. Among the remaining properties are two older buildings that will be upgrad-ed to harmonize with their surroundings. Every year, Skanska’s showcase is becoming more full. If the planning pro-cesses and economic conditions remain favorable, within a few years Lindhagens-terrassen can become a vibrant new neighborhood of workplaces, apart-ments and services for thousands of people.
Lindhagensterrassen is an area of Stockholm that has long been a showcase for Skanska’s development of commer-cial projects. Now Skanska’s residential developers are also helping to quicken the pulse of western Kungsholmen island.
Agneta har
beställt en
illustration
���������������
��������������
�����
�
�� � ����
���
�������
����� ������������������������������ ����������������������������������� ��������������������������� ���������������������������� ���������������������������������� ����������������������������������� �������������������� ������������������������������� ���������������������� ����������������������� ��������������������������������
Skanska is continuing to develop Lindhagensterrassen close to downtown Stockholm, with both housing and office space. Skanska’s building rights total about 95,000 sq. m (1.02 million sq. ft.) of office and other com-mercial space and some 300 apartments. Skanska has started or completed 33,000 sq. m of office space as well as 160 apartments in the residential buildings.

30 Skanska Annual Report 2005Infrastructure Development
Skanska Infrastructure Development invests in infrastructure facilities that are developed, built and operated as public-private partnerships.
Infrastructure Development Skanska invests in privately financed infrastructure
The Infrastructure Development business stream and the Skanska Infrastructure Development (Skanska ID) business unit, formerly Skanska BOT, changed names during 2005 in order to clarify the content of their operations: public-private partnership projects.
Public-private partnerships mean that private market play-ers provide facilities and buildings to public agencies. This often implies a number of macroeconomic advantages for customers, taxpayers, users and builders. The model makes more room for investments in public facilities by spreading large public invest-ments over longer time periods. It also increases the benefit to users through earlier availability and lower life-cycle costs.
Public-private partnership projects create value-added for Skanska by generating large construction assignments and contin-uous revenue and cash flows during the lengthy operation phase. Furthermore, Skanska receives long-term service and maintenance contracts.
From an investor perspective, Skanska ID creates assets char-acterized by reliable cash flows over a decades-long service life, once the operation phase begins.
The development processIn public-private partnership projects, Skanska is involved in the entire development chain from design and financing to construc-tion, operation and maintenance. By assuming an overall responsi-bility, Skanska optimizes both construction and operating costs.
Skanska-led consortia are awarded these projects not only by because of price but, above all, on the basis of how well the Skanska-developed product or service meets the needs of the customer today and in the future.
During the development process, a public-private partnership project mainly goes through the following stages: bidding, selec-tion of the preferred bidder, financial close, construction, the ramp-up phase and the steady state phase.
During the development process, which is led by Skanska ID, the customer, owners (Skanska ID and its partners), builders and suppliers of operating and maintenance services are integrated into the task from the start, which reduces the overall risks to Skanska.
Risk management − generating value-addedThe investment, which is Skanska ID’s part of the value chain, must also meet ordinary commercial financial return targets. In order to create a commercially attractive asset, Skanska ID must efficiently manage risks and opportunities during the development phase, that is, after financial close. Large value-added is generated during this process.
Thorough selection processThe selection process is crucial to Skanska, since there is a very wide range of projects. First and foremost, projects must be in product and geographic areas matching Skanska’s competencies. As mentioned earlier, the investment must also meet Skanska’s return targets. Skanska performs a thorough examination of risks and opportunities, in close collaboration with the Group’s construction units. Among the available projects, Skanska selects those in which it has the greatest potential to achieve success. Since public-private partnership projects largely undergo final planning during the bidding phase, the bidding costs are sub-stantially higher than for traditional construction contracts. The
��������������������������������������������������������������������
����� ����� ����� ����� ����� ����� ����� ����� ������
�����������������������������������������������������������������������������������������������������������������������������
����������������������������������������������������������������������������
�����������������������������������
����
����
�
���
���
���
�����
�����
�����
�����
�����
�����������������������������������������������������������������
����� ����� ����� ����� ����� ����� ����� ����� ������
�������������������������������������������������������������������������������������������������������
������������������������������������������������������������������������������
����
����
�
���
���
���
�����
�����
�����
�����
�����
�����
���
�����������������
Infr
astr
uct
ure
Dev
elo
pm
ent
SEK M 2005 2004
Revenue 53 33
Operating income -9 31
Investments -476 –188
Divestments 35 6
Operating cash flow from business operations1 -641 –215
Capital employed 2,532 1,480
Return on capital employed, % -0.1 3.3
Return on capital employed, %2 36 11
Employees 66 40
1 Before taxes, financing operations and dividends2 Calculated in accordance with the definition of financial targets

Skanska Annual Report 2005 31
bidding period is usually also longer. By means of a very thorough selection process, bidding costs can be kept down and the pros-pects of being selected can increase.
Together with one or more suitable partners, Skanska ID forms a bidding consortium. In collaboration between the bidding consortium, Skanska’s local construction unit and other suppliers, Skanska ID develops a bid. If the bid is accepted by the customer, the consortium is appointed the preferred bidder. Other bidders are thus eliminated. At this point, Skanska ID and its partners form a special project company to own and operate the facility during the concession period, often lasting 20 to 35 years.
Integrated modelAs a rule, Skanska’s local construction company carries out most of the construction project as a design-build contract with a fixed price and completion date. The margins are ordinarily higher in these contracts than is the case in traditionally procured projects. The local construction company is often also contracted to oper-ate and maintain the completed facility. The greatest risk from an investor perspective is that the asset cannot go into service and that quality standards are not met. When Skanska itself carries out the construction assignment, this risk is substantially lower. Once the construction phase ends, the ramp-up phase begins. Its length
Infrastructure Development
Infr
astr
uct
ure
Dev
elo
pm
ent
Phases in development processes, Skanska IDTerminology Meaning Implications for Skanska Appraisal, Skanska ID
Bidder Company that actively tries to bet Costs are recognized continuously in No
awarded the projec the income statement.
Preferred bidder A consortium is selected and pursues final The project is highly likely to be implemented. No
negotiations to sign a contract with Bidding costs are capitalized in the balance sheet.
exclusive rights.
Financial close All contracts are signed. Debt funding is raised, often Construction and service contracts are reported among order bookings. Yes
in the form of a syndicated bank loan or bonds. The A certain value is reported as a new project in
first disbursement is made to the project company. the Skanska ID accounts. An initial risk premium is
added to Skanska’s discount rate.
Completion of Construction is completed, entirely The initial operating phase has begun. The initial risk Yes
construction phase or partly (in stages), and the asset is in operation. premium has gradually been reduced, but a certain
risk premium is retained through the ramp-up phase.
Ramp-up The initial operating phase. The duration varies, The ramp-up risk premium is gradually reduced. Yes
depending on the type of project and payment.
Steady state The project is in full operation and ha The long-term discount rate is applied. Yes
as achieved long-term revenue and cost levels
There is full activity at the new school buildings in Bexley, southeastern London – developed, built, owned and managed by Skanska as part of the British public-private partner-ship program. The attractive new Bexleyheath and Welling school premises accommodate some 3,600 students.

32 Skanska Annual Report 2005Infrastructure Development
varies depending on the type of project and the payment model (see below). In projects using the availability model, the ramp-up phase is normally no more than one year. In highway projects using the market risk model, for example, the ramp-up phase is instead connected to the functionality of the toll and invoicing systems and whether traffic revenue is as expected.
Two different compensation modelsThe project company, in which Skanska is a part owner, receives compensation mainly according to one of two different models.
In the availability model, compensation is based on provid-ing a given amenity and agreed services at a predetermined price. Compensation is payable regardless of the extent to which the facility is utilized. The project company is exclusively respon-sible for keeping the services and facilities available, functioning smoothly and up to the agreed standard. Divergences from this standard may result in a limited deduction from payments. The compensation is adjusted for inflation. Because the customer is usually a national or local government, the project company’s credit and payment risk is low. Meanwhile the potential for a higher return is more limited in the availability model.
In the market risk model, compensation is based entirely on end-user fees, for example tolls collected from motorists on a stretch of road. The market risk model implies that the owner – the project company – has bought the rights to the revenue from a given facility during an agreed period, usually 20-35 years. In this case, the project company’s credit and payment risks are sub-stantially higher, while it also has major potential for increasing the return on its investment as a consequence of increased use of the amenity. For this reason, from the bid preparation stage, Skanska conducts thorough analyses of the legal and political stability of the country or region in question. Future needs are analyzed on the basis of microeconomic forecasts and projections of demographic trends. In these projects, too, such revenue as auto tolls is adjusted for inflation.
The availability model is more common in Skanska’s project port-folio, especially in Europe. In the U.S. and Latin America, how-ever, the market risk model occurs more frequently.
The financing of a project/project company is allocated between Skanska ID and its partner(s), which invest in the form of equity and subordinated loans. Other financing − which in avail-ability projects may total more than 90 percent and in market risk projects 60-70 percent − consists of bank or bond loans. These loans are based entirely on the project company’s financial condi-tion and payment capacity. The owners of the project company normally act as guarantors until the facility has gone into service. A project company is not consolidated into the balance sheet of the Skanska Group in cases where Skanska does not exercise con-trol over the company.
Cash flows from the project company to Skanska ID consist of interest and repayment of principal on subordinated loans issued by Skanska, dividends from the project company’s profits and finally repayment of capital stock.
In the availability model, the payment flows to the inves-tors move as follows: Because the largest proportion of Skanska’s investment in the project company consists of subordinated loans, revenue consists of interest and principal payments on these loans. Only later, normally in the final years of the contract, are there dividends.
In the market risk model, Skanska’s investment consists largely of share capital. Payment flows thus consist mainly of dividends, which in turn are determined by the underlying profit-ability of the facility. At the end of the steady state period, capital stock is also repaid. During the first few years after completion of a project, when interest and principal payments are large cost items, the project company shows a loss. Later the costs decline and revenue gradually increases along with the use of the facility.
Infr
astr
uct
ure
Dev
elo
pm
ent
���������������������������������
�������
����������
�������������������
�������������������
��������������
����������
�����������������
���������
�����������������
���������������
�������
���������������������
�������������������������
�
���������������������������
�����������������������������
�������������������
�����������������
��������������
���������������
��������
���
�����������������
�������������������
�����������������
���������������������������������
��������
������������
�������
������������������
�����������
����������
����������������
�����������������
������������
�������������
���������
���������������������
��������������������������
��������������������
����������������������
�����������������������
�����������������
������������������
��������
�����������������
����������������
�����������������

Skanska Annual Report 2005 33
����������������������������
�����������������������������������������������������������������������
�������������������������������� �
�����������������������������
���������������������������������������������������������������
�������������������������������
�����������������������������������������������������������������������������
������������������������������������������������������������������������
��������������������������������������������������������������
������������������������������
���������������������������������������������������������������
������������������������������������������������������������������������
�����������������������������������������������������������������������������������������
Infrastructure Development
Infr
astr
uct
ure
Dev
elo
pm
ent Appraisal methodology
Skanska ID regularly conducts appraisals of its portfolio. Future cash flows are discounted at a discount rate based on country, risk model and project phase for the various projects. The discount rate selected is applied to all future cash flows starting on the appraisal date.
The most recently updated financial model is used as a base. This financial model describes all cash flows in the project and serves as the ultimate basis for financing, which is carried out with full project risk and without guarantees from Skanska. The financial model has been examined and approved by banks and so-called wrappers (companies with very high credit ratings of their own that themselves assume the project risk for the final bond holders) as well as rating companies. Data for the financial model is updated at least once a year.
A market value is assigned only to projects that have reached financial close. The appraisal is performed from the perspective of Skanska ID, i.e. all flows are appraised − investments in the project (equity and subordinated loans), interest and principal payments on subordinated loans as well as dividends to and from the project company.
The discount rate selected is based on levels of return where the steady state phase has been reached. Differences in the appraisal over time are due to changes in future cash flow, in time value (the closer the cash flow is in time, the larger its value), in the discount rate used. Today all investments are denominated in currencies other than Swedish kronor. This means there is also an exchange rate risk in market values.
The 2005 appraisalAt year-end 2005, estimated gross present value totaled SEK 5.2 billion (2.2). See the sensitivity analysis on page 35. Estimated unrealized development gains in Skanska ID increased during 2005 by SEK 1.7 billion and thus amounted to SEK 2.4 billion. The increase in value was mainly due to the reduced risk level in the project portfolio but also to greater demand for fully developed projects in the secondary market. Taken together, this led to lower discount rates. The weighted discount rate was 13.7 (16.5) percent on December 31. Another major element of the increase in unreal-ized development gains was related to exchange rate changes.In the consolidated accounts, elimination of intra-Group profits totaled SEK 0.3 billion (0.2), which meant that unrealized devel-
Appraisal methodologyType Steady state methodology Steady state discount rate Additional risk premium during dev’t ID projects
UK PPP hospitals Secondary market yields where 9% Add 2 percent during construction/ramp-up Kings, Coventry,
a deep market exists. and reduce this premium from FC Derby, Mansfield
on a linear basis until steady state is reached
UK PPP schools/prison As above. Slightly less 10% As above Bexley, Bridgend
demand than for hospitals
Other PPP Roads As above. 10% As above A1, E18, E39
and Nelostie
Concession type roads Estimate the risk premium over 12% Add 3-4 percent during construction/ramp-up Autopista Central
government bonds. Use listed and reduce this premium from FC
universe and secondary deals. on a linear basis until steady state is reached
Others Estimate the risk premium 15–19% Add 2 percent during construction/ramp-up Ponte de Pedra,
over government bonds. and reduce this premium from FC Manaus/Breitener,
Use listed universe and secondary deals. on a linear basis until steady state is reached Nordvod, Maputo

34 Skanska Annual Report 2005
Infr
astr
uct
ure
Dev
elo
pm
ent
Infrastructure Development
Valuation in 2005 by category, SEK M Net present value (NPV), Discount NPV Unrealized of cash flow from projects rate 2005 remaining Book value, development Category Dec. 2005 % Inv1 Dec. 20052 gain, 2005
Road 460 10.8 124 192 144
Autopista 3,454 14.0 0 1,473 1,981
Social infrastructure 618 10.2 264 194 160
Utilities 657 17.4 0 579 78
Total3 5,189 13.7 388 2,438 2,363
Accumulated development profit 2004 700
Change 2005 1,6631 Nominal value SEK 535 M.2 Invested capital plus accrued value of participations in project companies corresponding to Skanska’s ownership.3 Eliminations at Group level reduce the book value and hence increase the accumulated development gain by SEK 300 M to SEK 2,663 M. In the Group’s accumulated development gain in 2004 of SEK 900 M, Group eliminations amounted to SEK 200 M. The 2005 change in development gain on Group level therefore totaled SEK 1,763 M.
opment gains at Group level amounted to SEK 2.7 billion (0.9) at year-end. The appraisal methodology that was applied as well as proj-ects equivalent to 75 percent of the estimated value of the portfolio were examined and quality-assured by external specialists with long experience from appraisals of this type of assets.
Business unit Skanska Infrastructure DevelopmentSkanska Infrastructure Development has 18 projects in its portfo-lio, most of them in Europe and Latin America.
During 2005, Skanska reached financial close for • the A1 highway in Poland. • the King’s Mill Hospital and Mansfield Community Hospital
projects in Nottinghamshire, UK. • the E18 European highway north of Helsinki. A Skanska-led
consortium was both awarded the contract and completed the financing during 2005 in a record-quick four months.
Skanska was also selected as preferred bidder for a number of school projects for the Midlothian Council in Scotland and the Bristol City Council in England. Financing agreements are expect-ed to be signed during 2006.
The St. Bartholomew’s Hospital (Barts) and Royal London Hos-pital project in England, for which Skanska was expected to reach financial close before the end of 2005, has been delayed. No con-tract has been signed yet. During 2005, the organization was expanded in order to take advantage of the many potential projects. Skanska ID has also devoted extensive effort to ensuring that the risks and opportuni-ties in its project portfolio are handled in the best way. The degree of maturity in the project portfolio increased during 2005 as the Bexley schools in the U.K., the E39 highway in Norway, the Nordvod wastewater plant in St. Petersburg, Russia and the Ponte de Pedra power plant in Brazil went into full opera-tion. Meanwhile the continued performance of the Coventry and Derby hospitals in the U.K. and especially the Autopista Central highway in Chile had a positive impact on operations. The outlook for Skanska ID is bright, with continued strong demand, while new markets such as the United States and Central and Eastern Europe are expected to provide further potential proj-ects. Skanska ID expects to sell a number of non-strategic invest-ments during 2006.
Definitions, Skanska ID’s appraisal modelPresent value of cash flow from projects The discounted present value of all flows from the project to Skanska ID.
Present value of remaining investments The discounted present value of remaining investment commitments. This is discounted at the same
discount rate as the project.
Net present value The discounted present value of all flows to/from the project. This is the same as the sum of the present
value of cash flow from projects and the present value of remaining investments.
Unrealized development gain Net present value minus book value of projects (this is determined by book value of invested capital and
by accumulated recognized income share less dividends paid). Development gain in Skanska ID differs
somewhat from that of the Group due to eliminations.
Change in unrealized development gain Annual change in development gain.
����������
���������
���
���
���
���
���
���
���
���
���
��������������
����������������������������
��������� �������������������������������
����������
������ ����������������������������������������������
���������������������������
����������������������������������������������������������� �������������������������������������������������
������ ������
����������
���������
���
���
���
���
���
���
���
���
���
��������������
��������������������
���������
������������������������
����������
������������
����������������������������������
���������������������������
����������������������
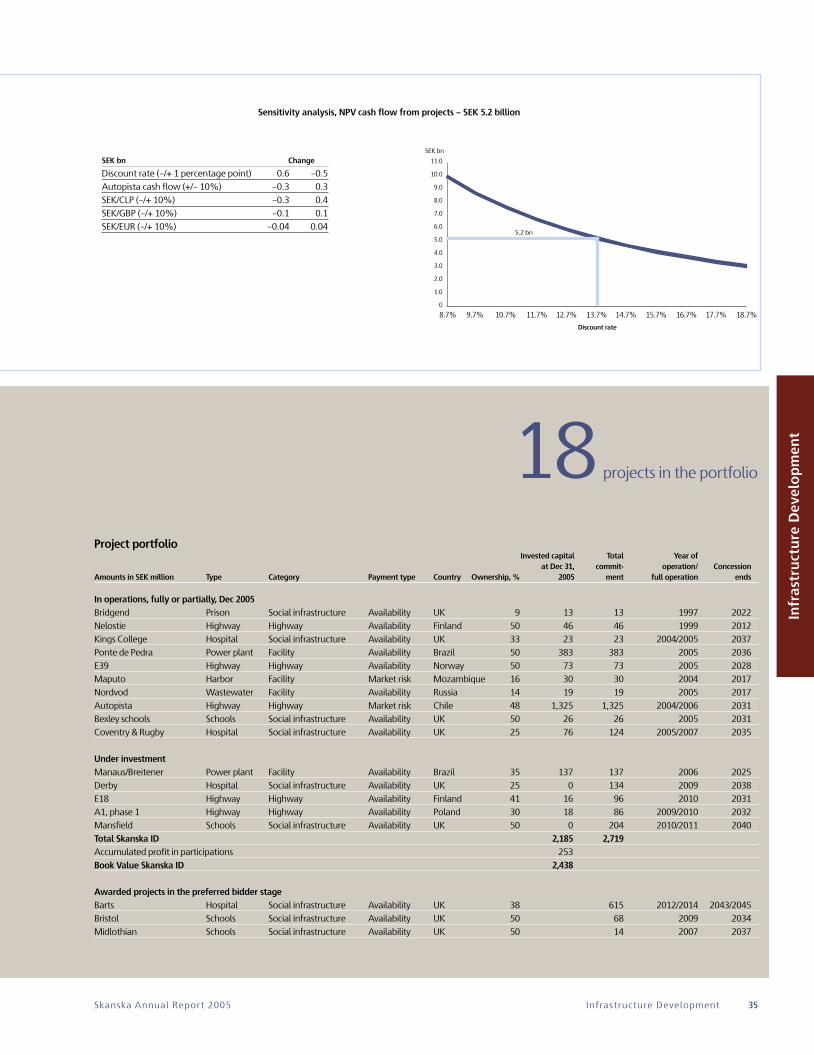
Skanska Annual Report 2005 35
Infr
astr
uct
ure
Dev
elo
pm
ent
Infrastructure Development
SEK bn Change
Discount rate (–/+ 1 percentage point) 0.6 –0.5
Autopista cash flow (+/– 10%) –0.3 0.3
SEK/CLP (–/+ 10%) –0.3 0.4
SEK/GBP (–/+ 10%) –0.1 0.1
SEK/EUR (–/+ 10%) –0.04 0.04
18 projects in the portfolio
Project portfolio Invested capital Total Year of at Dec 31, commit- operation/ Concession Amounts in SEK million Type Category Payment type Country Ownership, % 2005 ment full operation ends
In operations, fully or partially, Dec 2005Bridgend Prison Social infrastructure Availability UK 9 13 13 1997 2022
Nelostie Highway Highway Availability Finland 50 46 46 1999 2012
Kings College Hospital Social infrastructure Availability UK 33 23 23 2004/2005 2037
Ponte de Pedra Power plant Facility Availability Brazil 50 383 383 2005 2036
E39 Highway Highway Availability Norway 50 73 73 2005 2028
Maputo Harbor Facility Market risk Mozambique 16 30 30 2004 2017
Nordvod Wastewater Facility Availability Russia 14 19 19 2005 2017
Autopista Highway Highway Market risk Chile 48 1,325 1,325 2004/2006 2031
Bexley schools Schools Social infrastructure Availability UK 50 26 26 2005 2031
Coventry & Rugby Hospital Social infrastructure Availability UK 25 76 124 2005/2007 2035
Under investmentManaus/Breitener Power plant Facility Availability Brazil 35 137 137 2006 2025
Derby Hospital Social infrastructure Availability UK 25 0 134 2009 2038
E18 Highway Highway Availability Finland 41 16 96 2010 2031
A1, phase 1 Highway Highway Availability Poland 30 18 86 2009/2010 2032
Mansfield Schools Social infrastructure Availability UK 50 0 204 2010/2011 2040
Total Skanska ID 2,185 2,719 Accumulated profit in participations 253
Book Value Skanska ID 2,438
Awarded projects in the preferred bidder stageBarts Hospital Social infrastructure Availability UK 38 615 2012/2014 2043/2045
Bristol Schools Social infrastructure Availability UK 50 68 2009 2034
Midlothian Schools Social infrastructure Availability UK 50 14 2007 2037
����������������������������������������������������������
�����������������������������������������������
�������������
�
���
���
���
���
���
���
���
���
���
����
����
������
������������������
�
���
���
���
���
���
���
���
���
���
����
����
����� ����� ������ ������ ������ ������ ������ ������ ������ ������ ����� ����� ����� ������ ������ ������ ������ ������ ������ ������ ������ �����
�������������������������������
������� ������
Sensitivity analysis, NPV cash flow from projects – SEK 5.2 billion

36 Skanska Annual Report 2005Infrastructure Development
154,000 SATISFIED CUSTOMERS PER DAY
Infr
astr
uct
ure
Dev
elo
pm
ent
In Santiago, Skanska has eliminated traffic bottlenecks. Road users in the capital of Chile now have 61 km (38 mi) of new highway and Skanska has gained 1.2 million new customers – that is how many have registered to use the new Autopista Central toll road.
The travel time from the northern to the southern neighborhoods of the city has been trimmed from one
and a half hours to 20 minutes. Vehicles move non-stop along the Autopista Cen-tral, without traffic jams or slow-downs at tollbooths. Both the payment and traffic monitoring systems are entirely electronic. The journey costs less than SEK 4 or about half a U.S. dollar per five kilometers (three miles), roughly equivalent to the price of a bus or subway ride in Santiago. Every day 154 ,000 motorists use the road. Through the project company Auto-pista Central, Skanska Infrastructure Development – which was responsible for all the development work – is part-owner of the four- and six-lane highway, whose
two branches run straight through San-tiago in a north-south direction. The Santiago region has 5.6 million inhabitants divided into 14 municipali-ties. The Autopista Central construction project, which was performed by Skanska Latin America, thus offered major chal-lenges in terms of coordination.
North-south highwayApproximately 500,000 people live along the Autopista Central, or the Autopista Panamericana as it is often called because it is part of the Pan American Highway, a transcontinental route running through North and South America. Of the project’s 106 bridges, most are pedestrian bridges above the roadway. But there are also large highway bridges. The longest, over the Mapocho River, is 680 m (2,230 ft) in length. Like all the other structures, this bridge has been spe-cially built to withstand earthquakes. Thanks to various improvements in design and implementation, Skanska was able to open most of the Autopista Cen-tral by December 2004. It thus became the first of Santiago’s four new toll roads to open for traffic. By the end of 2005, more than 90 percent of the Autopista Central had been completed. Construc-
tion started in July 2001 and will end during the first quarter of 2006, when the remaining portions of the route become available to motorists. The construction contract, of which Skanska’s share totaled USD 300 M, is Skanska Latin America’s largest-ever proj-ect. One indicator of the project size is average wage costs, which for skilled workers in Chile are 1/20 of those in the United States, while the cost of construc-tion and materials is generally around 1/10 of U.S. levels. A comparable project in the U.S. or Western Europe would thus have involved an investment many times higher.
Sophisticated payment systemIn order to collect road user payments, all traffic is recorded with the aid of both sensors and cameras. A very powerful computer system gathers all the informa-tion that provides the basis for monthly invoicing. Vehicles not registered to use the road are identified by photos and in the government’s motor vehicle registry, enabling the road company to invoice the owners afterward. Skanska managed the task of devel-oping a common registration and pay-
In Chile, Skanska has gained 1.2 million new customers – that is how many have registered to use the new Autopista Central in Santiago. The new 61 km (38 mi) toll highway is used by an average of 154,000 motorists per day. It has shortened rush-hour travel time across the city from 90 to 20 minutes. The toll is about SEK 1 per kilometer, the average journey 12 km (7.5 mi.) long.

Skanska Annual Report 2005 37
Infr
astr
uct
ure
Dev
elo
pm
ent
ment system for all four of Santiago’s toll roads, which was a requirement from the authorities.
Maintenance ensures highway standardOwnership responsibilities also include handling highway maintenance. Clean-ing, maintenance and repairs occur at night, when kilometer-long sections are completely shut down so that work can be performed safely. Regular main-tenance work ensures that the road will retain the promised standard and improve both its safety and its benefits to the community. Furthermore, a well-run road is an attractive choice for motorists, thereby generating revenue for the project company.
A focus on safetyRoad safety is also a high priority. Around the clock, seven days a week, there are paramedics, ambulances and tow trucks ready to respond to emergency calls and take care of the injured, direct traffic and remove vehicles that are blocking traffic. Along the road are emergency telephones, linked to a dispatch center that has direct lines to police, firefight-ers and medical care facilities. The police also have a person on duty at all times in the central control room of the road company, where all 61 km of the road are monitored via more than 120 cam-eras stationed along the route. Another element of safety work has been to train more than 100,000 children in traffic safety awareness.
Macroeconomic benefitsThe Autopista Central has not only given the Chileans a new toll road of the high-est standard. It has also freed up public funds for other urgent investments, such as improving drinking water supply sys-tems and educational programs. Public-private partnership projects bring macroeconomic benefits. Their private element often means that they are completed earlier than if financed through a public budget, giving users access to a highway earlier. A long-term private commitment is also a strong incentive to design and implement the project with a life-cycle perspective. This lowers life-cycle costs compared to pub-lic facilities procured by traditional ten-der procedures based on lowest price.
Infrastructure Development

38 Skanska Annual Report 2005
Sustainable developmentSkanska regards sustainable development as an important business aspect that influences both risks and opportunities. ‘The four zero visions’— zero loss-making projects, zero work place accidents, zero environmental incidents and zero ethical breaches — are fundamental driving forces.
Sustainable development
Sust
ain
able
dev
elo
pm
ent
The Global Reporting Initiative 2002 Sustainability Reporting Guidelines have served as an inspiration for Skanska’s sustainability reporting. More information regarding work with sustainable development is available at:www.skanska.com/sustainability.
“By balancing economic progress, social responsibility and environmental considerations, we are building a robust foundation for continued prosperity.”
Stuart Graham
Economic progress Social responsibility Environmental considerations
Skanska defines its approach to sustainable development as inte-grating social and environmental dimensions into its day-to-day business process. The challenge is to build a robust and sustain-able way of working in a decentralized and integrated organiza-tion – Skanska has 54,000 employees and an even larger number of subcontractors in 12,000 projects. Its business units engage employees in corporate strategies for sustainable development through training, targets and follow-ups. Skanska has a Code of Conduct and, among other com-mitments, has signed the UN Global Compact and the World Economic Forum’s Partnership Against Corruption Initiative. Dialogues that are conducted with employees, customers and local residents help assure that local needs are met. During 2005, the task of integrating certified/registered management systems continued. Skanska is among the few international construction companies to have implemented envi-ronmental, quality and occupational health and safety manage-ment systems in most of its operations. Other activities in 2005 included a successfully Groupwide Safety Week, the first Social Accountability 8000 certification and increased attention to man-agement development. During 2006, the focus will continue to be on day-to-day
operational issues such as health and safety and business ethics as well as on strategic, long-term questions regarding climate change and biodiversity. Engaging in these priorities will help create a more sustainable market.
Driving forces for sustainabilityA number of internal and external driving forces influence Skanska’s approach and plans for the future: Customers – In the same way as the product’s location, quality and price, sustainable development provides value-added that strengthens Skanska’s capacity to build long-term customer relationships. In 2005, there were again numerous projects with environmental criteria exceeding compliance levels (see table to the left). Shareholders – The market for ethical investments is increasing. Skanska is among the most frequently invested con-struction sector companies in Europe, according to 2005 research. Four percent of Skanska’s total shares are held by ethical funds. Internally-driven – A sense of pride in, and trust for, Skanska values are preconditions for recruiting and low employee turnover. Employees and subcontractors need to feel confident that Skanska is doing its utmost to ensure their health and safety. Cost-consciousness – Financial benefits include reduced operating costs, especially in risk management and improved productivity. Lower project expenditures are achieved through improved resource management and by sharing best practices. Legal and other requirements – Skanska actively engages in the development of a range of tools geared towards continual improvements. Both EU directives on energy efficiency and man-agement of hazardous substances as well as tools for environmental design, such as LEED in the U.S., contribute to the development of Skanska strategies.
Order value of projects with higher environmental standardsUSD M 2005 2004 2003 2002 2001
Total 8,377 7,627 8,335 6,250 7,163

Skanska Annual Report 2005 39
Sust
ain
able
dev
elo
pm
ent
Sustainable development
Some recognition during 2005
• For the seventh consecutive year, Skanska qualified for the Dow Jones Sustainability Index.
• FTSE4Good and Storebrand SR are among the leading ethical funds and analysts that include Skanska in their indexes.
• The Global 100 Most Sustainable Corporations, launched at the World Economic Forum in 2005, listed Skanska as its sole construction sector representative.
• The Czech Top 100 Association ranked Skanska Czech Republic among the five most admired companies in the country.
• Skanska UK received three Gold Awards from the Considerate Constructor’s Scheme, for keeping public disruption to a minimum at specific projects in the UK.
• The Goathill North Rock Pile Mitigation project, operated by Nielson Skanska, received the Excellence in Reclamation Award in 2005 from the New Mexico Energy, Minerals and Natural Resources Department and the Mining and Minerals Division.
• The Danish organization Key2Green awarded Skanska Denmark with a prize for its forward-thinking approach to caring for the local environment.
Suppliers and subcontractors
Nationel, regional and local government officials
Local residents
Employees
Clients
Charity oranizations
Media and general public
Shareholders
Organized responsibility A number of corporate units support Skanska’s line organization. Group Staff Unit Sustainability directs the Group’s sustainable development efforts and conducts dialogues with relevant stake-holder groups. This unit has special responsibility in the fields of the environment, work-related health and safety issues as well as business ethics.
Skanska’s business units have operational responsibility and combine their competencies with corporate-level development projects such as Best Practice Groups. In 2005, Best Practice proj-ects evaluated issues regarding health, safety and environmental strategies as well as energy performance in buildings.
Code of ConductThe Skanska Group’s Code of Conduct is an important policy document governing how all employees are expected to conduct their activities and approach issues relating to sustainability. The Skanska Code of Conduct outlines responsibilities toward employees and business partners, the environment as well as society in general. It helps develop and maintain an economically viable and prosperous business.
The Code of Conduct contains three sections: employee relations, business ethics and concern for the environment. It is also accompanied by a compliance guideline for implementation.
Skanska’s key stakeholders
Through the Code of Conduct, Skanska adopts a proactive stand in regard to human rights, fundamental ILO conventions and business ethics. One aspect of the Code of Conduct is its emphasis on good working environment. It also underlines the importance of preventive action in environmental work, conserving resources and avoiding projects that present unacceptable risks.
The importance of communicating this approach to sup-pliers and subcontractors is of great importance. During 2005 approximately 9,100 suppliers and subcontractors were informed of the content of the Code of Conduct, compared to approxi-mately 6,200 in 2004. Skanska has engaged more than 31,000 subcontractor and supplier employees in its environmental and health and safety training during 2005. At present, a small share of Skanska’s purchasing is coordinated on a global level. The volume is, however, expected to grow, thereby heightening the need for supplier evaluations.
A 2005 internal follow-up of the Code of Conduct indicates high levels of acceptance and compliance with the Code through-out the organization. This conclusion is supported by internal auditors who specialize in quality, environmental and health and safety issues. Meanwhile these auditors emphasize that it is a major challenge to benchmark results in a project-based business, where many factors are unique to a specific project.
Skanska Sweden’s Göran Karlsson uses proper personal protection equipment in his work. The Skanska Code of Conduct emphasizes the importance of good job-related health and safety standards in all projects.
BEST IN CLASSenviromental andsocial performance STOREBRAND SRI

40 Skanska Annual Report 2005Sustainable development
Environmental management
Most of Skanska’s environmental direct impact occurs at the local level and all operations are controlled by environmental management systems. Through a life-cycle perspective, the environmental impact of a building can be improved during its entire life span.
Uniqhus, a housing concept developed by Skanska, was the first residential project to obtain Nordic Swan certification. In addition to environmentally sound materials and production methods, the building has a lower life-cycle cost thanks to reduced energy consumption.
Sust
ain
able
dev
elo
pm
ent
Operational planning and targets for continual improvement are defined through management systems. Skanska monitors progress at both unit and project levels. Internal and external audits identify possible non-conformities that are then addressed. Skanska has certified/registered all units according to the ISO 14001 interna-tional standard for environmental management.
In recent years, customer interest in eco-design has increased and Skanska has therefore developed specialized expertise to meet this demand. Skanska USA Building currently employs 30 LEED-accredited professionals for environmentally sound design. This provides new project opportunities and attracts potential clients.
TrainingBy the end of 2005, approximately 80 percent of Skanska’s 54,000 employees had undergone basic environmental training con-ducted at unit level. In addition, 31,000 supplier and subcontractor employees were either informed or trained in environmental issues. Meanwhile, Skanska has provided advanced in-service training for environmental specialists and other key personnel.
From design to finished productIn cases where a product is designed from a life-cycle perspective, its entire environmental impact can be controlled – from design to completion and its subsequent use. In the U.S. and U.K., LEED
and BREEAM are tools used to evaluate environmental criteria, primarily to assess water consumption, energy efficiency, choice of material and indoor climate. During 2005, they were applied to approximately 115 Skanska projects, primarily in the U.S., the U.K. and Finland, where customers have seen the value-added provided by this investment.
Energy efficiency in buildingsClimate change is probably the greatest global environmental chal-lenge. The construction industry has an important contribution to make in addressing this since a considerable share of the world’s total energy use is related to buildings. Skanska can help reduce emissions of greenhouse gases mainly by persuading customers to improve the efficiency of energy use in buildings. The priorities are heating, air conditioning and electricity use. The user phase is responsible for approximately 85 percent of a building’s total energy consumption during its life cycle. The remaining share is connected to materials and building construction.
Focus on construction materialsReducing the use of hazardous substances is necessary for both environmental reasons and to ensure work site safety and health. It also has a positive influence on the final product and avoids the generation of hazardous waste. The handling of chemicals is often

Skanska Annual Report 2005 41Sustainable development
Sust
ain
able
dev
elo
pm
entSkanska’s FDR Drive Rehabilitation Project, which extends along the East River in the New York City borough of Manhattan, must adhere to the rule “no noise at night, no tak-
ing out lanes during the daytime.” As is the case for many large or sensitive projects within Skanska, a special community liaison officer has been linked to the FDR Drive project to manage contacts and encourage dialogue with local constituents and residents.
regulated in detail through national legislation. Many Skanska business units go beyond these regulation and other demands by developing their own programs for phasing out hazardous sub-stances, despite the fact that they are still permitted in the market. There are more than 3,900 chemical products with accom-panying safety data sheets listed on one of Skanska’s databases. To date, more than 10,900 chemical products and 2,900 construction materials have been assessed at Skanska for their environnmen-tal and health impacts. This can be compared to approximately 10,300 products and 1,500 construction material evaluations up to the end of 2004.
Noise, dust and other local impactsConstruction activities can cause local environmental impacts, such as noise and dust from transporting materials to and from the site. Carefully designed measures reduce local impacts, espe-cially with regard to residents near the site.
BiodiversityMost projects are carried out in already exploited urban areas. This is why Skanska focuses on indirect impacts on biodiversity that occur through its supply chain. Responsible procurement of wood products contributes to the protection of biodiversity. Avoiding wood products from illegally harvested timber and actively seeking FSC-certified products are shared priorities in this strategy.
Monitoring and reportingSkanska’s global operations are certified/registered according to ISO 14001. Each business unit is responsible for ensuring that on-site work in their projects is monitored. Follow-ups are further
supported by a reporting system at the corporate level. A large number of internal environmental audits are conducted and their results are addressed through management reviews. These inter-nal audits are also supported by external audits. During 2005 one major non-conformity was reported. The incident involved an under-sized, temporary sewage treatment system that was imme-diately remedied once identified.
Environmental training at Skanska, number of employees 2005 2004 2003 2002 2001
Specialist trainingg 6,748 2,936 2,689 2,730 1,254
Auditor training 255 122 261 318 393
Number of materials evaluated 2005 2004 2003 2002 2001
Chemical products 10,909 10,299 8,693 7,588 4,749
Construction
materials 2,938 1,543 1,783 1,402 -
Environmental audits 2005 2004 2003 2002 2001
Internal 1,146 1,282 1,568 1,753 1,431
External 191 241 143 204 185
Energy use in Skanska Commercial Development Nordic’s properties 2005 2004 2003 2002 2001
kWh/m2 100 100 118 131 143
Kg CO2/m2 8.6 10.4 11.8 12.9 14.6

42 Skanska Annual Report 2005Sustainable development
Social responsibility
As an international company with a number of home markets, Skanska has a key role in promoting local and global improvements in such areas as working environment, quality and business ethics.
Sust
ain
able
dev
elo
pm
ent
In order to credibly assume social responsibility, Skanska has introduced a number of policies and rules to guide employees in their day-to-day work. This creates clarity and trust in both inter-nal and external relations. Attaining and maintaining a leading market position is entirely dependent on the Group’s employees: on making sure that they know what they should do, possess the proper skills for their work and feel a sense of participation and dedication. Skanska is an international company and its work force reflects this. Diversity is an asset, ensuring a richer variety of talents, backgrounds and perspectives.
EmployeesAs the needs of customers increase and change, greater demands are being placed on Skanska. The organization must be adaptable to every situation. This requires a great deal from employees, who must be knowledgeable as well as flexible in order to live up to new demands. The Company must become better at hiring both high-level managers and knowledgeable skilled workers. Such measures as job rotation, employee surveys and leadership train-ing at all levels are key elements in the Company’s strategic talent management. Increased customer satisfaction, improved produc-tivity and cost-effectiveness will also be important factors when Skanska crafts future leadership programs. At the same time, Skanska is putting large resources into the in-service training of our largest knowledge bank – the skilled workers who account for 62 percent of all employees. The construction industry is traditionally male-dominated. Today eleven percent of Skanska employees are women, most of them in white collar positions. Female representation in manage-ment positions remains low, although it rose from six to seven percent between 2004 and 2005. This increase is a positive sign that efforts to heighten the focus on equal opportunity programs in Skanska’s business units are paying off. However, Skanska needs to recruit more diversity at all levels, especially in line positions.
The key to this is to generate more interest among individuals in the target groups for activities such as project operations, which lay the groundwork for career advancement.
Absence due to illnessReducing absences due to illness (sick leave) is an important goal if the Company is to be sustainable in the long term. There are large differences between geographic regions in the reasons for sick leave. These problems must consequently be dealt with in somewhat different ways within the Group. In Skanska’s Swedish units, overall sick leave fell from 4.9 percent in 2004 to 4.5 percent in 2005. The decline between 2003 and 2004 was 0.2 percentage points. This favorable trend is partly an effect of various steps that Skanska has taken. The most important is increased involvement during the period of illness through regular contact, personal dia-logue and positive rehabilitative efforts. Skanska also encourages employees to work proactively with their health through various forms of exercise.
Health and safetyAccidents do not happen, they are caused – Skanska’s vision is to create a working environment without work site accidents. By adopting this approach, occupational safety and health issues become a clear priority. Skanska’s health and safety strategy is based on the Code of Conduct and OHSAS 18001 international management guidelines. Close to 70 percent of Skanska’s 54,000 employees underwent basic job health and safety training and some 20,500 employees underwent some type of further training in this field during 2005. Fifty-seven percent of Skanska’s employees are currently included in third party certified/registered occupational health and safety management programs as in accordance with OHSAS 18001. Projects emphasize the importance of identifying site-spe-
More women are needed at all levels in the Company, especially in line positions.
Female employees1
% by job category 2005 2004
Skilled workers 3 4
White collar employees 23 22
Skanska AB Board2 22 22
Managerial positions 7 6
Total employees 11 11
1 These employee figures are based on annual averages and may differ somewhat from the figures from the
end of 2004 presented in last year’s Sustainability Report.
2 Refers to members elected by the Annual Meeting. If employee representatives are included, women account
for 27 (20) percent.

Skanska Annual Report 2005 43Sustainable development
Sust
ain
able
dev
elo
pm
ent
Skanska’s 2005 Safety WeekFollowing up its successful Safety Day in 2004, Skanska carried out a Safety Week in October 2005 on a Groupwide basis. Training and communication increased awareness of how important it is to prioritize safety.
7,000,000work hours
= 6accidents
cific risks. A list of mandatory personal protection equipment and safety routines is posted at all construction sites, and occupational safety instructions are distributed to all personnel. Monitoring and internal audits are priority areas. Targets and their implementation are evaluated by the business units and their boards of directors. The Group’s incentive systems are tied, among other things, to reducing the number of work site accidents. Unfortunately, eight Skanska employees and five sub-contractor employees lost their lives during 2005 due to work site-related accidents. This underscores the importance of further improvements in the fields of safety and working environment.
Business ethicsSkanska manages its work with business ethics through the Code of Conduct and the principles of the World Economic Forum’s Partnership Against Corruption Initiative and the UN Global Compact. Employees gain insights into the principles of busi-ness ethics by undergoing training programs based on various dilemmas that individuals may encounter in everyday job-related situations. Working against corruption is a key imperative for construction industry members and stakeholders alike. In 2005, Skanska continued to be active in promoting the anti-corruption principles it launched together with 19 other companies at the World Economic Forum.
Skanska in the communityThrough engagement in various local and global community activities, Skanska gains insight into various stakeholders’ work with general and specific sustainability-related issues. In these forums, Skanska also has the opportunity to both communicate its own way of working and strengthen relationships with various
More women are needed at all levels in the Company, especially in line positions.
cultures, traditions and stakeholders. This also increases constitu-ents’ understanding of Skanska’s operations. Corporate citizenship programs are primarily conducted at the local level, where the need for Skanska’s expertise is most in demand. Local social issues are particularly relevant in Latin America. Skanska Latin America has therefore attained certification/regis-tration according to Social Accountability 8000, a voluntary stan-dard for managing social issues.
By providing financial, human and other resources, Skanska participated in 2005 in a range of activities including:• ISO 26000 Guidance on Social Responsibility• Establishment of the Swedish chapter of Transparency
International• The UN Global Compact Nordic Network• The World Business Council for Sustainable Development
Quality and researchQuality is ensured among other means through the international quality standard ISO 9001: 72 percent of Skanska’s operations are certified and registered, an increase from 65 percent in 2004. Focus areas include design, moisture and mold, as well as project management. Research and development comprise about 0.4 per-cent of Skanska’s sales. In addition to approximately 50 employees who have already earned doctorates, Skanska has access to six employees with the rank of professor and some 15 doctoral stu-dents. Their efforts are channeled into projects both via external networks and internal Best Practice Groups.
Economic progressSkanska’s operations have a positive economic impact and provide tangible assets to society.Skanska has many roles in society – for example as a taxpayer, an employer and a creator of infrastructure and buildings. Skanska also contributes to society by serving as an eco-nomic engine. For example, new types of public-private partner-ship projects are becoming increasingly common in a number of Skanska’s markets. Skanska Infrastructure Development is the Group’s business unit that invests in and develops social and physi-cal infrastructure such as hospitals, schools and highways.
Skanska donated a total of USD 1,000,000 for emergency relief efforts fol-lowing the December 2004 tsunami in South East Asia, Hurricane Katrina in September, and the Pakistan/India earthquake in October, 2005. Half of these donations were channeled through SOS Barnbyar, the Swedish chapter of SOS-Kinderdorf International.
�����������������������������������������������������������������������������������������������������������������������������������������������������������
�
�
��
���
���
��������� �������� �������� �������� �������� �������� �������� �������� �������� ���������������� ������ ��������� �������� ������� ������ ��� ����� ����� ������� � � � � � ����� � ��������� ������ �������
������������������������������������
����������������������������
���������������������������������������������������������������������������������������������������������������������������������������������������������������
�
�
��
���
���
��������� �������� �������� �������� �������� �������� �������� �������� �������� ��������������� ������� �������� �������� ������� ������ ��� ����� ����� ������� � � � � � ����� � ��������� ������ �������
�������������������������������������
������������������
������������������������������������

44 Skanska Annual Report 2005
During 2005, Group-level evaluation of senior managers at Skanska encompassed 720 people, an 8 percent increase on the previous year. However, the main thing is not the number of man-agers assessed at Group level. Of greater importance is spending more time and effort on each individual, both to see where he or she fits best into Skanska and to clarify how Skanska can best contribute to the person’s professional development.
Meanwhile Skanska’s business units have established their own leadership reviews, based on corresponding criteria and administered through an IT-based system. During 2005, these reviews encompassed about 4,800 people. The various business units are continuously including additional people in the evalua-tion system. Taken together, this provides a better overview of the supply of future leadership talent.
During 2005, all Presidents and Executive Vice Presidents of business units and approximately 100 other senior managers underwent a “360 degree” evaluation based on interviews with the individual’s supervisors, management colleagues and subor-dinates. The aim is to provide an all-round basis for an accurate evaluation. This tool has shown itself to provide valuable feed-back, while serving as a basis for discussion between managers and other employees. The evaluation, combined with various kinds of tests, is also used as one element of Skanska’s talent man-agement program. It contributes to greater self-knowledge and helps participants focus on the portions of the program that are especially important for their development. The 360-degree evalu-ation will also be used as a way to assess the effects of the talent management program on learning and development.
Skanska has continued to work with the IMD executive development program in Switzerland. During 2005, about 50 managers completed their training and more than 70 new ones began an eleven day long program aimed at improving their abil-
ity to manage a company in a changing world. Another increas-ingly important method of executive development at Skanska is job rotation and giving managers responsibility for special assignments. To highlight good examples and stimulate increased exchanges of experience, Skanska runs a yearly internal competi-tion for Project of the Year awards in various categories. In order to draw attention to outstanding management performance as well, in keeping with its “Outperform” strategy, during 2005 Skanska introduced its own Golden Hard Hat Awards. The awards will be given yearly to three project and construction managers who have carried out a multiple projects with well-documented good results according to both financial and qualitative parameters.
Human resource development at business unitsTo meet the need for qualified employees, every Skanska business unit has its own human resource development programs adapted to its specific needs. Each unit provides a choice of programs aimed at broadening knowledge at all levels. There are also large-scale exchanges of experience between business units in order to learn and benefit from each others’ ideas and programs.
In Poland, a Skanska University has been established to bring together 40 different Skanska companies with varying cul-tures and disciplines. The aim is to create a common knowledge and skills base, as well as a uniform organizational culture consis-tent with Skanska’s philosophy.
Skanska USA Civil, with its geographically far-flung opera-tions, has created programs that focus on increased basic knowl-edge for new employees. Other programs are adapted to employ-ees who have leadership potential and two to seven years of expe-rience. They are trained in leadership, communications, financing and customer relations. The programs at the highest level are for managers with seven to 15 years of experience, who are trained in such areas as strategy, business development, tender negotiation, scheduling work and cost control.
During 2005, Skanska Norway built up a mentor program aimed at motivating participants for future leadership tasks while helping to develop a strong, positive Skanska culture.
Skanska Sweden started a new Skanska Strategic Program (SSP). This program is based on strategic leadership work and how to control operations through a management team. It is mainly intended for district and staff managers.
During 2005, Skanska Finland focused on building up a trainee program. Its goal is to identify suitable new project man-agers and enhance Skanska’s reputation and attractiveness as an employer.
Skanska UK offers training programs that encompass all cat-egories from newly hired employees to top managers. The results are reported with the help of a balanced scorecard system, where different units report their training progress monthly.
Since 2003, Skanska Latin America has run an annual man-agement program for “young talents” from the whole region,
Management development
Development of future managers is a high priority throughout Skanska. Pursued at Group level and in each business unit, this task is adapted to the specific needs of both individuals and units, with a special focus on compensation and gender equality issues.
Man
agem
ent
dev
elo
pm
ent
Management development
Skanska’s new Golden Hard Hat Award will be given yearly to successful project managers and builders. Kari Nuora of Skanska Finland, Dave Murawski of Koch Skanska and Lars Henriksson of Residential Development Nordic were the first to win the award for their long track records of well-executed projects.

Skanska Annual Report 2005 45
In Hammarby Sjöstad, a waterfront redevelopment area near central Stockholm, Skanska is building 216 apartments for the SKB residential cooperative organization and Sjöstadsskolan for the City of Stockholm’s school building company. Both projects will be completed during 2006.
Man
agem
ent
dev
elo
pm
ent
Management development
focusing on leadership, strategic analysis, project management and deeper understanding of Skanska’s values and culture.
More women at all levelsTo meet the Company’s gender equality targets and achieve a better gender balance, Skanska needs more women at all levels, especially in line positions. A company that better reflects the population structure of the surrounding community gains a broader perspec-tive and is thus more competitive. A number of highly capable women are working at project manager level. However, the propor-tion of women in management is still very low, though it rose from six to seven percent between 2004 and 2005.
Performance-based compensation Skanska has designed an incentive structure that supports the Company’s project-focused working method and its explicit ambi-tion to operate in a socially responsible way, as well as its desire to develop, challenge and retain highly skilled managers and employ-
ees. Their performance is measured on the basis of these factors, and the result is used to finally establish the variable portion of Skanska manager salaries.
As one element in the compensation system, Skanska’s 2005 Annual Meeting approved a proposal from the Skanska Board of Directors to create a new Share Award Plan for the Company’s 300 most senior executives. The program has a clear share-owner-ship focus and strong incentives for social responsibility, with an emphasis on environmental considerations, sound business ethics and a safe working environment. Management development tar-gets are also incorporated into the program. Allocation of shares in this program only occurs if Skanska’s Outperform targets were achieved in the previous year.
Pension issues have become a greater focus of attention both at Skanska and elsewhere. For this reason, the Board has chosen to create a formal structure surrounding the management of the Group’s pension plans. During 2005 Skanska thus introduced a global pension policy and established a Group pension committee.

46 Skanska Annual Report 2005Risk management
Risk management
Projects are Skanska’s primary source of revenue. The Company’s profitability is dependent on the earnings of individual projects. Unforeseen risks can cause losses. One characteristic of the con-struction business is that risks and opportunities are not always symmetrical. A well-executed project can mean that the gross mar-gin in the project may increase by a couple of percentage points. A large loss-making project, however, may result in a considerably larger downturn in earnings.
A loss-making project not only results in the absence of profit; it also consumes disproportionately much executive time, while the project is unable to cover its own administrative expenses. Given the traditionally low margins in the business, several profit-able projects are thus needed in order to offset a single loss-mak-ing project.
In the construction business, operational risks are substantially higher than financial risks. The Company’s ability to foresee and manage business risks is crucial in achieving good earnings.
Uniform risk management modelTo ensure a systematic and uniform assessment of construction projects, Skanska uses its Operational Risk Assessment (ORA) system for identifying and managing potential risks throughout the Group.
With the help of ORA, Skanska evaluates larger, more risk-exposed construction projects continuously, from tender prepara-tion to completion of the assignment, with regard to technical, legal and financial risks. It also analyzes a number of general “public exposure” issues – among them ethical, social and environ-mental aspects – in conjunction with planned projects.
Analyses of earlier loss-making projects indicate that such factors as improper choices related to project management and geographic location are often behind poor outcomes. Experience also shows that initial profitability problems tend to worsen rather than to ease over time. The ORA process means that the prepara-tion of tenders is systematized. Possible new projects are analyzed
in light of the core strengths of business operationss in terms of expertise, geographic market, contract types and contract size, as well as available project capacity. A survey of this core competence has been made for each unit. Potential projects must match the established expertise profile of a unit.
After completing a risk assessment, based on size and other fac-tors, the Senior Executive Team decides, in consultation with the local management, whether a tender should be submitted and how the identified risks can be limited by means of specific measures.
Skanska’s risk management model does not imply avoidance of all risks, but instead aims at identifying, managing and pricing these risks. The support unit Skanska Project Support provides business units and the Senior Executive Team with back-up in the analysis, planning, follow-up and implementation of major civil construction projects. In the early stages, for example, Skanska Project Support can make its own calculations to verify assump-tions in tender calculations compiled by the various local units. Skanska Financial Services evaluates financial risks related to cash flows, customers, subcontractors and joint venture partners.
Fewer loss-making projectsIn all types of major projects that continue over a long period, Skanska conducts regular follow-up of its risk assessment. In addition, the Senior Executive Team carries out quarterly reviews of a number of projects, equivalent to about one third of total construction volume. Since systematic risk management work was introduced in 2002, the number of new loss-making projects has declined.
Material price and similar risksIn Skanska’s operations there are many different types of contrac-tual mechanisms. The degree of risk associated with the prices of goods and services varies greatly, depending on the contract type. In cases where Skanska works on a cost-plus basis, any price increases are passed directly to the customer. However, in assign-
The construction business is largely about risk management. Practically every project is unique. Size, shape, environment – everything varies for each new assignment. The construction industry differs in this way from a typical manufacturing company that has permanent facilities.
Ris
k m
anag
emen
t
APPROVALCONDITIONS
PROACTIVEDECISION
SETBusiness units
Board of DirectorsSET
Business units
SETBusiness units
POTENTIALPROJECTS
YES, MITIGATE RISK, DEVELOPMENT TENDER
NO, STOP
FOLLOW UP ONRISK MITIGATION
IDENTIFYINGOPPORTUNIES
Is this project in linewith core strengths ?
– customer – contract size
– geography– project type
SENIOR MANAGEMENT (SET)REVIEW AND APPROVAL
SUBMISSIONOF TENDER
Board of DirectorsSET
Business units
OPERATIONAL RISK ASSESSMENT

Skanska Annual Report 2005 47Risk management
ments for public sector customers, Skanska often has fixed-price contracts. Because projects often continue over long periods, conditions may change. Even if there are sharp price increases on materials or wages, for example, a fixed tender price applies in principle. Certain contracts contain indexing clauses that allow an upward revision of the contract value, equivalent to price increas-es. But in some geographic markets, there is no such tradition; instead the contractor is bound by the quoted price even if costs increase. To protect itself against such risks, to the greatest pos-sible extent Skanska endeavors to procure materials and approved subcontractors as soon as this is feasible after signing a contract. In most cases, finished agreements are in place as early as the tender-ing phase and are conditional on Skanska signing a contract with its customer in turn. For some materials such as reinforcement steel, possible savings are limited because Skanska cannot take one-time physical delivery of the quantity required for a project. In such cases, Skanska must expect certain price increases and factor these assumptions into its tender price.
Foreign exchange risksProject revenues and costs are normally denominated in the same currency, and transaction risks from exchanges between different currencies are thus very limited. Known and budgeted financial flows are hedged. The foreign exchange risk that arises because portions of the Group’s equity are invested long-term in foreign subsidiaries – translation exposure – is not hedged. Investments in development business streams are hedged, since the intention is to sell these assets over time.
A group of Skanska Norway residential builders planning a new project in Oslo. From the left: Kristian Andresen, Lise Bergflødt, Tor Aksel Bjørnsen and Svein Nilsebakken
Impact on the Group of a change in SEK against all currencies and a change in USD against SEK, based on 2005 accounts. Of which +/– 10% USD+/– 10%
Revenue +/–9,633 +/– 4,294
Operating income +/– 235 +/–28
Equity +/– 963 +/– 379
The sensitivity analysis above shows in SEK M the Group’s sensitivity to a 10 percent unilateral change in SEK against all currencies and a 10 percent unilateral change in USD against SEK.
Interest rate risksInterest rate risk is the impact on earnings arising from a change in interest rate. Interest-bearing assets exceed interest-bearing liabilities. This means that net financial items are favorably affect-ed by in increase in interest rate. At year-end 2005, the average interest refixing period for interest-bearing assets, SEK 17.0 bil-lion, was 0.1 (0.2) years and on interest-bearing liabilities, SEK 4.2 billion, it was 1.0 (1.3) years. The size of Skanska’s interest-bearing pension liability, SEK 2.4 billion (1.0) is largely connected to the interest rate on long-term central government debt. An increase or decrease in long-term interest rates leads to an increase or decrease in pension liability. Such changes are recognized directly in the equity of the Group (see Note 29).
Interest-bearing liabilities and assets SEK bn Dec. 31, 2005 Dec. 31, 2004
Interest-bearing gross liabilities –5.9 –5.2
Liquid assets and interest- bearing receivables 17.0 12.4
Interest-bearing net receivable/debt 11.1 7.2
Refinancing risks and liquidityRefinancing risk is the risk caused by lack of liquidity or by diffi-culty in obtaining or rolling over external loans. At year-end 2005, the Group’s unutilized credit facilities totaled SEK 6.1 billion (5.6) and the average maturity of the borrowing portfolio was 2.7 (3.0) years.
Ris
k m
anag
emen
t
��������������
�������������������������������������������������������������������
�������������
���������������������
�����������������������������
�����������������������������������������������������������
������������
����������������������������������������������������������������������
������������������
��������������������������������������������������������������������
������������������

48 Skanska Annual Report 2005Share data
Shar
e d
ata
Transfers of capital to Skanska’s shareholders Total 2006 2005 2004 2003 2002
Regular dividend per share, SEK 4.501 4.00 3.00 2.00 3.00
Extra dividend, SEK 2.001 - - - -Total dividend, SEK 6.50 4.00 3.00 2.00 3.00Total, SEK billion 7.8 2.7 1.7 1.3 0.8 1.3
1 Proposed by the Board of Directors
Shares by category on December 31, 2005
Category No. of shares % of capital % of votes
A 22,554,063 5.4 36.3
B 395,999,009 94.6 63.7
Total 418,553,072 100 100
Share data• Skanska’s market capitalization totaled SEK 33.4 billion at the end of 2005.
• Skanska’s share price rose by 52 percent to SEK 121.00 during the year.
• Average volume per trading day rose by 14 percent to 1,917,123 shares.
• The proposed dividend for 2005 is SEK 4.50 plus an extra dividend of SEK 2.00 per share.
Skanska share history 2005 2004 2003 2002 2001
Year-end market price, SEK 121.00 79.75 63.50 51.00 68.50
Year-end market capitalization,
SEK bn 50.6 33.4 26.6 21.3 28.7
Average shares for the year, million 418.6 418.6 418.6 418.6 420.0
Shares outstanding at year-end, million 418.6 418.6 418.6 418.6 418.6
Highest share price during the year, SEK 125.5 83.75 65.00 83.50 106.40
Lowest share price during the year, SEK 79.0 57.50 38.10 41.20 57.00
Yield, percent1 5.42 5.02 4.7 3.9 4.4
1 Dividend as a percentage of respective year-end share price.2 Based on the dividend proposed by the Board of Directors.
Changes in shares outstanding (millions) and capital stock Par value Shares- of capital Stock New share out stockYear and event Reduction dividend issue standing SEK M
1991 1:1 – 63.0 – 125.9 1,259.2
1994 conv. – – – 125.9 1,259.2
1997 redemption 1:10 –12.0 – – 113.9 1,366.3
2001 cancellation of
repurchased shares –9.2 – – 104.7 1,255.7
2001 split 4:1 – 314.0 – 418.6 1,255.7
The largest shareholders in Skanska AB, holdings on December 31, 2005
Series A Series B % of % ofShareholders shares shares capital stock votes
AMF Pension and AMF Pension Funds 0 32,775 500 7.8 5.3
Industrivärden (investment company) 15,000,000 17,300,000 7.7 26.9
Robur mutual funds 0 14,571,016 3.5 2.3
SHB/SPP mutual funds 0 11,279,724 2.7 1.8
Alecta (retirement insurance) 0 7,850,000 1.9 1.3
State of New Jersey Pension Fund 0 6,800,000 1.6 1.1
Nordea mutual funds 0 6,524,489 1.6 1.0
SEB mutual funds 0 6,471,910 1.5 1.0
Second Swedish National Pension Fund 0 5,721,265 1.4 0.9
Svenska Handelsbanken (SHB) 2,000,000 3,453,288 1.3 3.8
10 largest shareholders 17,000,000 112,747,192 31.0 45.5Other shareholders in Sweden 5,467,515 177,418,780 43.7 37.3
Other shareholders abroad 86,548 105,833 037 25.3 17.2
Total 22,554,063 395,999,009 100.0 100.0Source: SIS Ägarservice.
Skanska’s Series B shares are quoted on the A list of Stockholms-börsen (the Stockholm Stock Exchange) under the SKAb symbol in round lots of 200 shares. Current price information is available on Skanska’s website, www.skanska.com (click on “Investors”), in the Reuter system under the SKAb.ST symbol and in the Bloom-berg system under the SKAB SS symbol. At the end of 2005, there were a total of 418,553,072 shares outstanding, with a par value of SEK 3 per share. Of the shares outstanding, 22,554,063 were Series A shares with 10 votes apiece and 395,999,009 were Series B shares with one vote apiece. Of the shares in circulation, Series B shares accounted for 94.6 percent of capital stock and 63.7 percent of vot-
ing power. The number of Skanska shares traded on Stockholms-börsen in 2005 totaled 485,032,158 (426,843,443), at a value of SEK 46.2 billion (28.8). The average volume per trading day amounted to 1,917, 123, an increase of 14 percent from the average volume of 1,687,128 shares during 2004. Trading volume during 2005 was equivalent to 122 (109) percent of all Series B shares outstanding at the end of the year.
Share performanceDuring 2005 the market price climbed by 52 percent to SEK 121.00 per share as the final price paid for the year. The overall market capitalization of Skanska thus rose during the year to SEK 50.6 bil-lion. The highest price paid for a Skanska share was SEK 125.50 on November 23. The lowest price paid was SEK 79.00 on January 25, February 18 and February 21. The all share index – formerly called SAX, now OMX Stockholm_PI (OMXSPI) – rose by 32.6 percent. The Dow Jones Titans Construction Index, which includes Skanska, rose by 15.0 percent. Skanska’s Series B shares are also included in the Dow Jones Sustainability Index and the Dow Jones Stoxx 600.
Ownership changesAt the close of 2005, the number of shareholders totaled 85,438 (80,685). The proportion of capital stock owned by Swedish share-
������������������������������������������������������������
���������������������������������������������������������������������������������������������������������������������������������������������������������������
����������������������������������������������
����������������������������������������������������������������������������������������������������������������������������������������������������������������������
���������������������������������������������������
��������������
������������������������������������������������

Skanska Annual Report 2005 49Share data
Major listed construction companies
Income Absolute Total Total Market after financial Return on return return return capitalization, Net sales, items, Return capital 2005, % 2005, % 2001-2005, % SEK bn SEK bn1 SEK bn1 on equity, %1 employed, %1
AMEC (United Kingdom) 16 21 18 15.6 62.6 1.2 8.2 10.8
ACS (Spain) 62 65 252 90.2 100.1 6.1 21.9 13.7
Balfour Beatty Plc (United Kingdom) 13 16 205 54,921.9 47.1 2.0 49.2 10.7
Bilfinger & Berger (Germany) 33 38 221 13.9 49.6 0.8 4.6 4.1
FCC (Spain) 35 40 167 58.7 57.4 4.9 19.0 15.7
Ferrovial (Spain) 49 51 368 77.1 66.3 6.4 24.7 6.8
Fluor Corp. (United States) 42 47 153 53.2 68.9 1.9 14.0 16.7
Hochtief (Germany) 58 62 113 24.9 109.0 1.7 2.7 4.1
NCC (Sweden) 64 87 187 15.5 45.4 0.8 12.7 9.0
Royal BAM Group (Netherlands) 92 98 159 16.3 57.9 1.0 13.0 13.8
Skanska (Sweden) 52 59 54 50.6 121.3 4.3 20.6 19.9VINCI (France) 47 51 157 134.0 178.2 11.2 23.2 9.8
1 All figures are from 2004.According to Reuters Company Views
holders declined during the year from 73.5 percent to 73.1 percent, and their share of voting power from 83.5 percent to 81.7 percent. Of foreign shareholders, U.S. residents made up the largest group, with about 58 million shares representing some 14 percent of capital stock. Of Swedish shareholders, institutional owners accounted for 53 percent, while 25 percent was owned directly by individuals. As the table on page 48 indicates, AMF Pension together with AMF Pension Funds hold the largest proportion of capital stock, 7.8 per-cent. AB Industrivärden has the most votes, with 26.9 percent of total voting power. The “free float” in Skanska’s shares is regarded as making up 100 percent of the number of Series B shares out-standing. Dividend policyFuture earnings are expected to support growth in operations as well as growth in the regular dividend. It is expected that the pay-out ratio can be at least 50 percent.
DividendThe Board of Directors proposes a dividend of SEK 4.50 (4.00) per share plus an extra dividend of SEK 2.00 per share, for a total pay-out of SEK 2,721 M (1,674).
Total returnThe total return on a share is calculated as the change in share price, together with the value of dividends. During 2005, the total return on a Skanska share amounted to 59 percent. Stockholms-börsen’s SIX Return Index rose by 36 percent during the year. Dur-ing the five-year period January 1, 2001 to December 31, 2005, the total return on a Skanska share amounted to 54 percent. During the same period, the SIX Return Index rose by 21 percent.
New share issue and repurchaseThe 2005 Annual Shareholders’ Meeting approved a Share Award Plan covering the 300 highest executives in the Group. In Decem-ber 2005, Skanska’s Board of Directors approved an issue and a repurchase offer for 4,500,000 new Series D shares for the purpose of ensuring delivery of Series B shares to the above share incen-tive program. All Series D shares were issued in January 2005 to Nordinvest AB, a wholly owned subsidiary of AB Industrivärden. Later the same month, Skanska carried out a repurchase of the same shares. The purpose of the repurchase is to convert Series D shares to Series B shares as needed for delivery in accordance with the Share Award Plan and to cover administrative expenses, social insurance contributions and corresponding taxes that may arise due to the Plan. After the repurchase, Skanska holds 4,500,000 of its own Series D shares.
Shar
e d
ata
�������
�������
�������
�������
������
������
������
������
������
������
������
������
������������������
���� ���� ���� ���� ���� ����
���������
����������������
�������������������������������
����������������������������������������������������������
�������
�������������������������������������������������������������
�������
�������
�������
�������
������
������
������
������
������
������
������
������
������������������
���� ���� ���� ���� ���� ����
���������
����������������
����������������������
�����������������������������������������������������������������������������
�������
���������������������������������������������������������������
���
��
40
60
80
100
120
140
160
2001 2002 2003 2004 2005 2006
Skanska B SIX Return Index (c) SIX
Totalavkastning i Skanska-aktien jämfört med SIX Return Index (avkastningsindex) 1 januari 2001–24 februari 2006
40
60
80
100
120
140
160
2001 2002 2003 2004 2005 2006
Skanska B SIX Return Index (c) SIX
Total return of Skanska shares compared to the SIX Return Index, January 1, 2001–February 24, 2006
SEK
Kr

50 Report of the Directors Skanska Annual Report 2005
Rep
ort
of
the
Dir
ecto
rs
Report of the Directors
The Board of Directors and the President of Skanska AB hereby submit their report on the operations of both the Company and the Group in 2005. The Group’s operations continued to per-form favorably during the year. Construction operations showed improved margins. Resi-dential Project Development operations showed improved margins on higher sales vol-ume and showed a return on capital employed of nearly 24 percent. The Group also made good capital gains on divestments of fully developed properties in Commercial Project Development. The process of creating a more focused structure continued during the year. Residen-tial Project Development in the Nordic coun-tries was gathered into a common organiza-tion. The new unit, Residential Development Nordic, embraces all residential project devel-opment in Sweden, Finland, Denmark and Norway. This new organization will enable the Group to make better use of its collective expertise for coordinated development of these operations. Privately financed infrastructure is an important and growing part of Skanska’s core business. There is a continued growth of inter-est in public-private partnership solutions in the Group’s home markets. The task of streamlining Groupwide pro-cesses is continuing. One important part of this task is to streamline purchasing opera-tions. About 70 percent of costs in Construc-tion operations consist of purchases of goods and services, which implies that more efficient purchasing operations offer significant savings potential.
MarketThe market situation was stable in most of the Group’s home markets. In commercial and industrial construction, the market stabilized. The market for con-struction of commercial buildings in the Unit-ed States was good in the healthcare and edu-cational sectors. In the United Kingdom, the volume of public-private partnership (PPP) projects remains large. In other segments of importance to Skanska, British construction volume was low. Construction investments in the Czech Republic rose after a first half with-out growth. The trend of commercial building construction in the Nordic countries was cau-tiously positive, which was also true of the Polish market.
The trend of the Norwegian civil construction market remained positive, driven by projects for the oil industry as well as infrastructure investments in highways. In Finland, civil con-struction increased. The Czech Republic and Poland showed continued growth, among other things due to EU membership. In Swe-den, the civil construction market was cau-tiously awaiting the government’s promised infrastructure investments. Civil construction in the U.S. remained at a low level. There was keen competition for projects. In Latin Ameri-ca, the market for electrical power projects and projects in the oil and gas industries was good. Residential construction remained at a high level in Finland and Norway. In the Czech Republic, the housing market began to show signs of oversupply. In Sweden, residential construction rose. The often lengthy planning process remained a constraining factor in a number of markets. Vacancy rates in the Scandinavian and Central European office markets declined somewhat during the year. Leasing activity rose, and both in Scandinavia and in Central Europe there is continued good demand from the investment market for properties with effi-cient space in the right locations.
Order bookingsThe Group’s order bookings declined by 4 percent to SEK 117,097 M (121,903). Exclud-ing currency rate effects of SEK 3,285 M, the decline amounted to 7 percent. During the comparative year, order bookings were includ-ed until the respective divestment date of the businesses that were sold. The currency rate effect was attributable to the weakening of the
Swedish krona against virtually all other cur-rencies during the year. Order bookings in continuing operations amounted to SEK 116,562 M (116,615), including positive currency rate effects of SEK 3,285 M. Excluding currency rate effects, the decline was 3 percent. Order bookings rose in Norwegian, Danish, Finnish, Polish and Brit-ish construction operations and in Skanska USA Civil, while other construction opera-tions declined or showed largely unchanged order bookings compared to the previous year. Among major orders received was an assignment to plan, design and extend the M1 motorway in the United Kingdom, with Skans-ka’s share amounting to SEK 1.3 billion. Skanska also signed an eight-year partnering agreement related to replacement of the net-work of gas distribution mains in north Lon-don. Skanska’s total commitment over an eight-year period is valued at SEK 2.6 billion. In Scotland, Skanska received a contract to modernize two prisons, an assignment worth SEK 740 M. Skanska Czech Republic received two large railroad contracts worth a total of about SEK 1 billion. In Norway, Skanska was award-ed an order worth SEK 600 M to construct, modernize and operate Norway’s first two schools built in a public-private partnership, as well as a SEK 660 M contract for a sunken tunnel in Oslo. In Sweden, Skanska received an assignment valued at nearly SEK 1 billion for an expansion of the Forum Nacka shopping mall outside Stockholm. In Brazil, Skanska signed a contract related to the construction of a coking unit at an oil refinery worth about SEK 1 billion. During the year, Skanska received a num-ber of large assignments in its American civil construction business, Skanska USA Civil. These included a contract to design and build twin high-level bridges over Escambia Bay in Pensacola, Florida. Skanska’s portion of the contract totals about SEK 1 billion. The same unit also landed major contracts in the New York City area. Skanska USA Building was named construction manager for the expansion and renovation of a medical center in San Jose, California, with a contract value of SEK 540 M. Other large construction management assign-ments included a new headquarters for Verizon Communications, with a contract value of more than SEK 700 M.
������������������������������������������������
������
�������������������������������������������������������������
�������
�������������������������������������������������
�
��
��
��
���
���
���
�
��
��
��
���
���
���
�������������������������������������������������
������
������������������������������������������������������������������������������
�����
�����
�����
�����
�����
�����
�����
�����
�
��
��
��
���
���
���
�
��
��
��
���
���
���

Skanska Annual Report 2005 Report of the Directors 51
Rep
ort
of
the
Dir
ecto
rs
An increasingly attractive form of procure-ment is public-private partnerships, for which a number of large contracts were signed during 2005. Together with a consortium partner, Skanska signed a contract to finance, design, construct and manage the facilities at three hospitals in Nottinghamshire, United King-dom in that country’s Private Finance Initiative sector. These contracts mean that Skanska is committed to investing about SEK 200 M in the consortium that owns the project. The concession period is 32 years. The agreement includes a construction contract worth about SEK 4 billion plus maintenance contracts worth about SEK 40 M per year covering the construction and concession periods. The A1 highway in Poland is another proj-ect being carried out in a public-private part-nership. Skanska is leading the consortium that has signed the concession agreement, which runs until 2039, with full responsibility for financing, constructing and operating a 90 km (56 mi.) long stretch of highway. Skanska’s share in the ownership consortium is 30 per-cent, and Skanska’s investment in the project totals about SEK 94 M. Skanska Poland is lead-ing the joint venture that will perform the con-struction assignment, in which Skanska’s share of the contract is some SEK 3.7 billion.
Skanska is also part of a consortium that has been chosen to build a portion of the E18 highway in Finland. The project consists of about 51 km (32 mi.) of the final construction phase of the highway between Turku and Hel-sinki. This project, too, is being implemented as a public-private partnership. The total proj-ect amount is estimated at SEK 6.5 billion, of which the construction cost will be about SEK 2.8 billion. Payment to the consortium will be based on availability and road safety. The high-way will open for service in November 2008. The contract period is 21 years from the open-ing of the road.
Order backlogAt year-end 2005, the Group had an order backlog of SEK 128,743 M (113,740), equiva-lent to an increase of 13 percent. The increase included positive currency rate effects of SEK 13,624 M, equivalent to 12 percent. In continu-ing operations, order backlog rose by 13 per-cent to SEK 128,572 M (113,498). The curren-cy rate effect totaled 12 percent, equivalent to SEK 13,624 M. U.S., Nordic and other Europe-an operations accounted for 43, 25 and 29 per-cent of order backlog, respectively. The other 3 percent was attributable to Skanska Latin America and Skanska International Units.
Order bookings and backlog
Order bookings Order backlog
SEK M 2005 2004 2005 2004
Sweden 22,087 23,039 16,004 15,485
Norway 11,353 10,195 8,631 7,371
Denmark 3,902 3,518 2,172 2,157
Finland 9,082 7,316 5,879 4,854
Poland 7,625 4,559 7,143 3,844
Czech Republic 8,567 12,910 12,493 13,047
United Kingdom 13,815 10,850 17,412 13,318
USA Building 23,158 29,699 36,663 36,577
USA Civil 13,179 8,242 18,381 12,116
Latin America 3,080 3,924 3,138 2,885
Skanska International Units 705 1,756 656 1,844
Other 9 607 0 0
Total continuingoperations 116,562 116,615 128,572 113,498Discontinued
operations 535 5,288 171 242
Skanska Group 117, 097 121,903 128,743 113,740
RevenueRevenue rose to SEK 124,667 M (121,263), up 3 percent. The increase consisted of positive currency rate effects. In continuing operations, revenue rose by 7 percent to SEK 124,106 M (116,257). Excluding currency rate effects, it rose 4 percent to SEK 120,854 M.
Revenue Jan-Dec Jan-DecSEK M 2005 2004
Revenue
Construction 115,955 107,977
Residential Project Development 6,113 5,814
Commercial Project Development 5,075 5,584
Infrastructure Development 53 33
Central and eliminations –3,090 –3,151
Continuing operations 124,106 116,257
Discontinued operations 561 5,006
Skanska Group 124,667 121,263
Income Gross incomeGross income, SEK 11,265 M (9,557) included income from operating activities as well as capital gains from divestments of commercial
and residential project development proper-ties. It also included impairment losses in project development operations and loss provi-sions in ongoing projects as well as certain restructuring expenses. Selling and administrative expenses fell to SEK 6,686 M (6,951). The action programs that were initiated earlier in order to reduce overhead, as well as divestments of businesses, were factors contributing to the decrease. The gain from divestments of businesses amounted to SEK 184 M (1,587). Skanska’s income from its holdings in joint ventures and associated companies mainly included its share of income from Infrastruc-ture Development operations.
Operating income Jan-dec Jan-decSEK M 2005 2004
Operating incomeConstruction 2,871 1,512
Residential Project Development 611 528
Commercial Project Development 1,740 1,617
Infrastructure Development –9 31
Central –342 –360
Eliminations –73 46
Continuing operations 4,798 3,374Discontinued operations
- operating income 18 –600
- income from divestments 184 1,587
Operating income 5,000 4,361Net interest items 171 –48
Change in market value 19 –
Other financial items –70 14
Net financial items 120 –34Income after financial items 5,120 4,327Taxes –1,230 –1,141
Profit for the year 3,890 3,186
Profit for the year attributable to
Equity holders (shareholders) 3,879 3,173
Minority interest 11 13
Earnings per share for the year 9.27 7.58
Operating incomeOperating income amounted to SEK 5,000 M (4,361), of which continuing operations accounted for SEK 4,798 M (3,374). Operating income in Construction rose to SEK 2,871 M (1,512). The trend of earnings in Construction was positive in most of the Group’s markets, and the overall operating margin reached 2.5 percent for the full year. Sweden, Norway, Latin America and the Unit-ed Kingdom enjoyed good margins. USA Building showed a strong recovery, with a pos-itive operating margin. Skanska USA Civil is unfortunately weighed down by its California operations, Yeager Skanska, where nonrecur-ring expenses plus operating losses totaling SEK 474 M were charged to earnings. Other construction operations showed a stable oper-ating margin, except Denmark and Finland, which reported somewhat lower margins.
�������������������������������������������������������������
���� ���� ���� ����
��
��
���
���
����
��������������������������������
������ �
�
��
��
��
��
��
��
��
��
��
������������������������������������������������������������
���� ���� ���� ����
��
��
���
���
����
������������������������
������ �
�
��
��
��
��
��
��
��
��
��

52 Report of the Directors Skanska Annual Report 2005
Rep
ort
of
the
Dir
ecto
rs
Residential Project Development reported an increase in operating income to SEK 611 M (528). The operating margin in the business stream rose to 10.0 (9.1) percent. The housing market remained strong, and all units except the one in the Czech Republic showed improved operating income. The toughening market situation resulted in somewhat lower operating income in Czech residential opera-tions. Commercial Project Development report-ed higher operating income, SEK 1,740 M (1,617) as a consequence of larger divestments of commercial projects. However, rental income declined as a consequence of the reduction in the property portfolio compared to previously. A number of major fully devel-oped properties were sold. Property divest-ments totaled a sale price of about SEK 4 bil-lion, with capital gains of SEK 1.6 billion. Property divestments occurred at prices aver-aging 11 percent above the appraised market values at the end of 2004. These transactions followed Skanska’s strategy of maintaining high turnover in its real estate portfolio by divesting fully developed properties as well as investing in new development projects. The two properties Atrium Plaza and Atri-um Centrum in central Warsaw were sold dur-ing 2005. Purchase price amounted to SEK 799 M; the gain was SEK 178 M. In the Copenhagen region, Skanska sold the Kalvebod Brygge and Peblingehus proper-ties in Copenhagen as well as Baltorpsvej in Ballerup for a total of SEK 870 M. The capital gain amounted to SEK 225 M. Four properties were sold in the Stockholm region. The pur-chase price was about SEK 1,100 M, with a capital gain of SEK 555 M. Infrastructure Development The Infrastructure Development business stream develops and invests in privately financed projects in cooperation with Skans-ka’s construction units. Infrastructure Devel-opment is part owner of 18 projects, of which 10 are in operation. At year-end 2005, the book value of shares, participations and subordinated receivables in the business stream totaled about SEK 1.9 bil-lion, plus an investment related to the highway concession in Santiago, Chile amounting to SEK 0.5 billion. The remaining investment obligations were related to ongoing projects amounted to about SEK 0.5 billion (0.7). Operating income in Infrastructure Devel-opment totaled SEK -9 M (31). The lower income was an effect of such factors as increased selling and administrative expenses, since these operations are growing. Corporate overhead totaled SEK -342 M (-360). Eliminations of intra-Group profits
amounted to SEK -73 M (46). This item included a reversal of previously carried out eliminations of real estate projects totaling SEK 75 M, eliminations of intra-Group profits related to Infrastructure Development projects in a net amount of SEK -147 M, plus other eliminations of SEK -1 M. The item discontinued operations, SEK 202 M (987) included both capital gains from divestments of businesses and operating income from discontinued operations.
Income after financial itemsNet interest items improved as a consequence of Skanska’s strengthened financial position and amounted to SEK 171 M (-48). Capital-ized interest expenses in ongoing projects for Skanska’s own account amounted to SEK 28 M (39). The net amount of changes in the market value of financial instruments totaled SEK 19 M (-). Other financial items amounted to SEK -70 M (14) and mainly consisted of currency rate effects plus various financial fees, espe-cially related to Skanska Latin America.
Profit for the yearAfter subtracting the year’s tax expenses of SEK -1,230 M (-1,141), profit for the year attributable to equity holders amounted to SEK 3,879 M (3,173). The effective tax rate was 24 (26) percent. This comparatively low tax rate is mainly explained by certain divestments of businesses with low or no taxes and by a positive tax effect from the discontinuation of foreign subsidiaries.
Residential Project Development, Commercial Project Development and other commercial properties
Residential Project DevelopmentAt year-end, there were about 5,500 (6,400) residential units under construction, of which 78 (73) percent were pre-sold.
The number of unsold completed residential units was 148 (299). During the year, con-struction started on 3,931 (4,314) units. The number of residential units sold was 4,536 (4,474).
The book value of current-asset proper-ties in Residential Project Development totaled SEK 3.3 billion (3.3). Of this amount, undeveloped land and develop-ment properties mainly for housing con-struction totaled SEK 2.4 billion (2.0). This represented building rights for about 17,500 residential units. There were also 3,100 building rights in associated companies. In addition, Skanska has options for 8,500 more building rights.
Commercial Project DevelopmentAt year-end 2005, Commercial Project Devel-opment had seven projects underway and one completed project, with a total book value of SEK 0.6 billion (0.4).The seven ongoing proj-ects, six of them in Sweden, represented leas-able space of about 110,000 sq. m (1,184,400 sq. ft.) and were 48 percent pre-leased, measured in rent. In addition to these projects, during 2005 four projects were sold before completion, with a pre-leasing level of 100 percent on the date of sale. At the end of the year, the book value of the seven ongoing projects amounted to SEK 0.4 billion (0.2). Their book value upon comple-tion is expected to total SEK 1.8 billion, with an estimated market value of SEK 2.2 billion. Expected yield, based on book value, was estimated at about 8 percent. Operating net for completed commercial space amounted to SEK 350 M (504), which was equivalent to an operating net margin of about 59 (62) percent. Skanska’s estimate of the market value of finished properties on December 31, 2005, which was partially carried out in collaboration with external appraisers, indicated a market value of about SEK 4.6 billion (6.6). The corre-sponding book value in the consolidated finan-cial statements was SEK 3.2 billion (4.4).
������������������������������������������
�
���
���
���
���
�����
�����
�����
�����
�����
�����
�
�����
�����
�����
�����
����
����������������������������������������������������������������������������������������������������������������������������������
������� ���������������
�������
�������������������������������������������������
�
�����������������������
�
���
���
���
���
�����
�����
�����
�����
�����
�����
�
�����
�����
�����
�����
����
����������������������������������������������������������������������������������������������������
������� �����������������
������
������
������
������
������
������������������
�
������������������
���� ���� ���� ������
��
�
�
�
�
�
��
����
��
������������������
���� ���� ���� ������
��
�
�
�
�
�
��
����
���

Skanska Annual Report 2005 Report of the Directors 53
Rep
ort
of
the
Dir
ecto
rs
The occupancy rate in terms of rent was 73 (81) percent. Including properties that were recognized as completed on January 1, 2006, estimated total market value amounted to some SEK 4.8 billion (6.9), with a corresponding book value of SEK 3.4 billion (4.6). The market value of completed properties rose by about SEK 300 M during 2005, equivalent to 7 percent. The book value of Skanska’s undeveloped land and development properties (building rights) for commercial construction totaled about SEK 2.0 billion (2.4).
Other commercial properties“Other commercial properties” are part of the Construction business stream. Here the gain on property divestments amounted to SEK 246 M (150). Book value at year-end was SEK 1,396 M (1,272).
InvestmentsThe Group’s investments totaled SEK -6,986 M (-6,765). Divestments totaled SEK 10,631 M (12,534), and the net amount of the Group’s investments (-) and divestments (+) was SEK 3,645 M (+5,769).
Investments/DivestmentsSEK M 2005 2004
Operations – investmentsIntangible non-current assets –46 –38
Property, plant and equipment –1,455 –1,131
Assets in Infrastructure Development –476 –188
Shares –3 –6
Current-asset properties –4,956 –5,266
of which Residential Project
Development –3,181 –3,665
of which Commercial Project
Development –1,135 –1,331
of which other commercial
properties –640 –270
Investments –6,936 –6,629
SEK M 2005 2004
Operations - DivestmentsIntangible non-current assets 4 2
Property, plant and equipment 613 635
Assets in Infrastructure Development 35 7
Shares 1 12
Current-asset properties 9,400 9,321
of which Residential Project
Development 4,150 4,143
of which Commercial Project
Development 4,430 4,645
of which other commercial
properties 820 533
Divestments 10,053 9,977
Net divestments in operations 3,117 3,348
Strategic Investments Acquisitions of businesses –50 –135
Shares 0 –1
Strategic investments –50 –136
Strategic divestmentsDivestments of businesses 537 2,078
Shares 41 479
Strategic divestments 578 2,557
Net strategic divestments 528 2,421
TOTAL DIVESTMENTS 3,645 5,769Depreciation/amortization,
non-current assets –1,073 –1,249
Investments in property, plant and equipment rose to SEK -1,455 M (-1,131). Net invest-ments amounted to SEK -842 M (-496). This item was mainly related to investments in the Construction business stream. Investments in the form of shares and equi-ty as well as subordinated loans in the Infra-structure Development business stream amounted to SEK -476 M (-188). In Residential Project Development, net divestments totaled SEK 969 M (478). During the year, fully developed residential projects were sold for SEK 4,150 M (4,143), while investments amounted to SEK -3,181 M (-3,665). Divestment volume was largely unchanged compared to the previous year, while investment volume decreased. Commercial Project Development carried out net divestments of SEK 3,295 M (3,314). Investments amounted to SEK -1,135 M (-1,331) and divestments were SEK 4,430 M (4,645). Both divestment and investment vol-ume decreased during the year. Net divest-ments in the business amounted to SEK 3,117 M (3,348). Net strategic investments/divestments for the year consisted of a divestment of SEK 528 M (2,421). Companies were acquired at a cost of SEK -50 M (-135), and companies and shares were divested in the amount of SEK 537 M (2,078).
The Group’s operating cash flowCash flow for the year amounted to SEK 3,638 M (1,921) Cash flow from business operations decreased somewhat, from SEK 5,786 M to SEK 5,354 M. The decrease was partly explained by negative cash flow effects related to project impairment losses in the United Kingdom and the United States during the fourth quarter of 2004, which adversely affected the change in working capital during 2005. The decrease is also partly explained by about SEK 600 M in taxes paid during the year related to the tax allocation reserves withdrawn during 2004. In order to achieve uniform accounting for cash and cash equivalents, beginning with 2005 checks issued are being recognized as a reduction in the item “Cash and cash equiva-lents” only when cashed. This affects operations in the U.S. and the U.K. This reclassification implies an increase of SEK 764 M in interest-bearing net receivables. The effect was included in 2005 cash flow in the amount of SEK 15 M. The positive cash flow from net strategic investments, SEK 527 M (2,392), was mainly related to divestments of companies and shares. In addition to cash flow of SEK 3,638 M during the year, liquid assets including reclas-sifications and exchange rate differences at the beginning of the year amounted to SEK 10,040 M, resulting in liquid assets of SEK 13,678 M at year-end.
Commercial Project Development Book Book value value upon Market value OccupancySEK M December 31 completion Dec 31, 2005 rate, %
Completed properties 3,157 3,157 4,577 73
Projects completed in 2005 217 217 262 99
Ongoing projects 382 1,756 2,185 48
Total 3,756 5,130 7,024 Development properties and undeveloped land 2,048
TOTAL 5,804
Allocation of book value, current-asset properties, December 31, 2005 Residential Commercial Other Project Project commercial SEK M Development Development properties Total
Completed projects 261 3,157 44 3,462
Ongoing projects 601 599 444 1,644
Development properties and undeveloped land 2,420 2,048 908 5,376
Totalt 3,282 5,804 1,396 10,482

54 Report of the Directors Skanska Annual Report 2005
Rep
ort
of
the
Dir
ecto
rs
The Group’s operating cash flowSEK M 2005 2004
Cash flow from operating activities before change in working capital 3,313 1,983
Change in working capital 456 1,519
Net investments in operatingactivities 3,117 3,348
Adjustments in payment dates of net investments –57 –53
Taxes paid in operating activities –1,475 –1,011
Cash flow from businessoperations 5,354 5,786
Net interest items and other
financial items –120 –34
Taxes paid in financing activities 36 10
Cash flow from financing activities –84 –24
Cash flow from operations 5,270 5,762
Net strategic investments 528 2,421
Taxes paid on strategic investments –1 –29
Cash flow from strategic investments 527 2,392
Dividend etc –1,675 –1,288
Cash flow before change inInterest-bearing receivablesAnd liabilIties 4,122 6,866Change in interest-bearing receivables and liabilities –484 –4,945
CASH FLOW FOR THE YEAR 3,638 1,921Liquid assets, January 1 8,868 7,037
Reclassifications in liquid assets 751 0
Exchange rate differences in liquid assets 421 –90
Liquid assets, December 31 13,678 8,868
Financing and liquidityAt year-end 2005, the Group had interest-bear-ing net receivables amounting to SEK 11,111 M (7,229). Net interest items, before taking into account capitalized interest, amounted to SEK 107 M (-87). The change is mainly attrib-utable to the sharp increase in interest-bearing receivables. Interest-bearing assets rose to SEK 16,975 M (12,421). Of these, receivables in foreign cur-rencies accounted for 61 (48) percent. The average interest refixing period for all of the Group’s interest-bearing assets was 0.1 (0.2) year, and the interest rate averaged 2.42 (2.62) percent.
Change in interest-bearing assets and liabilities
Jan–Dec Jan–DecSEK M 2005 2004
Net receivables (+) /Net debt (-),opening balance 7,229 150Adjustment to IFRS 287
Net receivables (+) /Net debt (-), opening balance in compliance with IFRS 7,229 437Cash flow from operating activities 5,354 5,786
Cash flow from financing activities
excluding changes in interest-bearing
liabilities and receivables –84 –24
Jan–Dec Jan–DecSEK M 2005 2004
Cash flow from strategic investments 527 2,392
Dividend etc. –1,675 –1,288
Acquired/divested interest-bearing
liabilities 219 123
Exchange rate difference 120 304
Change in pensions in compliancewith IAS 19 –1,471 –590
Other reclassifications 992 131
Other changes –100 –42
Net receivables (+) /Net debt (-), closing balance 11,111 7,229
The Group’s interest-bearing liabilities rose to SEK 5,864 M (5,192). The average interest refixing period for all interest-bearing liabili-ties excluding pension liability was 1.0 (1.3) years, and the average maturity amounted to 2.7 (3.0) years. The average interest rate for all Group interest-bearing liabilities excluding pension liability amounted to 4.38 (4.11) percent at year-end. The proportion of loans in foreign currencies, after taking derivatives into account, increased to 31 (28) percent. At year-end, the Group’s unutilized credit facilities amounted to SEK 6,071 M (5,610). For a description of financial policies and risks, see Note 6.
Return on capital employedAt the end of 2005, the Group’s capital employed was SEK 24,451 M (21,560). Return on capital employed increased from 19.9 to 23.3 percent.
Return on equityAt the end of 2005, the Group’s equity amount-ed to SEK 18,587 M (16,368). Return on equity rose to 22.4 (20.6) percent. Aside from profit for the year, the change in equity is explained in part by disbursement of a dividend to the shareholders of SEK 1,674 M and in part by positive currency translation differences of SEK 1,135 M as well as the impact of applying an alternative accounting method in compliance with IAS 19, “Employee Benefits” for pensions, totaling SEK -1,190 M.
Discontinued operationsRevenue in discontinued operations amounted to SEK 561 M (5,006) during the year, with an operating income of SEK 202 M (987). The structured divestment process related to a number of specialized companies, primar-ily in Skanska Sweden, was essentially com-pleted during 2005. Skanska Prefab Mark, which manufactures and sells prefabricated concrete products for paving and water/wastewater systems, was sold during the second quarter. The purchase price was about SEK 340 M. The divestment resulted
in a capital gain of about SEK 180 M. The company has some 260 employees and report-ed 2004 sales in the range of SEK 400 M. The part of Skanska Prefab that manufac-tures and sells frame systems for construction of buildings is not part of the divestment but will continue its operations under the name Region Frame Systems within Skanska Sweden. A binding agreement on the divestment of Skanska Modul AB and its subsidiaries was signed during the fourth quarter. The Skanska Modul Group manufactures, leases and sells mobile modular buildings that are used as temporary offices, day care centers, schools and construction sheds. The purchase price for the debt-free company amounted to about SEK 360 M and resulted in a small gain. The company, with about 200 employees, has sales in the range of SEK 480 M.
Amount included in 2005 accounts:
Operating CapitalSEK M Revenue income gain Total
Skanska Prefab Mark 59 –3 180 177
Skanska Modul 373 77 4 81
432 74 184 258
Accounting principles and changes in accounting practicesAs a listed company operating in a European Union member country, beginning with 2005 the Group must fully comply with the Interna-tional Financial Reporting Standards (IFRS) that have been adopted by the European Com-mission. The comparative year 2004 is also reported in compliance with IFRS. Accounting practices, differences from earlier Swedish generally accepted accounting practices (GAAP) and a detailed presentation of their financial effects as well as recalculated com-parative figures are provided in Note 3.In conjunction with the transition to IFRS, acquired goodwill amounting to SEK 428 M
�����������������������������������������
�
���
�
��
��
��
���
�
��
��
��
���� ���� ����
������������
���� ����
������������������
����������������������������������������������
�
���
�
��
��
��
���
�
��
��
��
���� ���� ����
������
���� ����
����������������

Skanska Annual Report 2005 Report of the Directors 55
Rep
ort
of
the
Dir
ecto
rs
was reallocated from the Construction busi-ness stream to the Residential Project Develop-ment business stream. Effective from January 1, 2005, Skanska has also changed its principle for reporting of con-tingent liabilities. Effective from January 1, 2005, changes in fair values of financial instruments are recog-nized at fair value through profit or loss. The total effect on income of currency derivatives, attributable to financial operations, is recog-nized either as financial income or as a finan-cial expense. The same is true of the effect on income of change in the value of interest rate swaps. The fair value of the instruments is rec-ognized in the balance sheet as a non-interest-bearing asset or as a non-interest-bearing lia-bility. The International Accounting Standards Board (IASB) has amended International Accounting Standard (IAS) 19, “Employee Benefits,” which has made possible an alterna-tive treatment of actuarial gains and losses in defined-benefit pension plans (see separate section below).
Pension obligationsThe International Accounting Standards Board (IASB) has amended IAS 19, “Employee Bene-fits,” which has also been adopted by the EU, thereby making possible an alternative treat-ment of surpluses and deficits in defined-ben-efit pension plans. This alternative rule implies that actuarial gains and losses are recognized directly in the balance sheet and thus do not give rise to any effect on earnings. The conse-quence of the alternative method will be that future changes in actuarial assumptions, both positive and negative, will have an immediate effect on reported equity and interest-bearing net receivables/liabilities. Skanska has decided to apply this alternative method. The adjust-ment means that interest-bearing pension lia-bilities rose by SEK 2.1 billion and Group equi-ty was reduced by about SEK 1.6 billion, taking deferred taxes and social insurance contribu-tions into account. The increase in pension liabilities was allo-cated between actuarial gains and losses amounting to SEK 1.5 billion in 2005 and SEK 0.6 billion in 2004, respectively. The increase was mainly due to lower long-term interest rates and changed benchmark interest rates and was partly offset by actuarial gains on plan assets. Changed assumptions, primarily a lower discount rate, imply that the pension obliga-tion, calculated in terms of present value, will be higher. The current service cost is allocated on a straight-line basis during employees’ peri-ods of service, resulting in an increased future
• Generating knowledge as a basis for new products, systems and business operations.
• Creating a better understanding of materi-als, products or processes in order to increase industrialization and/or cost sav-ings.
• Identifying future needs and trends, inter-nally and externally.
• Disseminating interesting findings and developed knowledge to Skanska’s projects and personnel.
Research is primarily headed by the develop-ment manager of each respective business unit, with back-up from adjunct professors and doc-toral students who divide their working time between Skanska and a university. This meth-odology yields benefits in the form of a broad external network where colleagues at universi-ties can disseminate their knowledge and, above all, recommend external experts for specific issues, such as: • improving the indoor environment in
buildings with respect to acoustics, air quality, radiation etc.
• energy performance in buildings• developing quiet road surfaces• moisture-proof construction • industrializing the construction process
As a result of cooperation with universities, projects of a research nature are co-financed by the European Union’s Framework Pro-grams, national funds, public agencies, indus-try organizations and private companies, among others. Development efforts usually occur in Skanska’s major projects. Development in smaller projects is administered centrally by each respective business unit or, in the case of more general problems, in Groupwide development efforts, where the affected business units often participate with backing from external networks. Patenting and development of “Skanska Standard” products increased significantly during 2005, benefiting Skanska customers in the form of unique products and improved functionality. The total cost of Skanska’s research and development work is difficult to estimate, since a large proportion of it is integrated into ongo-ing projects. Sustainable developmentFollow-ups and the results of more than 1,000 internal audits of the introduction of the Skanska Code of Conduct (ethical guidelines) show a high degree of acceptance and compli-ance in the Group. These results were support-ed by external auditors, who reported no seri-ous non-conformities. In 2005, the focus was on streamlining the ISO 14001 certified envi-ronmental management systems, revision of the
annual charge to earnings of about SEK 100 M, given an unchanged discount rate.
Alleged cartel activitiesAs a result of the Swedish Competition Authority’s investigation of a number of com-panies, among them Skanska, concerning alleged collusive anti-competitive practices related to contract tenders for asphalt and pav-ing contracts, in March 2003 the Competition Authority filed suit against 11 companies with asphalt operations, among them Skanska. The suit originally requested total fines of SEK 1.6 billion for alleged infringements of the Swed-ish Competition Act, of which Skanska’s share was SEK 664 M. In conjunction with oral preparations for the case at Stockholm City Court, the Competition Authority adjusted its request downward to SEK 1.2 billion, of which SEK 557 M is related to Skanska. Skanska has denied the Authority’s allegations. The case is unusually extensive. In the opinion of the City Court, the main hearings can begin during autumn 2006. In Norway and Finland as well, investiga-tions by competition authorities are underway concerning Skanska’s possible involvement in anti-competitive activities in the asphalt and civil construction sector. In Norway, no requested amount has been presented yet. The amount of infringement fines requested totals about SEK 100 M in Finland. Skanska denies the alleged infringements. Great uncertainty characterizes the outcome of these legal actions. Skanska and another company suspected of having participated in cartel activities in Sweden have been sued by a number of Swed-ish municipalities that maintain that they have suffered damage in procurements alleged to have been the object of collusion of cartels between contractors. Skanska has been sued for a total of SEK 57 M. Skanska denies the allegations. In December 2005, Slovakia’s competition authority announced a decision concerned alleged pricing collusion in tendering for a road project. The fine in Skanska’s case is SEK 58 M. Skanska denies the allegations and has appealed the decision.
Research and developmentThe purpose of the research and development pursued by Skanska is to develop knowledge platforms and disseminate know-how in order to satisfy all the needs of Skanska’s business.
This task includes a number of disciplines, with a focus on:• Building up strategic knowledge networks,
both internal and external, to back up projects.

56 Report of the Directors Skanska Annual Report 2005
Rep
ort
of
the
Dir
ecto
rs
56
employee health and safety strategy and contin-ued attention to business ethics. A significant share of Skanska’s major proj-ects are implemented with higher environmen-tal standards than required by law in each respective country. A few Group facilities are required to obtain permits and submit registra-tion documents; their environmental impact is relatively limited. Through exchanges of experience in the Group, employee health and safety strategy was evaluated. A Safety Week was implemented on a Groupwide basis in October and resulted in an 80 percent reduction in accidents compared to an average week during the year. More and more projects are achieving the vision of zero work site accidents. The overall frequency of accidents that lead to absences from work fell by about 10 percent compared to 2004. Skanska remains involved in Transparency International and other initiatives to promote ethics and develop tools and information con-cerning ethics-related issues. One high-priority commitment has been participation in efforts to develop a new international standard for social responsibility, ISO 26000. In 2005, Skanska contributed financially to reconstruc-tion efforts following the Indian Ocean tsunami disaster and the earthquake in Pakistan, among other initiatives.
PersonnelThe average number of employees during 2005 was 53,806 (53,803), including 10,706 (11,653) in Sweden. During the year, corporate-level evalua-tions of senior managers covered 720 people, an increase of 7.5 percent from the previous year. Meanwhile Skanska’s business units have established their own leadership evaluation systems, based wholly or partially on the same criteria. To meet the need for “good employees,” each Skanska business unit has a talent man-agement program tailored to its specific requirements. The program content varies greatly, depending on the needs of each respec-tive unit. The purpose is to create broad know-how at all levels and ensure a supply of highly qualified employees in the Group. Achieving a more even balance between men and women at all levels in the Group has been and remains a high-priority task. How-ever, the proportion of women in management positions remains very low, although it rose from 6 percent to 7 percent between 2004 and 2005. As more and more attention has been focused on pension issues both inside and out-side of Skanska, the Board of Directors has chosen to create a formal structure related to the management of the Group’s pension plans.
per year. The Plan will lead to a maximum dilution of capital stock by about 1.1 percent over three years. In all, share awards equivalent to a maximum of 3,900,000 Series B shares may be granted to employees under the Plan. To ensure the delivery of Series B shares to employees under the Share Award Plan, in Jan-uary 2006, 4,500,000 Series D shares were issued (3,900,000 shares for awards and anoth-er 600,000 shares to cover social insurance contributions etc.) and were then immediately bought back by the Company. During the respective vesting period, these Series D shares will be converted into Series B shares and be delivered free of charge to employees. A preliminary reconciliation of how finan-cial and qualitative targets were met in 2005 indicates an average outcome of approximately a 16 percent addition to fixed salary for those managers included in the Plan. The cost of the distribution will amount to about SEK 50 M allocated over four years. The distribution will be determined and finally approved in April 2006. To receive shares, a person is required to be employed for three years after the end of the measurement period. The dilution effect during 2005 is estimated at 8,851 shares or 0.002 percent of the number of shares outstanding. For further information, see Note 27, Equity/Earnings per share.
Annual Shareholders’ MeetingThe Annual Meeting will be held at 5:00 p.m. on March 30, 2006 at the Rival Hotel, Maria-torget, Stockholm, Sweden.
Nomination Committee and proposal for Board of DirectorsIn accordance with a decision by the Annual Shareholders’ Meeting in 2005, the Chairman of the Board asked five of the largest share-holders to appoint one representative each, who together with the Chairman will consti-tute a Nomination Committee. Among the Committee’s tasks is to work out a proposal for a Board of Directors and remuneration to the Board for a decision by the 2006 Annual Meet-ing. The Nomination Committee during the period leading up to the 2006 Annual Meeting of Skanska AB has the following composition: Carl-Olof By, Chairman of the Nomination Committee, and representing AB Indus-trivärden, Robert Wikström, representing the Svenska Handelsbanken pension funds and Svenska Handelsbanken AB; Magnus Wärn, representing AMF Pension; Per Ludvigsson, representing Inter-IKEA Investments AB; KG Lindvall, representing Robur mutual funds; and Sverker Martin-Löf, Chairman of the Board, Skanska AB.
During 2005, Skanska thus established a global pension policy and a corporate-level pension committee.
Stock optionsTwenty-nine senior executives held a total of 3,220,000 employee stock options divided into two programs at the beginning of 2005. The 2000-2005 employee stock option program ended on March 31, 2005. Since the market price of a Skanska share on that date was below the exercise price, holders did not uti-lize the opportunity to exercise them. At year-end 2005, the 2001-2006 option program included 1,844,000 options, with an exercise price of SEK 128, held by 24 senior executives. The options are synthetic and set-tlement occurs in cash. The options were provided free of cost and may only be exercised on the condition that the person is still employed by Skanska on the exercise date or has retired with a pension. Those who received stock options may not transfer them to others. Because the market price of a Skanska share on December 31 was below the exercise price of the options, the program had no impact on 2005 earnings. Nor did the option program have any dilution effect. Most obligations that the synthetic option program may cause, if the market price of a Skanska Series B share exceeds the exercise price on the balance sheet date, have been hedged using equity swaps related to shares in Skanska AB. The difference between the mar-ket price on the balance sheet date and the ini-tial prices of the swap agreement is accounted for and recognized as a financial item. The positive effect on equity on January 1 amount-ed to SEK 12 M. In the income statement for the full year 2005, income after financial items was positively affected in the amount of SEK 85 M.
Long-term share incentive programIn April 2005, the Annual Shareholders’ Meet-ing of Skanska approved a long-term share incentive program (the Skanska Share Award Plan, or “the Plan”), adapted to the Company’s higher financial targets. The Plan applies dur-ing 2005 – 2007, with disbursements in 2009 – 2011, and covers about 300 managers. Today this is Skanska’s only Groupwide long-term incentive program and it replaces an earlier program. Aside from financial targets, it includes tar-gets for health and safety, environmental impact, business ethics, fewer loss-making projects and management development. The Plan may provide a maximum 30 percent addition to fixed annual salary. The maximum cost for Plan distributions is about SEK 120 M

Skanska Annual Report 2005 Report of the Directors 57
Rep
ort
of
the
Dir
ecto
rs
57
The Nomination Committee has announced that it proposes the re-election of Roger Flanagan, Ulrika Francke, Jane Garvey, Stuart Graham, Finn Johnsson, Sverker Martin-Löf and Anders Nyrén and the election of Curt Källströmer and Lars Pettersson. Sören Gyll and Arne Mårtensson have declined re-election. Curt Källströmer is Senior Vice President of Svenska Handelsbanken AB and Lars Pettersson is President and CEO of Sand-vik AB. The Committee further proposes that Sverker Martin-Löf be re-elected Chairman of the Board. The proposals of the Nomination Committee are supported by shareholders rep-resenting about 45 percent of the total number of votes in Skanska.
Proposed dividendThe Board of Directors proposes a regular div-idend of SEK 4.50 (4.00) per share and an extra dividend of SEK 2.00 per share for the 2005 financial year, totaling SEK 6.50 (4.00) per share, equivalent to a total dividend payout of SEK 2,721 M (1,674).
The Board’s reasons for the dividend proposal The nature and scale of Skanska’s operations can be seen in the Articles of Association and this Annual Report. The operations carried out in the Group do not pose risks beyond those that occur or can be assumed to occur in its industry or the risks that are otherwise associ-ated with carrying out business operations. The Group’s dependence on the business cycle does not deviate from what otherwise occurs in its industry. Concerning important events, the reader is referred to what is presented in the Report of the Directors. The equity/assets ratio of the Group amounts to 26.1 (25.9) percent. The proposed dividend does not jeopardize the investments that have been deemed necessary. The finan-cial position of the Group does not give rise to any judgment except that the Group can con-tinue its operations and that the Group can be expected to meet its short- and long-term obli-gations. With reference to the above and what has otherwise come to the Board’s attention, it is the judgment of the Board that the dividend is justified with reference to the demands that the nature, scale and risks of its operations place on the size of the Company’s and the Group’s equity and the Company’s and the Group’s consolidation requirements, liquidity and position otherwise. Future profits are expected to cover growth in operations as well as growth in the regular dividend. The Board expects that the dividend payout ratio can amount to about 50 percent.
On the balance sheet date, the equity of the Parent Company included SEK 73 M compris-ing the effect of financial assets and liabilities being recognized at fair value in compliance with the Annual Accounts Act, Chapter 4, Section 14a.
Parent CompanyThe Parent Company carries out administra-tive work and includes the Senior Executive Team and management units. Profit for the year amounted to SEK 1,024 M (1,781). The average number of employees was 59 (59).
Market outlookThe outlook for commercial building con-struction in the Nordic countries remains cau-tiously positive, with retailing among the stronger sectors. The Polish market, too, con-tinues to have a positive outlook, although lead times are long between the tendering process and the start of a project. Construction invest-ments in the Czech Republic are increasing again after a first half without growth. In the United Kingdom, the volume of public-private partnership (PPP) projects remains large. In other segments of importance to Skanska, the construction volume in the U.K. is low. In the American commercial building market, the healthcare and educational sectors remain strong. The market for civil construction in the U.S. has improved. The new federal program for infrastructure as well as a general improve-ment in the economy will have a positive impact during 2006. Rising costs of fuel as well as for certain types of materials add a degree of volatility to the market, since they affect the ability of customers to finance projects as well as the project risk to contractors. In Sweden, civil construction is expected to increase dur-ing 2006, among other things due to a number of railroad projects that are coming into the market. The trend of the Norwegian civil con-struction market remains positive, partly driv-en by public-private partnership projects as well as road and railroad projects. In Finland, civil construction is expected to slow some-what. The Czech Republic and Poland are showing continued growth, among other things due to EU membership. In Latin America, there is a continued good outlook for projects in the oil and gas industries, which are important sectors for Skanska’s operations in this region. Residential construction remains at a high level in Finland, Norway and Denmark. In Sweden, residential construction is increasing. In the Czech Republic, which will increase the value-added tax on residential units at the
beginning of 2008, the housing market remains strong but is showing certain early signs of oversupply. The local planning process continues to be a restraining factor in a num-ber of markets. Skanska has experienced a continued increase in leasing activity. Vacancy rates, especially in modern properties in the Scandi-navian and Central European office markets, have declined. In Scandinavia as well as in Central Europe, there is continued good demand from the investment market for prop-erties with efficient space in the right locations and high occupancy rates.
Events after the end of the financial yearIn order to ensure the deliveries of Series B shares to employees in accordance with Skans-ka’s Share Award Plan, in January 2006 the capital stock of the Company was increased by SEK 13,500,000 through the issue of 4,500,000 new Series D shares at a subscription price equivalent to their par value, SEK 3 per share. The shares were subscribed by Nordinvest AB, one of the wholly owned subsidiaries of AB Industrivärden (publ), early in January 2006. Skanska also presented a repurchase offer to Nordinvest AB covering all 4,500,000 Series D shares. The repurchase was carried out late in January 2006 at a price of SEK 3.002 per share, totaling SEK 13,509,000. The purpose of the repurchase was to convert Series D shares to Series B shares as needed for delivery in accor-dance with the Share Award Plan and to cover related social insurance contributions that may arise because of the Plan.

58 Skanska Annual Report 2005Consol idated income statement
Co
nso
lidat
ed in
com
e st
atem
ent
Consolidated income statement
Continuing Discontinued operations operations Group total
SEK M Note 2005 2004 2005 2004 2005 2004
Revenue 8,9 124,106 116,257 561 5,006 124,667 121,263
Cost of sales 9 –112,952 –106,696 –450 –5,010 –113,402 –111,706
Gross income 11,154 9,561 111 –4 11,265 9,557
Selling and administrative expenses 11 –6,593 –6,343 –93 –608 –6,686 –6,951
Income from divestments of discontinued
operations 5 0 0 184 1,587 184 1,587
Income from joint ventures and associated
companies 20 237 156 0 12 237 168
Operating income 10, 12, 13, 22, 37, 39, 41 4,798 3,374 202 987 5,000 4,361
Financial income 323 291 7 10 330 301
Financial expenses –178 –362 -32 –30 –210 –392
Income from associated companies 0 57 0 0 0 57
Net financial items 14 145 –14 –25 –20 120 –34
Income after financial items 15 4,943 3,360 177 967 5,120 4,327
Taxes 16 –1,240 –1,095 10 –46 –1,230 –1,141
Profit for the year 3,703 2,265 187 921 3,890 3,186
Profit for the year attributable to
Equity holders 3,692 2,253 187 920 3,879 3,173
Minority interest 11 12 0 1 11 13
Earnings per share, SEK 27, 45
before dilution 8.82 5.38 0.45 2.20 9.27 7.58
after dilution 8.82 5.38 0.45 2.20 9.27 7.58
Average number of shares 58, 45
before dilution 418,553,072 418,553,072
after dilution 418,561,923 418,553,072
Proposed regular dividend per share, SEK 4.50 4.00
Proposed extra dividend per share, SEK 2.00
See notes 1, 2, 3, 4, 5, 6, 7, 35, 40, 42, 43, 44, 45.

Skanska Annual Report 2005 59Consol idated balance sheet
Co
nso
lidat
ed b
alan
ce s
hee
t
Consolidated balance sheet
SEK M Note 2005 2004
ASSETS
Non-current assets
Property, plant and equipment 17, 41 5,243 5,507
Goodwill 18 4,154 3,899
Other intangible assets 19 644 535
Investments in joint ventures andassociated companies 20 1,834 862
Financial non-current assets 21 1,236 1,137
Deferred tax assets 16 2,282 1,633
Total non-current assets 15,393 13,573
Current assets
Current-asset properties 22 10,482 11,948
Inventories 23 501 610
Financial current assets 21 2,260 2,490
Tax receivables 16 330 269
Gross amount due from customers for contract work 9 5,610 3,579
Trade and other receivables 24 22,985 21,744
Short-term investments 25 3,095 3,053
Cash and cash equivalents 26 10,583 5,815
Assets classified as held for sale 5 72
Total current assets 55,918 49,508
TOTAL ASSETS 33 71,311 63,081 of which interest-bearing non- current assets 32 1,070 1,063 of which interest-bearing assets held for sale 32 2 of which other interest-bearing current assets 32 15,903 11,358
16,975 12,421
SEK M Note 2005 2004
EQUITY 27
Capital stock 1,256 1,256
Contributed capital 316 316
Reserves 1,442 214
Retained earnings 15,440 14,465
Equity attributable to equity holders 18,454 16,251
Minority interest 133 117
TOTAL EQUITY 18,587 16,368
LIABILITIES
Non-current liabilities
Financial non-current liabilities 28 2,424 3,046
Pensions 29 2,407 1,112
Deferred tax liabilities 16 2,831 2,744
Non-current provisions 30 143 135
Total non-current liabilities 7,805 7,037
Current liabilities
Financial current liabilities 28 1,080 1,006
Tax liabilities 16 595 998
Current provisions 30 3,200 2,740
Gross amount due to customers forcontract work 9 11,782 10,428
Trade and other payables 31 28,220 24,504
Liabilities classified as held for sale 5 42
Total current liabilities 44,919 39,676
TOTAL LIABILITIES 52,724 46,713
TOTAL EQUITY AND LIABILITIES 33 71,311 63,081 of which interest-bearing financial liabilities 32 3,286 4,052 of which interest-bearing pensions and provisions 32 2,570 1,140 of which interest-bearing liabilities held for sale 32 8
5,864 5,192
For information about the Group’s assets pledged and contingent liabilities, see note 34.
See notes 1, 2, 3, 4, 5, 6, 7, 35, 40, 42, 43, 44, 45.

60 Skanska Annual Report 2005Consol idated statement of recognized income and expenses
Co
nso
lidat
ed s
tate
men
t o
f re
cog
niz
ed in
com
e an
d e
xpen
ses
SEK M 2005 2004
Translation differences during the year 1,642 1
Hedging of exchange rate risk in operations outside Sweden –498 218
Cash flow hedges Recognized directly in equity 115
Transfer to income statement –50
Change in pension liability Changed assumptions –2,098 –766
Difference between expected and actual return on plan assets 627 176
Social insurance contributions –214 –13
Share Award Plan 12
Equity swaps 0 44
Other transfers of assets recognized directly in equity –3 –95
Taxes attributable to items recognized directly in equity 482 178
Net income recognized directly in equity, excluding transactions with the Company’s owners 15 –257
Profit for the year 3,890 3,186
Total recognized income and expense, excluding transactions with the Company’s owners 3,905 2,929
Attributable to:Equity holders 3,888 3,006
Minority interest 17 –77
See note 27.
Consolidated statement of recognized income and expenses

Skanska Annual Report 2005 61Consol idated cash f low statement
Co
nso
lidat
ed c
ash
flo
w s
tate
men
t
SEK M 2005 2004
Operating activities
Operating income 5,000 4,361
Adjustments for items not included in cash flow –1,687 –2,378
Income tax paid –1,449 –986Cash flow from operating activities beforechange in working capital 1,864 997
Cash flow from change in working capital
Acquisitions of current-asset properties –5,047 –4,973
Divestments of current-asset properties 9,434 8,976
Change in inventories and operating receivables –1,177 316
Change in operating liabilities 1,633 1,203
Cash flow from change in working capital 4,843 5,522
Cash flow from operating activities 6,707 6,519
Investing activities
Acquisitions of businesses –50 –135
Acquisitions of intangible non-current assets –46 –38
Acquisitions of property, plant and equipment –1,455 –1,131Acquisitions of assets in Infrastructure Development –476 –188
Acquisitions of shares –3 –7Increase in interest-bearing receivables,loans provided –1,385 –1,167
Divestments of businesses 537 2,078
Divestments of tangible non-current assets 4 2
Divestments of property, plant and equipment 613 634Divestments of assets in Infrastructure Development 35 7
Divestments of shares 42 491Decrease in interest-bearing receivables, repayments of loans provided 1,888 714
Income tax paid –27 –54
Cash flow from investing activities –323 1,206
Financing activities
Net interest items 135 –48
Other financial items –255 14
Borrowings 410 694
Repayment of debt –1,397 –5,186
Dividend paid –1,674 –1,256
Dividend to minority interest –1 –32
Income tax paid 36 10
Cash flow from financing activities –2,746 –5,804
Cash flow for the year 3,638 1,921
Liquid assets, January 1 8,868 7,037
Reclassifications 1 751
Translation differences in liquid assets 421 –90
Liquid assets, December 31 13,678 8,868
Change in interest-bearing net receivables
SEK M 2005 2004
Interest-bearing net receivables, January 1 7,229 437
Cash flow from operating activities 6,707 6,519
Cash flow from investing activities excludingchange in interest-bearing receivables –826 1,659
Cash flow from financing activities excludingchange in interest-bearing liabilities –1,759 –1,312
Change in accounting principle for pensions in compliance with IAS 19 –1,471 –590
Reclassifications 2 992 131
Net receivable/liability acquired/divested 219 123
Exchange rate differences 120 304
Other items –100 –42
Interest-bearing net receivables, December 31 11,111 7,229
Consolidated operating cash flow statementSEK M 2005 2004Cash flow from operating activities before change in working capital and taxes paid 3,313 1,983
Change in working capital excludingcurrent-asset properties 456 1,519
Net investments in operating activities 3,117 3,348
Cash flow effect, adjustment in payment dates ofnet investments 3 –57 –53
Taxes paid in operating activities –1,475 –1,011
Cash flow from business operations 5,354 5,786
Net interest items and other net financial items –120 –34
Taxes paid in financing activities 36 10
Cash flow from financing activities –84 –24
Cash flow from operations 5,270 5,762
Strategic net investments 528 2,421
Taxes paid on strategic net investments –1 –29
Cash flow from strategic investments 527 2,392
Dividend etc. –1,675 –1,288
Cash flow before change in interest
bearing receivables and liabilities 4,122 6,866
Change in interest-bearing receivables and liabilities –484 –4,945
Cash flow for the year 3,638 1,921
1 Of this amount, SEK 764 M is related to checks issued but not cashed. See also
Note 3, ”Effects of changes in accounting principles,” point D.
2 This amount includes SEK +764 in reclassification of uncashed checks, SEK –194
M in reclassification of subordinated loans in Skanska Infrastructure Develop-
ment and SEK +446 in reclassification of receivables from property buyers.
3 “Adjustment in payment dates of net investments” refers to payments made
during the year related to investments/divestments in prior years, or unpaid
investments related to the current year.
See note 36.
Consolidated cash flow statement

62 Skanska Annual Report 2005Parent Company income statement
Pare
nt
Co
mp
any
inco
me
stat
emen
t
Parent Company income statement
SEK M Note 2005 2004
Net sales 48 50 55
Cost of sales –2 –3
Gross income 48 52
Selling and administrative expenses –330 –140
Operating income 52, 53, 65 –282 –88
Income from holdings in Group companies 49 1,200 1,200
Income from other financialnon-current assets 49 216 116
Income from financialcurrent assets 49 0 5
Interest expenses andsimilar items 49 –209 –135
Income after financial items 925 1,098
Allocations 50 0 926
Taxes on profit for the year 51 99 –243
Profit for the year 1,024 1,781
See note 1, 46, 67.

Skanska Annual Report 2005 63Parent Company balance sheet
Pare
nt
Co
mp
any
bal
ance
sh
eet
Parent Company balance sheet
SEK M Note 2005 2004
ASSETS
Intangible non-current assets 52 16 17
Property, plant and equipment 53
Buildings and land 0 6
Machinery and equipment 3 3
Total property, plant and equipment 3 9
Financial non-current assets 54
Holdings in Group companies 55 10,575 10,565
Holdings in joint ventures 56 0 0
Receivables from Group companies 66 7,332 4,163
Deferred tax assets 51 51 57
Other non-current receivables 73 47
Total financial non-current assets 18,031 14,832
Total non-current receivables 18,050 14,858
Current receivables
Current receivables from Group companies 66 19 15
Tax receivables 51 1 0
Other current receivables 49 35
Prepaid expenses and accrued income 57 97 4
Current assets 166 54
Total current assets 166 54
TOTAL ASSETS 62 18,216 14,912
See note, 1, 46, 47, 67.
SEK M Note 2005 2004
EQUITY AND LIABILITIES
Equity 58
Capital stock 1,256 1,256
Restricted reserves 598 598
Restricted equity 1,854 1,854
Retained earnings 5,697 5,068
Profit for the year 1,024 1,781
Unrestricted equity 6,721 6,849
Total equity 8,575 8,703
Provisions 59
Provisions for pensions andsimilar obligations 60 160 181
Other provisions 22 25
Total provisions 182 206
Non-current interest-bearing liabilities 61
Liabilities to credit institutions 188 222
Liabilities to Group companies 66 9,202 5,705
Total non-current interest-bearing liabilities 9,390 5,927
Current liabilities 61
Trade accounts payable 15 27
Liabilities to Group companies 66 7 6
Tax liabilities 0 6
Other liabilities 6 12
Accrued expenses and prepaid income 41 25
Total current liabilities 69 76
EQUITY AND LIABILITIES 62 18,216 14,912
Assets pledged 63 73 46
Contingent liabilities 63 70,414 50,127

64 Skanska Annual Report 2005Parent Company statement of changes in shareholders ’ equity and cash f low statement
Parent Company cash flow statement
SEK M 2005 2004
Operating activities
Operating income –282 –88
Adjustments for items not included in cash flow 4 6
Income tax paid –102 –102
Cash flow from operating activities before change in working capital –380 –184
Cash flow from change in working capital
Change in inventories and operating receivables –113 –6
Change in operating liabilities –4 –83
Cash flow from change in working capital –117 –89
Cash flow from operating activities –497 –273
Investing activities
Acquisitions of property, plant and equipment –1 –3
Increase in interest-bearing receivables, loans provided –26 –2
Divestments of property, plant and equipment 4 0
Cash flow from investing activities –23 –5
Financing activities
Net interest items –89 –14
Other financial items 1,296 1,200
Borrowings 1,021 373
Repayment of debt –34 –29
Dividend paid –1,674 –1,256
Income tax paid 0 4
Cash flow from financing activities 520 278
Cash flow for the year 0 0
Liquid assets, January 1 0 0
Liquid assets, December 31 0 0
See note 64.
Parent Company statement of changes in equity
Un- Capital Restricted restricted TotalSEK M stock reserves equity equity
Equity, January 1, 2004 1,256 598 6,614 8,468
Equity swaps for employee
stock options 44 44
Group contributions –334 –334
Dividend –1,256 –1,256
Profit for 2004 1,781 1,781
Equity, December 31, 2004 1,256 598 6,849 8,703
Adjustment to change in accounting principle
Equity swaps for employee stock option 12 12
Adjusted opening balance, 2005 1,256 598 6,861 8,715
Group contributions 498 498
Dividend –1,674 –1,674
Share Award Plan 12 12
Profit for 2005 1,024 1,024
of which effects of derivative instruments carried at fair value 61 61
Equity, December 31, 2005 1,256 598 6,721 8,575
of which effects of financial assets and liabilities carried at fair value, SEK 73 M.
See note 58.
Pare
nt
Co
mp
any
stat
emen
t o
f ch
ang
es in
sh
areh
old
ers’
eq
uit
y an
d c
ash
flo
w s
tate
men
t

Skanska Annual Report 2005 Notes, including accounting and valuat ion pr inc iples 65
No
tes,
incl
ud
ing
acc
ou
nti
ng
an
d v
alu
atio
n p
rin
cip
les
Notes including accounting and valuation principles
Table of contents, notesGroup PageNote 1 Accounting and valuation principles 66
Note 2 Key estimates and judgments 75
Note 3 Effects of changes in accounting principles 75
Note 4 Segment reporting 81
Note 5 Non-current assets held for sale and discontinued operations 84
Note 6 Financial instruments 85
Note 7 Business combinations 88
Note 8 Revenue 89
Note 9 Construction contracts 89
Note 10 Operating income 90
Note 11 Selling and administrative expenses 91
Note 12 Depreciation/amortization 91
Note 13 Impairment losses/Reversals of impairment losses 92
Note 14 Net financial items 92
Note 15 Borrowing costs 93
Note 16 Income taxes 93
Note 17 Property, plant and equipment 94
Note 18 Goodwill 96
Note 19 Intangible assets 97
Note 20 Investments in joint ventures and associated companies 98
Note 21 Financial assets 100
Note 22 Current-asset properties/Project development 100
Note 23 Inventories etc. 102
Note 24 Trade and other receivables 102
Note 25 Short-term investments 102
Note 26 Cash and cash equivalents 102
Note 27 Equity/Earnings per share 102
Note 28 Financial liabilities 104
Note 29 Pensions 104
Note 30 Provisions 106
Note 31 Trade and other payables 107
Note 32 Specification of interest-bearing receivables per asset and liability 107
Note 33 Expected recovery periods of assets and liabilities 108
Note 34 Assets pledged, contingent liabilities and contingent assets 109
Note 35 Effect of changes in foreign exchange rates 110
Note 36 Cash flow statement 112
Note 37 Personnel 114
Note 38 Compensation to executive officers 114
Note 39 Fees and other remuneration to auditors 117
Note 40 Related party disclosures 117
Note 41 Leases 117
Note 42 Events after the balance sheet date 118
Note 43 Consolidated quarterly results 119
Note 44 Five-year Group financial summary 120
Note 45 Definitions 123
Amounts in million Swedish crowns (SEK M) unless otherwise specified.
Income is reported in positive figures and expenses in negative figures.
Both assets and liabilities are reported in positive figures.
Interest-bearing net receivables/liabilities are reported in positive figures if they are receivables and negative figures if they are liabilities.
Accumulated depreciation/amortization and accumulated impairment losses are reported in negative figures.
Generally speaking, in this Annual Report, the 2004 and 2005 financial statements have been prepared in compliance with International
Financial Reporting Standards (IFRS) and the financial statements for 2001-2003 comply with the previous Swedish Generally Accepted
Accounting Standards (SWGAAP). The standards of the Swedish Financial Accounting Standards Council (Redovisningsrådet) are abbreviated RR.
Parent Company PageNote 1 Accounting and valuation principles 66
Note 42 Events after the balance sheet date 118
Note 46 Effects of changes in accounting principles 124
Note 47 Financial instruments 124
Note 48 Net sales 124
Note 49 Financial items 124
Note 50 Allocations and untaxed reserves 124
Note 51 Income taxes 125
Note 52 Intangible assets 125
Note 53 Property, plant and equipment 125
Note 54 Financial non-current assets 126
Note 55 Holdings in Group companies 126
Note 56 Holdings in joint ventures 126
Note 57 Prepaid expenses and accrued income 126
Note 58 Equity 126
Note 59 Provisions 127
Note 60 Provisions for pensions 127
Note 61 Liabilities 127
Note 62 Expected recovery periods of assets, provisions and liabilities 128
Note 63 Assets pledged and contingent liabilities 128
Note 64 Cash flow statement 129
Note 65 Personnel 129
Note 66 Related party disclosures 129
Note 67 Supplementary information 129

66 Notes, including accounting and valuat ion pr inc iples Skanska Annual Report 2005
No
tes,
incl
ud
ing
acc
ou
nti
ng
an
d v
alu
atio
n p
rin
cip
les
Note 1 Accounting and valuation principles
Consolidated accounting and valuation principlesConformity with laws and standardsIn compliance with the ordinance approved by the European Union (EU) on the
application of international accounting standards, the consolidated financial
statements have been prepared in compliance with International Financial Report-
ing Standards (IFRS) and International Accounting Standards (IAS), issued by the
International Accounting Standards Board (IASB), to the extent these have been
adopted by the EU, as well as the interpretations by the International Financial
Reporting Interpretations Committee (IFRIC) and its predecessor the
Standing Interpretations Committee (SIC). This financial report is the first com-
plete financial report prepared in compliance with IFRS. In conjunction with the
transition from the accounting principles that were previously applied to reporting
in compliance with IFRS, the Skanska Group has applied IFRS 1, which is the stan-
dard that describes how the transition to IFRS shall be reported. In addition, the
Swedish Financial Accounting Standards Council’s standard RR 30, “Supplementa-
ry Accounting Regulations for Groups” has been applied, as have the statements
issued by the Council’s Emerging Issues Task Force. According to Skanska’s listing
contract with Stockholmsbörsen (the Stockholm Stock Exchange), additional
information must be provided about incentive programs outstanding and benefits
provided to executive officers. Statement 2002:1 of the Swedish Securities Council
stipulates that a description of ongoing incentive programs should be provided.
Conditions when preparing the Group’s financial reportsThe functional currency of the Parent Company is Swedish crowns or kronor (SEK),
which is also the presentation currency of the Parent Company and of the Group.
This implies that the financial reports are presented in Swedish kronor. All
amounts are rounded off to the nearest million, unless otherwise stated.
Preparing the financial reports in compliance with IFRS requires management to
make judgments and estimates as well as make assumptions that affect the appli-
cation of accounting principles and the recognized amounts of assets, liabilities,
revenue and expenses. These estimates and assumptions are based on historical
experience and a number of other factors that seem reasonable under the prevail-
ing circumstances. The results of these estimates and assumptions are then used
to judge the recognized values of assets and liabilities that are otherwise not
clearly established from other sources. Actual outcomes may diverge from these
estimates and judgments.
Estimates and assumptions are reviewed regularly. Changes in estimates are rec-
ognized in the period the change is made if the change only affects this period, or
in the period the change is made and future periods if the change affects both the
period in question and future periods.
Judgments made by management when applying IFRS that have a substantial
impact on the financial reports and estimated that may lead to significant adjust-
ments in the financial reports of subsequent years are described in more detail in
Note 2.
The consolidated accounting principles stated below have been applied consis-
tently for all periods that are presented in the consolidated financial reports,
unless otherwise indicated below, and in the preparation of the consolidated
opening balance sheet in compliance with IFRS as of January 1, 2004, which
explains the transition from previously applied accounting principles to IFRS
accounting principles. The consolidated accounting principles have been applied
consistently in reporting and consolidation of the Parent Company and its subsid-
iaries, associated companies and joint ventures.
The Annual Report and the consolidated financial statement were approved for
issuance by the Board of Directors on February 15, 2006. The Parent Company
income statement and balance sheet and the consolidated income statement and
balance sheet will be subject to adoption by the Annual Shareholders’ Meeting on
March 30, 2006.
IFRS 1 “First-time Adoption of International Financial Reporting Standards” The transition to reporting in compliance with IFRS has occurred in compliance
with IFRS. The effect on comparative figures is described in Note 3.
In accordance with a voluntary option, IAS 39, “Financial Instruments: Recogni-
tion and Measurement” and IFRS 5, “Non-Current Assets Held for Sale and Dis-
continued Operations” are not being applied to the comparative figures for 2004,
but instead prospectively starting on January 1, 2005.
The Group has chosen to apply the transitional rule in IFRS 1 when accounting
for employee benefits in compliance with IAS 19, “Employee Benefits.” This
implies that unrecognized actuarial gains and losses are re-set to zero in equity
as of January 1, 2004. In addition, in the 2005 financial statements, actuarial gains
and losses have been recognized directly in equity in accordance with the amend-
ment to IAS 19 adopted by the EU in November 2005.
The Group has chosen to apply the transitional rule in IFRS 1 when transitioning
to IFRS 3, “Business Combinations,” which means that application will occur pro-
spectively from January 1, 2004.
Effective from January 1, 2005, Skanska has also changed its principle for recog-
nition of contingent liabilities, as explained in the section on IAS 37, “Provisions,
Contingent Liabilities and Contingent Assets.”
Application in advance of IFRSs and interpretations newly published or revised during 2005Pension obligations
The International Accounting Standards Board (IASB) has amended IAS 19,
“Employee Benefits,” which has also been adopted by the EU. This allowed an
alternative treatment of surpluses and deficits in defined-benefit pension plans.
The alternative rule implies that actuarial gains and losses are recognized directly
in the balance sheet and thus do not give rise to any effect on income. The conse-
quence of the alternative method is that future changes in actuarial assumptions,
positive and negative, will have an immediate impact on recognized equity and
interest-bearing net receivables/net debt. Skanska has decided to apply this alter-
native method. The adjustment implies that interest-bearing pension liability
increases by SEK 2.1 billion and the equity of the Group is reduced by about SEK
1.6 billion, taking into account taxes and social insurance contributions.
The increase in pension liability is divided into actuarial gains and losses amount-
ing to SEK 1.5 billion in 2005 and SEK 0.6 billion in 2004, respectively.
Otherwise, newly issued IFRSs or interpretations have not been applied in
advance.
With the exception of the effect of applying the amended rules in IAS 19, no
important effect is deemed to occur in income and financial position when apply-
ing newly issued or revised IFRSs and interpretations.
IAS 1, “Presentation of Financial Statements.”This accounting standard deals with financial statements, a term that refers to the
income statement, balance sheet, statement of changes in equity, cash flow state-
ment, description of accounting principles applied and information provided in
the form of notes.
The standard specifies that the financial statements are to be prepared using the
accrual principle, i.e. transactions and events are recognized as income or expens-
es when they occur. Expenses are recognized when the corresponding income is
recognized (the matching principle).
Offsetting of assets and liabilities occurs only in those cases where it is permitted
according to the accounting standard. An equivalent rule applies to income and
expenses.
Income statement
Reported as revenue are project revenue, divestment of current-asset properties,
deliveries of materials and merchandise, rental income and other operating reve-
nue.
Reported as cost of sales are, among others, direct and indirect manufacturing
expenses, loss risk provisions, the book values of divested current-asset properties,
bad debt losses and warranty expenses. Also included is depreciation on property,
plant and equipment that is used for construction, manufacturing and property
management.
Selling and administrative expenses include customary administrative expenses,
technical expenses and selling expenses, as well as depreciation of machinery and
equipment that have been used for selling and administration. Goodwill impair-
ment losses in the consolidated financial statements are also reported as a selling
and administrative expense.
Income/loss from joint ventures and associated companies is recognized sepa-
rately in the income statement, allocated in the consolidated income statement
between operating income (share of income after financial items) and taxes.
Share of income in partnerships and limited partnerships, including their foreign
equivalents, is recognized in its entirety as operating income, except for a small
number of holdings in limited partnerships of a financial nature, which are recog-

Skanska Annual Report 2005 Notes, including accounting and valuat ion pr inc iples 67
No
tes,
incl
ud
ing
acc
ou
nti
ng
an
d v
alu
atio
n p
rin
cip
les
nized among financial items.
Financial income and expenses are recognized divided into three lines: “Finan-
cial income,” “Financial expenses” and “Income from associated companies.”
Recognized under financial income are interest income and dividends, and recog-
nized among financial expenses are interest expenses and other net financial
items, which refer among other things to expenses related to bank transactions.
By applying IAS 39, “Financial instruments: Recognition and Measurement,” start-
ing on January 1, 2005 changes in the fair value of financial instruments that are
accounted for at fair value are recognized as a separate sub-item among financial
income and expenses. The change affects currency derivatives, which are connect-
ed to financial activities, and interest rate swaps. If the net amount per type of
instrument when reappraising financial assets and liabilities is positive, it is recog-
nized as financial income. If it instead is negative, it is included among financial
expenses. The net amount of exchange rate differences is treated in the same way.
Assets
Assets are divided into current assets and non-current assets. An asset is regarded
as a current asset if it is expected to be realized within twelve months from the
balance sheet date or within the Company’s operating cycle. Operating cycle
refers to the period from the signing of a contract until the Company receives cash
payment on the basis of a final inspection or deliveries of goods (including proper-
ties). Since the Group performs large contracting projects and project develop-
ment, which as a rule are underway for more than twelve months, the operating
cycle criterion means that many more assets are labeled as current assets than if
the only criterion were “within twelve months.”
If an asset does not fulfill the requirement for a current asset, it is classified as a
non-current asset.
Liquid assets consist of cash and immediately available deposits at banks and
equivalent institutions plus short-term liquid investments with a maturity from the
acquisition date of less than three months, which are subject to only an insignifi-
cant risk of fluctuations in value. Liquid assets that cannot be used freely are
reported as current assets (current receivables) if the restriction will cease within
twelve months from the balance sheet date. In other cases, liquid assets are
reported as non-current assets. Liquid assets that belong to a construction consor-
tium are liquid assets with restrictions if they may only be used to pay the debts of
the consortium.
Assets that meet the requirements in IFRS 5, “Non-current Assets Held for Sale
and Discontinued Operations” are accounted for as a separate item among cur-
rent assets.
Note 32 shows the allocation between interest-bearing and non-interest-bear-
ing assets.
In Note 33, assets are divided into amounts for assets expected to be recovered
within twelve months from the balance sheet date and assets expected to be
recovered after twelve months from the balance sheet date. The division for non-
financial non-current assets is based on expected annual depreciation. The divi-
sion for current-asset properties is mainly based on outcomes during the past
three years. This division is even more uncertain than for other assets, since the
outcome during the coming year is strongly influenced by the dates when binding
contracts for large individual properties are signed.
Equity
The Group’s equity is now divided into “Capital stock” (share capital), “Contribut-
ed capital,” “Reserves,” “Retained earnings” and “Minority interest.” Minority
interest includes surplus values from acquisitions of businesses that were made
starting in 2004. The new Swedish Companies Act, which went into effect on Jan-
uary 1, 2006, eliminates the requirement that Group equity be divided into
restricted and unrestricted reserves.
Holdings of the Company’s own shares and other equity instruments are recog-
nized as a reduction in equity. Acquisitions of such instruments are reported as a
deduction from equity. Proceeds from the divestment of equity instruments are
recognized as an increase in equity. Any transaction costs are recognized directly
in equity.
Dividends are recognized as a liability, once the Annual Shareholders’ Meeting
has approved the dividend.
A description of equity and the year’s changes is provided in Note 27.
Liabilities
Liabilities are allocated between current liabilities and non-current liabilities. Rec-
ognized as current liabilities are liabilities that are either supposed to be paid with-
in twelve months from the balance sheet date or, although only in the case of
business-related liabilities, are expected to be paid within the operating cycle.
Since the operating cycle is thus taken into account, no non-interest-bearing liabil-
ities, for example trade accounts payable and accrued employee expenses, are
reported as non-current. Interest-bearing liabilities can be reported as non-current
even if they fall due for payment within twelve months from the balance sheet
date, if the original maturity was longer than twelve months and the company
has reached an agreement to refinance the obligation long-term before the annu-
al accounts are submitted. Information on liabilities is provided in Notes 28 and
31.
In Note 33, liabilities are allocated between amounts for liabilities to be paid
within twelve months of the balance sheet date and liabilities to be paid after
twelve months from the balance sheet date. Note 32 also provides information
about the allocation between interest-bearing and non-interest-bearing liabilities.
IAS 27, “Consolidated and Separate Financial Statements”The consolidated financial statements encompass the accounts of the Parent
Company and those companies in which the Parent Company, directly or indirect-
ly, has a controlling influence. “Controlling influence” directly or indirectly implies
a right to shape a company’s financial and operating strategies for the purpose of
obtaining financial benefits. This normally requires ownership of more than 50
percent of the voting power of all participations. When judging whether a con-
trolling influence exists, potential voting rights that can be utilized or converted
without delay is taken into account. If, on the acquisition date, a subsidiary meets
the conditions to be classified as held for sale in compliance with IFRS 5, “Non-cur-
rent Assets Held for Sale and Discontinued Operations,” it is reported according to
that accounting standard.
Acquired and divested companies, respectively, are consolidated or deconsoli-
dated, respectively, from the date of the acquisition/divestment.
In preparing the consolidated financial statements, intra-Group receivables,
revenue and expenses are eliminated in their entirety.
Gains that arise from intra-Group transactions and that are unrealized from the
standpoint of the Group on the balance sheet date are eliminated in their entirety.
Unrealized losses on intra-Group transactions are also eliminated in the same way
as unrealized gains, to the extent that the loss does not correspond to an impair-
ment loss.
Goodwill attributable to operations abroad is expressed in local currency. Trans-
lation to SEK complies with IAS 21, “The Effects of Changes in Foreign Exchange
Rates.”
IFRS 3, “Business Combinations”This accounting standard deals with business combinations, which refers when
seperate companies or busineses are brought together to form a reporting entity.
If an acquisition does not relate to a business, which is normal when acquiring
properties, regardless of whether the properties are acquired directly or indirectly
through acquisition of holdings in real estate companies, the rules below are not
applicable. In such cases, the acquisition cost is allocated among the individual
identifiable assets and liabilities based on their relative fair values on the acquisi-
tion date. Unlike acquisitions for which IFRS 3 is applicable, acquisitions in these
cases will not give rise to goodwill, a deferred tax asset or a deferred tax liability.
Acquisitions of businesses, regardless of whether the acquisition concerns hold-
ings in another company or a direct acquisition of assets and liabilities, are report-
ed according to the purchase method of accounting. If the acquisition concerns
holdings in a company, the method implies that the acquisition is regarded as a
transaction through which the Group indirectly acquires the assets of a subsidiary
and assumes its liabilities and contingent liabilities. Cost in the consolidated
accounts is determined by means of an acquisition analysis in conjunction with the
business combination. The analyses establishes both the cost of holdings or the
business and the fair value of acquired identifiable assets plus the liabilities and
contingent liabilities assumed. The difference between the cost of holdings in a
subsidiary and the fair value of acquired assets and liabilities and contingent liabili-
ties assumed is goodwill on consolidation. Due to the introduction of IFRS 3, it is
no longer permitted to recognize restructuring reserves in connection with the
acquisition.
Note 1 continued
68 Notes, including accounting and valuat ion pr inc iples Skanska Annual Report 2005
No
tes,
incl
ud
ing
acc
ou
nti
ng
an
d v
alu
atio
n p
rin
cip
les
As for goodwill acquired before January 1, 2004, in transitioning to IFRS
the Group has not applied IFRS 3 retroactively. Instead the carrying amount
as of that date will continue to serve as the Group’s cost.
Goodwill is carried at cost minus accumulated impairment losses. Goodwill is
allocated among cash-generating units by annual impairment testing in compli-
ance with IAS 36, “Impairment of Assets.”
In case of business combinations where the cost of acquisition is below the net
value of acquired assets and the liabilities and contingent liabilities assumed, the
difference is recognized directly in the income statement.
IAS 21, “The Effects of Changes in Foreign Exchange Rates” Foreign currency transactions
Foreign currency transactions are translated into an entity’s functional currency at
the exchange rate prevailing on the transaction date. Monetary assets and liabili-
ties in foreign currency are translated to the functional currency at the exchange
rate prevailing on the balance sheet date. Exchange differences that arise from
translations are recognized in the income statement. Non-monetary assets and
liabilities recognized at historic cost are translated at the exchange rate on the
transaction date.
Functional currency is the currency of the primary economic environment where
the companies in the Group conduct their business. The companies in the Group
are the Parent Company, subsidiaries, associated companies and joint ventures.
Financial reports of foreign operations
Assets and liabilities in foreign operations, including goodwill and other consoli-
dated surpluses and deficits, are translated to Swedish kronor at the exchange
rate prevailing on the balance sheet date. Revenue and expenses in a foreign
operation are translated to Swedish kronor at the average exchange rate. Reve-
nue and expenses attributable to foreign operations located in countries with
hyperinflation are translated to the functional currency at the exchange rate on
the balance sheet date.
Translation differences that arise from currency translation of foreign operations
are recognized directly in equity as a translation reserve.
Before doing a currency translation of financial reports of foreign operations
located in countries with hyperinflation, the financial reports are adjusted with
the help of a reliable inflation index. This is done in order to take into account the
changes in the purchasing power in the company’s functional currency, ordinarily
its local currency. Only the year in question is adjusted with the help of an inflation
index.
Net investment in a foreign operation
Translation differences that arise in connection with translation of a foreign net
investments and accompanying effects of hedging of net investments are recog-
nized directly in the translation reserve in equity. When divesting a foreign opera-
tion, the accumulated translation differences attributable to the operation are
realized in the consolidated income statement after subtracting any currency
hedging. As for accumulated translation differences attributable to the period
before January 1, 2004, these are stated at zero upon transition to IFRS.
IFRS 5, Non-current Assets Held for Sale and Discontinued OperationsThe meaning of classifying a non-current asset or a disposal group as held for sale
is that its carrying amount will be recovered principally through a sale transaction,
rather than through continuing use.
Immediately before classifying them as held for sale, the carrying amount of the
assets and all assets and liabilities in a disposal group must be determined in com-
pliance with applicable accounting standards. When first classifying them as held
for sale, non-current assets and disposal groups are recognized at the carrying
amount or fair value, whichever is lower. According to IFRS, certain balance sheet
items including deferred tax assets and financial assets covered by IAS 39, “Finan-
cial Instruments: Recognition and Measurement,” are exempted from the valua-
tion rules that apply in IFRS 5. On each subsequent reporting date, the non-cur-
rent asset or the disposal group as a whole shall be recognized at fair value minus
selling expenses. However, recognized gains may not exceed previous impairment
losses.
A discontinued operation is a portion of a company’s operations that represents
a separate line of business or a major operation in a geographic area and is part of
a single coordinated plan to dispose of a separate line of business carried out in a
geographic area, or is a subsidiary acquired exclusively with a view to resale.
Classification as a discontinued operation occurs upon divestment, or at an
earlier date when the operation meets the criteria to be classified as held for
sale. A disposal group that is to be shut down can also qualify as a discontinued
operation if it meets the above size criteria.
If a non-current asset or disposal group is to be classified as held for sale, the
asset (disposal group) must be available for sale in its present condition. It must
also be highly probable that the sale will occur. In order for a sale to be highly
probable, a decision must have been made at management level, and active
efforts to locate a buyer and complete the plan must have been initiated. The
asset or disposal group must be actively marketed at a price that is reasonable in
relation to its fair value, and it must be probable that the sale will occur within
one year.
Depreciation or amortization of a non-current asset is not made as long as it is
classified as held for sale.
Non-current assets classified as held for sale as well as disposal groups and lia-
bilities attributable to them must be presented separately in the balance sheet.
Further information is provided in Note 5.
IAS 28, “Investments in Associates”Reported as associated companies are companies in which the Skanska Group
exercises significant but not controlling influence, which is presumed to be the
case when the Group’s holding amounts to a minimum of 20 percent and a maxi-
mum of 50 percent of the voting power. In addition, it is presumed that this own-
ership is one element of a long-term connection and that the holding shall not be
reported as a joint venture.
The equity method
From the date when Skanska obtains a significant influence, holdings in associat-
ed companies are included in the consolidated financial statements according to
the equity method. Any difference upon acquisition between the cost of the hold-
ing and Skanska´s share of net fair value of the associated company’s identifiable
assets, liabilities and contingent liabilities is recognized in compliance with IFRS 3,
“Business Combinations.” The equity method implies that the carrying amount of
the Group’s shares in associated companies is equivalent to the Group’s share of
their capital stock as well as goodwill in the consolidated accounts and any other
remaining consolidated surplus or deficit amounts. The consolidated income
statement includes the Group’s share of the associated company’s income after
financial items, adjusted for any depreciation/amortization, impairment losses or
dissolvement of acquired surpluses or deficits as well as internal profits, among
“Income from joint ventures and associated companies.” For certain associated
companies of a financial nature, Skanska’s share of income is recognized among
financial items. The Group’s share of the tax expense of an associated company is
included in “Taxes.” Dividends received from an associated company reduce the
book value of the investment.
When the Group’s share of recognized losses in an associated company exceeds
the recognized value of the holdings in the consolidated financial statements, the
value of the holding is reduced to zero. Settlement of losses also occurs against
long-term unsecured financial assets which, in substance, form part of Skanska´s
net investment in the associated company. Continued losses are not recognized
unless the Group has provided guarantees to cover losses arising in the associated
company.
Internal profits
When profits arise from transactions between the Group and an associated com-
pany, the portion equivalent to the Group’s share of ownership is eliminated. The
elimination of the internal profit is adjusted in later financial statements based on
how the asset is used or when it is divested. If a loss instead arises from a transac-
tion between the Group and an associated company, elimination occurs only if the
loss does not correspond to an impairment loss on the asset.
The equity method is applied until the date when significant influence ceases.
Note 20 provides information about associated companies.
IAS 31, “Interests in Joint Ventures” Companies operated jointly with other companies, and in which control is exer-
cised jointly according to agreement, are reported as joint ventures.
The equity method, which is described in the section on associated companies, is
applied when preparing the consolidated financial statements. The consolidated
Note 1 continued

Skanska Annual Report 2005 Notes, including accounting and valuat ion pr inc iples 69
No
tes,
incl
ud
ing
acc
ou
nti
ng
an
d v
alu
atio
n p
rin
cip
les
income statement recognizes the Group’s share of the income in joint ventures
before taxes, adjusted for any depreciation/amortization, impairment losses or
dissolvements of acquired surplus or deficit amounts as well as internal profits,
among “Income from joint ventures and associated companies.” The Group’s
share of the tax expense of a joint venture is included in “Taxes.”
In connection with infrastructure projects, the Group’s investment may include
either holdings in or subordinated loans to a joint venture. Both are treated in the
accounts as holdings.
Internal profits
Internal profits that have arisen from transactions between the Group and a joint
venture are eliminated based on the Group’s share of ownership. The elimination
of the internal profit is adjusted in later financial statements based on how the
asset is used or when it is divested. If a loss instead arises from a transaction
between the Group and a joint venture, elimination occurs only if the loss does
not correspond to an impairment loss on the asset.
Note 20 provides information about joint ventures.
IAS 11, “Construction Contracts”Project revenues are reported in compliance with IAS 11, “Construction Con-
tracts.” This implies that the income from a construction project is reported suc-
cessively as the project accrues. The stage of completion is mainly determined on
the basis of accumulated project expenses in relation to estimated accumulated
project expenses upon completion. If the outcome cannot be estimated in a satis-
factory way, revenue is reported as equivalent to accumulated expenses on the
balance sheet date (zero recognition). Anticipated losses are immediately reported
as expenses. If the construction project also includes liability to the customer for
divestment of completed housing units, the number of unsold units is taken into
account when recognizing the earnings of the construction project, by recogniz-
ing a profit that is proportional to both the stage of completion and the degree of
sales. This means that if the stage of completion is 50 percent and the degree of
sales likewise is 50 percent, 25 percent of forecasted final profit is reported (fore-
casted loss is reported immediately as an expense at 100 percent).
Recognized as project revenue are the originally agreed contract amount as well
as additional work, claims for special compensation and incentive payments, but
normally only to the extent that these have been approved by the customer.
If substantial advance payments have been received, interest on the advance
payment is included in the reporting of each project.
The difference between accrued project revenue and a not yet invoiced amount
is reported as an asset according to the percentage of completion method. Corre-
spondingly, the difference between an invoiced amount and not yet accrued proj-
ect revenue is reported as a liability. Major machinery purchases that are intended
only for an individual project and significant investments are included to the
extent they can be attributed to future activities as claims on the customer and are
included in the asset or liability amount stated in this paragraph, however without
affecting accrued project revenue.
Generally speaking, tendering expenses are recognized on a continuous basis.
When an order is received, tendering expenses attributable to a project and that
arose no earlier than at the beginning of the quarter when the order was received,
may be reversed and treated as project expenditures. This implies that tendering
expenses that were recognized in prior interim or annual financial statements may
not be reversed in later financial statements. As for tendering expenses related to
infrastructure projects, these are also recognized on a continuous basis. Reversal
may occur beginning in the quarter when the Group receives the status of pre-
ferred bidder.
Unrealized gains and losses on forward contracts related to hedging of operat-
ing transaction exposure are included, to the stage of completion, in the reporting
of the respective project.
A construction consortium that has been organized to perform a single con-
struction assignment is not an independent legal entity, since the participating co-
owners are also directly liable for its obligations. Skanska’s share of the construc-
tion assignment is thus recognized as an independent operation.
Most contracting agreements contain regulations concerning warranty obliga-
tions on the part of the contractor, with the contractor being obliged to remedy
errors and omissions discovered within a certain time after the property has been
handed over to the customer. Such obligations may also be required by law. Provi-
sions are made for these warranty obligations on a continuous basis, since their
estimated cost must be included in the estimated final cost of the project and thus
be accounted for by the percentage of completion method. The main principle is
that a provision for warranty obligations must be calculated for each individual
project. The provision is calculated for units with similar projects, with the help of
ratios that have historically provided a satisfactory provision for these expenses.
IAS 18, “Revenue”Revenue other than project revenue is recognized in compliance with IAS 18, “Rev-
enue.” For lease income, this means that the revenue is divided evenly over the
period of the lease. The total cost of benefits provided is recognized as a reduction
in lease income on a straight-line basis over the lease period. Compensation for ser-
vices performed that does not comprise project revenue is recognized as revenue
based on the stage of completion on the balance sheet date, which is normally
determined as services performed on the balance sheet date as a proportion of the
total to be performed. Deliveries of merchandise are reported as revenues when
the risks and rewards associated with ownership of the merchandise has been
transferred to the buyer. Divestment of completed current-asset properties that
belong to Commercial Project Development is normally reported as a revenue item
during the reporting period when a binding agreement on the sale is reached.
However, if the property being divested is not yet completed and the buyer will
occupy it only after completion, the gain is reported at the pace that the property is
completed. Income on the sale of land in conjunction with residential projects is
included in the reporting of the entire project.
A dividend is recognized as revenue when the right to receive payment is judged
to be certain.
Interest is recognized using an interest rate that provides a uniform return on the
asset in question, which is achieved by applying the effective interest method.
Effective interest is the interest rate at which the present value of all future pay-
ments is equal to the carrying amount of the receivable.
Revenue is carried at the fair value of what is received or will be received. This
means that receivables arising at the time of divestments are regarded as having
been acquired at fair value (discounted present value of future incoming payments)
if the interest rate on the date of the purchase is below the market interest rate and
the difference is significant. For example, discounting of a receivable may occur in
connection with a property divestment if the purchase price receivable is not set-
tled immediately. This takes into account that any operating net until the property
is transferred is recognized as interest.
Revenue is not recognized if it is probable that the economic benefits will not
flow to the Group. If uncertainty later arises with regard to the possibility of receiv-
ing payment for an amount that has already been recognized as revenue, the
amount for which payment is no longer probable is instead recognized as an
expense, instead of as an adjustment of the revenue amount that was originally
recognized.
IAS 17, “Leases”The accounting standard distinguishes between finance and operating leases. A
finance lease is characterized by the fact that the economic risks and rewards inci-
dental to ownership of the asset have substantially been transferred to the lessee.
If this is not the case, the agreement is regarded as an operating lease.
Finance leases
Finance lease assets have been recognized as an asset in the consolidated balance
sheet. The obligation to make future lease payments has been recognized as a non-
current or current liability. Leased assets are depreciated during their respective
useful life. When making payments on a financial lease, the minimum lease pay-
ment is allocated between interest expense and retirement of the outstanding lia-
bility. Interest expense is allocated over the lease period in such a way that each
reporting period is charged an amount equivalent to a fixed interest rate for the lia-
bility recognized during each respective period. Variable payments are recognized
among expenses in the periods when they arise.
Assets leased according to finance leases are not recognized as property, plant
and equipment, since the risks incidental to ownership have been transferred to the
lessee. Instead a financial receivable is recognized, related to future minimum lease
payments.
Operating leases
As for operating leases, the lease payment is recognized as an expense over the
Note 1 continued

70 Notes, including accounting and valuat ion pr inc iples Skanska Annual Report 2005
No
tes,
incl
ud
ing
acc
ou
nti
ng
an
d v
alu
atio
n p
rin
cip
les
lease term on the basis of utilization, and taking into account the benefits that
have been provided or received when signing the lease.
The amount stated in Note 41 for operating leases includes only rents from cur-
rent-asset properties that contain commercial space, since other current-asset
properties are intended to be divested when contracting projects are completed.
Note 41 provides information about leases.
IAS 16, “Property, Plant and Equipment”Property, plant and equipment are recognized as assets in the balance sheet if it is
probable that the Group will derive future economic benefits from them and the
cost of an asset can be reliably estimated. Property, plant and equipment are recog-
nized at cost minus accumulated depreciation and any impairment losses. Cost
includes purchase price plus expenses directly attributable to the asset in order to
bring it to the location and condition to be operated in the intended manner. Exam-
ples of directly attributable expenses are delivery and handling costs, installation,
ownership documents, consultant fees and legal services. Borrowing costs are
included in the cost of self-constructed property, plant and equipment. Impairment
losses are applied in compliance with IAS 36, “Impairment of assets.”
The cost of self-constructed property, plant and equipment includes expenditures
for materials and compensation to employees, plus other applicable manufacturing
costs that are considered attributable to the asset.
Further expenditures are added to cost only if it is probable that the Group will
enjoy future economic benefits associated with the asset and the cost can be reli-
ably estimated. All other further expenditures are recognized as expenses in the
period when they arise.
What is decisive in determining when a further expenditure is added to cost is
whether the expenditure is related to replacement of identified components, or
their parts, at which time such expenditures are capitalized. In cases where a new
component is created, this expenditure is also added to cost. Any undepreciated
carrying amounts for replaced components, or their parts, are disposed of and rec-
ognized as an expense at the time of replacement. If the cost of the removed com-
ponent cannot be determined directly, its cost is estimated as the cost of the new
component adjusted by a suitable price index to take into account inflation. Repairs
are recognized as expenses continuously. For reporting of components, in the
opening balance on January 1, 2004 an allocation has been made of book values
on December 31, 2003 of the various types of components specified in the next
paragraph.
Property, plant and equipment that consist of parts with different periods of ser-
vice are treated as separate components of property, plant and equipment. Depre-
ciation occurs on a straight-line basis during the estimated period of service, taking
into account any residual value at the end of the period. Office buildings are divid-
ed into foundation and frame, with a depreciation period of 50 years; installations,
depreciation period 35 years; and non-weight-bearing parts, depreciation period
15 years. Generally speaking, industrial buildings are depreciated during a 20-year
period without allocation into different parts. Stone crushing and asphalt plants as
well as concrete mixing plants are depreciated over 10 to 25 years depending on
their condition when acquired and without being divided into different parts. For
other buildings and equipment, division into different components occurs only if
major components with divergent useful lives can be identified. For other machin-
ery and equipment, the depreciation period is normally between five and ten years.
Equipment of little value is depreciated immediately. Gravel pits and stone quarries
are depreciated as materials are removed. Land is not depreciated. Assessments of
an asset’s residual value and period of service are performed annually.
The carrying amount of a property, plant and equipment item is removed from
the balance sheet when it is disposed of or divested, or when no further economic
benefits are expected from the use or disposal/divestment of the asset.
Provisions for restoration of an asset are normally made in the course of utiliza-
tion of the asset, because the prerequisites for an allocation at the time of acquisi-
tion rarely exist.
IAS 38, “Intangible Assets”This accounting standard deals with intangible assets. Goodwill that arises upon
acquisition of companies is recognized in compliance with the rules in IFRS 3, “Busi-
ness Combinations.”
An intangible asset is an identifiable non-monetary asset without physical sub-
stance that is used for producing or supplying goods or services or for leasing and
administration. To be recognized as an asset, it is necessary both that it be probable
that future economic benefits that are attributable to the asset will benefit the
company and that the acquisition value can be reliably calculated. It is especially
worth noting that expenditures recognized in prior annual or interim financial
statements may not later be recognized as an asset.
Intangible assets other than goodwill are recognized at cost minus accumulated
amortization and impairment losses. Impairment losses are applied in compliance
with IAS 36, “Impairment of Assets.”
Amortization is recognized in the income statement on a straight-line basis over
the period of service of intangible assets, to the extent such a period can be deter-
mined. Consideration is given to any residual value at the end of the period. Con-
cession fees are amortized on a straight-line basis over the part of the concession
period that occurs after the building or facility has gone into service for its intend-
ed purpose. Purchased software (major computer systems) is amortized over a
maximum of five years. Intangible assets with undetermined periods of service are
impairment tested annually or as soon as there are indications that the asset in
question has declined in value.
Further expenditures for capitalized intangible assets are recognized as an asset
in the balance sheet only when they increase the future economic benefits of the
specific asset to which they are attributable.
As for research and development, Skanska only capitalizes development expens-
es that have a future commercial value.
IAS 36, “Impairment of Assets”Assets covered by IAS 36, “Impairment of Assets,” must be tested on every bal-
ance sheet date for indications of impairment. The valuation of exempted assets is
tested according to the respective accounting standard.
For goodwill and other intangible assets with an indefinite useful life and intan-
gible assets that are not yet ready for use, the recoverable amount is estimated
yearly.
Impairment losses are determined on the basis of the recoverable amount of
assets, which is the higher of fair value less costs to sell and value in use. In calcu-
lating value in use, future cash flows are discounted using a discounting factor
that takes into account risk-free interest and the risk associated with the asset. For
an asset that does not generate cash flows that are essentially independent of
other assets, the recoverable amount is estimated for the cash-generating unit to
which the asset belongs. A cash-generating unit is the smallest group of assets
that generates cash inflows that are independent of other assets or groups of
assets. For goodwill, the cash-generating unit is mainly the same as the Group’s
business unit or other unit reporting to the Parent Company. Exempted from the
main rule are operations that are not integrated into the business unit’s other
operations. The same business unit may also contain a number of cash-generating
units if it works in more than one segment.
Impairment of assets attributable to a cash-generating unit is allocated mainly
to goodwill. After that, a proportionate impairment loss is applied to other assets
included in the unit.
Goodwill impairment is not reversed.
Impairment losses on other assets are reversed if there has been a change in the
assumptions on which the estimate of recoverable amount was based.
An impairment loss is reversed only to the extent that the carrying amount of
the asset after the reversal does not exceed the carrying amount that the asset
would have had if no impairment loss had occurred, taking into account the
amortization that would then have occurred.
Goodwill was impairment tested as of January 1, 2004 (transition date to IFRS)
even if there was no indication of impairment at that time.
The term “impairments” is also used in conjunction with reappraisals of the
value of properties that have been reported as current assets. However, appraisal
of these properties occurs according to the lower value principle and complies
with IAS 2, “Inventories.”
IAS 23, “Borrowing Costs”Borrowing costs are capitalized provided that it is probable that they will result in
future economic benefits and the costs can be measured reliably. Generally speak-
ing, capitalization of borrowing costs is limited to assets that take a substantial
period of time for completion, which in the Skanska Group’s case implies that capi-
talization mainly covers the construction of current-asset properties and proper-
ties for the Group’s own use (business properties or non-current-asset properties).
Capitalization occurs when expenditures included in cost have arisen and activities
to complete the building have begun. Capitalization ceases when the building is
Note 1 continued

Skanska Annual Report 2005 Notes, including accounting and valuat ion pr inc iples 71
No
tes,
incl
ud
ing
acc
ou
nti
ng
an
d v
alu
atio
n p
rin
cip
les
completed. Borrowing costs during an extended period when work to complete
the building is interrupted are not capitalized. If separate borrowing has occurred
for the project, the actual borrowing cost is used. In other cases, the cost of the
loan is calculated on the basis of the Group’s borrowing cost.
In accordance with the transitional rules in IFRS 1, “First-time Adoption of Inter-
national Financial Reporting Standards,” capitalization of borrowing costs has
been applied with full retroactivity.
IAS 12, “Income Taxes”Income taxes consist of current tax and deferred tax. Taxes are recognized in the
income statement except when the underlying transaction is recognized directly
in equity, in which case the accompanying tax effect is recognized in equity. Cur-
rent tax is tax to be paid or received that is related to the year in question, apply-
ing the tax rates that have been decided or in practice have been decided as of the
balance sheet date; this also includes adjustment of current tax that is attributable
to earlier periods.
Deferred tax is calculated according to the balance sheet method, on the basis
of temporary differences between carrying amounts of assets and liabilities and
their values for tax purposes. The amounts are calculated based on how the tem-
porary differences are expected to be settled and by applying the tax rates and tax
rules that have been decided or announced as of the balance sheet date. The fol-
lowing temporary differences are not taken into account: for a temporary differ-
ence that has arisen when goodwill is first recognized, the first recognition of
assets and liabilities that are not business combinations and on the transaction
date affect neither accounting profit nor taxable profit. Also not taken into
account are temporary differences attributable to shares in subsidiaries and asso-
ciated companies that are not expected to reverse in the foreseeable future.
Deferred tax assets related to deductible temporary differences and loss carry-for-
wards are recognized only to the extent that they will probably be utilized. The
value of deferred tax assets is reduced when it is no longer considered probable
that they can be utilized.
IAS 2, “Inventories” (current-asset properties)Both current-asset properties and inventories of goods are measured item by item
at the lower of cost and net realizable value. Net realizable value is the estimated
selling price in the ordinary course of business less the estimated costs for comple-
tion and the estimated costs necessary to make the sale.
The cost of inventories is assigned by using the first-in, first-out (FIFO) formula
and includes expenditures that have arisen from acquisition of inventory assets
and from bringing them to their present location and condition. For manufactured
goods, cost includes a reasonable share of indirect costs based on normal capacity
utilization.
Except for properties that are used in Skanska’s own business, the Group’s prop-
erty holdings are reported as current assets, since these holdings are included in
the Group’s operating cycle strategy, which implies acquisition of undeveloped
land or redevelopment property, planning, pre-construction engineering, leasing,
construction and divestment, all during a period averaging about 3 to 5 years.
Current-asset properties are divided among Commercial Project Development,
Other commercial properties and Residential Project Development. Note 22 pro-
vides information about these properties.
Before impairment loss, properties both completed and under construction are
carried at directly accumulated costs, a reasonable proportion of indirect costs
and interest expenses during the construction period.
Note 22 states estimated market values for Skanska’s current-asset properties.
For completed properties that include commercial space, market values have been
calculated partly in cooperation with external appraisers. For other current-asset
properties, the appraisal has been conducted internally.
Information on customary inventories of goods is found in Note 23.
IAS 37, “Provisions, Contingent Liabilities and Contingent AssetsProvisions
A provision is recognized in the balance sheet when the Group has a present legal
or constructive obligation as a result of a past event, it is probably that an outflow
of economic resources will be required to settle the obligation and a reliable esti-
mate of the amount can be made. When the timing of the payment will have a
material effect, provisions are estimated through discounting of expected future
Note 1 continued cash flow to a pre-tax interest rate that reflects current market assessments of the
time value of money and, if appropriate, the risks specific to the liability.
Skanska makes provisions for future expenses due to warranty obligations. The
estimate is based on the anticipated costs of each project or, for groups of similar
projects, calculated on the basis of a ratio that has historically served as a satisfac-
tory allocation for these expenses. For example, a percentage of revenue may
serve as such a ratio.
A provision is made for disputes related to completed projects if it is probable
that a dispute will result in an outflow of resources from the Group. Disputes
related to ongoing projects are taken into consideration in the valuation of the
project and are thus not included in the balance sheet item “Reserve for legal dis-
putes,” which is reported in Note 30, “Provisions.”
Provisions for restructuring expenses are recognized when a detailed restructur-
ing plan has been adopted and the restructuring has either begun or been publicly
announced.
Contingent liabilities
Contingent liabilities are possible obligations arising from past events and whose
existence will be confirmed only by the occurrence or non-occurrence of one or
more future events not wholly within the control of the Company. Also reported
as contingent liabilities are obligations arising from past events but that have not
been recognized as a liability because it is not likely that an outflow of resources
will be required to settle the obligation or the size of the obligation cannot be
estimated with sufficient reliability.
The amounts of contract fulfillment guarantees are included until the contract-
ed property has been transferred to the customer, which normally occurs upon its
approved in a final inspection. If the guarantee covers all or most of the contract
sum, the amount of the contingent liability is calculated as the contract sum
minus the value of the portion performed. In cases where the guarantee only cov-
ers a small portion of the contract sum, the guarantee amount remains
unchanged until the property is handed over to the customer. According to
accounting principles applied through 2004, the guarantee amount remained
unchanged until the guarantee formally ceased. The guarantee amount is not
reduced by being offset against payments not yet received from the customer.
Guarantees that have been received from subcontractors and suppliers of materi-
als are not taken into account, either. For the Skanska Group, the change affects
recognition of the Group’s liability for the portion of construction consortium obli-
gations incumbent upon consortium members outside the Group. If the Group
receives reciprocal guarantees related to outside consortium members’ share of
joint and several liability, these are not taken into account. Tax cases, court pro-
ceedings and arbitration are not longer included in contingent liability amounts.
Instead a separate description is provided.
In connection with contracting assignments, security is often provided in the
form of a completion guarantee from a bank or insurance institution. The issuer of
the guarantee, in turn, normally receives an indemnity from the contracting com-
pany or other Group company. In compliance with industry custom, such indemni-
ties related to the Group’s own contracting assignments are not reported as con-
tingent liabilities, since they do not involve any increased liability compared to the
contracting assignment.
It is not practicable to estimate the financial effect of contingent liabilities, to
provide an indication about uncertainties concerning the amounts or dates of
these outflows or to assess the possibility that compensation will be received.
Note 34 presents information about the Group’s contingent liabilities.
Contingent assetsContingent assets are possible assets arising from past events and whose exis-
tence will be confirmed only by the occurrence or non-occurrence of one or more
uncertain future events not wholly within the control of the Company.
In the Group’s construction operations, it is not unusual that claims for addition-
al compensation from the customer arise. If the right to additional compensation
is confirmed, this affects the valuation of the project when reporting in compli-
ance with IAS 11, “Construction Contracts.” As for claims that have not yet been
confirmed, it is not practicable to provide information about these, unless there is
an individual claim of substantial importance to the Group.
IAS 19, “Employee Benefits”This accounting standard makes a distinction between defined-contribution and
defined-benefit pension plans. Defined-contribution pension plans are defined as

72 Notes, including accounting and valuat ion pr inc iples Skanska Annual Report 2005
No
tes,
incl
ud
ing
acc
ou
nti
ng
an
d v
alu
atio
n p
rin
cip
les
plans in which the company pays fixed contributions into a separate legal entity
and has no obligation to pay further contributions even if the legal entity does not
have sufficient assets to pay all employee benefits relating to their service until the
balance sheet date. Other pension plans are defined-benefit. The calculation of
defined-benefit pension plans uses a method that often differs from local rules in
each respective country, for example from the method applied in Sweden when
calculating the Company’s liability for PRI occupational pensions. Obligations and
costs are calculated according to the “projected unit credit method.” The purpose
is to recognize expected future pension disbursements as expenses in a way that
yields more uniform expenses over the employee’s period of employment. Expect-
ed future wage or salary increases and expected inflation are taken into account in
the calculation. The present value of the obligations is to be discounted primarily
on the basis of the market return on high quality corporate bonds, with maturities
matching the pension obligations, on the balance sheet date. The fair value of plan
assets, for example in pension funds, is to be subtracted from the estimated value
of the obligations. The pension expense and the return on plan assets recognized
in the income statement refer to the pension expense and return estimated on
January 1. Divergences from actual pension expense and return comprise actuarial
gains and losses. Because Skanska has chosen to apply the amendment to IAS 19
that was adopted by the EU in November 2005, all actuarial gains and losses since
January 1, 2004 have been recognized directly in equity. In addition, the opening
balance as of January 1, 2004 recognized all actuarial gains and losses through
2003 directly in equity.
When there is a difference between how pension expense is determined in a
legal entity and the Group, a provision or receivable is recognized concerning the
difference for taxes and social insurance contributions based on the Company’s
pension expenses. The provision or receivable is not calculated at present value,
since it is based on present-value figures. Social insurance contributions on actuari-
al gains and losses are recognized directly in equity.
Obligations related to contributions to defined-contribution plans are recog-
nized as expenses in the income statement as they arise.
The Group’s net obligation related to other long-term employee benefits, aside
from pensions, amounts to the value of future benefits that employees have
earned as compensation for the services they have performed during the current
and prior periods. The obligation is calculated using the projected unit credit meth-
od and is discounted at present value, and the fair value of any plan assets is sub-
tracted. The discount rate is the interest rate on the balance sheet date for high
quality corporate bonds with a maturity matching the maturity of the obligations.
A provision is recognized in connection with termination of employees only if
the Company is obligated to end employment before the normal retirement date
or when benefits are offered in order to encourage voluntary termination. In cases
where the Company terminates employees, the provision is calculated on the basis
of a detailed plan that at least includes the location, function and approximate
number of employees affected as well as the benefits for each job classification or
function and the time at which the plan will be implemented.
Only an insignificant percentage of the Group’s defined-benefit pension obliga-
tions were financed by premiums to the retirement insurance company Alecta.
Since the required figures cannot be obtained from Alecta, these pension obliga-
tions are reported as a defined-contribution plan.
IFRS 2, “Share-based Payment”In accordance with the transitional rules in IFRS 1, Skanska’s past employee stock
option programs are not reported in compliance with IFRS 2. For these, recognition
of expenses occurs when the share price exceeds the exercise price of the option.
The Share Award Plan that was introduced during 2005 is reported as share-
based payments that are settled with equity instruments, in compliance with IFRS
2. This means that fair value is calculated on the basis of estimated fulfillment of
established income targets during the measurement period. After the end of the
measurement period, fair value is established. This value is allocated over the four-
year vesting period. There is no reappraisal after fair value is established during the
remainder of the vesting period except for changes in the number of shares
because the condition of continued employment during the vesting period is no
longer met.
Social insurance contributions
Social insurance contributions that are payable because of share-based payments
are reported in compliance with Statement 46 of the Emerging Issues Task Force,
Swedish Financial Accounting Standards Council, “IFRS 2 and Social Insurance Con-
tributions.” The cost of social insurance contributions is allocated over the period
when services are performed. The provision that arises is re-appraised on each
financial reporting date to correspond to the estimated contributions that are due
at the end of the vesting period.
IAS 7, “Cash Flow Statements”In preparing its cash flow statement, Skanska applies the indirect method in com-
pliance with the accounting standard. Aside from cash and cash equivalent flows,
liquid assets are to include short-term investments whose transformation into
bank balances may occur in an amount that is mainly known in advance. Short-
term investments with maturities of less than three months are regarded as liquid
assets. Liquid assets that are subject to restrictions are reported either as current
receivables or as non-current receivables.
In addition to the cash flow statement prepared in compliance with the stan-
dard, this Annual Report presents an operating cash flow statement that does not
conform to the structure specified in the standard. The operating cash flow state-
ment was prepared on the basis of the operations that the various business
streams carry out.
IAS 33, “Earnings per Share”Earnings per share are reported directly below the consolidated income statement
and are calculated by dividing the portion of profit for the year that is attributable
to the Parent Company’s equity holders (shareholders) by the average number of
shares outstanding during the period.
For the Share Award Plan that was introduced during 2005, the number of
potential ordinary shares during the measurement period is calculated, consider-
ing the dilution effect, on the basis of the number of shares that will be issued as a
consequence of fulfillment of the established targets. After the end of the mea-
surement period, Skanska establishes the number of shares that may be issued,
provided that the condition of continued employment is met. The number of
potential ordinary shares thus calculated is then reduced by the ratio between the
payment that Skanska is expected to receive and the average market price of a
share during the period.
IAS 24, “Related Party Disclosure”According to this accounting standard, information must be provided about trans-
actions and agreements with related companies and physical persons. In the con-
solidated financial statements, intra-Group transactions fall outside this reporting
requirement. Note 40 provides disclosures in compliance with the accounting
standard.
IAS 40, “Investment Property”Skanska reports no investment properties. Properties that are used in the Group’s
own operations (owner occupied properties) are reported in compliance with IAS
16, “Property, Plant and Equipment.” The Group’s holdings of current-asset prop-
erties are covered by IAS 2, “Inventories” and thus fall outside the application of
IAS 40, since these holdings are included in the Group’s operating cycle, which
implies acquisition of undeveloped land or redevelopment property, planning,
pre-construction engineering, leasing, construction and divestment, all during a
period averaging about 3 to 5 years.
IAS 14, “Segment Reporting”A segment is a distinguishable component of the Group that is either engaged in
providing products or services (business streams) or goods and services within a
particular economic environment (geographic area) that is subject to risks and
rewards that are different from other segments.
The division into business streams and markets reflects the internal organization
of the Company and its reporting system.
Skanska’s business streams are its primary segment reporting format. Skanska
carries out its operations in four business streams: Construction, Commercial Proj-
ect Development, Residential Project Development and Infrastructure Develop-
ment.
Skanska’s geographic markets are its secondary segment reporting format. The
division into markets that has been carried out is attributable to the natural delim-
itations between markets in the Group. The markets are Sweden, the Nordic coun-
tries excluding Sweden, Europe excluding the Nordic countries, the United States
and other markets. Discontinued operations are reported together with central
Note 1 continued

Skanska Annual Report 2005 Notes, including accounting and valuat ion pr inc iples 73
No
tes,
incl
ud
ing
acc
ou
nti
ng
an
d v
alu
atio
n p
rin
cip
les
(corporate) items and eliminations.
The geographic division in the secondary segment reflects the division of
Skanska’s business into different home markets.
In transactions between business streams, pricing occurs on market terms.
IAS 10, “Events After the Balance Sheet Date”Events after the balance sheet date may, in certain cases, confirm a situation that
existed on the balance sheet date. According to the standard, such events shall be
taken into account when financial reports are prepared. Information is provided
about other events after the balance sheet date that occur before the signing of
the financial report if its omission would affect the ability of a reader to make a
correct assessment and a sound decision.
As stated earlier, divestment of a property is normally reported as income during
the period when a binding agreement is signed, even if necessary regulatory
approvals have not yet been received. Contractual terms that in some way are at
the disposition of the counterparty may cause the reporting of income to be post-
poned while waiting for the terms to be fulfilled.
Information about events after the balance sheet date is provided in Note 42.
IAS 32, “Financial Instruments: Disclosure and Presentation”This accounting standard deals with classification of financial instruments and
what information must be provided. Treated as a financial instrument is any form
of agreement that gives rise to a financial asset in a company and a financial liabil-
ity or equity instrument in another company. Financial assets are any asset in the
form of cash, a contractual right to receive cash or other financial asset from
another company, a contractual right to exchange financial instruments with
another company on conditions that are potentially favorable or equity instru-
ments issued by another company. A financial liability is any liability that involves a
contractual obligation to deliver cash to another company or to exchange finan-
cial instruments with another company on terms that are potentially unfavorable.
Offsetting of financial assets and financial liabilities occurs when the legal right
to offset items against each other exists and there is an intention to settle the
items in a net amount or simultaneously divest the asset and settle the liability.
The standard prescribes, among other things, that a company shall provide
information on the fair value of each class of financial asset and financial liability
if this is feasible. Information shall also be provided on the carrying amount of
financial assets that serve as collateral for liabilities and contingent liabilities.
Information in compliance with the accounting standard is provided mainly in
Notes 6 and 35.
IAS 39, “Financial Instruments: Recognition and Measurement”Skanska has applied IAS 39 since January 1, 2005. Comparative figures for 2004
has not been adjusted.
The accounting standard deals with measurement and recognition of financial
instruments. Excepted from application of are, among others, holdings in subsid-
iaries, associated companies and joint ventures, leases, the rights under employ-
ment contracts, the Company’s own shares and financial instruments to which
IFRS 2, “Share-based Payments” applies.
All financial instruments covered by this standard, including all derivatives, are
reported in the balance sheet.
A derivative is a financial instrument whose value changes in response to chang-
es in an underlying variable, that requires no initial investment or one that is small
and that is settled at a future date. An embedded derivative is a contract condition
that causes the value of the contract to be affected in the same way as if the con-
dition were an independent derivative.
A financial asset or financial liability is recognized in the balance sheet when the
Group becomes a party to the contractual provisions of the instrument. Trade
accounts receivable are recognized in the balance sheet when an invoice has been
sent. A liability is recognized when the counterparty has performed and there is a
contractual obligation to pay, even if the invoice has not yet been received. Trade
accounts payable are recognized when an invoice has been received.
A financial asset is derecognized from the balance sheet when the contractual
rights are realized, expire or the Group loses control of them. The same applies to
a portion of a financial asset. A financial liability is derecognized from the balance
sheet when the contractual obligation is fulfilled or otherwise extinguished. The
same applies to a portion of a financial liability.
Acquisitions and divestments of financial assets are recognized on the transac-
tion date, which is the date that the Company undertakes to acquire or divest the
asset.
Financial instruments are initially recognized at cost, equivalent to the instru-
ment’s fair value plus transaction costs, except instruments in the category “assets
at fair value through profit or loss,” which are recognized exclusive of transaction
costs. Recognition then occurs depending on how they are classified as described
below.
Financial assets, including derivatives, are classified as “assets at fair value
through profit or loss,” “held-to-maturity investments,” “loans and receivables”
and “available-for-sale assets.”
“Assets at fair value through profit or loss,” and “available-for-sale assets” are
measured at fair value in the balance sheet. Change in fair value of “assets at fair
value through profit or loss” is recognized in the income statement, while change
in value of “available-for-sale assets” is recognized directly in equity. At derecogni-
tion, accumulated gains or losses are transferred to the income statement. “Held-
to-maturity investments” and “loans and receivables” are measured at amortized
cost.
Financial liabilities including derivatives are classified as “liabilities at fair value
through profit or loss” and “other financial liabilities.”
“Liabilities at fair value through the profit or loss” are measured at fair value in
the balance sheet, with change of value recognized in the income statement.
“Other financial liabilities” are measured at amortized cost.
Skanska uses currency derivatives and foreign currency loans to hedge fluctua-
tions in exchange rates. Accounting for derivatives varies depending on whether
hedge accounting in compliance with IAS 39 is applied or not.
Unrealized gains and losses on currency derivatives related to hedging of oper-
ating transaction exposure are measured and recognized at fair value in the bal-
ance sheet. The entire change in fair value is recognized directly in the income
statement, except in those cases where hedge accounting is applied. In hedge
accounting, unrealized gain or loss is recognized in operating income according to
a project’s stage of completion, while the remainder is recognized in equity. When
the hedged transaction occurs and is recognized in the income statement, accu-
mulated changes in fair value are transferred from equity to the operating income.
Unrealized gains and losses on embedded currency derivatives in commercial
contracts are measured and recognized at fair value in the balance sheet. Changes
in fair value are recognized in the operating income.
Currency derivatives and foreign currency loans for hedging net investments are
carried at fair value in the balance sheet. Because hedge accounting is applied,
exchange rate differences after taking into account tax effect are recognized in
consolidated equity. If a foreign operation is divested, accumulated exchange rate
differences attributable to that operation are transferred from equity to the
income statement. The interest component and changes in the value of the inter-
est component of currency derivatives are recognized as financial income or
expenses under the heading “Net change of value due to revaluation of financial
assets/liabilities.”
Skanska uses interest rate derivatives to hedge against fluctuations in interest
rates. Hedge accounting in compliance with IAS 39 is not applied, however.
Unrealized gains and losses on interest rate derivatives are recognized at fair
value in the balance sheet. Changes in fair value excluding the current interest
coupon portion, which is recognized as interest income or an interest expense, are
recognized as financial income or expenses in the income statement under the
heading “Net change of value due to revaluation of financial assets/liabilities.”
Skanska has entered into swap agreements related to shares in Skanska AB. An
unrealized gain or loss consists of the difference between the market value of a
share on the balance sheet date and the initial price of swap agreements. The
unrealized gain or loss is recognized in the balance sheet. Changes of fair value
are recognized as financial income or expenses in the income statement under the
heading “Net change of value due to revaluation of financial assets/liabilities.”
IAS 20, “Accounting for Government Grants and Disclosure of Government Assistance”“Government assistance” refers to action by government designed to provide an
economic benefit specific to one company or a range of companies that qualify
under certain criteria. Government grants are assistance by government in the
form of transfers of resources to a company in return for past or future compli-
ance with certain conditions relating to its operations.
Note 1 continued

74 Notes, including accounting and valuat ion pr inc iples Skanska Annual Report 2005
No
tes,
incl
ud
ing
acc
ou
nti
ng
an
d v
alu
atio
n p
rin
cip
les
Government grants are recognized in the balance sheet as prepaid income when
it is reasonable assurance that the grants will be received and that the Group will
meet the conditions associated with the grant.
The Swedish Financial Accounting Standards Council’s standard RR 30, “Supplementary Accounting Regulations for Groups”The standard specifies what further disclosures must be provided in order for the
annual accounts to conform with Sweden’s Annual Accounts Act. The additional
information mainly concerns personnel-related disclosures.
The disclosure on the number of employees, allocated between men and
women as well as among countries, is provided in Note 37, “Personnel.” The
number of employees during the year was calculated as an average of the num-
ber at four measurement dates during the year. Operations divested during the
year are not included.
The disclosure on gender breakdown specifies the situation on the balance
sheet date. “Senior executives” in the various subsidiaries refers to the members
of the management team of the respective business units. The information is pro-
vided in Note 37 and in Note 38.
Disclosures on wages, salaries, other remuneration and pension expenses are
provided concerning current and former members of Boards of Directors and
Presidents (Note 37).
In Note 17, information is provided on the assessed value for tax purposes of
non-current-asset properties located in Sweden. Disclosures on assessed value for
tax purposes are also provided for current-asset properties in Note 22.
Information is provided in Note 37 about loans, assets pledged and contingent
liabilities on behalf of members of Boards of Directors and Presidents in the
Skanska Group.
Information is also provided on remuneration to auditors and the audit firms
where the auditors work (Note 39).
Beyond what the standard specifies, information is provided about absence
from work due to illness regarding the Group’s Swedish companies (Note 37).
Order bookings and order backlogOrder backlog refers to the value of the remaining non-accrued project income
from contracted assignments.
The order backlog in the accounts of acquired subsidiaries on the date of acqui-
sition is not reported as order bookings, but is included in order backlog amounts.
Exchange rates Average Year-end exchange rate exchange rate
Currency Country/zone 2005 2004 2005 2004
ARS Argentina 2.62 2.22 2.56 2.50
CZK Tjeckien 0.32 0.30 0.31 0.29
DKK Danmark 1.26 1.21 1.25 1.23
EUR EU 9.39 9.00 9.28 9.13
GBP England 13.67 12.70 13.57 13.45
NOK Norge 1.17 1.09 1.16 1.09
PLN Polen 2.43 2.21 2.31 2.02
USD USA 7.94 6.62 7.46 7.35
Swedish kronor (SEK) per unit of each currency.
Parent Company accounting and valuation principlesThe Parent Company has prepared its annual accounts in compliance with the
Annual Accounts Act and the Swedish Financial Reporting Standards Council’s
standard RR 32, “Accounting for Legal Entities.” RR 32 implies that in the annual
accounts of the legal entity, the Parent Company must apply the International
Financial Reporting Standards (IFRS) and International Accounting Standards
(IAS), issued by the International Accounting Standards Board (IASB), to the extent
these have been adopted by the EU, as well as the interpretations by the Interna-
tional Financial Reporting Interpretations Committee (IFRIC) and its predecessor
the Standing Interpretations Committee (SIC), as far as this is possible within the
framework of the Annual Accounts Act and with respect to the connection
between accounting and taxation. A presentation of the various accounting stan-
dards can be found in the Group’s accounting and valuation principles. The state-
ments of the Swedish Financial Accounting Standards Council’s Emerging Issues
Task Force must also be applied.
Change in accounting principles
According to RR 32, IFRS 1, “First-time Adoption of International Financial Report-
ing Standards,” may not be used in the accounts of a legal entity, except for cer-
tain relief mechanisms. This means that in case of changes in accounting princi-
ples, the transitional rules in each accounting standard shall instead be applied. If
transitional rules do not exist, the transition shall be reported in compliance with
IAS 8, “Accounting Policies, Changes in Accounting Estimates and Errors.”
In the case of the Parent Company, changes in accounting principles have
occurred with regard to derivative instruments and contingent liabilities.
Derivative instruments are carried at fair value. The change in accounting princi-
ple is recognized in the statement of changes in equity as an adjustment in the
2005 opening balance. Comparative figures have not been changed.
Effective from January 1, 2005, Skanska has changed its principle for recognition
of contingent liabilities. The amounts of contract fulfillment guarantees are
included until the contracted property has been transferred to the customer,
which normally occurs upon its approved in a final inspection. If the guarantee
covers all or most of the contract sum, the amount of the contingent liability is
calculated as the contract sum minus the value of the portion performed. In cases
where the guarantee only covers a small portion of the contract sum, the guaran-
tee amount remain unchanged until the property is handed over to the customer.
According to the accounting principles applied through 2004, the guarantee
amount remained unchanged until the guarantee formally ceased. As earlier, the
guarantee amount is not reduced by being offset against payments not yet
received from the customer. Likewise, guarantees that have been received from
subcontractors and suppliers of materials are not taken into account, either.
Counter-guarantees related to outside consortium members’ share of joint and
several liability are not taken into account. Tax cases, court proceedings and arbi-
tration are not longer included in contingent liability amounts. Instead a separate
description is provided. The amounts for 2004 have been recalculated.
Important differences compared to consolidated accounting principles
The balance sheet and income statement comply with the presentation formats in
the Annual Accounts Act.
Allocations and untaxed reserves are presented on a gross basis without being
allocated between equity and deferred tax.
Defined-benefit pension plans are reported according to the regulations in the
Security of Income Act. Pension obligations secured by assets in pension funds are
not recognized in the balance sheet.
Holdings in associated companies and joint ventures, like holdings in subsidiar-
ies, are carried before any impairment loss at cost.
Group contributions
Group contributions received and provided are recognized directly in retained
earnings. Shareholder contributions provided when Group contributions are
received are also recognized directly in equity.
Note 1 continued

Skanska Annual Report 2005 Notes, including accounting and valuat ion pr inc iples 75
No
tes,
incl
ud
ing
acc
ou
nti
ng
an
d v
alu
atio
n p
rin
cip
les
Note 3 Effects of changes in accounting principles
The accounting principles presented in Note 1 have been applied to the prepara-
tion of the Group’s financial reports for the 2005 financial year and for the com-
parative year 2004 as well as to the Group’s opening balance on January 1, except
with regard to IAS 39, “Financial Instruments: Recognition and Measurement, and
IFRS 5, “Non-current Assets Held for Sale,” which in accordance with an exception
in IFRS 1, “First-time Adoption of International Financial Reporting Standards,” is
being applied only in 2005. Point A below describes the effects on reporting during
2004 and point B describes the effects of IAS 39 and IFRS 5 on January 1, 2005.
During 2005, Skanska changed its accounting principle for dealing with contin-
gent liabilities. This is described in point C. During the year, the Group adjusted its
application of certain accounting principles. Point D describes the change in deal-
ing with checks issued but not yet cashed. Point E describes accounting for joint
ventures in Infrastructure Development. Point F describes accounting for receiv-
ables from property buyers in Commercial Project Development.
A. Effects on reporting of 2004 upon transition to IFRSIn preparing the IFRS consolidated balance sheet for 2004, amounts that had been
recognized according to previously applied accounting principles were adjusted
according to IFRS. Explanations of how the transition from previous accounting
principles to IFRS affected the Group’s financial position, financial results and cash
flows can be found in the following tables and explanations of these.
Standards that affected the January 1, 2004 opening balance and 2004 comparative figures
IAS 19, “Employee Benefits”
Since 2003, the Group has applied the Swedish Financial Accounting Standards
Council’s standard RR 29, “Employee Benefits. ”Skanska has chosen to apply the
transitional rule in IFRS 1 when reporting employee benefits in accordance with
IAS 19. This means that unrecognized actuarial gains and losses are re-set to zero
in equity as of January 1, 2004. In the financial statements as of December 31,
2003, unrecognized actuarial gains amounted to SEK 287 M. As a result, provi-
sions for pensions were reduced by SEK 287 M and equity rose by SEK 203 M after
taking into account deferred tax.
The Group is using the alternative method for dealing with surpluses and defi-
cits, respectively, in defined-benefit pension plans, which means that actuarial
gains and losses are recognized directly in the balance sheet and thus do not give
rise to any effect on earnings. During 2004, actuarial losses amounted to SEK 590 M,
which meant that provisions for pensions rose by SEK 590 M and equity decreased
by SEK 425 M after taking into account a deferred tax asset of SEK 178 M and spe-
cial payroll tax of SEK 13 M.
IAS 23, “Borrowing Costs”
Capitalization of borrowing costs during the design and construction phase for
non-current assets and current-asset properties was applied with full retroactivity
according to the transitional rules (IFRS 1). Since 2002, Skanska has applied the
alternative rule in standard RR 21, “Borrowing Costs.” Capitalization of borrowing
costs according to IAS 23, “Borrowing Costs,” mainly related to current-asset
properties (SEK 172 M) and a concession for a highway project in Chile (SEK 47 M).
After taking the tax effect into account, equity increased by SEK 157 M.
During 2004, gain on sale of current-asset properties was affected in the amount
of SEK –20 M by higher book values on transition to IFRS.
IAS 38, “Intangible Assets”
The application of IAS 38, “Intangible Assets,” resulted in the capitalization of
SEK 36 M in assets, mainly computer software. After taking the tax effect into
account, this adjustment affected equity in the amount of SEK 26 M. During 2004,
higher amortization changed operating income by SEK –16 M. The capitalization
rules in IAS 38, “Intangible Assets,” also resulted in a minor reclassification from
goodwill to “Other intangible non-current assets” concerning acquisitions early in
2004 belonging to the then-business unit Skanska Services. This effect applied only
to the balance sheets for the first and second quarters of 2004, because the busi-
ness unit that made the acquisitions was divested during the third quarter of 2004.
IAS 16, “Property, Plant and Equipment”
The requirement to apply component depreciation set out in IAS 16, “Property,
Plant and Equipment,” led to an adjustment in equity of SEK –22 M during the
transition to IFRS. The balance sheet item “Property, plant and equipment”
decreased by SEK -30 M.
Note 2 Key estimates and judgments
Important estimates and judgmentsThe Senior Executive Team has discussed with the Board of Directors and the Audit
Committee the choices and disclosures related to the Group’s important account-
ing principles and estimates, as well as the application of these principles and esti-
mates.
Certain important accounting-related estimates that have been made when
applying the Group’s accounting principles are described below.
Goodwill impairment testingIn calculating the recoverable amount in cash-generating units for assessing any
goodwill impairment, a number of assumptions about future conditions and esti-
mates of parameters have been made. A presentation of these can be found in
Note 18, “Goodwill.” As understood from the description in Note 18, major
changes during 2006 in the prerequisites for these assumptions and estimates
might have a substantial effect on the value of goodwill.
Exposure to foreign currenciesChanges in exchange rates can have a relatively large impact on the Company as a
whole. Note 35, “Effects of changes in exchange rates” provides a detailed analy-
sis of exposure to foreign currencies as well as risks associated with changes in
exchange rates, including a sensitivity analysis.
Pension assumptionsSkanska recognizes defined-benefit pension obligations according to the alterna-
tive method in IAS 19, “Employee Benefits.” In this method, actuarial gains and
losses are recognized directly in equity and thus give rise to no effect on income.
The consequence is that future changes in actuarial assumptions, both positive
and negative, will have an immediate effect on recognized equity and on interest-
bearing pension liability.
Note 29, “Pensions,” describes the assumptions and prerequisites that provide
the basis for recognition of pension liability, including a sensitivity analysis.
Percentage of completion Skanska applies the percentage of completion method, i.e. using a forecast of
final project results, income is recognized successively during the course of the
project based on the stage of completion. This requires that the size of project rev-
enue and project costs can be reliably determined. The prerequisite for this is that
the Group has efficient, coordinated systems for cost accounting, forecasting and
revenue/cost reporting. The system also requires a consistent judgment (forecast)
of the final outcome of the project, including analysis of divergences compared to
earlier assessment dates. This critical judgment is performed at least once per
quarter according to the “grandfather principle,” i.e. the immediate superior
examines the project in a number of reviews at successively higher levels of the
organization.
DisputesManagement’s best judgment has been taken into account in reporting disputed
amounts, but the actual future outcome may diverge from this judgment.
See Note 34, “Assets pledged, contingent liabilities and contingent assets” and
Note 30 “Provisions”.
Investments in Infrastructure DevelopmentEstimated market values are based on discounting of expected cash flows for each
respective investment. Estimated targeted returns on investments of this type
have been used as discount rates. Changes in expected cash flows, which in a
number of cases extend 20-30 years ahead in time, and/or changes in targeted
returns, may materially affect both estimated market values and carrying amounts
for each investment.
Current-asset propertiesThe stated total market value is estimated on the basis of prevailing price levels in
the respective location of each property. Changes in the supply of similar proper-
ties as well as changes in demand due to changes in targeted return may material-
ly affect both estimated market values and carrying amounts for each property.

76 Notes, including accounting and valuat ion pr inc iples Skanska Annual Report 2005
No
tes,
incl
ud
ing
acc
ou
nti
ng
an
d v
alu
atio
n p
rin
cip
les
Note 3 continuedEffects on the balance sheet, Jan. 1, 2004 SWGAAP IFRS Dec 31 Total Jan 1SEK M 2003 IAS 19 IAS 23 IAS 38 IAS 16 IAS 11 IAS 1 changes 2004
Non-current assets Property, plant and equipment 6,730 –30 –30 6,700
Goodwill 4,259 4,259
Other intangible assets 459 47 36 83 542
Investments in joint ventures
and associated companies 1,374 1,374
Financial non-current assets 2,032 2,032
Deferred tax assets 1,539 –94 14 –80 1,459
Total non-current assets 16,393 –94 47 36 –30 14 0 –27 16,366
Current assets
Current-asset properties 1 13,694 172 172 13,866
Inventories 828 828
Financial current assets 1,248 1,248
Tax assets 415 415
Gross amount due from customers for contract work 4,814 –46 –46 4,768
Trade and other receivables 22,309 22,309
Short-term investments 218 218
Cash and cash equivalents 6,819 6,819
Total current assets 50,345 0 172 0 0 –46 0 126 50,471
TOTAL ASSETS 66,738 –94 219 36 –30 –32 0 99 66,837
EQUITY
Equity attributable to equity holders 14,169 203 157 26 –22 –32 332 14,501
Minority interest 200 200
Total equity 14,369 203 157 26 –22 –32 0 332 14,701
LIABILITIES
Non-current liabilities
Financial non-current liabilities 7,182 –1,468 –1,468 5,714
Pensions 2,058 –287 –287 1,771
Deferred tax liabilities 3,104 –4 62 10 –8 60 3,164
Non-current provisions 174 174
Total non-current liabilities 12,518 –291 62 10 –8 0 –1,468 –1,695 10,823
Current liabilities
Financial current liabilities 809 1,468 1,468 2,277
Tax liabilities 571 0 571
Current provisions 3,056 –6 –6 3,050
Gross amount due to customers
for contract work 9,311 0 9,311
Trade and other payables 26,104 0 26,104
Total current liabilities 39,851 –6 0 0 0 0 1,468 1,462 41,313
TOTAL EQUITY AND LIABILITIES 66,738 –94 219 36 –30 –32 0 99 66,837 1 Current-asset properties Commercial Project Development 9,249 172 172 9,421 Other commercial properties 1,051 0 1,051 Residential Project Development 3,394 0 3,394 13,694 0 172 0 0 0 0 172 13,866 Interest-bearing assets 10,241 0 10,241 Interest-bearing liabilities 10,091 –287 9,804
Interest-bearing net receivables 150 287 437 Capital employed 24,460 45 24,505 Equity/assets ratio, % 21.5 0.5 22.0
Changes according to standards

Skanska Annual Report 2005 Notes, including accounting and valuat ion pr inc iples 77
No
tes,
incl
ud
ing
acc
ou
nti
ng
an
d v
alu
atio
n p
rin
cip
les
Note 3 continued
IAS 11, “Construction Contracts”The accrual of certain capitalized tendering expenses according to IAS 11, “Con-
struction Contracts,” affected equity on transition to IFRS in the amount of
SEK –32 M after taking the tax effect into account. The balance sheet item “Gross
amount due from customers for contract work was affected in the amount of
SEK –46 M. During 2004, operating income was affected negatively in the amount
of SEK –18 M.
IAS 1, “Presentation of Financial Statements”The Group’s presentation formats for the income statement and the balance sheet
were affected by the transition. A new item was added under operating income,
“Income from divestments of discontinued operations.” This amount includes
gains/losses on the sale of Group companies and joint ventures. In 2004, the gain/
loss on the sale of Group companies was recognized on two lines. The gain/loss
on the sale of Group companies was recognized under “Income from Group com-
panies” and the loss on the sale of Gammon Skanska was recognized as part of
“Income from joint ventures.” The effect of gains and losses on these divestments
in the full-year 2004 income statement was as follows:
According According to, IFRS toSEK M SWGAAP related change IFRS
Income from Group companies 1,413 –1,413 0
Income from divestments of
discontinued operations 0 1,587 1,587
Income from joint ventures –35 35 0
1,378 209 1,587
Income from divestments of discontinued operations can be seen
in the following table: IFRS According According to related toSEK M SWGAAP change IFRS
Skanska Cementation –5 9 4
Skanska Services 1,165 –25 1,140
Skanska India –45 56 11
Myresjöhus 298 298
Gammon Skanska –35 169 134
Total 1,378 209 1,587
The minority interest in income is recognized in a line below profit, where the allo-
cation of profit between equity holders is shown. In the balance sheet, minority
interest is recognized as a component of equity. “Provisions” has disappeared as a
separate heading. Provisions are instead recognized among liabilities, divided into
non-current and current. The number of headings in the balance sheet has been
reduced, compared to the earlier presentation. Differences in the definition of
non-current liabilities between IAS 1 and RR 22 led to reclassifications between
non-current and current financial liabilities.
The new presentation formats can be seen in the attached income statements,
in which the “bridge” or transition from Swedish GAAP to IFRS is reported in
amounts per IAS and income statement and balance sheet item.
Standards affecting Skanska during 2004In addition to the effects of the changes in opening balance, Skanska’s 2004
results were also affected by the following international reporting standards.
IFRS 3, “Business Combinations”The Group chose to apply the transitional rule in IFRS when transitioning to IFRS 3,
“Business Combinations,” which meant that it would be applying this standard
prospectively as of January 1, 2004. During 2004, the consolidated financial state-
ments were affected by reversed goodwill amortizations totaling SEK 405 M. In
some cases, the reversal of the goodwill amortization caused the carrying amount
to exceed the net realizable value, leading to the recognition of a goodwill impair-
ment loss according to IAS, “Impairment of Assets,” of SEK –45 M. The net effect
of these items in the income statement was SEK 360 M. The effect on the balance
sheet is SEK 334 M, after the effects of exchange rate differences.
IAS 21, “The Effects of Changes in Foreign Exchange Rates”The transition to IFRS affected divestment gains/losses on the sale of Group com-
panies and joint ventures during 2004. According to RR 8, “The Effect of Changes
in Foreign Exchange Rates,” accumulated translation differences of SEK –197 M in
equity related to divestment gains/losses were transferred to the income state-
ment using Swedish GAAP. As a consequence of the IFRS 1 transition rules, accu-
mulated translation differences were re-set to zero as of January 1, 2004, result-
ing in an adjustment of SEK 234 M in accumulated translation differences related
to Group companies and joint ventures divested in 2004. According to IFRS,
income from discontinued operations thus increased by SEK 234 M related to the
reversal of negative translation differences in the income statement. (This had no
effect on equity, however.)
The gain/loss from divestments of discontinued operations was also affected
negatively in the amount of SEK –25 M on transition to IFRS because the net
assets of Skanska Services were affected by the transition to IFRS. This, in turn,
resulted in an adjustment of the gain on the divestment from SEK 1,165 M to
SEK 1,140 M.
B. Effects on reporting as of January 1, 2005 of the introduction of IAS 39 and IFRS 5Transition to IAS 39 in reporting of financial instruments as of January 1, 2005
The application of IAS 39, “Financial Instruments,” chosen by Skanska implied
that the opening balance on January 1, 2005 changed prospectively. The compara-
tive figures for 2004 were not affected. According to IAS 39, financial derivatives
such as interest rate swaps, forward rate agreements, embedded derivatives etc.
shall be carried at fair value in the balance sheet. Skanska uses financial derivatives
to adapt the interest refixing period on its net debt and to minimize its transaction
exposure and reduce translation exposure. The fair value of financial derivatives
undergoes changes as market interest rates and currency exchange rates fluctu-
ate. Carrying such items at fair value results in both positive figures and negative
figures, depending on current market interest rates and exchange rates on the
balance sheet date. The effect on January 1, 2005 implied a change in equity of
about SEK –11 M, after taking into account deferred tax.
Transition to IFRS 5, “Non-current Assets Held for Sale etc.” as of January 1, 2005Assets and liabilities held for sale
Skanska recognizes assets and disposal groups held for sale on a separate line in
the balance sheet. These assets and the collective assets and liabilities (not internal)
of the divestment categories are recognized on the lines “Assets classified as held
for sale” and “Liabilities classified as held for sale.”
As of January 1, the Group reported a number of units as divestment categories.
Businesses reported as held for sale are Skanska Prefab Mark, Skanska Modul,
Glasbyggarna and Honkavaaran Maastorakennus. For further descriptions of these
businesses and information about their divestment, see Note 5, “Non-current
assets held for sale and discontinued operations.”
The following table shows what balance sheet items were transferred to the
respective amounts as of January 1, 2005. See Note 5, “Non-current assets held for
sale and discontinued operations” for corresponding figures as of December 31,
2005.
Discontinued operationsSkanska presents the income statement divided into continuing operations and
discontinued operations.
The transition to IFRS 5 did not lead to any change in the reporting of discontin-
ued operations in the income statement compared to the rules applied in 2004
according to RR 19, “Discontinuing operations.” During 2005, no further opera-
tions were added to the category “Discontinued operations” and thus no compar-
ative figures were recalculated.
See also Note 5, “Non-current assets held for sale and discontinued operations.”
C. Change in accounting principle for contingent liabilitiesThe principle for recognizing contingent liabilities changed during 2005. This
change of principle is described in Note 1, “Accounting and valuation principles.”
The change in “Other contingent liabilities” is related to ongoing legal proceed-
ings on alleged collusive anti-competitive activities.

78 Notes, including accounting and valuat ion pr inc iples Skanska Annual Report 2005
No
tes,
incl
ud
ing
acc
ou
nti
ng
an
d v
alu
atio
n p
rin
cip
les
Note 3 continued
Total changes, allocated between continuing and discontinued operations Continuing operations Discontinued operations SWGAAP Total IFRS SWGAAP Total IFRSSEK M 2004 changes 2004 2004 changes 2004
Revenue 116,257 116,257 5,006 5,006
Cost of sales –106,657 –39 –106,696 –5,010 –5,010
Gross income 9,600 –39 9,561 –4 0 –4Selling and administrative expenses –6,671 328 –6,343 –618 10 –608
Income from divestments of discontinued operations 0 0 1,413 174 1,587
Income from joint ventures and associated companies 156 156 –23 35 12
Operating income 3,085 289 3,374 768 219 987Financial income and expenses –14 –14 –20 –20
Income after financial items 3,071 289 3,360 748 219 967Taxes –1,111 16 –1,095 –47 1 –46
Profit for the year 1,960 305 2,265 701 220 921
Effect on the income statement, Jan-Dec 2004 Divestment SWGAAP IFRS 3 of Total IFRSSEK M 2004 IAS 19 IAS 23 IAS 38 IAS 11 IAS 36 IAS 21 Services changes 2004
Revenue 121,263 0 121,263Cost of sales –111,667 –7 –20 –12 –39 –111,706
Gross income 9,596 –7 –20 –12 0 0 0 0 –39 9,557
Selling and administrative
expenses1 –7,289 –4 –18 360 338 –6,951
Income from divestment ofdiscontinued operations 1,413 199 –25 174 1,587
Income from joint venturesand associated companies 133 35 35 168
Operating income 3,853 –7 –20 –16 –18 360 234 –25 508 4,361Financial income and expenses –34 0 –34
Income after financial items 3,819 –7 –20 –16 –18 360 234 –25 508 4,327Taxes –1,158 3 5 4 5 17 –1,141
Profit for the year 2,661 –4 –15 –12 –13 360 234 –25 525 3,186
Profit for the year attributable to
Equity holders 2,648 525 3,173
Minority interest 13 0 13
1 of which goodwill amortization 405 of which goodwill impairment loss –45
Earnings per share 6.33 1.25 7.58
Return on capital employed 17.9 2.0 19.9
Return on equity 17.5 3.1 20.6
Changes in compliance with standards

Skanska Annual Report 2005 Notes, including accounting and valuat ion pr inc iples 79
No
tes,
incl
ud
ing
acc
ou
nti
ng
an
d v
alu
atio
n p
rin
cip
les
Effects on the balance sheet, Dec. 31, 2004 SWGAAP IFRS Dec 31 IFRS 3 Total Dec 31SEK M 2004 IAS 19 IAS 23 IAS 38 IAS 16 IAS 11 IAS 36 IAS 1 changes 2004
Non-current assetsProperty, plant and equipment 5,537 –30 –30 5,507
Goodwill 3,565 334 334 3,899
Other intangible assets 464 47 24 71 535
Investments in joint ventures and associated companies 862 862
Financial non-current assets 1,137 1,137
Deferred tax assets 1,526 88 19 107 1,633
Total non-current assets 13,091 88 47 24 –30 19 334 0 482 13,573
Current assets
Current-asset properties 1 11,796 152 152 11,948
Inventories 610 610
Financial current assets 2,490 2,490
Tax assets 269 269
Gross amount due from customersfor contract work 3,641 –62 –62 3,579
Trade and other receivables 21,744 21,744
Short-term investments 3,053 3,053
Cash and cash equivalents 5,815 5,815
Total current assets 49,418 0 152 0 0 –62 0 0 90 49,508
TOTAL ASSETS 62,509 88 199 24 –30 –43 334 0 572 63,081
EQUITYEquity attributable to equity holders 16,066 –244 143 17 –22 –43 334 185 16,251
Minority interest 117 117
Total equity 16,183 –244 143 17 –22 –43 334 0 185 16,368
LIABILITIESNon-current liabilities
Financial non-current liabilities 3,094 –48 –48 3,046
Pensions 831 281 281 1,112
Deferred tax liabilities 2,698 –9 56 7 –8 46 2,744
Non-current provisions 135 135
Total non-current liabilities 6,758 272 56 7 –8 0 0 –48 279 7,037
Current liabilitiesFinancial current liabilities 958 48 48 1,006
Tax liabilities 998 998
Current provisions 2,680 60 60 2,740
Gross amount due to customersfor contract work 10,428 10,428
Trade and other payables 24,504 24,504
Total current liabilities 39,568 60 0 0 0 0 0 48 108 39,676
TOTAL EQUITY AND LIABILITIES 62,509 88 199 24 –30 –43 334 0 572 63,081
1 Current-asset properties Commercial Project Development 7,256 152 152 7,408 Other commercial properties 1,272 0 1,272
Residential Project Development 3,268 0 3,268 11,796 0 152 0 0 0 0 0 152 11,948
Interest-bearing assets 12,421 0 12,421 Interest-bearing liabilities 4,922 270 5,192 Net interest-bearing receivables 7,499 –270 7,229 Capital employed 21,105 455 21,560 Equity/assets ratio 25.9 0.0 25.9
The above amounts were affected by differences between both average exchange rates for the year and by opening and closing balance sheet date exchange rates.
, Changes in compliance with standards
Note 3 continued

80 Notes, including accounting and valuat ion pr inc iples Skanska Annual Report 2005
No
tes,
incl
ud
ing
acc
ou
nti
ng
an
d v
alu
atio
n p
rin
cip
les
Note 3 continuedEffect on the balance sheet, January 1, 2005 IFRS IFRS Dec 31 Total Jan 1SEK M 2004 IAS 39 IFRS 5 changes 2005
Non-current assetsProperty, plant and equipment 5,507 –529 –529 4,978
Goodwill 3,899 3,899
Other intangible assets 535 535
Investments in joint ventures and associated companies 862 862
Financial non-current assets 1,137 116 116 1,253
Deferred tax assets 1,633 36 –49 –13 1,620
Total non-current assets 13,573 152 –578 –426 13,147
Current assetsCurrent-asset properties1 11,948 –13 –13 11,935
Inventories 610 –127 –127 483
Financial current assets 2,490 281 281 2,771
Tax receivables 269 269
Gross amount due from customers for contract work 3,579 95 –21 74 3,653
Trade and other receivables 21,744 –43 –122 –165 21,579
Short-term investments 3,053 3,053
Cash and cash equivalents 5,815 –21 –21 5,794
Assets classified as held for sale 869 869 869
Total current assets 49,508 320 578 898 50,406
TOTAL ASSETS 63,081 472 0 472 63,553
EQUITYEquity attributable to equity holders 16,251 –11 –11 16,240
Minority interest 117 117
Total equity 16,368 –11 0 –11 16,357
LIABILITIESNon-current liabilitiesFinancial non-current liabilities 3,046 254 254 3,300
Pensions 1,112 –4 –4 1,108
Deferred tax liabilities 2,744 22 –58 –36 2,708
Non-current provisions 135 135
Total non-current liabilities 7,037 276 –62 214 7,251
Current liabilitiesFinancial non-current liabilities 1,006 193 –2 191 1,197
Tax liabilities 998 –4 –4 994
Current provisions 2,740 –5 –5 2,735
Gross amount due to customers for contract work 10,428 44 –1 43 10,471
Trade and other payables 24,504 –30 –250 –280 24,224
Liabilities classified as held for sale 324 324 324
Total current liabilities 39,676 207 62 269 39,945
TOTAL EQUITY AND LIABILITIES 63,081 472 0 472 63,553
1 Current-asset properties Commercial Project Development 7,408 –13 –13 7,395 Other commercial properties 1,272 1,272 Residential Project Development 3,268 3,268 11,948 –13 0 –13 11,935
Interest-bearing assets 12,421 12,421 Interest-bearing liabilities 5,192 5,192
Net interest-bearing receivables 7,229 0 0 0 7,229
Capital employed 21,560 –11 0 –11 21,549
Equity/assets ratio 25.9 –0.2 25.7
Changes in compliancewith standards

Skanska Annual Report 2005 Notes, including accounting and valuat ion pr inc iples 81
No
tes,
incl
ud
ing
acc
ou
nti
ng
an
d v
alu
atio
n p
rin
cip
les
Contingent liabilities according to
the 2004 financial statements 20,437
Change in accounting principle:
Contingent liabilities related to construction consortia –12,204
Other contingent liabilities –808 –13,012
Contingent liabilities in 2004 according to changed accounting principle 7,425
D. Change in accounting practice for checks issued but not yet cashedTo achieve uniform accounting for cash and cash equivalents, starting in 2005,
checks issued are recognized as a reduction in the item “Cash and cash equiva-
lents” only when they are cashed. Consequently the corresponding amount
remains as an operating liability until the checks are cashed. This affects opera-
tions in the U.S. and the U.K.
This reclassification implies an increase of SEK 764 M in interest-bearing net
receivables as of July 1 and is recognized in cash flow as a reclassification of
liquid assets.
See “Accounting and valuation principles,” Note 1
E. Change in accounting practice for holdings in Infrastructure DevelopmentAs of January 1, Infrastructure Development changed its accounting for subordi-
nated loans to joint ventures. Previously recognized receivables, both interest-
bearing and non-interest-bearing, have been reclassified as investments in joint
ventures. This reclassification affected the Group’s interest-bearing net receivables
in the amount of SEK –194 M and is accounted for as a reclassification of interest-
bearing net debt.
The effect on the balance sheet of this reclassification on January 1, 2005 is
shown in the following table:
Investments in joint ventures and associated companies 250
Financial non-current assets –194
Operating receivables –56
Total 0
See “Accounting and valuation principles,” Note 1.
F. Change in accounting practice for receivables from buyers of properties in Commercial Project DevelopmentAs of January 1, 2005, the accounting practice for recognition of receivables from
buyers of properties in Commercial Project Development changed. Receivables
from buyers are treated as interest-bearing.
This change in accounting practice affected interest-bearing net receivables on
January 1, 2005 in the amount of SEK +446 M.
See “Accounting and valuation principles,” Note 1.
G. Reallocation of acquisition goodwill between the Construction and Residen-tial Project Development business streamsAs of January 1, 2005, acquisition goodwill of SEK 428 M was reallocated from
the Construction business stream to Residential Project Development. See also
Note 4, “Segment reporting.”
Note 3 continued Note 4 Segment reporting
The division into business streams and markets reflects the Company’s internal
organization and reporting system.
Skanska’s business streams are reported as primary segments. Skanska carries
out its operations in four business streams:
Construction, Commercial Project Development, Residential Project Development
and Infrastructure Development. Geographic markets are reported as secondary
segments. The market division that is used is based on the natural delimitations
between markets in the Group. Discontinued operations are reported together
with central items and eliminations. For information concernng discontinued
operations, see Note 5, “Non-current assets held for sale and discontinued opera-
tions.
Intra-Group pricing between business streams occurs on market terms.
A. Primary segment: Business streamsConstruction is the Group’s largest business stream. Construction includes both
building and civil construction, but not residential construction for Skanska’s own
account.
Residential Project Development creates residential projects for immediate sale.
Housing units are adapted to selected customer categories. The business units are
responsible for planning and selling the projects. Construction assignments are
performed by Skanska’s construction units in each respective market.
Commercial Project Development initiates, develops, leases and divests com-
mercial property projects. Project development in this business stream focuses on
office buildings, shopping malls and logistics properties located in Stockholm,
Gothenburg, the Öresund region of southern Sweden and eastern Denmark, War-
saw (Poland), Wroclaw (Poland), Budapest (Hungary) and Prague (Czech Republic).
Infrastructure Development (formerly BOT) specializes in identifying, developing
and investing in privately financed infrastructure projects, such as highways, hos-
pitals and power generating plants. The business stream focuses on creating new
potential projects in the markets where the Group has operations.
Assets and liabilities by business streamEach business stream has operating responsibility for its capital employed. The
capital employed by each business stream consists of its total assets minus tax
assets and intra-Group receivables invested in Skanska’s treasury unit (“internal
bank”) minus non-interest-bearing liabilities excluding tax liabilities. Acquisition
goodwill has been reported in the business stream to which it belongs.
Revenue and expenses by business streamEach business stream has operating responsibility for its income statement down
to and including operating income. If its assets include interest-bearing receivables
and liquid assets other than funds invested in the Group’s treasury unit, the com-
pany is also responsible for the interest income that these assets earn. No interest
expenses or taxes are found in the income statements of the respective business
streams.

82 Notes, including accounting and valuat ion pr inc iples Skanska Annual Report 2005
No
tes,
incl
ud
ing
acc
ou
nti
ng
an
d v
alu
atio
n p
rin
cip
les
Note 4 continued Discontinued Commercial operations, Resident. Project Project Infrastructure central and Group Construction Development Development Development eliminations total 2005 2004 2005 2004 2005 2004 2005 2004 2005 2004 2005 2004
Income statementExternal revenue 112,700 104,495 6,113 5,814 5,073 5,520 51 33 730 5,401 124,667 121,263
Intra-Group revenue 3,255 3,482 0 0 2 64 2 0 –3,259 –3,546 0 0
Total revenue 115,955 107,977 6,113 5,814 5,075 5,584 53 33 –2,529 1,855 124,667 121,263
Cost of sales –107,684 –101,297 –5,185 –4,993 –3,112 –3,711 –100 –45 2,679 –1,660 –113,402 –111,706
Gross income 8,271 6,680 928 821 1,963 1,873 –47 –12 150 195 11,265 9,557
Selling and administrative
expenses –5,447 –5,207 –334 –305 –228 –215 –123 –70 –554 –1,154 –6,686 –6,951
Income from divestments ofdiscontinued operations 184 1,587 184 1,587
Income from joint venturesand associated companies 47 39 17 12 5 –41 161 113 7 45 237 168
Operating income1 2,871 1,512 611 528 1,740 1,617 –9 31 –213 673 5,000 4,361Interest income 121 162 3 9 28 22 0 14 156 77 308 284
Interest expenses –137 –332 –137 –332
Change in market value 19 0 19 0
Other financial items –70 14 –70 14
Income after financial items 2,992 1,674 614 537 1,768 1,639 –9 45 –245 432 5,120 4,327Taxes –1,230 –1,141 –1,230 –1,141
Profit for the year 2,992 1,674 614 537 1,768 1,639 –9 45 –1,475 –709 3,890 3,186
Profit for the year attributable to
Equity holders 3,879 3,173
Minority interest 11 13
AssetsProperty, plant and equipment 5,243 4,972 7 5 7 6 3 1 –17 523 5,243 5,507
Intangible assets 2 3,757 3,525 481 447 541 440 19 22 4,798 4,434
Investments in associated companiesand joint ventures 134 137 106 91 16 13 1,896 766 –318 –145 1,834 862
Other shares and participations 47 58 14 18 –2 –2 59 74
Interest-bearing assets 3 5,372 3,733 75 59 591 104 3 208 10,932 8,317 16,973 12,421
Current-asset properties 1,396 1,288 3,289 3,259 5,903 7,577 –106 –176 10,482 11,948
Tax assets 2,612 1,902 2,612 1,902
Non-interest-bearing assets 27,514 22,178 1,663 1,989 198 1,056 165 105 –302 605 29,238 25,933
Assets classified as held for sale 72 72
Total assets 43,463 35,891 5,635 5,868 6,715 8,756 2,608 1,520 12,890 11,046 71,311 63,081
LiabilitiesTax liabilities 3,426 3,742 3,426 3,742
Trade and other payables and noninterest-bearing provisions 39,053 32,194 3,107 3,062 680 1,038 76 40 484 1,445 43,400 37,779
Liabilities classified as held for sale 34 34
39,053 32,194 3,107 3,062 680 1,038 76 40 3,944 5,187 46,860 41,521
Capital employed 4,410 3,697 2,528 2,806 6,035 7,718 2,532 1,480 8,946 5,859 24,451 21,560
1 of which depreciation/amortization –1,044 –1,039 –3 –2 –1 –1 –13 0 –12 –207 –1,073 –1,249 of which goodwill impairment losses/reversals of impairment losses –108 –23 –146 –108 –169 of which impairment of other assets –58 –13 –20 –14 –98 –67 –78 –192 of which gains from divestments of residential units 0 0 801 607 31 801 638 of which gains from commercial property divestments 253 150 1,626 1,495 –7 0 1,872 1,645 2 On January 1, 2004, SEK 428 M in acquisition goodwill was transferred from Construction to Residential Project Development.3 Including external cash and cash equivalents, excluding deposits in Skanska’s treasury unit.
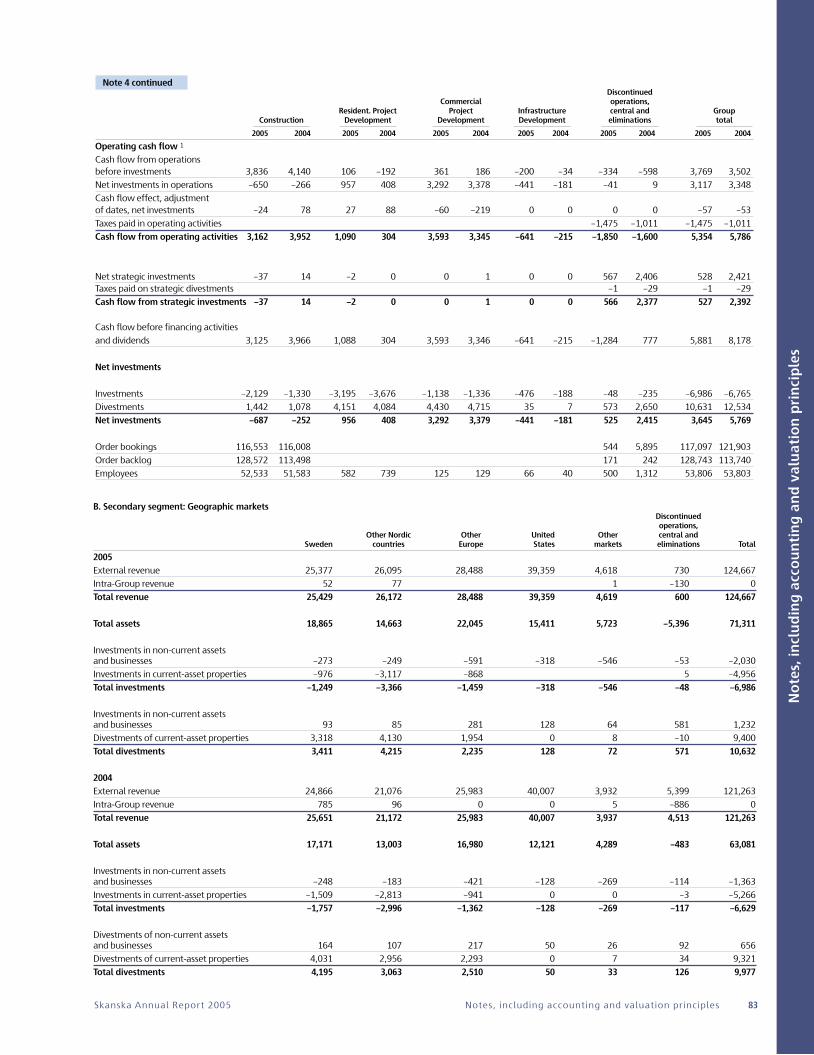
Skanska Annual Report 2005 Notes, including accounting and valuat ion pr inc iples 83
No
tes,
incl
ud
ing
acc
ou
nti
ng
an
d v
alu
atio
n p
rin
cip
les
Note 4 continued Discontinued Commercial operations, Resident. Project Project Infrastructure central and Group Construction Development Development Development eliminations total 2005 2004 2005 2004 2005 2004 2005 2004 2005 2004 2005 2004
Operating cash flow 1
Cash flow from operationsbefore investments 3,836 4,140 106 –192 361 186 –200 –34 –334 –598 3,769 3,502
Net investments in operations –650 –266 957 408 3,292 3,378 –441 –181 –41 9 3,117 3,348
Cash flow effect, adjustmentof dates, net investments –24 78 27 88 –60 –219 0 0 0 0 –57 –53
Taxes paid in operating activities –1,475 –1,011 –1,475 –1,011
Cash flow from operating activities 3,162 3,952 1,090 304 3,593 3,345 –641 –215 –1,850 –1,600 5,354 5,786
Net strategic investments –37 14 –2 0 0 1 0 0 567 2,406 528 2,421Taxes paid on strategic divestments –1 –29 –1 –29
Cash flow from strategic investments –37 14 –2 0 0 1 0 0 566 2,377 527 2,392
Cash flow before financing activities
and dividends 3,125 3,966 1,088 304 3,593 3,346 –641 –215 –1,284 777 5,881 8,178
Net investments
Investments –2,129 –1,330 –3,195 –3,676 –1,138 –1,336 –476 –188 –48 –235 –6,986 –6,765
Divestments 1,442 1,078 4,151 4,084 4,430 4,715 35 7 573 2,650 10,631 12,534
Net investments –687 –252 956 408 3,292 3,379 –441 –181 525 2,415 3,645 5,769
Order bookings 116,553 116,008 544 5,895 117,097 121,903
Order backlog 128,572 113,498 171 242 128,743 113,740
Employees 52,533 51,583 582 739 125 129 66 40 500 1,312 53,806 53,803
B. Secondary segment: Geographic markets Discontinued operations, Other Nordic Other United Other central and Sweden countries Europe States markets eliminations Total
2005External revenue 25,377 26,095 28,488 39,359 4,618 730 124,667
Intra-Group revenue 52 77 1 –130 0
Total revenue 25,429 26,172 28,488 39,359 4,619 600 124,667
Total assets 18,865 14,663 22,045 15,411 5,723 –5,396 71,311
Investments in non-current assetsand businesses –273 –249 –591 –318 –546 –53 –2,030
Investments in current-asset properties –976 –3,117 –868 5 –4,956
Total investments –1,249 –3,366 –1,459 –318 –546 –48 –6,986
Investments in non-current assetsand businesses 93 85 281 128 64 581 1,232
Divestments of current-asset properties 3,318 4,130 1,954 0 8 –10 9,400
Total divestments 3,411 4,215 2,235 128 72 571 10,632
2004External revenue 24,866 21,076 25,983 40,007 3,932 5,399 121,263
Intra-Group revenue 785 96 0 0 5 –886 0
Total revenue 25,651 21,172 25,983 40,007 3,937 4,513 121,263
Total assets 17,171 13,003 16,980 12,121 4,289 –483 63,081
Investments in non-current assetsand businesses –248 –183 –421 –128 –269 –114 –1,363
Investments in current-asset properties –1,509 –2,813 –941 0 0 –3 –5,266
Total investments –1,757 –2,996 –1,362 –128 –269 –117 –6,629
Divestments of non-current assetsand businesses 164 107 217 50 26 92 656
Divestments of current-asset properties 4,031 2,956 2,293 0 7 34 9,321
Total divestments 4,195 3,063 2,510 50 33 126 9,977

84 Notes, including accounting and valuat ion pr inc iples Skanska Annual Report 2005
No
tes,
incl
ud
ing
acc
ou
nti
ng
an
d v
alu
atio
n p
rin
cip
les
Forts. Note 4
C. Other information by business stream/reporting unit Return Operating on capital Order Revenue income employed, % Orderbacklog bookings 2005 2004 2005 2004 2005 2004 2005 2004 2005 2004
ConstructionSweden 22,141 20,519 887 579 16,004 15,485 22,087 23,039
Norway 10,502 8,640 422 215 8,631 7,371 11,353 10,195
Denmark 4,385 3,636 50 53 2,172 2,157 3,902 3,518
Finland 8,366 7,623 222 263 5,879 4,854 9,082 7,316
Poland 5,082 3,970 146 101 7,143 3,844 7,625 4,559
Czech Republic 10,303 7,906 466 368 12,493 13,047 8,567 12,910
United Kingdom 10,761 11,024 346 52 17,412 13,318 13,815 10,850
USA Building 29,944 27,601 239 –413 36,663 36,577 23,158 29,699
USA Civil 9,415 12,406 –99 218 18,381 12,116 13,179 8,242
Latin America 3,579 2,785 154 118 3,138 2,885 3,080 3,924
International 1,477 1,867 38 –42 656 1,844 705 1,756
Elimination
115,955 107,977 2,871 1,512 128,572 113,498 116,553 116,008
Residential Project DevelopmentSweden 2,394 2,046 196 136 108.1 25.4
Norway 1,343 1,234 132 122 12.0 9.7
Finland 1,616 1,609 195 151 27.5 24.0
Poland 114 116 16 10 21.5 7.7
Czech Republic 416 523 86 105 31.8 48.6
International 230 286 –14 4 –15.7 8.6
6,113 5,814 611 528 23.8 18.4
Commercial Project Development 5,075 5,584 1,740 1,617 25.1 17.7Infrastructure Development 53 33 –9 31 –0.1 3.3
Discontinued operations, central and eliminations –2,529 1,855 –213 673 171 242 544 5,895
Total 124,667 121,263 5,000 4,361 23.3 19.9 128,743 113,740 117,097 121,903
Non-current assets held for sale and discontinued operations are recognized in
compliance with IFRS 5. See “Accounting and valuation principles,” Note 1.
Discontinued operationsIn the consolidated income statement, discontinued operations are accounted for
separately.
Recognized under discontinued operations are income from divestments of dis-
continued operations and the income of these operations from January 1 until the
companies are sold. Also shown is the income from those operations still recog-
nized as ”disposal groups to be sold” at year-end.
A number of specialized companies, mainly from Skanska Sweden, are recog-
nized as a separate disposal group. ”Specialized companies” refers to units that
provide specialized services or products. During 2005, most of the companies that
were included among discontinued operations at the beginning of the year were
divested. Skanska Prefab Mark was sold during the second quarter with a capital
gain of SEK 180 M. During the fourth quarter, Skanska Modul was sold with a gain
of SEK 4 M.
Two small units remain as disposal groups under “Discontinued operations.”
Income from divestments of discontinued operations can be seen in the following
table.
2005 2004
Skanska Prefab Mark 180
Skanska Modul 4
Skanska Cementation 4
Skanska Services 1,140
Skanska India 11
Myresjöhus 298
Skanska Gammon 134
Total 184 1,587
The effects of discontinued operations on the Group’s cash flow can be seen in the
following table.
2005 2004
Cash flow from operating activities –164 66
Cash flow from investing activities 443 2,348
Cash flow from financing activities 201 –77
Total 480 2,337
Note 5 Non-current assets held for sale and discontinued operations
Note 4 continued

Skanska Annual Report 2005 Notes, including accounting and valuat ion pr inc iples 85
No
tes,
incl
ud
ing
acc
ou
nti
ng
an
d v
alu
atio
n p
rin
cip
les
Note 5 continuedAssets classified as held for saleTwo small units are reported as a disposal group held for sale.
Assets classified as held for sale Dec 31, 2005 Jan 1, 2005
Property, plant and equipment 33 529
Deferred tax assets 11 49
Inventories 1 127
Operating receivables 25 143
Cash and cash equivalents 2 21
Total 72 869
Liabilities classified as held for sale Dec 31, 2005 Jan 1, 2005
Financial liabilities 2
Pensions 8 4
Deferred tax liabilities 58
Tax liabilities 4
Provisions 5 5
Operating liabilities 29 251
Total 42 324
Note 6 Financial instruments
A. Objectives and policyFor the Skanska Group, it is essential that there is an effective and systematic
assessment of both financial and business risks. To ensure a systematic and uni-
form assessment of construction projects, Skanska uses its Operational Risk
Assessment (ORA) model on a Groupwide basis. The risk management model
does not imply avoidance of risks, but is instead aimed at identifying, managing
and pricing these risks.
The Group’s Financial Policy states guidelines, objectives and limits for financial
management and administration of financial risks in the Group. This policy docu-
ment regulates the allocation of responsibilities among Skanska’s Board, the
Senior Executive Team, Skanska Financial Services and the business units.
Within the Group, Skanska Financial Services has operative responsibility for
ensuring Group financing and efficiently managing liquidity, financial assets and
financial liabilities. Skanska Financial Services is also responsible for monitoring
compliance with the Financial Policy.
The Senior Executive Team is responsible for reporting risk exposure as well as
gains and losses from the Group’s financial activities to Skanska’s Board.
B. Financial risksFinancial risks can mainly be divided into the following categories: interest rate,
foreign exchange, refinancing and counterparty risk.
Interest rate riskInterest rate risk is the risk that changes in interest rates will adversely affect the
Group’s net interest items and/or cash flows. Various forms of derivative con-
tracts, mainly interest rate swaps and currency swaps, are used in order to adapt
the interest-rate refixing period and currency as needed or if deemed suitable.
Interest rate risk is defined as the possible negative impact in case of a sudden
one percentage point increase in interest rates across all maturities. The absolute
risk may never exceed SEK 100 M.
Refinancing riskRefinancing risk is defined as the risk caused by lack of liquidity or difficulty in
obtaining, or rolling over, external loans.
At all times, the Group shall also have the equivalent of at least SEK 4,000 M in
available liquid assets or committed credit facilities, accessible within the space of
one week.
Foreign exchange riskForeign exchange risk is defined as the risk of negative impact on the Group’s
earnings due to fluctuations in exchange rates. This risk can be divided into trans-
action exposure, i.e. net operating and financial (interest/principal payment)
flows, and translation exposure related to the shareholders’ equity of foreign
subsidiaries denominated in foreign currencies.
Although the Group has a large international presence, its operations are of a
local nature in terms of foreign exchange risks. Project revenues and costs are
mainly denominated in the same currency, and transaction risks from exchanges
between different currencies are thus very limited.
The objective stated in the Financial Policy is that all transaction exposures for
each respective business unit shall be hedged via Skanska Financial Services. This
foreign exchange risk may amount to a total of SEK 50 M, with risk calculated as
the effect on earnings of a five percentage point shift in exchange rates. The for-
eign exchange risk in transaction exposure is kept as close to zero as possible.
The foreign exchange risk that arises because portions of the shareholders’ equi-
ty of the Group are invested long-term in foreign subsidiaries, known as transla-
tion exposure, is not hedged. Exceptions to this rule are investments in Commer-
cial Project Development and Infrastructure Development (Skanska ID), which are
normally financed through loans in functional or local currencies.
Counterparty riskCounterparty risk is defined as the risk that the Group will suffer a loss because a
counterparty does not fulfill its contractual commitments toward Skanska.
Financial counterparty risk is identified, managed and reported according to lim-
its defined in the Financial Policy and the risk instruction established for Skanska
Financial Services.
To ensure a systematic and uniform assessment of construction projects,
Skanska uses its Operational Risk Assessment (ORA) model throughout the Group.
C. Reported and fair value of interest-bearing assets and liabilities − financial instruments The Group’s interest-bearing net receivable amounted to SEK 11,111 M (7,229).
The Group’s interest-bearing assets rose to SEK 16,975 M (12,421). The Group’s
interest-bearing liabilities amounted to SEK 5,864 M (5,192) at year-end.
The Group’s net interest items before taking into account capitalized interest
amounted to SEK 143 M (–87). The change was mainly attributable to a sharp
increase in interest-bearing assets.
Recognized and fair value of financial instruments considered for all balance
sheet items except for non-current financial liabilities, where fair value was
SEK 53 M (60) higher.
Fair value has mainly been calculated according to generally accepted methods
of discounting future cash flows based on quoted market interest rates for each
respective currency and maturity. If an official price quotation exists in an active
market, this is primarily used. An estimate of Skanska’s risk premium is used in
calculating fair value in the borrowing portfolio.
Skanska AB has entered into swap agreements related to shares in the Compa-
ny. The equity swaps are reported in the balance sheet at fair value.
D. Funding Established relationships with capital markets are a prerequisite for Skanska’s abili-
ty to ensure a supply of capital on good terms. Via several borrowing programs,
the Group is well prepared for temporary fluctuations in its liquidity requirements.
Bank credit facilities
Skanska’s committed credit facilities consist of:
• A syndicated bank loan (Multicurrency Revolving Credit Facility) with a ceiling of
EUR 600 M and a final due date of November 15, 2010. On December 31, 2005,
the amount borrowed was SEK 0 M, since the facility had not yet been utilized.
• Two bilateral loan agreements with the Nordic Investment Bank amounting to
EUR 40 M and EUR 30 M, respectively. These loans fall due in 2012.
The Group’s unutilized credit lines amounted to SEK 6,071 M (5,610).
Market funding programsSkanska has two market funding programs:
• Commercial paper (CP) program related to short-term borrowing for maturities
of up to one year. The loan ceiling in the CP program amounts to SEK 6,000 M.
On December 31, 2005, the borrowed amount was SEK 0 M.
• Medium Term Note program (MTN) for borrowing with maturities between
1–10 years. The loan ceiling in the MTN program amounts to SEK 8,000 M. On
December 31, 2005, the borrowed amount was SEK 1,122 M with an average
maturity of 2.0 years.
These borrowing programs are mainly intended for borrowing in the Swedish
credit market; however, it is possible to borrow in EUR within the framework of
these programs.

86 Notes, including accounting and valuat ion pr inc iples Skanska Annual Report 2005
No
tes,
incl
ud
ing
acc
ou
nti
ng
an
d v
alu
atio
n p
rin
cip
les
Liquidity reserve and maturity structureThe target is to have a central liquidity reserve of at least SEK 4,000 M available within one week through cash equivalents or committed credit facilities. At year-end
2005, this amounted to more than SEK 15 billion. At year-end 2005, the average maturity of the borrowing portfolio was 2.7 (3.0) years.
The maturity structure of interest-bearing assets and liabilities on December 31, 2005 was distributed over coming years according to the table below.
2005 2004 Fixed Variable Fixed Variable Interest-bearing assets, maturity rate rate Total rate rate Total
< 1 year 8,254 7,651 15,905 8,255 3,103 11,358
1–2 years 587 226 813 147 449 596
2–3 years 1 19 20 1 4 5
3–4 years 0 0 0 0 40 40
4–5 years 48 0 48 109 0 109
> 5 years 3 187 190 173 140 313
Total interest-bearing assets 8,892 8,082 16,975 8,685 3,736 12,421
Interest-bearing liabilities including Fixed Variable Fixed Variable derivatives, maturity rate rate Total rate rate Total
< 1 year –270 1,182 912 24 982 1,006
1–2 years 417 468 884 1,452 –771 681
2–3 years 749 113 862 931 –67 864
3–4 years 1 41 42 369 411 780
4–5 years 0 3 3 428 –382 46
> 5 years 0 753 753 90 720 810
Total interest-bearing liabilities 898 2,559 3,457 3,294 893 4,187
Net interest-bearing financial instruments 7,995 5,523 13,518 5,391 2,843 8,234
Pensions 2,407 1,005
Interest-bearing net receivables 11,111 7,229
On December 31, 2005, the Group’s interest rate swap portfolio amounted to a nominal SEK 1,718 M (17,111). A net amount of SEK 58 M (–1,939) of the liabilities was
Note 6 continued
swapped from fixed to variable interest rates.
E. Risk managementThe Group uses various derivative instruments (mainly interest rate swaps and cur-
rency futures) to control and adapt its risk exposure to fluctuations in interest
rates and foreign exchange rates. Derivative contracts, including derivatives that
are embedded in other instruments or commercial contracts, are continuously rec-
ognized at fair value in the balance sheet. Their change in fair value is recognized
in the income statement, except for hedges of net investments abroad and part of
the cash flow hedges of transaction exposure for which hedge accounting is
applied.
Currency riskTransaction exposure
Expected contracted net flows in currencies that are foreign to the respective sub-
sidiary are distributed among currencies and maturities as follows.
December 31, 2005 2008 The Group’s expected foreign currency flow 2006 2007 and later
USD 486
EUR 2,679 1,339 354
CAD –27
CHF 65
DKK 265
NOK 22
Other currencies –9
Total equivalent value 3,481 1,339 354
The following table shows recognized gains and losses related to hedging of
transaction exposure for which hedge accounting is applied. Foreign exchange
futures are used as instruments to hedge future income in local currency by mini-
mizing the effects of changes in the forward price of contracted inflows in EUR.
December 31, 2005The Group’s recognized gains and losses for derivates related 2008 to transaction exposure 2006 2007 and later Total
EUR 104 48 12 164
Recognized gains 104 48 12 164
EUR –4 –4
Recognized losses –4 0 0 –4
The following table shows recognized gains and losses related to the Group’s
other hedges of operational transaction exposure, for which hedge accounting is
not applied.
December 31, 2005The Group’s recognized gains and losses for derivates related 2008 to transaction exposure 2006 2007 and later Total
EUR 32 10 1 43
CAD 4 4
JPY1 20 9 1 30
Other currencies 2 2
Recognized gains 58 19 2 79
EUR –29 –11 –1 –41
CAD –3 –3
JPY1 –22 –11 –1 –34
Other currencies –2 –2
Recognized losses –56 –22 –2 –80
1 Flows in JPY are attributable to a road project in Slovakia.

Skanska Annual Report 2005 Notes, including accounting and valuat ion pr inc iples 87
No
tes,
incl
ud
ing
acc
ou
nti
ng
an
d v
alu
atio
n p
rin
cip
les
Note 6 continuedTranslation exposureEquity in foreign subsidiaries is normally not hedged, since it is regarded as an
investment of a long-term nature. There have been exceptions, among them con-
cerning the equity of Skanska’s U.S. operations. Beginning in January 2005, this
hedge has been unwound.
The translation difference in the equity of the Group may be significant during
certain periods of major exchange rate fluctuations. During 2005 the largest expo-
sures were in USD, NOK, CZK, GBP and EUR.
Investments in project development and public-private partnerships, which will
be divested, are normally financed in functional or local currencies, or alternative-
ly by entering into a currency future contract.
The amounts that are hedged consist of equity including any text effect. Hedge
accounting is applied for those hedges that meet the criteria for hedge account-
ing.
See also Note 35, “Effects of changes in foreign exchange rates.”
Interest rate risk (excluding pension liability)The average interest rate refixing period for all interest-bearing liabilities was 1.0
(1.3) years. The average interest rate for these amounted to 4.38 (4.11) percent at
year-end. The share of borrowing in foreign currencies, after taking into account
derivatives, was 31 (28) percent.
The average interest refixing period for all interest-bearing assets was 0.1 (0.2)
years, and the average interest rate was 2.42 (2.62) percent at year-end. Of these,
receivables in foreign currencies accounted for 61 (48) percent.
The Skanska Group’s portfolio of derivatives related to borrowing was distribut-
ed as follows on December 31, 2005. The values stated do not include accrued
interest.
December 31, 2005The Group’s recognized gains and losses for derivativesrelated to borrowings 2006 2007 2008 Later Total
Receiving fixed rate 1 0 6 0 7
Paying fixed rate –1 –8 2 0 –7
Net amount 0 –8 8 0 0
December 31, 2004The Group’s recognized gains and losses for derivativesrelated to borrowings 2005 2006 2007 Later Total
Receiving fixed rate 22 27 32 22 103
Paying fixed rate –38 –66 –94 –35 –233
Net amount –16 –39 –62 –13 –130
The fair value of the borrowing portfolio, including derivatives related to borrow-
ings, would change by about SEK 40 M in case of a change of market interest
rates − over the entire yield curve − of one percentage point, given the same vol-
ume and interest refixing period as on December 31, 2005.
Counterparty riskThe Group’s counterparty risk can be divided into two main categories: financial
counterparty risk and counterparty risk attributable to commercial contracts.
Financial counterparty risk This is a risk that the Group runs in its relations with financial counterparties in the
case of deposits of surplus funds, bank account balances and investments in
financial assets. Financial credit and counterparty risk is identified, managed and
reported according to limits defined in the Financial Policy and the risk instruction
for Skanska Financial Services.
Skanska has netting (ISDA) agreements with all the financial counterparties with
which it enters into derivative contracts. These agreements reduce counterparty
risk to some extent.
Skanska endeavors to limit the number of financial counterparties, which must
possess a rating equivalent to a BBB+ at Standard & Poor’s or the equivalent rating
at Moody’s. The permitted exposure volume per counterparty is dependent on the
counterparty’s credit rating and the maturity of the exposure.
Counterparty risk attributable to commercial contractsThe Group’s financial counterparty risk attributable to commercial contracts can
be divided into three main categories: customer credit risk, counterparty risk relat-
ed to partners in construction consortia and counterparty risk related to partners
in investment projects.
To ensure a systematic and uniform assessment of the business units’ various
projects, Skanska uses its Operational Risk Assessment (ORA) model throughout
the Group.
Financial counterparty risks that arise in projects are identified, managed and
reported in accordance with limits defined in the Financial Policy and the respec-
tive decision making systems of the Parent Company and business units.
Customer credit risk Skanska’s credit risk with regard to trade receivables from customers have a high
degree of risk diversification, due to the large number of projects of varying sizes
and types with numerous different customer categories in a large number of geo-
graphic markets.
The portion of Skanska’s operations related to construction projects extends
only very limited credit, since projects are invoiced in advance as far as possible. In
other operations, the extension of credit is limited to customary invoicing periods.
A business unit is not permitted to extend credit to a customer beyond estab-
lished threshold limits without first receiving approval from Skanska Financial Ser-
vices.
Counterparty risk related to partners in construction consortiaIn major construction projects (mainly infrastructure projects), Skanska may work
together with other construction companies in the form of consortia. The con-
struction consortia assume various types of guarantees toward the customer and
the institutions that provide financing during the construction period, as a rule
also guarantees issued by third parties such as banks or insurance companies. In
these projects, the Group is exposed to the risk that other parties cannot fulfill
their contractual obligations. The process that precedes project tenders together
with other companies in construction consortia includes a due diligence assess-
ment of the financial stability of the other parties. To limit this exposure, as a rule
the parties in each consortium issue reciprocal Parent Company guarantees. For
further information, see Note 34, “Contingent liabilities.”
Counterparty risk related to partners in investment projectsSkanska’s investments in privately financed infrastructure projects, so-called pub-
lic-private partnership (PPP) projects, consist of shares and, as a rule, subordinated
loans in a project company created for this purpose. In conjunction with the
financing of PPP projects, in some cases Skanska may assume responsibility in the
form of Parent Company guarantees and bank guarantees, for the purpose of
ensuring financing on behalf of a third party during a limited period.
The total obligation is equivalent to the Group’s ownership stake in the project
company in the form of equity and subordinated debenture loans (share of risk
capital in the project company) when fully invested. Skanska’s ownership in PPP
project companies amounts to a maximum of 50 percent (lower voting power).
The Group is thus exposed to the risk that other co-owners cannot fulfill their con-
tractual financial obligations to project companies. The process that precedes an
investment includes a due diligence assessment of the financial stability of the
other co-owners. To limit this exposure, as a rule the co-owners of PPP project
companies issue reciprocal Parent Company guarantees. The external institutions
that provide financing for PPP projects, as a rule capital market investors or banks,
also require that project companies and their owners meet high standards of
financial strength.
Insurable risksAt Skanska, there are guidelines for how insurance questions are to be dealt with.
The insurance unit at Skanska Financial Services assists the business units in their
procurement of arranged insurance solutions. Skanska’s captive insurance compa-
nies Skanska Försäkrings AB and Scem Re S A provide back-up to business units in
arranging insurance solutions. The overall insurance risk is normally reinsured in
the international reinsurance market.

88 Notes, including accounting and valuat ion pr inc iples Skanska Annual Report 2005
No
tes,
incl
ud
ing
acc
ou
nti
ng
an
d v
alu
atio
n p
rin
cip
les
Note 7 Business combinations
Business combinations are reported in compliance with IFRS 3, “Business Combi-
nations.” See “Accounting and valuation principles,” Note 1.
Acquisitions of Group companiesDuring the year, only two acquisitions occurred. The total investment was SEK 50 M.
During the third quarter of 2004, Skanska Czech Republic signed a contract to
acquire Klimavex, an installation company in Slovakia. The company was consoli-
dated effective on January 1, 2005.
The acquisition of Klimavex in Slovakia gave the Group access to a new, attrac-
tive submarket and special expertise. After having distributed the purchase price
among identifiable assets, SEK 24 M was allocated to acquisition goodwill, which
is largely related to access to the market and special expertise.
The second acquisition consisted of an additional 10 percent purchase of Raken-
nus Vuorenpää Oy from the minority shareholder. After this purchase, the Skanska
Group has a 90 percent holding in the company.
No contingent liabilities are included in the year’s acquisitions. Both acquisitions
are in the Construction business stream. There are no plans to divest any portion
of the acquired companies.
The acquired companies affected profit for the year in the amount of SEK 5 M.
Both acquisitions were included in Group revenue throughout the year. Klimavex
accounted for SEK 144 M. Acquisition Ownership PurchaseAcquisitions of shares Country date percent1 price Investment
2005Klimavex a.s. Slovakia Jan 1 100 45 39Rakennus Vuorenpää Oy (purchase of minority) Finland Apr 1 90 11 11
Total 56 50
2004FAVEA, Sydkraft Service Partner, (Divested Q3) Sweden Q1&2 100 113 105
Teklog OY, Maraarkennus Lantman OY (purchase of minority) Finland Q2 100 29 29
Others 1 1
Total 143 135
1 Refers to both voting power and percentage of capital stock unless otherwise stated.
The net assets of the acquired companies on the acquisition date Carrying amount Fair value in acquired Fair recognized companies before value by Skanska2005 acquisition adjustment Group
Property, plant and equipment 19 2 21
Intangible assets 0 0 0
Interest-bearing receivables 0 0
Non-interest-bearing receivables 45 45
Liquid assets 6 6
Interest-bearing liabilities –29 –29
Non-interest-bearing liabilities –21 –21
Net identifiable assets and liabilities 20 2 22Acquired minority interest 3
Goodwill 31
Purchase price paid 1 56
Less liquid assets in acquired companies 6
Effect on consolidated liquid assets, investment 50
1 Purchase price includes acquisition-related costs of SEK 1 M.
Carrying amount Fair value in acquired Fair recognized companies before value by Skanska2004 acquisition adjustment Group
Property, plant and equipment 9 4 13
Intangible assets 2 33 35
Shares and participations –1 –1
Current-asset properties 4 2 6
Interest-bearing receivables 4 4
Inventories and operating receivables 104 104
Liquid assets 8 8
Interest-bearing liabilities –10 –10
Non-interest-bearing liabilities –101 –10 –111
Net identifiable assets and liabilities 19 29 48Acquired minority interest 17
Goodwill 78
Purchase price paid 143
Less liquid assets in acquired companies 8
Effect on consolidated liquid assets, investment 135

Skanska Annual Report 2005 Notes, including accounting and valuat ion pr inc iples 89
No
tes,
incl
ud
ing
acc
ou
nti
ng
an
d v
alu
atio
n p
rin
cip
les
Revenue by primary and secondary segment Discontinued operations, Primary segment: Other Other United Other central and TotalBusiness streams Sweden Nordic countries Europe States markets eliminations revenue
2005Construction 22,141 23,253 26,633 39,359 4,569 115,955
Residential Project Development 2,394 2,959 760 6,113
Commercial Project Development 2,736 1,244 1,095 5,075
Infrastructure Development 53 53
Other
Central 169 169
Eliminations –1,842 –1,284 –3 –130 –3,259
Discontinued operations 561 561
Total 25,429 26,172 28,488 39,359 4,619 600 124,667
2004Construction 20,519 19,899 23,648 40,007 3,904 107,977
Residential Project Development 2,046 2,843 925 5,814
Commercial Project Development 3,932 242 1,410 5,584
Infrastructure Development 0 33 33
Other
Central 620 620
Eliminations –846 –1,812 –1,113 –3,771
Discontinued operations 5,006 5,006
Total 25,651 21,172 25,983 40,007 3,937 4,513 121,263
Revenue by category
2005 2004
Construction contracts 108,578 103,889
Services 4,813 4,938
Sale of goods 1,071 2,091
Rental income 805 1,024
Divestments of properties 9,400 9,321
Total 124,667 121,263
Regarding other types of revenue, dividends and interest income are recognized
as part of net financial items. See Note 14, “Financial items.”
Other mattersInvoicing to associated companies and joint ventures amounted to SEK 5,238 M
(3,491). For other related party transactions, see
Note 40, “Related party transactions.”
Note 9 Construction contracts
Construction contracts are recognized as revenue at the pace of project comple-
tion. See “Accounting and valuation principles,” Note 1.
Information from the income statementRevenue recognized during the year amounted to SEK 108,578 M (103,889).
Information from the balance sheet
Gross amount due from customers for contract work 2005 2004
Recognized revenue 94,089 86,166
Progress billings –88,479 –82,587
Total, asset 5,610 3,579
Gross amount due to customers for contract work 2005 2004
Progress billings 166,699 140,273
Recognized revenue –154,917 –129,845
Total, liability 11,782 10,428
Recognized revenue in ongoing projects including recognized gains minus recog-
nized loss provisions amounted to SEK 249,006 M (216,011).
Advance payments received totaled SEK 1,323 M (1,675).
Amounts retained by customers, which have been partly invoiced according to
an established plan and which the customer is retaining in accordance with con-
tractual terms until all the conditions specified in the contract are met, amounted
to SEK 2,931 M (2,479).
Secondary segment: Geographic markets
Note 8 Revenue
Projects in Skanska’s contracting operations are reported in compliance with IAS 11, “Construction Contracts.” See Note 9.
Revenue other than project revenue is recognized in compliance with IAS 18,”Revenue.” See “Accounting and valuation principles,” Note 1.

90 Notes, including accounting and valuat ion pr inc iples Skanska Annual Report 2005
No
tes,
incl
ud
ing
acc
ou
nti
ng
an
d v
alu
atio
n p
rin
cip
les
Operating income by business stream Operating income 2005 2004
Construction 2,871 1,512
Residential Project Development 611 528
Commercial Project Development 1,740 1,617
Infrastructure Development –9 31
Central –342 –360
Eliminations –73 46
Discontinued operations operating income 18 –600
divestment gain 184 1,587
Total 5,000 4,361
The Parent Company and other corporate units are reported as “Central.”
Elimination of profits from intra-Group sales and dissolvement of these are report-
ed as “Eliminations.” The amounts are explained in the following table:
2005 2004
Dissolvement of intra-Group income on
divestments of properties 75 72
Provision for intra-Group income on contracting
work related to Infrastructure Development –154 –60
Dissolvement of intra-Group profits in
Infrastructure Development 12 34
Other –6
Total –73 46
Discontinued operations are described in Note 5. See also “Accounting and valua-
tion principles,” Note 1.
Note 10 Operating income Operating expenses by category of expenses
Continuing Discontinued operations operations Total
2005Revenue 124,106 561 124,667
Personnel expenses 1 –20,980 –26 –21,006
Depreciation/amortization –1,073 –1,073
Impairment losses –186 –186
Other operating expenses –97,069 –333 –97,402
Operating income 4,798 202 5,000
2004Revenue 116,257 5,006 121,263
Personnel expenses 1 –20,299 –314 –20,613
Depreciation/amortization –1,063 –186 –1,249
Impairment losses –160 –201 –361
Other operating expenses –91,361 –3,318 –94,679
Operating income 3,374 987 4,361
1 Wages, salaries and other remuneration plus social insurance contributions are recognized according to Note 37, “Personnel,” along with non-monetary remuneration such as free healthcare and car benefits.
Analysis of operating income 2005 2004Impairment losses Goodwill impairment losses –108 –169
Impairment losses/reversals of impairment
losses on intangible assets 1
Impairment losses/reversals of impairment
losses on property, plant and equipment –30 –73
Impairment losses/reversals of impairment
losses on current-asset properties –48 –120
–186 –361Gains from divestments of current-asset propertiesCommercial Project Development 1,626 1,495
Other commercial properties 246 150
Residential Project Development 803 638
2,675 2,283
Income from divestments of discontinued operations 184 1 587
Income from joint ventures and associated companies 237 168
Restructuring in the U.S. and project losses in the U.K. and the U.S. –376 –1,245
Other operating income 2,466 1,929Total according to the income statement 5,000 4,361
Using the exchange rates prevailing in 2004, operating income would have been
SEK 113 M lower in 2005. See also Note 35, “Effect of changes in foreign
exchange rates.”

Skanska Annual Report 2005 Notes, including accounting and valuat ion pr inc iples 91
No
tes,
incl
ud
ing
acc
ou
nti
ng
an
d v
alu
atio
n p
rin
cip
les
Note 11 Selling and administrative expenses
Selling and administrative expenses are recognized as one item. See “Accounting and valuation principles,” Note 1.
Distribution of selling and administrative expenses by primary and secondary segment Discontinued operations, Other Nordic Other United Other central and Primary segment: Business streams Sweden countries Europe States markets eliminations Total
2005Construction –1,264 –1,119 –1,868 –959 –237 –5,447
Residential Project Development –111 –159 –64 –334
Commercial Project Development –137 –20 –71 –228
Infrastructure Development –123 –123
Discontinued operations, central and eliminations –554 –554
Total –1,512 –1,298 –2,003 –959 –360 –554 –6,686
2004Construction –1,270 –1,021 –1,575 –1,186 –154 –5,206
Residential Project Development –91 –124 –90 –305
Commercial Project Development –117 –15 –83 –215
Infrastructure Development –70 –70
Discontinued operations, central and eliminations –1,155 –1,155
Total –1,478 –1,160 –1,748 –1,186 –224 –1,155 –6,951
Note 12 Depreciation/amortization
Depreciation and amortization occur in compliance with IAS 16, “Property, Plant and Equipment,” and IAS 38, “Intangible Assets.”
See Note 1, “Accounting and valuation principles.”
Depreciation and amortization are presented below by business stream.
For further information on depreciation and amortization, see Note 19, “Intangible assets,” and Note 17, “Property, plant and equipment.”
Depreciation/amortization by asset class and business stream Discontinued Residential Commercial operations, Project Project Infrastructure central and Group Construction Development Development Development eliminations total
2005Intangible assets –36 –1 –12 –4 –53
Property, plant and equipment
Buildings and land –64 –64
Machinery and equipment –944 –2 –1 –1 –8 –956
Total –1,044 –3 –1 –13 –12 –1,073
2004Intangible assets –35 –2 –8 –45
Property, plant and equipment
Buildings and land –65 –5 –70
Machinery and equipment –939 –1 –1 –193 –1,134
Total –1,039 –3 –1 0 –206 –1,249
Secondary segment: Geographic markets

92 Notes, including accounting and valuat ion pr inc iples Skanska Annual Report 2005
No
tes,
incl
ud
ing
acc
ou
nti
ng
an
d v
alu
atio
n p
rin
cip
les
Note 13 Impairment losses/Reversals of impairment losses
Impairment losses are recognized in compliance with IAS 36, “Imapirment of assets.” See “Accounting and valuation priunciples,” Note 1.
Impairment losses on current-asset properties are recognized in compliance with IAS 2, “Inventories” and are disclosed in Note 22.
Impairment losses/reversals of impairment losses are presented below by business stream.
For further information on impairment losses/reversals of impairment losses, see Note 19, “Intangible assets,” Note 17, “Property, plant and equipment,”
and Note 22, “Current-asset properties/Project development.”
Impairment losses/reversals of impairment losses by asset class and business stream Discontinued Residential Commercial operations, Project Project Infrastructure central and Group Construction Development Development Development eliminations total
2005Recognized in operating incomeGoodwill –108 –108
Other intangible assets 0
Property, plant and equipment
Buildings and land –22 2 –20
Machinery and equipment –10 –10
Current-asset properties
Commercial Project Development 0
Other commercial properties –8 –8
Residential Project Development –18 –22 –40
–166 –20 0 0 0 –186
Recognized in financial itemsFinancial assets –2 –2
Total –166 –22 0 0 0 –188
2004Recognized in operating incomeGoodwill –23 –146 –169
Other intangible assets 1 1
Property, plant and equipment
Buildings and land 3 –1 –10 –8
Machinery and equipment –8 –57 –65
Current-asset properties
Commercial Project Development –98 –98
Other commercial properties –9 –9
Residential Project Development –13 –13
–36 –14 –98 0 –213 –361Recognized in financial itemstFinancial assets 0
Total –36 –14 –98 0 –213 –361
2005 2004
Financial incomeInterest income 308 284
Dividends 3 0
Net change in value due to revaluation of financial assets/liabilities 19
Net exchange rate differences 17
330 301
Financial expensesInterest expenses –137 –332
Net exchange rate differences –28
Net other financial items –45 –60
–210 –392
Income from associated companies 0 57
Total 120 –34
Net interest itemsNet interest items in 2005 amounted to SEK +171 M (–48). The change occurred
because Skanska increased its interest-bearing net assets. Interest-bearing net
receivables rose to SEK 11,111 M (7,229).
Note 14 Net financial items
Interest expenses included SEK –54 M (–28) related to interest on hedging instru-
ments in Infrastructure Development.
Interest income was received at an average interest rate of 2.34 (2.58) percent.
Interest expenses, excluding interest on pension liability, were paid at an aver-
age interest rate of 4.15 (4.59) percent.
During 2005, consolidated interest expenses of SEK –28 M (–39) were capital-
ized.
Net change of value due to revaluation of financial, assets/liabilitiesDerivatives as well as certain other assets and liabilities are carried at fair value
starting in 2005, in compliance with IAS 39.
The item consists mainly of gains and losses on derivatives.
Net other financial itemsThe item includes various financial fees mainly related to Skanska Latin America.
Income from associated companiesSkanska’s holdings in the equity of aircraft leasing companies was recognized in
“Net financial items.” During 2005, no income arose. In 2004, Skanska’s holdings
in the limited partnership Mega-Carrier KB were liquidated, which yielded a gain
of SEK 57 M. Holdings in other associated companies are part of the Group’s oper-
ations and are thus recognized under “Operating income.”

Skanska Annual Report 2005 Notes, including accounting and valuat ion pr inc iples 93
No
tes,
incl
ud
ing
acc
ou
nti
ng
an
d v
alu
atio
n p
rin
cip
les
Note 15 Borrowing costs
Borrowing costs related to investments that require a substantial period for
completion are capitalized. See “Accounting and valuation principles,” Note 1.
During 2005, borrowing costs were capitalized at an interest rate of about
4 percent. Total accumulated capitalized interest Interest capitalized included in during the year cost 2005 2004 2005 2004
Intangible assets 5 16 92 87
Property, plant and equipment 0 0 0 0
Current-asset properties Commercial Project Development 16 15 148 165
Other commercial properties 10 10
Residential Project Development 7 8 18 24
Total 28 39 268 286
Note 16 Income taxes
Income taxes are reported in compliance with IAS 12, “Income Taxes.” See
“Accounting and valuation principles,” Note 1.
Tax expenses 2005 2004
Current taxes –1,115 –1,571
Deferred tax benefits/expenses from change
in temporary differences –72 331
Deferred tax benefits/expenses from change
in loss carry-forwards –8 123
Taxes in joint ventures –29 –19
Taxes in associated companies –6 –5
Total –1,230 –1,141
Tax items recognized directly in equity 2005 2004
Deferred taxes attributable to cash flow hedging –13
Deferred taxes attributable to pensions 495 178
Total 482 178
There was no deferred tax attributable to financial assets classified as held for sale.
Taxes related to divested companies Tax expenses for the year in each Capital gains tax company Company 2005 2004 2005 2004
Divestments in 2005 Skanska Prefab Mark 0 2
Skanska Modul 0 –34
Divestments in 2004 Cementation Africa & Cementation Canada 0 –11
Services 0 –29
Gammon 0 –1
Cementation India 0 6
Myresjöhus 0 –17
Total 0 0 –32 –52
Relation between taxes calculated at weighted average tax rate and taxes recognized
The Group’s weighted average tax rate was estimated at 28 (30) percent.
Tax rates in effect in Skanska’s largest home markets 2005 2004
Sweden 28% 28%
Norway 28% 28%
Denmark 28% 30%
Finland 26% 29%
Poland 19% 19%
Czech Republic 26% 28%
United Kingdom 30% 30%
United States 35–45% 35–45%
The relation between taxes calculated according to an aggregation of the tax
rates in effect and recognized taxes is explained in the table below.
2005 2004
Income after financial items 5,120 4,327
Tax according to aggregation of the
tax rates in effect, 28 (30) percent –1,433 –1,298
Tax effect of:Goodwill impairment losses –41 –19
Divestments/discontinuations of businesses 317 384
Losses not offset by deferred tax assets –57 –183
Other items –16 –25
Recognized tax expenses –1,230 –1,141
Deferred tax assets 2005 2004
Deferred tax assets for loss carry-forwards 253 222
Deferred tax assets for holdings 132 156
Deferred tax assets for other assets 138 340
Deferred tax assets for provisions
for pensions 910 384
Deferred tax assets for other liabilities 849 531
Total 2,282 1,633
Deferred tax assets for loss carry-forwards are expected to be mainly utilized to
offset deferred tax liabilities.
Deferred tax assets other than for loss carry-forwards refer to temporary differ-
ences between carrying amounts for tax purposes and carrying amounts recog-
nized in the balance sheet. These differences arise, among other things, when the
Group’s valuation principles deviate from those applied locally by a subsidiary.
These deferred tax assets are mostly realized within five years.
Deferred tax assets arise, for example, when a recognized depreciation/amorti-
zation/impairment loss on assets becomes deductible for tax purposes only in a
later period, when eliminating intra-Group profits and when the required provi-
sions become tax-deductible in a later period.
Deferred tax assets for provisions for pensions refer to the difference between
the calculation of defined-benefit pension obligations according to local rules
compared to IAS 19, “Employee Benefits.”
Temporary differences that are not recognized as deferred tax assets 2005 2004
Loss carry-forwards that expire within one year 745 223
Loss carry-forwards that expire in more than
one year but within three years 346 623
Loss carry-forwards that expire in more
than three years 1,475 1,766
Other temporary differences 0 161
2,566 2,773

94 Notes, including accounting and valuat ion pr inc iples Skanska Annual Report 2005
No
tes,
incl
ud
ing
acc
ou
nti
ng
an
d v
alu
atio
n p
rin
cip
les
Provisions for taxes 2005 2004
Deferred tax liabilities on consolidated
surplus values 24 56
Deferred tax liabilities on other assets 1,136 1,084
Deferred tax liabilities on untaxed reserves 894 876
Other deferred tax liabilities 777 728
Total 2,831 2,744
Deferred tax liabilities on other assets and other deferred tax liabilities refer to
temporary differences between carrying amounts for tax purposes and carrying
amounts in the balance sheet. These differences arise, among other things, when
the Group’s valuation principles differ from those applied locally by a subsidiary.
These deferred tax liabilities are mostly realized within five years.
For example, deferred tax liabilities arise when depreciation/amortization in the
current period is larger than the required economic depreciation/amortization and
when recognized profits in ongoing projects are taxed only when the project is
completed.
Temporary differences attributable to investments in subsidiaries, branches,
associated companies and joint ventures for which deferred tax liabilities were not
recognized totaled SEK 0 M (0). In Sweden, share divestments are tax-exempt if
they meet certain conditions specified by law (among others, shares held for busi-
ness purposes). Temporary differences thus do not normally exist for sharehold-
ings by the Group’s Swedish companies.
Net change in deferred taxes in the balance sheet 2005 2004
Deferred taxes (net liability), January 1 1,111 1,682
Adjusted opening balance on transition to IAS 39 –14
Transferred to assets classified as held for sale –9
Recognized in equity –482 –178
Deferred tax benefit/expenses 80 –454
Acquisitions of companies –3
Divestments of companies –9 –19
Exchange rate differences –128 83
Deferred taxes (net liability), December 31 549 1,111
Note 16 continued Note 17 Property, plant and equipment
Property, plant and equipment are reported in compliance with IAS 16, “Property,
plant and equipment.” See Note 1, “Accounting and valuation principles.”
Office buildings and other buildings used in the Group’s business are recognized
as property, plant and equipment. Machinery and equipment are recognized as a
single item.
Property, plant and equipment by asset class 2005 2004
Buildings and land 1,614 1,740
Machinery and equipment 3,527 3,696
Construction in progress 102 71
Total 5,243 5,507
Depreciation of property, plant and equipment by asset class and function
Sales and Cost of sales administration Total 2005 2004 2005 2004 2005 2004
Buildings and land –49 –55 –15 –15 –64 –70
Machinery and equipment –818 –992 –138 –142 –956 –1,134
Total –867 –1,047 –153 –157 –1,020 –1,204
Impairment losses/reversals of impairment losses on property, plant and equipmentImpairment losses/reversals of impairment losses of SEK –30 M (–73) were recog-
nized, of which SEK –20 was related to buildings and land. Most of these were
attributable to Skanska Czech Republic and Skanska Poland. Buildings and Machinery and
Impairment losses/reversal land equipment
of impairment losses by function 2005 2004 2005 2004
Cost of sales
Impairment losses –25 –32 –10 –65
Reversals of impairment losses 5 24
Total –20 –8 –10 –65
Amount of impairment losses/reversals of impairment losses is based on
Net realizable value –12 –7 –2 –65
Value in use –8 –1 –8
Total –20 –8 –10 –65
Property, plant and equipment held for saleAs of January 1, 2005, property, plant and equipment with a carrying amount of
SEK 529 M had been transferred to the item “Assets classified as held for sale.” At
year-end the carrying amount of property, plant and equipment included in the
item “Assets classified as held for sale” was SEK 33 M.
See also Note 5, “Non-current assets held for sale and discontinued operations.”
.

Skanska Annual Report 2005 Notes, including accounting and valuat ion pr inc iples 95
No
tes,
incl
ud
ing
acc
ou
nti
ng
an
d v
alu
atio
n p
rin
cip
les
Note 17 continuedInformation about cost, accumulated depreciation, accumulated revaluation and accumulated impairment losses
Properties Buildings and land Machinery and equipment under construction 2005 2004 2005 2004 2005 2004
Accumulated costJanuary 1 2,857 3,247 11,600 13,150 71 104
Transferred to assets classified as held for sale –103 –1,123 –5
New acquisitions 130 107 1,242 1,009 43 16
Business combinations 18 4 3 9
Divestments of companies –37 –164 –35 –1,191 –5
Divestments –276 –245 –661 –864 –2 –32
Reclassifications –7 –188 212 –400 –12 –16
Exchange rate differences for the year 208 96 794 –113 7 4
2,790 2,857 12,032 11,600 102 71
Accumulated depreciationJanuary 1 –816 –844 –7,809 –8,620
Transferred to assets classified as held for sale 34 585
Divestments of companies 68 20 889
Divestments and disposals 49 22 387 600
Reclassifications –7 23 –241 389
Depreciation for the year –64 –70 –956 –1,134
Exchange rate differences for the year –46 –15 –476 67
–850 –816 –8,490 –7,809
Accumulated impairment lossesJanuary 1 –301 –290 –95 –49
Transferred to assets classified as held for sale 10 73
Divestments of companies 8
Divestments 33 12 1
Reclassifications –21 11 17 19
Impairment losses/reversals of impairment
losses for the year –20 –9 –10 –65
Exchange rate differences for the year –27 –33 –1
–326 –301 –15 –95
Carrying amount, December 31 1,614 1,740 3,527 3,696 102 71Carrying amount, January 1 1,740 2,143 3,696 4,481 71 104
Information on assessed value for tax purposes, Sweden 2005 2004
Buildings 326 374
corresponding book value of buildings 160 190
Land 239 271
corresponding book value of land 85 109
Other mattersInformation about capitalized interest is presented in Note 15, “Borrowing costs.”
For information about finance leases, see Note 41, “Leases.”
Skanska has obligations to acquire property, plant of equipment in the amount of SEK 94 M (54).
Skanska did not receive any major compensation from third parties for property, plant and equipment that was damaged or lost.

96 Notes, including accounting and valuat ion pr inc iples Skanska Annual Report 2005
No
tes,
incl
ud
ing
acc
ou
nti
ng
an
d v
alu
atio
n p
rin
cip
les
Goodwill is recognized in compliance with IFRS 3, “Business Combinations.” See Note 1, “Accounting and valuation principles.”
For key judgments, see Note 2.
Goodwill according to the balance sheet amounted to SEK 4,154 M (3,899) and was mainly attributable to acquisitions during 2000,
when Skanska acquired goodwill through acquisitions of businesses in Norway, the U.K. and the Czech Republic.
Goodwill value by business unit of which of which of which Change for exchange impairment business of which 2005 2004 the year rate differences losses combinations 2 other
Construction
Sweden 0 9 –9 –9
Norway 1,047 974 73 73
Finland 383 361 22 16 –1 7
Poland 19 17 2 2
Czech Republic 399 342 57 34 24 –1
United Kingdom 1,446 1,342 104 104
USA Building 322 268 54 54
USA Civil 1 29 111 –82 16 –98
International 33 32 1 3 –2
Residential Project DevelopmentNordic 476 443 33 33
Total 4,154 3,899 255 335 –108 31 –3
1 The impairment loss was USD –13.2 M, calculated at the average exchange rate for the year.2 See Note 7, “Business combinations.”
In Construction and Residential Project Development, goodwill recovery value is
based exclusively on value in use. Expected cash flows are based on forecasts for
each submarket in the countries where the Group has operations. For Construc-
tion, these forecasts include such variables as demand, cost of input goods, labor
costs and the competitive situation. Residential Project Development establishes
forecasts for the various segments of its operations. Important variables taken into
account include demographic and interest rate trends.
The forecasts are based on previous experience, Skanska’s own judgments and
external sources of information. The forecast period encompasses three years. The
growth rate that is used to extrapolate cash flow forecasts beyond the period cov-
ered by the three-year forecasts is trhe normal growth rate for the industry in each
respective country. Each business unit uses a unique discount factor, which
amounts to between 9 and 13 percentage points.
Goodwill impairment lossesDuring the year, the Group recognized goodwill impairment losses of SEK –108 M
(–169).
Of this amount, SEK –98 M was due to the impairment loss for Yeager Skanska,
a company in Skanska USA Civil. Skanska USA Civil identified a need for an exten-
sive restructuring of Yeager Skanska. Because of this, together with weak profit-
ability, the value in use of Yeager was below the book value of the company.
Skanska recognized an impairment loss on the remaining goodwill.
Most of the goodwill impairment loss of SEK –169 M during 2004 was related
to a goodwill impairment loss in Indian operations.
Impairment losses by function 2005 2004
Administrative and selling expenses
Impairment losses –108 –169
Total –108 –169
Amounts of impairment losses were based on
Net recoverable value –9 –159
Value in use –99 –10
Total –108 –169
Information about cost and accumulated impairment losses Goodwill 2005 2004
Accumulated cost January 1 3,941 4,259
Business combinations 31 104
Divestments of companies –397
New acquisitions 12
Divestments –2 0
Reclassifications –1 –9
Exchange rate differences for the year 337 –28
4,306 3,941Accumulated impairment losses
January 1 –42 0
Divestments of companies 127
Reclassifications 0
Impairment losses for the year –108 –169
Exchange rate differences for the year –2 0
–152 –42
Carrying amount, December 31 4,154 3,899Carrying amount, January 1 3,899 4,259
Note 18 Goodwill

Skanska Annual Report 2005 Notes, including accounting and valuat ion pr inc iples 97
No
tes,
incl
ud
ing
acc
ou
nti
ng
an
d v
alu
atio
n p
rin
cip
les
Intangible assets are recognized in compliance with IAS 38, “Intangible assets.”
See “Accounting and valuation principles,” Note 1.
Intangible assets and useful life applied Useful 2005 2004 life applied
Highway concession 540 440 26 years
Other intangible assets, externally acquired 92 68 3–50 years
Intangible assets, internally generated 12 27 3–5 years
Total 644 535
The highway concession in Chile went into operation in December 2004; the
remainder of the project is expected to be completed during 2006/2007. Amorti-
zation will occur over the estimated useful life of the project, 26 years.
“Other intangible assets, externally acquired” included extraction rights for
gravel pits in Sweden plus computer software. Extraction rights for gravel pits are
amortized as material is extracted. Computer software is amortized in 3–5 years.
Computer software is recognized as internally generated intangible assets.
Amortization of other intangible assets by function All intangible assets were amortized, because they have a limited useful life.
of which amortization of internally generated assets
Amortization by function 2005 2004 2005 2004
Cost of sales –29 –19 –14 –13
Selling and administration –24 –26 –1 0
Total –53 –45 –15 –13
Impairment losses/reversals of impairment losses on other intangible assets
Impairment losses/reversals of impairment losses by function 2005 2004
Cost of sales
Impairment losses
Reversals of impairment losses 1
Total 0 1
Amounts of impairment losses/reversals of impairment losses were based on Net realizable value 1
Value in use
Total 0 1
Note 19 Intangible assets Information about cost, accumulated amortization and accumulated impairment losses Intangible Other intangible assets, Highway assets, internally concession externally acquired generated
2005 2004 2005 2004 2005 2004
Accumulated costJanuary 1 440 433 179 196 64 63
Divestments of companies –2
Internally developed assets 1
Other investments 5 16 46 25
Divestments –2
Reclassifications 2 –43
Exchange rate differences
for the year 107 –9 11 3
552 440 236 179 64 64Accumulated amortizationJanuary 1 0 –109 –123 –37 –24
Divestments of companies 4
Divestments –2
Reclassifications 46
Amortization for the year –12 –26 –32 –15 –13
Exchange rate differences
for the year –7 –2
–12 0 –142 –109 –52 –37Accumulated impairment lossesJanuary 1 –2 –3
Impairment losses/reversals
of losses for the year 1
0 0 –2 –2 0 0
Carrying amount, December 31 540 440 92 68 12 27Carrying amount, January 1 440 433 68 70 27 39
Other mattersInformation about capitalized interest is presented in Note 15, “Borrowing costs.”
Direct research and development expenses amounted to SEK 47 M (48).

98 Notes, including accounting and valuat ion pr inc iples Skanska Annual Report 2005
No
tes,
incl
ud
ing
acc
ou
nti
ng
an
d v
alu
atio
n p
rin
cip
les
Note 20 Investments in joint ventures and associated companies
Investments in joint ventures and associated companies are reported according to
the equity method of accounting. Income from joint ventures and associated com-
panies is reported on a separate line in operating income. This income consists of
the Group’s share of the income in joint ventures and associated companies after
financial items, adjusted for any impairment losses in goodwill on consolidation
and intra-Group profits.
Income from joint ventures and associated companies can be seen in the follow-
ing table.
2005 2004
Share of income in joint ventures
according to the equity method1 195 121
Share of income in associated companies
according to the equity method1 14 13
Divestments of joint ventures 16
Dissolvement of intra-Group profit
in infrastructure projects 12 34
Total 237 168
1 When calculating the inome of joint ventures and associated companies according to the equity method, the Group’s share of taxes is recognized as taxes. The Group’s share of taxes in joint ventures amounted to SEK -29 M (-19) Mkr and its share of taxes in associated compa-nies amounted to SEK -6 M (-5). See also Note 16, “Income taxes”.
Book value according to the balance sheet and the change that occurred during
2005 can be seen in the following table. Joint Associated ventures companies Total
January 1 814 48 862
New acquisitions 470 470
Divestments –28 –16 –44
Reclassifications1 251 –7 244
Exchange rate differences for the year 311 2 313
The year’s provision for intra-Group profit
on contracting work –154 –154
The year’s change in share of income in associated companies and joint ventures after subtracting dividends received 131 12 143
Carrying amount, December 31 1,795 39 1,834
1 This amount included SEK +250 M for a change in the accounting practice for recognition of holdings in Infrastructure Development. For changes in accounting practices, see Note 3, point E.
Specification of major holdings of shares and participations in joint ventures Percentage Percentage Consolidated, of capital of voting Currency book value,1
Company Operations Country stock power if not SEK 2005 2004
Joint ventures in Infrastructure Development Autopista Central S.A.2 Highway Chile 48 48 CLP 759 277
Breitener Energetica S/A Power station Brazil 35 35 BRL 151 111
Bridgend Custodial Services,Ltd Correctional care U.K. 20 9 GBP 14 3
Capital Hospitals (Holdings) Healthcare U.K. 38 38 GBP 1
Central Nottinghamshire, Hospital (Holdings) Healthcare U.K. 50 50 GBP 2
Derby Healthcare Holdings Ltd Healthcare U.K. 25 50 GBP –1 –5
Gdansk Transport Company Highway Poland 30 30 PLN 19 0
HpC King´s College Hospital Ltd Healthcare U.K. 33 33 GBP 23 –5
Investors in Community (Bexley Schools) Ltd Education U.K. 50 50 GBP 32
LLC Nordvod Wastewater treatment Russia 14 14 EUR 26 1
Orkdalsvegen,AS Highway Norway 50 50 NOK 8 –23
Ponte de Pedra Energetica S/A Power station Brazil 50 50 BRL 361 221
Portus Indico S.A. Port Mozambique 32 32 EUR 31 –2
The Coventry and Rugby Hospital Comp.Ltd Healthcare U.K. 25 50 GBP 80 5
Tieyhtiö Nelostie Oy Highway Finland 50 41 EUR 51 30
Tieyhtiö Ykköstie Oy Highway Finland 41 41 EUR 16
Others –1
1,572 613
Other joint ventures 223 201Total 1,795 814
1 Negative book values are explained by elimination of intra-Group profits.1 There is also an investment in a concession fee. Its book value amounted to SEK 540 M (440). See Note 19, “Intangible assets.”
Joint venturesJoint ventures are reported in compliance with IAS 31, “Interests in Joint Ven-
tures.” See “Accounting and valuation principles,” Note 1.
The Group had holdings in joint ventures with a book value of SEK 1,795 M (814).
Infrastructure Development included a large book value in joint ventures, SEK
1,896 M (766). The value of these companies in the consolidated accounts was
reduced by intra-Group profits of SEK -324 M (-154), which arose due to contract-
ing work for these joint ventures, among other things. Subordinated loans to joint
ventures in Infrastructure Development increased the book value of shares in joint
ventures by SEK 250 M on January 1. This amount was previously recognized as
receivables from joint ventures. See the change in accounting practice in Note 3,
point E.
Income from joint ventures
Share of income in joint ventures is reported in the income statement, because
these holdings are an element of Skanska’s business.
Share of income in joint ventures according to the equity method comes mainly
from Infrastructure Development operations.
Infrastructure Development specializes in identifying, developing and investing
in privately financed infrastructure projects, such as roads, hospitals and power
generating stations. The business stream focuses on creating new project oppor-
tunities in
The projects that had the largest effect during 2005:
The Autopista Central Santiago toll highway in Chile placed additional sections
in operation. Traffic volume and revenue developed satisfactorily and exceeded
the original expectations. The remaining sections will be completed and placed in
operation in mid-2006.
The projects that were in operation during 2004, such as the Bridgend prison
and Kings College Hospital in the United Kingdom and the highway between Hel-
sinki and Lahti, Finland, provided continued good contributions to earnings.
During 2005, the hospitals in Coventry and Derby, U.K.; the Nordvod wastewater
treatment plant in St. Petersburg, Russia; and the E39 highway
in Norway also went into service – wholly or partially – which also contributed
positively to earnings.
The Ponte de Pedra hydropower generating plant went into service late in the
year. All electricity that the project generates is sold at a predetermined price to a
major energy distributor.
Early in 2005, Infrastructure Development was awarded a 25-year concession on
two diesel oil-fired power generating plants in Manaus, Brazil. It thus proved pos-
sible to find a new use for the assets of the Breitener diesel power generating
plant in Brazil, whose operations ceased in March 2005.
The new plants will go into service early in 2006.

Skanska Annual Report 2005 Notes, including accounting and valuat ion pr inc iples 99
No
tes,
incl
ud
ing
acc
ou
nti
ng
an
d v
alu
atio
n p
rin
cip
les
Note 20 continuedInformation on the Group’s share of the income statements and balance sheets of joint ventures reported according to the equity method
The amounts included Infrastructure Development operations totaling Income statement 2005 2004 2005 2004
Revenue 2,209 3,213 1,707 1,312
Operating expenses –1,931 –3,022 –1,502 –1,180
Operating income 278 191 205 132Financial items –88 –45 –64 –19
Income after financial items1 190 146 141 113Taxes –29 –19 –21 –11
Profit for the year 161 127 120 102
Balance sheetNon-current assets 8,926 5,972 8,765 5,686
Current assets 5,340 3,203 4,051 2,246
Total assets 14,266 9,175 12,816 7,932
Equity attributable
to equity holders2 2,101 957 1,878 755
Minority interest 8 12
Non-current liabilities 10,506 7,514 10,161 6,752
Current liabilities 1,651 692 777 425
Total equity and liabilities 14,266 9,175 12,816 7,932
1 The year’s income after financial items, SEK 190 M, was SEK 5 M less than the share of income in joint ventures according to the equity method, which was SEK 195 M. The amount consisted of losses in joint ventures that had not been posted.
2 Equity exceeded the book value of shares in joint ventures by consolidated intra-Group profits on contracting work for Infrastructure Development, which was not charged to income in these operations and was thus not reported in the table.
Reconciliation with shares in joint ventures 2005 2004
Skanska’s portion of equity in joint ventures, adjustedfor surplus value and goodwill 2,101 957
–Intra-Group profit in consolidated financial statements –324 –154
+losses in Infrastructure Development not posted,since Skanska’s portion is already zero 18 11
Book value of shares 1,795 814
Assets pledgedShares in joint ventures pledged as collateral for loans and other obligations
amounted to SEK 1,444 M (609).
Other mattersSkanska’s portion of the total investment obligations of partly owned joint ventures
amounted to SEK 6,998 M (2,241). Skanska has undertaken to invest an additional
SEK 535 M (748) M in Infrastructure Development in the form of equity holdings
and loans. The remaining portion is expected to be financed mainly in the form of
bank loans or bond loans in the respective joint venture and in the form of partici-
pations and loans from other co-owners.
Contingent liabilities to joint ventures amounted to SEK 1,495 M (889).
Associated companiesAssociated companies are reported in compliance with IAS 28, “Investments in
Associates.” See “Accounting and valuation principles,”
Note 1.
The book value of associated companies amounted to SEK 39 M (48).
Of this amount, SEK 3 M (10) was attributable to ”aircraft leasing companies.”
Swedish Aircraft FOUR KB was recognized at SEK 3 M (8)
and Swedish Aircraft TWO KB at SEK 0 M (2).
Share of income in associated companies is recognized in the income statement,
with the exception of share of income in “aircraft leasing companies,” which is
recognized under financial items.
Holdings in associated companies are specified in the table below.
Holdings in associated companiesName Country Revenue Income Assets Liabilities Equity % ownership Book value
2005Swedish Aircraft TWO KB Sweden 22 0 27 27 0 50 0
Swedish Aircraft FOUR KB1 Sweden 40 0 158 155 3 100 3
1909 Aircraft Leasing KB1 Sweden 8 –5 108 1,193 –1,085 99 0
Nor-Pel AS Norway 24 3 15 4 11 50 11
NUUK Kraft ANS Norway 9 1 20 10 10 28.5 10
AS Tartu Maja Betoontooted Estonia 33 8 26 12 14 25 14
Others 1 1 1
Total 136 7 355 1,401 –1,046 39 Adjustment for losses not posted according to the table below 1,085
Book value according to balance sheet 39
Name Country Revenue Income Assets Liabilities Equity % ownership Book value
2004Swedish Aircraft TWO KB Sweden 26 0 110 108 2 50 2
Swedish Aircraft FOUR KB1 Sweden 40 1 182 174 8 100 8
1909 Aircraft Leasing KB1 Sweden 73 –2 117 1,197 –1,080 99 0
Nor-Pel AS Norway 35 2 20 13 7 50 7
NUUK Kraft ANS Norway 0 –7 16 8 8 28.5 8
AS Kalev Real Estate Company Estonia 26 4 67 54 13 41 13
AS Tartu Maja Betoontooted Estonia 23 3 19 10 9 25 9
Others 1 1 1
Total 223 1 532 1,564 –1,032 48
Adjustment for losses not posted according to the table below 1,080
Book value according to balance sheet 48
1 The companies are associate companies since Skanska has no controlling influence because the general partner in each of these limited partnerships is external to the Group.

100 Notes, including accounting and valuat ion pr inc iples Skanska Annual Report 2005
No
tes,
incl
ud
ing
acc
ou
nti
ng
an
d v
alu
atio
n p
rin
cip
les
Note 20 continued
Information on losses in associated companies that have not been recognized because the book value of Skanska’s holding “is already zero.” 2005 2004
Loss for the year –5 –2
Loss in prior years –1,080 –1,078
The losses occurred in partly owned limited partnerships (aircraft leasing) for which
the Group has no obligation to provide additional capital.
Other mattersThe associated companies have no liabilities, provisions or contingent liabilities
which the Group may become responsible for paying. Nor are there any obliga-
tions for further investments.
Note 21 Financial assets
Financial investments, financial receivables and shareholdings where ownership is
less than 20 percent and the Group has no singificant influence are recognized as
financial non-current assets.
Financial investments and financial receivables are recognized as financial current
assets.
See also Note 6, “Financial instruments.”
Financial non-current assets 2005 2004
Financial investments Financial assets carried at fair value
through profit or loss
Unrealized non-interest-bearing changes
in value of interest-bearing securities 92
Unrealized non-interest-bearing changes in value of derivatives 15
Financial assets available for sale1 359 74
Financial non-current assets cont. 2005 2004
Financial receivables, interest-bearingReceivable from associated companies 5 0
Receivable from joint venturess 0 198
Liquid assets with restrictions 410 455
Other interest-bearing receivables 355 410
Total 1,236 1,137
of which interest-bearing
financial non-current assets 1,070 1,063
of which non-interest-bearing
financial non-current assets 166 74
Financial current assets 2005 2004
Financial investmentsFinancial assets carried at
fair value through profit or loss
Unrealized non-interest-bearing changes
in value of derivatives 35
Hold-to-maturity investments 476
Financial assets available for sale 105
Financial investments before introduction of IAS 39 253
Financial receivables, interest-bearingReceivable from joint ventures 0 2
Liquid assets with restrictions 633 1,453
Discounted operating receivables 152 0
Other interest-bearing receivables2 859 782
Total 2,260 2,490
of which interest-bearing
financial current assets 2,225 2,490
of which non-interest-bearing
financial current assets 35 0
1 Including SEK 59 M (74) in shares carried at cost. The shares are carried at cost, since they are not quoted and fair value cannot be reliably estimated. During 2005, an impairment loss of SEK –2 M (0) on shareholdings was recognized. The impairment loss occurred in the Residen-tial Project Development business stream and was charged to financial items. The impairment loss was based on net realizable value.
2 Receivables from buyers of properties amounting to SEK 432 M were recognized as other interest-bearing receivables among current assets. See Note 3, point F for the change in accounting practices related to receivables from buyers of property. The 2004 amount includ-ed SEK 582 M for Group companies divested, for which payment was received early in 2005.
For a further description of the respective business streams, see Note 4, “Segment
reporting.”
Income from current-asset properties comes mainly from Commercial Project
Development and Residential Project Development.
Completed properties, properties under construction and development proper-
ties are all reported as current-asset properties.
Divestments of current-asset properties 2005 2004
Divestment revenue Commercial Project Development 4,430 4,645
Other commercial properties 820 533
Residential Project Development 4,150 4,143
9,400 9,321
Note 22 Current-asset properties/Project development
Current-asset properties are reported in compliance with IAS 2, “Inventories.” See “Accounting and valuation principles,” Note 1.
The allocation of balance sheet items among the various business streams can be seen below.
Balance sheet item Business stream 2005 2004
Commercial Project Development Commercial Project Development 5,804 7,408
Other commercial properties Construction 1,396 1,272
Residential Project Development Residential Project Development 3,282 3,268
Total 10,482 11,948
Book value Commercial Project Development –2,804 –3,150
Other commercial properties –574 –383
Residential Project Development –3,347 –3,505
–6,725 –7,038Gross incomeCommercial Project Development1 1,626 1,495
Other commercial properties 246 150
Residential Project Development 803 638
2,675 2,283
1 The amount included SEK 0 M (25) from divestments of properties in joint ventures.

Skanska Annual Report 2005 Notes, including accounting and valuat ion pr inc iples 101
No
tes,
incl
ud
ing
acc
ou
nti
ng
an
d v
alu
atio
n p
rin
cip
les
The book value of current-asset properties is allocated between properties carried
at cost and properties carried at net realizable value, as shown in the following
table. Net Cost realizable value Total 2005 2004 2005 2004 2005 2004
CommercialProject Development 5,356 6,724 448 684 5,804 7,408
Other commercialproperties 882 1,124 514 148 1,396 1,272
Residential ProjectDevelopment 3,207 3,119 75 149 3,282 3,268
Total 9,445 10,967 1,037 981 10,482 11,948
Fair value of current-asset propertiesThe market value of completed commercial properties on December 31, 2005 was
estimated at SEK 4.6 billion (6.6), partially in collaboration with external apprais-
ers. This included partly owned properties. The corresponding book value was
SEK 3.2 billion (4.4).
Including projects recognized as completed on January 1, 2006, estimated total
market value was about SEK 4.8 billion (6.9), with a corresponding book value of
SEK 3.4 billion (4.6).
Other properties have an estimated market value that largely coincides with
their book value of SEK 7.1 billion (7.2).
Information on assessed value for tax purposes of current-assets properties in Sweden Corresponding Assessed value book value 2005 2004 2005 2004
Buildings 2,759 3,281 3,796 4,567
Land 1,928 2,840 1,850 1,897
Total 4,687 6,121 5,646 6,464
Assets pledgedCurrent-asset properties used as collateral for loans and other obligations totaled
SEK 5 M (89). See Note 34.
Other mattersInformation on capitalized interest is reported in Note 15, “Borrowing costs.”
Note 22 continued
Book value Properties Total current-asset Completed properties under construction Development properties properties 2005 2004 2005 2004 2005 2004 2005 2004
Commercial Project Development 3,157 4,570 599 419 2,048 2,419 5,804 7,408
Other commercial properties 44 132 444 321 908 819 1,396 1,272
Residential Project Development 261 652 601 608 2,420 2,008 3,282 3,268
Total 3,462 5,354 1,644 1,348 5,376 5,246 10,482 11,948
Commercial Other commercial Residential Project Total current-asset Project Development properties Development properties 2005 2004 2005 2004 2005 2004 2005 2004
Book valueJanuary 1 7,408 9,421 1,272 1,051 3,268 3,394 11,948 13,866
Adjustment of opening balances
upon transition to IAS 39 –13 –13
Business combinations 6 0 6
Divestments of companies –1 –1 –137 –1 –138
New acquisitions 1,135 1,331 640 270 3,181 3,665 4,956 5,266
Divestments –2,804 –3,150 –574 –383 –3,347 –3,505 –6,725 –7,038
Impairment losses/reversalsof impairment losses –98 –8 –9 –40 –13 –48 –120
Reclassifications –127 –48 25 332 43 –171 –59 113
Change for the year due to IAS 39 7 7
Exchange rate differences for the year 198 –54 41 12 178 35 417 –7
December 31 5,804 7,408 1,396 1,272 3,282 3,268 10,482 11,948
Breakdown of divestments by Commercial Project Development among com-pleted projects, properties under constructionand development properties Properties under Completed construction and properties development properties Total 2005 2004 2005 2004 2005 2004
Divestment revenue 3,430 3,333 1,000 1,312 4,430 4,645
Book value –2,231 –2,170 –573 –980 –2,804 –3,150
Gross income 1,199 1,163 427 332 1,626 1,495
Impairment losses/reversals of impairment lossesCurrent-asset properties are valued in compliance with IAS 2, “Inventories,” and
are thus carried at cost or net realizable value, whichever is lower. Adjustments in
net realizable value via an impairment loss is recognized, as are reversals of previ-
ous impairment losses, in the income statement as part of ”Cost of sales.” Net
realizable value is affected by the type and location of the property as well as by
the type and location of the property and by the targeted return in the market.
The following table shows that during 2005, impairment losses totaling SEK 1 M
(46) were reversed. The reason for this was that net
realizable value increased during the year.
Reversals of Impairment losses impairment losses Total 2005 2004 2005 2004 2005 2004
CommercialProject Development –142 44 0 –98
Other commercialproperties –9 –9 1 –8 –9
Residential ProjectDevelopment –40 –15 2 –40 –13
Total –49 –166 1 46 –48 –120

102 Notes, including accounting and valuat ion pr inc iples Skanska Annual Report 2005
No
tes,
incl
ud
ing
acc
ou
nti
ng
an
d v
alu
atio
n p
rin
cip
les
Note 23 Inventories etc.
Inventories are reported in compliance with IAS 2, “Inventories.” See Accounting
and valuation principles,” Note 1.
2005 2004
Raw materials and supplies 340 317
Products being manufactured 120 91
Finished products and merchandise 41 202
Total 501 610
Other mattersThere were no significant differences between the carrying amount for inventories
and their fair value. No portion of inventories was adjusted due to an increase in net
realizable value. No merchandise was used as collateral for loans and other obliga-
tions.
Note 24 Trade and other receivables
Note 27 Equity/Earnings per share
In the consolidated financial statements, equity is divided between equity attribut-
able to equity holders (shareholders) and minority interest. Minority interest
accounts for less than one percent of total equity.
During the year, equity changed as follows.Closing balance, 2004 16,368Attributable to equity holdersChange to IAS 39, opening balance, 2005 –11
Dividend –1,674
Translation differences 1,135
Effect of reporting of pensions in compliance with IAS 19 –1,190
Effect of share-based payment 12
Effect of IAS 39 hedge accounting 52
Change in minority interest 5
Profit for the year attributable to
Equity holders 3,879
Minority interest 11
Closing balance 18,587Equity attributable to equity holders is allocated as follows: 2005 2004
Capital stock 1,256 1,256
Other contributed capital 316 316
Reserves 1,442 214
Retained earnings 15,440 14,465
Total 18,454 16,251
The following reserves are found in the consolidated financial statements: 2005 2004
Translation reserve 1,349 214
Hedging reserve 93 0
Fair value reserve 0 -
Total 1,442 214
Contributed capital: Paid-in capital in excess of par value from historical issues of new
shares is recognized as “Contributed capital.”
Retained earnings: Retained earnings include the profit for the year plus undistributed
Group profits earned in prior years. The statutory reserve is part of retained earnings, as
is change in pension liability, which in compliance with IAS 19 was charged it in the
amount of SEK –1,190 M ( –425). See Note 29, “Pensions.” In compliance with IFRS 2,
the year’s change in share-based payment was recognized directly in equity in the
amount of SEK +12 M (0). See below.
Translation reserve: The translation reserve consists of accumulated translation differ-
ences from the translation of financial reports for operations abroad. The translation
reserve also includes exchange rate differences that have arisen when hedging net
investments in operations abroad. The translation reserve was reset to zero upon the
transition to IFRS on January 1, 2004. Translation differences for the year amounted to
SEK 1,633 M (33) and consisted mainly of differences in USD, NOK, CZK and CLP (for cur-
rency abbreviations, see Note 35, “Effect of changes in exchange rates”).
During the year, the translation reserve was affected by exchange rate differences of
SEK –498 M (218) due to currency hedges. The Group has currency hedges against net
investments mainly in EUR, BRL and CLP. The Group’s hedging of its net investment in
American operations was unwound during the spring. In all, the Group was affected by
currency hedges in BRL and CLP totaling SEK –0.2 billion, in EUR totaling SEK –0.1 billion
and in USD totaling SEK –0.2 billion. In 2004, the amount was primarily affected by the
U.S. dollar but also by the British pound.
Hedging reserve: Recognized in the hedging reserve are unrealized gains and losses on
hedging instruments when applying hedge accounting with regard to forecasted cash
flows. On January 1, 2004, SEK 41 M was transferred directly into the hedging reserve in
equity upon transition to IAS 39. This amount came from Skanska’s operations in Poland,
where hedge accounting is applied for transaction exposure to foreign currencies. The
change in the reserve for the year, also attributable to Poland, amounted to SEK 52 M.
The closing balance of the reserve was thus SEK 93 M.
Non-interest-bearing business receivables are reported as “Trade and other receiv-
ables.” Trade and other receivables are part of the Group’s operating cycle and are
consequently recognized as current assets.
2005 2004
Trade accounts receivable 18,941 15,949
Operating receivables from joint ventures 183 344
Prepaid expenses and accrued income 1,621 1,840
Other operating receivables 2,240 3,611
Total 22,985 21,744
Note 25 Short-term investments
Investments with an insignificant risk of fluctuations in value and which can easily
be transformed into cash are reported as short-term investments. Their maturity
from the acquisition date is three months or shorter.
Short-term investments are allocated as shown in the table below.
2005Held-to-maturity investments 237
Financial assets available for sale 2,858
3,0952004Short-term investments 3,053
Note 26 Cash and cash equivalents
Starting in 2005, checks issued but not yet cashed were included in cash and cash
equivalents. See the change of accounting practice in Note 3, point D. The amount
is related to checks in the United States and the United Kingdom and amounted
to SEK 919 M.

Skanska Annual Report 2005 Notes, including accounting and valuat ion pr inc iples 103
No
tes,
incl
ud
ing
acc
ou
nti
ng
an
d v
alu
atio
n p
rin
cip
les
Fair value reserve: The fair value reserve includes the accumulated net change in the fair
value of financial assets available for sale until the asset is derecognized from the bal-
ance sheet.
IFRS 2 , “Share-Based Payment”: The share incentive program (“Share Award Plan”)
introduced during 2005 is recognized as share-based payment, which is settled with
Skanska’s own capital instruments in compliance with IFRS 2. This implies that fair value
is calculated on the basis of estimated fulfillment of established financial targets during
a measurement period. After the close of the measurement period, fair value is estab-
lished. This value is allocated over the four-year vesting period. There is no reappraisal
after fair value is established during the remainder of the vesting period, aside from
changes in the number of shares because the condition of continued employment dur-
ing the vesting period is no longer met.
Dividend: After the balance sheet date, the Board of Directors decided to propose a reg-
ular dividend of SEK 4.50 (4.00) per share and an extra dividend of SEK 2.00 per share.
The dividend is subject to the approval of the Annual Shareholders’ Meeting on March
30, 2006.
The overall proposed dividend in SEK M is
2005 2004
Regular dividend 1,884 1,674
Extra dividend 837
Total 2,721 1,674
Number of shares: Information on the number of shares is provided in the Parent Com-
pany financial statements, Note 58.
IAS 33, “Earnings per share”: Earnings per share are calculated as profit for the year
divided by the average number of shares. See Note 45, “Definitions.”
The method for calculating earnings per share before and after dilution effects is
found in “Accounting and valuation principles,” Note 1.
Dilution effect: In past employee stock option programs, the dilution effect of potential
ordinary shares has been calculated on the basis of the difference between the exercise
price of the option and the average price of a Skanska share during the period. In the
Share Award Plan introduced in 2005, the number of potential ordinary shares is calcu-
lated under the measurement period based on the estimated number of shares that will
be issued due to fulfillment of the established targets. Afrer the end of the measure-
ment period, Skanska establishes the number of shares that may be issued provided that
the conditions regarding continued employment are met. The number of potential ordi-
nary shares thus calculated is then reduced by the difference between the payment
Skanska expected to receive and the average share price during the period.
Past employee stock option programs resulted in no dilution effect during 2005. The
Skanska Share Award Plan introduced during 2005 has been estimated to have a dilution
effect during 2005 of 8,851 shares or 0.002 percent of the number of shares outstanding.
Other matters: Concerning equity swaps for employee stock options, see “Accounting
and valuation principles,” Note 1, and Note 38, “Compensation to executive officers.”
Note 27 continued
Equity attributable to equity holders Contributed Retained Minority Total Capital stock capital Reserves earnings Total interest equity
Equity, January 1, 2004 1,256 316 0 12,929 14,501 200 14,701Equity swaps 44 44 44
Change in translation reserve for the year 214 214 5 219
Change in pensions for the year in compliance with IAS 19 –603 –603 –603
Other transfers of assets recognized
directly in equity1 –95 –95
Taxes attributable to items recognized
directly in equity 178 178 178
Net income recognized directly in equity, excluding transactions with the Company’s owners 0 0 214 –381 –167 –90 –257
Profit for the year 3,173 3,173 13 3,186
Total recognized income and expense, excludingtransactions with the Company’s owners 0 0 214 2,792 3,006 –77 2,929
Dividend –1,256 –1,256 –6 –1,262
Equity, December 31, 2004 1,256 316 214 14,465 16,251 117 16,368
Change in accounting principle, IAS 39 41 –52 –11 –11
1 SEK –3 M ( –95) in minority interest was recognized as other changes in assets recognized directly in equity. The amount consisted of purchases from minority interests totaling SEK –3 M ( –42) and divestments of Group companies with minority interest of SEK 0 M ( –53).

104 Notes, including accounting and valuat ion pr inc iples Skanska Annual Report 2005
No
tes,
incl
ud
ing
acc
ou
nti
ng
an
d v
alu
atio
n p
rin
cip
les
Specification of reserves included in “Equity attributable to equity holders” 2005 2004
Translation reserve January 1 214 0
Translation differences for the year 1,633 33
Less hedging of currency risks
in operations abroad –498 218
Less translation differences
attributable to divested businesses 0 –37
1,349 214Hedging reserve January 1 0
Change in accounting principle 41
Cash flow hedges:
Recognized directly in equity 115
Transferred to income statement –50
Taxes attributable to hedging for the year –13
93
Total reserves 1,442 214 Fair value reserve: The fair value reserve amounted to SEK 0 M.
Note 28 Financial liabilities
Financial liabilities are allocated between non-current and current liabilities. Nor-
mally, a maturity date within one year is required if a liability is to be treated as
current. This does not apply to discounted operating liabilities, which are part of
Skanska’s operating cycle and are consequently recognized as current liabilities
regardless of the maturity date.
Regarding financial risks and financial policies, see Note 6, “Financial instru-
ments.”
Financial non-current liabilities 2005 2004
Financial liabilities carried at fair value
through profit or loss
Unrealized non-interest-bearing change in value of derivatives 22
Loans and credit facilities
Bond loans 939 1,497
Liabilities to credit institutions 1,000 1,179
Liabilities to associated companies 3
Other liabilities 463 367
Total 2,424 3,046 of which interest-bearing
financial non-current liabilities 2,402 3,046
of which non-interest-bearing
financial non-current liabilities 22 0
Note 29 Pensions
Provisions for pensions are reported in compliance with IAS 19, “Employee Bene-
fits.” See “Accounting and valuation principles,” Note 1.
Pension liabilities according to the balance sheet 2005 2004
Interest-bearing pension liability 2,407 1,005
Other pension obligations 0 107
Total 2,407 1,112
Skanska has defined-benefit pension plans in Sweden, Norway, the U.K. and the
U.S. The pension in these plans is mainly based on final salary. The plans include a
large number of employees, but Skanska also has defined-contribution plans in
these countries. Group subsidiaries in other countries mainly have defined-contri-
bution plans.
Defined-benefit plansThe pension plans mainly consist of retirement pensions. Each respective employer
usually has an obligation to pay a lifetime pension. Benefits are based on the num-
ber of years of employment. The employee must belong to the plan for a certain
number of years to earn a full retirement pension entitlement. For each year, the
employee earns increased pension entitlements, which is reported as pension
earned during the period plus an increase in pension obligation.
Pension plans are funded by securing pension obligations with assets in pension
funds and provisions in the balance sheet. The plans are funded by payments from
Note 27 continued Equity attributable to equity holders Contributed Retained Minority Total Capital stock capital Reserves earnings Total interest equity
Adjusted equity, January 1, 2005 1,256 316 255 14,413 16,240 117 16,357Change in translation reserve for the year 1,135 1,135 9 1,144
Change in hedging reserve for the year 65 65 65
Change in share-based payment for the year in compliance with IFRS 2 12 12 12
Change in pensions for the year in compliance with IAS 19 –1,685 –1,685 –1,685
Other transfers of assets recognized directly in equity1 0 –3 –3
Taxes attributable to items recognized directly in equity –13 495 482 482
Net income recognized directly in equityexcluding transactions with the Company’s owners 0 0 1,187 –1,178 9 6 15
Profit for the year 3,879 3,879 11 3,890Total recognized income and expense, excluding transactions with the Company’s owners 0 0 1,187 2,701 3,888 17 3,905
Dividend –1,674 –1,674 –1 –1,675
Equity, December 31, 2005 1,256 316 1,442 15,440 18,454 133 18,587
1 SEK –3 M ( –95) in minority interest was recognized as other changes in assets recognized directly in equity. The amount consisted of purchases from minority interests totaling SEK –3 M ( –42) and divestments of Group companies with minority interest of SEK 0 M ( –53).
Financial current liabilities 2005 2004
Financial liabilities carried at fair value
through profit or loss
Unrealized non-interest-bearing
change in value of derivatives 196
Loans and credit facilities
Bond loans 183 310
Liabilities to credit institutions1 548 468
Liabilities to associated companies 0 14
Discounted liabilities 94 0
Other liabilities 59 214
Total 1,080 1,006
of which interest-bearing financial current liabilities 884 1,006
of which non-interest-bearing financial current liabilities 196 0
Note 28 continued

Skanska Annual Report 2005 Notes, including accounting and valuat ion pr inc iples 105
No
tes,
incl
ud
ing
acc
ou
nti
ng
an
d v
alu
atio
n p
rin
cip
les
the respective Group companies and in some cases the employees.
The plan assets in each pension fund are smaller than the pension obligation.
For this reason, the difference is recognized as a liability in the balance sheet. The
ceiling rule that, in some cases, limits the value of these assets in the balance
sheet does not apply when plan assets are smaller than pension obligations.
On the balance sheet date, the pension obligation amounted to SEK 10,738 M
(7,591). The increase was largely due to lower long-term interest rates and thus
lower discount rates, which provided a higher pension obligation calculated on
the basis of present value. Plan assets amounted to SEK 8,331 M (6,586).
During 2005, the EU adopted IASB’s amendment to IAS 19. This amendment
implies that actuarial gains and losses may be recognized directly in the balance
sheet according to the alternative rule. Skanska is applying this alternative meth-
od. Actuarial gains and losses amounted to a net loss of SEK 1,471 M (590) for the
year. The accumulated net loss amounted to SEK 2,061 M (590), which is included
in recognized pension liability. The actuarial loss was mainly due to lower discount
rates and was offset to some extent by actuarial gains on plan assets.
The return on plan assets recognized in the income statement amounted to SEK
455 M (356), while actual return amounted to SEK 1,082 M (532).
The plan assets consisted mainly of equities, interest-bearing securities and
mutual fund units. No assets are used in Skanska’s operations. An insignificant per-
centage of shareholdings consists of Skanska shares.
Plan assets United United Sweden Norway Kingdom States
2005 Equities 38% 37% 63% 51%
Interest-bearing securities 46% 52% 37% 49%
Alternative investments 16% 11% 0% 0%
Expected return 6.50% 6.50% 6.50% 6.80%
Actual return 13.80% 14.50% 16.00% 4.40%
2004Equities 30% 28% 65% 56%
Interest-bearing securities 54% 61% 35% 44%
Alternative investments 16% 11% 0% 0%
Expected return 6.50% 5.90% 7.10% 6.50%
Actual return 8.40% 4.50% 12.70% 6.00%
The ITP occupational pension plan in Sweden is a defined-benefit plan. A small
portion is secured by insurance from the retirement insurance company Alecta.
This is a multi-employer insurance plan, and there is insufficient information to
report these obligations as a defined-benefit plan. Pensions secured by insurance
from Alecta are therefore reported as a defined-contribution plan.
Trade union-sponsored plans in the United States are defined-benefit plans that
cover multiple employers. Since there is insufficient information to report these
obligations as defined-benefit plans, they are reported as defined-contribution
plans.
Defined-contribution plansThese plans mainly cover retirement pension, disability pensions and family pen-
sions. The premiums are paid regularly during the year by the respective Group
company to separate legal entities, for example insurace companies. The size of
the premium is based on salary. The pension expense for the period is included in
the income statement.
Note 29 continued Obligations related to employee benefits, defined-benefit plans 2005 2004
Pension obligations, funded plans,
present value on December 31 10,738 7,591
Plan assets, fair value, December 31 –8,331 –6,586
Net liability according to balance sheet 2,407 1,005
Pension obligations and plan assets by country United United Sweden Norway Kingdom States Total
2005Pension obligations 3,864 2,122 3,912 840 10,738
Plan assets –3,035 –1,497 –3,320 –479 –8,331
2004Pension obligations 2,941 1,283 2,817 550 7,591
Plan assets –2,646 –1,114 –2,480 –346 –6,586
Total pensions expenses 2005 2004
Pension earned during the year –439 –399
Less: Funds contributed by employees 56 46
Interest on obligations –418 –352
Expected return on plan assets 455 356
Curtailments and settlements 0 0
Pension expenses, defined-benefit plans –346 –349
Pensions expenses, defined-benefit plans –651 –632
Social insurance contributions, defined-benefit
and defined-contribution 1 –76 –81
Total pension expenses –1,073 –1,062
1 Refers to special payroll tax in Sweden and employer fee in Norway.
Allocation of pension expenses in the income statement 2005 2004
Cost of sales –854 –771
Selling and administrative expenses –256 –295
Financial items 37 4
Pension expenses, defined-benefit plans –1,073 –1,062
Actuarial gains and losses recognized directly in equity 2005 2004
January 1 –590 0
Changed assumptions for pension obligations –2,098 –766
Difference between expected,
and actual return on plan assets 627 176
Accumulated –2,061 –590
See also “Consolidated statement of recognized income and expenses, which
shows the tax portion and social insurance contributions recognized directly in
equity.
Pension obligations 2005 2004
January 1 7,591 6,567
Transferred to liabilitiesclassified as held for sale –8 0
Pensions earned during the year 439 399
Interest on obligations 418 352
Benefits paid by employers –143 –123
Benefits paid by plan assets –100 –89
Acquisitions of companies 0 0
Divestments of companies –12 –196
Reclassifications 29 0
Actuarial gains ( –), losses (+) for the year 2,098 766
Curtailments and settlements –6 0
Exchange rate differences 432 –85
Pensions obligations, present value 10,738 7,591

106 Notes, including accounting and valuat ion pr inc iples Skanska Annual Report 2005
No
tes,
incl
ud
ing
acc
ou
nti
ng
an
d v
alu
atio
n p
rin
cip
les
Plan assets 2005 2004
January 1 6,586 4,929
Expected return on plan assets 455 356
Funds contributed by employers 362 1,329
Funds contributed by employees 56 46
Benefits paid –100 –89
Acquisitions of companies 0 0
Divestments of companies –8 –121
Reclassifications 0 52
Actuarial gains (–), losses (+) for the year 627 176
Curtailments and settlements 0 0
Exchange rate differences 353 –92
Plan assets, fair value 8,331 6,586
Funds contributed are expected to total about SEK 400 M during 2006.
Reconciliation of interest-bearing pension liability 2005 2004
Pension liabilities, January 1 1,005 1,638
Transferred to liabilities
classified as held for sale –8 0
Pension expenses 346 349
Benefits paid by employers –143 –123
Funds contributed by employers –362 –1,329
Acquisitions of companies 0 0
Divestments of companies –4 –75
Reclassifications 28 –52
Actuarial gains (–), losses (+) for the year 1,471 590
Curtailments and settlements –6 0
Exchange rate differences 80 7
Net liability according to balance sheet 2,407 1,005
Actuarial assumptions Sweden Norway U.K. U.S.
2005Discount rate, January 1 5.00% 5.25% 5.50% 5.50%
Discount rate, December 31 3.50% 4.00% 4.75% 5.25%
Expected return on
plan assets for the year 6.50% 6.50% 6.50% 6.80%
of which, equities 8.30% 8.80% 8.00% 8.00%
of which, interest-bearing securities 5.00% 5.30% 5.10% 5.00%
Expected pay increase, December 31 3.00% 3.25% 4.25% 4.50%
Expected inflation, December 31 2.00% 2.50% 2.50% 3.00%
2004
Discount rate, January 1 5.75% 5.50% 5.50% 5.50%
Discount rate, December 31 5.00% 5.25% 5.50% 5.50%
Expected return on
plan assets for the year 6.50% 5.90% 7.10% 6.50%
of which, equities 8.00% 9.00% 7.50% 8.00%
of which, interest-bearing securities 5.00% 5.50% 4.50% 4.00%
Expected pay increase, December 31 3.00% 3.30% 4.25% 4.40%
Expected inflation, December 31 2.00% 2.50% 2.75% 2.90%
Sweden Norway U.K. U.S.A
Life expectancyafter age 65, men 18 years 18 years 21 years 19 years
Life expectancyafter age 65, women 22 years 20 years 24 years 22 years
Expected return on interest-bearing securities is established on the basis of market
interest rates on the balance sheet date for high-grade long-term corporate bonds
or government bonds in each respective country, adjusted for current holdings in
each respective portfolio.
For the equities market as a whole, a risk premium of 3 percent is added. This
premium is adjusted for the risk profile of each respective equities market.
Note 29 continued Sensitivity of pension obligation to change in discount rate Sweden Norway U.K. U.S. Total
Pension obligation, December 31 3,864 2,122 3,912 840 10,738
Discount rateincrease of 0.25 percent1 –150 –100 –200 –50 –500
Discount ratedecrease of 0.25 percent1 150 100 200 50 500
1 Estimated change in pension obligation/pension liability if the discount rate changes. If pension liability increases, the Group’s equity is reduced by about 75 percent of the increase in pension liability, after taking into account deferred tax and social insurance
contributions.
Note 30 Provisions
Provisions are reported in compliance with IAS 37, “Provisions, Contingent Liabili-
ties and Contingent Assets”. See “Accounting and valuation principles,” Note 1.
Provisions are allocated in the balance sheet between non-current liabilities and
current liabilities. Provisions are both interest-bearing and non-interest-bearing.
Provisions that are part of Skanska’s operating cycle are recognized as current.
2005 2004
Non-current provisions
Interest-bearing 143 135
Current provisions
Interest-bearing 20 0
Non-interest-bearing 3,180 2,740
Total 3,343 2,875
The amount for interest-bearing provisions included SEK 112 M (133) in provision
to the employee foundation in Sweden.
The change during the year in provisions, allocated among the reserve for legal
disputes, provision for warranty obligations and other provisions can be seen in
the following table.
Warranty Other Legal disputes obligations provisions Total
January 1 700 1,052 1,123 2,875
Change in accounting principle, IAS 19 215 215
Divestments of companies –3 –2 –5
Provisions for the year 256 314 396 966
Provisions utilized –111 –186 –482 –779
Unutilized amounts that were reverse,
change in value –159 –56 –83 –298
Exchange rate differences 41 34 47 122
Reclassifications 171 –97 173 247
December 31 898 1,058 1,387 3,343
Specification of “Other provisions” 2005 2004
Restructuring measures 177 217
Project risks 85 146
Employee foundation, Sweden 112 133
Employee-related provisions 358 264
Environmental obligations 78 45
Provision for unsold housing units, Sweden 38 44
Provision in compliance with IAS 19 for social insurance
contributions on pensions 196 13
Miscellaneous provisions 343 261
Total 1,387 1,123
Normal cycle time for “Other provisions” is about one to three years.
Provisions for warranty expenses are related to expenses that may arise during
the warranty period. Such provisions in Construction are mainly based on average
experience-based cost, expressed as a percentage of sales during a five-year peri-
od. The expenses are charged to each project on a continuous basis. Provisions for
warranty obligations in other business streams are based on individual assess-
ments of each project. The change in 2005 was mainly related to Construction.
Provisions for legal disputes refer to provisions in the Construction business
stream for projects that have been completed.

Skanska Annual Report 2005 Notes, including accounting and valuat ion pr inc iples 107
No
tes,
incl
ud
ing
acc
ou
nti
ng
an
d v
alu
atio
n p
rin
cip
les
Note 31 Trade and other payables
Non-interest-bearing liabilities in business operations are recognized as “Trade
and other payables.” Such liabilities are part of the Group’s operating cycle and
are consequently recognized as current liabilities.
2005 2004
Trade accounts payable 14,343 12,438
Advance payments from customers 1,548 1,702
Payable to joint ventures ventures 20 13
Payable to associated companies 0 1
Accrued expenses and prepaid income 7,187 6,769
Other operating expenses 5,122 3,581
Total 28,220 24,504
Trade and other payables included SEK 919 M (0) for checks issued but not yet
cashed in the U.S. and the U.K. See change of accounting practice, Note 3, point D.
Note 32 Specification of interest-bearing receivable per asset and liability
The following table allocates financial current and non-current assets as well as liabilities between interest-bearing and non-interest-bearing items. 2005 2004 Interest-bearing Non-interest-bearing Total Interest-bearing Non-interest-bearing Total
ASSETSNon-current assetsProperty, plant and equipment 5,243 5,243 5,507 5,507
Goodwill 4,154 4,154 3,899 3,899
Other intangible assets 644 644 535 535
Investments in joint ventures and associated companies 1,834 1,834 862 862
Financial non-current assets 1,070 166 1,236 1,063 74 1,137
Deferred tax assets 2,282 2,282 1,633 1,633
Total non-current assets 1,070 14,323 15,393 1,063 12,510 13,573
Current assets
Current-asset properties 10,482 10,482 11,948 11,948
Inventories 501 501 610 610
Financial current assets 2,225 35 2,260 2,490 0 2,490
Tax receivables 330 330 269 269
Gross amount due from customers for contract work 5,610 5,610 3,579 3,579
Trade and other receivables 22,985 22,985 21,744 21,744
Short-term investments 3,095 3,095 3,053 3,053
Cash and cash equivalents 10,583 10,583 5,815 5,815
Assets classified as held for sale 2 70 72
Total current assets 15,905 40,013 55,918 11,358 38,150 49,508
TOTAL ASSETS 16,975 54,336 71,311 12,421 50,660 63,081
LIABILITIES Non-current liabilities Financial non-current liabilities 2,402 22 2,424 3,046 0 3,046
Pensions 2,407 2,407 1,005 107 1,112
Deferred tax assets 2,831 2,831 2,744 2,744
Non-current provisions 143 143 135 135
Total non-current liabilities 4,952 2,853 7,805 4,186 2,851 7,037
Current liabilitiesFinancial current liabilities 884 196 1,080 1,006 0 1,006
Tax liabilities 595 595 998 998
Current provisions 20 3,180 3,200 2,740 2,740
Gross amount due to customers for contract work 11,782 11,782 10,428 10,428
Trade and other payables 28,220 28,220 24,504 24,504
Liabilities classified as held for sale 8 34 42
Total current liabilities 912 44,007 44,919 1,006 38,670 39,676
TOTAL LIABILITIES 5,864 46,860 52,724 5,192 41,521 46,713
Interest-bearing net receivable 11,111 7,229
Note 30 continued
The provision to the employee fund in Sweden refers to a refund of surplus funds
from the retirement insurance company SPP, now Alecta. The provision is used in
consultation with trade union representatives to enable employees with reduced
work capacity to remain employed on a part-time basis. The employee is compen-
sated for loss of income and loss of future pension benefits.
Employee-related provisions included such items as the cost of profit-sharing,
certain bonus programs and other obligations to employees.
Among provisions for environmental obligations are the costs of restoring grav-
el pits to their natural state in Swedish operations.
Restructuring provisions refer to the expenses of adapting operations to the pro-
jected market and in accordance with the Group’s strategic plan. Expenses were
paid for such items as closing down operations and phasing out employees.

108 Notes, including accounting and valuat ion pr inc iples Skanska Annual Report 2005
No
tes,
incl
ud
ing
acc
ou
nti
ng
an
d v
alu
atio
n p
rin
cip
les
Note 33 Expected recovery periods of assets and liabilities
2005 2004 Amounts expected to be recovered Within 12 month 12 months or longer Total Within 12 month 12 months or longer Total
ASSETSNon-current assetsProperty, plant and equipment 1 1,020 4,223 5,243 1,100 4,407 5,507
Goodwill1 4,154 4,154 3,899 3,899
Other intangible assets 1 50 594 644 10 525 535
Investments in joint ventures and associated companies 2 1,834 1,834 862 862
Financial non-current assets 1,236 1,236 1,137 1,137
Deferred tax assets 3 2,282 2,282 1,633 1,633
Total non-current assets 1,070 14,323 15,393 1,110 12,463 13,573
Current assets Current-asset properties 4 5,550 4,932 10,482 5,976 5,972 11,948
Inventories 5 447 54 501 569 41 610
Financial current assets 2,097 163 2,260 2,485 5 2,490
Tax receivables 330 330 269 269
Gross amount due from customers for contract work 5 5,251 359 5,610 3,440 139 3,579
Trade and other receivables 5 22,454 531 22,985 21,025 719 21,744
Short-term investments 3,095 3,095 3,053 3,053
Cash and cash equivalents 10,583 10,583 5,815 5,815
Assets classified as held for sale 72 72
Total current assets 49,879 6,039 55,918 42,632 6,876 49,508
TOTAL ASSETS 50,949 20,362 71,311 43,742 19,339 63,081
Amounts expected to be paid Within 12 month 12 months or longer Totalt Within 12 month 12 months or longer Totalt
LIABILITIES Non-current liabilities
Financial non-current liabilities 25 2,399 2,424 14 3,032 3,046
Pensions 242 2,165 2,407 81 1,031 1,112
Deferred tax liabilities 2,831 2,831 2,744 2,744
Non-current provisions 143 143 135 135
Total non-current liabilities 267 7,538 7,805 95 6,942 7,037
Current liabilities
Financial current liabilities 986 94 1,080 992 14 1,006
Tax liabilities 595 595 998 998
Current provisions 2,051 1,149 3,200 2,065 675 2,740
Gross amount due to customers for contract work 11,126 656 11,782 10,428 10,428
Trade and other payables 27,168 1,052 28,220 24,017 487 24,504
Liabilities classified as held for sale 42 42
Total current liabilities 41,968 2,951 44,919 38,500 1,176 39,676
TOTAL LIABILITIES 42,235 10,489 52,724 38,595 8,118 46,713
1 In case of amounts expected to be recovered within twelve months, expected annual depreciation/amortization has been recognized.2 No portion of this amount is expected to be recovered within twelve months.3 Deferred tax assets are expected to be recovered in their entirety in more than twelve months.4 Recovery within one year on current-asset properties is based on a historical assessment from the past three years.5 Current receivables that fall due in more than twelve months are part of the operating cycle and are thus recognized as current.

Skanska Annual Report 2005 Notes, including accounting and valuat ion pr inc iples 109
No
tes,
incl
ud
ing
acc
ou
nti
ng
an
d v
alu
atio
n p
rin
cip
les
Note 34 Assets pledged, contingent liabilities and contingent assets
Assets pledged 2005 2004
Mortgages, current-asset properties 5 89
Chattel mortgages 0 42
Shares and participations 1,444 609
Receivables 381 335
Total 1,830 1,075
The use of shares and participations as assets pledged refers to shares in joint ven-
tures belonging to Infrastructure Development. These assets are pledged as collat-
eral when obtaining outside lending for these joint ventures.
Receivables include liquid assets in escrow as collateral in conjunction with con-
struction projects.
Assets pledged for liabilities Property mortgages Chattel mortgages Shares and receivables Total 2005 2004 2005 2004 2005 2004 2005 2004
Own obligationsLiabilities to credit institutions 1 85 42 0 1 127
Other liabilities 4 381 226 381 230
Total own obligations 1 89 0 42 381 226 382 357
Other obligations 4 1,444 718 1,448 718
Total 5 89 0 42 1,825 944 1,830 1,075
Contingent liabilitiesContingent liabilities are reported in compliance with IAS 37, “Provisions, contin-
gent liabilities and contingent assets. See Accounting and valuation principles,”
Note 1, which describes changes in accounting principles. Comparative figures
have been restated on the basis of the new principles. See Note 3, “Effects of
changes in accounting principles,” point C.
2005 2004
Contingent liabilities related to construction consortia 5,518 4,146
Contingent liabilities related to joint ventures 1,495 889
Other contingent liabilities 2,090 2,390
Total 9,103 7,425
The Group’s contingent liabilities related to construction consortia totaled about
SEK 5.5 billion (4.1). This amount referred to the portion of the joint and several
liability for the obligations of construction consortia affecting consortium mem-
bers outside the Group. Such liability is often required by the customer. To the
extent it is deemed likely that Skanska will be subject to liability claims, the obliga-
tion is reported as a liability in the balance sheet.
Contingent liabilities related to joint ventures refer mainly to guarantees issued
when joint ventures belonging to the Infrastructure Development business stream
have raised loans.
Most of the Group’s other contingent liabilities, SEK 2.1 billion (2.4), were relat-
ed to obligations attributable to the operations of Residential Project Develop-
ment Nordic.
During 1988–1990 the Skanska Group, through partly owned companies, pur-
chased holdings in aircraft. The depreciation deductions that were made were
later a topic of tax litigation affecting most of the partly owned companies. With
regard to tax litigation related to depreciation deductions, the Group has paid in
full the Tax Authority’s demands for additional taxes and accompanying fees and
interest. Due to differing views regarding the consequences for subsequent tax
years due to disallowed depreciation deductions, tax litigation has arisen concern-
ing later tax years as well. Taken together, the outcome of this tax litigation is
deemed to constitute only a limited risk to the Group.
On March 21, 2003, the Swedish Competition Authority filed suit against 11
companies with asphalt operations, among them Skanska. The suit requested a
total amount of SEK 1.6 billion in fines for alleged infringement of the Swedish
Competition Act, of which Skanska’s share was SEK 664 M. Early in 2006, the
Competition Authority lowered the requested amounts in such a way that the
total amount is now SEK 1.2 billion, of which Skanska’s share is nearly SEK 560 M.
Skanska denies the Competition Authority’s allegations. Similar litigation is also
underway in Finland. There the Competition Authority has demanded that
Skanska pay a penalty of about SEK 100 M. Skanska denies the allegations behind
this demand. Swedish municipalities have put forward demands for damages of
more than SEK 57 M due to the alleged anti-competitive activities in asphalt oper-
ations. Skanska denies the allegations on which the demands are based.
In December 2005, the competition authority in Slovakia announced a decision
concerning alleged pricing collaboration related to a road project. The fee
demanded for Skanska’s part amount to SEK 58 M. Skanska denies the allegation
and has appealed the decision.
No provision has been made for the above-described disputes, because of the
great uncertainty that surrounds the outcome of the disputes. In compliance with
the accounting principles applied, no such amounts have been included in the
table of the Group’s contingent liabilities.
Contingent assetsThe Group has no contingent assets of significant importance in assessing the
position of the Group. See also “Accounting and valuation principles,” Note 1.

110 Notes, including accounting and valuat ion pr inc iples Skanska Annual Report 2005
No
tes,
incl
ud
ing
acc
ou
nti
ng
an
d v
alu
atio
n p
rin
cip
les
Note 35 Effect of changes in foreign exchange rates
Exchange rates are dealt with in compliance with IAS 21, “The Effect of Changes in Foreign Exchange Rates.” See “Accounting and valuation principles,” Note 1.
Exchange rates Exchange rate at balance sheet date Change in percent Currency Country 2005 2004 2003 2004–2005 2003–2004
ARS Argentina 2.62 2.22 2.47 18 –10
CZK Czech Republic 0.32 0.30 0.28 10 6
DKK Denmark 1.26 1.21 1.22 4 –1
EUR EU euro zone 9.39 9.00 9.07 4 –1
GBP United Kingdom 13.67 12.70 12.89 8 –1
NOK Norway 1.17 1.09 1.08 8 1
PLN Poland 2.43 2.21 1.94 10 14
USD United States 7.94 6.62 7.26 20 –9
Average exchange rate Change in percent Currency Country 2005 2004 2003 2004-2005 2003-2004
ARS Argentina 2.56 2.50 2.75 2 –9
CZK Czech Republic 0.31 0.29 0.29 9 –1
DKK Denmark 1.25 1.23 1.23 1 0
EUR EU euro zone 9.28 9.13 9.12 2 0
GBP United Kingdom 13.57 13.45 13.19 1 2
NOK Norway 1.16 1.09 1.14 6 –4
PLN Poland 2.31 2.02 2.08 14 –3
USD United States 7.46 7.35 8.08 2 –9
Effect of changes in exchange rates on the income statement compared to the previous yearDuring 2005, the Swedish krona weakened against virtually all other currencies used by the Skanska Group. In the following table, the 2005 income statement is translat-
ed at the exchange rates prevailing in 2004. The change, or currency rate effect, for each currency is stated in SEK.
Income statement Currency rate effect 2005, at 2004 rates1 2005 2005 2004
Revenue 121,414 124,667 3,253 –4,689
Operating income 4,887 5,000 113 –10
Income after financial items 4,999 5,120 121 –8
Profit for the year 3,798 3,890 92 –1
1 2005 figures translated to the exchange rates prevailing in 2004.
Currency effect, by respective currency2005 USD EUR GBP NOK CZK PLN Others Total
Revenue 662 168 96 705 884 657 81 3,253
Operating income 4 7 3 33 46 20 0 113
Income after financial items 4 7 4 36 46 26 –2 121
Profit for the year 2 6 3 25 34 25 –3 92
2004 USD EUR GBP NOK CZK PLN Others Total
Revenue –4,269 1 242 –439 –15 –124 –85 –4,689
Operating income 10 0 –10 –16 –1 –3 10 –10
Income after financial items 10 0 –8 –17 –1 –4 12 –8
Profit for the year 13 0 –10 –12 –1 –2 11 –1
Effect on the Group of change in SEK against other currencies and change in USD against SEK
The following sensitivity analysis based on income statement and balance sheet
2005 shows the sensitivity of the Group to a unilateral 10 percent change in SEK
against all currencies and a unilateral 10 percent change in USD against SEK.
of which USD +/– 10% +/– 10%
Revenue +/– 9,633 +/– 4,294
Operating income +/– 235 +/– 28
Equity +/– 963 +/– 379
“Plus”means a weakening of the Swedish krona. “Plus” for USD thus means
increased value against SEK.

Skanska Annual Report 2005 Notes, including accounting and valuat ion pr inc iples 111
No
tes,
incl
ud
ing
acc
ou
nti
ng
an
d v
alu
atio
n p
rin
cip
les
Effects of changes in exchange rates in the balance sheet compared to previous year Group, amounts in SEK billion 2005 2004
Assets Property, plant and equipment 0.5 0.0
Intangible assets 0.5 0.0
Shares and participations 0.3 0.0
Interest-bearing receivables 0.1 0.0
Current-asset properties 0.4 0.0
Non-interest-bearing receivables 2.8 –0.6
Liquid assets 0.4 –0.1
Total 5.0 –0.7
Note 35 continued
Consolidated balance sheet by currency, SEK billion Other foreign Hedge 2005 USD GBP EUR NOK CZK DKK PLN currencies1 loans2 SEK Total
Assets
Property, plant and equipment 1.3 0.3 0.3 0.5 1.3 0.1 0.3 0.2 1.0 5.3
Intangible assets 0.3 1.5 0.4 1.5 0.4 0.0 0.0 0.5 0.2 4.8
Shares and participations 0.0 0.2 0.2 0.1 0.0 0.0 0.0 1.5 –0.1 1.9
Interest-bearing receivables 1.7 0.5 2.8 2.5 0.8 0.8 1.6 –8.7 1.3 3.3
Current-asset properties 0.0 0.0 2.2 0.9 0.5 1.1 0.0 0.3 5.5 10.5
Non-interest-bearing receivables 9.6 3.6 1.7 2.9 3.9 0.8 1.7 2.1 5.5 31.8
Liquid assets 2.5 2.2 0.1 0.1 0.3 0.0 0.2 0.1 8.2 13.7
Total 15.4 8.3 7.7 8.5 7.2 2.8 3.8 –4.0 21.6 71.3
Equity and liabilitiesEquity attributable to equity holders 3 3.0 1.0 4.7 2.9 2.4 0.7 1.1 2.0 0.7 18.5
Minority interest 0.0 0.0 0.1 0.0 0.1 0.0 0.0 0.0 –0.1 0.1
Interest-bearing liabilities 0.3 1.9 0.2 0.5 0.3 0.5 0.0 –7.7 1.6 8.3 5.9
Non-intrest-bearing liabilities 12.1 5.4 2.7 5.1 4.4 1.6 2.7 1.7 11.1 46.8
Total 15.4 8.3 7.7 8.5 7.2 2.8 3.8 –4.0 1.6 20.0 71.3
Other foreign Hedge 2004 USD GBP EUR NOK CZK DKK PLN currencies1 loans2 SEK Total
AssetsProperty, plant and equipment 1.2 0.3 0.3 0.5 1.1 0.2 0.4 0.0 1.5 5.5
Intangible assets 0.3 1.3 0.4 1.4 0.3 0.0 0.0 0.5 0.2 4.4
Shares and participations 0.0 0.0 0.1 0.0 0.0 0.0 0.0 0.8 0.0 0.9
Interest-bearing receivables 1.3 1.2 3.1 1.3 1.3 0.6 0.7 –8.2 2.3 3.6
Current-asset properties 0.6 0.0 1.6 0.7 0.7 1.5 0.1 0.3 6.4 11.9
Non-interest-bearing receivables 8.3 3.4 1.4 2.3 2.7 1.2 1.0 1.5 6.1 27.9
Liquid assets 1.3 0.2 0.1 0.1 0.2 0.0 0.1 0,2 6.7 8.9
Total 13.0 6.4 7.0 6.3 6.3 3.5 2.3 –4.9 23.2 63.1
Equity and liabilitiesEquity attributable to equity holders 3 2.8 0.3 4.2 2.2 1,8 0.6 0.7 1.5 2.2 16.3
Minority interest 0.0 0.0 0.1 0.0 0.0 0.0 0.0 0.0 0.0 0.1
Interest-bearing liabilities 0.6 0.9 0.1 0.3 0.3 1.5 0.0 –7.7 1.9 7.4 5.3
Non-interest-bearing liabilities 9.6 5.2 2.6 3.8 4.2 1.4 1.6 1.3 11.7 41.4
Total 13.0 6.4 7.0 6.3 6.3 3.5 2.3 –4.9 1.9 21.3 63.1
1 Including elimination of intra-Group receivables and liabilities.2 Aside from hedge loans in EUR and GBP, Skanska hedged equity in foreign currencies via forward contracts equivalent to liabilities of SEK 2.8 billion (6.0) in EUR, CLP och BRL (USD, EUR, CLP and BRL).3 After elimination of shares in subsidiaries.
Other mattersFor information on the translation reserve in equity on January 1 and December 31, which is recognized directly in equity, see Note 27, “Equity.”
Group, amounts in SEK billion 2005 2004
Equities and liabilitiesEquity attributable to equity holders 1.1 0.3
Minority interest 0.0 0.0
Interest-bearing liabilities 0.4 –0.4
Non-interest-bearing liabilities 3.5 –0.6
Total 5.0 –0.7
Effect of exchange rate differences on
the Group’s interest-bearing net receivable 0.1 0.3
Of the total effect on the Group’s assets, SEK +2.7 billion was due to USD; SEK
+0.6 billion to CZK; SEK +0.5 billion to NOK; SEK +0.5 billion to GBP; SEK +0.3 bil-
lion to EUR; and SEK +0.3 billion to PLN. Of the total effect in 2004, SEK –1.3 bil-
lion was due to USD; SEK +0.3 billion to PLN; and SEK +0.3 billion to CZK.

112 Notes, including accounting and valuat ion pr inc iples Skanska Annual Report 2005
No
tes,
incl
ud
ing
acc
ou
nti
ng
an
d v
alu
atio
n p
rin
cip
les
Note 36 Cash flow statement
Aside from the cash flow statement prepared in compliance with IAS 7, “Cash
Flow Statements,” Skanska is preparing a cash flow statement prepared on the
basis of the operations carried out by the respective business streams. This cash
flow statement is called the “Consolidated operating cash flow statement.” The
connection between the respective cash flow statements is explained below.
Adjustments for items not included in cash flow 2005 2004
Depreciation/amortization and impairment losses/
reversals of impairment losses 1,259 1,610
Income from divestments of property,
plant and equipment and current-asset properties –2,834 –2,437
Income from divestments of discontinued operations –184 –1,587
Income after financial items from joint ventures
and associated companies –221 –168
Dividends from joint ventures and associated companies 42 68
Intra-Group profits on contracting work 154 60
Other items that have not affected
cash flow from operating activities 97 76
Total –1,687 –2,378
Taxes paidTaxes paid are divided into operating activities, investing activities and financing
activities.
Total taxes paid for the Group amounted to SEK -1,440 M (-1,030), of which SEK
600 M was related to the effect of tax allocation reserves withdrawn in 2004.
Information on interest and dividends 2005 2004
Interest income during the year 388 239
Interest payments during the year –387 –393
Dividends received during the year 45 68
Liquid assetsLiquid assets in the cash flow statement consist of cash and cash equiavalents as
well as short-term investments. The definition of cash and cash equivalents in the
balance sheet can be seen in Note 1, “Accounting and valuation principles.”
The same rule that has been used in determining liquid assets in the balance
sheet has been used in determining liquid assets according to the cash flow state-
ment. Only amounts that can be used without restrictions are recognized as cash
and cash equivalents.
2005 2004
Cash and cash equivalents 10,583 5,815
Short-term investments 3,095 3,053
Total 13,678 8,868
Information about assets and liabilities in acquired Group companies
2005 2004
AssetsProperty, plant and equipment 21 13
Intangible assets 31 113
Shares and participations –1
Current-asset properties 6
Non-interest-bearing receivables 45 104
Interest-bearing receivables 4
Liquid assets 6 8
Total 103 247
Liabilities Minority interest –3 –17
Interest-bearing liabilities 29 10
Non-interest-bearing liabilities 21 111
Total 47 104
Purchase price paid –56 –143
Liquid assets in acquired companies 6 8
Effect on consolidated liquid assets, investment –50 –135
Acquired Group companies are described in Note 7, “Business combinations.”
Information about assets and liabilities in divested Group companies 2005 2004
Assets Property, plant and equipment –560 –395
Intangible assets 0 –282
Shares and participations 0 –20
Current-asset properties –1 –138
Interest-bearing receivables –4 –199
Non-interest-bearing receivables –469 –1,740
Liquid assets –60 –62
Total –1,094 –2,836
Equity and liabilitiesIncome from divestments of Group companies 1 199 1,478
Accumulated exchange rate differences in
divested companies 0 –18
Minority interest 0 –53
Interest-bearing liabilities –254 –312
Non-interest-bearing liabilities –442 –1,791
Total –497 –696
Purchase price paid 597 2,140
Liquid assets in divested companies –60 –62
Effect on liquid assets, divestment 537 2,078
1 Income from divested Group companies is recognized both as “Income from divestments of discontinued operations ”and as “Cost of sales” in continuing operations. The allocation is shown in the following table.
2005 2004
Income from divestments of discontinued operations 184 1,587
Less Gammon (divestment related to joint venture) –134
Income from divestments of Group companies
recognized in continuing operations 2 15 25
199 1,478
2 The income originated from the divestment of some small Group companies in Poland, Russia and the International business unit. In 2004, the income stemmed from divestments in Poland.
For divested operations, see Note 5.
Other mattersThe Group’s unutilized credit facilities amounted to SEK 6, 071 M (5,610) at
year-end.
Relation between consolidated operating cash flow and consolidated cash flow statementThe difference between the consolidated operating cash flow statement and the
consolidated cash flow statement in compliance with IAS 7, “Cash flow
statement,” is presented below.
The consolidated cash flow statement that was prepared in compliance with
IAS 7 recognizes cash flow divided into:
Cash flow from operating activities
Cash flow from investing activities
Cash flow from financing activities
The consolidated operating cash flow statement recognizes cash flow divided into:
Cash flow from business operations
Cash flow from financing activities
Cash flow from strategic investments
Dividend etc.
Change in interest-bearing receivables and liabilities
The consolidated operating cash flow statement refers to operating activities as
“business operations.” Unlike the cash flow statement in compliance with IAS 7,
“business operations” also includes net investments, which are regarded as an
element of business operations together with tax payments on these. Such net
investments are net investments in property, plant and equipment and intangible
non-current assets as well as net investments in Infrastructure Development.

Skanska Annual Report 2005 Notes, including accounting and valuat ion pr inc iples 113
No
tes,
incl
ud
ing
acc
ou
nti
ng
an
d v
alu
atio
n p
rin
cip
les
Investments of a strategic nature are recognized under cash flow from strategic
investments.
Under cash flow from financing activities, the operating cash flow statement
recognizes only interest and other financial items as well as taxes paid on the
same. Dividends are recognized separately. Loans provided and repayment of
loans are also recognized separately together with changes in interest-bearing
receivables at the bottom of the operating cash flow statement, resulting in a sub-
total in the statement that shows cash flow before changes in interest-bearing
receivables and liabilities.
2005 2004
Cash flow from business operations according
to operating cash flow statement 5,354 5,786
less net investments in property, plant and
equipment and intangible non-current assets 1,327 708
less tax payments on property, plant and equipment
and intangible non-current assets divested 26 25
Cash flow from operating activities 6,707 6,519
Cash flow from strategic investment according
to operating cash flow statement 527 2,392
Net investment in property, plant and equipment
and intangible non-current assets –1,327 –708
Increase and decrease in interest-bearing receivables 503 –453
Taxes paid on property, plant and equipment
and intangible non-current assets divested –26 –25
Cash flow from investing activities –323 1,206
Cash flow from financing activities according
to operating cash flow statement –84 –24
Increase and decrease in interest-bearing liabilities –987 –4,492
Dividend etc. –1,675 –1,288
Cash flow from financing activities –2,746 –5,804
Cash flow for the year 3,638 1,921
Relation between the Group’s investments in the cash flow statement and investments in the operating cash flow statementTotal net investments are recognized in the cash flow statement divided into oper-
ating activities and investing activities, taking into account the settlement of pay-
ments for investments and divestments. Purchases and divestments of current-
asset properties are recognized under operating activities, while other net invest-
ments are recognized under investing activities.
2005 2004
Net investments in business operations 4,387 4,003
Net investments in investing activities –799 1,713
3,588 5,716less adjustment for payment dates,
cash flow effect of investment 57 53
Total net investments 3,645 5,769
The consolidated operating cash flow statement recognizes net investments divided
into net investments in operating activities and strategic net investments as follows.
2005 2004
Investments in operating activitiesAcquisitions of intangible assets –46 –38
Acquisitions of property, plant and equipment –1,455 –1,131
Acquisitions of assets in Infrastructure Development –476 –188
Acquisitions of shares –3 –6
Acquisitions of current-asset properties –4,956 –5,266
–6,936 –6,629Divestments in operating activitiesDivestments of intangible assets 4 2
Divestments of property, plant and equipment 613 635
Divestments of assets in Infrastructure Development 35 7
Divestments of shares 1 12
Divestments of current-asset properties 9,400 9,321
10,053 9,977
Net investments in operating activities 3,117 3,348
Strategic investmentsAcquisitions of Group companies –50 –135
Acquisitions of shares 0 –1
–50 –136
Strategic divestmentsDivestments of businesses 537 2,078
Divestments of shares 41 479
578 2,557Net strategic investments 528 2,421TOTAL INVESTMENTS 3,645 5,769
Note 36 continued

114 Notes, including accounting and valuat ion pr inc iples Skanska Annual Report 2005
No
tes,
incl
ud
ing
acc
ou
nti
ng
an
d v
alu
atio
n p
rin
cip
les
Not 37 Personnel
Wages, salaries, other remuneration and social insurance contributions Continuing Discontinued operations operations Total 2005 2004 2005 2004 2005 2004
Wages, salaries and other remuneration
Board members, Presidents and Executive Vice Presidents 1 339 280 1 6 340 286
(of which bonuses) 114 101 1 0 115 101
Other employees 15,850 15,155 16 227 15,866 15,382
Total wages, salaries and other remuneration 16,189 15,435 17 233 16,206 15,668
Social insurance contributions 4,063 4,294 9 79 4,072 4,373
of which pension expenses 1,106 1,042 4 21 1,110 1,063
1 The amount related to Board members, Presidents and Executive Vice Presidents included compensation to former Board members, Presidents and Executive Vice Presidents during the financial year.
Of the Group’s total pension expenses, SEK 46.4 M (52.3) was related to the category “Board members, Presidents and Executive Vice Presidents.” The amount included
compensation to former Board members, President and Executive Vice Presidents.
The expense for a provision to the employee profit-sharing foundation in Sweden totaled SEK 103 M (40).
Average number of employeesPersonnel is calculated as the average number of employees. See ”Accounting and valuation principles,” Note 1.
2005 of whom men of whom women 2004 of whom men of whom women
Continuing operationsSweden 10,663 9,758 905 11,178 10,235 943
Norway 4,346 4,034 312 4,310 3,970 340
Denmark 1,427 1,284 143 1,445 1,310 135
Finland 3,400 3,074 326 3,460 3,127 333
United Kingdom 3,399 2,959 440 3,452 3,000 452
Poland 4,006 3,350 656 3,809 3,148 661
Czech Republic 7,053 5,943 1,110 6,686 5,633 1,053
United States 8,102 7,070 1,032 9,226 8,158 1,068
Argentina 4,312 4,024 288 3,060 3,000 60
Other countries 6,947 6,478 469 6,448 5,928 520
Subtotal, continuing operations 53,655 47,974 5,681 53,074 47,509 5,565
Discontinued operationsSweden 43 37 6 475 418 57
Other countries 108 74 34 254 196 58
Subtotal, discontinued operations 151 111 40 729 614 115Total 53,806 48,085 5,721 53,803 48,123 5,680
Men and women on Boards of Directors and among senior executives at balance sheet date 2005 of whom men of whom women 2004 of whom men of whom women
Number of Board members 285 96% 4% 283 95% 5%
Number of Presidents and members ofmanagement teams in business units 182 95% 5% 192 95% 5%
Absence from work due to illnessFigures on absence from work due to illness (sick leave) apply only to operations
in Sweden.
Swedish operations 2005 2004
Total absence from work due to illness as a percentage
of regular working time 4.5% 4.9%
Percentage of total absence from work due to illness
for a continuous period of 60 days or more 58.0% 62.4%
Absence from work due to illness as a percentage of each category’s regular
working time:
Men 4.6% 5.0%
Women 3.7% 3.4%
Absence due to illness by age category:
Age 29 or younger 3.5% 3.6%
Age 30-49 3.4% 3.6%
Age 50 or older 6.3% 7.0%
Other mattersNo loans, assets pledged or contingent liabilities have been provided on behalf of
any Board member or President in the Group.
Note 38 Compensation to executive officers
A Preparation and decision-making processes
The salary and other benefits of the President and CEO are fixed by the Board of Skanska
AB, based on recommendations from the Board’s Compensation Committee. The Com-
mittee sets limits on the salaries, bonuses and other benefits of Executive Vice Presi-
dents, heads of Group staff units and heads of business units.
During 2005, from the statutory Board meeting in May and onward, the Compensa-
tion Committee consisted of Sverker Martin-Löf, Chairman of the Board, and Arne
Mårtensson, Board member. The Compensation Committee met four times during the
year.
The Annual Shareholders’ Meeting approves the total amount of directors’ fees for
members of the Board, based on a recommendation from the Nomination Committee.
B1 Principles for remuneration to the Senior Executive Team
The Senior Executive Team includes the President and Executive Vice Presidents of
Skanska AB plus the Senior Vice President Human Resources. The Team consisted of
seven persons during 2005.
The Board will submit to the 2006 Annual Shareholders’ Meeting a proposal for princi-
ples for remuneration and other terms of employment for the Senior Executive Team,
for the approval of the Annual Meeting. The proposal mainly implies that remuneration
shall consist of a fixed salary, a flexible salary, customary benefits plus pension benefits.
Total remuneration shall be competitive in the market where the employee is working.

Skanska Annual Report 2005 Notes, including accounting and valuat ion pr inc iples 115
No
tes,
incl
ud
ing
acc
ou
nti
ng
an
d v
alu
atio
n p
rin
cip
les
C Benefits to the Board and Senior Executive Team
Remuneration and other benefits recognized as expenses in 2005 Allocated value of Director’s Flexible Share fee/basic salary Award Other PensionSEK thousand salary element1 Plan2 benefits expense Total
Chairman of the Board
Sverker Martin-Löf 1,275 1,275
President and CEO
Stuart Graham 8,442 3,033 1,825 2,017 6,244 21,560
Other members of the
Senior Executive Team 22,612 11,666 4,463 1,101 10,351 50,193
Total 32,329 14,699 6,288 3,118 16,594 73,028
1 Flexible salary element including the incentive program related to the 2005 financial year will be finally fixed in April 2006. The amounts included under the heading ”Flex-ible salary element” in the above table refer to the 2005 financial year. A flex element of SEK 9,721,000, of which SEK 717,000 to the President and CEO, was paid during 2005 for the 2004 financial year.
2 The value stated refers to a full allotment for 2005. In order for it to be paid, an addi-tional three years of service are required. The fraction of allocated value recognized as an expense during 2005 was 3/16.
C1 Directors’ fees
The 2005 Annual Shareholders’ Meeting decided that fees would be paid to those mem-
bers of the Board of Directors who are not employed by the Company, totaling
SEK 3,500,000 plus a special appropriation of SEK 625,000 for committee work. The
Annual Meeting decided that the fee to the Chairman of the Board shall amount to
SEK 1,050,000. As authorized by the Annual Meeting, the Board decided that the mem-
bers elected by the Annual Meeting shall receive SEK 350,000 each and that the special
appropriation for committee work shall be paid in the amount of SEK 225,000 to the
Chairman of the Board, and to each other committee member elected by the Annual
Meeting SEK 100,000 for serving as a member of the Project Review Committee,
SEK 75,000 for serving as a member of the Audit Committee and SEK 50,000 for serving
as a member of the Compensation Committee.
C2 Chairman of the Board
During 2005 the Chairman of the Board, Sverker Martin-Löf, received a director’s fee of
SEK 1,050,000 and SEK 225,000 related to committee work, totaling SEK 1,275,000.
C3 Members of the Board
Other members of the Board did not receive any remuneration beyond their regular
directors’ fees.
C4 Stuart Graham, President and CEO
During 2005, Stuart Graham received a salary, fees and other remuneration from Group
companies in the amount of SEK 8,442,000 plus a flexible salary element of
SEK 3,033,000 based on financial targets achieved, equivalent to target fulfillment of
40 percent. The flexible salary element may amount to a maximum of 50 percent of his
fixed annual salary. In addition, Mr. Graham is included in the Group’s 2005 share incen-
tive program, with a preliminary allocation of Skanska shares amounting to about 24
percent of his fixed salary, where 30 percent is the maximum possible allocation. The
flexible salary element plus the outcome of the share incentive program for the 2005
financial year will be finally fixed in April 2006.
Mr. Graham is entitled to a free residence in Sweden. During 2005, the Company com-
pensated him for his residence in the amount of SEK 1,314,000. Mr. Graham resides in
Stockholm.
Mr. Graham has had so-called expert tax status, which ceased in September 2005.
Because of this, during 2005 an agreement was reached on special compensation
amounting to a total of no more than SEK 10,400,000, with disbursement allocated over
a three-year period. Neither flexible salary elements nor pension are affected by this.
During 2005, Mr. Graham’s entitlement to a pension was changed from age 61 at the ear-
liest to age 62 at the earliest.
As previously, full pension will be received at age 65; however, this pension shall total a
fixed amount of USD 500,000, instead of about 50 percent of fixed salary as previously,
including his share of Skanska USA’s general pension plan.
His pension entitlement is indexed to an American inflation index, but with annual
index increase limited to a maximum of 3 percent. This is a defined-benefit pension, and
the expense during the year amounted to SEK 6,244,000. The pension entitlement is
earned on a straight-line basis during his employment period.
In addition, outstanding performance shall be reflected in total remuneration.
The following shall mainly apply to each respective portion of remuneration:
• Fixed and flexible salary shall be related to the responsibilities and influence of the
employee.
• In addition, the flexible salary shall be related to results that are connected to the pub-
lic results of the Company and shall link performance with the interests of the share-
holders. Furthermore, the flexible salary shall have a ceiling.
• As far as notice periods and severance payments are concerned, the normal notice
period shall amount to a maximum of 6 months. Severance payment shall amount to
a maximum of 24 months, with the exception of the President, to whom a maximum
of 30 months may be paid.
• Concerning pensions, the earliest retirement age shall be age 65. In exceptional cases,
however, a minimum retirement age of age 60 may be accepted. Pensionable salary
shall normally consist of the fixed salary, insofar as membership in general pension
plans does not entail a different pensionable salary according to the regulations of the
plan, for example the ITP occupational pension plan.
B2 Targets and performance related to flexible salary elements
Flexible salary elements may consist of two parts: an annual flexible salary that is cash-
based and the Share Award Plan, which provides remuneration in the form of shares.
For an account of the Share Award Plan, see section E of this note. The “Outperform”
targets stated below are common to both parts of the flexible salary, while the “starting
point” is only relevant for the annual flexible salary. The table below presents, by busi-
ness stream, what starting point and “Outperform” target was decided for 2005. “Out-
perform” also refers to the level that must be achieved for this.
B2 Targets for flexible salary elements, by business stream
Ful- Starting ”Out- Out- fillment Earnings yardstick point perform” come level
Construction Operating margin 2.0% 3.1% 2.5% 45%
Residential Project
Development Operating margin 6.1% 9.4% 10.0% 100%Commercial Project
Development SVA1 SEK M –152 125 341 100%
Infrastructure
Development ROIC 2 30% 40% 56% 100%
Group target Operating income 3,
SEK M 3,574 4,500 5,121 100%
1 SVA means Skanska Value Added and, put simply, refers to operating income minus a capital cost for capital employed. Operating income includes financial income. This yardstick is often called ”Economic Value Added.”
2 ROIC refers to return on invested capital in projects where return is adjusted for changes in market value based on external appraisals.
3 Outcome is calculated excluding exchange rate effects. The figures shown in the table are calculated using outcome in local currency translating at exchange rates on September 30, 2004. Both target and outcome are reported before corporate overhead.
In addition to the above mentioned financial performance factors, each person in the
Senior Executive Team has non-financial targets that may reduce final outcome. These
non-financial targets concern health and safety, the environment, business ethics, man-
agement of loss-making projects and management development. A reduction occurs if,
depending on the target, the person has not shown clear improvements or if something
has occurred (for example an environmental incident, where the target is not to have
any).
For the President and CEO, the target has been the operating income of the Group.
The President and CEO has also had non-financial targets. The 50 percent maximum
flexible salary, excluding the Share Award Plan, of the President and CEO was earned in
full, based on the financial target, but was reduced by 10 percentage points because
two non-financial targets were not met. The outcome for the President and CEO was
thus 40 percent of fixed salary.
For the other members of the Senior Executive Team, annual flexible salary is either
100 percent tied to the Group target or 20 percent of annual flexible salary to the Group
target while 80 percent is tied to the business units they are directly responsible for. The
non-financial targets are connected to the business units certain individuals in the Senior
Executive Team are responsible for.
The outcome for the other members of the Senior Executive Team averaged 88 percent
fulfillment of financial targets and 78 percent after subtracting for non-financial targets.
Note 38 continued

116 Notes, including accounting and valuat ion pr inc iples Skanska Annual Report 2005
No
tes,
incl
ud
ing
acc
ou
nti
ng
an
d v
alu
atio
n p
rin
cip
les
and will be disbursed during the remainder of his life. The pension is conditional upon
future employment.
In addition, Mr. Graham will receive a nonrecurring amount of USD 180,000 at age 65.
This amount was vested earlier in the United States and was reported as an expense dur-
ing prior years.
In 2001 Mr. Graham was allotted 80,000 employee stock options.
In case of termination by the Company, or in case of termination of his own volition due to
material breach of contract by the Company, Mr. Graham is entitled to his salary and other
employment benefits during a six month notice period, then 30 months of severance pay-
ments equivalent to his fixed salary on the date of termination.
D Other members of the Senior Executive Team
During 2005, the other members of the Senior Executive Team totaled six persons (2004:
five persons). Members of the Senior Executive Team received a fixed salary and a flexi-
ble salary element based on the Group’s earnings. In addition, executive officers of
Skanska were covered by the Group’s 2005 share incentive program, with a preliminary
allocation of Skanska shares amounting to about 24 percent of their fixed salary. In
2001, the Senior Executive Team was allocated employee stock options under the 2001 –
2006 program, totaling 360,000 in number. The flexible salary element plus the outcome
of the temporary incentive program for the 2005 financial year will be finally fixed in
April 2006.
D1 Pension benefits
Members of the Senior Executive Team are normally entitled to pension benefits accord-
ing to defined-benefit pension systems. Defined-contribution pension packages occur in
a few cases and, in terms of cost, are mainly equivalent to the ITP occupational pension
plan. The retirement age for members of the Senior Executive Team is 60–65 years. The
ITP plan is a defined-contribution plan and guarantees a lifetime pension from age 65.
The pension amount is a certain percentage of final salary and the service period to
qualify for a full pension is 30 years. The pension entitlement is 10 percent for portions
of salary up to SEK 324,750 per year, 65 percent for portions of salary between SEK
324,750 and SEK 866,000 and 32.5 percent for portions of salary up to SEK 1,299,000.
In addition, this group is covered by a supplementary pension entitlement for portions
of salary exceeding 30 base amounts (as defined by Swedish social insurance rules). This
is a defined-contribution pension entitlement and the premium is 20 percent of pension-
able salary exceeding 30 base amounts.
D2 Notice periods etc.
In case of termination by the Company, notice periods range from six months to twelve
months. Salary and other remuneration are disbursed without reduction during the
notice period. After the notice period, severance pay is disbursed for 12–18 months.
When payments are disbursed after the notice period, other income must be subtracted
from the amount payable.
E Skanska Share Award Plan
Skanska’s 2005 Annual Meeting decided to introduce a share incentive program (the
Skanska Share Award Plan, or “the Plan”) for executive officers and other key employees
of the Skanska Group. The Plan comprises up to 300 employees in the Group, including
the President and CEO, the Chief Financial Officer, the Executive Vice Presidents, other
members of the Senior Executive Team and staff units, the Presidents of business units
and their management teams. The purpose of the Plan is to create shareholder value
and provide incentives in order to retain and recruit qualified employees to the Skanska
Group. The Plan is also expected to increase employees’ interest in Skanska’s business
and development and to give present and future employees the opportunity to become
shareholders in Skanska. In light of this, the Plan is deemed to have a positive effect on
the Skanska Group’s future development and thus to be advantageous both to the
shareholders and the Company.
The Plan means that employees have been offered the opportunity to be granted
“share awards” entitling the holder to receive Series B shares in the Company free of
charge, provided that certain targets are met. The maximum yearly allocation for each
participant is equivalent to 30 percent of the value of the participant’s annual base salary
in Series B shares, based on their average market price during the two-week period start-
ing one week after the publication of the Year-end Report. Each participant’s allocation
of share awards is dependent upon the fulfillment of a number of established earnings-
and performance-related conditions, which are based on the “Outperform” targets
approved by the Board of Directors. The Outperform targets consist of (i) financial tar-
gets at the Group level as well as at the business unit level and (ii) non-financial targets
attributable to the respective business unit, including improvements in health and safety,
environment, business ethics, handling of loss-making projects and management devel-
opment. In order to receive the shares, three years of employment are required after the
end of the measurement period.
The Outperform targets for 2005 were adopted by Skanska’s Board of Directors in
2004 and are shown in section B2 of this note. The published Outperform targets for
2007 are intended to correspond to the Outperform targets for the Plan. For the Plan,
the Outperform targets for 2005 and 2006 represent a gradual raising of targets toward
those for 2007. Based on the achievement of these targets, the number of share awards
to be allocated will be determined after the close of each financial year. If the financial
Outperform targets are achieved, the allocation of share awards may still be reduced by
up to a half, to the extent that the non-financial targets are not met.
The Group’s financial Outperform targets are the sum of the financial Outperform tar-
gets for each business unit. In order for an employee in a business unit to receive an allo-
cation, the requirement is for the business unit to achieve its financial Outperform tar-
gets. For an employee at Group level to receive an allocation, the requirement is that the
Group achieves 90 percent of the level of the Group’s financial Outperform target. The
Outperform targets are set high for each business unit, and the sum of these targets is
very difficult to achieve. The 10 percent reduction in the targets at Group level reflects
this.
Furthermore, there are two other conditions which must be met in order for any allo-
cation to be made under the Plan. These are both closely tied to Skanska’s consolidated
earnings: (i) that Skanska’s regular dividend does not decrease in the allocation year
compared to the previous financial year and (ii) that consolidated operating income
must exceed certain thresholds that have been approved by the Board of Directors. The
threshold for 2005 was equivalent to the starting point for the Group target, or
SEK 3,574 M.
The outcome of the Plan for 2005 is preliminarily estimated to be that 166 individuals
have received share awards with a total value of about SEK 52,500,000. In addition, the
Company will be charged the related social insurance expenses. The average allocation,
in relation to their fixed salary, to the group of employees encompassed by the Plan is
preliminarily 16 percent.
The principles for recognition of the costs of the Plan are presented in “Accounting and
valuation principles,” Note 1, and comply with IFRS 2, “Share-Based Payment.”
F1 Employee stock options, 2001 – 2006
In 2001, the Board of Skanska AB decided to allot a total of 2,040,000 options to 21 indi-
viduals in Skanska’s Group Management. In February 2002, the Board of Skanska AB
approved an additional allocation of options. After the above decisions, and after adjust-
ments due to employee attrition, the 2001 – 2006 employee stock option program cov-
ers 24 individuals, and the number of options totals 1,844,000.
The exercise price amounts to SEK 128, equivalent to 125 percent of the average closing
price paid for a Skanska Series B share during the period June 14 – 20, 2001. The options
may be exercised during the period March 3, 2004 – March 31, 2006. As of December 31,
2005, the options were valued at SEK 0.
F2 Terms of employee stock options
For the above-mentioned employee stock option program, the following are among the
conditions that apply. The option program encompasses synthetic options and settle-
ment will take place in cash. The options were provided free of charge and may only be
exercised on the condition that the holder is still employed by Skanska on the exercise
date or has retired with a pension. The holder may not transfer the right to exercise the
options. Skanska has hedged the obligations that the Company may incur as a conse-
quence of a market price upturn. Since the market price of a Skanska share on December
31, 2005 stood substantially below the exercise price, no provision was reported in the
balance sheet, and no personnel expense in the income statement either.
The principles for reporting of employee stock options in the financial statements can
be found under “Accounting and valuation principles.”
G Local incentive programs
Salaries and other remuneration are adopted with reference to prevailing conditions in
the rest of the construction industry and customary practices in each local market. The
Skanska Group applies a remuneration model for the affected executives and managers
that consists of a fixed annual salary plus a flexible salary element which is based on
financial targets achieved.
Note 38 continued

Skanska Annual Report 2005 Notes, including accounting and valuat ion pr inc iples 117
No
tes,
incl
ud
ing
acc
ou
nti
ng
an
d v
alu
atio
n p
rin
cip
les
Note 39 Fees and other remuneration to auditors
2005 2004
KPMG,
Audit assignments 50 47
Other audit-related assignments 7 8
Tax advisory services 8 8
Other auditors
Audit assignments 1
Other assignments
Total 65 64
“Audit assignments refer to examination of the annual accounts as well as the
administration by the Board of Directors and the President, as well as other tasks
that are incumbent upon the Company’s auditors to perform. “Other audit-related
assignments” refer to advisory services related to accounting issues and advisory
services concerning the divestment and acquisition of businesses.
Note 40 Related party disclosures
Through its ownership and percentage of voting power, AB Industrivärden has a
significant influence, as defined in compliance with IAS 24, “Related Party Disclo-
sures.” All transactions have occurred on market terms.
Skanska sells administrative services to pension funds that manage assets
intended to cover the Group’s pension obligations.
Associated companies and joint ventures are companies related to Skanska.
Information on transactions with these is presented in the following tables.
Information on personnel expenses is found in Note 37, “Personnel,” and Note
38, “Compensation to executive officers.”
Transactions with joint ventures 2005 2004
Sales to joint ventures 5,204 3,469
Purchases to joint ventures –95 –74
Interest income from joint ventures 4 28
Interest expenses to joint ventures 0 0
Dividends from joint ventures 42 68
Receivable from joint ventures 183 544
Liabilities to joint ventures 20 16
Contingent liabilities for joint ventures 1,495 889
Transactions with associated companies 2005 2004
Sales to associated companies 34 22
Purchases from associated companies 0 –4
Interest income from associated companies 0 0
Interest expenses to associated companies 0 0
Dividends from associated companies 0 0
Receivable from associated companies 5 0
Liabilities from associated companies 0 15
Contingent liabilities for associated companies 0 0
Note 41 Leases
Skanska is a lessee in both finance and operating leases.
When Skanska is a lessee, finance lease assets are recognized with a book value
as a non-current asset in the balance sheet, while the future obligation to the les-
sor is recognized as a liability in the balance sheet.
As a finance lessor, Skanska recognizes the present value of its claim on the les-
see as a financial receivable.
As an operating lessor, Skanska leases properties to tenants via its Commercial
Project Development operations.
A. Skanska as a lesseeFinance leasesLeased property, plant and equipment including buildings and land as well as
machinery and equipment are recognized in the consolidated financial statements
as finance leases.
Of the amount in the balance sheet for finance leases, most is related to a prop-
erty in Norway used for Skanska’s business and an office building in the Czech
Republic.
Finance leases, book value 2005 2004
Property, plant and equipmentBuildings and land 42 45
Machinery and equipment 25 37
Total 67 82
Cost 113 120
Depreciation for the year –7 –5
Accumulated depreciation, January 1 –39 –33
Book value 67 82
Variable fees for finance leases included in 2005 income amounted to SEK –10 M
(–13). No property leased to Skanska has been subleased to others.
Future minimum lease payments and their present value can be seen in the fol-
lowing table. Present value, of Future minimum future minimum lease payments lease payments Expenses, due dates 2005 2004 2005 2004
Within one year –23 –28 –17 –23
Later than one year but within five years –50 –55 –32 –38
Later than five years –67 –60 –48 –46
–140 –143 –97 –107
Reconciliation, future minimum lease payments and their present value 2005 2004
Future minimum lease payments –140 –143
Less interest charges 43 36
Present value of future minimum lease payments –97 –107
Operating leasesMost of the amounts for future minimum lease payments are related to office
space for operations in the United Kingdom and site leasehold fees in Sweden.
The Group’s leasing expenses related to operating leases in 2005 amounted to
SEK –265 M (–244), of which SEK –259 M (244) was related to minimum lease
Mpayments and SEK –6 M (0) was related to variable payments. The Group had
SEK 5 M (0) in leasing income related to subleasing on operating leases.
The due dates of future minimum lease payments for noncancellable operating
leases were distributed as follows:
Expenses, due dates 2005 2004
Within one year –237 –182
Later than one year but within five years –709 –579
Later than five years –601 –686
Total –1,547 –1,447
Of this amount, SEK 29 M (0) was related to properties that were subleased.

118 Notes, including accounting and valuat ion pr inc iples Skanska Annual Report 2005
No
tes,
incl
ud
ing
acc
ou
nti
ng
an
d v
alu
atio
n p
rin
cip
les
B. Skanska as a lessorFinance leasesSkanska owns a property in Sweden that is leased to a customer under a finance
lease. The present value of the claim related to future minimum lease payments is
recognized in the balance sheet as a financial non-current asset. At the balance
sheet date, it amounted to:
2005 2004
Gross investment in finance leases 16 18
- Unearned financial income –2 –3
Net investment in finance leases 14 15- Non-guaranteed residual value
belonging to the lessor –1 –1
Present value of claim related to future lease payments 13 14
The due dates of the gross investment and the present value of future minimum
lease payments were distributed as follows: Present value of claims related Gross investment in to future minimum finance leases lease payments Income, due dates 2005 2004 2005 2004
Within one year 3 3 2 2
Later than one year but within five years 13 10 10 8
Later than five years 0 5 0 4
16 18 12 14
Reserves for doubtful receivables related to minimum lease payments amounted
to SEK 0 M (0).
The variable portion of lease payments included in 2005 income amounted to SEK
0 M (0).
Operating leasesCommercial Project Development carries out Skanska’s operating lease business.
These properties are recognized as current assets in the balance sheet. For a
description of the Commercial Project Development business stream, see Note 4,
“Segment reporting.”
In 2005, the Group’s variable lease income related to operating leases amount-
ed to SEK 0 (0).
The due dates of future minimum lease payments for non-cancellable operating
leases were distributed as follows:
Income, due dates 2005 2004
Within one year 373 769
Later than one year but within five years 881 1,724
Later than five years 349 557
Total 1,603 3,050
The book value of current-asset properties in Commercial Project Development
totaled SEK 5,804 M (7,408).
Note 42 Events after the balance sheet date
The financial reports were signed on February 15, 2006 and will be submitted for
adoption by the Annual Shareholders’ Meeting of Skanska AB on March 30, 2006.
In order to ensure delivery of Series B shares to employees in accordance with
Skanska’s long-term Share Award Plan, with the authorization of the 2005 Annual
Shareholders’ Meeting, the capital stock of the Company was increased by
13,500,000 by means of an issue of 4,500,000 news Series D shares at a subscrip-
tion price equivalent to their par value, SEK 3 per share. The shares were sub-
scribed by Nordinvest AB, one of the wholly owned subsidiaries of AB Indus-
trivärden (publ), early in January 2006. Skanska also presented a repurchase offer
to Nordinvest AB covering all 4,500,000 Series D shares. Nordinvest AB accepted
the repurchase offer. The repurchase was carried out late in January 2006 at a
price of SEK 3.002 per share, totaling SEK13,509,000. The purpose of the repur-
chase is to convert Series D shares to Series B shares for delivery in accordance
with the Share Award Plan and to cover related social insurance contributions that
may arise because of the Plan.
Note 41 contunued

Skanska Annual Report 2005 Notes, including accounting and valuat ion pr inc iples 119
No
tes,
incl
ud
ing
acc
ou
nti
ng
an
d v
alu
atio
n p
rin
cip
les
Note 43 Consolidated quarterly results
2005 20041 Q4 Q3 Q2 Q1 Q4 Q3 Q2 Q1
Order bookings 28,894 36,879 27,541 23,783 29,713 27,265 33,549 31,376IncomeRevenue 36,068 32,199 30,916 25,484 30,616 32,389 32,225 26,033
Cost of sales –32,939 –29,494 –28,045 –22,924 –29,314 –29,507 –29,078 –23,807
Gross income 3,129 2,705 2,871 2,560 1,302 2,882 3,147 2,226
Selling and administrative expenses –1,843 –1,566 –1,737 –1,540 –1,592 –1,694 –1,953 –1,712
Income from divestments of
discontinued operations 4 0 180 0 381 1,206 0 0
Income from joint ventures and associated companies 165 –2 51 23 119 1 20 28
Operating income 1,455 1,137 1,365 1,043 210 2,395 1,214 542Interest income 72 98 57 81 91 100 21 72
Interest expenses –33 –39 –11 –54 –95 –74 –58 –105
Change in market value 0 12 –24 31 – – – –
Other financial items –69 11 –10 –2 47 –27 –1 –5
Net financial items –30 82 12 56 43 –1 –38 –38Income after financial items 1,425 1,219 1,377 1,099 253 2,394 1,176 504
Taxes –343 –244 –357 –286 –47 –555 –391 –148
Profit for the period 1,082 975 1,020 813 206 1,839 785 356
Profit for the period attributable to
Equity holders 1,080 970 1,018 810 204 1,836 777 356
Minority interest 2 5 2 3 2 3 8 0 Order backlog 128,743 131,525 126,467 119,191 113,740 120,695 129,718 126,742
Capital employed 24,451 22,809 22,928 22,663 21,560 23,826 23,027 23,763
Interest-bearing net receivable 11,111 7,693 6,413 6,826 7,229 4,412 183 176
Debt/equity ratio –0.6 –0.4 –0.4 –0.4 –0.4 –0.3 0.0 0.0
Return on capital employed, % 23.3 18.3 23.5 22.7 19.9 23.9 16.9 17.7
Cash flowCash flow from operating activities 4,793 976 1,014 –76 2,291 2,604 1,527 97
Cash flow from investing activities 115 –987 959 –410 1,321 151 –945 679
Cash flow from financing activities 0 –1,161 –1,414 –171 –1,864 –854 –1,375 –1,711
Cash flow for the period 4,908 –1,172 559 –657 1,748 1,901 –793 –935
Business streamsOrder bookingsConstruction 29,062 36,764 27,306 23,421 29,238 26,549 31,402 28,819
Residential Project Development – – – – – – – –
Commercial Project Development – – – – – – – –
Infrastructure Development – – – – – – – –
Central and eliminations –165 32 13 129 163 157 153 133
Discontinued operations –3 83 222 233 312 559 1,994 2,424
Total 28,894 36,879 27,541 23,783 29,713 27,265 33,549 31,376
RevenueConstruction 33,680 31,039 28,468 22,768 29,082 28,440 27,459 22,996
Residential Project Development 1,739 1,443 1,502 1,429 1,721 1,326 1,472 1,295
Commercial Project Development 1,108 417 1,699 1,851 800 2,238 1,922 624
Infrastructure Development 42 3 2 6 10 9 9 5
Central and eliminations –507 –841 –953 –789 –1,336 –410 –733 –672
Discontinued operations 6 138 198 219 339 786 2,096 1,785
Total 36,068 32,199 30,916 25,484 30,616 32,389 32,225 26,033
Operating incomeConstruction 1,155 964 434 318 63 716 460 273
Residential Project Development 160 172 142 137 171 127 113 117
Commercial Project Development 211 138 700 691 121 650 680 166
Infrastructure Development 67 –61 –6 –9 36 5 –7 –3
Central –89 –68 –99 –86 –83 –86 –105 –86
Eliminations –25 –25 –2 –21 25 10 –16 27
Discontinued operations
- operating income –28 17 16 13 –504 –233 89 48
- income from divestments 4 0 180 0 381 1,206 0 0
Total 1,455 1,137 1,365 1,043 210 2,395 1,214 5421 The accounts for 2004 are in compliance with IFRS. See “Accounting and valuation principles,” Note 1.

120 Notes, including accounting and valuat ion pr inc iples Skanska Annual Report 2005
No
tes,
incl
ud
ing
acc
ou
nti
ng
an
d v
alu
atio
n p
rin
cip
les
Note 44 Five-year Group financial summary
Income statements In compliance with IFRS In compliance with SWGAAP 2005 2004 2003 2002 2001
Revenue 124,667 121,263 132,879 142,033 165,063
Cost of sales –113,402 –111,706 –119,987 –130,452 –153,644
Gross income 11,265 9,557 12,892 11,581 11,419Selling and administrative expenses –6,686 –6,951 –8,453 –10,315 –9,244
Income from divestments of discontinued operations 184 1,587 14 – –
Income from joint ventures and associated companies 237 168 79 –285 136
Operating income 5,000 4,361 4,532 981 2,311Net financial items 120 –34 –460 –908 –1,195
Income after financial items 5,120 4,327 4,072 73 1,116
Taxes –1,230 –1,141 –1,303 –856 –1,094
Profit for the year 3,890 3,186 2,769 –783 22
Profit for the year attributable to
Equity holders 3,879 3,173 2,761 –837 22
Minority interest 11 13 8 54 0
Cash flowCash flow from operating activities 6,707 6,519 11,062 3,729 4,505
Cash flow from investing activities –323 1,206 –1,207 –3,011 –2,238
Cash flow from financing activities –2,746 –5,804 –7,967 –2,790 –372
Cash flow for the year 3,638 1,921 1,888 –2,072 1,895

Skanska Annual Report 2005 Notes, including accounting and valuat ion pr inc iples 121
No
tes,
incl
ud
ing
acc
ou
nti
ng
an
d v
alu
atio
n p
rin
cip
les
Balance sheet In compliance with IFRS In compliance with SWGAAP Dec 31 Jan 1 Dec 31 Jan 1 Dec 31 Dec 31 Dec 31 2005 2005 2004 2004 2003 2002 2001
ASSETSNon-current assetsProperties, plant and equipment 5,243 4,978 5,507 6,700 6,730 7,808 8,512
Goodwill 4,154 3,899 3,899 4,259 4,259 5,360 7,049
Intangible assets 644 535 535 542 459 481 765
Investments in joint ventures and associated companies 1,834 862 862 1,374 1,374 1,468 2,476
Financial non-current assets 1, 3 1,236 1,253 1,137 2,032 2,032 1,408 1,082
Deferred tax assets 2,282 1,620 1,633 1,459 1,539 1,621 1,412
Total non-current assets 15,393 13,147 13,573 16,366 16,393 18,146 21,296
Current assetsCurrent-asset properties 2 10,482 11,935 11,948 13,866 13,694 19,544 18,790
Inventories 501 483 610 828 828 865 1,001
Financial current assets 3 2,260 2,771 2,490 1,248 1,248 1,128 1,068
Tax receivables 330 269 269 415 415 310 474
Gross amount due from customers for contract work 5,610 3,653 3,579 4,768 4,814 4,896 7,404
Trade and other receivables 22,985 21,579 21,744 22,309 22,309 26,096 32,335
Short-term investments 3,095 3,053 3,053 218 218 303 582
Cash and cash equivalents 10,583 5,794 5,815 6,819 6,819 5,460 8,048
Assets classified as held for sale 72 869 – – – – –
Total current assets 55,918 50,406 49,508 50,471 50,345 58,602 69,702TOTAL ASSETS 71,311 63,553 63,081 66,837 66,738 76,748 90,998 of which interest-bearing 16,975 12,421 12,421 10,241 10,241 7,749 10,576
EQUITYEquity attributable to equity holders 18,454 16,240 16,251 14,501 14,169 14,217 17,871
Minority interest 133 117 117 200 200 298 517
Total equity 18,587 16,357 16,368 14,701 14,369 14,515 18,388
LIABILITIESNon-current liabilities
Financial non-current liabilities 3 2,424 3,300 3,046 5,714 7,182 13,845 17,729
Pensions 2,407 1,108 1,112 1,771 2,058 984 437
Deferred tax liabilities 2,831 2,708 2,744 3,164 3,104 2,317 2,027
Non-current provisions 143 135 135 174 175 16 223
Total non-current liabilities 7,805 7,251 7,037 10,823 12,519 17,162 20,416
Current liabilitiesFinancial current liabilities 3 1,080 1,197 1,006 2,277 808 2,607 0
Tax liabilities 595 994 998 571 571 447 1,445
Current provisions 3,200 2,735 2,740 3,050 3,055 3,062 2,658
Gross amount due to customers for contract work 11,782 10,471 10,428 9,311 9,311 10,174 11,845
Trade and other payables 28,220 24,224 24,504 26,104 26,105 28,781 36,246
Liabilities classified as held for sale 42 324 – – – – –
Total current liabilities 44,919 39,945 39,676 41,313 39,850 45,071 52,194TOTAL EQUITY AND LIABILITIES 71,311 63,553 63,081 66,837 66,738 76,748 90,998of which interest-bearing 5,864 5,192 5,192 9,804 10,091 17,125 17,952
1 of which shares 59 74 74 76 76 547 204 2 Current-asset properties Commercial Project Development 5,804 7,395 7,408 9,421 9,249 12,610 11,828 Other commercial properties 1,396 1,272 1,272 1,051 1,051 2,120 2,193 Residential Project Development 3,282 3,268 3,268 3,394 3,394 4,814 4,769 10,482 11,935 11,948 13,866 13,694 19,544 18,7903 Items related to non-interest-bearing unrealized changes in value of derivatives/securities are included in the following amounts: Financial non-current assets 107 116 – – – – – Financial current assets 35 281 – – – – – Financial non-current liabilities 22 254 – – – – – Financial current liabilities 196 193 – – – – –
Note 44 continued

122 Notes, including accounting and valuat ion pr inc iples Skanska Annual Report 2005
No
tes,
incl
ud
ing
acc
ou
nti
ng
an
d v
alu
atio
n p
rin
cip
les
Note 44 continued
Financial ratios etc. 4, 5 In compliance with IFRS In compliance with SWGAAP Dec 31 Jan 31 Dec 31 Jan 31 Dec 31 Dec 31 Dec 31 2005 2005 2004 2004 2003 2002 2001
Order bookings 117,097 – 121,903 – 121,128 134,625 147,796
Order backlog 128,743 – 113,740 – 116,401 135,165 153,823
Average number of employees 53,806 – 53,803 – 69,669 72,698 74,925
Regular dividend per share. SEK 4 4.50 – 4.00 – 3.00 2.00 3.00
Extra dividend per share, SEK 4 2.00
Earnings per share, SEK 9.27 – 7.58 – 6.60 –2.00 0.05
Capital employed 24,451 21,549 21,560 24,505 24,460 31,640 36,340
Interest-bearing net receivable (+)/net debt (–) 11,111 7,229 7,229 437 150 –9,376 –7,376
Equity per share, SEK 44.09 38.80 38.83 34.65 33.90 34.00 42.73
Equity/assets ratio, % 26.1 25.7 25.9 22.0 21.5 18.9 20.2
Debt/equity ratio –0.6 –0.4 –0.4 0.0 0.0 0.6 0.4
Interest cover –37.4 – 122.8 – 16.8 5.7 5.6
Return on equity, % 22.4 – 20.6 – 19.5 –5.2 0.1
Return on capital employed, % 23.3 – 19.9 – 17.1 4.2 7.5
Total number of shares 418,553,072 418,553,072 418,553,072 418,553,072 418,553,072 418,553,072 418,553,072
Average number of shares
Before dilution 418,553,072 418,553,072 418,553,072 418,553,072 418,553,072 418,553,072 419,981,149
After dilution 418,561,923
4 Proposed by the Board of Directors: Regular dividend of SEK 4.50 and extra dividend of SEK 2.00 per share for 2005.5 For definitions, see Note 45.

Skanska Annual Report 2005 Notes, including accounting and valuat ion pr inc iples 123
No
tes,
incl
ud
ing
acc
ou
nti
ng
an
d v
alu
atio
n p
rin
cip
les
Note 45 Definitions
Number of shares outstanding
Average number of shares for the year 2005 2004 2003 2002 2001
before dilution 418,553,072 418,553,072 418,553,072 418,553,072 419,981,149
after dilution 418,561,923
Total, December 31 418,553,072 418,553,072 418,553,072 418,553,072 418,553,072
Return on equity Profit attributable to equity holders as a percentage of average visible equity attributable to equity holders.
Consolidated return on Operating income plus financial income as a percentage of average capital employed.
capital employed
Return on capital employed in Operating income plus financial income minus interest income from Skanska’s treasury unit and other
business streams, markets and financial items as a percentage of average capital employed.
business/reporting units
Yield on properties Operating net divided by year-end book value.
Operating net on properties Rental income and interest subsidies minus operating, maintenance and administrative expenses as well as
real estate tax. Site leasehold rent is included in operating costs.
Equity per share Visible equity attributable to equity holders divided by the number of shares.
Average capital employed Calculated on the basis of five measuring points: half of capital employed on January 1 plus capital employed
at the end of the first, second and third quarters plus half of capital employed at year-end, divided by four.
Consolidated operating cash flow In the consolidated operating cash flow statement, which includes taxes paid, investments are recognized
both in cash flow from business operations and in cash flow from strategic investments. See also Note 36.
Net working capital Net non-interest-bearing receivables and liabilities including taxes.
Operating cash flow Cash flow from operations before taxes and before financial activities. See also Note 36.
Earnings per share Profit for the year attributable to equity holders divided by the average number of shares.
Interest-bearing net receivable Interest-bearing assets minus interest-bearing liabilities.
Interest cover Operating income and financial income plus depreciation/amortization divided by net interest items.
Debt/equity ratio Interest-bearing net debt divided by visible equity including minority interest.
Equity/assets ratio Visible equity including minority interest as a percentage of total assets.
Consolidated capital employed Total assets minus non-interest-bearing liabilities.
Capital employed in business streams, Total assets minus tax receivables in deposits in Skanska’s treasury unit minus non-interest-bearing liabilities
markets and business units/reporting minus provisions for taxes and tax liabilities.
units
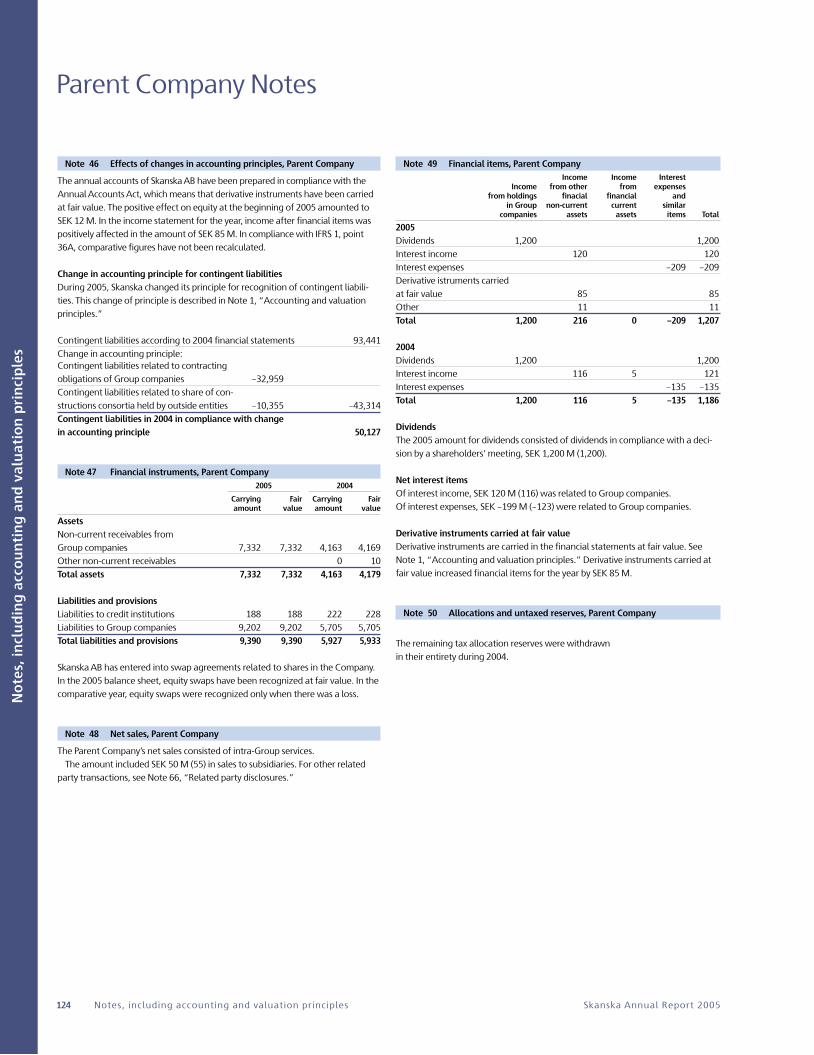
124 Notes, including accounting and valuat ion pr inc iples Skanska Annual Report 2005
No
tes,
incl
ud
ing
acc
ou
nti
ng
an
d v
alu
atio
n p
rin
cip
les
Note 46 Effects of changes in accounting principles, Parent Company
The annual accounts of Skanska AB have been prepared in compliance with the
Annual Accounts Act, which means that derivative instruments have been carried
at fair value. The positive effect on equity at the beginning of 2005 amounted to
SEK 12 M. In the income statement for the year, income after financial items was
positively affected in the amount of SEK 85 M. In compliance with IFRS 1, point
36A, comparative figures have not been recalculated.
Change in accounting principle for contingent liabilitiesDuring 2005, Skanska changed its principle for recognition of contingent liabili-
ties. This change of principle is described in Note 1, “Accounting and valuation
principles.”
Contingent liabilities according to 2004 financial statements 93,441
Change in accounting principle:Contingent liabilities related to contracting
obligations of Group companies –32,959
Contingent liabilities related to share of con-
structions consortia held by outside entities –10,355 –43,314
Contingent liabilities in 2004 in compliance with changein accounting principle 50,127
Note 47 Financial instruments, Parent Company 2005 2004 Carrying Fair Carrying Fair amount value amount value
AssetsNon-current receivables from
Group companies 7,332 7,332 4,163 4,169
Other non-current receivables 0 10
Total assets 7,332 7,332 4,163 4,179
Liabilities and provisionsLiabilities to credit institutions 188 188 222 228
Liabilities to Group companies 9,202 9,202 5,705 5,705
Total liabilities and provisions 9,390 9,390 5,927 5,933
Skanska AB has entered into swap agreements related to shares in the Company.
In the 2005 balance sheet, equity swaps have been recognized at fair value. In the
comparative year, equity swaps were recognized only when there was a loss.
Note 48 Net sales, Parent Company
The Parent Company’s net sales consisted of intra-Group services.
The amount included SEK 50 M (55) in sales to subsidiaries. For other related
party transactions, see Note 66, “Related party disclosures.”
Parent Company Notes
Note 49 Financial items, Parent Company Income Income Interest Income from other from expenses from holdings finacial financial and in Group non-current current similar companies assets assets items Total
2005Dividends 1,200 1,200
Interest income 120 120
Interest expenses –209 –209
Derivative istruments carried
at fair value 85 85
Other 11 11
Total 1,200 216 0 –209 1,207
2004Dividends 1,200 1,200
Interest income 116 5 121
Interest expenses –135 –135
Total 1,200 116 5 –135 1,186
DividendsThe 2005 amount for dividends consisted of dividends in compliance with a deci-
sion by a shareholders’ meeting, SEK 1,200 M (1,200).
Net interest itemsOf interest income, SEK 120 M (116) was related to Group companies.
Of interest expenses, SEK –199 M (–123) were related to Group companies.
Derivative instruments carried at fair valueDerivative instruments are carried in the financial statements at fair value. See
Note 1, “Accounting and valuation principles.” Derivative instruments carried at
fair value increased financial items for the year by SEK 85 M.
Note 50 Allocations and untaxed reserves, Parent Company
The remaining tax allocation reserves were withdrawn
in their entirety during 2004.

Skanska Annual Report 2005 Notes, including accounting and valuat ion pr inc iples 125
No
tes,
incl
ud
ing
acc
ou
nti
ng
an
d v
alu
atio
n p
rin
cip
les
Note 51 Income taxes, Parent Company
2005 2004
Current taxes 105 –221
Deferred tax expense/
income from change in temporary differences –6 –22
Total 99 –243
Tax on Group contributions received in 2005, SEK 194 M, was recognized directly
in equity. A tax effect of SEK 130 M on Group contributions provided in 2004 was
alsorecognized directly in equity.
The relation between the Swedish tax rate of 28 percent and taxes recognized is
explained in the table below.
2005 2004
Income after financial items 925 1,098
Taxes at tax rate of 28 percent –259 –307
Tax effect of:Allocations –259
Provision for pensions –11
Dividends from subsidiaries 336 336
Other 22 –2
Recognized tax expense 99 –243
Deferred tax assets 2005 2004
Deferred tax assets for
employee-related provisions 53 57
Minus deferred tax liabilities for holdings –2
Total 51 57
Change in deferred taxes in balance sheet 2005 2004
Deferred tax assets, January 1 57 79
Deferred tax expense –6 –22
Deferred tax assets, December 31 51 57
The Parent Company expects to be able to utilize deferred tax assets to offset
Group contributions from Swedish operating subsidiaries.
Note 52 Intangible assets, Parent Company
Intangible assets are reported in compliance with IAS 38, “Intangible Assets.” See
Note 1, “Accounting and valuation principles.”
Amortization of intangible assets amounted to SEK –1 M (–1) during the year
and were included in sellingand administrative expenses.
In determining the amortization amount, the Parent Company paid particular
attention to estimated residual value at the end of useful life. Intangible assets 2005 2004
Accumulated costJanuary 1 25 25
25 25Accumulated amortizationJanuary 1 –7 –6
Amortization for the year –1 –1
–8 –7Accumulated impairment lossesJanuary 1 –1 –1
Impairment losses for the year
–1 –1
Carrying amount, December 31 16 17Carrying amount, January 1 17 18
Note 53 Property, plant and equipment, Parent Company
Property, plant and equipment are reported in compliance with IAS 16, “Property,
Plant and Equipment.” See Note 1, “Accounting and valuation principles.”
Buildings and land owned by the Parent Company are recognized as property,
plant and equipment. Machinery and equipment are recognized in one item.
The year’s depreciation on property, plant and equipment amounted to
SEK –1 M (–1) and was included in selling and administrative expenses.
Information about cost, accumulated depreciation, accumulated revaluations and
accumulated impairment losses. Buildings Machinery and land and equipment 2005 2004 2005 2004
Accumulated costJanuary 1 13 35 7 5
New acquisitions 1 2
Divestments and disposals –13 –22
0 13 8 7Accumulated depreciationJanuary 1 –7 –26 –4 –3
Divestments and disposals 7 19
Depreciation for the year –1 –1
0 –7 –5 –4
Carrying amount, December 31 0 6 3 3Carrying amount, January 1 6 9 3 2
Information on assessed value for tax purposes, non-current assets, Sweden.
Property, plant and equipment 2005 2004
Buildings 0 6
corresponding book value of buildings 0 4
Land 0 4
corresponding book value of land 0 5

126 Notes, including accounting and valuat ion pr inc iples Skanska Annual Report 2005
No
tes,
incl
ud
ing
acc
ou
nti
ng
an
d v
alu
atio
n p
rin
cip
les
Note 54 Financial non-current assets, Parent Company
Holdings and receivables are reported as financial non-current assets.
Holdings are divided into holdings in Group companies and joint ventures. Joint
ventures are described in Note 56.
Receivables are divided into receivables from Group companies, deferred tax
assets and other non-current receivables. Tax assets are described in Note 51,
“Income taxes.” All receivables except deferred tax assets are interest-bearing.
Holdings in Holdings in Group companies joint ventures Holdings 2005 2004 2005 2004
Accumulated costJanuary 1 12,325 12,325 0 0
Long-term Share Award Plan 10
12,335 12,325 0 Accumulated impairment lossesJanuary 1 –1,760 –1,760
–1,760 –1,760 0 0
Book value, December 31 10,575 10,565 0 0Book value, January 1 10,565 10,565 0 0
Note 55 Holdings in Group companies, Parent Company
Skanska AB holds shares in three subsidiaries.
The subsidiary Skanska Kraft AB is a holding company and the company that owns the Group’s shareholdings in Skanska Group operating companies.
Skanska Financial Services AB is the Group’s treasury unit (internal bank). Corporate Book value Registered Number of Company identity number office participations 2005 2004
Swedish subsidiariesHexabar Kornblå AB 556556–6642 Solna 1,000 0 0
Skanska Financial Services AB 556106–3834 Solna 500,000 65 65
Skanska Kraft AB 556118–0943 Solna 4,000,000 10,510 10,500
Total 10,575 10,565
All the above companies are 100 percent owned by the Parent Company.
Note 56 Holdings in joint ventures, Parent Company
Joint ventures are reported in compliance with IAS 31, “Interests in Joint Ventures.” See Note 1, “Accounting and valuation principles.”
Percentage of Corporate capital stock Book value Registered Company identity number office and votes 2005 2004
Swedish joint venturesSundlink Contractors HB 969620–7134 Malmö 37 0 0
Total 0 0
Note 57 Prepaid expenses and accrued income, Parent Company
The Parent Company has prepared expenses and accrued income of SEK 97 M (4).
The amount consists of accrued gains of SEK 92 M on derivative instruments car-
ried at fair value, prepaid insurance premiums of SEK 2 M and miscellaneous inter-
im receivables of SEK 3 M.
Note 58 Equity, Parent Company
Restricted and unrestricted equityAccording to Swedish law, equity must be allocated between non-distributable
(restricted) and distributable (unrestricted) funds. Capital stock (share capital) and
the statutory reserve comprise restricted equity. Unrestricted equity comprises
retained earnings, which includes the effect of derivative instruments carried at
fair value.
The equity of the Parent Company was allocated among SEK 1,256 M (1,256) in
capital stock, SEK 598 M (598) in the statutory reserve (restricted reserves) and
SEK 6,721 M (6 849) in retained earnings.
Other non-current receivables and Receivables from deferred Group companies tax assets Receivables 2005 2004 2005 2004
Accumulated costJanuary 1 4,163 2,834 104 124
Receivables added/settled 3,169 1,329 20 –20
7,332 4,163 124 104Book value, December 31 7,332 4,163 124 104Book value, January 1 4,163 2,834 104 124
The proposed but not yet approved dividend for 2005 amounts to a total of
SEK 2,721 M. Of this, SEK 1,884 M (1,674) comprises the regular dividend, equiva-
lent to SEK 4.50 (4.00) per share, plus SEK 837 M (0) is an extra dividend, equiva-
lent to SEK 2.00 per share.
Number of shares 2005 2004
Average number of shares before dilution 418,553,072 418,553 072
after dilution 418,561,923 418,553 072
Total number of shares 418,553,072 418,553 072
The number of shares amounted to 418,553,072, divided into 22,554,063
(28,538,696) Series A shares and 395,999,009 (390,014,376) Series B shares. Dur-
ing 2005, 5,984,633 (2,133,225) Series A shares were redeemed for a correspond-
ing number of Series B shares.
The par (nominal) value per share amounts to SEK 3 (3). All shares are fully paid
up. One Series A share carries 10 votes, and a Series B share carries one vote. Oth-
erwise all shares enjoy the same rights. Series B shares are listed on Stockholms-
börsen (the Stockholm Stock Exchange). According to the Articles of Association,
Skanska’s capital stock may amount to a minimum of SEK 1,200 M and a maxi-
mum of SEK 4,800 M.

Skanska Annual Report 2005 Notes, including accounting and valuat ion pr inc iples 127
No
tes,
incl
ud
ing
acc
ou
nti
ng
an
d v
alu
atio
n p
rin
cip
les
Note 59 Provisions, Parent Company
Provisions are reported in compliance with IAS 37, “Provisions, contingent
liabilities and contingent assets.”
See Note 1, “Accounting and valuation principles.”
Provisions Provisions Other for pensions for taxes provisions
January 1 181 0 25
Provisions for the year 67 22
Provisions utilized –67 –25
Unutilized amounts that were reversed –21
December 31 160 0 22
“Other provisions” consisted of employee-related provisions.
Normal cycle time for “Other provisions” is about one to three years.
Employee-related provisions included such items as costs of profit-sharing, certain
bonus programs and other obligations to employees.
Note 60 Provisions for pensions, Parent Company
Provisions for pensions are recognized in compliance with the Security
of Income Act.
Pension liabilities according to the balance sheet 2005 2004
Interest-bearing pension liability1 131 156
Other pension obligations 29 25
Total 160 181
1 Liability in compliance with the Security of Income Act.
Reconciliation, provisions for pensions 2005 2004
January 1 156 214
Pension expenses 52 35
Benefits paid –56 –78
Reclassifications –21 –15
Provisions for pensions according to the balance sheet 131 156
Note 61 Liabilities, Parent Company
Liabilities are allocated between non-current and current in compliance with IAS
1, “Presentation of Financial Statements.” See Note 1, “Accounting and valuation
principles.”
Non-current liabilities Interest-bearing liabilities that fall due for payment within twelve months may be
regarded as non-current in some cases. The Parent Company intends to refinance
SEK 0 M (30) worth of liabilities that fall due within one year. As a result, they were
labeled non-current.
Accrued expenses and prepaid income The Parent Company had accrued expenses and prepaid income of SEK 41 M (25).
This was related to accrued vacation pay of SEK 15 M, special payroll tax on pen-
sions of SEK 14 M, accrued social insurance contributions of SEK 5 M and other
accrued expenses of SEK 6 M.

128 Notes, including accounting and valuat ion pr inc iples Skanska Annual Report 2005
No
tes,
incl
ud
ing
acc
ou
nti
ng
an
d v
alu
atio
n p
rin
cip
les
Note 62 Expected recovery periods of assets, provisions and liabilities, Parent Company
2005 2004 Within 12 months Within 12 months Amount expected to be recovered 12 months or longer Total 12 months or longer Total
Tangible non-current assets1 1 15 16 1 16 17Property, plant and equipment1 1 2 3 2 7 9Financial non-current assets Holdings in Group companies and joint ventures 2 10,575 10,575 10,565 10,565
Receivables from Group companies 3 7,332 7,332 4,163 4,163
Other non-current receivables 73 73 47 47
Deferred tax assets 51 51 57 57
18,031 18,031 14,832 14,832Current receivables Current receivables from Group companies 19 19 15 15
Tax receivables 1 1
Other current receivables 49 49 35 35
Prepaid expenses and accrued income 97 97 4 4
Total assets 168 18,048 18,216 57 14,855 14,912
2005 2004 More More than than Within 12 months 5 years Within 12 months 5 years Amounts expected to be paid 12 months to 5 years (liabilities) Total 12 months to 5 years (liabilities) Total
Provisions Provisions for pensions 160 160 181 181
Other provisions 22 22 25 25
182 182 206 206
Liabilities Non-current liabilities Liabilities to credit institutions 30 158 188 30 192 222
Liabilities to Group companies 4 9,202 9,202 5,705 5,705
30 158 9,202 9,390 30 192 5,705 5,927
Current liabilities Trade accounts payable 15 15 27 27
Liabilities to Group companies 7 7 6 6
Tax liabilities 0 6 6
Other liabilities 6 6 12 12
Accrued expenses and prepaid income 41 41 25 25
69 0 0 69 76 0 0 76Total liabilities and provisions 99 340 9,202 9,641 106 398 5,705 6,209
1 In case of amounts expected to be recovered within twelve months, expected annual depreciation/amortization has been recognized.2 No portion of this amount is expected to be recovered within twelve months.3 No portion of this amount is expected to be recovered within twelve months, since this lending is treated as non-current.4 Intra-Group non-current interest-bearing liabilities are treated as if they fall due in more than five years from the balance sheet date.
Note 63 Assets pledged and contingent liabilities, Parent Company
Assets pledged Assets pledged by the Parent Company totaled SEK 73 M (46), which were related
to assets in the form of non-current receivables.
These assets were pledged as collateral for some of the Parent Company’s pen-
sion obligations.
Contingent liabilities Contingent liabilities are reported in compliance with IAS 37, “Provisions, Contin-
gent Liabilities and Contingent Assets. See “Accounting and valuation principles,”
Note 1, IAS 37 section, which describes changes in accounting principles. The com-
parative figures have been recalculated on the basis of the new principles.
2005 2004
Contingent liabilities on behalf of Group companies 64,221 47,072
Other contingent liabilities 6,193 3,055
70,414 50,127
Of the Parent Company’s contingent liabilities on behalf of Group companies,
nearly SEK 59 billion (42) was related to contracting obligations incurred by Group
companies. Of the remaining contingent liabilities on behalf of Group companies,
about SEK 5.2 billion (4.1) consisted of guarantees issued for borrowing by Group
companies from credit institutions.
Of other contingent liabilities, more than SEK 4 billion (2.1) was related to liabili-
ty for the portion of construction consortia held by external entities. Of the
remaining SEK 2.1 billion (0.9), more than SEK 1.4 billion (0,9) was attributable to
guarantees provided for financing of joint ventures in which Group companies are
co-owners and SEK 0.7 billion (0.0) to guarantees for financing of residential proj-
ects in Sweden.
The Parent Company has issued capital coverage guarantees for certain subsid-
iaries.
The amounts in the above table include SEK 9 M (23) worth of Parent Company
contingent liabilities related to construction consortia.

Skanska Annual Report 2005 Notes, including accounting and valuat ion pr inc iples 129
No
tes,
incl
ud
ing
acc
ou
nti
ng
an
d v
alu
atio
n p
rin
cip
les
Absence from work due to illness 2005 2004
Total absence from work due to illness
as a percentage of regular working time1 1.2% 2.4%
Percentage of total absence from work due to illness
related to continuous absences of 60 days or more 63% 83%
Absence from work due to illness as a percentage of each category’s regular working time:Men 0.3% 0.1%
Women 2.3% 5.3%
Absence due to illness by age category: Age 29 or younger 2 – –
Age 30-49 2 1.8% 4.3%
Age 50 or older 0.3% 0.2%
1 In the Parent Company, the number of employees totaled 59 (59).2 Since the category “Age 29 or younger” includes fewer than 10 people, this category is
reported together with the “Age 30-49” category.
Note 66 Related party disclosures, Parent Company
Through its ownership and percentage of voting power, AB Industrivärden has a
singnificant influence, as defined in compliance with IAS 24, “Related Party Disclo-
sures.” All transactions have occurred on market terms.
Information on personnel expenses is found in Note 65, “Personnel”
2005 2004
Sales to Group companies 50 55
Purchases from Group companies –52 –59
Interest income from Group companies 120 116
Interest expenses to Group companies –199 –123
Dividends from Group companies 1,200 1,200
Non-current receivables from Group companies 7,332 4,163
Current receivables from Group companies 19 15
Non-current liabilities to Group companies 9,202 5,705
Current liabilities to Group companies 7 6
Contingent liabilities on behalf of Group companies 64,221 47,072
Note 67 Supplementary information, Parent Company
Skanska AB (publ), Swedish corporate identification number 556000-4615, is the
Parent Company of the Skanska Group.
The Company has its registered office in Solna, Stockholm County and is a limit-
ed company as provided by Swedish legislation. Its headquarters is located in
Solna, Stockholm County.
Address:
Skanska AB
SE-169 83 SOLNA, Sweden
Tel: +46-8-504 350 00
Fax: +46-8-755 71 26
www.skanska.com
For questions concerning financial information, please contact:
Skanska AB, Investor Relations, SE-169 83 SOLNA, Sweden
Tel: +46-8-753 88 00
Fax: +46-8-755 12 56
E-mail: [email protected]
Note 64 Cash flow statement, Parent Company
Adjustments for items not included in cash flow 2005 2004
Depreciation/amortization 2 3
Gains from divestments of non-current assets 2 3
Total 4 6
Taxes paidTotal taxes paid in the Parent Company during 2005 amounted to SEK –102 M
(–98).
Information on interest and dividends 2005 2004
Interest income during the year 120 116
Interest payments during the year –208 –123
Dividends received during the year 1,200 1,200
Note 65 Personnel, Parent Company
Salaries, other remuneration and social insurance contributions 2005 2004
Salaries and other remunerationBoard of Directors, Presidents and Executive Vice Presidents1 40 47
(of which bonuses) 10 10
Other employees 52 51
Total salaries and other remuneration 92 98
Social insurance contributions 95 74
of which pension expenses 55 35
1 The amount related to the Board of Directors, Presidents and Executive Vice Presidents included compensation to former Board members, Presidents and Executive Vice Presidents during the financial year.
The Parent Company’s pension expenses were calculated in compliance with the
Security of Income Act. Pension expenses during 2005 and 2004 were affected by
an upturn in the value of assets held by Swedish pension funds.
Of the Parent Company’s pension expenses, SEK 12.8 M (19.6) was related to
the category Board of Directors, Presidents and Executive Vice Presidents. The
amount included compensation to former Board members, Presidents and Execu-
tive Vice Presidents. The Company’s outstanding pension obligations to these
amounted to SEK 234.8 M (241.2).
Average number of employees Personnel figures are calculated as the average number of employees. See Note 1,
“Accounting and valuation principles.”
of whom of whom of whom of whom 2005 men women 2004 men women
Sweden 59 36 23 59 35 24
Men and women on the Board of Directors and Senior Executive Team on the balance sheet date of whom of whom of whom of whom 2005 men, % women,% 2004 men, % women,%
Number of Board members 15 73 27 15 80 20President and other members of
the Senior Executive Team 6 100 0 6 100 0

130 Skanska Annual Report 2005
Proposed allocation of earnings
The Board of Directors and the President of Skanska AB propose that the profit for 2005,SEK 1,023,568,387, plus the retained earnings of SEK 5,697,209,676 brought forward from the previous year, totaling SEK 6,720,778,063, be allocated as follows:
A dividend to the shareholders of SEK 6.50 per share SEK 2,720,594,968Of which, an extra dividend of SEK 2.00 per share, SEK 837,106,149 To be carried forward SEK 4,000,183,095Total SEK 6,720,778,063
As far as we are aware, the annual accounts have been prepared in compliance with generally accepted accounting practices for listed companies, the information provided matches the actual conditions and nothing of essential importance has been omitted that might affect the picture of the Company created by the annual accounts.
Stockholm, February 15, 2006
Sverker Martin-Löf Ulrika Francke Roger Flanagan Sören Gyll Finn Johnsson Jane F. Garvey Arne Mårtensson Anders Nyrén Folmer Knudsen Gunnar Larsson Nils-Erik Pettersson
Stuart GrahamPresident
Pro
po
sed
all
oca
tio
n o
f ea
rnin
gs
Proposed al locat ion of earnings

Skanska Annual Report 2005 131
Auditors’ Report
To the Annual Shareholders’ Meeting of Skanska AB (publ.) Swedish corporate identity number 556000-4615
We have examined the annual accounts which consist of pages 50-130, the consolidated accounts, the accounting records and the administration of the Board of Directors and the President of Skanska AB (publ) for the year 2005. The Board of Directors and the President are responsible for these accounts and the administration of the Company as well as for the appli-cation of the Annual Accounts Act when preparing the annual accounts and the application of International Financial Reporting Standards (IFRSs) as adopted by the EU and the Annual Accounts Act when preparing the consolidated accounts. Our responsibility is to express an opinion on the annual accounts, the consolidated accounts and the administration based on our audit. We conducted our audit in accordance with generally accepted auditing standards in Swe-den. These standards require that we plan and perform the audit to obtain high but not abso-lute assurance that the annual accounts and the consolidated accounts are free of material mis-statement. An audit includes examining, on a test basis, evidence supporting the amounts and disclosures in the accounts. An audit also includes assessing the accounting principles used and their application by the Board of Directors and the President and significant estimates made by the Board of Directors and the President when preparing the annual accounts as well as evaluating the overall presentation of information in the annual accounts and the consoli-dated accounts. As a basis for our opinion concerning discharge from liability, we examined significant decisions, actions taken and circumstances of the Company in order to be able to determine the liability, if any, to the Company of any Board member or the President. We also examined whether any Board member or the President has, in any other way, acted in contra-vention of the Swedish Companies Act, the Annual Accounts Act or the Articles of Associa-tion. We believe that our audit provides a reasonable basis for our opinion set out below. The annual accounts have been prepared in accordance with the Annual Accounts Act and provide a true and fair view of the Company’s results of operations and financial position in accordance with generally accepted accounting principles in Sweden. The consolidated accounts have been prepared in accordance with International Financial Reporting Standards (IFRSs) as adopted by the EU and the Annual Accounts Act and provide a true and fair view of the Group’s results of operations and financial position. The statutory Report of the Directors is consistent with the other parts of the annual accounts and the consolidated accounts. We recommend to the Annual Shareholders’ Meeting that the income statements and bal-ance sheets of the Parent Company and the Group be adopted, that the profit of the Parent Company be dealt with in accordance with the proposal in the Report of the Directors and that the members of the Board of Directors and the President be discharged from liability for the financial year.
Stockholm, February 24, 2006 KPMG Bohlins AB
Caj Nackstad Authorized Public Accountant
Au
dit
ors
’ Rep
ort
Auditors ’ Report

132 Skanska Annual Report 2005
Application of the Corporate Governance CodeSkanska applies the Swedish Code of Corporate Governance. In accordance with the listing agreement with Stockholmsbörsen (the Stockholm Stock Exchange), Skanska began to apply the Code as soon as possible after July 1, 2005. It will apply the Code in full prior to the Annual Shareholders’ Meeting in 2006.
The Board of Directors is not issuing a complete corporate governance report for the 2005 financial year. The “comply or explain” model is not suitable in the case of a gradual application of the Code, which also encompasses only half the financial year.
At the end of 2005, Skanska was in compliance with all the rules of the Code except as concerns the following (disregarding conditions before July 1, 2005): • Skanska does not have an “internal audit function” as described
in Point 3.7.3 of the Code. The Audit Committee of the Board has approved the company’s plan for setting up an independent internal control function handling internal control and audit matters. During 2006, the Board will evaluate the scope of duties and the organization of the internal control function.
• A complete corporate governance report concerning the finan-cial year 2005 is not being issued for the reasons presented above.
This Corporate Governance Report has not been reviewed by the Company’s auditors.
Internal control With reference to the statement of December 15, 2005 from the Swedish Corporate Governance Board, the Board of Directors is providing a description below of how Skanska’s internal control is organized, without any statement about how well it has func-tioned.
Corporate Governance Report of Skanska AB (publ)plus the Board of Directors’ description of how internal control is organized
Members of Board of Directors and itscommittees and number of meetings attended
Board of Directors (9 meetings) Attended
Sverker Martin-Löf (Chairman) 9
Roger Flanagan 9
Ulrika Francke 7
Jane F. Garvey 7
Stuart Graham 9
Sören Gyll 8
Inge Johansson 9
Peter Johansson1 7
Finn Johnsson 7
Folmer Knudsen 9
Ann-Christin Kutzner 9
Gunnar Larsson 9
Arne Mårtensson 7
Anders Nyrén 9
Nils-Erik Pettersson 7
Jessica Karlsson2 1
Compensation Committee (4 meetings) Attended
Sverker Martin-Löf (Chairman) 4
Arne Mårtensson 3
Audit Committee (5 meetings) Attended
Anders Nyrén (Chairman) 5
Sverker Martin-Löf3 3 Ulrika Francke 5
Project Review Committee (12 meetings) Attended
Sverker Martin-Löf 12
Roger Flanagan 10
Anders Nyrén 11
Nils-Erik Pettersson 8
1 Board member until November 30, 20052 Board member since December 1, 20053 Member of Audit Committee since April 7, 2005
During the autumn of 2005, Skanska began the task of establish-ing an internal control function. During an introductory stage, this function is reporting via the Controlling Group Staff Unit to the Company’s Executive Vice President and Chief Financial Officer. During 2006, when the Internal Control function has become fully staffed, Internal Control will comprise a separate Group staff unit, reporting directly to the Audit Committee and under the direction of the Executive Vice President and Company’s Chief Financial Officer. Together with the business units, during the autumn of 2005 Internal Control has identified the most essential risks that the control department will focus on and has established a structure, including control standards for how internal control shall take place in the Group. The general control environment has been examined and found to cover the greatest risks and to be clear, consistent and well-communicated. During the spring and summer of 2006, the control structure will be implemented in the Group.
General information about the governance of the GroupSkanska AB is a listed Swedish stock corporation, governed in accordance with Swedish corporate legislation, Skanska’s Articles of Association and the listing agreement with Stockholmsbörsen.
Annual Shareholders’ MeetingAt the Shareholders’ Meeting, the highest decision-making body, the shareholders of Skanska decide on central issues, such as adopting the income statement and balance sheet, discharging the members of the Board of Directors and the President from liabil-ity for the financial year, the dividend to the shareholders, the composition of the Board and election of auditors.C
orp
ora
te G
ove
rnan
ce R
epo
rt
Corporate Governance Report
Skanska Annual Report 2005 133Corporate Governance Report
The Annual Shareholders’ Meeting was held on April 7, 2005 in Stockholm. At the Meeting, a total of 408 shareholders were pres-ent, personally or through proxy, representing about 57 percent of the total voting power in the Company. The Annual Shareholders’ Meeting gave the Chairman of the Board a mandate to contact the five largest shareholders in terms of voting power, which each appoint a representative, who may not be a member of the Board of Directors, to comprise together with the Chairman a Nomina-tion Committee for the period until the next Annual Sharehold-ers’ Meeting, or if needed until a new Nomination Committee has been appointed. In preparation for the 2006 Annual Meeting, the Nomination Committee has the following composition: Carl-Olof By, Chairman of the Nomination Committee and representing AB Industrivärden; Sverker Martin-Löf, Chairman of the Board, Skanska AB; KG Lindvall, representing the Robur mutual funds; Per Ludvigsson, representing Inter-IKEA Investments AB; Robert Vikström, representing the Svenska Handelsbanken pension funds as well as Svenska Handelsbanken AB; and Magnus Wärn, repre-senting AMF Pension.
Board of DirectorsThe Board of Directors makes decisions concerning overall issues about the Parent Company and the Group, such as Group strategy, publication of interim and full-year reports, major construction projects, investments and divestments, appointment of the President and CEO as well as the organizational structure of the Group. The Board has established three special committees: the Audit Committee, the Compensation Committee and the Project Review Committee. These committees have the Board’s mandate to make decisions on certain items of business. The committees report regularly to the Board.
CEO and Senior Executive TeamThe President and Chief Executive Officer (CEO) is responsible for day-to-day management and oversight of the Group’s opera-tions. The CEO, five Executive Vice Presidents and the Senior Vice President, Human Resources, form the Senior Executive Team. (Information of the renumeration and other terms of employment for the Senior Executive Team is provided in Note 38, page 114).
Governing documentsAs part of the governance of Group operations, Skanska AB’s Board of Directors has established a number of policy documents. In addition, the Senior Executive Team has established more detailed guidelines for the Group. These policies and guidelines are available to all business units on Skanska’s internal website and are updated regularly to reflect changes in operations and new requirements. Among the more important governing documents are the Board’s Procedural Rules, the Group’s financial policy, communications policy, risk management policy and the Code of Conduct. The Board’s Procedural Rules state what items of busi-
ness shall be decided by the Board of Skanska AB, by the CEO/Senior Executive Team or at the business unit level. The threshold levels for decisions stated in the Procedural Rules are further bro-ken down in the business units’ own decision-making rules. The business units provide regular, systematic feedback on compliance with the more important governing documents, such as the Code of Conduct, to the Senior Executive Team.
Group staff units and support unitsAt Skanska Group headquarters in Solna, there are ten Group staff units plus the support units Skanska Financial Services and Skanska Project Support. The Group staff units and support units assist the CEO and the Senior Executive Team on matters concern-ing Groupwide functions, coordination and controls. In addition, they provide backup to the business units related to such fields as human resource matters, information technology, project financ-ing, purchasing and risk management. The head of each Group staff unit reports directly to a member of the Senior Executive Team.
The business units and their governanceThe organizational structure of the Skanska Group is character-ized by clear decentralization and a large measure of delegation of authority and responsibility to the business units. Each business unit is headed by a President and has its own staff units and other resources in order to conduct its operations effectively.
Aside from day-to-day operations of the business units, there are matters related to the strategic development of the units as well as matters concerning their strategic investments and divestments. These items of business are prepared by the man-agement team at each respective unit and are then submitted to the Senior Executive Team or Skanska AB’s Board of Directors for a decision, depending on the size of the item of business. The Boards of Directors of the business units consist of representatives of Skanska AB as well as of the business unit’s management team. In each business unit, the Chairman of the Board is a member of the Senior Executive Team. Where appropriate, employee repre-sentatives are included.
Each business unit follows a structured, step-by-step risk management process (Operational Risk Assessment, ORA). Depending among other things on the size, type and geographic location of projects, a structured risk management report to the proper decision-making level is required before decisions on the projects are made.
Solna, February 2006
THE BOARD OF DIRECTORS
Co
rpo
rate
Go
vern
ance
Rep
ort

134 Skanska Annual Report 2005Board of Directors
Sverker Martin-LöfStockholm, born 1943.Chairman. Elected 2001.Other directorships: SCA (Chairman), SSAB (Chairman), Industrivärden (Vice Chairman), Telefonaktiebo-laget LM Ericsson, Svenska Handels-banken, Confederation of Swedish Enterprise.Holdings in Skanska: 8,000 B shares.
Roger FlanaganHenley-On-Thames, Oxon, England, born 1944. Elected 1998. Professor at University of Reading, United Kingdom;; Chalmers Univer-sity of Technology; and University of Cape Town, South Africa.Other directorships: Halcrow Group.Holdings in Skanska: 2,000 B shares.
Ulrika FranckeStockholm, born 1956.Elected 2003.President of SBC, SverigesBostads-rättsCentrum AB. Other director-ships: Föreningssparbanken (Vice Chairman), Tyréns, Brandkontoret.Holdings in Skanska: 1,000 B shares.
Jane F. GarveyKennebunkport, Maine, U.S.A., born 1944.Elected 2003.Executive Vice President and Chair-man of the Transportation Practice, APCO Worldwide.Holdings in Skanska: 0 shares.
Stuart E. GrahamStockholm, born 1946.President and CEO. Elected 2003. Other directorships: Securitas AB.Holdings in Skanska: 75,000 B shares.
Sören GyllSaltsjö-Duvnäs, born 1940.Elected 1997.Other directorships: SKF, SCA, Medicover Holding S.A, Fenix Holding. Member, Royal Swed-ish Academy of Engineering Sciences.Holdings in Skanska: 4,952 B shares.
Inge JohanssonHuddinge, born 1951.Swedish Building Workers’ Union, appointed 1999.Concrete worker.Deputy Board member.Holdings in Skanska: 150 B shares.
Finn JohnssonGothenburg, born 1946.Elected 1998.Other directorships:City Airline (Chairman), KappAhl (Chairman), Outokumpu Copper Products (Chairman), Thomas Concrete Group (Chairman), Unomedical A/S (Chairman), Volvo (Chairman), Indus-trivärden.Holdings in Skanska: 8,000 B shares.
Jessica KarlssonAngered, born 1975.IF Metall (Industrial Union + Metalworkers), appointed 2005.Administrator.Holdings in Skanska: 0 shares.
Folmer KnudsenEslöv, born 1942.Swedish Building Workers’ Union, appointed 1992. Wood worker.Holdings in Skanska: 1,000 B shares.
Ann-Christin KutznerMalmö, born 1947.Swedish Union of Clerical and Technical Employees in Industry (SIF), appointed 2004.Human Resources Administrator.Holdings in Skanska: 248 B shares.
Gunnar LarssonKalix, born 1953.Union for Service and Communica-tion (SEKO), appointed 2002.Asphalt works operator.Holdings in Skanska: 116 B shares.
Arne MårtenssonDjursholm, born 1951.Elected 2001.Other directorships: Svenska Han-delsbanken (Chairman), Stockholm School of Economics Advisory Board (Chairman), Telefonaktiebolaget LM Ericsson (Deputy Chairman), Holmen, Industrivärden, Sandvik, Vin & Sprit, Svenska ICC, member of Business Council of World Economic Forum. Holdings in Skanska: 2,200 B shares.
Anders NyrénBromma, born 1954.Elected 2002.President and CEO of Industrivärden. Other directorships: Association of Exchange Listed Companies (Chair-man), Association for Generally Accepted Practices in the Securities Market (Chairman), Svenska Han-delsbanken (Vice Chairman), Indus-trivärden, Indutrade, Sandvik, SCA, SSAB, Ernström-gruppen and Center for Business and Policy Studies (SNS). Holdings in Skanska: 2,000 B shares.
Nils-Erik PetterssonHemmingsmark, born 1948.Swedish Association of Supervisors (LEDARNA), appointed 1998. Health and safety manager. Holdings in Skanska: 9 864 B shares.
Auditors KPMG Bohlins AB
Auditors in charge:
Caj NackstadStockholm, born 1945.Authorized Public Accountant.Auditor for Skanska since 2001.
Board of Directors
Anders NyrénArne Mårtensson Nils-Erik Pettersson
Sverker Martin-Löf Roger Flanagan Ulrika Francke Jane F. Garvey Stuart E. Graham Sören Gyll
Inge Johansson Finn Johnsson Jessica Karlsson Folmer Knudsen Ann-Christin Kutzner Gunnar Larsson
Bo
ard
of
Dir
ecto
rs

Skanska Annual Report 2005 135
Peter Gimbe CommunicationsBert-Ove Johansson PurchasingTor Krusell Human ResourcesAnders Lilja Investor RelationsEinar Lundgren Legal AffairsMats Moberg ReportingNoel Morrin SustainabilityStaffan Schéle Corporate FinancePeter Thompson Information TechnologyMariann Östansjö Controlling
Senior Vice Presidents, Group Staff Units
Presidents of business units
Geir Aarstad Skanska NorwayZdenek Burda Skanska Czech RepublicDavid Fison Skanska UKRoman Wieczorek Skanska PolandJuha Hetemäki Skanska FinlandSimon Hipperson Skanska Infrastructure DevelopmentRon Oakley Skanska USA Building
Anders Kupsu Skanska Residential Development Nordic Claes Larsson Skanska Commercial Development NordicSalvatore Mancini Skanska USA CivilJan-Gunnar Glave Skanska DenmarkGustavo Vago Skanska Latin AmericaMats Williamson Skanska SwedenFredrik Wirdenius Skanska Commercial Development Europe
Presidents of support unitsLars-Erik Alm Skanska Project SupportAnders Årling Skanska Financial Services
Tor KrusellSenior Vice President Human ResourcesBorn 1964.Joined Skanska in 1998.Holdings in Skanska:4,000 B shares.
Thomas AlmExecutive Vice PresidentBorn 1949.Joined Skanska in 1981.Responsible in the Senior Executive Team for Skanska UK, Skanska Latin America, Skanska International Proj-ects and Skanska Infrastruc-ture Development. Holdings in Skanska: 208 B shares.
Stuart E. Graham President and Chief Executive Officer Born 1946.Joined Skanska in 1990.Holdings in Skanska: 75,000 B shares.
Johan KarlströmExecutive Vice PresidentBorn 1957.Joined Skanska in 2001.Responsible in the Senior Executive Team for Skan-ska USA Building, Skanska USA Civil, Skanska Czech Republic.Holdings in Skanska: 40,000 B shares.
Hans Biörck Executive Vice President and Chief Financial Officer. Born 1951.Joined Skanska in 2001.Holdings in Skanska:50,000 B shares.
Johan BergmanExecutive Vice PresidentBorn 1964.Joined Skanska in 1990.Responsible in the Senior Executive Team for Skanska Poland, Skanska Residential Development Nordic, Skanska Commercial Development Nordic and Skanska Com-mercial Development Europe.Holdings in Skanska: 1,000 B shares.
Petter EikenExecutive Vice PresidentBorn 1955.Joined Skanska in 2001.Responsible in the Senior Executive Team for Skanska Sweden, Skanska Norway, Skanska Denmark och Skanska Finland.Holdings in Skanska:0 shares.
Sen
ior
Exec
uti
ve T
eam
Tor Krusell
Stuart E. Graham
Thomas Alm
Hans Biörck Johan Bergman
Johan KarlströmPetter Eiken
Senior Executive Team
Senior Execut ive Team

136 Skanska Annual Report 2005
Financial information The Skanska Group’s interim reports for
2006 will be published on the follow-
ing dates:
Three Month Report April 27, 2006
Six Month Report July 27, 2006
Nine Month Report November 2, 2006
Year-end Report February 15, 2007
Only the Annual Report will be printed
and distributed. The quarterly reports
will be available via Skanska’s website,
www.skanska.com, and can also be
ordered from Skanska AB, Investor
Relations.
In case of questions, please contact:
Skanska AB, Investor Relations
SE-169 83 Solna, Sweden
Telephone: +46 8 753 88 00
Fax: +46 8 730 41 69
E-mail: [email protected]
More information about the Skanska
Group is available at:
www.skanska.com
Annual Shareholders’ Meeting
More information about Skanska’s business streamsFurther information about Skanska’s Residential Develop-ment and Commercial Development business streams can be downloaded from Skanska’s website (www.skanska.com, click “Investors” followed by “Reports” and the name of each report. The reports can also be ordered in hard copy from Skanska AB, Investor Relations.
Annual Shareholders ´ Meet ing
An
nu
al S
har
eho
lder
s´ M
eeti
ng
The Annual Shareholders’ Meeting of Skanska AB will be held at 5:00 p.m. on Thursday, March 30, 2006 at the Rival Hotel, Maria -torget 3, Stockholm, Sweden.
Notification etc.Shareholders who wish to participate in the Annual Meeting must be listed in the print-out of the register of shareholders maintained by VPC (the Swedish Central Securities Depository and Clearing Organization) produced on March 24, 2006 and must notify Skan-ska no later than 12 noon on March 24, 2006 of their intention to participate in the Meeting. Shareholders whose shares have been registered in the name of a trustee must have temporarily re-registered their shares in their own name in the register of shareholders to be entitled to participate in the Meeting. Such re-registration should be request-ed well in advance of March 24, 2006 from the bank or brokerage house holding the shares in trust
Notification may be sent in writing to Skanska AB, Legal Affairs, SE-169 83 Solna, Sweden; by telephone to +46 8 753 88 14 (between 10 a.m. and 4 p.m. CET); by fax to +46 8 753 37 52; by e-mail to [email protected]; or via Skanska’s website: www.skanska.com. The notification must state the shareholder’s name, national registration or corporate ID number, address and telephone number. If participation is authorized by proxy, this must be sent to the Company before the Meeting. Shareholders who have duly notified the Company of their participation will receive an admittance card, which should be brought and shown at the Meeting venue.
DividendFor 2005, the Board of Directors proposes a dividend of SEK 4.50 and an extra dividend of SEK 2.00 per share to the shareholders. The Board proposes April 4, 2006 as the record date to qualify for the dividend. Provided that the Meeting approves this proposal, the dividend is expected to be mailed by VPC on April 7, 2006.
WorldwideThe Skanska Group publishes the magazine Worldwide, containing
features and news items from the Group’s operations around the world. The magazine appears in English four times per year. A subscription is free of charge and can be ordered at the following address:Skanska Worldwide c/o Strömberg DistributionSE-120 88 Stockholm, SwedenTelephone: +46 8 449 88 00, Fax: +46 8 449 88 10 E-mail: [email protected]
The HubThe Hub is a news service that offers personalized news about Skanska, its competitors and its industry. It provides brief, fast news items, often linked to addi-tional information on the Internet. You can subscribe to receive them via e-mail, mobile phone (SMS) or fax. They are available in English and Swedish. You can subscribe via The Hub’s website: www.skanska.com/thehub
More information about Skanska
the world. The magazine appears in English four times per year. A subscription is free of charge and can be ordered at the following address:Skanska Worldwide c/o Strömberg DistributionSE-120 88 Stockholm, SwedenTelephone: +46 8 449 88 00, Fax: +46 8 449 88 10 E-mail: [email protected]

Skanska Annual Report 2005 137
Abbreviations and definitions
Abbreviations
GDP Gross domestic product
ORA Operational Risk Assessment (Skanska’s risk management model)
PFI Private Finance Initiative (Privately financed infrastructure projects)
PPP Public Private Partnership (Privately financed infrastructure projects)
SET Senior Executive Team (Skanska’s corporate management team)
SFS Skanska Financial Services
DefinitionsAverage capital employed Calculated on the basis of five measuring points: half of capital employed on January 1 plus capital employed at the end of the first, second and third quarters plus half of capital employed at year-end, divided by four.
Capital employed in Total assets minus tax receivables in deposits in Skanska’s treasury unit minus non-interest-bearing business streams,markets liabilities minus provisions for taxes and tax liabilities.and business units/reporting units
Consolidated capital employed Total assets minus non-interest-bearing liabilities.
Consolidated operating cash flow In the consolidated operating cash flow statement, which includes taxes paid, investments are recognized both in cash flow from business operations and in cash flow from strategic investments. See also Note 36.
Consolidated return on Operating income plus financial income as a percentage of average capital employed.capital employed
Debt/equity ratio Interest-bearing net debt divided by visible equity including minority interest.
Earnings per share Profit for the year attributable to equity holders divided by the average number of shares.
Equity/assets ratio Visible equity including minority interest as a percentage of total assets.
Equity per share Visible equity attributable to equity holders divided by the number of shares. 3
Interest-bearing net receivable Interest-bearing assets minus interest-bearing liabilities.
Interest cover Operating income and financial income plus depreciation/amortization divided by net interest items.
Net working capital Net non-interest-bearing receivables and liabilities including taxes.
Operating cash flow Cash flow from operations before taxes and before financial activities. See also Note 36.
Operating net on properties Rental income and interest subsidies minus operating, maintenance and administrative expenses as well as real estate tax. Site leasehold rent is included in operating costs.
Return on capital employed in Operating income plus financial income minus interest income from Skanska’s treasury unit andbusiness streams, markets and other financial items as a percentage of average capital employed.business/reporting units
Return on equity Profit attributable to equity holders as a percentage of average visible equity attributable to equity holders.
Yield on properties Operating net divided by year-end book value.
Abbreviat ions and def in it ions
Ab
bre
viat
ion
s an
d d
efin
tio
ns


Production: Skanska AB, Investor Relations in collaboration with Addira, Enell and Suscom. Translated by: Victor Kayfetz, Scan Edit, Oakland, CA.Printed by: Arkpressen, Västerås, Sweden, 2006.
Addresses
Skanska ABSE-169 83 SolnaSwedenStreet address: Råsundavägen 2Tel: +46 8 753 88 00Fax: +46 8 755 12 56
Skanska SwedenSE-169 83 SolnaSwedenStreet address: Råsundavägen 2Tel: +46 8 504 350 00 Fax: +46 8 755 63 17Kundtjänst: 020-30 30 40www.skanska.se
Skanska NorwayPostbox 1175 SentrumNO-0107 OsloNorwayStreet address: Drammensveien 60Tel: +47 40 00 64 00 Fax: +47 23 27 17 30 www.skanska.no
Skanska DenmarkBaltorpvej 158DK-2750 BallerupDenmarkTel: +45 44 77 99 99 Fax: +45 44 77 98 99www.skanska.dk
Skanska FinlandP.O.Box 114FI-00101 HelsinkiFinlandStreet address: Paciuksenkatu 25Tel: +358 9 6152 21 Fax: +358 9 6152 2271 www.skanska.fi
Skanska Poland Gen. J. Zajaczka 9PL-01-518 WarsawPolandTel: +48 22 561 3000Fax: +48 22 561 3001www.skanska.pl
Skanska Czech Republic Kubánské námesti 1391/11CZ-100 05 Prague 10 Czech RepublicTel: +420 2 67 310 476Fax: +420 2 67 310 644www.skanska.cz
Skanska UK Maple Cross HouseDenham Way, Maple CrossRickmansworthHertfordshire WD3 9SWUnited KingdomTel: +44 1923 776 666 Fax: +44 1923 423 900www.skanska.co.uk
Skanska USA Building1633 Littleton RoadParsippany, NJ 07054U.S.A.Tel: +1 973 656 65 00Fax: +1 973 334 5376www.skanskausa.com
Skanska USA Civil16-16 Whitestone ExpresswayWhitestone NY 11357 U.S.A.Tel: +1 718 747 34 54 Fax: +1 718 747 34 58 www.usacivil.skanska.com
Skanska Latin AmericaAv. Pte. Roque S. Peña 555-8 Piso(C1035AAA) Buenos AiresArgentina Tel: +54 11 4341 7000 Fax: +54 11 4341 7503 www.skanska.com.ar
Skanska Residential Development NordicSE-169 83 SolnaSwedenStreet address: Råsundavägen 2Tel: +46 8 504 350 00 Fax: +46 8 504 361 99www.skanska.com/residentialnordic
Skanska InternationalSE-169 83 SolnaSwedenStreet address: Råsundavägen 2Tel: +46 8 504 350 00Fax: +46 8 504 361 99www.skanska.com/residentialnordic
Skanska Commercial Development NordicSE-169 83 SolnaSwedenStreet address: Råsundavägen 2Tel: +46 8 504 350 00 Fax: +46 8 504 361 99www.skanska.se/fastigheter
Skanska Commercial Development EuropeSE-169 83 SolnaSwedenStreet address: Råsundavägen 2Tel: +46 8 504 350 00 Fax: +46 8 504 361 99www.skanska.com/property
Skanska Infrastructure DevelopmentSE-169 83 SolnaSwedenStreet address: Råsundavägen 2Tel: +46 8 504 350 00 Fax +46 8 755 13 96www.skanska.com/id
Skanska Financial ServicesSE-169 83 SolnaSwedenStreet address: Råsundavägen 2Tel: +46 8 504 350 00 Fax: +46 8 753 18 52
Skanska Project SupportSE-169 83 SolnaSwedenStreet address: Råsundavägen 2Tel: +46 8 504 350 00Fax: +46 8 753 48 42www.skanska.com/projectsupport
For other addresses:www.skanska.com
Contents 1 n Business streams and organization
2 n Comments by the President and CEO
4 n Mission, vision, goals and strategy
7 n Financial targets
8 n Construction
16 n Residential Development
23 n Commercial Development
30 n Infrastructure Development
38 n Sustainable development
40 n Environmental management
42 n Social responsibility
43 n Economic progress
44 n Management development
45 n Risk management
48 n Share data
50 n Report of the Directors
58 n Consolidated income statement
59 n Consolidated balance sheet
60 n Consolidated statement of recognized
income and expenses
61 n Consolidated cash flow statement
62 n Parent Company income statement
63 n Parent Company cash flow statement
64 n Parent Company balance sheet
64 n Parent Company changes in equity
65 n Notes including accounting and
valuation principles
130 n Proposed allocation of earnings
131 n Auditors’ Report
132 n Corporate governance report
134 n Board of Directors
135 n Senior Executive Team
136 n Annual Shareholders´ Meeting
136 n More information about Skanska
137 n Abbreviations and definitions
Cover:The Cooper River Bridge in South Carolina is the longest cable-stay bridge in North America.
This document is in all respects a translation of the Swedish original Annual Report. In the event of any differences between this translation and the Swedish original, the latter shall prevail.
��������������������������������
�������������������������������������
���� ���� ����
���������������������������������������
��
��
�
�
�
�
�
��
������������������������
���� ������
�������������������������������
������������������������������������
���� ���� ����
������������������������
���� �����
��
���
����������������������
�������������������������������������
��
��
�
�
�
�
�
��
• Revenue in 2005 amounted to SEK 124.7 billion.
• Skanska Group operating income totaled SEK 5.0 billion, and after-tax profit was SEK 3.9 billion. Earnings per share amounted to SEK 9.27. The Board of Directors is proposing a regular dividend of SEK 4.50 and an extra dividend of SEK 2.00 per share for 2005.
• Operating margins rose in most Construction business units. This improvement was a result of greater focus on quality in project implementation and a stricter risk management and selection process. Sweden, Norway, the United Kingdom and Latin Ameri-can have already achieved their “Outperform” targets for 2007.
• Skanska sold a number of properties in Warsaw, Budapest, Stockholm, Copenhagen and elsewhere. Divestment volume totaled SEK 4.4 billion, with capital gains of SEK 1.6 billion. Sale prices exceeded estimated market values by an average of 11 percent.
• Year-end market appraisals indicate unrealized development gains of SEK 1.9 billion in Commercial Development and SEK 2.7 billion in Infrastructure Development.
• Skanska will develop, build and manage rental apartments in Sweden for its own account. The Group will respond to heavier demand for reasonably priced rental housing by industrializing its construction process and streamlining purchases. A new company, Skanska Hyresbostäder, will enable the Group to build about 1,000 rental apartments per year.
• Skanska’s successful development of housing units for sale in Sweden, Norway, Finland and the Czech Republic is now also expanding to Denmark. The main focus will be on the Copen-hagen and Århus regions, where the demand and population base are the largest.
HIGHLIGHTS
SEK M EUR M
Revenue 124,667 13,434
Operating income 5,000 539
Income after financial items 5,120 552
Earnings per share, SEK/EUR 9.27 1.00
Return on equity, % 22.4 22.4
Return on capital employed, % 23.3 23.3
Order bookings1 116,553 12,559
Order backlog1 128,572 13,692
1 Refers to Construction operations.
Skanska 2005

SKANSKA ANNUAL REPORT 2005
SK
AN
SKA
AN
NU
AL
REP
OR
T 2
00
5


