31
Slide 1 Overview of Lithgow Labour Market This is a presentation given by Ivan Neville, Branch Manager Labour Market Research and Analysis Branch on 13 April 2015 to the Local Council.

Slide 1 Overview of Lithgow Labour Market
This is a presentation given by Ivan Neville, Branch Manager Labour Market Research and Analysis Branch on 13 April 2015 to the Local Council.

Slide 2 Windamere
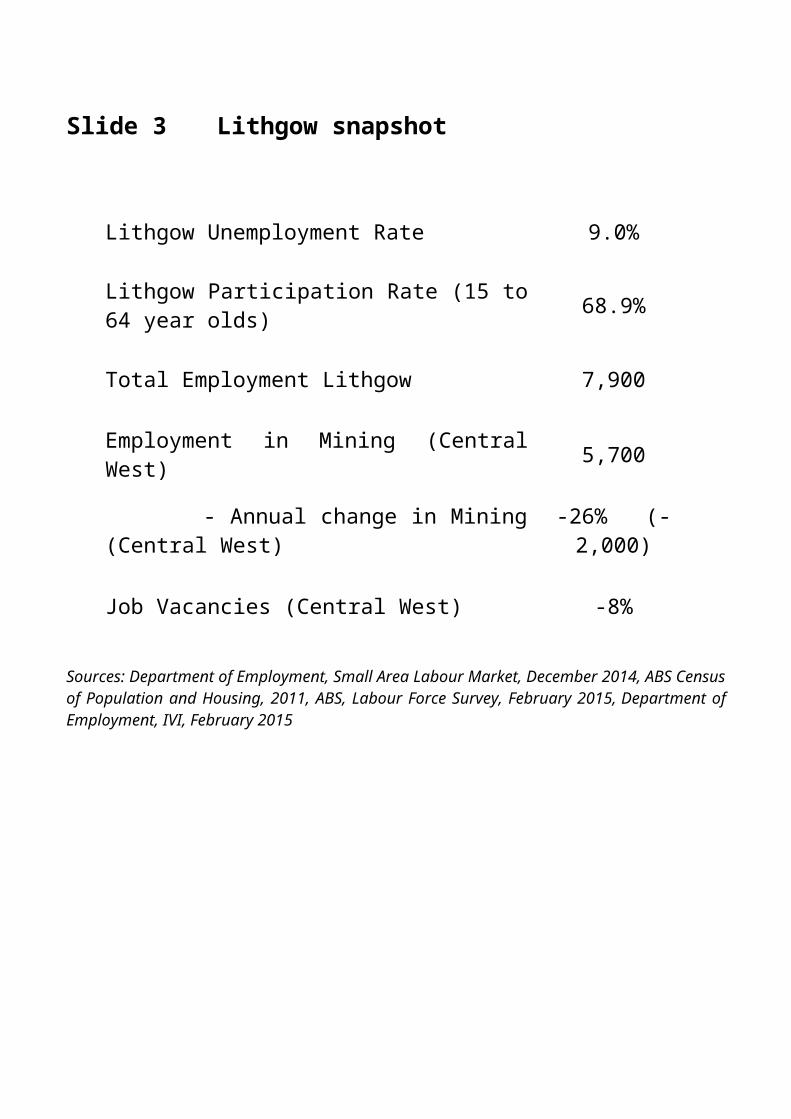
Slide 3 Lithgow snapshot
Lithgow Unemployment Rate 9.0%
Lithgow Participation Rate (15 to 64 year olds) 68.9%
Total Employment Lithgow 7,900
Employment in Mining (Central West) 5,700
- Annual change in Mining (Central West) -26% (-2,000)
Job Vacancies (Central West) -8%
Sources: Department of Employment, Small Area Labour Market, December 2014, ABS Census of Population and Housing, 2011, ABS, Labour Force Survey, February 2015, Department of Employment, IVI, February 2015
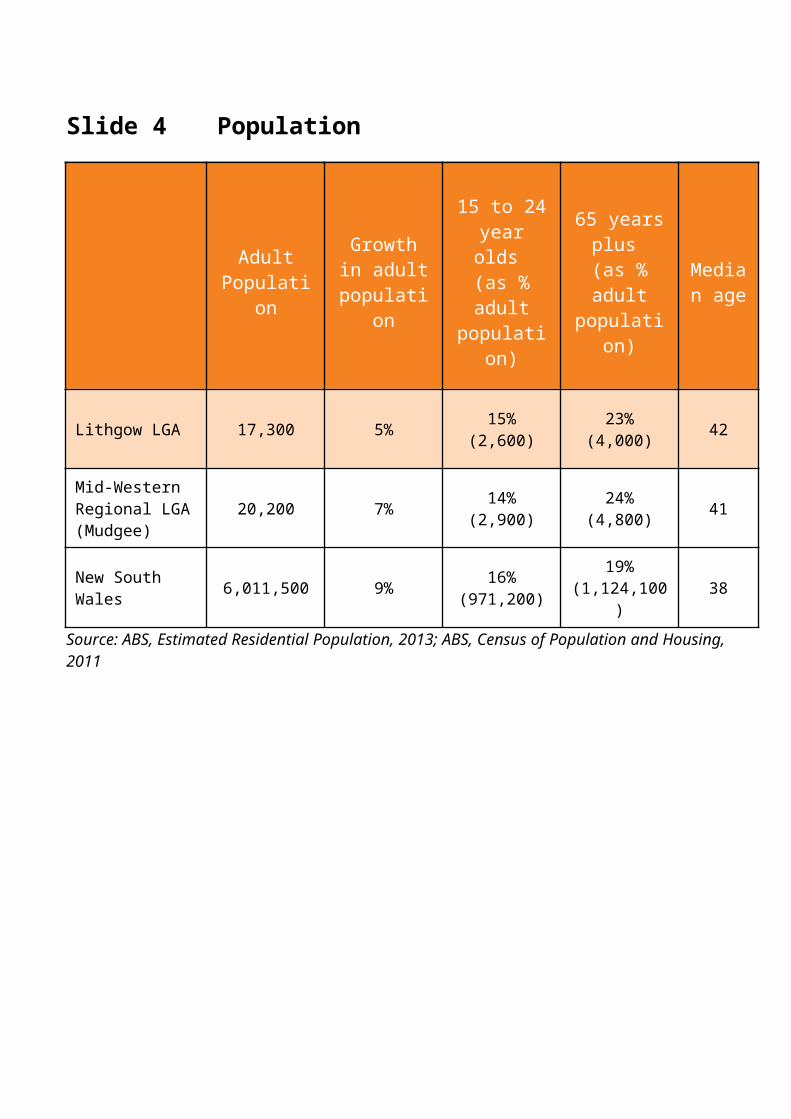
Slide 4 Population
Adult Population
Growth in adult
population
15 to 24 year olds
(as % adult population)
65 years plus
(as % adult population)
Median age
Lithgow LGA 17,300 5% 15%(2,600)
23%(4,000) 42
Mid-Western Regional LGA (Mudgee)
20,200 7% 14%(2,900)
24%(4,800) 41
New South Wales 6,011,500 9% 16%(971,200)
19%(1,124,100) 38
Source: ABS, Estimated Residential Population, 2013; ABS, Census of Population and Housing, 2011
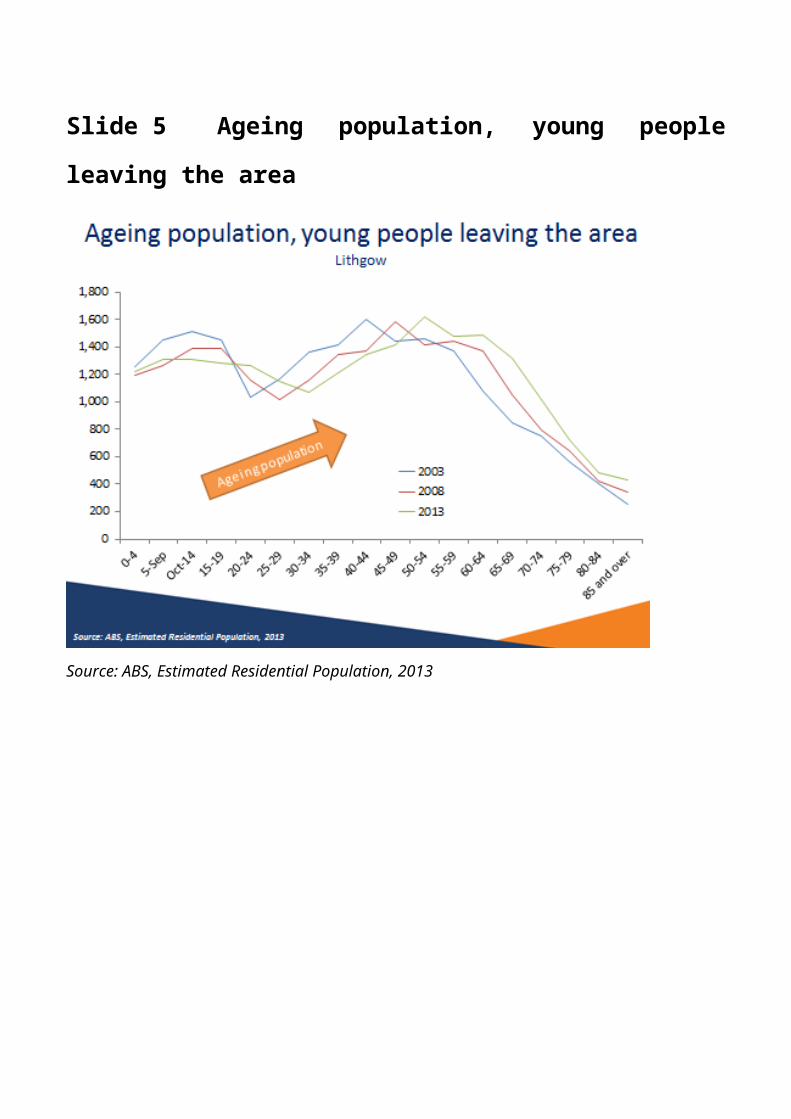
Slide 5 Ageing population, young people leaving the area
Source: ABS, Estimated Residential Population, 2013

Slide 6 Unemployment remains high
Region
Unemployment rate
December2013
December2014
Lithgow (township only) 11.6% 10.2%
Lithgow Region (excl township) 7.2% 7.3%
Lithgow LGA 9.8% 9.0%
New South Wales(February 2015 seasonally adjusted) 5.9% 6.0%
Source: Department of Employment, Small Area Labour Markets, December 2014

Slide 7 Where do people work?
Source: ABS, Labour Force Survey, November Quarter 2014, 4 Quarter Average
The largest employing industry in the Central West region was Agriculture, Forestry and Fishing, which employs 14 per cent of the adult population. This was followed by the Health Care and Social Assistance industry (11 per cent) and the Retail Trade industry (9 per cent).

Slide 8 Employment growth for largest industries Central West
2004-2014
Source: ABS, Labour Force Survey, February Quarter 2015, 4 Quarter Average
Employment in Transport, Postal and Warehousing increased by 2,000 in the 12 months to February 2015 , this was followed by Rental, Hiring and Real Estate Services (800) and Electricity, Gas, Water and Waste Services (500).
It should be noted that since February 2014 the Mining industry in the Central West SA4 now employs 2,000 fewer people.
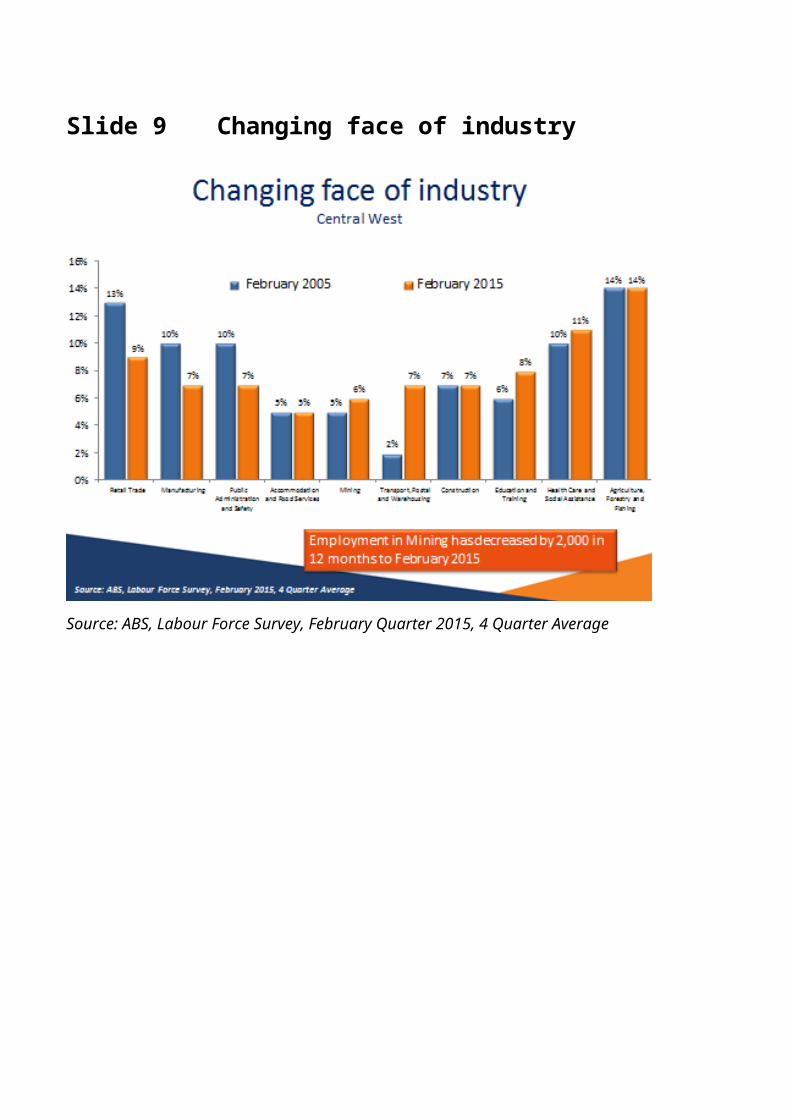
Slide 9 Changing face of industry
Source: ABS, Labour Force Survey, February Quarter 2015, 4 Quarter Average

Slide 10 Internet vacancies declining
Source: Department of Employment, Vacancy Report, December 2014 (three month moving average)

Slide 11 Although employment is expected to pick up, mining
will only have modest growth
Source: Department of Employment, Projections to November 2018
The Health Care and Social Assistance industry is projected to create 1,800 jobs in the Central West Regional in the next five years to November 2018. This is followed by Education and Training (1,200) and Accommodation and Food Services (1,000).
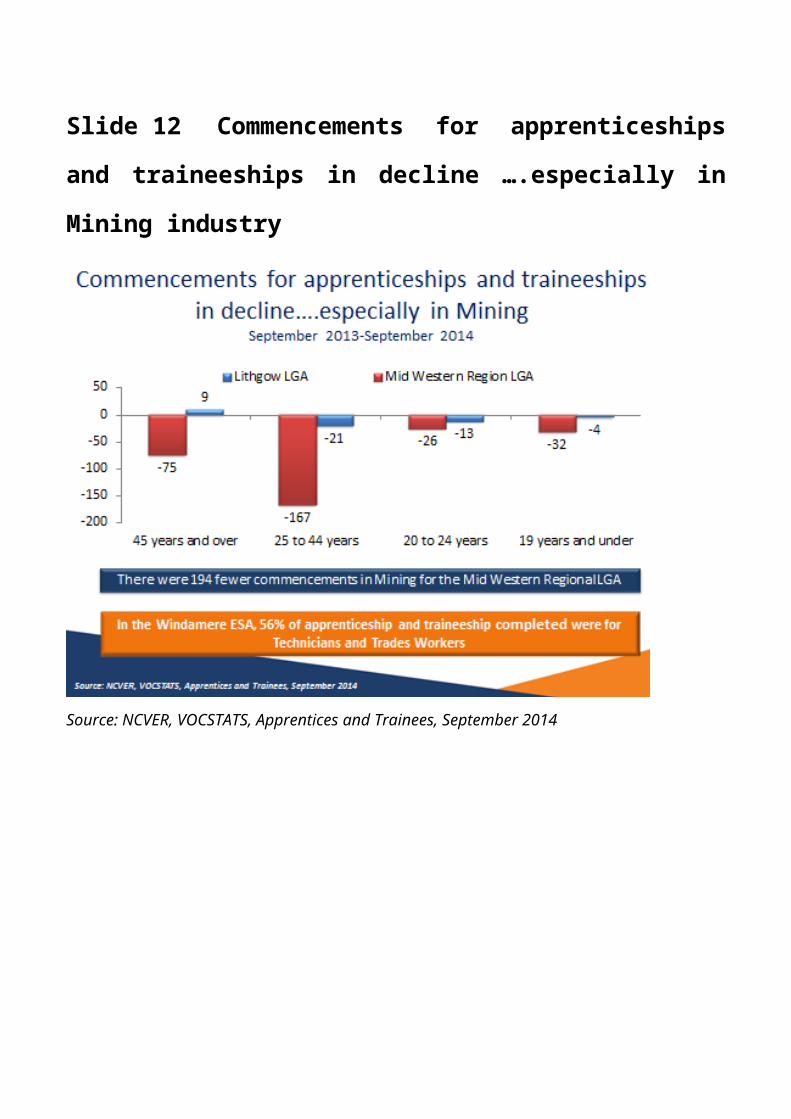
Slide 12 Commencements for apprenticeships and traineeships
in decline ….especially in Mining industry
Source: NCVER, VOCSTATS, Apprentices and Trainees, September 2014

Helping workers transition from one job to another
Slide 14 A prime aged male workforce in Mining
Source: ABS, Labour Force Survey, February 2015 (4 quarter averages)

Slide 15 There may be challenges transitioning out of mining
Source: ABS, Census of Population and Housing, 2011
This slide highlights some of the challenges ex-mining workers in Lithgow may face when attempting to transitional to new employment. Although Hospitality Workers and Personal Carers and Assistants are among the occupations which have grown the most from 2006 to 2011, they will generally offer a lower salary and fewer hours per week than occupations in the mining industry.

Slide 16 Workers may need to think about jobs outside of their
local area
Source: ABS, Census of Population and Housing, 2011
According to the 2011 Census, only 10 per cent of the people who live in Windamere travel outside the region for employment.
Residents of The Windamere ESA may need to consider opportunities in surrounding large labour markets. For example in the Bathurst Regional LGA (15,200 employed people) and Orange LGA (17,300 employed people).
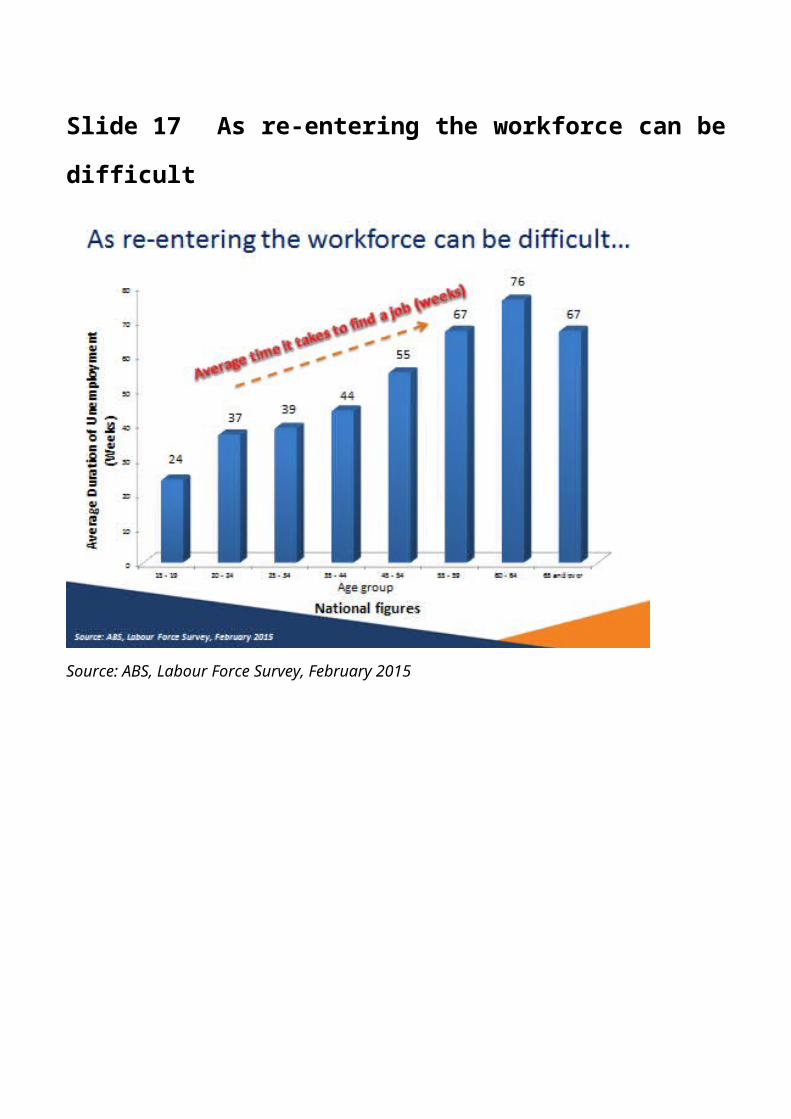
Slide 17 As re-entering the workforce can be difficult
Source: ABS, Labour Force Survey, February 2015
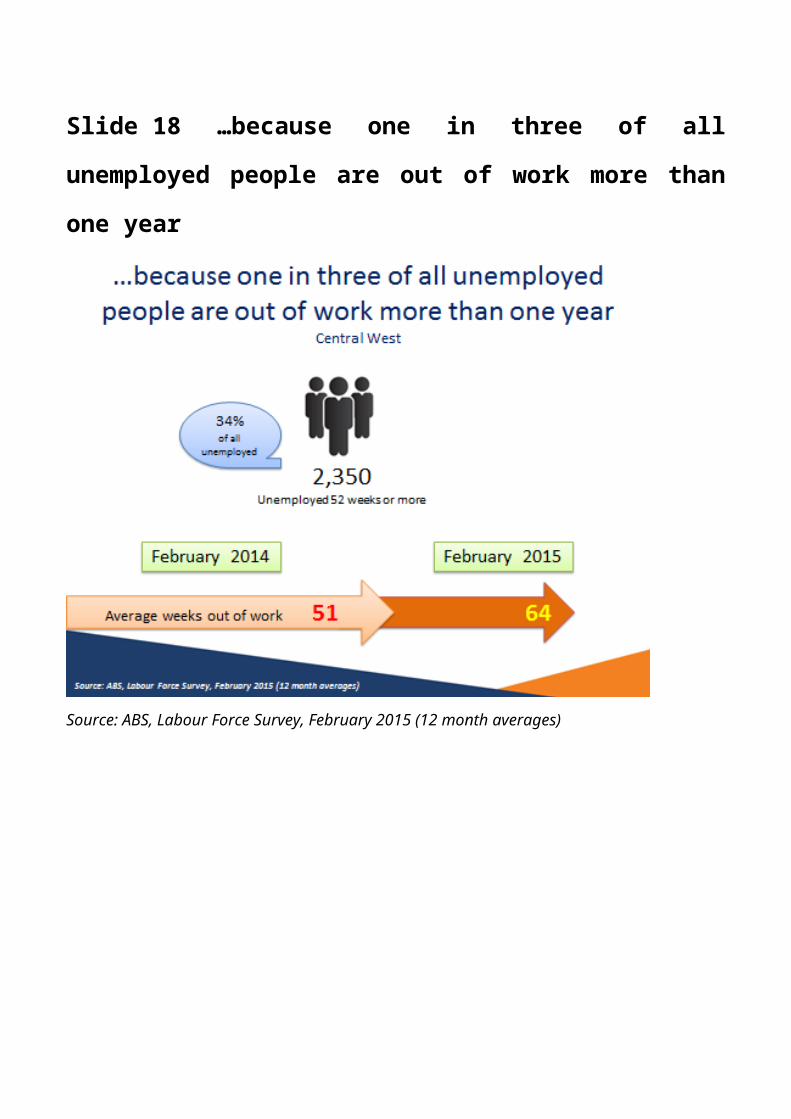
Slide 18 …because one in three of all unemployed people are
out of work more than one year
Source: ABS, Labour Force Survey, February 2015 (12 month averages)

Slide 19 …and because most people do not complete year 12…
RegionCompleted
Year 12(2011)
Highest non-school qualification
Advanced Diploma,
Diploma or
Certificate III & IV
Attained Bachelor
Degree or Higher
Lithgow LGA 45% 42% 12%
Mid-Western Regional LGA (Mudgee) 56% 42% 17%
New South Wales 75% 29% 37%
Source: ABS, Census of Population and Housing, 2011
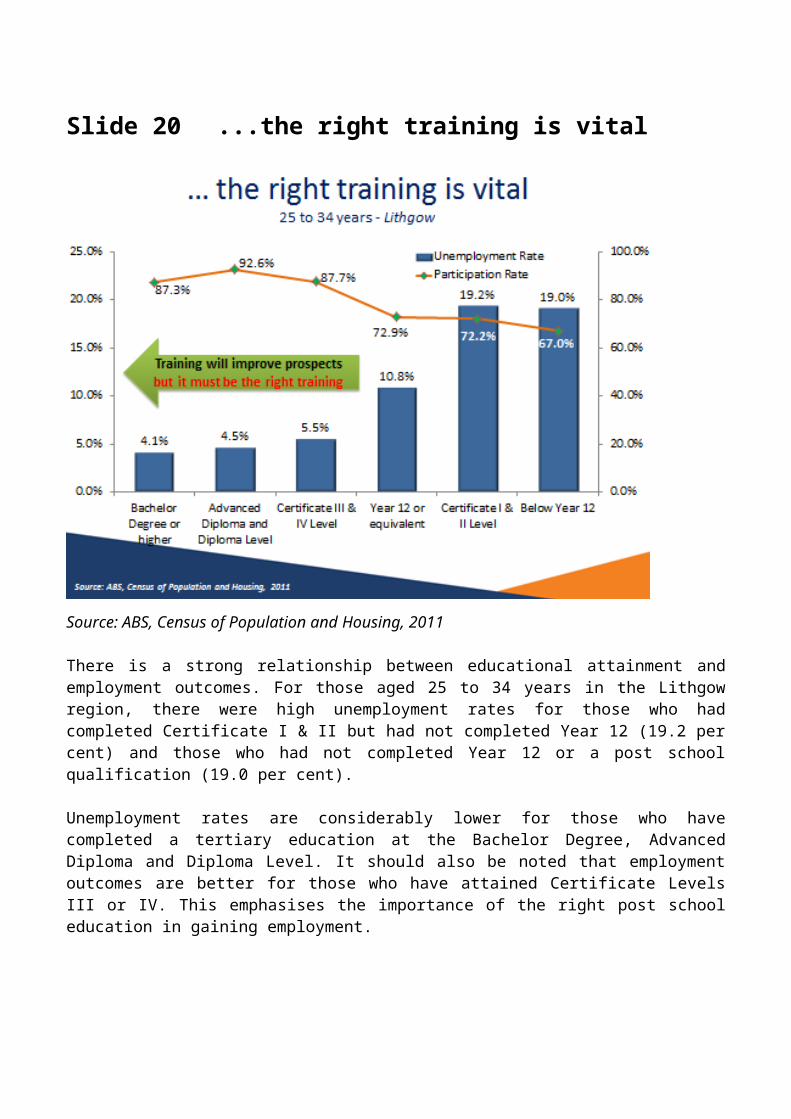
Slide 20 ...the right training is vital
Source: ABS, Census of Population and Housing, 2011
There is a strong relationship between educational attainment and employment outcomes. For those aged 25 to 34 years in the Lithgow region, there were high unemployment rates for those who had completed Certificate I & II but had not completed Year 12 (19.2 per cent) and those who had not completed Year 12 or a post school qualification (19.0 per cent).
Unemployment rates are considerably lower for those who have completed a tertiary education at the Bachelor Degree, Advanced Diploma and Diploma Level. It should also be noted that employment outcomes are better for those who have attained Certificate Levels III or IV. This emphasises the importance of the right post school education in gaining employment.

Slide 21 Youth disengagement is a concern
Source: ABS, Census of Population and Housing, 2011
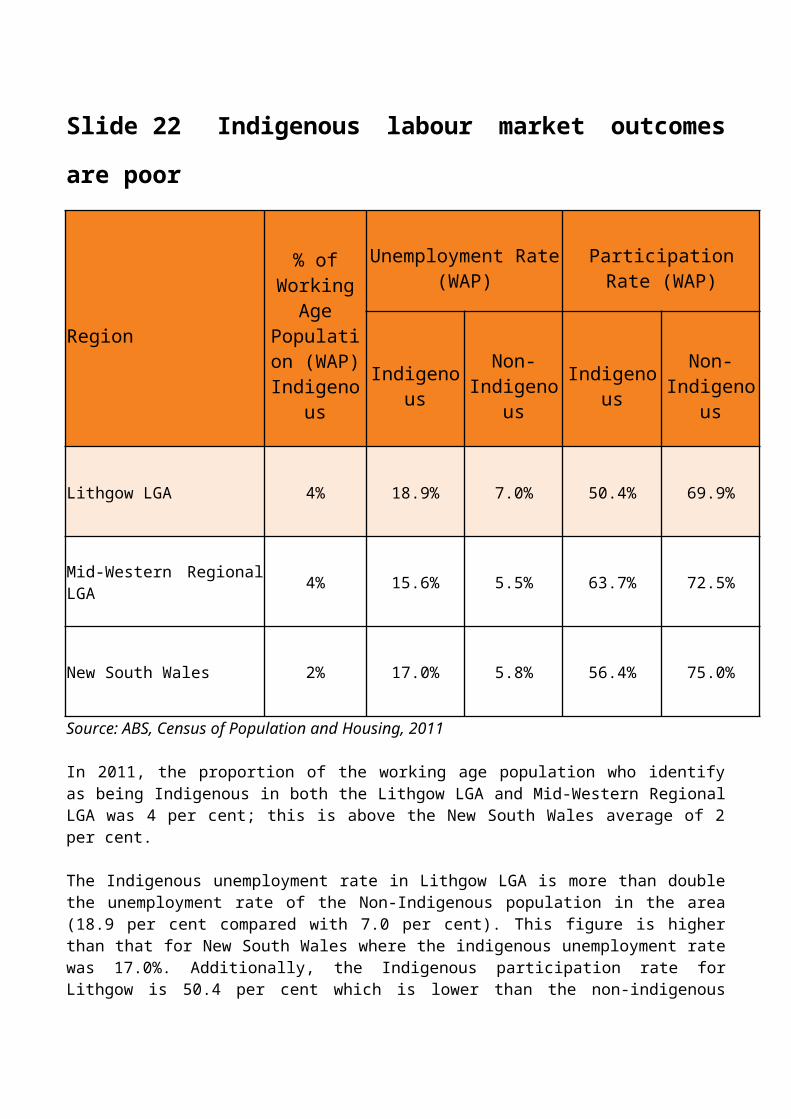
Slide 22 Indigenous labour market outcomes are poor
Region
% of Working Age Population
(WAP) Indigenous
Unemployment Rate (WAP) Participation Rate (WAP)
Indigenous Non-Indigenous Indigenous Non-
Indigenous
Lithgow LGA 4% 18.9% 7.0% 50.4% 69.9%
Mid-Western Regional LGA 4% 15.6% 5.5% 63.7% 72.5%
New South Wales 2% 17.0% 5.8% 56.4% 75.0%
Source: ABS, Census of Population and Housing, 2011
In 2011, the proportion of the working age population who identify as being Indigenous in both the Lithgow LGA and Mid-Western Regional LGA was 4 per cent; this is above the New South Wales average of 2 per cent.
The Indigenous unemployment rate in Lithgow LGA is more than double the unemployment rate of the Non-Indigenous population in the area (18.9 per cent compared with 7.0 per cent). This figure is higher than that for New South Wales where the indigenous unemployment rate was 17.0%. Additionally, the Indigenous participation rate for Lithgow is 50.4 per cent which is lower than the non-indigenous portion of the population (69.9 per cent). This is also lower than the New South Wales figure of 56.4 per cent.

Slide 23 Many not getting an interview due to lack of
experience and other reasons
Source: Department of Employment, Survey of Employers’ Recruitment Experiences, All regions surveyed to December 2014
The most common reason given by employers as to why they didn’t give an applicant an interview was lack of relevant work experience (51 per cent). This was followed by insufficient qualifications or training (21 per cent).

Slide 24 …So help will be needed transitioning from one job to
another

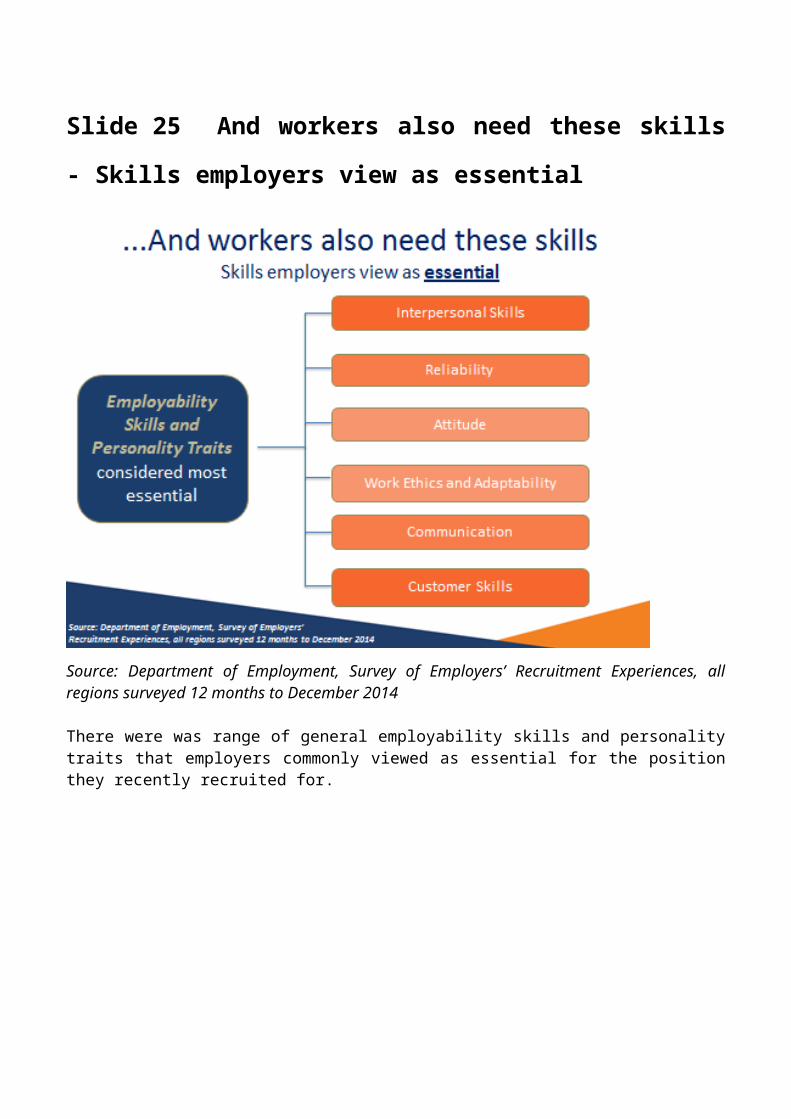
Slide 25 And workers also need these skills - Skills employers
view as essential
Source: Department of Employment, Survey of Employers’ Recruitment Experiences, all regions surveyed 12 months to December 2014
There were was range of general employability skills and personality traits that employers commonly viewed as essential for the position they recently recruited for.
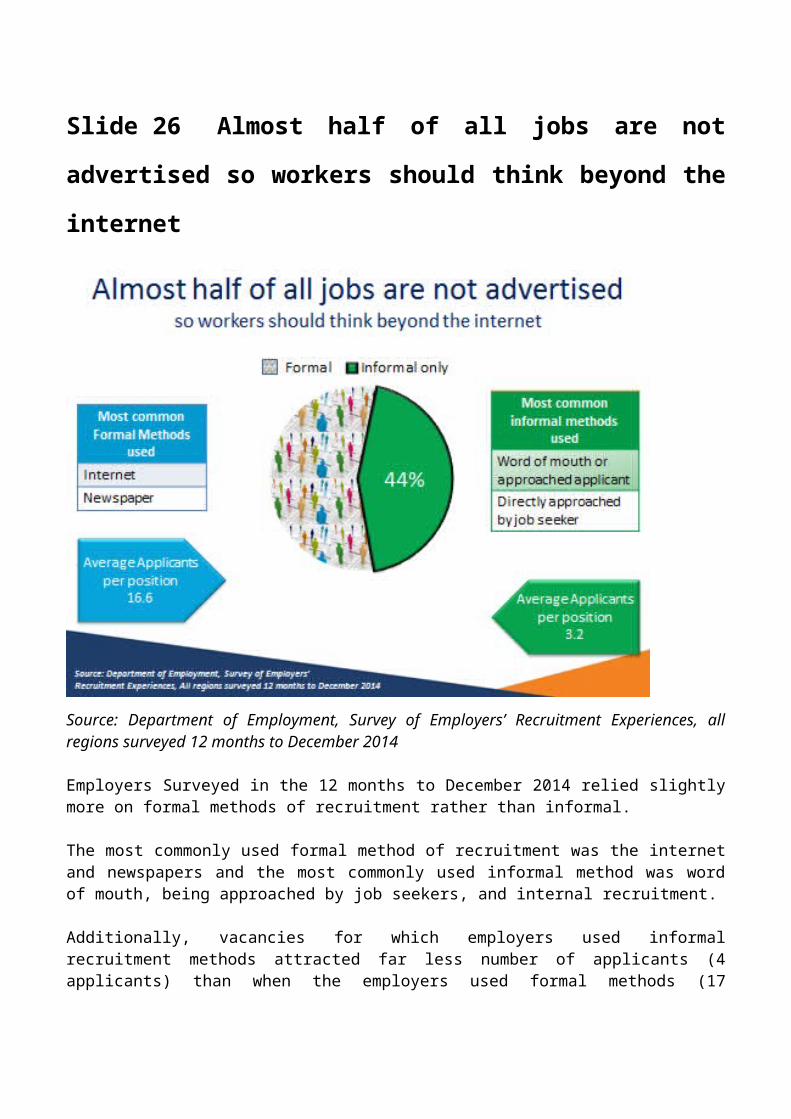
Slide 26 Almost half of all jobs are not advertised so workers
should think beyond the internet
Source: Department of Employment, Survey of Employers’ Recruitment Experiences, all regions surveyed 12 months to December 2014
Employers Surveyed in the 12 months to December 2014 relied slightly more on formal methods of recruitment rather than informal.
The most commonly used formal method of recruitment was the internet and newspapers and the most commonly used informal method was word of mouth, being approached by job seekers, and internal recruitment.
Additionally, vacancies for which employers used informal recruitment methods attracted far less number of applicants (4 applicants) than when the employers used formal methods (17 applicants). This highlights the value of job seekers actively approaching employers when looking for work.
Slide 27 Final recap - What workers need to do in order to
move on?

Slide 28 Conclusion
Challenges facing the region and Lithgow Council• Rising unemployment• Length of time searching for work between jobs getting longer• High reliance on mining for jobs – redundancies• High youth unemployment and many young people not finishing Year 12• Many young people leaving the area
Opportunities• Projected jobs growth in industries that employ lower to medium skilled occupations• Less competition for vacancies if approach employer directly
Council may need to consider how the region can help workers facing retrenchment• Retraining needs to match areas of employment growth• Is the Mining industry a long term option? Decreasing labour force and short careers• Other industries as a career choice, such as Health as a strong growth industry• Workers expecting to be made redundant need to prepare themselves early • Retrenched workers may need to look outside of local area for employment
Ongoing collaboration amongst key stakeholders and Council

Slide 29 Tools to assist job seekers
The Department of Employment has many tools to assist people with transitioning into the work force or into another job.

Slide 30
If you have any questions about the presentation please contact the Employer Surveys Section or Recruitment Analysis Section on:
Tel: 1800 059 439 or Email: [email protected]


