Small Angle Neutron Scattering Part2 Dr. Richard Heenan ISIS Facility, Rutherford Appleton Laboratory, England [email protected]SANS Instrumentation - How to do an experiment – just in case you do one !
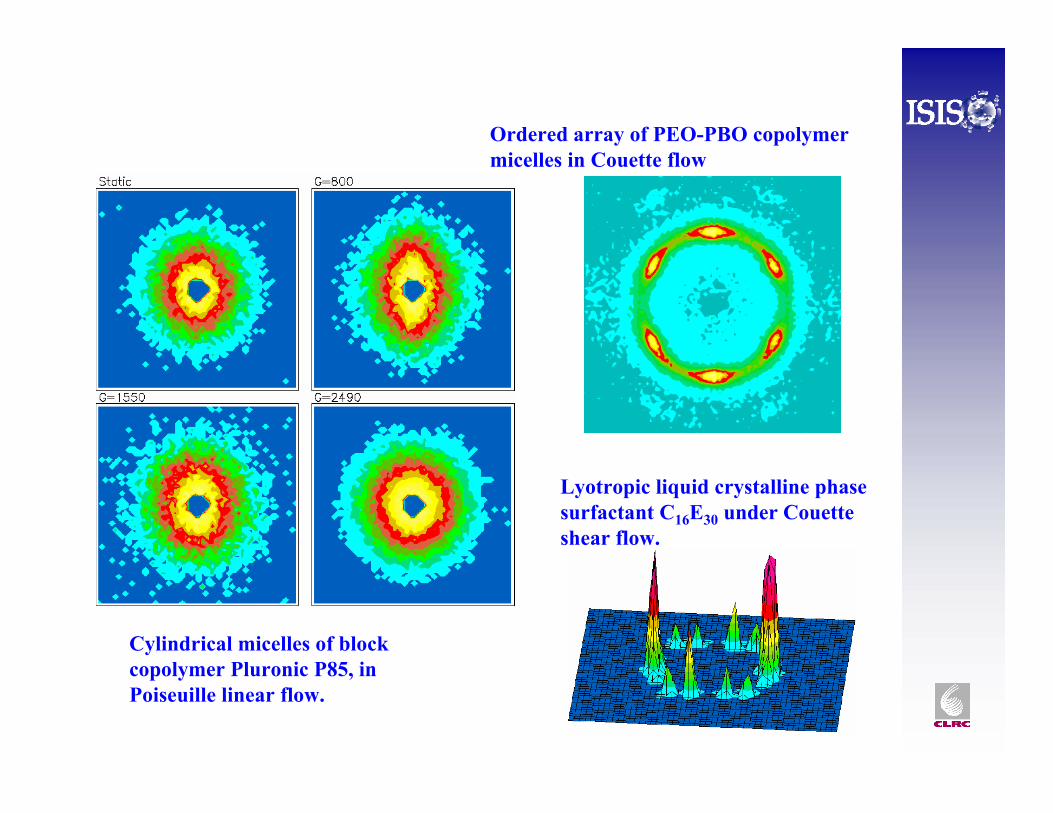
Very long thin rods, nonionic surfactant micelles, oriented mostly horizontally. The vertical pattern gives the rod diameter, the horizontal give information on the rod length and flexibility.
E90B10 30% Shear ( I.Hamley et.al.)
Concentrated block copolymer micelles in a “crystalline” lattice.
Lyotropic liquid crystalline phase surfactant C16E30 under Couetteshear flow.
Cylindrical micelles of block copolymer Pluronic P85, in Poiseuille linear flow.
Ordered array of PEO-PBO copolymer micelles in Couette flow
“Sheffield” high temp Couette cell
Sample
15 mm sapphire windows
Hydraulicpiston
LOQ - 1.6 kBar sapphire window Pressure Cell
Piston position sensor
Pressure & temp sensor
StirrerWater jacket
• Operational range 1.6 kBar (25ºC), 1.2kBar (120ºC)
• Choice of 15mm sapphire windows, in Au plated Ti ring, gives 1mm to 5mm path length, with 12mm beam, & can see phase separation!
• Sample volume ~ 4.7 to 2.5 ml (piston up / down) at 1mm path ~ 6.8 to 4.6 ml (piston up / down) at 3mm
• Temperature control by water jackets or electrical heaters.
• Designed to fit 100mm bore He cryostat for ~ -40ºC, not tested.
• Organic solvents & water - Viton seals, Rulon on piston.
• CO2 - tricky at high temperatures & pressures, has been to 600 bar, 60ºC, further tests in progress.
LOQ Pressure Cell - parameters
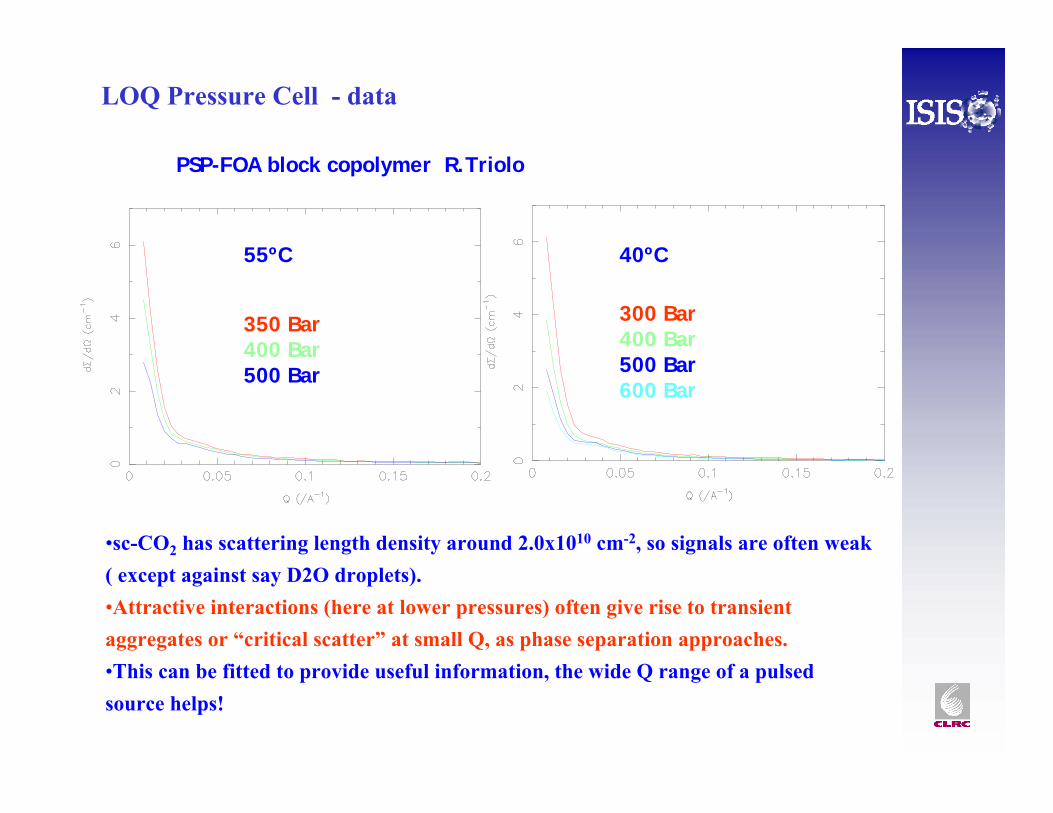
LOQ Pressure Cell - data
PSP-FOA block copolymer R.Triolo
55ºC 40ºC
300 Bar400 Bar500 Bar600 Bar
350 Bar400 Bar500 Bar
•sc-CO2 has scattering length density around 2.0x1010 cm-2, so signals are often weak ( except against say D2O droplets). •Attractive interactions (here at lower pressures) often give rise to transient aggregates or “critical scatter” at small Q, as phase separation approaches. •This can be fitted to provide useful information, the wide Q range of a pulsed source helps!
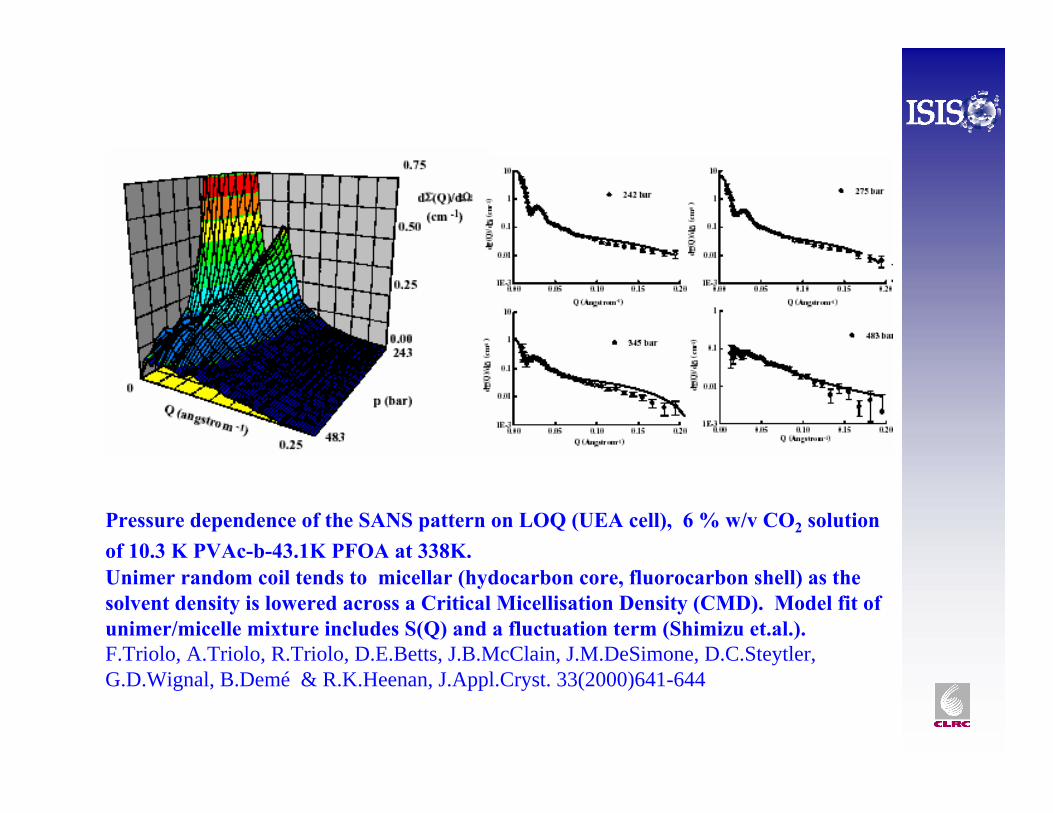
Pressure dependence of the SANS pattern on LOQ (UEA cell), 6 % w/v CO2 solution of 10.3 K PVAc-b-43.1K PFOA at 338K. Unimer random coil tends to micellar (hydocarbon core, fluorocarbon shell) as the solvent density is lowered across a Critical Micellisation Density (CMD). Model fit of unimer/micelle mixture includes S(Q) and a fluctuation term (Shimizu et.al.).F.Triolo, A.Triolo, R.Triolo, D.E.Betts, J.B.McClain, J.M.DeSimone, D.C.Steytler, G.D.Wignal, B.Demé & R.K.Heenan, J.Appl.Cryst. 33(2000)641-644
Other Sample Environment on LOQ
Standard ISIS furnaces, helium cryostats, or CCR’s to heat or cool samples, using a “Tomkinson flange”.
(See www.ISIS.rl.ac.uk )
Goudsmit magnet - up to 2T
LOQ data reduction
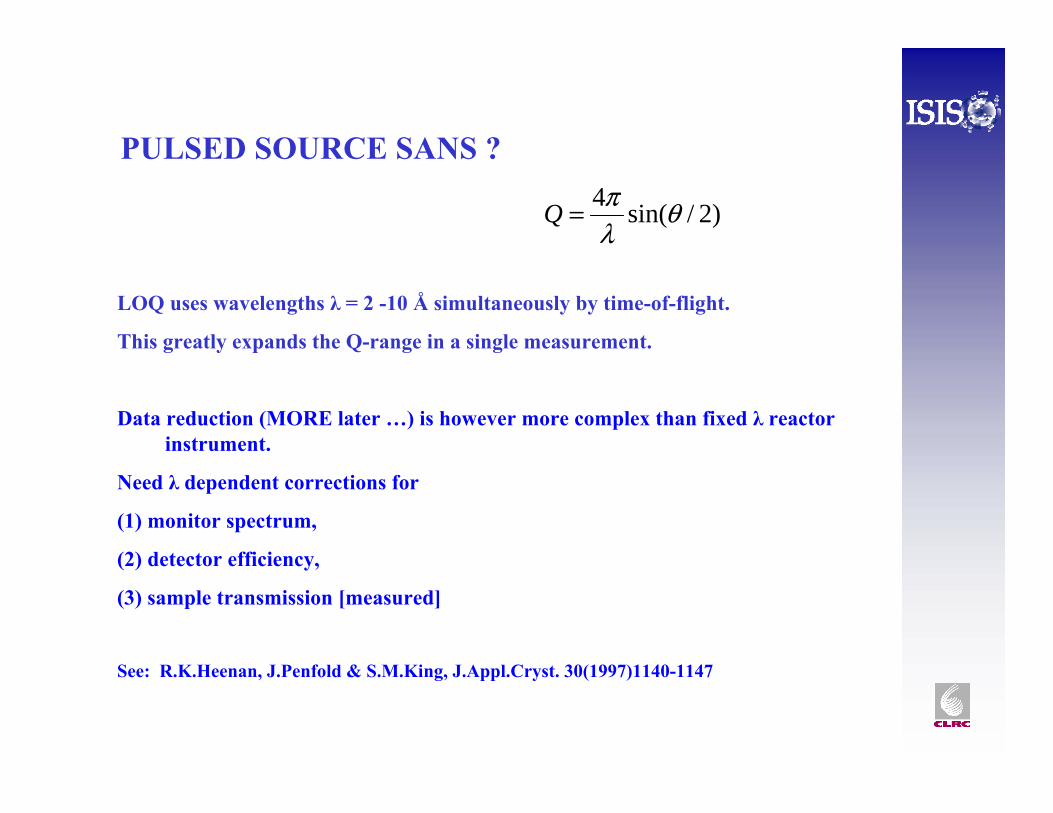
Use ~100 time channels for λ = 2.2 - 10 Å with a 128 x 128 detector at 4.1m from the sample ( and the High Angle Bank at 0.5m ).
Three wavelength dependent corrections are needed:
Monitor spectrum shape M(λ) - detector before sample.
Detector efficiency η(λ) actually goes in as “direct beam file” D() which contains the relative efficiency of the main detector compared to the monitor, including the effect of the beam windows between them.
Transmission T(λ) is measured in a separate transmission run.
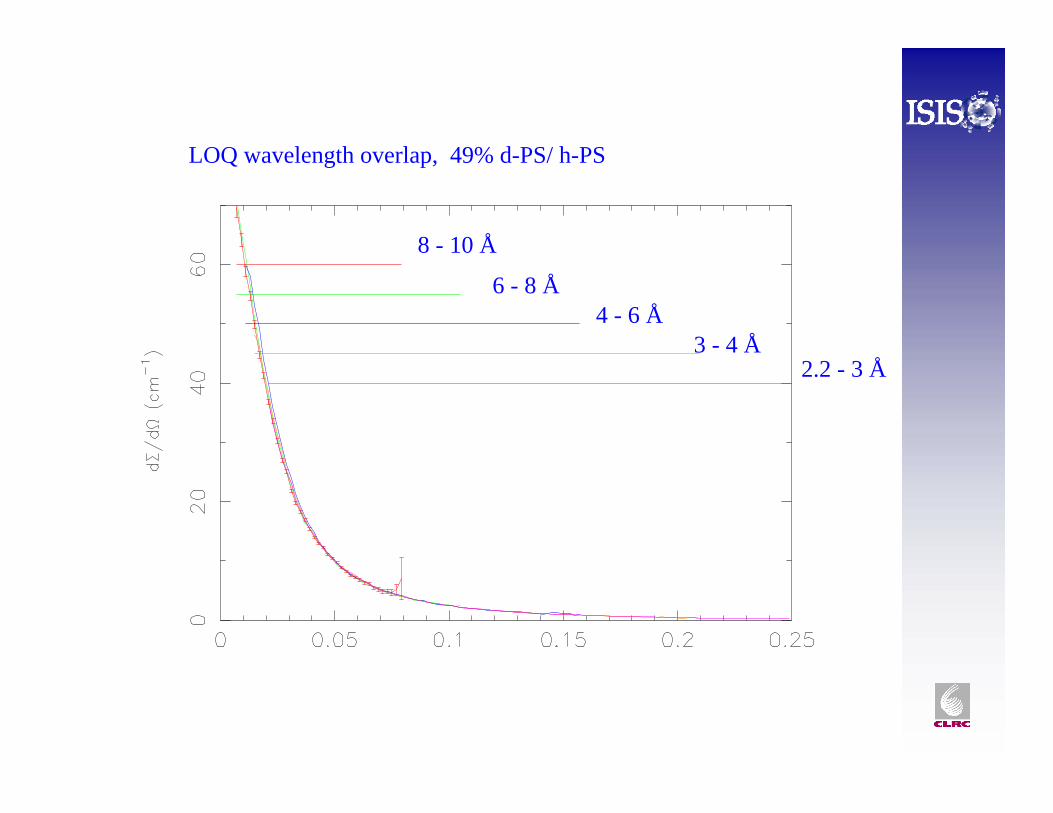
A final rescale factor ( ~ 1.0 ) is based on a fit to a “polymer standard”, d-PS/h-PS run with the current beam size.
Q resolutionSANS is smeared out by Q resolution function - depends on detector pixel size, detector spatial resolution, sample size.
At a given Q, resolution is worse at shorter wavelength due to a 1/λ term.
There is also a Δλ wavelength spread due to the neutron source.
At a reactor Δλ is given by the velocity selector used.
At a pulsed source Δλ has a sharp leading edge, followed by a ~ exponential tail, due to the time width of the proton pulse and the moderation process.
Over most of Q range Δλ is less on LOQ than for a reactor source at the same sample-detector, despite the use of shorter wavelengths.
Fits to sharp features, particularly at small Q, will ideally need resolution smearing.
⎥⎥⎦
⎤
⎢⎢⎣
⎡⎟⎠⎞
⎜⎝⎛ Δ+
Δ+
′+=⎟⎟
⎠
⎞⎜⎜⎝
⎛ 2
22
2
22
2
2
22
21
21
2
2 )(33
121
λλ
θσ
LR
LR
LR
LR
QQ
On LOQ this needs to be “averaged” over the wavelengths contributing at each Q.
For a Gaussian, Full Width Half Maximum = FWHM= (8loge(2))1/2 σ ~ 2.35σ
Where σ is the standard deviation
Estimated LOQ resolution (better now with latest detector)
Beware - this can be a problem when I(Q) is large at small Q, if say I(Q=0) > 1000 cm-1 then check carefully.
Detector dead time may also become a problem if the count rate is to high.
In some systems the contrast may be diluted to reduce both count rates and multiple scatter. Else wise try thinner samples.
A number of programs and methods are available to allow for multiple scattering.
For micron sized particle MSANS deliberately uses multiple scatter to determine particle size distributions ( usually for microporous materials, ceramics etc).
Multiple scattering
Hydrogen has a strong “incoherent” scatter which gives rise to a “flat background”,
e.g. 1mm of H2O gives around 1cm-1 which may be large compared to a SANS signal, especially at high Q.
1mm H2O is often taken to be “flat” at many reactor instruments which use it to normalise their detector response.
BUT half its measured scatter is actually multiple inelastic scattering. The “cold”neutron beam is being thermalised in the water, many neutrons are accelerated to shorter wavelengths. The signal detected depends on detector efficiency (usually less at shorter λ) and at a pulsed source on the sample-detector distance.
The inelastic spectrum is quite different for other hydrogenous materials.
This can make background subtraction and matching of main and high angle detectors quite difficult and sometimes almost impossible!
Incoherent & Inelastic scattering
• Work in D-solvent rather than H-solvent
• For weak signals at high Q, where model fitting or Porod analysis is important, then collect data on a range of solvents with around, or a little less H than the (sample+solvent) - helps estimate the systematic error in the high Q background.
• Always include a flat background in any fitting to allow for errors in initial background subtraction - then ask is it reasonable?
• NOTE at very high Q, solvents, especially D-H mixtures may have their own structure as molecular dimensions are approached.
Dealing with “Incoherent” scattering
•Good starting places for ideas: Global SAS conferences every 3 yrs, in J.Appl.Cryst. –36(2003)373-868 Venice, Aug 2002, 33(2000)421-868 Brookhaven, 30(1997)569-888 Brazil, 24(1991)413-974 Leuven, 21(1987)581-1009 Argonneexcept - J.de Physique IV, 3,colloque 8(1993)1-559 Saclay.
•Long review of general interest, including porous materials: E.Hoinkis, p71-241 in “Chemistry and physics of carbon”, vol 25, ed. P.A.Thrower, Pub. M.Dekker, New York 1997.
•Highly detailed: “Neutrons, X-rays and Light Scattering Methods Applied to Soft Condensed Matter” ed. P.Lindner & Th.Zemb, Elsevier, 2002.
•Chapter 3, “Using SANS to study adsorbed layers in colloidal dispersions”, S.M.King, P.C.Griffiths & T.Cosgrove in “Applications of neutron scattering to soft condensed matter”, Ed. B.J.Gabrys, Gordon & Breach, 2000.
•“Methods of X-Ray and Neutron Scattering on Polymer Science”, Ryong-Joon Roe, Oxford University Press, 2000.
•Classic text book: “Polymers and Neutron Scattering”, J.S.Higgins & H.C.Benoit, Oxford University Press, 1997.
Some SANS references:
We will look in more detail at SANS from dilute and concentratedparticles to see what information we may learn about their structure and interactions.