Technical University of Lodz Faculty of Electrical, Electronic, Computer and Control Engineering Department of Microelectronics and Computer Science Smart Materials as Sensors and Actuators for Lorentz Force Tuning System Dissertation written by Przemyslaw Sękalski supervised by prof. Andrzej Napieralski Lódź September 2006
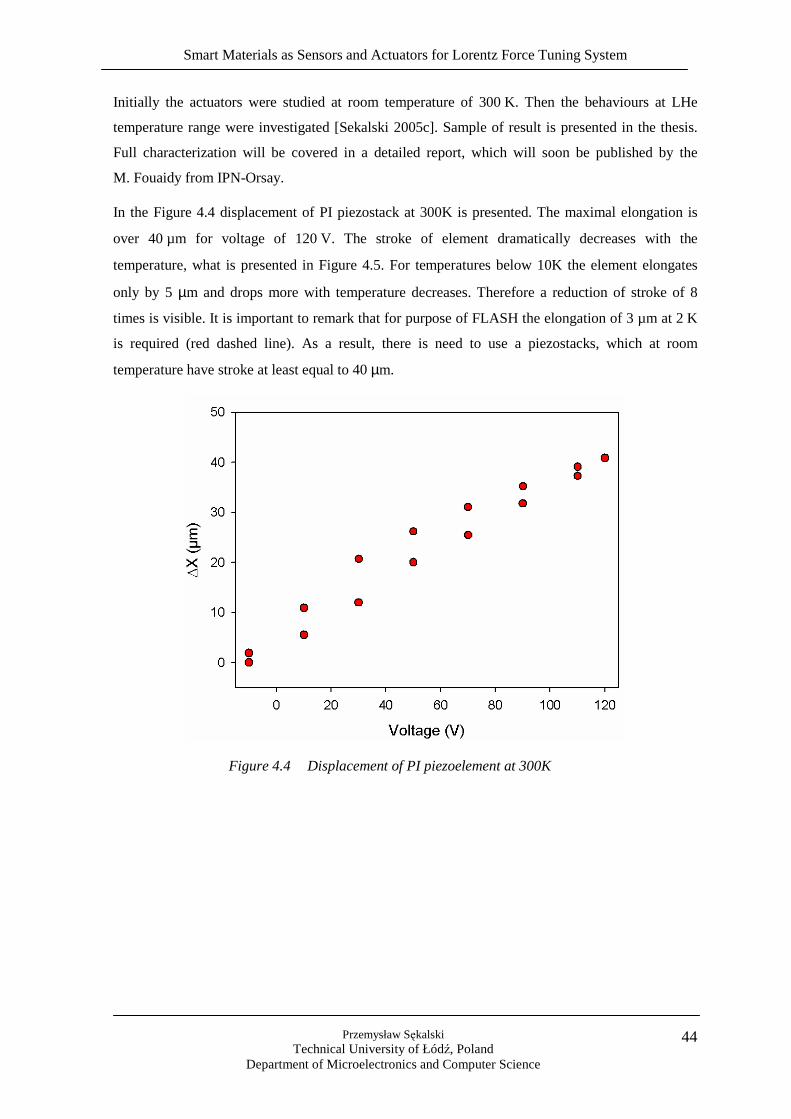
Transcript
Technical University of Lodz
Faculty of Electrical, Electronic, Computer and Control Engineering
Department of Microelectronics and Computer Science
Smart Materials as Sensors and Actuators
for Lorentz Force Tuning System
Dissertation
written by Przemysław Sękalski
supervised by prof. Andrzej Napieralski
Łódź September 2006
Smart Materials as Sensors and Actuators for Lorentz Force Tuning System
Przemysław Sękalski Technical University of Łódź, Poland
Department of Microelectronics and Computer Science
Dla kochanej Ewunii, Zosii oraz Fistaszka
Smart Materials as Sensors and Actuators for Lorentz Force Tuning System
Przemysław Sękalski Technical University of Łódź, Poland
Department of Microelectronics and Computer Science
Acknowledgement
I would like to express my gratitude to my advisor, professor Andrzej Napieralski, for his support,
patience, and encouragement throughout my studies. His technical and editorial advice was
essential to the completion of this dissertation and has taught me countless lessons and insights on
the workings of academic research in general.
Special thanks are addressed to doctor Mariusz Grecki and professor Dieter Proch who have
encouraged me to take part in the CARE project.
I would like to thank doctor Stefan Simrock for his invaluable comments, constant support and
what is the most important for his trust in young people. I would like to show my gratitude to
doctor Lutz Lilje, who helped me to understand the physics which stands behind the project and
who encouraged me to exceed the limits. I would like to express special thanks to Clemens
Albrecht and all cryogenic team from DESY for their continuous support in the preparation and
execution of experiments as well as their valuable comments.
Special thanks are addressed to the colleagues from IPN-Orsay, INFN-Milan and CEA-Saclay
laboratories for their collective work. Especially, I would like to thank Mohammed Fouaidy for
long discussions, Angelo Bosotti for research inspirations, Rocco Papparella for knowledge
exchange and Pierre Bosland for explanation of mechanics.
Special thanks are addressed to professor Tadeusz Pustelny for his valuable remarks and comments
regarding the dissertation.
Finally, I would like to express my gratitude to my Family, who have encouraged me to continue
my studies. Moreover, I would like to greatly appreciate my wife Ewa for her patience, support and
inspiration.
I acknowledge the support of the European Community-Research Infrastructure Activity under the
FP6 “Structuring the European Research Area” program (CARE, contract number RII3-CT-2003-
506395), and Polish National Science Council Grant”138/E-370/SPB/6.PR UE/DIE 354/2004-
2007” and “3 T10C 036 30”.
Smart Materials as Sensors and Actuators for Lorentz Force Tuning System
Przemysław Sękalski Technical University of Łódź, Poland
Department of Microelectronics and Computer Science
1
Index
Used shortcuts 3
Chapter 1. Introduction 4
Chapter 2. State of the art of the cavity tuners 8
2.1. Introduction 8
2.2. Superconducting accelerators 8
2.3. Vacuum Ultra Violet Free Electron Laser 10
2.4. Current tuners development 16
Chapter 3. Detuning sources 21
3.1. Lorentz force phenomenon description 21
3.2. Microphonics 24
3.3. Mechanical model of cavity 27
3.3.2. Direct and inverse transfer functions between piezostack and RF field 28
3.4. Cavity model description 30
3.5. Detuning measurement 34
3.5.1. Multi-pulse detuning measurement 34
3.5.2. Single pulse detuning measurement 35
3.5.3. Comparison of single and multi-pulse detuning measurement 36
3.6. Conclusion 37
Chapter 4. Smart materials 39
4.1. Introduction 39
4.2. Piezoelectric stacks 40
4.2.1. Piezoelement characterization and comparison 42
4.3. Magnetostrictive rods 48
4.4. Conclusion 52
Chapter 5. Force measurement 53
5.1. Introduction 53
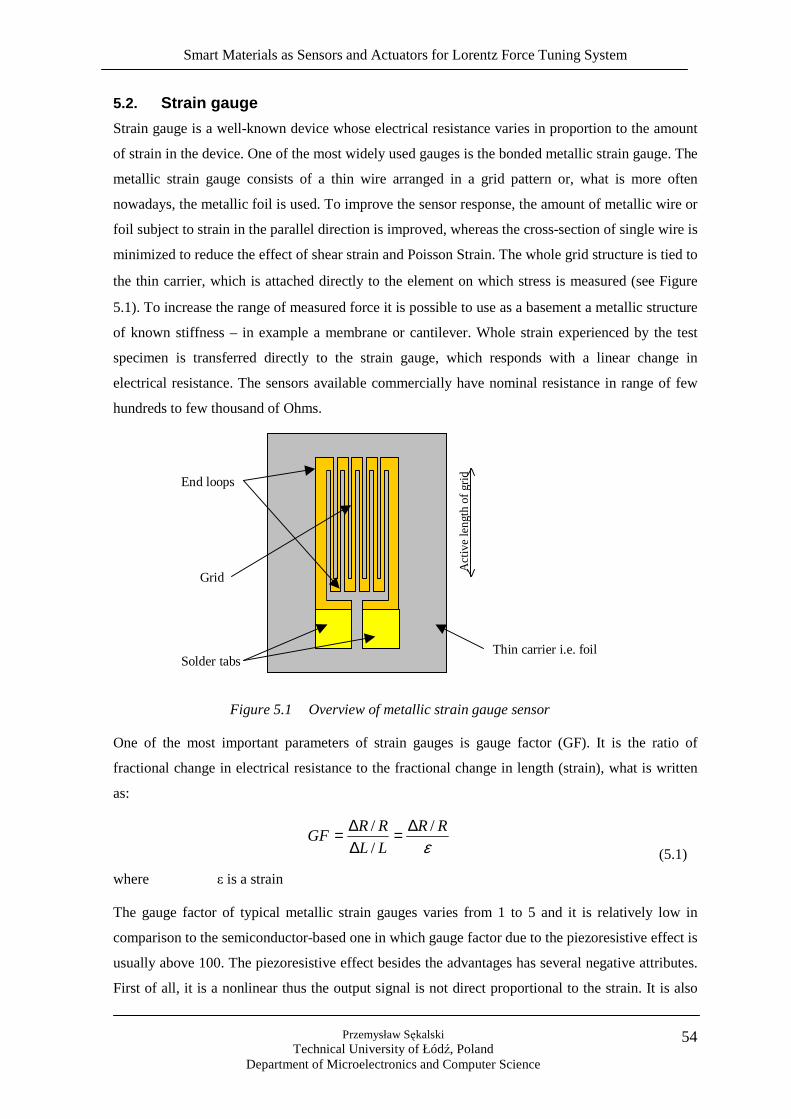
5.2. Strain gauge 54
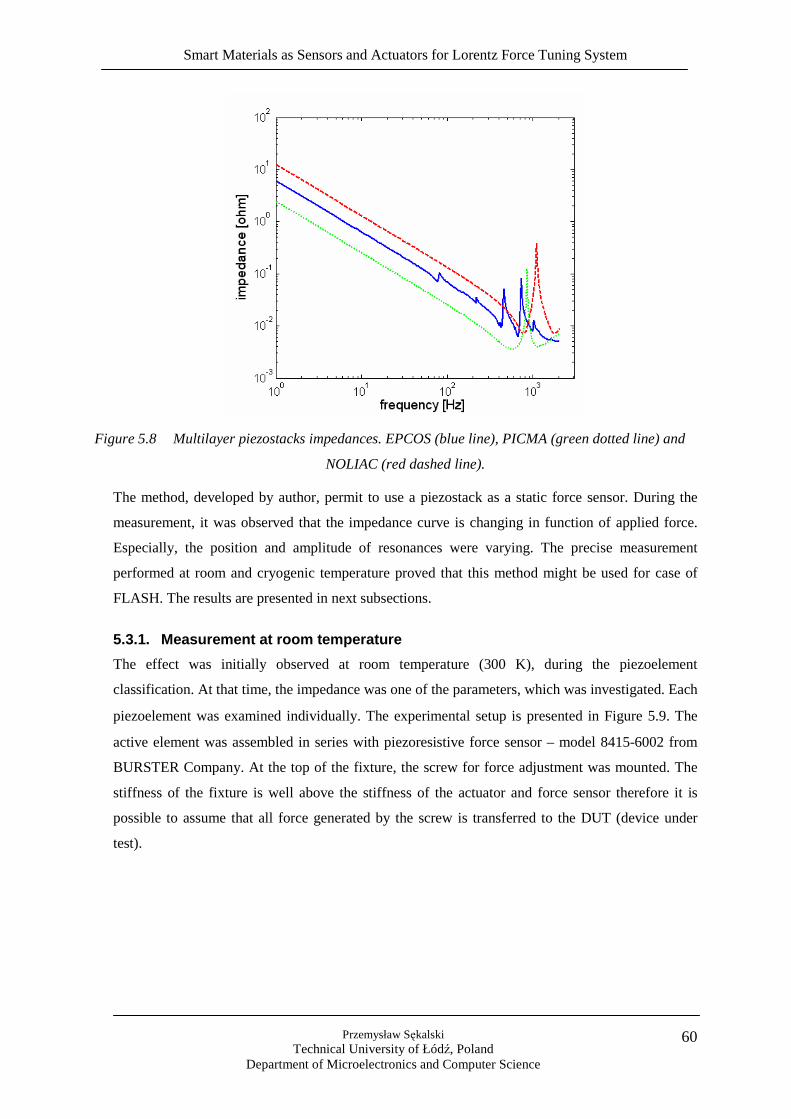
5.3. Shift of piezoelectric stack resonant frequency 58
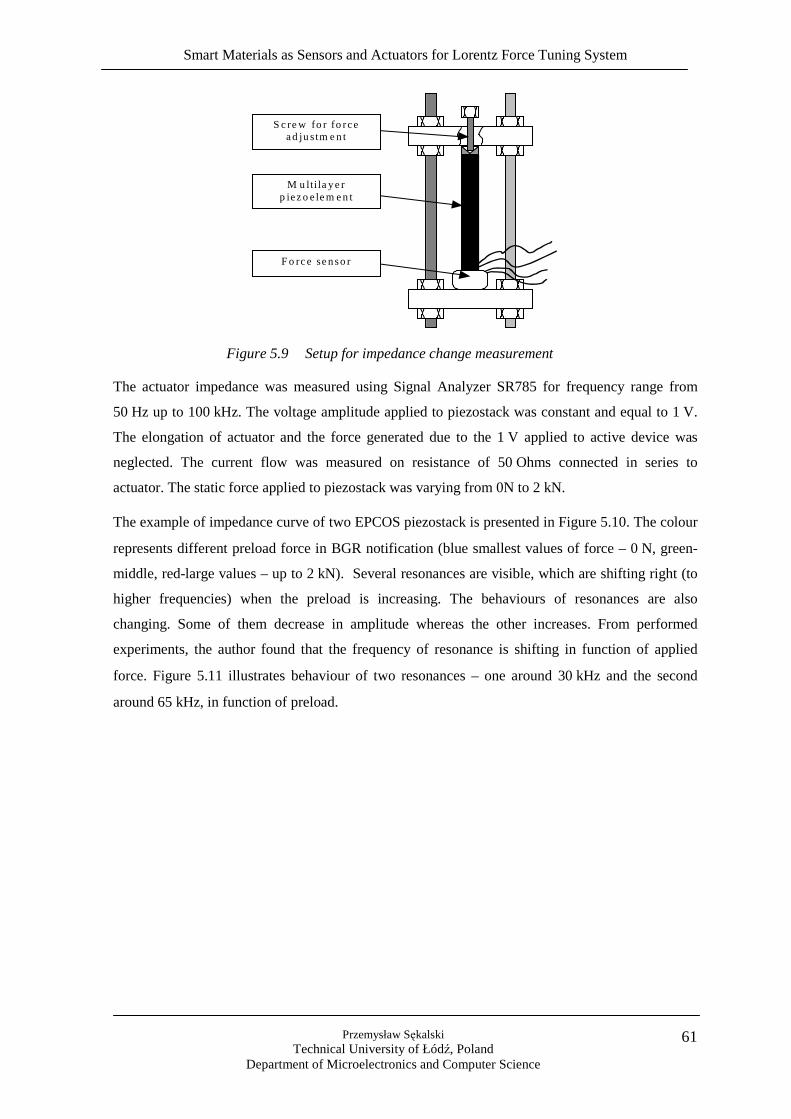
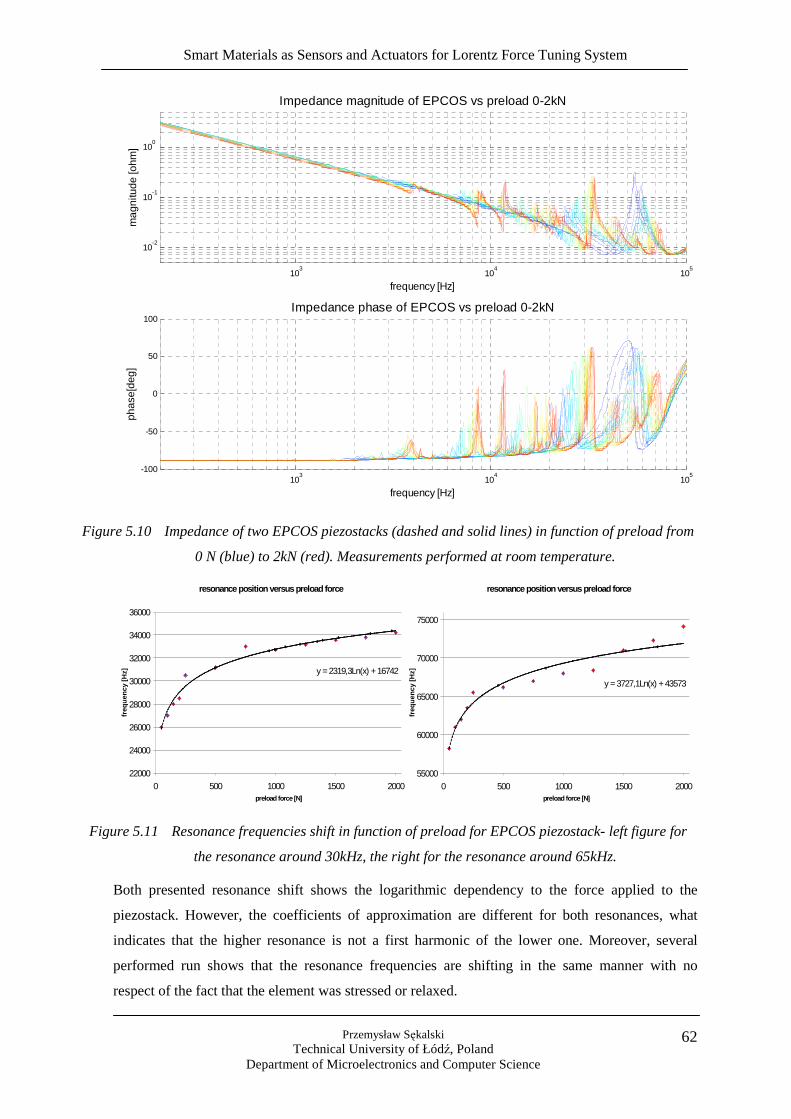
5.3.1. Measurement at room temperature 60
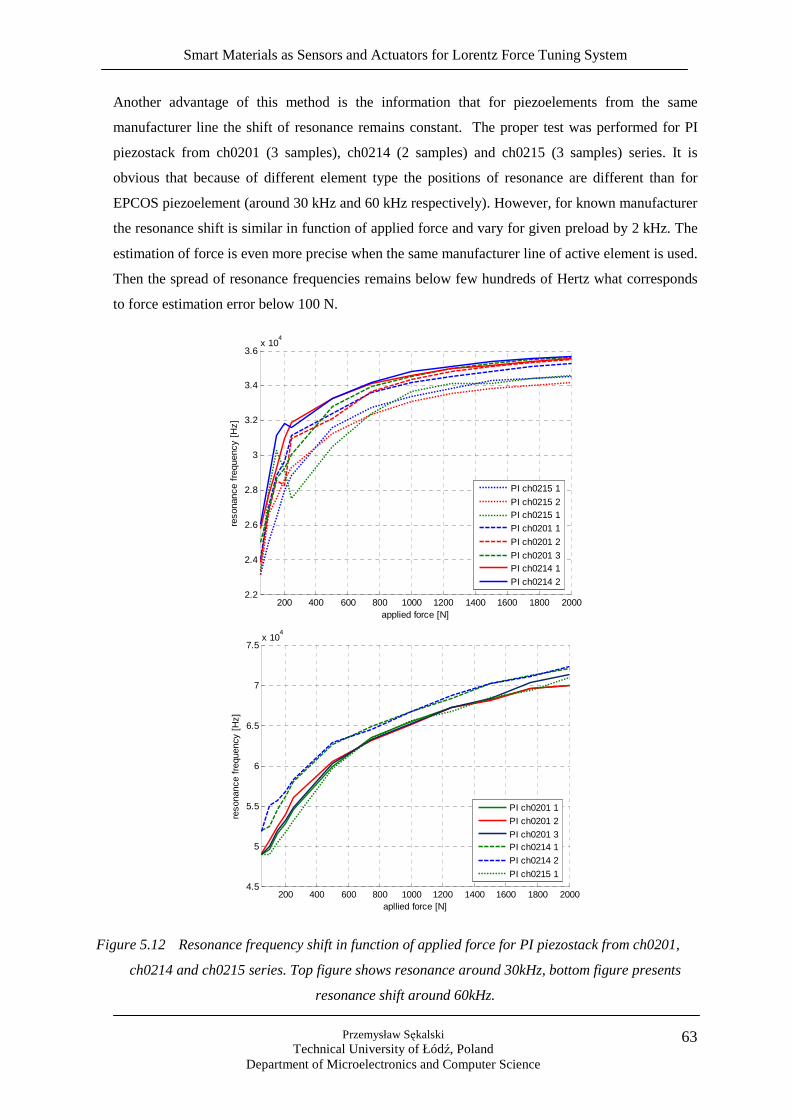
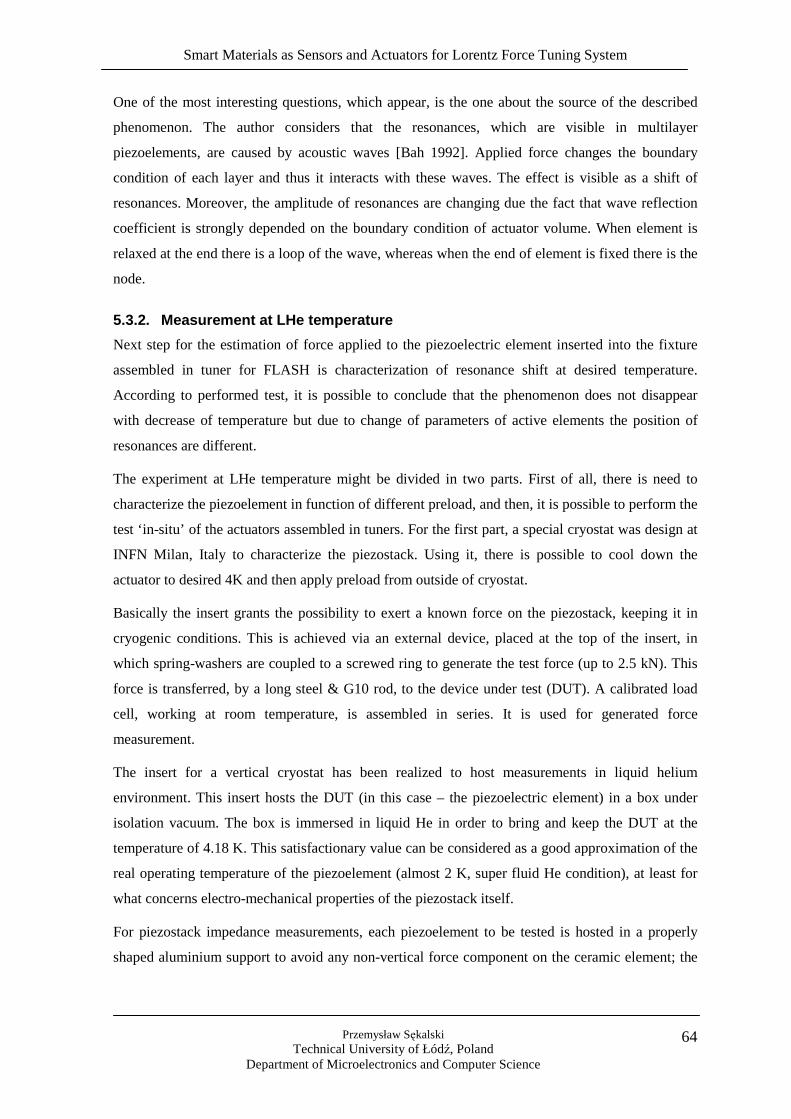
5.3.2. Measurement at LHe temperature 63
5.4. Capacitance change 67
5.5. Conclusion 69
Smart Materials as Sensors and Actuators for Lorentz Force Tuning System
Przemysław Sękalski Technical University of Łódź, Poland
Department of Microelectronics and Computer Science
2
Chapter 6. Fast tuning system 70
6.1. Introduction 70
6.2. Mechanical part – Cold Tuning System 71
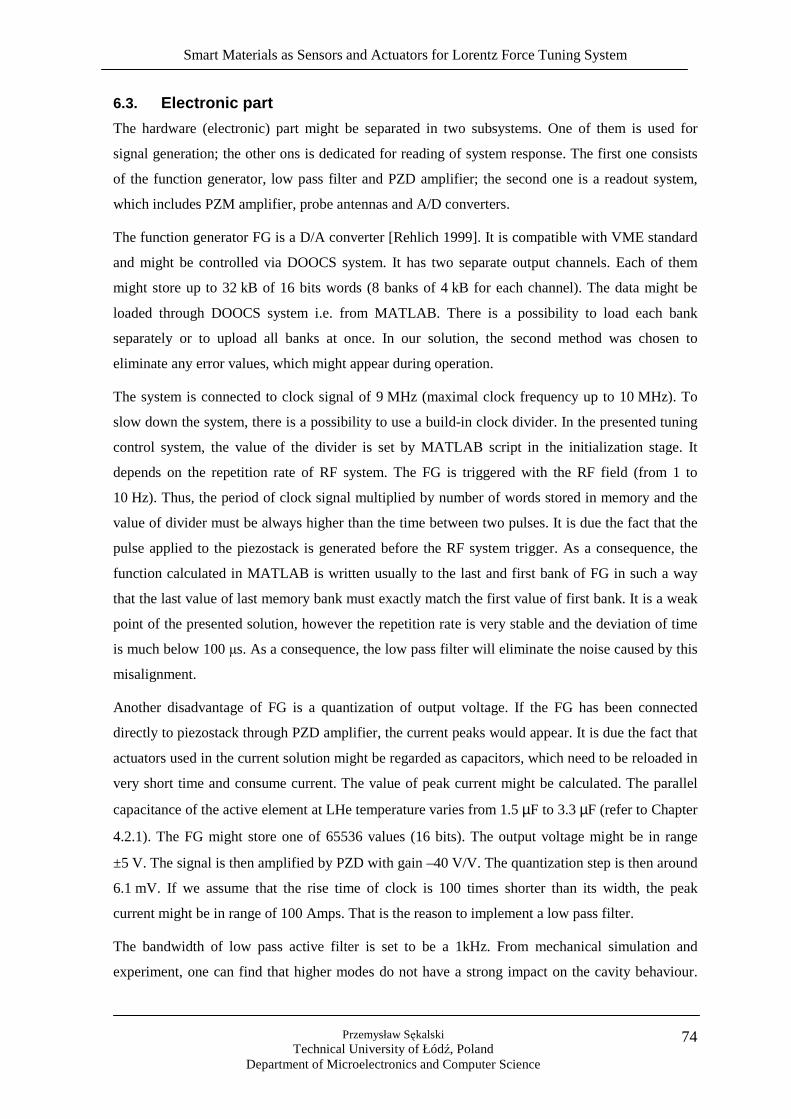
6.3. Electronic part 73
6.4. Software part 74
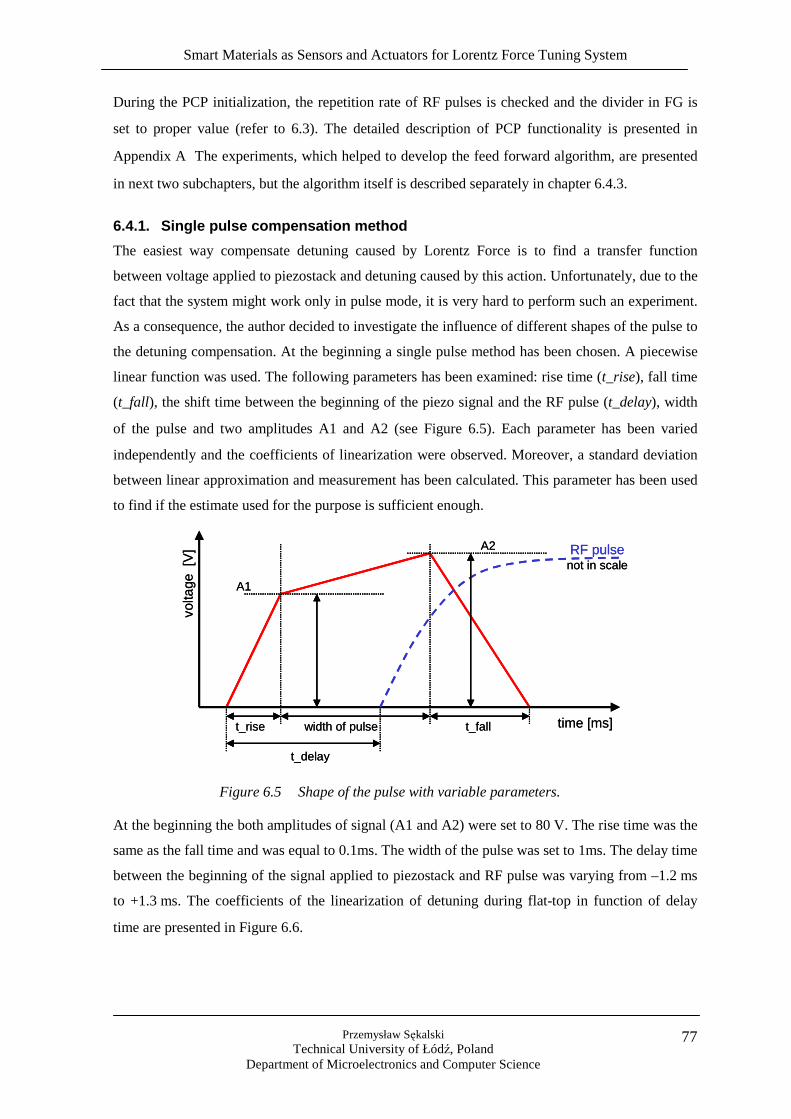
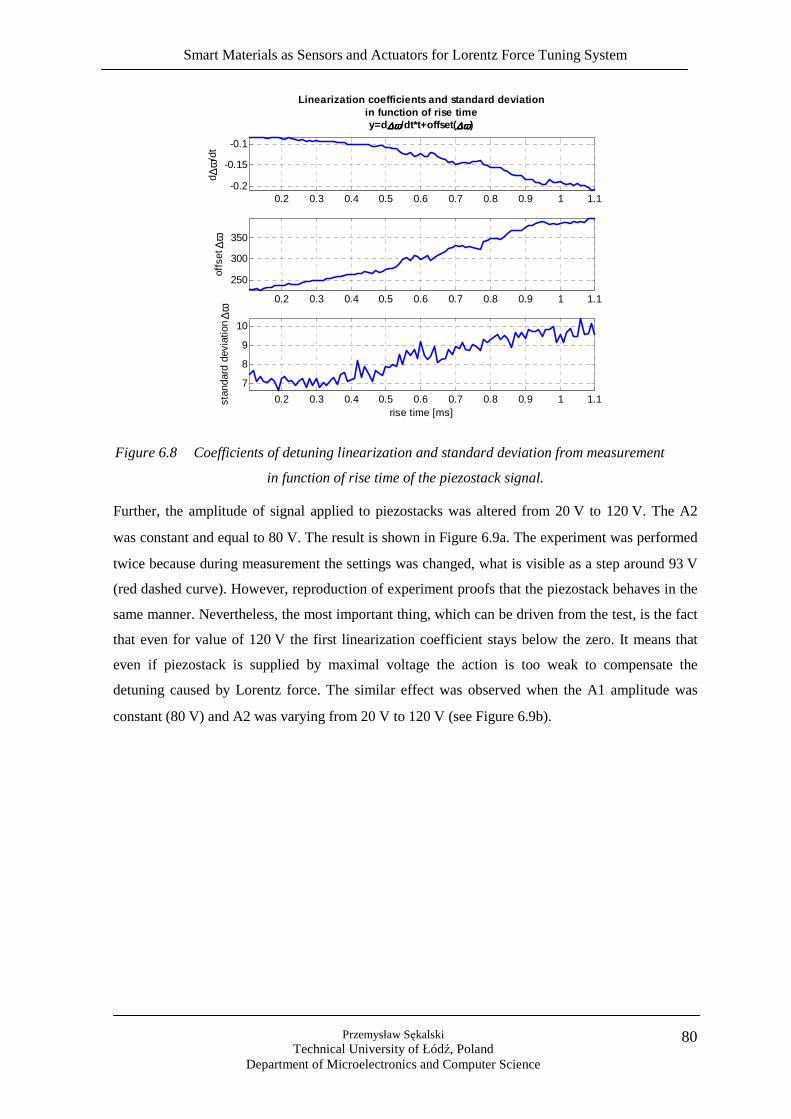
6.4.1. Single pulse compensation method 76
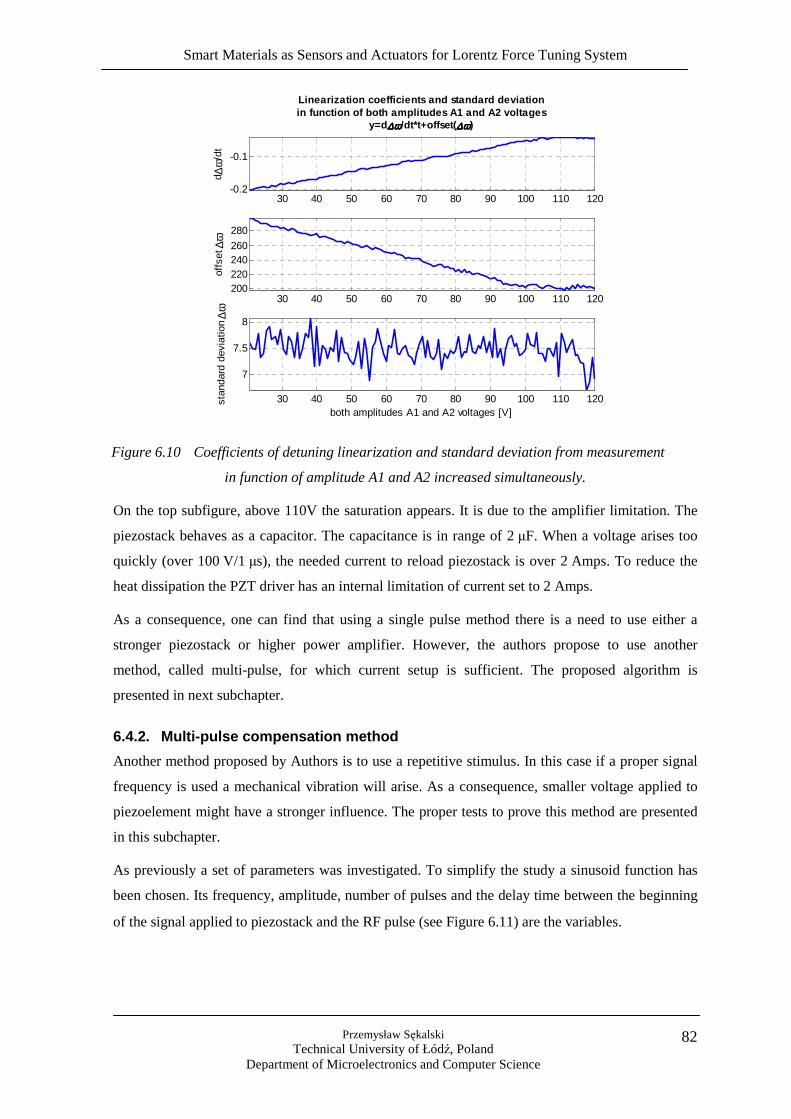
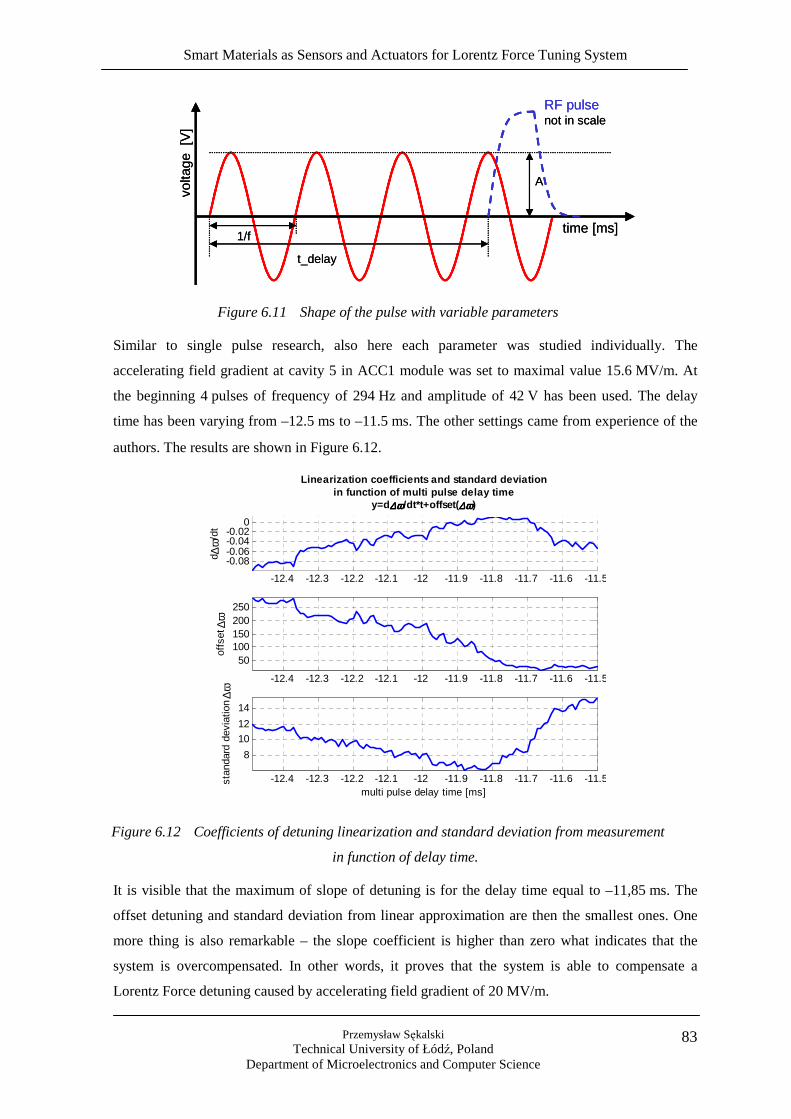
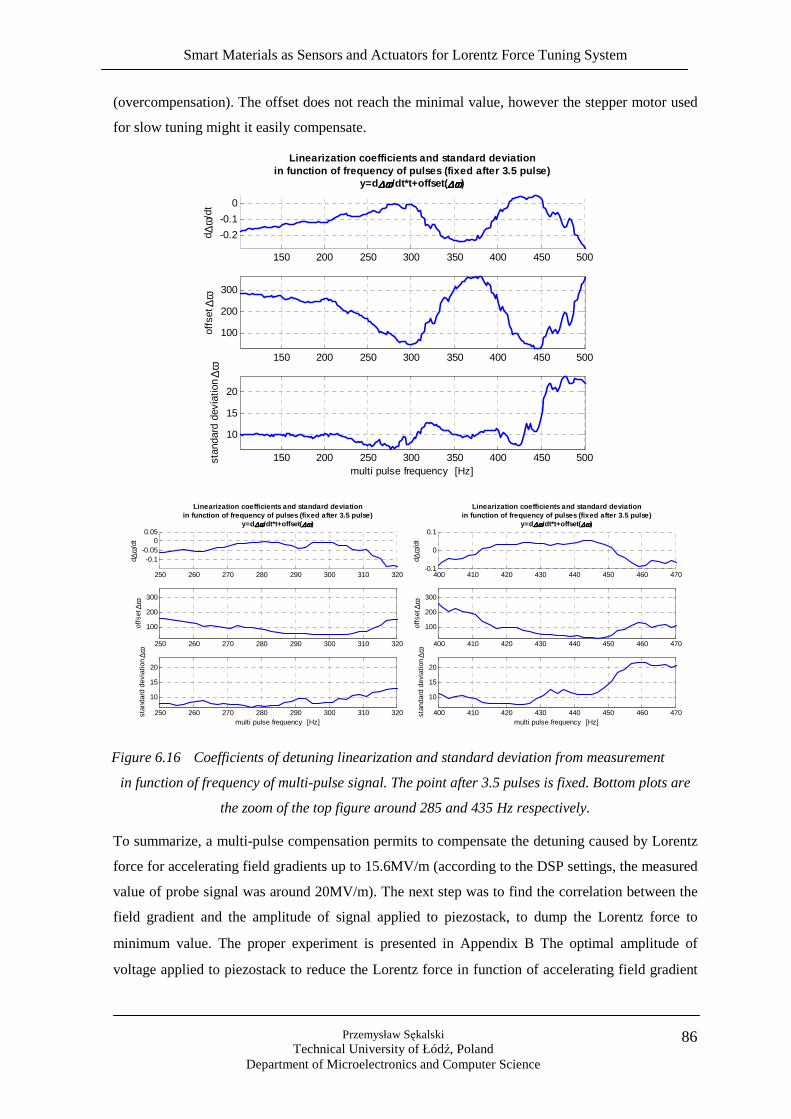
6.4.2. Multi-pulse compensation method 81
6.4.3. Feed forward algorithm for Lorentz force compensation 87
6.5. Measurements and results 88
Chapter 7. Summary and conclusion 92
Bibliography 95
Index of figures 101
Index of tables 105
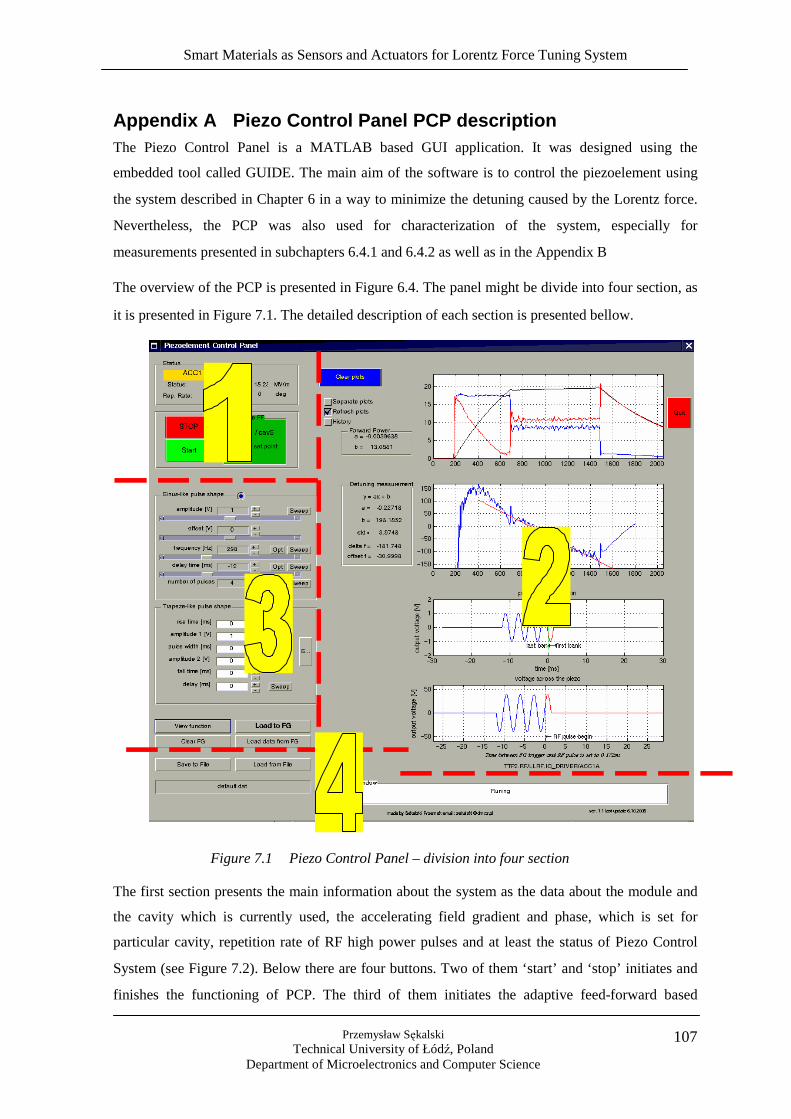
Appendix A Piezo Control Panel PCP description 106
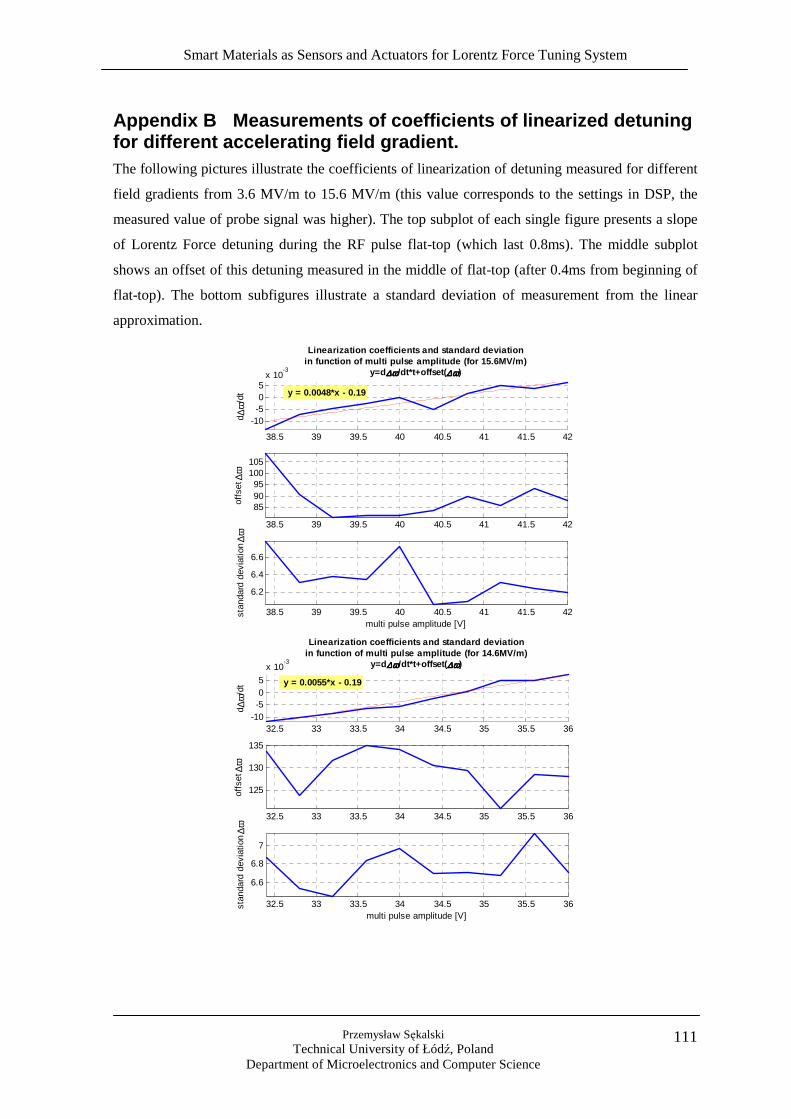
Appendix B Measurements of coefficients of linearized detuning for different
accelerating field gradient. 109
Smart Materials as Sensors and Actuators for Lorentz Force Tuning System
Przemysław Sękalski Technical University of Łódź, Poland
Department of Microelectronics and Computer Science
3
Used shortcuts CTS - Cold Tuner System
DOOCS - Distributed Object Oriented Control System
FG - function generator
FLASH - Free Electron Laser in Hamburg
ILC - International Linear Collider,
KL - Lorentz force detuning constant
LCR - an electrical circuit consisting of a resistor (R), an inductor (L),
and a capacitor (C)
LHC - Large Hadron Collider
NC - normal conducting
PI - Physik Instrumente GmbH & Co. KG
PTS - Piezo Tuner System
PZD - Piezo Driver Transducer
PZM - Piezo Driver Receiver (Measurement)
PZT - a piezoelectric material, which contains lead zirconium titanate
QL - loaded quality factor
Q0 - unloaded quality factor
SASE - self amplified spontaneous emission
SC - superconducting
TCE - temperature coefficient of expansion,
TESLA - Tera-eV Superconducting Linear Accelerator,
TTF - TESLA Test Facility,
VUV-FEL - Vacuum Ultra-Violet Free Electron Laser,
X-FEL - X-Ray Free Electron Laser,
Smart Materials as Sensors and Actuators for Lorentz Force Tuning System
Przemysław Sękalski Technical University of Łódź, Poland
Department of Microelectronics and Computer Science
4
Chapter 1. Introduction During the last century the understanding of the nature, especially at the level of its smallest
constituents have been significantly improved. The last achievement – the so-called Standard
Model becomes a fundamental theory for the particle physics. However, the presented model needs
to be verified by experiment. The only method to validate the hypothesis covered in Standard
Model is to design particle accelerators, which are able to provide an extremely high energy
of range of millions of millions of eV and higher.
The first precursor of nowadays machines – the cyclotron – was constructed by E. Lawrence
in 1929. This device was operated at energy up to 1 MeV. For comparison, the Large Hadron
Collider (LHC), which is constructed at CERN, Switzerland will be able to provide the centre-of-
mass energy of 14 TeV. However, there is need to remark that during the collision this energy will
be shared with quarks of protons therefore the energy of the collision will be much lower. In other
words, products of collision will capture part of energy. This “energy sharing” might be eliminated
by using the fundamental particles, which make up all the other particles found in Nature, and are
not themselves made up of smaller particles. As a consequence, the e- e+ colliders are promising for
the current and future research. The advantages of such a machine were proved by the biggest
storage ring called Large Electron-Positron Collider (LEP). Its energy was around 200GeV and the
beam luminosity was in range of 1033 cm-2s-1. In high energy physics community is strong believe
that after the great success of previous machine, there is need to build new accelerator, which will
be able to provide an energy of collision over 1 TeV.
Across the world there are several groups, which are working on the successor of LEP. One of
them is a TESLA Technology Collaboration, which proposes to use a nine-cell superconducting
standing wave accelerating structures made of pure niobium [Brinkmann 2001]. The cavities will
be operated at 1.3 GHz and the average accelerating field gradient in each cavity will be above
35 MV/m. The over 30 km long accelerator will be able to provide the required energy of collision
of positrons and electrons of 1 TeV.
The proposed machine is a linear accelerator. It is the only solution to eliminate the synchrotron
radiation, which prevent reaching the high energy by electrons and positrons. This radiation
is generated while the electrons, which move near the speed of light, flight through magnetic fields
perpendicular to the direction of movement. Then the photons are generated, which carry out part
of electron energy. In case of ring accelerator the magnetic field are used to change the direction
of beam.
The reason of using the superconducting cavities is its efficiency. The small power dissipation
in the cavity walls is guaranteed by using the pure nine-cell niobium cavities cooled by superfluid
Smart Materials as Sensors and Actuators for Lorentz Force Tuning System
Przemysław Sękalski Technical University of Łódź, Poland
Department of Microelectronics and Computer Science
5
helium to 2 K. As a consequence, the unloaded quality factor of single cavity is in order of 1010.
However, for high accelerating gradients (above the 20 MV/m) there is need to operate the machine
in pulse mode to keep the average cryogenic losses in acceptable limits. In case of proposed
solution, the pulse length is set to 1.3 ms, where the first 500 µs is used for filling the cavity with
RF field and during the next 800 µs the field is kept constant (so-called flat-top). This is also
a great advantage of the superconducting structure over the normal conducting ones, in which only
microseconds pulses might be reached.
The performance of TESLA technology significantly evaluated since last decade. Since the first
test of single cavity, through TTF I - the 100 m TESLA Test Facility and TTF II (its 260 m long
upgrade), to VUV-FEL1 (Vacuum Ultra Violet Free Electron Laser), the improvement in reliability
and performance of used technology has been done. All of these machines were constructed
at DESY-Hamburg, Germany with international collaboration of many countries including Poland.
As it was mentioned above the TESLA technology allows building not only the linear collider,
but also a free electron laser. In the second type of the device the fast high-energy electrons are
moving through undulators in which a high magnetic field forces the particles to undergo
oscillations and radiate. As a consequence, the phenomenon of synchrotron radiation, which
prevents from reaching high energy in ring accelerators, is used to generate a high brilliant and
coherent light of very short wavelength. Currently, the wavelength of FLASH is in range
of several nanometers. The next machine of length of 3 km will be able to provide a light of X-ray
regime – X-FEL (X-ray Free Electron Laser). The possible application of FEL is not limited
to high-energy physics but also covers the biology, medicine, solid physic and many others.
The cavities used in TESLA and X-FEL projects are powered by the wave with constant radio
frequency equal to 1.3 GHz (RF). This frequency was adjusted to internal frequency of the TESLA
cavity, because the cavity should work on resonance. As it was mentioned, the quality factor
of unloaded cavity is more than 1010 whereas the quality factor of loaded cavity (with couplers,
tuner, etc) is QL=3*106. It corresponds to cavity measured half-bandwidth around ω1/2 ≈ 230 Hz.
There is need to point, that each cavity is slightly different, what causes that each cavity need to be
tuned before operation.
The resonant frequency of the cavity depends on its dimension. As a result, a sophisticated system,
which can shrink and stretch the single cavity, was build to reach the frequency of master
oscillator. The tuning system consists of a stepper motor, which adjust the shape of the cavity after
cooling down and pumping. Because there is need to tune cavities before operating, therefore this
process is commonly named pre-detuning. The system is also equipped with piezoelectric stack,
1 VUV-FEL was recently renamed to FLASH (Free-Electron LASer in Hamburg)
Smart Materials as Sensors and Actuators for Lorentz Force Tuning System
Przemysław Sękalski Technical University of Łódź, Poland
Department of Microelectronics and Computer Science
6
which are using for Lorentz force and microphonics cancellation. The second part of the system is
commonly named a fast tuner.
The principle of fast tuner operation is described in thesis of M. Liepe [Liepe 2001b]. However,
the presented solution was checked with only one cavity, and the driving signal was set manually.
In case of FLASH, there will be six modules, but probably only two of them will be equipped with
the fast tuners. It means that there will be at least 16 compensation systems. In case of future
machine, like X-FEL there will be at least 1000 of tuners. For longer machines, like ILC few teens
of thousands of tuners is predicted. As a consequence, there is need to automate the algorithm
for compensation. Another important issue is a reliability of used actuator. According to the
literature [Zickgraf 1995, PI web] the lifetime of the piezoelectric stacks depends on preload force.
As a result, a static force measurement at cryogenic environment becomes an important topic.
The main objective of the thesis is to present the recent development of the fast tuner attached
to TESLA type cavities assembled in FLASH accelerator. Especially the thesis proofs, that:
• it is possible to automate the Lorentz force compensation system used for Vacuum Ultra
Violet Free Electron Laser,
• it is possible to use a piezoelectric stack itself to measure the static force (preload) applied
to the actuator in wide range of temperatures from 2 to 300 K,
The dissertation is organized in seven chapters. At the beginning the general information about
the accelerator technology is presented. The second chapter provide also a terminology used
in the high-energy physics field, which allows easy understanding for experts from other
disciplines. Moreover, the TESLA type cavity is presented with its dimensions and mechanical
properties. Beside of that, it also covers the information about alternative development of tuners,
which might be used for TESLA type cavities for future machines.
Chapter 3 summarizes the information about detuning sources. The mechanical
and electromechanical models of cavity compared to performed measurements are presented. Also
the old (multi-pulse) and new (single pulse) methods of detuning measurement are described.
In chapter 4 the smart materials, which might be used for fast tuning system, are presented.
Especially, there results of experiments performed at cryogenic and room temperature
of piezoelectric stacks from five different manufacturers and two types of magnetostrictive rods are
shown. Moreover, the problems related with reliability of the active element are investigated.
The lifetime of the piezoelectric actuator depends on the preload force. As a result there is need to
measure the static force applied to the piezoelement. The innovative method of using the active
Smart Materials as Sensors and Actuators for Lorentz Force Tuning System
Przemysław Sękalski Technical University of Łódź, Poland
Department of Microelectronics and Computer Science
7
element itself to estimate the preload is presented in Chapter 5. Moreover, t is compared to existing
method, which relays on the strain gauges.
Next chapter is dedicated to the fast tuning system used for FLASH accelerator.
At the beginning the mechanical part is briefly presented. The main part of this chapter is
the automation of Lorentz force compensation system.
At the end a summary and plan for the further research is presented. Moreover, a list of used
bibliography is attached. The thesis is finished with two appendixes. The first of them describes
the control panel used for Lorentz force compensation (Appendix A). The second one presents
a study of linearized detuning coefficients for different accelerating field gradient (Appendix B).
Smart Materials as Sensors and Actuators for Lorentz Force Tuning System
Przemysław Sękalski Technical University of Łódź, Poland
Department of Microelectronics and Computer Science
8
Chapter 2. State of the art of the cavity tuners
2.1. Introduction
The main aim of this chapter is to give a brief introduction to the accelerators technology,
especially for the experts from non-high-energy-physics fields. At the beginning, the principle
of superconducting cavities (SC) is presented. In general, the work covered in the thesis is
connected with TESLA type cavities and as a result only this type of the structure will be presented
in this Chapter. Then, the Vacuum Ultra Violet Free Electron Laser is described as the example
of machine, which uses the SC cavities. At the end of this chapter different variation of proposed
tuners are shown
2.2. Superconducting accelerators
Nowadays, the physics of accelerator is well established and described in plenty of books
and papers. The most interesting, valuable and complex are the one presented by A. W. Chao
and H. Padamsee [Padamsee 1998, Chao 1999]. The work presented in the thesis focuses on
the recent development done at DESY in Hamburg, Germany. Especially, the recent development
connected with Vacuum Ultra Violet Free Electron Laser will be presented. Nevertheless, several
references to other machines are given.
As it was written in the introduction the superconducting SC technology becomes more and more
interesting for low current, pulsed mode machines as for the one developed at DESY in Hamburg,
Germany [Schmueser 2003]. The key part of any accelerator is a resonant cavity. In technology
developed at DESY, commonly named TESLA, it is a nine-cell structure build of pure niobium
(see Figure 2.1) [Brinkmann 2001]. The niobium of high RRR2 (over 300) used for the design
becomes a superconductor when cooled below 9.2 K. Thanks to superconductivity, the particles in
an accelerator can be brought up to highest energies with hardly any power loss (the efficiency of
energy transmission between the accelerating field and the beam is almost 100 %). However, the
cavity operation temperature is set to 1.8 K to eliminate temporary surface warm up (called
quench), caused by imperfection of the surface and high electromagnetic fields. Additionally, the
lower temperature causes lower power losses. The resistance of niobium decreases by almost two
orders of magnitude when cooled down from 4 K to 1.8 K.
2 RRR - the Residual Resistivity Ratio is defined as the ratio of electrical resistivity at 295K to electrical
resistivity at 4.2K
Smart Materials as Sensors and Actuators for Lorentz Force Tuning System
Przemysław Sękalski Technical University of Łódź, Poland
Department of Microelectronics and Computer Science
9
Figure 2.1 Nine-cell cavity used at FLASH. [Brinkmann 2001]
The power losses in the resonator walls are negligible and almost all the power can be transferred
to the particle beam. As a consequence the energy consumption is vastly decreased. The energy is
mainly spending on the cryogenic system. However, the overall energy consumed to accelerate low
current beam remains lower than for normal conducting NC systems. It is hard to judge which
technology is better because it depends on the purpose for what the accelerator is used. Moreover,
both NC and SC technologies are still developing and the breakthroughs open new possibilities of
application.
Additional advantage of SC technology is extremely high quality of so created particle beam.
Thanks to vanishing electrical resistance, fewer interference fields arise and thus the resonator can
be made bigger than for NC’s one. As a consequence, it is possible to produce a particle beam with
higher energy and smaller cross-section. This allows obtaining higher collision rate at the detector,
and the energy of the collision is also higher.
The cavity is powered by 1.3 GHz radio frequency wave, supplied from klystrons via waveguides
and couplers. The cavity shape is adjusted in such a way, that the given RF field creates a standing
wave inside it. The quality factor of presented system is over 1010 without any load (Q0) and more
than 3*106 when equipped with couplers and pick-up antenna (QL). Due to the high quality factor
the half-bandwidth is reasonably small and it is in order of few hundreds of Hertz. In case of
FLASH it is only 230 Hz and slightly varies from cavity to cavity. Nevertheless, it is very
important to precisely adjust the shape of the cavity because any geometry disturbance changes the
frequency of cavity resonance. The system detunes and as a result the quality factor of resonator is
reduced.
Tesla Test Facility I (TTF I), which was successfully commissioned in 1997, proved the principle
of operation of TESLA technology. The laser radiation was generated for the first time using the
free-electron laser on February 2000. During next two years the test facility was used for
experiments in physics. Since late 2002 an upgrade to 260-meter-long test facility was began.
Smart Materials as Sensors and Actuators for Lorentz Force Tuning System
Przemysław Sękalski Technical University of Łódź, Poland
Department of Microelectronics and Computer Science
10
Nowadays, the machine, after major upgrade and tuning of used devices (i.e. klystrons, LLRF
control system,), evaluated to Vacuum Ultra Violet Free Electron Laser (VUV-FEL). Beside the
improvement and expansion of the system, the principles of operation remain untouched.
Furthermore, it is already decided that for X-Ray Free Electron Laser (X-FEL) the same
technology will be used. To continue, a new biggest linear accelerator called International Linear
Collider (ILC) will base on the current development.
2.3. Vacuum Ultra Violet Free Electron Laser
The free-electron laser (FEL) that provides tuneable radiation from the vacuum-ultraviolet (VUV)
to soft X-rays is built at Deutsche Elektronen-Synchrotron (DESY) laboratory in Hamburg,
Germany. It is a 260 meter-long extension of TTF I additionally equipped with undulators, in
which the accelerated electrons are induced to emit flashes of X-ray laser light [Brinkmann 2002].
The first system ended lasing operation in March 2002 with great success. The SASE
(self amplified spontaneous emission) principle has been proven for wavelengths from 180 nm
down to 80 nm.
However, after minor modification the VUV-FEL will be able to operate at energy of 1 GeV.
Then it should serve the light of the wavelengths down to 6 nm in the first harmonic of the SASE
FEL. However, the most recent achievement (mid of 2006) indicates that the VUV-FEL stably
lasing at wavelength of 13 nm. The overview of the machine with localization of each section
is presented in Figure 2.2.
Figure 2.2 Overview of VUV-FEL localization. [DESY web]
Smart Materials as Sensors and Actuators for Lorentz Force Tuning System
Przemysław Sękalski Technical University of Łódź, Poland
Department of Microelectronics and Computer Science
11
Simultaneously, the VUV-FEL is an experimental facility for future generations of lasers and
accelerators. After success of SASE operation, the construction of European X-Ray Free Electron
Laser (X-FEL) was scheduled for years 2008-2012. It will consist of almost 2000-meter-long
accelerator ended with several undulators. The beam energy is planed to be over 20 GeV. To reach
higher energy either a longer accelerator needs to be built or cavities, which will allow obtaining
higher gradients needs to be used (or at least combination of both parameters).
At the moment, at VUV-FEL there are five modules (called ACC1÷ACC5) equipped with eight
cavities each. The average accelerating field gradient of single module varies from 15 to 20 MV/m.
However, particular cavities (i.e. module ACC1, cavity 5) might reach higher gradients up to
25 MV/m. On the other hand, at horizontal test stand named CHECHIA, which can hold a single
fully dressed cavity, nine-cell structure were stably operated at field gradient of 37 MV/m
[Lilje 2004a]. Moreover, at the end of 2006 a new module (ACC6) equipped with 8 high gradient
cavities will be inserted in line to VUV-FEL. Nevertheless, there is still a room for cavity
development because the theoretical limit of superconductivity allows operation at 50 MV/m.
[Liepe 2001b]
All cavities used for TESLA technology has similar nine-cell shape presented in Figure 2.3.
However, the first and the last cell are slightly different that the one in the middle to ensure equal
field amplitudes in all 9 cells. Moreover, there is a slight asymmetry between left (closer to the gun
- endcup1) and right end cell (farther to the gun - endcup2), which prevents trapping of higher-
order modes [Aune 2000]. The contour of single cell is presented in Figure 2.3 and the appropriate
values of dimension are gathered in Table 2.1 [Brinkmann 2001].
Smart Materials as Sensors and Actuators for Lorentz Force Tuning System
Przemysław Sękalski Technical University of Łódź, Poland
Department of Microelectronics and Computer Science
12
axis of cavity
Requator
Rarc
a
b
Riris length
Figure 2.3 Dimension of single cell used in TESLA technology
Table 2.1 Dimension in mm of single cell used in TESLA technology Parameters of cavity shape Midcup Endcup1 Endcup2
Particles per Bunch 5.4 1010 Bunch Separation 1 µs
Number of bunches per pulse 800 Beam current 8 mA
Cavity fill time 510 µs Cavity QL 3 106 Cavity Q0 3 109
Smart Materials as Sensors and Actuators for Lorentz Force Tuning System
Przemysław Sękalski Technical University of Łódź, Poland
Department of Microelectronics and Computer Science
14
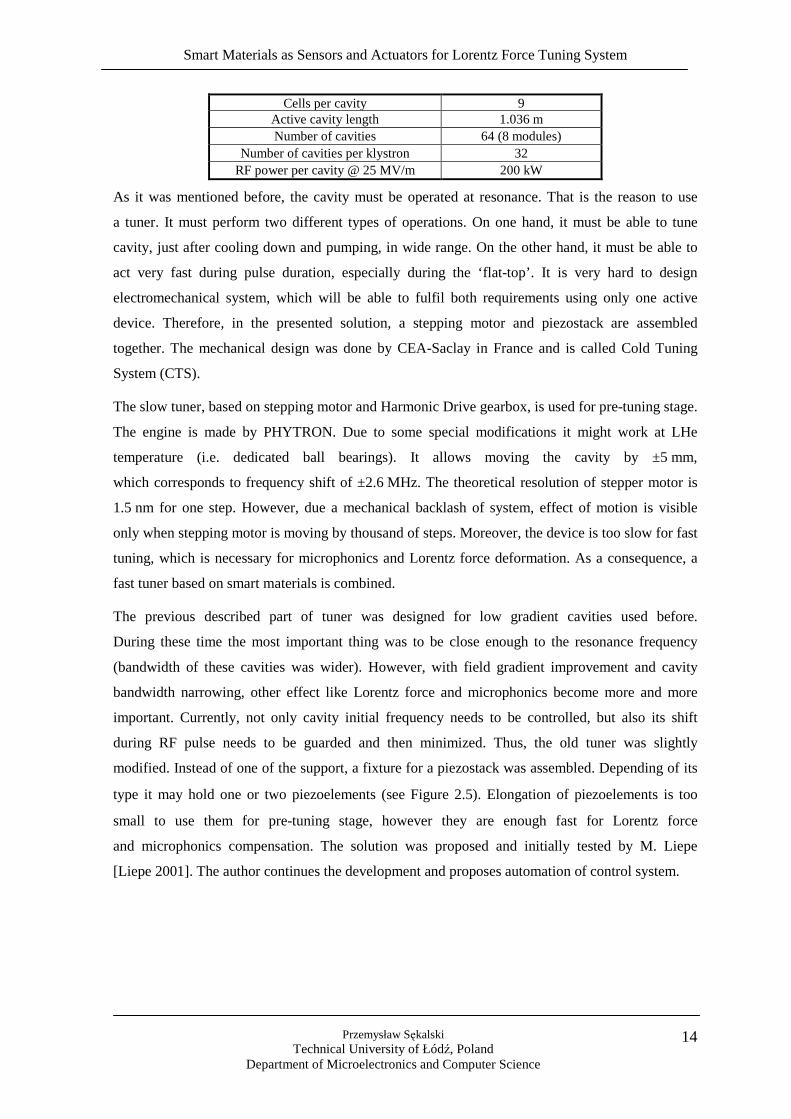
Cells per cavity 9 Active cavity length 1.036 m Number of cavities 64 (8 modules)
Number of cavities per klystron 32 RF power per cavity @ 25 MV/m 200 kW
As it was mentioned before, the cavity must be operated at resonance. That is the reason to use
a tuner. It must perform two different types of operations. On one hand, it must be able to tune
cavity, just after cooling down and pumping, in wide range. On the other hand, it must be able to
act very fast during pulse duration, especially during the ‘flat-top’. It is very hard to design
electromechanical system, which will be able to fulfil both requirements using only one active
device. Therefore, in the presented solution, a stepping motor and piezostack are assembled
together. The mechanical design was done by CEA-Saclay in France and is called Cold Tuning
System (CTS).
The slow tuner, based on stepping motor and Harmonic Drive gearbox, is used for pre-tuning stage.
The engine is made by PHYTRON. Due to some special modifications it might work at LHe
temperature (i.e. dedicated ball bearings). It allows moving the cavity by ±5 mm,
which corresponds to frequency shift of ±2.6 MHz. The theoretical resolution of stepper motor is
1.5 nm for one step. However, due a mechanical backlash of system, effect of motion is visible
only when stepping motor is moving by thousand of steps. Moreover, the device is too slow for fast
tuning, which is necessary for microphonics and Lorentz force deformation. As a consequence, a
fast tuner based on smart materials is combined.
The previous described part of tuner was designed for low gradient cavities used before.
During these time the most important thing was to be close enough to the resonance frequency
(bandwidth of these cavities was wider). However, with field gradient improvement and cavity
bandwidth narrowing, other effect like Lorentz force and microphonics become more and more
important. Currently, not only cavity initial frequency needs to be controlled, but also its shift
during RF pulse needs to be guarded and then minimized. Thus, the old tuner was slightly
modified. Instead of one of the support, a fixture for a piezostack was assembled. Depending of its
type it may hold one or two piezoelements (see Figure 2.5). Elongation of piezoelements is too
small to use them for pre-tuning stage, however they are enough fast for Lorentz force
and microphonics compensation. The solution was proposed and initially tested by M. Liepe
[Liepe 2001]. The author continues the development and proposes automation of control system.
Smart Materials as Sensors and Actuators for Lorentz Force Tuning System
Przemysław Sękalski Technical University of Łódź, Poland
Department of Microelectronics and Computer Science
15
piezoelectric stacks
slow tuner mechanism
helium tank, which holds cavity
anchor for piezostack fixture
Figure 2.5 Fixture for two piezoelements attached instead of old tuner support.
The whole tuner attached to the end of the cavity as it is presented in Figure 2.6. On the right photo
a bellow is visible, which connects two nearest cavities. It allows adjusting shape of single cavity
without significant interference to the other ones.
stepper motor
double lever mechanism
cavity flange
piezostack fixture
bellow connection between nearest cavities
Figure 2.6 Photographs of cavity tuner.
Smart Materials as Sensors and Actuators for Lorentz Force Tuning System
Przemysław Sękalski Technical University of Łódź, Poland
Department of Microelectronics and Computer Science
16
The above-presented solution is not the only one, which was proposed for TESLA type cavities.
Several other designs are developed at KEK, INFN, CEA and Thomas Jefferson Laboratory.
The summary of current designs is presented in next subchapter.
2.4. Current tuners development
Since the decision that International Linear Collider (ILC) will be based on superconducting
TESLA-like cavities several different tuner design has been proposed [Liepe 2005]. Beside the
presented-above two other solutions are developed in European Union in framework of
Coordinated Accelerator Research in Europe (CARE) program. The fist of them is the Piezo
Tuning System (PTS) proposed by CEA-Saclay (see Figure 2.7) and the second is a coaxial blade
tuner projected by INFN-Milan (shown in Figure 2.8). Also o KEK, Japan proposed two tuner
prototypes – the Slide Jack Tuner and the coaxial ball screw one (both presented in Figure 2.9).
The last but not least, is a tuner from TJLAF module upgrade called renascence tuner ( Figure 2.10).
The main parameters of all tuners are presented in Table 2.3.
Table 2.3 Different tuners for TESLA type cavities [Liepe 2005] Europe
developed in framework of CARE project Japan USA
CEA-Saclay CTS
CEA-Saclay PTS
INFN Blade tuner
KEK Slide Jack
Tuner
KEK coaxial ball
screw
TJLAF Renascence
tuner Coarse Range
[kHz] ±220 ±250 ±250 ±550 ±2760 ±250
Coarse Res. [Hz]
<1 <1 <1 <1 <1
Fast actuator Piezo or
magnetostr. Piezo Piezo Piezo Piezo
Piezo or magnetostr.
Fast range [Hz]
500 1000 1200 1200 2500 1000/ 30000
Tuning direction
Tensile and compression
Tensile and compression
Tensile and compression
Position of fast actuator
4 K, vacuum
4 K, vacuum
4 K, vacuum 5 K,
vacuum 80 K,
vacuum 5 K,
vacuum Position of
motor 4 K,
vacuum 4 K,
vacuum 4 K, vacuum Warm
80 K, vacuum
5 K, vacuum
Position of tuner
At the end of the cavity
At the end of the cavity
In the middle of the cavity
In the middle of the cavity
In the middle of the cavity
In the middle of the cavity
All of the presented tuners might work either directly with TESLA type cavities or need some
minor modification (i.e. the anchor interface). Every single one has two mechanisms – for slow and
fast tuning. In general for fast tuning a piezostack are used. However, for some of them it is
possible to exchange the piezoelements with magnetostrictive rods (see Chapter 4 for details). The
range of fast tuning is quite similar and stays over 1 kHz, except the one, which is used nowadays
(CTS) and the second one, which is designed for TJLAF (it might have much higher fast tuning
range up to 30 kHz, but test of prototype is needed).
Smart Materials as Sensors and Actuators for Lorentz Force Tuning System
Przemysław Sękalski Technical University of Łódź, Poland
Department of Microelectronics and Computer Science
17
According the experience, the fast tuning of 1000 Hz allows to compensate Lorentz force caused
by RF field of gradient below 25 MV/m. In case of old CEA design, where fast tuning range is
even smaller, the operation is limited to gradient of 15 MV/m. However, the method presented in
Chapter 6 allows to counteract to the dynamic Lorentz force generated by accelerating field of
gradient of 20 MV/m.
Regarding position of the tuner it is possible to split them into two groups. In one of them (CEA-
Saclay’s designs) the tuner is mounted at the end of the cavity and therefore there is need to keep
more space between nearest cavities. In the other group the tuner is mounted around cavity and as a
consequence there is no need to leave additional gap. In case of INFN solution, it allows to reduce
the total length of the whole accelerator by 5%. It is required to perform a financial calculation to
find, what is more reasonable - use more complex and expensive tuner or to provide extra cost
needed for longer machine.
Concerning the position of active elements of tuners, there are three main classes. In the first
solution, both stepper motor and piezoelement are assembled in cryogenic temperature of 2÷5 K
(European and US designs). Two other ideas are developed in KEK. In one of them the motor is
mounted outside the cryostat and therefore the maintenance is possible, but the piezoelectric
actuators are located close to the cavity (operating temperature of 5 K). In second solution (Slide
Jack Tuner), both piezostacks and stepper motors are placed at intermediate temperature inside of
the vacuum vessel.
The localization of active elements of fast and slow tuner is extremely important due to the
maintenance and replacement in case of failure. Only the solution proposed by KEK allows
exchanging the stepper motor without warming up the cryomodule. However, as it is expected the
price of such solution is the highest.
Nevertheless, any of the presented solutions allows exchanging the piezoelement. As a
consequence the lifetime of the actuator is one of the major issues. If the piezoelectric element is
breakdown, the cavity will not be able to operate at high gradient (over 30 MV/m). On the other
hand the lifetime of the actuator is strongly depends on the preload force [Zickgraf 1995]. As a
consequence, one of the important issues is measurement and control of static force applied to the
element. The innovative methods developed by author are presented in Chapter 5.
Smart Materials as Sensors and Actuators for Lorentz Force Tuning System
Przemysław Sękalski Technical University of Łódź, Poland
Department of Microelectronics and Computer Science
18
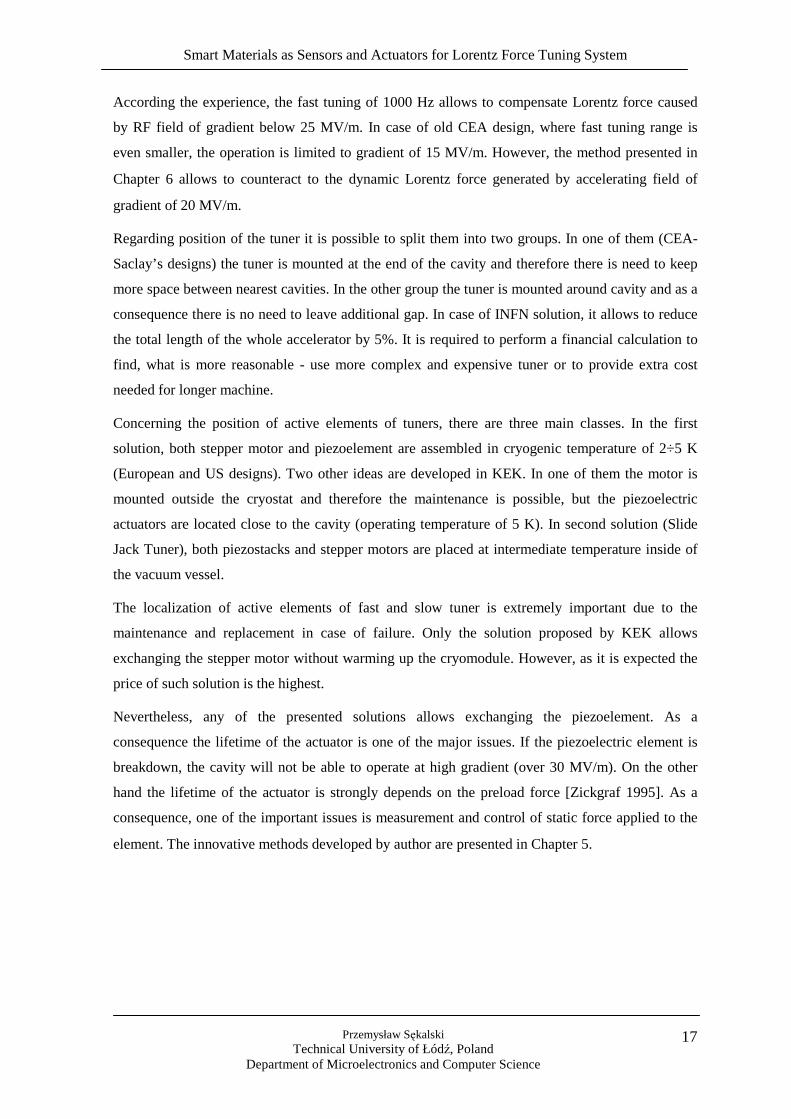
The double lever system Stepper motor with Harmonic Drive gear box The piezo frame with 2 NOLIAC piezo stacks
Figure 2.7 Drawing and photo of new design of CEA-Saclay - PTS tuner. [Bosland 2005]
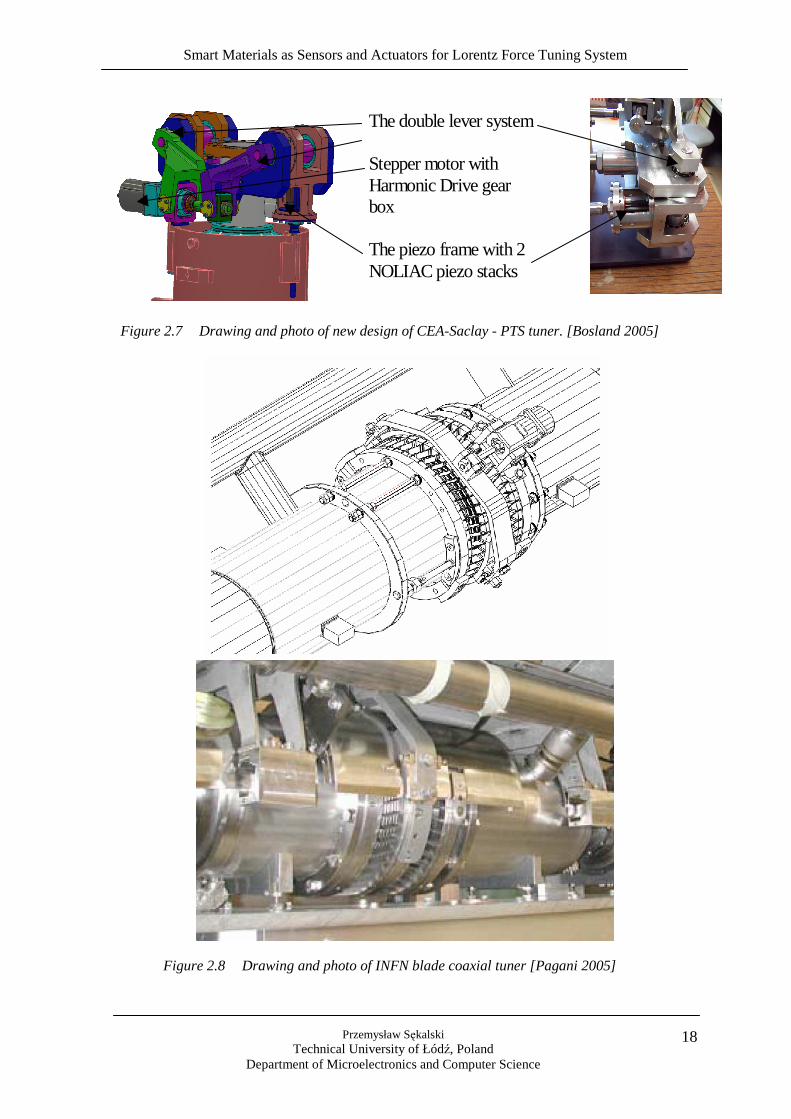
Figure 2.8 Drawing and photo of INFN blade coaxial tuner [Pagani 2005]
Smart Materials as Sensors and Actuators for Lorentz Force Tuning System
Przemysław Sękalski Technical University of Łódź, Poland
Department of Microelectronics and Computer Science
19
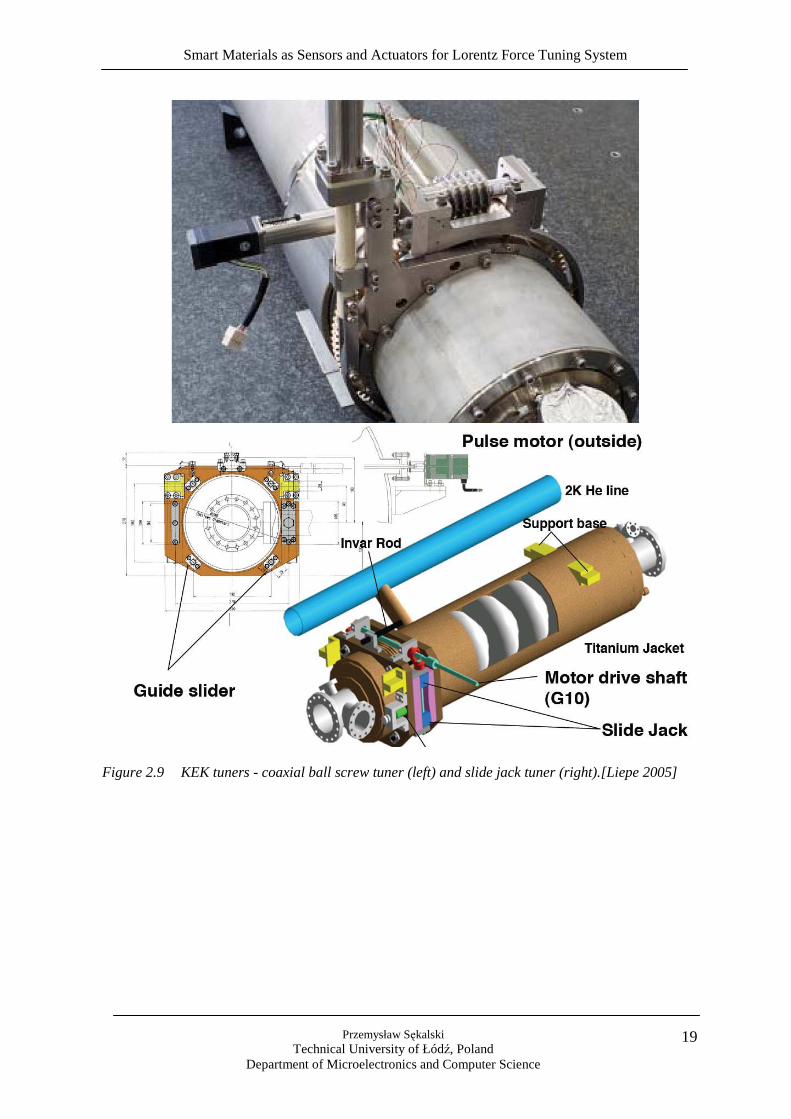
Figure 2.9 KEK tuners - coaxial ball screw tuner (left) and slide jack tuner (right).[Liepe 2005]
Smart Materials as Sensors and Actuators for Lorentz Force Tuning System
Przemysław Sękalski Technical University of Łódź, Poland
Department of Microelectronics and Computer Science
20
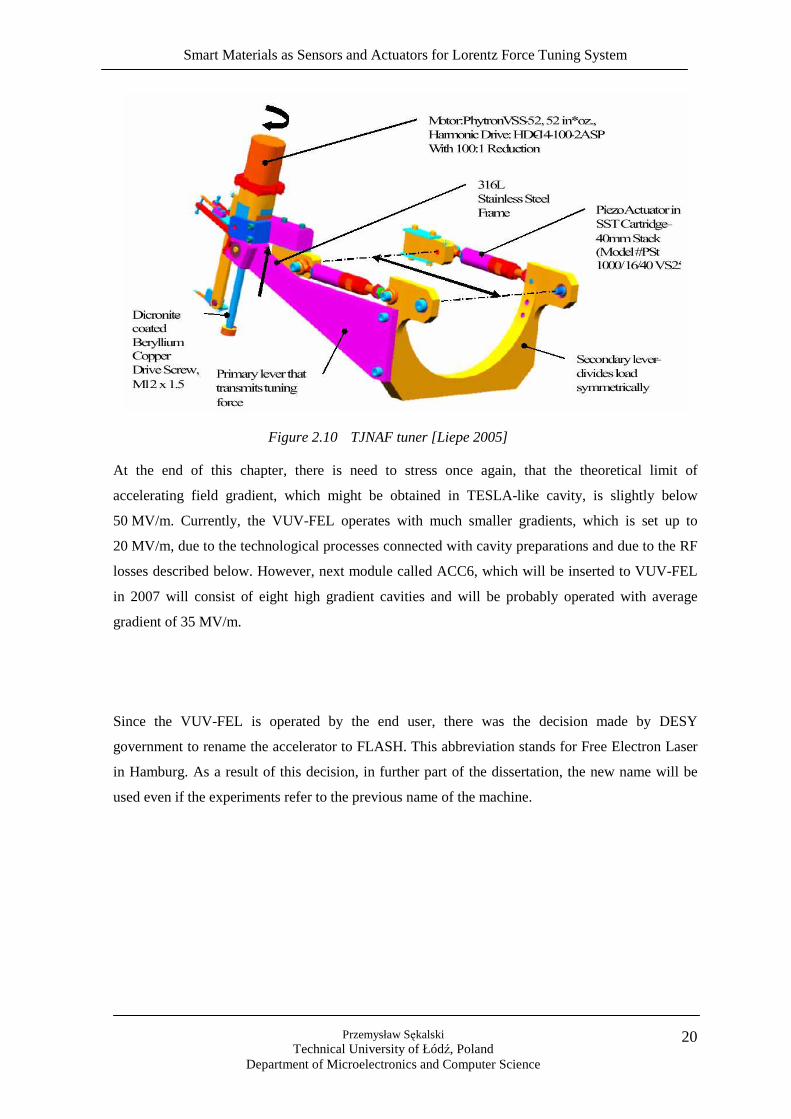
Figure 2.10 TJNAF tuner [Liepe 2005]
At the end of this chapter, there is need to stress once again, that the theoretical limit of
accelerating field gradient, which might be obtained in TESLA-like cavity, is slightly below
50 MV/m. Currently, the VUV-FEL operates with much smaller gradients, which is set up to
20 MV/m, due to the technological processes connected with cavity preparations and due to the RF
losses described below. However, next module called ACC6, which will be inserted to VUV-FEL
in 2007 will consist of eight high gradient cavities and will be probably operated with average
gradient of 35 MV/m.
Since the VUV-FEL is operated by the end user, there was the decision made by DESY
government to rename the accelerator to FLASH. This abbreviation stands for Free Electron Laser
in Hamburg. As a result of this decision, in further part of the dissertation, the new name will be
used even if the experiments refer to the previous name of the machine.
Smart Materials as Sensors and Actuators for Lorentz Force Tuning System
Przemysław Sękalski Technical University of Łódź, Poland
Department of Microelectronics and Computer Science
21
Chapter 3. Detuning sources In this chapter a detailed description of the detuning sources are given. As it was mentioned
previously, it is possible to split the cavity deformation sources into two main groups. One of them
is a Lorentz force, which is predictable and depends on the cavity parameters and accelerating field
gradient. The second one is microphonics – mechanical vibrations of surrounding environment,
which is fully stochastic. Both types of perturbation are presented in subsections 3.1 and 3.2
respectively.
Both phenomena were investigated previously in several papers and thesis. The most important
works in the field are the thesis of H. Gassot [Gassot 2001], M. Liepe [Liepe 2001b] and M.
Doleans [Doleans 2003a]. The first of them concentrate on the mechanical aspects of the Lorentz
force and as a result of the research the stiffening rings were introduced. These special rings are
mounted between the cells to improve the stiffness and reduce the detuning caused by Lorentz
force by factor of 2. The second thesis focuses on the manual method of compensation of Lorentz
force. The author proposes to use a piezostack for the purpose. He also proved the principle of the
method. The third one is focused on the system dedicated for the medium-beta cavities used for
Spallation Neutron Source SNS project. However, the analytical investigation can be applied to the
TESLA type cavities.
3.1. Lorentz force phenomenon description
The accelerating field gradients inside the single cell are equal to teens of MV/m. In case of
TESLA type cavity the RF reloaded frequency is set to 1.3GHz. As a consequence, a huge charge
flow through the thin surface layer of the cavity walls is caused. The movement of charges in
electromagnetic field is affected by the Lorentz force. The pressure, which is caused by these
forces, acts on the cavity wall. The radiation pressure Ps is calculated from equation:
−=
2
0
2
041 EHPs
εµ
(3.1)
where H
and E
are correspondently the magnetic and electric vectors of field
The distribution of Lorentz forces is presented in Figure 3.1. As it is shown the forces act inward
near the cell equator and outward near the cell bore. Due to the coaxial symmetry a 2 dimensional
model might be regarded. Only a single cell is investigated analytically due to the complexity of
calculation. The full nine-cell cavity was examined using Finite Element Method in PhD thesis of
H. Gassot [Gassot 2001].
Smart Materials as Sensors and Actuators for Lorentz Force Tuning System
Przemysław Sękalski Technical University of Łódź, Poland
Department of Microelectronics and Computer Science
22
Repulsive magnetic
forces
Attractive electric forces
Figure 3.1 Single cell deformation due to the internal electromagnetic forces (left side) and the
volume change caused by Lorentz force ∆V (right side).
As a result of the radiation pressure the cavity deforms, leading to a change in its shape. The
resonance frequency depends on the geometrical dimensions of the cavity; therefore finally the
Lorentz forces cause the resonance frequency modification. According to the Slater theory the
change of frequency caused by small change of the volume is given by formula [Slater 1950]:
( )∫∆
−=∆Vstored
dVHEE
ff 2
02
00
4µε
(3.2)
where ( )∫ −=V
stored dVHEE 20
204
1 µε is a stored energy in no deformed cavity
V is a volume of no deformed cavity
∆V is a change of the cavity volume caused by Lorentz force (see Figure 3.1)
f0 is a resonance frequency of unperturbed cavity
The distribution of the electromagnetic field in the cavity shows that close to the cell iris the
electric field dominates, but near the equator the magnetic part is larger. The calculation done for a
field gradient equal to 25 MV/m shows that the frequency shift is around 900 Hz. The computation
was performed using two assumptions. First of them is that the cavity is not stiffened. The second
necessary statement is the value of wall thickness of the cavity, which was set to 2.8 mm. The
frequency shift of less than 1 kHz seems to be very small comparing with the resonance frequency
of the cavity, which is 1.3 GHz. However, the loaded quality factor QL of cavity (equipped with the
main coupler and antennas) is equal to 3*106. Therefore the full bandwidth of the cavity is only
430 Hz. As a consequence, the reinforcement of the cavity is needed. To make the cavity stiffer it
is possibly to increase the thickness of the wall. However, this is a very expensive solution because
Smart Materials as Sensors and Actuators for Lorentz Force Tuning System
Przemysław Sękalski Technical University of Łódź, Poland
Department of Microelectronics and Computer Science
23
of cost of pure niobium used for cavities. It is stimulation for searching a new type of the cavities
i.e. the one made of copper and coated inside by thin layer of niobium [Bousson 2000].
Another disadvantage of this solution is a problem with the pre-detuning. There is need to adjust
the frequency of the cavity, after cooling down and helium pumping, to the frequency of master
oscillator. For TESLA type cavities the stiffness rings are used which are welded in between the
adjacent cells. However, the welded ring reduces the deformation of the cavity close to the iris, but
the cavity elasticity remains unchanged close to the equator of each cell. This simple solution
reduces the frequency shift caused by RF field of gradient of 25 MV/m to only 500 Hz [Gassot
2001].
Measurement of the static detuning was done at CHECHIA stand test at DESY [Schilcher 1998].
The cavity D39 was driven by continues RF wave. According to experiment the static detuning is
proportional to square of the magnitude of accelerating field gradient:
2~ accLEKf −∆
(3.3)
where KL is a Lorentz force detuning constant equal to 0.9 Hz/(MV/m)2
Eacc is a magnitude of accelerating field
The value of Lorentz force detuning constant KL was measured on the cavity (see Figure 3.2). This
constant varies slightly from cavity to cavity. Nowadays, it is assumed to be around 1 Hz/(MV/m)2.
Figure 3.2 Static Lorentz force detuning and Lorentz force coefficient. [Schilcher 1998]
In case of normal operation of FLASH, the cavities are operated in pulsed mode with repetition of
RF pulse between 1 to 10Hz. As a result, a dynamic Lorentz forces detuning need to be taken under
consideration. Proper measurements for different acceleration gradients were performed several
Smart Materials as Sensors and Actuators for Lorentz Force Tuning System
Przemysław Sękalski Technical University of Łódź, Poland
Department of Microelectronics and Computer Science
24
times. The example of detuning caused by the dynamic Lorentz force is presented in Figure 3.3. It
is visible that for gradients above the 20 MV/m the frequency change is higher than cavity half-
bandwidth (~230 Hz).
Low field
High field
FLAT TOP
Figure 3.3 Detuning caused by Lorentz force for different accelerating field gradients
3.2. Microphonics
The cavity is also deformed by the mechanical vibrations caused by external sources, which are
commonly called microphonics. There are plenty sources of them, for instance both the liquid
hydrogen and water cooling systems – especially pumps generates noise. Even a nonlinear flow of
LHe itself might disturb the geometry of the cavity. Another source is a human activity: walking
people, car traffic above the tunnel, civil works, etc. At last but not least, the seismic movement of
ground need to be taken under consideration.
The change of cavity frequency caused by microphonics is very low in comparison to Lorentz
force, and usually remains below 20 Hz. The measurement of microphonics influence was
performed in CHECHIA cryostat. The cavity was operated in continuous-wave (cw) mode. Both,
the detuning caused by microphonics in function of time and the distribution of resonance
frequency are presented in Figure 3.4 [Liepe 2001b].
It is also possible to measure the vibrations caused by Lorentz force and microphonics using the
piezoelectric element, which is inserted in fast tuner. The typical spectrum of the actuator response
Smart Materials as Sensors and Actuators for Lorentz Force Tuning System
Przemysław Sękalski Technical University of Łódź, Poland
Department of Microelectronics and Computer Science
25
for CHECHIA stand test is presented in Figure 3.6. The left figure shows the spectrum of signal
response when cavity was operated in cw mode. The right figure shows the ordinary spectrum of
piezostack output voltage excited by RF pulse. The accelerating field gradient was set 30 MV/m.
The RF pulse length was 800 µs.
The mechanical resonance around 287 Hz is clearly visible in both figures. It will be used later in
automatic Lorentz force compensation system ( Chapter 6). Nevertheless, there are also others
frequencies, which correspond to microphonics (i.e. He system, pumps). It is also visible that above
500 Hz there are no other resonances. As a consequence, the cavity damp higher frequencies and
the mechanical resonance cannot be excited.
20
Figure 3.4 Noise measured in cavity and distribution of frequency caused by microphonics. The cavity
was operated in cw mode in CHECHIA cryostat [Liepe 2001b].
Smart Materials as Sensors and Actuators for Lorentz Force Tuning System
Przemysław Sękalski Technical University of Łódź, Poland
Department of Microelectronics and Computer Science
26
Figure 3.5 Spectrum of piezostack output voltage. Data from CHECHIA stand test. Figure shows the
response in cw mode [Liepe 2001]
0 50 100 150 200 250 300 350 400 450 5000
0.002
0.004
0.006
0.008
0.01
0.012
0.014
X: 304.7Y: 0.01348
X: 50.78Y: 0.004701
X: 335.9Y: 0.002138
X: 287.1Y: 0.005005
X: 449.2Y: 0.002182
X: 296.9Y: 0.003184
frequency [Hz]
ampl
itude
[a.
u.]
Spectrum of piezostack response (CHECHIA 30 MV/m)
Figure 3.6 Spectrum of piezostack output voltage. Data from CHECHIA stand test. Figure shows the
response to RF field, accelerating field gradient 30 MV/m.
Smart Materials as Sensors and Actuators for Lorentz Force Tuning System
Przemysław Sękalski Technical University of Łódź, Poland
Department of Microelectronics and Computer Science
27
The microphonics might be compensated only by feedback system. The PID controllers cannot be
used because according to performed study, system is observable but not controllable. At this
moment study of single cell cavity is performed at INFN Milan [Paparella 2005]. Further work will
be soon published by the team, which is leaded by A. Bosotti.
3.3. Mechanical model of cavity
The mechanical model of the cavity was investigated in details by Hui Min Gassot in her thesis
[Gassot 2001]. Due to the complexity of mechanical behaviour of the nine-cell cavity the finite
element method implemented in CAST3M software was used. Furthermore, the comparison of the
model simulations and measurements was done. The results are presented in Figure 3.8 and Figure
3.8. It is visible a good correlation between the calculation and reality. It is important to remark that
due to the symmetry of the cavity only a two dimensional model of half-cavity might be
considered.
However, also a full nine-cell model was investigated to find mechanical modes of the cavity. The
results of the simulation are very close to the one obtained from measurement and presented in
Figure 3.6.
detu
ning
∆f
[Hz]
time [µs]
Figure 3.7 The cavity detuning obtained from FEM simulation done using CAST3M [Gassot 2001].
Smart Materials as Sensors and Actuators for Lorentz Force Tuning System
Przemysław Sękalski Technical University of Łódź, Poland
Department of Microelectronics and Computer Science
28
detu
nin
g ∆f
[Hz]
time [µs]
Figure 3.8 The cavity detuning obtained from measurement done at DESY.
3.3.2. Direct and inverse transfer functions between piezo stack and RF field
For optimal controller of piezoelement it would be very helpful to measure the transfer functions
between the RF field and the piezostack and the inverse one. Since, it is easy to measure the
piezoelement response to particular field (i.e. Figure 3.9), it is hard to measure the opposite effect.
-1 0 1 2 3 4 5 6 7 8
x 10-3
-0.4
-0.3
-0.2
-0.1
0
0.1
0.2
0.3
X: 0.0013Y: -0.2961
time [s]
volta
ge [V
]
Piezostack output voltage
X: 0.0005Y: -0.2646
Figure 3.9 Output voltage of piezostack inserted in CHECHIA stand test. (red line represents the RF
field, blue line is a piezostack response).
Smart Materials as Sensors and Actuators for Lorentz Force Tuning System
Przemysław Sękalski Technical University of Łódź, Poland
Department of Microelectronics and Computer Science
29
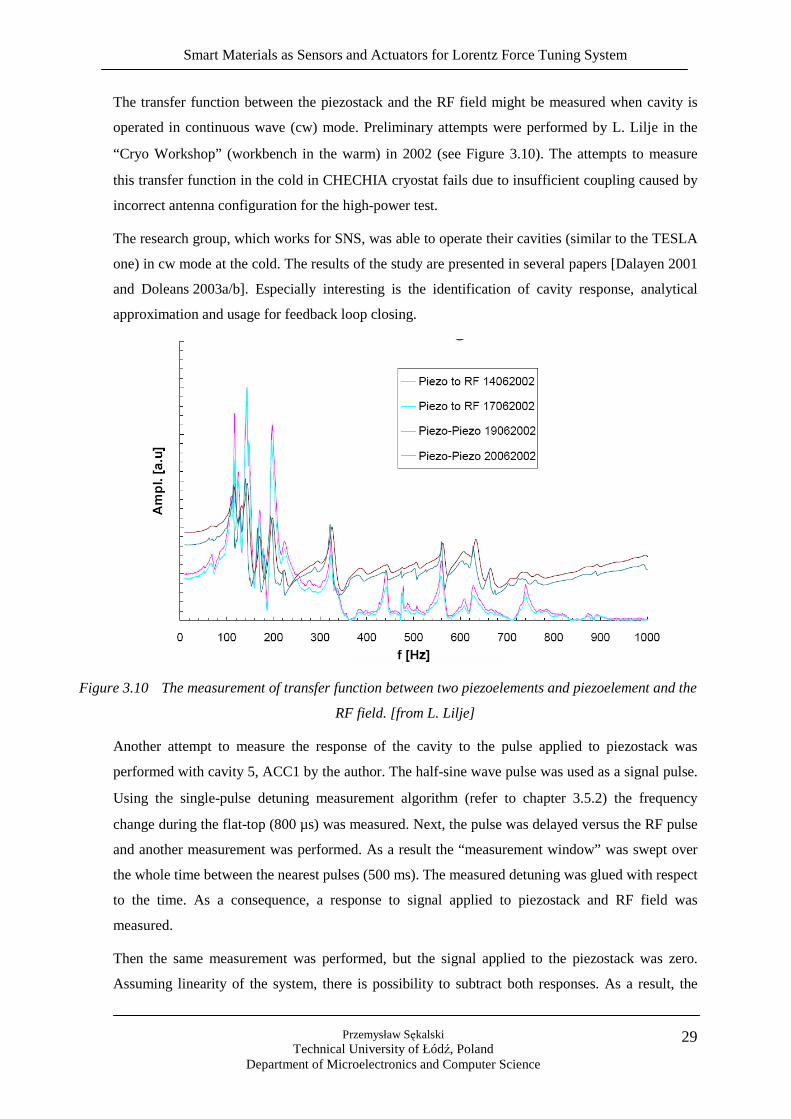
The transfer function between the piezostack and the RF field might be measured when cavity is
operated in continuous wave (cw) mode. Preliminary attempts were performed by L. Lilje in the
“Cryo Workshop” (workbench in the warm) in 2002 (see Figure 3.10). The attempts to measure
this transfer function in the cold in CHECHIA cryostat fails due to insufficient coupling caused by
incorrect antenna configuration for the high-power test.
The research group, which works for SNS, was able to operate their cavities (similar to the TESLA
one) in cw mode at the cold. The results of the study are presented in several papers [Dalayen 2001
and Doleans 2003a/b]. Especially interesting is the identification of cavity response, analytical
approximation and usage for feedback loop closing.
Figure 3.10 The measurement of transfer function between two piezoelements and piezoelement and the
RF field. [from L. Lilje]
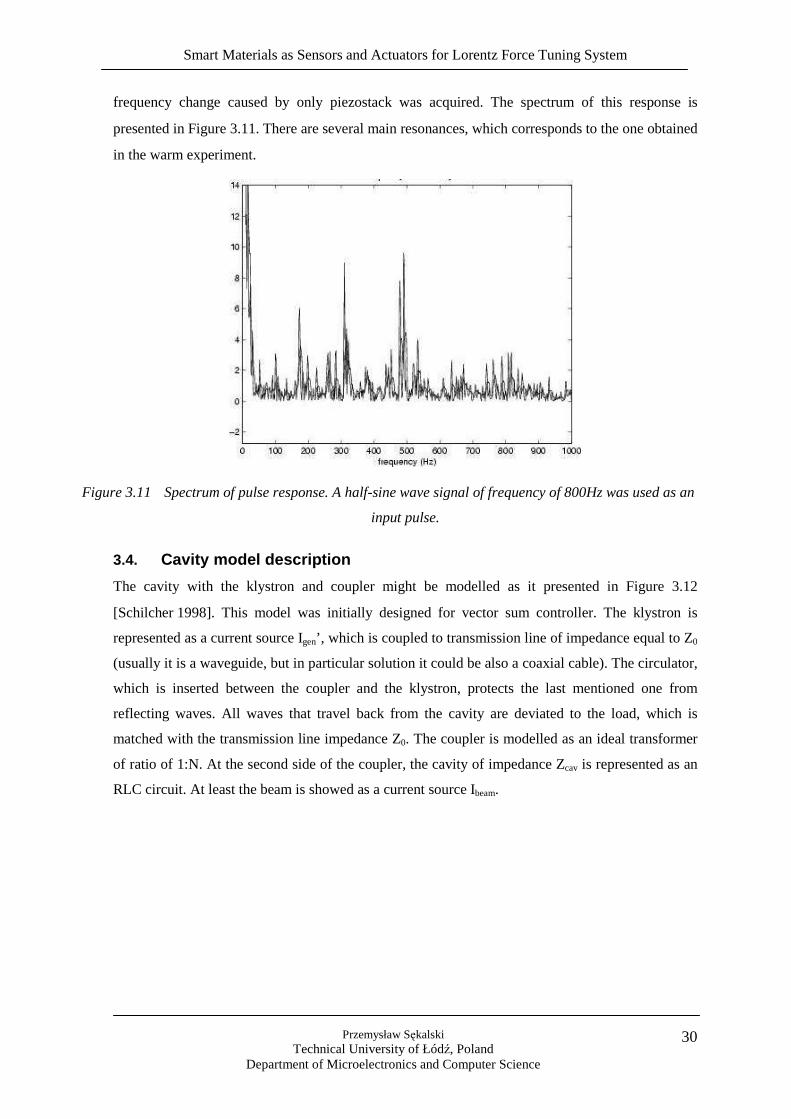
Another attempt to measure the response of the cavity to the pulse applied to piezostack was
performed with cavity 5, ACC1 by the author. The half-sine wave pulse was used as a signal pulse.
Using the single-pulse detuning measurement algorithm (refer to chapter 3.5.2) the frequency
change during the flat-top (800 µs) was measured. Next, the pulse was delayed versus the RF pulse
and another measurement was performed. As a result the “measurement window” was swept over
the whole time between the nearest pulses (500 ms). The measured detuning was glued with respect
to the time. As a consequence, a response to signal applied to piezostack and RF field was
measured.
Then the same measurement was performed, but the signal applied to the piezostack was zero.
Assuming linearity of the system, there is possibility to subtract both responses. As a result, the
Smart Materials as Sensors and Actuators for Lorentz Force Tuning System
Przemysław Sękalski Technical University of Łódź, Poland
Department of Microelectronics and Computer Science
30
frequency change caused by only piezostack was acquired. The spectrum of this response is
presented in Figure 3.11. There are several main resonances, which corresponds to the one obtained
in the warm experiment.
Figure 3.11 Spectrum of pulse response. A half-sine wave signal of frequency of 800Hz was used as an
input pulse.
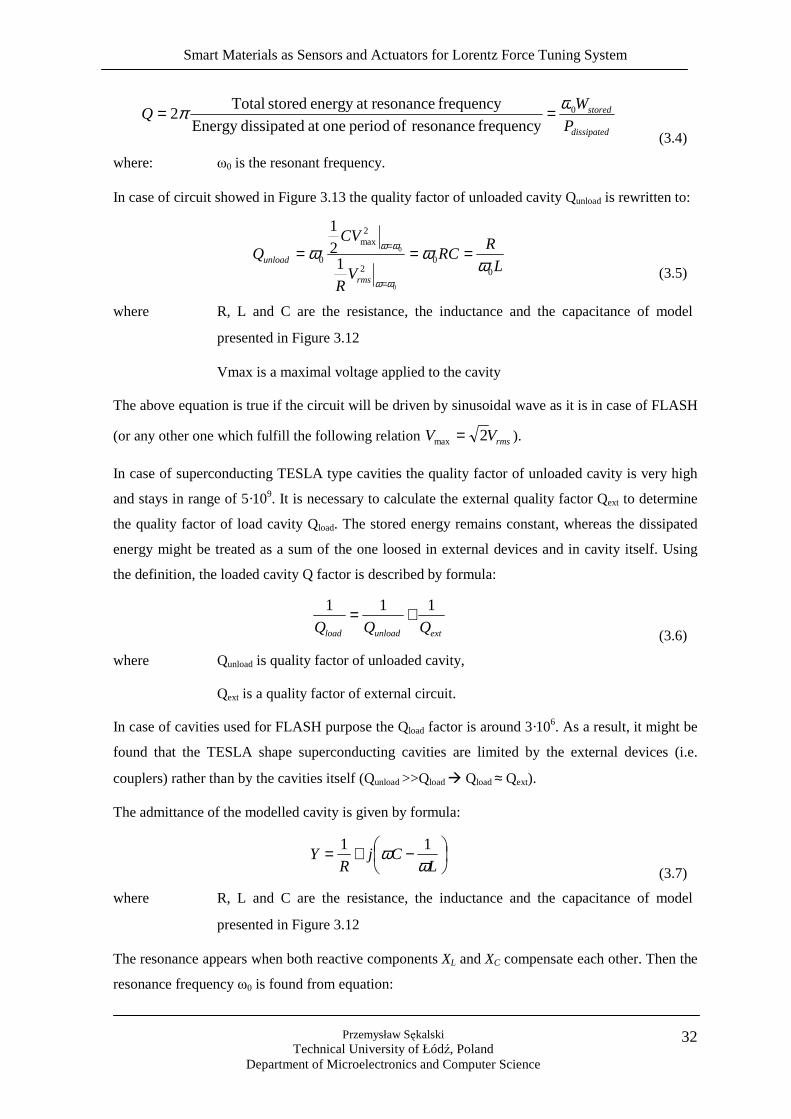
3.4. Cavity model description
The cavity with the klystron and coupler might be modelled as it presented in Figure 3.12
[Schilcher 1998]. This model was initially designed for vector sum controller. The klystron is
represented as a current source Igen’, which is coupled to transmission line of impedance equal to Z0
(usually it is a waveguide, but in particular solution it could be also a coaxial cable). The circulator,
which is inserted between the coupler and the klystron, protects the last mentioned one from
reflecting waves. All waves that travel back from the cavity are deviated to the load, which is
matched with the transmission line impedance Z0. The coupler is modelled as an ideal transformer
of ratio of 1:N. At the second side of the coupler, the cavity of impedance Zcav is represented as an
RLC circuit. At least the beam is showed as a current source Ibeam.
Smart Materials as Sensors and Actuators for Lorentz Force Tuning System
Przemysław Sękalski Technical University of Łódź, Poland
Department of Microelectronics and Computer Science
31
Ucav
Icav
L R C Z0 Igen’ Z0
Z0
transmission line
transmission line
circulator
load
COUPLER 1:N
CAVITY Zcav
RF generator
BEAM
Ibeam
Figure 3.12 The model of cavity connected to a RF generator by coupler and transmission lines
[Schilcher 1998]
For further investigations, it is more useful to operate with the model, which is seen from cavity
side (see Figure 3.13). As previously, the resonant cavity is considered as a special case of resonant
RLC circuit where the inductance L and the capacitance C represent a lumped element or its
distributed equivalent, and the resistance R symbolizes the losses in the circuit connected with
capacitance and inductance imperfection as well as with the wall losses of the cavity resonator. The
Zext represents external losses (in example coaxial cable, in general Zext = N2 · Z0). As previously the
current sources represent the RF field source (Igen) and the beam (Ibeam). Due to the circulator and
the coupler the current, which represents RF source is equal to Igen’=2Igen/N.
Ucav
Icav
L R C Zext
Igen Ibeam
cavity
RX
CjX
LjX
R
C
L
=
=
=
ω
ω1
Figure 3.13 The simplified model of cavity circuit.
Since the cavity is a resonance device it is useful to introduce the parameter, which describes its
efficiency – a quality factor Q. From the general definition of Q factor, it is given as:
Smart Materials as Sensors and Actuators for Lorentz Force Tuning System
Przemysław Sękalski Technical University of Łódź, Poland
Department of Microelectronics and Computer Science
32
dissipated
stored
P
WQ 0
frequency resonance of period oneat dissipatedEnergy
frequency resonanceat energy stored Total2
ωπ == (3.4)
where: ω0 is the resonant frequency.
In case of circuit showed in Figure 3.13 the quality factor of unloaded cavity Qunload is rewritten to:
L
RRC
VR
VCQ
rms
unload0
02
2max
0
0
0
121
ωωω
ωω
ωω ===
=
=
(3.5)
where R, L and C are the resistance, the inductance and the capacitance of model
presented in Figure 3.12
Vmax is a maximal voltage applied to the cavity
The above equation is true if the circuit will be driven by sinusoidal wave as it is in case of FLASH
(or any other one which fulfill the following relation rmsVV 2max = ).
In case of superconducting TESLA type cavities the quality factor of unloaded cavity is very high
and stays in range of 5·109. It is necessary to calculate the external quality factor Qext to determine
the quality factor of load cavity Qload. The stored energy remains constant, whereas the dissipated
energy might be treated as a sum of the one loosed in external devices and in cavity itself. Using
the definition, the loaded cavity Q factor is described by formula:
extunloadload QQQ
111 += (3.6)
where Qunload is quality factor of unloaded cavity,
Qext is a quality factor of external circuit.
In case of cavities used for FLASH purpose the Qload factor is around 3·106. As a result, it might be
found that the TESLA shape superconducting cavities are limited by the external devices (i.e.
couplers) rather than by the cavities itself (Qunload >>Qload Qload ≈ Qext).
The admittance of the modelled cavity is given by formula:
−+=L
CjR
Yω
ω 11
(3.7)
where R, L and C are the resistance, the inductance and the capacitance of model
presented in Figure 3.12
The resonance appears when both reactive components XL and XC compensate each other. Then the
resonance frequency ω0 is found from equation:
Smart Materials as Sensors and Actuators for Lorentz Force Tuning System
Przemysław Sękalski Technical University of Łódź, Poland
Department of Microelectronics and Computer Science
33
LC
10 =ω
(3.8)
For TESLA shape cavity the resonance frequency f0 is set to 1.3GHz. The steady-state description
of the circuit showed in Figure 3.13 is given by equation:
dt
tdI
CtV
LCdt
tdV
CZRdt
tVd
ext
)(1)(
1)(111)(2
=+
++
(3.9)
where I = I beam + I gen is a sum of the beam current and the RF field current.
The above equation may be rewritten using the quality factor and resonance frequency to:
dt
tdI
Q
RtV
dt
tdV
Qdt
tVd
load
L
load
)()(
)()( 0202
0
ωωω =++
(3.10)
where RL is a parallel connection of resistance R and Zext
However, the system is operated in pulse mode, therefore there is need to introduce a transient
behaviour description instead of steady-state one. Several assumptions have to be made:
the beam and the RF generator current are turned on for a long time compared to characteristic
filling time of the cavity,
the cavity is weakly damped system (1/Qload<<1) therefore the resonance frequency ωres equal to:
20 41
1load
res Q−= ωω is approximated to ω0,
the second order time derivatives are neglected.
By applying the above assumption to equation (3.10), a state space equation might be written:
ɺ u
I
I
R
R
x
V
V
x
V
V
dt
d
gL
L
gg
+
−∆∆−−
=
Im
Re
2/1
2/1
Im
Re
2/1
2/1
Im
Re
0
0
BA
ωω
ωωωω
(3.11)
where ( )( ) ti
g
tig
etiItItI
etiVtVtVω
ω
)()()(
)()()(
ImRe
ImRe
+=
+=
represents a complex field vector,
loadQ20
2/1
ωω = is the bandwidth of cavity resonator equal to 216 Hz,
the measured value is around 230 Hz
ωωω −=∆ 0 is a detuning of the cavity.
Using the matrix notification the differential equation becomes:
Smart Materials as Sensors and Actuators for Lorentz Force Tuning System
Przemysław Sękalski Technical University of Łódź, Poland
Department of Microelectronics and Computer Science
34
)()()( tutxtx BA +=ɺ
(3.12)
where A and B matrices are the one from equation
The general solution of equation (3.10) is given as:
( ) ')'()0()(0
' dttuexetxt
ttt BAA∫
−+= (3.13)
where
∆∆∆−∆
= −
)cos()sin(
)sin()cos(2/1
tt
ttee tt
ωωωωωA ,
the initial state for t0=0 ⇒
=
)0(
)0()0(
Im
Re
gV
Vx .
The above equation introduces the cavity detuning from master oscillator frequency ∆ω. The cavity
shape determines the resonance frequency. Thus, any mechanical perturbation influences on the
electrical parameters of the resonator. From measurement performed at DESY, one can find that if
the over-one-meter-long cavity is compressed by 1 µm, then the resonance frequency change is
around 300 Hz.
3.5. Detuning measurement
Measurement of detuning is one of the mayor issues for tuning system. There is possibly to
estimate the detuning using the piezoelement, however it is more reasonable to use forward,
reflected and probe signal acquired from the cavity itself. The second solution uses
electromechanical model presented in previous subchapter.
There are two methods of detuning measurement: multi-pulse and single pulse one. First of them
was proposed by T. Schilcher in his thesis [Schilcher 1998]. The second one was developed during
the research with A. Brandt. Both methods are shortly presented bellow and then a comparison is
given.
3.5.1. Multi-pulse detuning measurement
During the operation the cavity is pulsed with RF field. However, when forward power is removed
the stored RF field starts oscillation with frequency of the detuned cavity. The frequency shift
might be measured by comparison of phase of free ringing cavity versus the master oscillator clock.
The slope of the phase is proportional to the detuning (see Figure 3.14) [Schilcher 1998].
Smart Materials as Sensors and Actuators for Lorentz Force Tuning System
Przemysław Sękalski Technical University of Łódź, Poland
Department of Microelectronics and Computer Science
35
Figure 3.14 Principle of detuning measurement in multi-pulse method [Schilcher 1998].
Using this method it is possible to measure the detuning during whole pulse. However, there is
need to shorten the forward power pulse and measure the slope of the phase for each time. As a
consequence there is need to perform several runs (usually around 100) with different RF pulse
length to obtain the detuning change in time. Of course, the presented method is invasive and
cannot be used during the normal operation. It was an inspiration for developing a single pulse non-
perturbing method of the detuning measurement.
3.5.2. Single pulse detuning measurement
The single pulse method base on the electromechanical model of the cavity presented in section
3.4. Rewriting the equation (3.10) it is possible to find the value of the detuning in respect to the
amplitude and phase of the signal applied to the cavity (forward power) and the one measured
inside it (probe signal). The formula for the detuning is given as:
( )
−−−=∆ probefor
probe
forprobe
U
U
dt
dφφω
φπ
ω sin22
12/1
(3.14)
where Ufor is a magnitude of forward power,
φfor is a phase of forward power,
Uprobe is a magnitude of probe signal,
φprobe is a phase of probe signal,
Smart Materials as Sensors and Actuators for Lorentz Force Tuning System
Przemysław Sękalski Technical University of Łódź, Poland
Department of Microelectronics and Computer Science
36
Using the above equation, there is possibility to measure the detuning on-line. In case of algorithm
presented in Chapter 6 it was implemented in MATLAB script. However, the algorithm might be
easily implemented in FPGA chip [Jalmuzna 2006]. The board, which was used, is equipped with
powerful programmable IC Virtex II Pro. Originally it is used for LLRF control purpose and only
few percent of resources is used for presented algorithm. The results obtained with hardware
implementation of algorithm are presented in Figure 3.15.
One of the important issues, which need to be solved for future usage of this method, is noise
elimination. The presented method base on derivative of the phase, and as a consequence of that it
is very sensitive to all changes of signal. The phase noise is visible as two glitches in the beginning
an in the end of the flat top. There is need to use a smooth filter, but then the additional delay need
to be taken into account.
Figure 3.15 The cavity detuning measured using FPGA board. The scope screenshot [Jalmuzna 2006].
3.5.3. Comparison of single and multi-pulse detuning measu rement
Both presented above methods – single and multi-pulse was compared to each other. The results
are presented in Figure 3.16. There is need to note that they are shifted in time by 100µs because of
the delay of ADC board.
The main difference between these two methods is the fact, that the multi-pulse method requires
changing the pulse length, whereas the single pulse one is non invasive. As a consequence, it is
possible to monitor the detuning all the time and what is more important it does not interfere with
the experiment performed with the beam. Another advantage of the second method is possibility of
implementation in FPGA-based system. As a result, the information about the detuning will be
available on-line with a delay of hundreds ns. It means that the cavity frequency might be monitor
Smart Materials as Sensors and Actuators for Lorentz Force Tuning System
Przemysław Sękalski Technical University of Łódź, Poland
Department of Microelectronics and Computer Science
37
with 1 MHz, which is set as a main sample repetition for LLRF system. Such a promising outcome,
allows compensating even the microphonics.
Figure 3.16 Comparison of single and multi-pulse detuning measurement method. FLASH, accelerating
field gradient is set to 10.85 MV/m (left) and 15MV/m (right). LLRF feedback is switched off. A
100 µs shift between the measurements is caused by DAC board delay.
3.6. Conclusion
In this chapter the information about detuning sources were presented. They were classified to two
groups – to the periodic and predictive one, which are connected with Lorentz-force effect, and to
Smart Materials as Sensors and Actuators for Lorentz Force Tuning System
Przemysław Sękalski Technical University of Łódź, Poland
Department of Microelectronics and Computer Science
38
the stochastic one, which are caused by microphonics. The Lorentz-force phenomenon was
described in details. Moreover, the mechanical study and electromechanical model of the
superconducting TESLA type cavity were explained. The new method of detuning measurement,
which base on the presented model, was described. At the end, it was compared to the previous
method, which requires pulse length changing.
Using the knowledge presented in previous chapters it is possible to clearly define the requirements
for the electromechanical system required for fast tuning. The actuator, used for this purpose, need
to compensate the few microns of cavity length change. Moreover, the active elements must react
at least with speed of 0.01 µm/µs. The stiffness of the tuning system should be over 10 µm/kN,
whereas the blocking force of the actuator needs to be above 3 kN. Next chapter is dedicated to the
active elements, which fulfils the above requirements and might be operated at 2 K in radiation
environment without the damage.
Smart Materials as Sensors and Actuators for Lorentz Force Tuning System
Przemysław Sękalski Technical University of Łódź, Poland
Department of Microelectronics and Computer Science
39
Chapter 4. Smart materials
4.1. Introduction
Smart materials are ordinary name for wide group of different substances. The common feature of
all of them is the fact that one or more properties might be dramatically altered under controlled
condition. Most everyday materials have physical properties, which cannot be significantly
changed, for example if oil is heated it will become a little thinner, whereas a smart material with
variable viscosity may turn from a fluid which flows easily to a solid.
For the purpose of tuning system used for linear accelerator, there is need to use a material, which
will change its length. The movement must be in range of several micrometers, but the resolution
must be measured in teens of nanometres. The device must be also quick and strong enough – the
slew rate of elongation should be over 0.01 µm/µs and the blocking force should be above 6 kN.
One can imagine a mechanical apparatus, which could fulfil the above parameters, however the
final system must work reliable for 1010 cycles in high vacuum, radioactive environment of
temperature of 2K (below –270oC). That was the reason to explore different smart materials, which
could be later used for tuner design.
As a consequence, two type of smart materials are investigated as an actuator for tuner purpose:
• piezoelectric stacks,
• magnetostrictive rods.
Both phenomena are well known and they are used for long time (piezoelectricity was discovered
by Pierre and Jacques Curie in 1880, and the magnetostriction – by James Prescott Joule in 1840).
Both of them exist as a direct and an inversed effect. Beside diverse material, in which given
phenomenon exist; the main difference is the stimulus. The piezoelectric stacks are driven by
electric fields supplied by metal plates, which are built in the stack, whereas the magnetostrictive
rods are controlled by magnetic flux usually generated by the coil, which is assembled around the
active element. As the result, from electrical circuit point of view, the first group is commonly
treated as capacitors and are voltage driven components, whereas the second set of used smart
materials are regarded as a current driven inductances ( Figure 4.1).
Smart Materials as Sensors and Actuators for Lorentz Force Tuning System
Przemysław Sękalski Technical University of Łódź, Poland
Department of Microelectronics and Computer Science
40
HHH
Figure 4.1 Piezoelectric stack and magnetostrictive rod principle of operation.
This chapter describes both types of smart materials in details. The parameters at room temperature
and at cryogenic environment are presented. The elements are regarded as an actuator and sensor.
The parameters with high importance for fast tuning purpose are underlined. In section 4.2 the
piezoelectric stack from EPCOS, NOLIAC, Physical Instrumente (PI), PiezoJENA and
Piezomechanik manufacturers are investigated. Section 4.3 is dedicated to magnetostrictive rods
from ENERGEN and ETREMA.
4.2. Piezoelectric stacks
The piezoelectric elements have evaluated for more than 120 years. The Curie brothers discovered
the direct piezoelectric effect in 1880. The name of the effect is a concatenation of two words
“piezo”, which stands in Greek for pressure, and the “electricity”. It clearly defines that it is a
generation of electricity from applied stress. The converse piezoelectric effect was deduced from
fundamental thermodynamic principles by Lippmann in 1881 and was immediately confirmed by
experiments. For next 20 years after the discovery, the core of piezoelectric applications science
was established. In 1910 Voigt’s “Lehrbuch der Kristallphysics” was published which quickly
became the standard reference for the future development. Nowadays, the main reference for
piezoelectricity is publication of standards committee of the Institute of Electrical and Electronics
Engineers [SC IEEE 1987]. It is the most widely recognized description of piezoelectric ceramic
behaviour.
From physics of solids, it is known that piezoelectricity is very common effect. It exist in non-
centrosymmetric crystal classes materials except the cubic class 432 [Soluch 1980]. All of them
shows the dipole behavior. The reason of that is a charge separation between the positive and
negative ions. Groups of dipoles with parallel orientation are called Weiss domains. In raw PZT
material the Weiss domains are randomly oriented. However it is possible to align them. For this
purpose the element is heated and the high electric field is applied (over 2 kV/mm). Under this
Smart Materials as Sensors and Actuators for Lorentz Force Tuning System
Przemysław Sękalski Technical University of Łódź, Poland
Department of Microelectronics and Computer Science
41
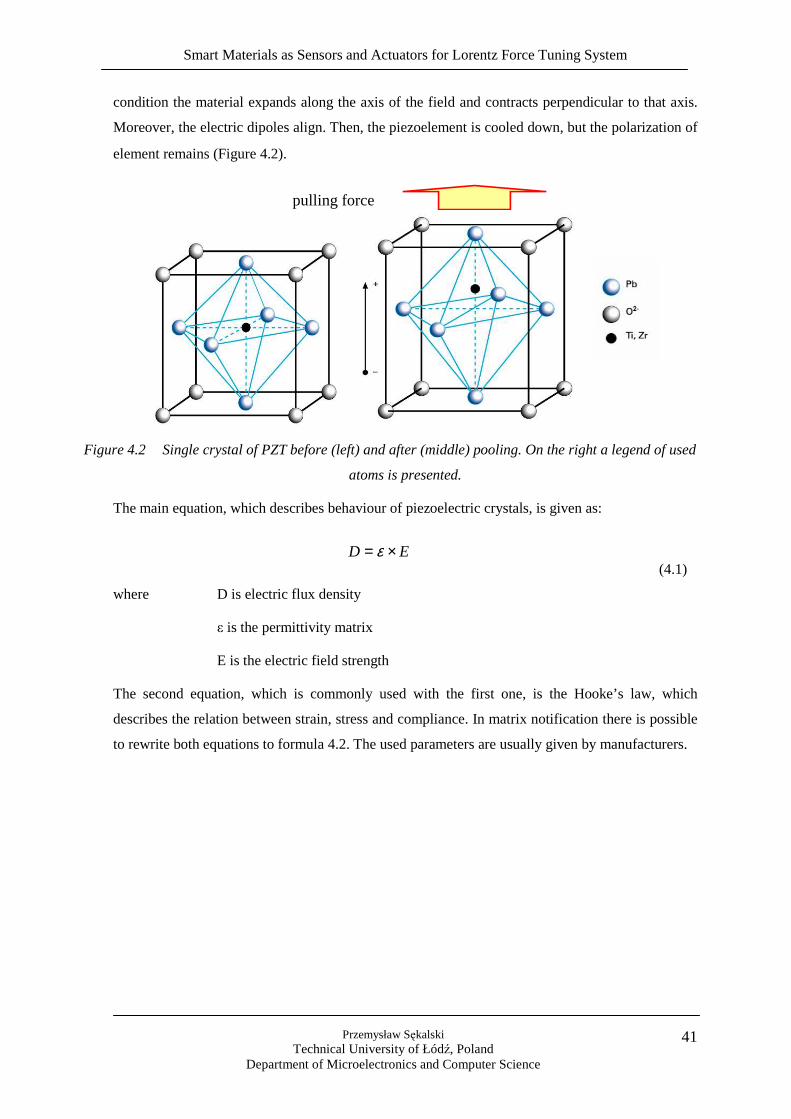
condition the material expands along the axis of the field and contracts perpendicular to that axis.
Moreover, the electric dipoles align. Then, the piezoelement is cooled down, but the polarization of
element remains ( Figure 4.2).
pulling force
Figure 4.2 Single crystal of PZT before (left) and after (middle) pooling. On the right a legend of used
atoms is presented.
The main equation, which describes behaviour of piezoelectric crystals, is given as:
ED ×= ε
(4.1)
where D is electric flux density
ε is the permittivity matrix
E is the electric field strength
The second equation, which is commonly used with the first one, is the Hooke’s law, which
describes the relation between strain, stress and compliance. In matrix notification there is possible
to rewrite both equations to formula 4.2. The used parameters are usually given by manufacturers.
Smart Materials as Sensors and Actuators for Lorentz Force Tuning System
Przemysław Sękalski Technical University of Łódź, Poland
Department of Microelectronics and Computer Science
42
+
=
3
2
1
15
15
33
31
31
6
5
4
3
2
1
66
44
44
331313
131112
131211
6
5
4
3
2
1
000
00
00
00
00
00
00000
00000
00000
000
000
000
E
E
E
d
d
d
d
d
T
T
T
T
T
T
s
s
s
sss
sss
sss
S
S
S
S
S
S
E
E
E
EEE
EEE
EEE
+
=
3
2
1
33
11
11
6
5
4
3
2
1
333131
15
15
3
2
1
00
00
00
000
00000
00000
E
E
E
T
T
T
T
T
T
ddd
d
d
D
D
D
εε
ε
(4.2)
where S is a strain vector
s is a compliance matrix
T is a stress vector
d is a piezoelectric coefficient matrix
superscript E stands for measurement done at zero, or constant, electric field
( )EEE sss 121166 2 −=
Recent development in piezoelectric materials is focused on development of new materials, which
will have higher piezoelectric coefficients. Simultaneously, the very thin layers of crystal (around
100 µm) are stacked together to improve the elongation of whole actuator. The electrode is inserted
between the adjacent layers. As a consequence, electric field applied to the single layer is in range
of few MV/m (100 V over 100 µm).
4.2.1. Piezoelement characterization and comparison
For purpose of FLASH a piezostack from EPCOS (LN 01/8002), Physik Instrumente (P-888.90
PIC255), Piezomechanik (PSt 150/10/60VS15 TT/UHV), and NOLIAC (SCMAS/S1/A/10/10/20
/200/42/6000) were investigated (see Figure 4.3). All of them are the low voltage piezoelectric
stacks, which might be operated up to 200 V. Only the Piezomechanik one was supplied with metal
cover and it was initially preloaded.
Smart Materials as Sensors and Actuators for Lorentz Force Tuning System
Przemysław Sękalski Technical University of Łódź, Poland
Department of Microelectronics and Computer Science
43
Figure 4.3 Photographs of used piezostacks. From left to right: EPCOS, PI, Piezomechanik, NOLIAC
(not in scale).
The parameters of tested piezoelement are presented in Table 4.1. The one from EPCOS was used
for FLASH tuner, however according to performed test two others – NOLIAC and PI should be
taken under consideration for next development. The one from PiezoMechanik produces more
failure than the previous ones and therefore were not investigated in details.
Table 4.1 Parameters of tested piezoelements
Parameter name Units EPCOS NOLIAC PI Piezo-
mechanik
Material PZT-Nd34 PZT pz27 PZT 255 PZT 5H Case/preload no no No yes/400N
Length mm 30 30 36 55
Cross-section mm2 7 x 7 10 x 10 10 x 10 7.5 x 7.5
Young Module kN/mm2 51 45 48.3 55
Stroke (300K) µm 40 42 35 60
Main resonance frequency kHz 66 40 14
Stiffness N/µm 83 150 105 56
Blocking force kN 3.2 6.3 3.6 4
Density kg/m3 7800
Minimum voltage @ 300K V -20
Maximum voltage @ 300K V 160 200 120 150
Slew rate V/ms 1.6
Load current A 20
Capacitance nominal (Fload=0N)
µF 2.1 5.7 12.4 13.4
Capacitance measured (Fload =0N)
µF 2.1 5.7 13.6
Capacitance (Fload =850N) µF 3.4
Capacitance @10K µF 3.4 1.43
Loss factor (tan δ) 0.015
Smart Materials as Sensors and Actuators for Lorentz Force Tuning System
Przemysław Sękalski Technical University of Łódź, Poland
Department of Microelectronics and Computer Science
44
Initially the actuators were studied at room temperature of 300 K. Then the behaviours at LHe
temperature range were investigated [Sekalski 2005c]. Sample of result is presented in the thesis.
Full characterization will be covered in a detailed report, which will soon be published by the
M. Fouaidy from IPN-Orsay.
In the Figure 4.4 displacement of PI piezostack at 300K is presented. The maximal elongation is
over 40 µm for voltage of 120 V. The stroke of element dramatically decreases with the
temperature, what is presented in Figure 4.5. For temperatures below 10K the element elongates
only by 5 µm and drops more with temperature decreases. Therefore a reduction of stroke of 8
times is visible. It is important to remark that for purpose of FLASH the elongation of 3 µm at 2 K
is required (red dashed line). As a result, there is need to use a piezostacks, which at room
temperature have stroke at least equal to 40 µm.
Figure 4.4 Displacement of PI piezoelement at 300K
Smart Materials as Sensors and Actuators for Lorentz Force Tuning System
Przemysław Sękalski Technical University of Łódź, Poland
Department of Microelectronics and Computer Science
45
Figure 4.5 Maximum displacement (stroke) versus temperature (PI piezostack)
Another parameters, which were detailed investigated, are the magnitude and the phase of the
piezoelement impedance. The sample of measurement is presented in Figure 4.6. The measurement
was done using a LCR Agilent 4293 B. The impedance of the actuator decreases with the
temperature whereas the phase remains almost constant (less than 1 degree).
Figure 4.6 Magnitude and phase of impedance in function of temperature
The parallel capacitance and resistance of the PI piezoelectric stack in function of temperature is
shown in Figure 4.7. The capacitance decreases by factor of 3÷4 when cooled down to LHe
temperatures. It is due to the contraction of the element and, what is more important, it is due to the
changing of properties of piezoelectric crystal itself. The piezoelectric stack at cryogenic
Smart Materials as Sensors and Actuators for Lorentz Force Tuning System
Przemysław Sękalski Technical University of Łódź, Poland
Department of Microelectronics and Computer Science
46
environment might be operated in wider range of voltages. Moreover, the so-called butterfly
behavior of elongation in function of applied voltage, which is visible at room temperatures,
becomes almost linear and as a result the actuator might be operated with bipolar voltages.
Figure 4.7 Parallel capacitance and resistance of piezoelement in function of temperature
The loss tangent was also studied during the piezoelement investigation. The sample of
measurement done for PI piezoelement is presented in Figure 4.8.
Figure 4.8 Loss tangent in function of temperature,
Another important issue, which was investigated, was a radiation hardness of the piezoelement. A
special experiment to check the behaviour of irradiated actuator was performed at CERI – Orleans,
France. The element was cooled down to 4.2 K and then exposed for 20h to the neutron radiation.
The total acquired dose was calculated to 1.76÷3.09 1014 n/cm². The only visible effect was the
increasing the capacitance due to the heating caused by fast neutron beam.
Smart Materials as Sensors and Actuators for Lorentz Force Tuning System
Przemysław Sękalski Technical University of Łódź, Poland
Department of Microelectronics and Computer Science
47
1,535
1,54
1,545
1,55
1,555
1,56
1,565
5,1 5,2 5,3 5,4 5,5 5,6 5,7
T ( K )
Cp
( uF
)
Figure 4.9 Capacitance in function of temperature during fast neutron beam test. (NOLIAC)
At the end of this chapter, there is need to mention that a long lifetime test of NOLIAC and PI
actuator were performed at LN2 temperature (77 K). The elements were pulsed by over 109 cycles
and no significant degradation was observed (see Figure 4.10) [Bosotti 2005d]. However there is
need to mention that preload force was set to optimal value of 1.2 kN (one third of the blocking
force).
Figure 4.10 Stroke in function of applied load before and after lifetime test.
According to the literature [Zickgraf 1995] and [PI web] the lifetime of the piezoelectric stack
strongly depends on the static force applied to the actuator. Higher preload causes a mechanical
fatigue of material and significantly reduces the MTBF factor. Therefore, correct preload of one
Smart Materials as Sensors and Actuators for Lorentz Force Tuning System
Przemysław Sękalski Technical University of Łódź, Poland
Department of Microelectronics and Computer Science
48
third of the blocking force is necessary for long operation of fast tuning system. Thus, the Chapter
5 is dedicated to static force measurement at LHe environment.
The presented above issue is important especially for the tuners in which the active element is
assembled inside the cryomodule and therefore cannot be easily replaced with the new one.
Depending on the repetition rate the lifetime of the actuator should be above 1010 cycles (20 Hz for
10 years of operation).
4.3. Magnetostrictive rods
At the current state two types of magnetostrictive elements seem to fulfil above requirements - one
of them is fabricated by ENERGEN INC, the other by ETREMA. Material from first company is
called KELVIN ALL®, the other GalFeNOL. There is need to use special materials because the
ones commonly used at room temperature i.e. Terfenol-D does not work correctly at LHe
environment (see Figure 4.11). The others like TbDyZn are extremely expensive (even 5÷10 times
more than Kelvin All). In general the magnetostrictive rods are twice or three times more expensive
than piezoelectric stack of the same properties.
0
0,1
0,2
0,3
0,4
0,5
0,6
0 50 100 150 200 250 300 350
temperature [K]
elon
gatio
n (%
)
TbDyZnPZTKELVIN ALLTerfenol D
Figure 4.11 Elongation of different materials in function of temperature [Mavanur 2003]
First of the magnetostrictive element rod is made of material called KELVIN All®. Its
magnetostriction is range of thousands of ppm (see Figure 4.11) [Energen 2003]. Manufacturer
claims that the 18 mm length rod has a stroke around 20 µm. The full-length elongation takes only
250 µs, which stands for control speed of 0.08 µm/µs. It may operate in radioactive, high vacuum
Smart Materials as Sensors and Actuators for Lorentz Force Tuning System
Przemysław Sękalski Technical University of Łódź, Poland
Department of Microelectronics and Computer Science
49
environment. However, currently there is no data about degradation in time caused by radiation.
Assumed lifetime is higher than 1010, but a proper test needs to be performed to verify this
statement.
KELVIN ALL®
0
500
1000
1500
2000
2500
3000
0 20 40 60 80 100 120 140 160
magnetic field (H) [Am-1]
mag
neto
stric
tion
(ppm
)
4.2K
77K
293K
Figure 4.12 Magnetostriction of KELVIN ALL material (courtesy of ENERGEN)
The company ENERGEN, INC provide a tuner with magnetostrictive rod inside. The draft view
with dimensions and its photo are presented in Figure 4.13. The details of magnetostrictive tuner
are shown in Figure 4.14.
22 mm 50 mm
61
.8 m
m
Figure 4.13 Magnetostrictive element with metal frame – the draft view with dimensions (left) and its
photo (right).
Smart Materials as Sensors and Actuators for Lorentz Force Tuning System
Przemysław Sękalski Technical University of Łódź, Poland
Department of Microelectronics and Computer Science
50
Kelvin All rod
ferrite
superconducting coil (Nb3Sn)
copper heat plates
Figure 4.14 At the bottom a magnetostrictive rod with Nb3Sn coil and ferrite ring is presented.
The tuner was validated in the vertical cryostat [Sekalski 2005b]. A special insert was designed,
which consist of a frame in which, two active elements were assembled in series: the piezoelectric
one from NOLIAC, which works as a sensor, and the magnetostrictive one from ENERGEN as an
actuator (see Figure 4.15). The special screw mounted on top allows adjusting the system
compression. The preload force was set at room temperature to 1.2 kN.
NOLIAC piezostack
Screw for preload adjustment
Magnetostrictive tuner
Figure 4.15 Photos of insert for the vertical cryostat.
Three temperature sensors were glued to base, to magnetostrictive tuner frame, and to metal block
close to piezoelectric sensor. They allow controlling heat flow through the system during
experiment. Additionally, they indicate if the insert is well thermal stabilized. The whole system
was cooled down to 4 K. The coil was thermally stabilized by two thermal cooper connectors,
which were attached to the metal cover ( Figure 4.15 – in the middle). It allows keeping the
superconducting coil made of Nb3Sn below critical temperature.
Smart Materials as Sensors and Actuators for Lorentz Force Tuning System
Przemysław Sękalski Technical University of Łódź, Poland
Department of Microelectronics and Computer Science
51
To superconducting coil was driven by voltage to current transducer (device base on APEX PA93
linear power amplifier). The maximum output current is slightly over 8 Amps. Over this value the
amplifier saturates. Remarkable is fact, that the inductance of the coil is 2.4 mH, therefore also high
voltage is necessary to reload coil with frequency of 1 kHz. Due to the heat dissipation, the
transducer might work only in pulse mode. The input signal is set in Rhode & Schwartz function
generator.
The magnetic field inside the coil elongates the magnetostrictive rod. Noliac’s piezoelement acts as
a displacement sensor. When pressed it generates voltage, which was registered on the scope.
Similar experiment with two Noliac piezostacks was performed previously. At that time, one
piezostack acted as a sensor, the second as an actuator.
Comparing the results from both experiments, the elongation of magnetostrictive tuner was
calculated [Sekalski 2005b]. The results is presented in Figure 4.16. The coil was supplied by half-
sine current wave. The current amplitude was changed from 0.4 to 8.3 Amps.
0
0,2
0,4
0,6
0,8
1
1,2
1,4
1,6
1,8
0 2 4 6 8 10
input current [A]
disp
lace
men
t [um
]
Figure 4.16 Calculated displacement of magnetostrictive rod versus applied current.
First of all, the experiment indicates that KELVIN ALL material works at 4K. Nevertheless,
the elongation of the magnetostrictive rod is smaller than presented in datasheet (4 µm for 8 A).
However, it might happen that the preload force was not well controlled and it was higher than
1kN, because stiffness of fixture was unknown.
Figure 4.17 Photo of GalFeNOL rod of cross-section of 7x7 mm and length of 18 mm.
Smart Materials as Sensors and Actuators for Lorentz Force Tuning System
Przemysław Sękalski Technical University of Łódź, Poland
Department of Microelectronics and Computer Science
52
The second set of actuators is made of GalFeNOL (see Figure 4.17). It is a composition of gal, iron
and rare earth minerals. Its dimensions are 6x6x20mm. It has smaller magnetostriction than
KELVIN ALL® by factor of 2÷3. Moreover, it has no lamination to reduce the edgy current, as the
previous one. On the other hand, it is at least twice cheaper than ENERGEN solution. According to
the manufacturer, it will fulfil the requirement list, but till now it was tested only in liquid nitrogen.
The precise characterization of GalFeNOL rods at LHe environment will be done in the nearest
future.
4.4. Conclusion
Two types of smart materials have been investigated as an actuator for fast tuning system for
TESLA type cavities. The piezoelectric stacks are used for longer time and therefore their
behaviour is better understanding. The influences of temperature and neutron radiation were
studied in details. As well, the lifetime issues were taken under consideration. As a result two
stacks – one from NOLIAC, the other from PI – were chosen for further validation. Both of them
fulfils requirement for fast tuning components. The one important remark which need to be stressed
is the fact, that both element must be correctly preloaded to guarantee the required lifetime. It is a
reason of study presented in next chapter, in which a different method of static force measurement
at LHe environment is investigated.
The alternative solution base on the magnetostrictive tuner. However, the research on these devices
is not as well advanced as on the piezoelectric one. Nevertheless, the magnetostrictive rods were
successfully operated at cryogenic temperatures (4 K) and the stroke was in the required range of
2 µm. In the nearest future, a test with cavity in horizontal cryostat is planed.
Smart Materials as Sensors and Actuators for Lorentz Force Tuning System
Przemysław Sękalski Technical University of Łódź, Poland
Department of Microelectronics and Computer Science
53
Chapter 5. Force measurement
5.1. Introduction
One of the most important parameter, which needs to be taken under consideration, is the static
force applied to the piezostack, when it is cooled down to the desired temperature. It not only
indicates the stroke of the actuator as it is described in Chapter 4.2. But also according to the
literature it also changes the lifetime of the actuator [Zickgraf 1995].
The active elements are assembled in the cryomodule at room temperature. After that, the structure
is closed and then it is pumped to gain a high vacuum in the module. The tank is filled up with
helium. Due to the pressure difference the force distribution is modified. Moreover, the system is
also cooled down to the desired operation temperature of 1.8 K. The temperature coefficient of
expansion (TCE) of materials used for cryomodule insert construction is diverse; therefore shared
stresses are generated when temperature is varying. As a consequence, both processes lead to shift
of the force applied to piezostack.
If the displacement of the internal elements of cryomodule is huge it may happen that the
piezostack will be completely released and, in the worst case, it may fall out from the fixture. It
was the reason to design special holdings for active element, which have four fingers. Moreover,
the metal handle helps to arrange the actuator in correct position during assembling process. In
contrary, if the piezostack are preloaded too much the stroke is reduced. At the limit, if the preload
force is higher than blocking force, the element no longer elongates.
There is possible to roughly estimate the preload force, but due to the complexity of the system the
error could be enormous. That is the reason to introduce the force sensor. The commercial solutions
are either too big to fit into the tuner or they are too expensive. In this chapter different method
developed by authors and CARE project co-workers are presented. Part of the measurements was
done at IPN Orsay, France and INFN Milan, Italy. Three types of method are presented. There is
possibility to use a strain gauge sensor, as it is describe in section 5.2. However it is more
convenient to use one of the two other methods, which do not require additional sensor and base
only on the piezostack itself. The first method, developed by author, which base on shift of
resonance on the impedance curve is described in section 5.33. The second one, showed in section
5.4, bases on the capacitance change in function of applied force. This method is developed in IPN
Orsay and arises as the consequence of the first one.
3 For this invention the author gained a Gold Medal on 54th The World Exhibition of Innovation, Research and New Technologies, “BRUSSELS EUREKA 2005” and prize of Ministry of Education and Science in Poland.
Smart Materials as Sensors and Actuators for Lorentz Force Tuning System
Przemysław Sękalski Technical University of Łódź, Poland
Department of Microelectronics and Computer Science
54
5.2. Strain gauge
Strain gauge is a well-known device whose electrical resistance varies in proportion to the amount
of strain in the device. One of the most widely used gauges is the bonded metallic strain gauge. The
metallic strain gauge consists of a thin wire arranged in a grid pattern or, what is more often
nowadays, the metallic foil is used. To improve the sensor response, the amount of metallic wire or
foil subject to strain in the parallel direction is improved, whereas the cross-section of single wire is
minimized to reduce the effect of shear strain and Poisson Strain. The whole grid structure is tied to
the thin carrier, which is attached directly to the element on which stress is measured (see Figure
5.1). To increase the range of measured force it is possible to use as a basement a metallic structure
of known stiffness – in example a membrane or cantilever. Whole strain experienced by the test
specimen is transferred directly to the strain gauge, which responds with a linear change in
electrical resistance. The sensors available commercially have nominal resistance in range of few
hundreds to few thousand of Ohms.
Grid
Solder tabs
End loops
Act
ive
leng
th o
f grid
Thin carrier i.e. foil
Figure 5.1 Overview of metallic strain gauge sensor
One of the most important parameters of strain gauges is gauge factor (GF). It is the ratio of
fractional change in electrical resistance to the fractional change in length (strain), what is written
as:
εRR
LL
RRGF
/// ∆=
∆∆=
(5.1)
where ε is a strain
The gauge factor of typical metallic strain gauges varies from 1 to 5 and it is relatively low in
comparison to the semiconductor-based one in which gauge factor due to the piezoresistive effect is
usually above 100. The piezoresistive effect besides the advantages has several negative attributes.
First of all, it is a nonlinear thus the output signal is not direct proportional to the strain. It is also
Smart Materials as Sensors and Actuators for Lorentz Force Tuning System
Przemysław Sękalski Technical University of Łódź, Poland
Department of Microelectronics and Computer Science
55
very dependent to the temperature. Another disadvantage is the semiconductor itself, which usually
is very fragile and therefore it might be exposed to relatively limited strain range (typically 3000 to
10,000 microstrain units compared to the 100,000 microstrain units for a metallic resistance gauge).
The Wheatstone bridge configuration is used to increase the sensor sensibility (see Figure 5.2).
There are at least three types of possible configuration: quarter, half and full bridge. The output
voltage versus supplied voltage is given by formula:
Force
Gauge in tension (R+∆R)
Gauge in compresion (R-∆R)
Vout VDD
R+∆R
Vout VDD
R+∆R
R-∆R
Vout VDD
R+∆R
R+∆R
R-∆R
R-∆R
Figure 5.2 Gauge placement on measured plate (top) and configuration of strain gauges (bottom)
- quarter (left), half (center) and full Wheatstone bridge circuit (right)
for quarter bridge circuit configuration:
+−=
εε
21*1
1
4
*
GF
GF
V
V
DD
out
(5.2)
for half bridge circuit configuration:
2
* εGF
V
V
DD
out −=
(5.3)
for full bridge circuit configuration:
ε*GFV
V
DD
out −=
(5.4)
It is important to locate the strain gauges in places where strain is maximal. Moreover, if a full
bridge or half bridge configuration is used, some gauges must work in tension whereas the other
must work in compression to unbalance the bridge (see Figure 5.2).
Another important issue, which need to be taken under consideration when strain gauges are
operated, is a thermal compensation of the sensor. Commonly used technique bases on the
placement on the inflexible area the second set of Wheatstone bridge of the same type of gauges.
Smart Materials as Sensors and Actuators for Lorentz Force Tuning System
Przemysław Sękalski Technical University of Łódź, Poland
Department of Microelectronics and Computer Science
56
As the consequence, the temperature change acts on both sets of bridges, but only one of them is
affected by applied stress. The final signal proportional only to applied stress is calculated as a
difference of response of both bridges.
During the research, both types of strain gauge were investigated – metallic and semiconductor
ones. The metallic foil type gauges from FLEX company were tested in the beginning. These small
and cheap sensors have high sensitivity for low applied forces (see Figure 5.3), but unfortunately
they were too fragile for our purpose. The static force, which is applied to piezostack, might be
equal even up to 6 kN. For this strength the foil was deformed permanently. This is the reason to
use a metal support on which gauges was glued. These types of devices are more complex and as a
consequence more expensive but allow operating with higher preloads.
R [kΩ]
F[N]
3000 3 1,5
0,1
100
100,05
Y=-0,033 X + 100,1
Figure 5.3 Resistance change of FLEX strain gauge sensor in function of applied force.
The commercial available sensors are designed for room temperature and the materials used for
their construction were unstable at LHe environment (i.e. the glue crystallizes and crumbles). The
test of standard load cell from BURSTER manufacturer 8415-6002 at LHe temperature were
performed at DESY-Hamburg and at INFN Milan independently. The output signal was unstable
and was not repeatable. The main problems were the plastic deformations of the glue and the
choice of the strain gauges. In further research, a custom load cell has been realized and tested in
order to verify the performances of cryogenic devices. The tests made in LHe on the prototype
have been successful and proved that this load cell can work in cryogenic environment with good
sensitivity and repeatability (see Figure 5.4) [Bosotti 2005b].
The presented force sensor has a linear response in whole applied load range. Due to the cryostat
limitation higher loads could not be measured. Several performed run shows that the sensitivity is
constant and equal to 0.02 mV/kg (~0.2 mV/N). Moreover, what is also important the same
sensitivity is for room temperature and only offset value varies with temperature.
Smart Materials as Sensors and Actuators for Lorentz Force Tuning System
Przemysław Sękalski Technical University of Łódź, Poland
Department of Microelectronics and Computer Science
57
One of the main disadvantages of the sensor is its size. The cell presented in Figure 5.4 has a
diameter of 10 cm and will not fit to current design of PTS or CTS tuner. The smaller device is
under design and will be available in the mid of 2006.
Figure 5.4 Load cell developed for cryogenic operation and its transfer characteristics.
[Bosotti 2005b]
One of the disadvantages of strain gauge sensor beside its price is an offset voltage, which needs to
be annulling. Since now, two samples of load cell for LHe temperature operation have been
manufactured. First measurements performed at 4 K shows that the output voltage is linear in
function of applied force (above 300 N), but the offset of both devices is different (see Figure 5.5).
As a consequence, the independent characterization of each force sensor is highly recommended.
Smart Materials as Sensors and Actuators for Lorentz Force Tuning System
Przemysław Sękalski Technical University of Łódź, Poland
Department of Microelectronics and Computer Science
58
T=4 K
y = 1,70E-05x + 1,32E-02
R2 = 9,62E-01y = 1,84E-05x + 1,22E-02
R2 = 9,82E-01
0,0120
0,0125
0,0130
0,0135
0,0140
0,0145
0,0150
0,0155
0,0160
0,0165
0,0170
0 20 40 60 80 100 120 140 160 180 200
load [Kg]
outp
ut v
olta
g [m
V]
8415-6002 s/n:185021
8415-6002 s/n:184992
Figure 5.5 Output voltage of two samples of strain gauge sensor dedicated for LHe temperature
operation. [Bosotti 2005b]
5.3. Shift of piezoelectric stack resonant frequency
Another method of measurement of static force applied to piezostack is the investigation of
characteristic parameters of actuator itself. As it was described in chapter 4.2 the piezoelement is a
dynamic force sensor. Thus, it might measure only a relatively fast change of applied load and
cannot be used for static force evaluation. The mechanical energy of stress is transferred to
electrical energy because of positive and negative charges centre shifts (refer to Chapter 4).
Unfortunately, due to the measurement and the actuator itself, the charges are dissipated, and the
voltage decays to zero value. The relaxation time depends on the size and material of actuator
(which determines the capacitance) and the resistance of external circuit and parasitic resistance of
sensor. When piezostack is connected to the scope (few MΩ of input resistance), the charge on
piezoelectric plates remains only for few seconds. One of the solutions to improve the time is using
a MOS transistor. The piezostack output voltage drives the gate of transistor. The resistance of
MOS channel is proportional to the gate voltage; therefore it might be used for force estimation.
Due to the fact that the leakage current between gate and source is very low, then the setup,
presented in Figure 5.6, might be used even for quasi-static measurement.
Smart Materials as Sensors and Actuators for Lorentz Force Tuning System
Przemysław Sękalski Technical University of Łódź, Poland
Department of Microelectronics and Computer Science
59
I
piezostack
force applied to actuator DC voltage source
Figure 5.6 Overview of circuit configuration for quasi-static force measurement using the piezostack.
However, the above-presented solution cannot be used for the case of FLASH. The actuator are
assembled into the cryomodule in room temperature, then the module is placed in the line with the
others, cooled down, and at least the stepper motor are used to tune the cavity to desired 1.3GHz.
Whole process is extremely long and takes few weeks. In this time the charge generated by force
applied to piezostack dissipates. Moreover, the properties of piezoactuator are changing with
temperature so the output signal will be influenced. That is the reason to search for other
techniques of static force measurement.
According to the literature the piezoelectric element has two resonances – parallel and series one
(see Figure 5.7). The frequencies are commonly called resonance (fr) and anti-resonance (fa).
However, according to the performed measurement, the multilayer piezostack has several pairs of
the resonances. The typical measured impedance curves of NOLIAC, EPCOS and PI active
elements are presented in Figure 5.8. It is worth to notice that the resonances observed by author
are well below the main resonance of piezostack, which usually appears in range of few hundreds
kHz (depends on material, size and construction of actuator).
10 1000,01
0,1
1
10
100 fa
fr
Impe
danc
e [ ΩΩ ΩΩ
]
frequency [kHz]
Figure 5.7 Typical example of an impedance-versus-frequency plot for piezoelement that indicates the
resonance frequency (fr) and the antiresonance frequency (fa).
Smart Materials as Sensors and Actuators for Lorentz Force Tuning System
Przemysław Sękalski Technical University of Łódź, Poland
Department of Microelectronics and Computer Science
[Bosotti 2005a] A. Bosotti, R. Paparella, F. Puricelli; “Piezo Impedance Measurements”,
Internal note, INFN Milan, Italy, 2005,
[Bosotti 2005b] A. Bosotti, P. Pierinia, P. Michelatoa, C. Paganib, R. Paparellaa, N.
Panzeria, L. Monacoa, R. Paulona, M. Novatia; “CARE activities on
superconducting RF cavities at INFN Milano” INFN-Milan, Italy, internal
report, 2005, CARE-Conf-05-047-SRF
[Bosotti 2005c] A. Bosotti et all, “Report on Fast Piezo Blade Tuner (UMI) for SCRF
Resonators Design and Fabrication”, CARE-Note-2005-021-SRF
[Bosotti 2005d] A. Bosotti et all, “PI piezo lifetime test report”, INFN Milan, Italy, internal
report, CARE-Note-2005-020-SRF
[Bousson 2000] S. Bousson, M. Fouaidy, H. Gassot, T. Junquera, J-C. Le Scornet, J. Lesrel,
“Cavity Stiffening By Thermal Spraying”, Proceedings of EPAC 2000,
Vienna, Austria
[Brinkmann 2001] R. Brinkmann, K. Flöttmann, J. Rossbach, P. Schmüser, N. Walker, H.
Weise, “TESLA Technical Design Report Part II: The Accelerator”, DESY
2001-011, ECFA 2001-209, 2001.
[Brinkmann 2002] R. Brinkmann, et all “TESLA XFEL, Technical Design Report Supplement”,
DESY 2002-167, 2002.
[Claeyssen 2002] F. Claeyssen, N. LHermet, T. Maillard, “Magnetostrictive Actuators
Compared to Piezoelectric Actuators” ASSET, European Workshop on
Smart Structures in Engineering and Technology, France, 2002, ISSN 0277-
786X and 2003, ISSU 4763, pages 194-200
[Chao 1999] A. W. Chao, M. Tigner, “Handbook of Accelerator Physics and
Engineering”, World Scientific, Singapore, 1999.
[Davis 2003] G. K. Davis, J. R. Delayen, “Piezoelectric Tuner Compensation of Lorentz Detuning in Superconducting Cavities”, Proceedings of the 2003 Particle Accelerator Conference, pp. 1383-1385
[Delayen 2001] J.R. Delayen, “Electronics Damping of Microphonics in Superconducting
Cavities”, Proceedings of the 2001 Particle Accelerator Conference,
Chicago, JLAB-ACT-01-11
Smart Materials as Sensors and Actuators for Lorentz Force Tuning System
Przemysław Sękalski Technical University of Łódź, Poland
Department of Microelectronics and Computer Science
99
[Doleans 2003a] M. Doleans, “Studies in reduced-beta elliptical superconducting cavities”,
PhD thesis, University Paris 7 – Denis Diderot, 2003
[Doleans 2003b] M. Doleans, “Insights in The Physics of the Dynamic Detuning in SRF
Cavities and its Active Compensation”, Proceedings of the 2003 Particle
Accelerator Conference, pp. 1599-1601
[Gassot 2001] H. Gassot, “Etudes de la stabilité mécanique des cavités supraconductrices et
de la méthode de rigidification par projection thermique de cuivre”, PhD
Figure 5.9 Setup for impedance change measurement 60
Figure 5.10 Impedance of two EPCOS piezostacks (dashed and solid lines) in function of preload from
0 N (blue) to 2kN (red). Measurements performed at room temperature. 61
Figure 5.11 Resonance frequencies shift in function of preload for EPCOS piezostack- left figure for
the resonance around 30kHz, the right for the resonance around 65kHz. 61
Smart Materials as Sensors and Actuators for Lorentz Force Tuning System
Przemysław Sękalski Technical University of Łódź, Poland
Department of Microelectronics and Computer Science
104
Figure 5.12 Resonance frequency shift in function of applied force for PI piezostack from ch0201,
ch0214 and ch0215 series. Top figure shows resonance around 30kHz, bottom figure
presents resonance shift around 60kHz. 62
Figure 5.13 Resonance shift of EPCOS piezostack at 4K in function of applied force. [Bosotti 2005a] 64
Figure 5.14 Photo of single fixture with EPCOS piezostack. The fixture is assembled to the cavity
tuner in CHECHIA cryostat. 65
Figure 5.15 EPCOS piezostack resonance shift in function of position of stepper motor. Test done in
CHECHIA. Resonance around 70kHz. 66
Figure 5.16 Change of force applied to piezostack in function of position of stepper motor (CHECHIA
stand test) when motor moved upward and downward. Red dotted line is smoothed
estimation of force. 66
Figure 5.17 Resonance frequency of cavity in function of position of stepper motor. 67
Figure 5.18 The change of capacitance of Piezo JENA (9222) versus applied force at RT. 68
Figure 5.19 Capacitance of PICMA piezoelectric actuator versus preloading force at T=4.4 K,
vacuum pressure 10-5mBar. Test performed at IPN-Orsay in July 2005.[Fouaidy 2005] 68
Figure 5.20 Sensitivity of piezoelectric actuator to preload force versus temperature 69
Figure 6.1 Overview of control system 71
Figure 6.2 Photograph of CTS tuning system attached to the cavity. 72
Figure 6.3 The idea of fast tuner based on piezoelectric stack 72
Figure 6.4 Panel for piezoelectric devices control 75
Figure 6.5 Shape of the pulse with variable parameters. 76
Figure 6.6 Coefficients of detuning linearization and standard deviation from measurement in
function of delay time between beginnings of RF pulse and piezostack signal. 77
Figure 6.7 Coefficients of detuning linearization and standard deviation from measurement in
function of width of the piezostack signal. 78
Figure 6.8 Coefficients of detuning linearization and standard deviation from measurement in
function of rise time of the piezostack signal. 79
Figure 6.9 Coefficients of detuning linearization and standard deviation from measurement in
function of amplitude A1 (a) and A2 (b) of the piezostack signal, when changed
independently. 80
Figure 6.10 Coefficients of detuning linearization and standard deviation from measurement in
function of amplitude A1 and A2 increased simultaneously. 81
Figure 6.11 Shape of the pulse with variable parameters 82
Figure 6.12 Coefficients of detuning linearization and standard deviation from measurement in
function of delay time. 82
Figure 6.13 Coefficients of detuning linearization and standard deviation from measurement in
function of amplitude of multi-pulse signal. 83
Figure 6.14 Coefficients of detuning linearization and standard deviation from measurement in
function of frequency of multi-pulse signal. The end of the 4 pulses is fixed. 84
Smart Materials as Sensors and Actuators for Lorentz Force Tuning System
Przemysław Sękalski Technical University of Łódź, Poland
Department of Microelectronics and Computer Science
105
Figure 6.15 Illustration of difference in fixing point. Left figure present situation when end of the pulse
is fixed in respect to RF pulse (not shown). Right figure present situation when signal
applied to piezostack is fixed in respect to RF pulse after 3.5 periods. 84
Figure 6.16 Coefficients of detuning linearization and standard deviation from measurement in
function of frequency of multi-pulse signal. The point after 3.5 pulses is fixed. Bottom
plots are the zoom of the top figure around 285 and 435 Hz respectively. 85
Figure 6.17 Measured amplitude of signal applied to piezostack needed for optimal compensation of
Lorentz force in function of accelerating field gradient. 86
Figure 6.18 Prediction of amplitude of signal applied to piezostack needed for optimal compensation
of Lorentz force in function of accelerating field gradient. 87
Figure 6.19 Cavity detuning with and without piezostack-based system measured in cav5, ACC1,
FLASH accelerator. The accelerating field gradient is 20MV/m. 89
Figure 6.20 Beam energy deviation from mean value in function of time measured after the ACC1
module. The fast piezostack-based tuner was switched on after 160 s and switched off
after 350 s. 90
Figure 6.21 Amplitude and phase of accelerating field gradient. CHECHIA horizontal cryostat,
35MV/m. 91
Figure 7.1 Piezo Control Panel – division into four section 106
Figure 7.2 Description of first section of PCP 107
Figure 7.3 Description of second section of PCP. 107
Figure 7.4 Description of third section of PCP. 108
Figure 7.5 Amplitude of signal applied to piezostack to obtain a flat detuning during the RF pulse
and its approximation for different accelerating field gradients. 115
Figure 7.6 Residuals and theirs norm for different approximations in function of accelerating field
gradients. 115
Smart Materials as Sensors and Actuators for Lorentz Force Tuning System
Przemysław Sękalski Technical University of Łódź, Poland
Department of Microelectronics and Computer Science
106
Index of tables Table 2.1 Dimension in mm of single cell used in TESLA technology 12
Table 2.2 Parameters of VUV-FEL 13
Table 2.3 Different tuners for TESLA type cavities [Liepe 2005] 16
Table 4.1 Parameters of tested piezoelements 43
Smart Materials as Sensors and Actuators for Lorentz Force Tuning System
Przemysław Sękalski Technical University of Łódź, Poland
Department of Microelectronics and Computer Science
107
Appendix A Piezo Control Panel PCP description The Piezo Control Panel is a MATLAB based GUI application. It was designed using the
embedded tool called GUIDE. The main aim of the software is to control the piezoelement using
the system described in Chapter 6 in a way to minimize the detuning caused by the Lorentz force.
Nevertheless, the PCP was also used for characterization of the system, especially for
measurements presented in subchapters 6.4.1 and 6.4.2 as well as in the Appendix B
The overview of the PCP is presented in Figure 6.4. The panel might be divide into four section, as
it is presented in Figure 7.1. The detailed description of each section is presented bellow.
Figure 7.1 Piezo Control Panel – division into four section
The first section presents the main information about the system as the data about the module and
the cavity which is currently used, the accelerating field gradient and phase, which is set for
particular cavity, repetition rate of RF high power pulses and at least the status of Piezo Control
System (see Figure 7.2). Below there are four buttons. Two of them ‘start’ and ‘stop’ initiates and
finishes the functioning of PCP. The third of them initiates the adaptive feed-forward based
Smart Materials as Sensors and Actuators for Lorentz Force Tuning System
Przemysław Sękalski Technical University of Łódź, Poland
Department of Microelectronics and Computer Science
108
algorithm used for automatic control of piezoelements. At least, there is possibility to recall the
initial settings, which was measured by the author and which are presented in Appendix B
Accelerating field gradient and phase
Repetition rate
Active module and cavity
Start and stop buttons
A daptive feed - forward algorithm activation
Recall initial settings
Status
Figure 7.2 Description of first section of PCP
The second section of PCP is dedicated to representation of the results (refer to Figure 7.2). The top
plot illustrates the reflected power (red), forward power (blue) and probe signal (black). Below the
detuning and its linearization is presented. The value of the coefficients and the value of detuning
are showed left to the figures. Two bottom plots illustrates the values saved in the function
generator with respect to the last and the first bank, and the signal which is applied to piezoelement
with respect to beginning of the RF field.
reflected, forward and probe signals
detuning measured using a single pulse method
Quit button
function saved in FG
signal applied to piezoelement
address of FG’s DOOCS server
Clear plots button
Drawing the results on separate plots
Refresh/cumulate plots
Saving to history
Linearization coefficients of forward power during the flat top
Linearization coefficients of detuning, standard deviation and values in Hz
Figure 7.3 Description of second section of PCP.
Smart Materials as Sensors and Actuators for Lorentz Force Tuning System
Przemysław Sękalski Technical University of Łódź, Poland
Department of Microelectronics and Computer Science
109
Additionally, there is possibility to cumulate the figures or shows only the recent one. Moreover,
the all above described plots might be saved in separate windows and at least the value of the
linearization coefficient with settings of the pulse applied to piezoelement might be saved in
separate file (‘history’).
The third section of PCP is used to manually generate the pulse. If the adaptive feed-forward
algorithm is switched off, the settings from this panel is used to set the signal applied to
piezoelement. Two types of pulse are allowed – sine-wave like and the trapezoid like one. For sine
wave pulse there are five different values which might be used – amplitude, offset, frequency,
delay time and number of pulses (refer to Figure 6.11). For the trapezoid like signal there are six
parameters – rise, fall, width and delay times, and amplitude A1 and A2 (refer to Figure 6.5).
There are also several buttons called ‘sweep’. They were used to change the given value in range
indicated in the script. These buttons were used for measurement presented in subchapters 6.4.1
and 6.4.2 as well as in the Appendix B
amplitude, offset, frequency, delay time and number of pulses used for sin wave like function
rise and fall time, pulse width, delay and amplitudes A1 & A2 for trapezoid like pulse shape
Buttons for function generator control
Figure 7.4 Description of third section of PCP.
Bellow the settings there are set of four buttons named ‘view function’, ‘load to FG’, ‘clear FG’
and ‘load from FG’. The names of these buttons indicates the function which are performed after
its activation. To set new value in the FG there is need to set desired settings, then click on the
‘view function’ button, ant then click on ‘load to FG’ button. These combination protects the
system from the incidentally change of settings. Nevertheless, to protect the piezoelements there
are several restriction which are applied to the settings (i.e. the maximal signal must be below
160 V).
Smart Materials as Sensors and Actuators for Lorentz Force Tuning System
Przemysław Sękalski Technical University of Łódź, Poland
Department of Microelectronics and Computer Science
110
At the end, the fourth section of PCP is used to save and restore previously saved data. There is
also a window, in which a results of performed command are shown.
Smart Materials as Sensors and Actuators for Lorentz Force Tuning System
Przemysław Sękalski Technical University of Łódź, Poland
Department of Microelectronics and Computer Science
111
Appendix B Measurements of coefficients of lineari zed detuning for different accelerating field gradient. The following pictures illustrate the coefficients of linearization of detuning measured for different
field gradients from 3.6 MV/m to 15.6 MV/m (this value corresponds to the settings in DSP, the
measured value of probe signal was higher). The top subplot of each single figure presents a slope
of Lorentz Force detuning during the RF pulse flat-top (which last 0.8ms). The middle subplot
shows an offset of this detuning measured in the middle of flat-top (after 0.4ms from beginning of
flat-top). The bottom subfigures illustrate a standard deviation of measurement from the linear
approximation.
38.5 39 39.5 40 40.5 41 41.5 42
-10-505
x 10-3
d ∆ω/
dt
Linearization coefficients and standard deviationin function of multi pulse amplitude (for 15.6MV/m)
y=d ∆∆∆∆ωωωω/dt*t+offset( ∆∆∆∆ωωωω)
y = 0.0048*x - 0.19
38.5 39 39.5 40 40.5 41 41.5 42
859095
100105
offs
et ∆
ω
38.5 39 39.5 40 40.5 41 41.5 42
6.2
6.4
6.6
multi pulse amplitude [V]
stan
dard
dev
iatio
n ∆ω
32.5 33 33.5 34 34.5 35 35.5 36-10-505
x 10-3
d ∆ω/
dt
Linearization coefficients and standard deviationin function of multi pulse amplitude (for 14.6MV/m)
y=d ∆∆∆∆ωωωω/dt*t+offset( ∆∆∆∆ωωωω)
y = 0.0055*x - 0.19
32.5 33 33.5 34 34.5 35 35.5 36
125
130
135
offs
et ∆
ω
32.5 33 33.5 34 34.5 35 35.5 36
6.6
6.8
7
multi pulse amplitude [V]
stan
dard
dev
iatio
n ∆ω
Smart Materials as Sensors and Actuators for Lorentz Force Tuning System
Przemysław Sękalski Technical University of Łódź, Poland
Department of Microelectronics and Computer Science
112
28.5 29 29.5 30 30.5 31 31.5 32-202468
x 10-3
d ∆ω/
dt
Linearization coefficients and standard deviationin function of multi pulse amplitude (for 13.6MV/m)
y=d ∆∆∆∆ωωωω/dt*t+offset( ∆∆∆∆ωωωω)
y = 0.0039*x - 0.11
28.5 29 29.5 30 30.5 31 31.5 32
160
165
170
175
offs
et ∆
ω
28.5 29 29.5 30 30.5 31 31.5 32
10
15
20
multi pulse amplitude [V]
stan
dard
dev
iatio
n ∆ω
24.5 25 25.5 26 26.5 27 27.5 28
05
1015
x 10-3
d ∆ω/
dt
Linearization coefficients and standard deviationin function of multi pulse amplitude (for 12.6MV/m)
y=d ∆∆∆∆ωωωω/dt*t+offset( ∆∆∆∆ωωωω)
y = 0.0063*x - 0.15
24.5 25 25.5 26 26.5 27 27.5 28
180
190
200
offs
et ∆
ω
24.5 25 25.5 26 26.5 27 27.5 2810
10.5
11
multi pulse amplitude [V]
stan
dard
dev
iatio
n ∆ω
Smart Materials as Sensors and Actuators for Lorentz Force Tuning System
Przemysław Sękalski Technical University of Łódź, Poland
Department of Microelectronics and Computer Science
113
20.5 21 21.5 22 22.5 23 23.5 240
0.01
0.02
d ∆ω/
dt
Linearization coefficients and standard deviationin function of multi pulse amplitude (for 11.6MV/m)
y=d ∆∆∆∆ωωωω/dt*t+offset( ∆∆∆∆ωωωω)
y = 0.0073*x - 0.15
20.5 21 21.5 22 22.5 23 23.5 24200
210
220
230
offs
et ∆
ω
20.5 21 21.5 22 22.5 23 23.5 24
12.6
12.8
13
13.2
multi pulse amplitude [V]
stan
dard
dev
iatio
n ∆ω
13 14 15 16 17 18 19 20
-0.02
0
0.02
d ∆ω/
dt
Linearization coefficients and standard deviationin function of multi pulse amplitude (for 10.6MV/m)
y=d ∆∆∆∆ωωωω/dt*t+offset( ∆∆∆∆ωωωω)
y = 0.0065*x - 0.11
13 14 15 16 17 18 19 20230
240
250
260
270
offs
et ∆
ω
13 14 15 16 17 18 19 20
14.6
14.8
15
15.2
multi pulse amplitude [V]
stan
dard
dev
iatio
n ∆ω
Smart Materials as Sensors and Actuators for Lorentz Force Tuning System
Przemysław Sękalski Technical University of Łódź, Poland
Department of Microelectronics and Computer Science
114
14 14.5 15 15.5 16 16.5 17
-10-505
x 10-3
d ∆ω/
dt
Linearization coefficients and standard deviationin function of multi pulse amplitude (for 9.6MV/m)
y=d ∆∆∆∆ωωωω/dt*t+offset( ∆∆∆∆ωωωω)
y = 0.0051*x - 0.08
14 14.5 15 15.5 16 16.5 17
280
285
290
offs
et ∆
ω
14 14.5 15 15.5 16 16.5 17
17.2
17.4
17.6
multi pulse amplitude [V]
stan
dard
dev
iatio
n ∆ω
11.5 12 12.5 13 13.5 14 14.5
-10-505
x 10-3
d ∆ω/
dt
Linearization coefficients and standard deviationin function of multi pulse amplitude (for 8.6MV/m)
y=d ∆∆∆∆ωωωω/dt*t+offset( ∆∆∆∆ωωωω)
y = 0.0066*x - 0.085
11.5 12 12.5 13 13.5 14 14.5280
290
300
offs
et ∆
ω
11.5 12 12.5 13 13.5 14 14.518.4
18.6
18.8
19
19.2
multi pulse amplitude [V]
stan
dard
dev
iatio
n ∆ω
10.5 11 11.5 12 12.5 13 13.5 14-505
1015
x 10-3
d ∆ω/
dt
Linearization coefficients and standard deviationin function of multi pulse amplitude (for 7.6MV/m)
y=d ∆∆∆∆ωωωω/dt*t+offset( ∆∆∆∆ωωωω)
y = 0.0067*x - 0.076
10.5 11 11.5 12 12.5 13 13.5 14295
300
305
310
offs
et ∆
ω
10.5 11 11.5 12 12.5 13 13.5 14
20
20.5
21
21.5
multi pulse amplitude [V]
stan
dard
dev
iatio
n ∆ω
Smart Materials as Sensors and Actuators for Lorentz Force Tuning System
Przemysław Sękalski Technical University of Łódź, Poland
Department of Microelectronics and Computer Science
115
9.5 10 10.5 11 11.5 12 12.5
0
10
20x 10
-3
d ∆ω/
dt
Linearization coefficients and standard deviationin function of multi pulse amplitude (for 6.6MV/m)
y=d ∆∆∆∆ωωωω/dt*t+offset( ∆∆∆∆ωωωω)
y = 0.0069*x - 0.068
9.5 10 10.5 11 11.5 12 12.5
295300305310315
offs
et ∆
ω
9.5 10 10.5 11 11.5 12 12.521
21.5
22
22.5
multi pulse amplitude [V]
stan
dard
dev
iatio
n ∆ω
8 8.5 9 9.5 10 10.5 11
-505
10
x 10-3
d ∆ω/
dt
Linearization coefficients and standard deviationin function of multi pulse amplitude (for 5.6MV/m)
y=d ∆∆∆∆ωωωω/dt*t+offset( ∆∆∆∆ωωωω)
y = 0.0067*x - 0.06
8 8.5 9 9.5 10 10.5 11
315
320
325
330
offs
et ∆
ω
8 8.5 9 9.5 10 10.5 1122.5
23
23.5
multi pulse amplitude [V]
stan
dard
dev
iatio
n ∆ω
Smart Materials as Sensors and Actuators for Lorentz Force Tuning System
Przemysław Sękalski Technical University of Łódź, Poland
Department of Microelectronics and Computer Science
116
7 7.5 8 8.5 9 9.5 10
-0.01
0
0.01
d ∆ω/
dt
Linearization coefficients and standard deviationin function of multi pulse amplitude (for 4.6MV/m)
y=d ∆∆∆∆ωωωω/dt*t+offset( ∆∆∆∆ωωωω)
y = 0.0083*x - 0.072
7 7.5 8 8.5 9 9.5 10
330
340
350
offs
et ∆
ω
7 7.5 8 8.5 9 9.5 10
24.5
25
25.5
multi pulse amplitude [V]
stan
dard
dev
iatio
n ∆ω
7 7.5 8 8.5 9 9.5 10
-0.01
0
0.01
d ∆ω/
dt
Linearization coefficients and standard deviationin function of multi pulse amplitude (for 3.6MV/m)
y=d ∆∆∆∆ωωωω/dt*t+offset( ∆∆∆∆ωωωω)
y = 0.0068*x - 0.059
7 7.5 8 8.5 9 9.5 10
345
350
355
360
365
offs
et ∆
ω
7 7.5 8 8.5 9 9.5 1025
26
27
multi pulse amplitude [V]
stan
dard
dev
iatio
n ∆ω
It is possible to find a dependency between the voltages applied to piezostack, when the slope of
detuning is equal to zero, and the accelerating field gradient. The measurement and different
approximation are shown in Figure B.1. Next figure presents the errors of each approximation for
given value. Moreover, norms of residuals are presented. The quadratic estimate is sufficient,
however the cubic one gives better correlation. Higher degrees of approximation curves do not give
a significant improvement of norm of residuals.
Smart Materials as Sensors and Actuators for Lorentz Force Tuning System
Przemysław Sękalski Technical University of Łódź, Poland
Department of Microelectronics and Computer Science