42
Hoffer Creek Sediment TMDL Snyder County, Pennsylvania Prepared by : January 11, 2013
| Date post: | 14-Feb-2018 |
| Category: |
Documents |
| Upload: | truongtram |
| View: | 214 times |
| Download: | 1 times |
Hoffer Creek Sediment TMDL Snyder County, Pennsylvania
Prepared by:
January 11, 2013

2
TABLE OF CONTENTS
EXECUTIVE S UMMARY................................................................................................................................................................ 4
TABLE 1. SUMMARY OF TMDL FOR HOFFER CREEK WATERSHED IN LBS./YR. & LBS./DAY................................................. 4
INTRODUCTION ............................................................................................................................................................................... 5
TABLE 2. INTEGRATED WATER QUALITY MONITORING AND ASSESSMENT REPORT LISTED SEGMENTS............................ 5
CLEAN WATER ACT REQUIREMENTS ................................................................................................................................. 6
PENNS YLVANIA CLEAN S TREAMS LAW REQUIREMENTS AND AGRICULTURAL OPERATIONS ........ 6
INTEGRATED WATER QUALITY MONITORING AND ASS ESS MENT REPORT, LIST 5, 303(D), LISTING
PROCESS .............................................................................................................................................................................................. 7
TABLE 3. IMPAIRMENT DOCUMENTATION AND ASSESSMENT CHRONOLOGY.......................................................................... 8
BASIC STEPS FOR DETERMINING A TMDL ....................................................................................................................... 8
TMDL ELEMENTS (WLA, LA, MOS) ........................................................................................................................................ 8
FUTURE TMDL MODIFICATIONS ............................................................................................................................................ 8
CHANGES IN TMDLS THAT MAY REQUIRE EPA APPROVAL ................................................................................... 9
CHANGES IN TMDLS THAT MAY NOT REQUIRE EPA APPROVAL ........................................................................ 9
TMDL APPROACH ........................................................................................................................................................................... 9
SELECTION OF THE REFERENCE WATERS HED ........................................................................................................... 10
TABLE 4. COMPARISON OF THE HOFFER CREEK & SHIPPENS RUN WATERSHEDS ................................................................ 11 Figure 1: Impaired Hoffer Creek Watershed ..................................................................................................................... 12 Figure 2. Reference: Unimpaired Shippens Run Watershed .......................................................................................... 12
HYDROLOGIC / WATER QUALITY MODELING ............................................................................................................. 13
PART 1. MODEL OVERVIEW & DATA COMPILATION................................................................................................ 13
PART 2. GIS BAS ED DERIVATION OF INPUT DATA...................................................................................................... 14
TABLE 5. GIS DATASETS................................................................................................................................................................ 15 DATASET................................................................................................................................................................................15
WATERS HED ASSESS MENT AND MODELING................................................................................................................. 16
Figure 3. Cattle access to stream in Hoffer Creek Watershed ........................................................................................ 17 Figure 4. Stream bank erosion in the Hoffer Creek Watershed. ................................................................................... 17 Figure 5. Extensive riparian buffer in the Shippens Run Watershed ........................................................................... 18 Figure 6. Riparian buffer at the upstream end of the Shippens Run Watershed. ...................................................... 18
TABLE 6. EXISTING LOADING VALUES FOR HOFFER CREEK (IMPAIRED) ............................................................................... 19 TABLE 7. EXISTING LOADING VALUES FOR SHIPPENS RUN (REFERENCE).............................................................................. 19
DEVELOPMENT OF S EDIMENT TMDL................................................................................................................................ 19
TABLE 8. TMDL VALUES FOR THE HOFFER CREEK WATERSHED........................................................................................... 20
WASTE LOAD ALLOCATION ................................................................................................................................................... 20
TABLE 9. WASTE LOAD ALLOCATIONS FOR THE HOFFER CREEK WATERSHED .................................................................... 20
MARGIN OF SAFETY .................................................................................................................................................................... 20
LOAD ALLOCATION..................................................................................................................................................................... 21
ADJUS TED LOAD ALLOCATION ............................................................................................................................................ 21
TABLE 10. LOAD ALLOCATIONS, LOADS NOT REDUCED AND ADJUSTED LOAD ALLOCATIONS ........................................ 21

3
TMDL S UMMARY ........................................................................................................................................................................... 21
TABLE 11. TMDL COMPONENTS FOR THE HOFFER CREEK WATERSHED............................................................................... 21
CALCULATION OF S EDIMENT LOAD REDUCTIONS ................................................................................................... 22
TABLE 12. SEDIMENT LOAD ALLOCATIONS/REDUCTIONS FOR LAND USES AND STREAM BANKS IN THE HOFFER CREEK
WATERSHED (ANNUAL VALUES).................................................................................................................................................. 22 TABLE 13. SEDIMENT LOAD ALLOCATIONS/REDUCTIONS FOR LAND USES AND STREAM BANKS IN THE HOFFER CREEK
WATERSHED (DAILY VALUES)...................................................................................................................................................... 23
CONSIDERATION OF S EASONAL VARIATIONS ............................................................................................................. 23
CONSIDERATION OF BACKGROUND CONTRIBUTIONS ........................................................................................... 23
RECOMMENDATIONS ................................................................................................................................................................. 23
PUBLIC PARTICIPATION ........................................................................................................................................................... 24
LITERATURE CITED .................................................................................................................................................................... 24
ATTACHMENT A ............................................................................................................................................................................ 26
MAP OF HOFFER CREEK WATERSHED.......................................................................................................................................... 26 Figure A1. Hoffer Creek Watershed .................................................................................................................................... 27
ATTACHMENT B............................................................................................................................................................................. 28
EQUAL MARGINAL PERCENT REDUCTION METHOD .................................................................................................................. 28 TABLE B1. EQUAL MARGINAL PERCENT REDUCTION CALCULATIONS FOR HOFFER CREEK WATERSHED ....................... 30
ATTACHMENT C ............................................................................................................................................................................ 31
AVGW LF GENERATED DATA TABLES ....................................................................................................................................... 31 TABLE C1. DATA CONTAINED IN TRANSPRT.DAT FOR HOFFER CREEK WATERSHED ..................................................... 32 TABLE C2. OUTPUTS FOR HOFFER CREEK WATERSHED ........................................................................................................... 33 TABLE C3. DATA CONTAINED IN TRANSPRT.DAT FOR SHIPPENS RUN WATERSHED....................................................... 34 TABLE C4. OUTPUTS FOR SHIPPENS RUN WATERSHED............................................................................................................. 35
ATTACHMENT D ............................................................................................................................................................................ 36
PENNSYLVANIA INTEGRATED WATER QUALITY MONITORING AND ASSESSMENT REPORT : STREAMS, CATEGORY 5
WATERBODIES, POLLUTANTS REQUIRING A TMDL .................................................................................................................. 36
ATTACHMENT E............................................................................................................................................................................. 38
EXCERPTS JUSTIFYING CHANGES BETWEEN THE 1998-2002 SECTION 303(D) LISTS AND THE 2004 TO PRESENT
INTEGRATED WATER QUALITY MONITORING AND ASSESSMENT REPORTS........................................................................... 38
ATTACHMENT F............................................................................................................................................................................. 41
COMMENT AND RESPONSE ............................................................................................................................................................. 41

4
Hoffer Creek
Sediment TMDL
Snyder County, Pennsylvania
Executive Summary
Hoffer Creek is a tributary of the Susquehanna River in Snyder County, South Central Pennsylvania
(PA).
A Total Maximum Daily Load (TMDL) for sediment was developed to address impairments noted in Pennsylvania’s 303(d) List and the Pennsylvania Integrated Water Quality Monitoring and Assessment Report (Integrated List). The impairments were documented during biological surveys
of the aquatic life present in the watershed (11/18/1999) and listed in the Integrated List in 2002. Excessive siltation resulting from agricultural activities and small residential runoff has been
identified as the cause of these impairments in the basin. Because Pennsylvania does not currently have water quality criteria for sediment, a TMDL endpoint for sediment was identified using a reference watershed approach. The existing sediment loading in the Hoffer Creek Watershed is
864,600 pounds per year (2,451 pounds per day). Based on a comparison to a similar, unimpaired watershed, Shippens Run, the maximum sediment loading that should still allow water quality
objectives to be met in the Hoffer Creek Watershed is 816,876 pounds per year (2,238 pounds per day). Allocation of the sediment TMDL is summarized below:
Table 1. Summary of TMDL for Hoffer Creek Watershed in lbs./yr. & lbs./day
Summary of TMDL for the Hoffer Creek Watershed (lbs./yr.)
Pollutant TMDL WLA MOS LA LNR ALA
Sediment 816,876 8,169 81,688 727,020 31,800 695,220
Summary of TMDL for the Hoffer Creek Watershed (lbs./day)
Pollutant TMDL WLA MOS LA LNR ALA
Sediment 2,238 22 224 1,992 87 1,905
The Hoffer Creek Watershed TMDL is allocated to nonpoint sources, with 10% of the TMDL
reserved explicitly as a margin of safety (MOS). The waste load allocation (WLA) is that portion of the total load assigned to National Pollutant Discharge Elimination System (NPDES) permitted point source discharges. A search of the Pennsylvania Department of Environmental Protection’s
(Department) efacts permit database identified no permitted facilities, point source discharges within the Hoffer Creek Watershed. The load allocation (LA) is the portion of the total load
assigned to nonpoint sources, which are all sources other than NPDES permitted point sources. Loads not reduced (LNR) are the portion of the LA associated with nonpoint sources othe r than agricultural (croplands, hay/pasture), transitional land, and stream bank and is equal to the sum of
forested, wetland and low intensity development loadings. The adjusted load allocation (ALA) represents the remaining portion of the LA to be distributed among agricultural, transitional land
and stream bank uses receiving load reductions. The TMDL developed for the Hoffer Creek Watershed established a 5.5% reduction in the current sediment loading of 864,600 pounds per year (2,451 pounds per day).

5
Introduction
The assessed aquatic life use designation for the Hoffer Creek Watershed is as a Warm Water Fishery (WWF), (PA Code 25 § 93.9m), which provides for the maintenance and propagation of
fish species and additional flora and fauna which are indigenous to a warm water habitat. As part of the Susquehanna River Basin, Hoffer Creek is also considered a Migratory Fishery (MF), which provides for the passage, maintenance and propagation of anadromous and catadromous fishes and
other fishes which move to or from flowing waters to complete their life cycle in other waters.
This Total Maximum Daily Load (TMDL) calculation has been prepared for all segments in the Hoffer Creek Watershed (Attachment A). The stream and all of its tributaries are located in Chapman Township, south Snyder County. Hoffer Creek, including all headwater tributaries, makes
up approximately 8.1 stream miles downstream to the mouth located in Chapman Township, PA where it joins the Susquehanna River. The entire watershed basin area is approximately 2.6 square
miles (1658.1 acres, 671.0 hectares) and all stream segments of the watershed are listed as impaired. Land use in this watershed is composed of forestland (42.9%), low intensity development (6.1%), and agriculture (51.0%) including croplands and hay/pasture.
The watershed is located in State Water Plan (SWP) Subbasin 6A and within Hydrologic Unit Code
(HUC) 02050301-Lower Susquehanna-Penn Creeks. Hoffer Creek is within the Ridge and Valley physiographic province with an elevation range of over 700 feet to less than 400 feet above sea level over 6.1 stream miles including all tributaries. This slope in conjunction with the lack of
conservation farming practices in the headwaters creates high velocity silt laden runoff during precipitation events, thus degrading the entire stream to the point of impairment. The TMDL was
completed to address the impairments that first identified on Pennsylvania's 2002 303(d) and integrated list and has been relisted through 2010 for siltation from agricultural activities and road runoff. This TMDL, required under the Clean Water Act, and covers the listed segments
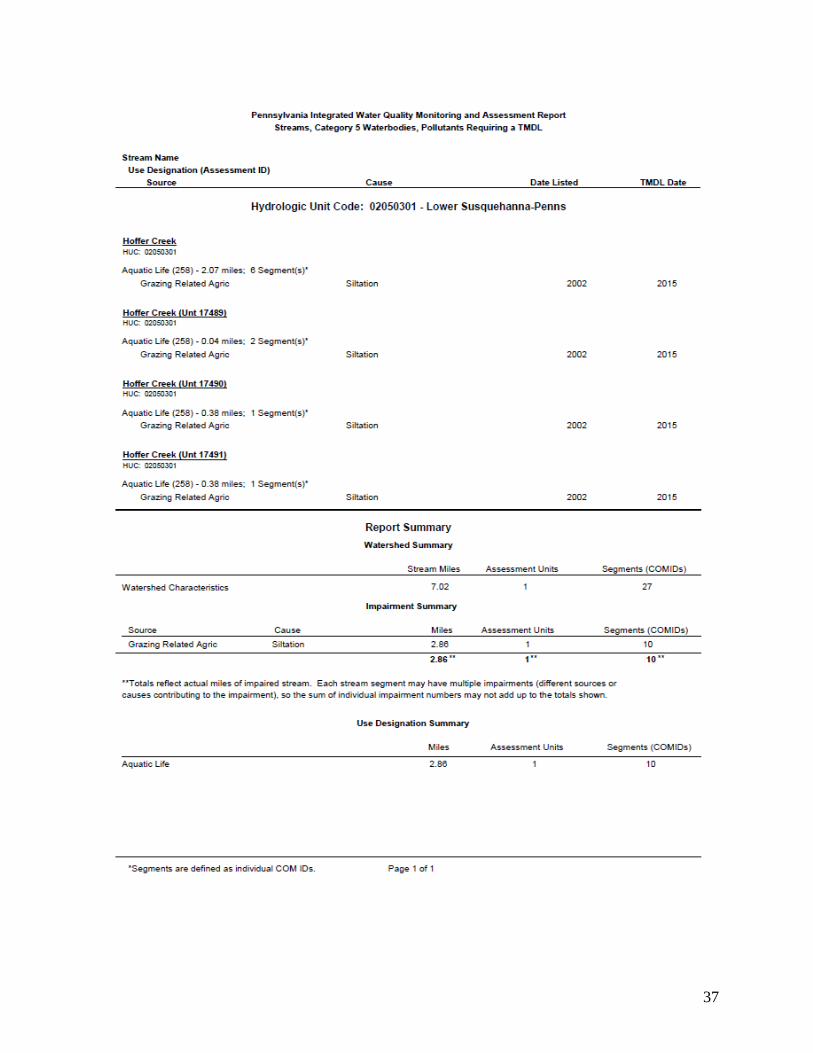
summarized in Table 2 and shown in detail in Attachment D. The TMDL addresses siltation from all land uses, including croplands and hay/pasture lands.
Table 2. Integrated Water Quality Monitoring and Assessment Report Listed Segments
State Water Plan (SWP) Subbasin: 6A
HUC: 02050301-Lower Susquehanna-Penns Creek
Watershed – Hoffer Creek
Source EPA 305(b) Cause
Code Miles Designated Use Use Designation
Agriculture Siltation 2.07 WWF, MF Aquatic Life
Agriculture Siltation 0.04 WWF, MF Aquatic Life
Agriculture Siltation 0.38 WWF, MF Aquatic Life
Agriculture Siltation 0.38 WWF, MF Aquatic Life
HUC= Hydrologic Unit Code
WWF= Warm Water Fishes
MF= Migratory Fishes
The use designations for the stream segments in this TMDL can be found in PA Title 25 Chapter 93.
See Attachments D & E, for more information on the listings and listing process.
6
Clean Water Act Requirements
Section 303(d) of the 1972 Clean Water Act requires states, territories, and authorized tribes to establish water quality standards. The water quality standards identify the uses for each waterbody
and the scientific criteria needed to support that use. Uses can include designations for drinking water supply, contact recreation (swimming), and aquatic life support. Minimum goals set by the Clean Water Act require that all waters be “fishable” and “swimmable.”
Additionally, the federal Clean Water Act and the United States Environmental Protection Agency’s
(EPA) implementing regulations (40 CFR 130) require:
States to develop lists of impaired waters for which current pollution controls are not
stringent enough to meet water quality standards (the list is used to determine which streams need TMDLs);
States to establish priority rankings for waters on the lists based on severity of pollution and the designated use of the waterbody; states must also identify those waters for which
TMDLs will be developed and a schedule for development;
States to submit the list of waters to EPA every two years (April 1 of the even numbered
years);
States to develop TMDLs, specifying a pollutant budget that meets state water quality
standards and allocate pollutant loads among pollution sources in a watershed, e.g., point and nonpoint sources; and
EPA to approve or disapprove state lists and TMDLs within 30 days of final submission.
Despite these requirements, states, territories, authorized tribes, and EPA have not developed many
TMDLs since 1972. Beginning in 1986, organizations in many states filed lawsuits against EPA for failing to meet the TMDL requirements contained in the federal Clean Water Act and its
implementing regulations. While EPA has entered into consent agreements with the plaintiffs in several states, many lawsuits still are pending across the country.
In the cases that have been settled to date, the consent agreements require EPA to backstop TMDL development, track TMDL development, review state monitoring programs, and fund studies on issues of concern (e.g., Abandoned Mine Drainage (AMD), implementation of nonpoint source
BMPs, etc.).
Pennsylvania Clean Streams Law Requirements and Agricultural Operations
All Pennsylvania farmers are subject to the water quality regulations authorized under the
Pennsylvania Clean Streams Law, Title 25 Environmental Protection, and found within Chapters 91-93, 96, 102 and 105. These regulations include topics such as manure management,
Concentrated Animal Operations (CAOs), Concentrated Animal Feeding Operations (CAFOs), Pollution Control and Prevention at Agricultural Operations, Water Quality Standards, Water Quality Standards Implementation, Erosion and Sediment Control Requirements, and Dam Safety
and Waterway Management. To review these regulations, please refer to http://pacode.com/ or the Pennsylvania Water Quality Action Packet for Agriculture which is supplied by the County
Conservation Districts. To find your County Conservation District’s contact information, please

7
refer to http://pacd.org/ or call any DEP office or the Pennsylvania Conservation Districts Headquarters at 717-238-7223.
Integrated Water Quality Monitoring and Assessment Report, List 5, 303(d), Listing Process
Prior to developing TMDLs for specific waterbodies, there must be sufficient data available to assess which streams are impaired and should be listed in the Integrated Water Quality Monitoring
and Assessment Report. Prior to 2004 the impaired waters were found on the 303(d) List; from 2004 to present, the 303(d) List was incorporated into the Integrated Water Quality Monitoring and
Assessment Report and found on List 5. Please see Table 3 below for a breakdown of the changes to listing documents and assessment methods through time.
With guidance from EPA, the states have developed methods for assessing the waters within their respective jurisdictions. From 1996-2006, the primary method adopted by the Pennsylvania
Department of Environmental Protection for evaluating waters found on the 303(d) lists (1998-2002) or in the Integrated Water Quality Monitoring and Assessment Report (2004-2006) was the Statewide Surface Waters Assessment Protocol (SSWAP). SSWAP was a modification of the EPA
Rapid Bioassessment Protocol II (RPB-II) and provided a more consistent approach to assessing Pennsylvania’s streams.
The assessment method required selecting representative stream segments based on factors such as surrounding land uses, stream characteristics, surface geology, and point source discharge locations.
The biologist selected as many sites as necessary to establish an accurate assessment for a stream segment; the length of the stream segment could vary between sites. All the biological surveys
included kick-screen sampling of benthic macroinvertebrates, habitat surveys, and measurements of pH, temperature, conductivity, dissolved oxygen, and alkalinity. Benthic macroinvertebrates were identified to the family level in the field.
The listings found in the Integrated Water Quality Monitoring and Assessment Reports from 2008
to present were derived based on the Instream Comprehensive Evaluation protocol (ICE). Like the SSWAP protocol that preceded the ICE protocol, the method requires selecting representative segments based on factors such as surrounding land uses, stream characteristics, surface geology,
and point source discharge locations. The biologist selects as many sites as necessary to establish an accurate assessment for a stream segment; the length of the stream segment could vary between
sites. All the biological surveys include D-frame kicknet sampling of benthic macroinvertebrates, habitat surveys, and measurements of pH, temperature, conductivity, dissolved oxygen, and alkalinity. Collected samples are returned to the laboratory where the samples are then subsampled
to obtain a benthic macroinvertebrate sample of 200 + or – 20% (160 to 240). The benthic macroinvertebrates in this subsample were then identified to the generic level. The ICE protocol is a
modification of the EPA Rapid Bioassessment Protocol III (RPB-III) and provides a more rigorous and consistent approach to assessing Pennsylvania’s streams than the SSWAP.
After these surveys (SSWAP, 1998-2006 lists or ICE, 2008-present lists) were completed, the biologist determined the status of the stream segment. The decision was based on the performance
of the segment using a series of biological metrics. If the stream segment was classified as impaired,

8
it was then listed on the state’s 303(d) List or presently the Integrated Water Quality Monitoring and Assessment Report with the source and cause documented.
Once a stream segment is listed as impaired, a TMDL must be developed for it. A TMDL addresses
only one pollutant. If a stream segment is impaired by multiple pollutants, all of those pollutants receive separate and specific TMDLs within that stream segment. In order for the TMDL process to be most effective, adjoining stream segments with the same source and cause listing are addre ssed
collectively on a watershed basis.
Table 3. Impairment Documentation and Assessment Chronology
Listing Date Listing Document Assessment Method
1998 303(d) List SSWAP
2002 303(d) List SSWAP
2004 Integrated List SSWAP
2006 Integrated List SSWAP
2008-Present Integrated List ICE Integrated List= Integrated Water Quality Monitoring and Assessment Report
SSWAP= Statewide Surface Waters Assessment Protocol
ICE= Instream Comprehensive Evaluation Protocol
Basic Steps for Determining a TMDL
Although all watersheds must be handled on a case-by-case basis when developing TMDLs, there are basic processes or steps that apply to all cases. They include:
1. Collection and summarization of pre-existing data (watershed characterization, inventory
contaminant sources, determination of pollutant loads, etc.);
2. Calculate TMDL for the waterbody using EPA approved methods and computer models; 3. Allocate pollutant loads to various sources;
4. Determine critical and seasonal conditions; 5. Submit draft report for public review and comments; and 6. EPA approval of the TMDL.
TMDL Elements (WLA, LA, MOS)
A TMDL equation consists of a wasteload allocation, load allocation and a margin of safety. The wasteload allocation (WLA) is the portion of the load assigned to point sources (National Pollutant
Discharge Elimination System (NPDES) permitted discharges). The load allocation (LA) is the portion of the load assigned to nonpoint sources (non-permitted). The margin of safety (MOS) is
applied to account for uncertainties in the computational process. The MOS may be expressed implicitly (documenting conservative processes in the computations) or explicitly (setting aside a portion of the allowable load).
Future TMDL Modifications
In the future, the Department may adjust the load and/or wasteload allocations in this TMDL to account for new information or circumstances that are developed or discovered during the

9
implementation of the TMDL when a review of the new information or circumstances indicate that such adjustments are appropriate. Adjustment between the load and wasteload allocation will only
be made following an opportunity for public participation. A wasteload allocation adjustment will be made consistent and simultaneous with associated permit(s) revision(s)/reissuances (i.e., permits
for revision/reissuance in association with a TMDL revision will be made available for public comment concurrent with the related TMDLs availability for public comment). New information generated during TMDL implementation may include, among other things, monitoring data, best
management practice (BMP) effectiveness information, and land use information. All changes in the TMDL will be tallied and once the total changes exceed 1% of the total original TMDL
allowable load, the TMDL will be revised. The adjusted TMDL, including its LAs and WLAs, will be set at a level necessary to implement the applicable water quality standards (WQS) and any adjustment increasing a WLA will be supported by reasonable assurance demonstration that load
allocations will be met. The Department will notify EPA of any adjustments to the TMDL within 30 days of its adoption and will maintain current tracking mechanisms that contain accurate loading
information for TMDL waters. Changes in TMDLs That May Require EPA Approval
Increase in total load capacity.
Transfer of load between point (WLA) and nonpoint (LA) sources.
Modification of the margin of safety (MOS).
Change in water quality standards (WQS).
Non-attainment of WQS with implementation of the TMDL.
Allocation transfers in trading programs.
Changes in TMDLs That May Not Require EPA Approval
Total loading shift less than or equal to 1% of the total load.
Increase of WLA results in greater LA reductions provided reasonable assurance of
implementation is demonstrated (a compliance/implementation plan and schedule).
Changes among WLAs with no other changes; TMDL public notice concurrent with permit
public notice.
Removal of a pollutant source that will not be reallocated.
Reallocation between LAs.
Changes in land use.
TMDL Approach
The TMDL developed for the Hoffer Creek Watershed addresses sediment. Because neither Pennsylvania nor EPA has water quality criteria for sediment, a method was developed to determine
water quality objectives for this pollutant that should result in the impaired stream segments attaining their designated uses. The method employed for this TMDL is termed the “Reference Watershed Approach”.

10
Selection of the Reference Watershed
The reference watershed approach was used to estimate the appropriate sediment loading reduction necessary to restore healthy aquatic communities to the Hoffer Creek Watershed. This approach is
based on selecting a non- impaired, or reference, watershed and estimating its current loading rates for the pollutants of interest. The objective of the process is to reduce loading rates of those pollutants identified as causing impairment to a level equivalent to or lower than the loading rates in
the reference watershed. Achieving the appropriate load reductions should allow the return of a healthy biological community to affected stream segments.
First, there are three factors that should be considered when selecting a suitable reference watershed: impairment status, similarity of physical properties, and size of the watershed. A
watershed that the Department has assessed and determined to be attaining water quality standards should be used as the reference. Second, a watershed that closely resembles the impaired watershed
in physical properties such as land use/land cover, physiographic province, elevation, slope and geology should be chosen. Finally, the size of the reference watershed should be within 20-30% of the impaired watershed area.
The search for a reference watershed that would satisfy the above characteristics was done by
means of a desktop screening using several GIS shapefiles, including a watershed layer, geologic formations layer, physiographic province layer, soils layer, Landsat-derived land cover/use grid, and the stream assessment information found on the Department’s Instream Comprehensive Evaluation
Protocol (ICE) GIS-based website. The suitability of the chosen watershed was confirmed through discussions with Department staff as well as through field verification of conditions.
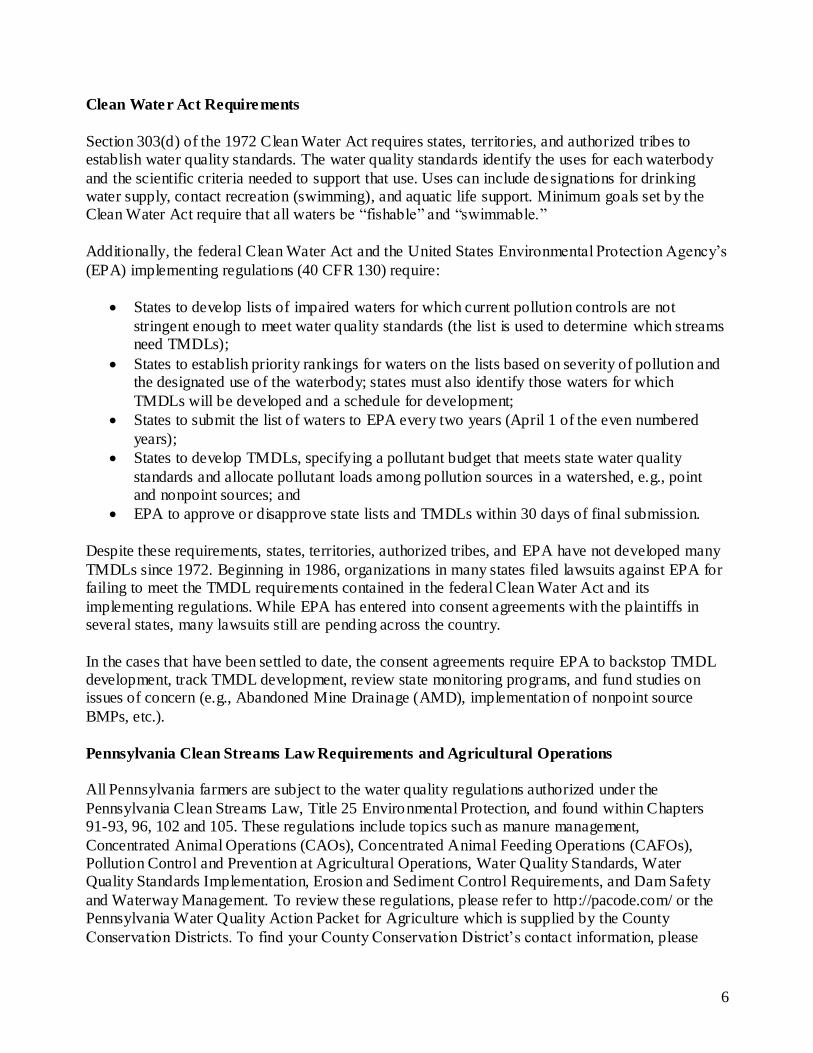
The Shippens Run Watershed was selected as the reference watershed for developing the Hoffer Creek Watershed TMDL (see Figure 1 and Figure 2, page 12). Shippens Run is a tributary to the
Susquehanna River. Shippens Run is located in Upper Paxton Township, Dauphin County, Pennsylvania. The watershed is located in the Ridge and Valley physiographic province in State Water Plan (SWP) sub-basin 6C. Shippens Run is identified in ICE as attaining its designated use
for aquatic life only. The attainment of designated uses is based on biological sampling done by the Department. Table 4 compares the two watersheds in terms of size, location, and other physical
characteristics.

11
Table 4. Comparison of the Hoffer Creek & Shippens Run Watersheds
Hoffer Creek Watershed Shippens Run Watershed
Physiographic Province Ridge and Valley Ridge and Valley
Area (acres) 1,658 1,423
Land Use Distribution % Agriculture
% Forest % Other
51
43 6
74
25 1
Soils
Dominant Group % C % B
80 20
100
Surface Geology
% Sandstone % Conglomerate
% Carbonate % Interbedded Sedimentary
25 1
4 70
100
Average Rainfall (in.) 39.3, 19 years 39.3, 19 years
Average Runoff (in.) 2.9, 19 years 3.2, 19 years
The AVGWLF model used data that included the average rainfall and runoff observed over a 19-year period from 1976-1994. The analysis of value counts for each pixel of the Multi-Resolution Land Characterization (MRLC) grid revealed that land cover/use distributions in both watersheds
are similar. Agriculture is the dominant land use category in both the Hoffer Creek and Shippens Run watersheds.
Hoffer Creek and Shippens Run lie within the Ridge and Valley Province. Surface geology in the Hoffer Creek watershed consists mainly of interbedded sedimentary and sandstone while Shippens
Run consists entirely of interbedded sedimentary. This geology has little influence on the sediment loads to either watershed.
12
Figure 1: Impaired Hoffer Creek Watershed
Figure 2. Reference: Unimpaired Shippens Run Watershed

13
Hydrologic / Water Quality Modeling
Part 1. Model Overview & Data Compilation
The TMDL for this watershed was calculated using the ArcView Generalized Watershed Loading Function (AVGWLF) Interface for Windows, version 7.2.3. The remaining paragraphs in this section are excerpts from the GWLF User’s Manual (Haith et al., 1992).
The core watershed simulation model for the AVGWLF software application is the GWLF
(Generalized Watershed Loading Function) model developed by Haith and Shoemaker. The original DOS version of the model was re-written in Visual Basic by Evans et al. (2002) to facilitate integration with ArcView, and tested extensively in the U.S. and elsewhere.
The GWLF model provides the ability to simulate runoff and sediment load from a watershed given
variable-size source areas (i.e., agricultural, forested, and developed land). It is a continuous simulation model that uses daily time steps for weather data and water balance calculations. Monthly calculations are made for sediment loads based on the daily water balance accumulated to
monthly values.
GWLF is considered to be a combined distributed/lumped parameter watershed model. For surface loading, it is distributed in the sense that it allows multiple land use/cover scenarios, but each area is assumed to be homogenous in regard to various attributes considered by the model. Additionally,
the model does not spatially distribute the source areas, but simply aggregates the loads from each source area into a watershed total; in other words there is no spatial routing. For sub-surface
loading, the model acts as a lumped parameter model using a water balance approach. No distinctly separate areas are considered for sub-surface flow contributions. Daily water balances are computed for an unsaturated zone as well as a saturated sub-surface zone, where infiltration is
simply computed as the difference between precipitation and snowmelt minus surface runoff plus evapotranspiration.
With respect to the major processes simulated, GWLF models surface runoff using the Soil Conservation Service Curve Number, or SCS-CN, approach with daily weather (temperature and
precipitation) inputs. Erosion and sediment yield are estimated using monthly erosion calculations based on the Universal Soil Loss Equation USLE algorithm (with monthly rainfall-runoff
coefficients) and a monthly composite of KLSCP values for each source area (i.e., land cover/soil type combination). The KLSCP factors are variables used in the calculations to depict changes in soil loss erosion (K), the length slope factor (LS), the vegetation cover factor (C), and the
conservation practices factor (P). A sediment delivery ratio based on watershed size and transport capacity, which is based on average daily runoff, is then applied to the calculated erosion to
determine sediment yield for each source area. Evapotranspiration is determined using daily weather data and a cover factor dependent upon land use/cover type. Finally, a water balance is performed daily using supplied or computed precipitation, snowmelt, initial unsaturated zone
storage, maximum available zone storage, and evapotranspiration values.
For execution, the model requires two separate input files containing transport and weather-related data. The transport (transport.dat) file defines the necessary parameters for each source area to be

14
considered (e.g., area size, curve number, etc.) as well as global parameters (e.g., initial storage, sediment delivery ratio, etc.) that apply to all source areas. The weather (weather.dat) file contains
daily average temperature and total precipitation values for each year simulated.
Since its initial incorporation into AVGWLF, the GWLF model has been revised to include a number of routines and functions not found in the original model. For example, a significant revision in one of the earlier versions of AVGWLF was the inclusion of a streambank erosion
routine. This routine is based on an approach often used in the field of geomorphology in which monthly streambank erosion is estimated by first calculating a watershed-specific lateral erosion
rate (LER). After a value for LER has been computed, the total sediment load generated via streambank erosion is then calculated by multiplying the above erosion rate by the total length of streams in the watershed (in meters), the average streambank height (in meters), and the average
soil bulk density (in kg/m3).
The inclusion of the various model enhancements mentioned above has necessitated the need for several more input files than required by the origina l GWLF model, including a “scenario” (*.scn) file, an animal data (animal.dat) file. Also, given all of the new and recent revisions to the model, it
has been renamed “GWLF-E” to differentiate it from the original model.
As alluded to previously, the use of GIS software for deriving input data for watershed simulation models such as GWLF is becoming fairly standard practice due to the inherent advantages of using GIS for manipulating spatial data. In this case, a customized interface developed by Penn State University
for ArcView GIS software (versions 3.2 or 3.3) is used to parameterize input data for the GWLF-E model. In utilizing this interface, the user is prompted to load required GIS files and to provide other
information related to various “non-spatial” model parameters (e.g., beginning and end of the growing season; the months during which manure is spread on agricultural land, etc.). This information is subsequently used to automatically derive values for required model input parameters which are then
written to the appropriate input files needed to execute the GWLF-E model. Also accessed through the interface are Excel- formatted weather files containing daily temperature and precipitation information.
(In the version of AVGWLF used in Pennsylvania, a statewide weather database was developed that contains about twenty-five (25) years of temperature and precipitation data for seventy-eight (78) weather stations around the state). This information is used to create the necessary weather.dat input file
for a given watershed simulation.
Part 2. GIS Based Derivation of Input Data
The primary sources of data for this analysis were geographic information system (GIS) formatted
databases and shapefiles. In using the AVGWLF interface, the user is prompted to identify required GIS files and to provide other information related to “non-spatial” model parameters (e.g. beginning
and end of growing season, manure spreading period, etc.). This information is subsequently used to automatically derive values for required model input parameters, which are then written to the TRANSPRT.DAT and WEATHER.DAT input files needed to execute the GWLF model. For use in
Pennsylvania, AVGWLF has been linked with statewide GIS data layers such as land use/cover, soils, topography and physiography; and includes location-specific default information such as
cropping practices. Complete GWLF-formatted weather files are also included for the seventy-eight weather stations around the state.

15
Table 5 lists GIS datasets and shapefiles used for the Hoffer Creek TMDL calculations via AVGWLF and provides explanations of how they were used for development of the input files for
the GWLF model.
Table 5. GIS Datasets
DATASET DESCRIPTION
county.shp The county boundaries coverage lists data on conservation practices which
provides C and P values in the Universal Soil Loss Equation (USLE).
padem 100 meter digital elevation model; this is used to calculate landslope and slope length.
palumrlc A satellite image derived land cover grid which is c lassified into 15 different
landcover categories. This dataset provides landcover loading rates for the different categories in the model.
physprov.shp A shapefile of physiographic provinces. This is used in rainfall erosivity
calculations.
smallsheds.shp A coverage of watersheds derived at 1:24,000 scale. This coverage is used with the stream network to delineate the desired level watershed.
streams.shp The 1:24,000 scale single line stream coverage of Pennsylvania. Provides a
complete network of streams with coded stream segments.
PAgeo A shapefile of the surface geology used to compare watersheds of similar qualities.
weathersta.shp Historical weather files for stations around Pennsylvania to simulate flow.
soils.shp A shapefile providing soil characteristics data. This is used in multiple calculations.
zipcodes.shp This shapefile provides animal density numbers used in the LER calculation.
In the GWLF model, the nonpoint source load calculated is affected by terrain conditions such as
amount of agricultural land, land slope, and inherent soil erodibility. It is also affected by farming practices utilized in the area. Various parameters are included in the model to account for these
conditions and practices. Some of the more important parameters are summarized below: Areal extent of different land use/cover categories: This is calculated directly from a GIS layer of
land use/cover.
Curve number: This determines the amount of precipitation that infiltrates into the ground or enters surface water as runoff. It is based on specified combinations of land use/cover and hydrologic soil type, and is calculated directly using digital land use/cover and soils layers.
K factor: This factor relates to inherent soil erodibility, and affects the amount of soil erosion taking
place on a given unit of land. LS factor: This factor signifies the steepness and length of slopes in an area and directly affects the
amount of soil erosion.

16
C factor: This factor is related to the amount of vegetative cover in an area. In agricultural areas, the crops grown and the cultivation practices utilized largely control this factor. Values range from 0 to
1.0, with larger values indicating greater potential for erosion.
P factor: This factor is directly related to the conservation practices utilized in agricultural areas. Values range from 0 to 1.0, with larger values indicating greater potential for erosion. Sediment delivery ratio: This parameter specifies the percentage of eroded sediment that is
delivered to surface water and is empirically based on watershed size.
Unsaturated available water-holding capacity: This relates to the amount of water that can be stored in the soil and affects runoff and infiltration. It is calculated using a digital soils layer.
Other less important factors that can affect sediment loads in a watershed are also included in the model.
The above parameter descriptions were taken from the AVGWLF Version 7.1 Users Guide (Evans et al., 2007).
Watershed Assessment and Modeling
The AVGWLF model was used to establish existing loading conditions for the Hoffer Creek and the Shippens Run Watersheds. All AVGWLF data and outputs have been attached to this TMDL as
Attachment C. Department staff visited the Hoffer Creek Watershed and the Shippens Run Watershed to get a better understanding of existing conditions that might influence the AVGWLF model. General observations of the individual watershed characteristics included:
Hoffer Creek Watershed (impaired)
limited or absent riparian buffers in the agricultural areas
conservation farming practices limited or absent
livestock access to the stream
Shippens Run Watershed (reference)
forested riparian buffers
tree plantings
no till farming practices
Based on field observations adjustments may be made to specific parameters used in the
AVGWLF model. These adjustments were as follows:
Hoffer Creek Watershed
No changes to the model were necessary for the Hoffer Creek watershed since model default parameters closely matched field observations.
Shippens Run Watershed
Slight adjustments were made to the P factors for agriculture due to the heavy riparian buffers and therefore lower potential for erosion.

17
Figure 3. Cattle access to stream in Hoffer Creek Watershed
Figure 4. Stream bank erosion in the Hoffe r Creek Watershed.

18
Figure 5. Extensive riparian buffer in the Shippens Run Watershed
Figure 6. Riparian buffer at the upstream end of the Shippens Run Watershed.

19
The AVGWLF model produced area information and sediment loading based on land use (Tables 6 and 7).
Table 6. Existing Loading Values for Hoffer Creek (impaired)
Source Area (ac) Sediment
(lbs)
Unit Area Load
(lbs/ac/yr)
HAY/PAST 521.4 90,200 173.0
CROPLAND 313.8 670,000 2135.1
FOREST 711.7 7,400 10.4
TRANSITION 9.9 25,600 2,585.9
LO_INT_DEV 101.3 24,400 240.9
Stream Bank 76,800
TOTAL 1,658.1 894,400 539.4
Table 7. Existing Loading Values for Shippens Run (reference)
Source Area (ac) Sediment
(lbs.) Unit Area Load
(lb/ac/yr)
HAY/PAST 536.2 29,600 55.2
CROPLAND 521.4 645,600 1,238.2
FOREST 358.3 13,000 36.3
TRANSITION 4.9 10,200 2,081.6
LO_INT_DEV 2.5 0 0
Stream Bank 2,800
TOTAL 1,423.3 701,200 429.7 For Tables 6 and 7 the “stream bank” sediment loads are calculated by AVGWLF’s stream bank
routine. This routine uses stream bank (linear) miles rather than area.
Development of Sediment TMDL
The target TMDL value for the Hoffer Creek Watershed was established based on current loading rates for sediment in the Shippens Run reference watershed. Shippens Run is currently designated
as a Warm Water Fishery (WWF) and previous biological assessments have determined that the watershed is attaining its designated aquatic life use. As part of the Susquehanna River Basin,
Hoffer Creek is also considered a Migratory Fishery (MF). Reducing the loading rates of sediment in the Hoffer Creek, to levels equal to, or less than, the reference watershed should allow for the reversal of current use impairments.
As described in the previous section, sediment loading rates were computed for the Shippens Run
Watershed using the AVGWLF model. The target TMDL value for sediment was determined by multiplying the unit area loading rates for the Shippens Run Watershed by the total watershed area of the Hoffer Creek Watershed (Table 8).

20
Table 8. TMDL Values for the Hoffer Creek Watershed
Pollutant Loading Rate in
Reference (lb/ac-yr) Total Area in Hoffer
Creek Watershed (ac) Target TMDL Value (lb/yr)
Target TMDL Value (lb/day)
Sediment 492.7 1,658.1 816,876* 2,238
* takes into account rounding in previous calculations
The target TMDL value was then used as the basis for load allocations and reductions in the Hoffer Creek Watershed, using the following two equations:
1. TMDL = WLA + LA + MOS
2. LA = ALA + LNR where: TMDL = Total Maximum Daily Load
WLA = Waste Load Allocation (Point Sources) LA = Load Allocation (Nonpoint Sources)
MOS = Margin of Safety ALA = Adjusted Load Allocation LNR = Loads Not Reduced
Waste Load Allocation
The waste load allocation (WLA) portion of the TMDL equation is the total loading of a pollutant that is assigned to point sources. There are no NPDES permitted facilities in the Hoffer Creek
Watershed; however, there was a bulk reserve allocation of 1.0% of the TMDL to account for the dynamic nature of permit activity. The bulk reserve accounts for a loading rate of 8,169 pounds of
sediment per year (Table 9). WLA= Flow (mgd) * mg/L (monthly average)* 8.34* 365= TSS lbs./yr.
Table 9. Waste Load Allocations for the Hoffer Creek Watershed
Name NPDES Permit # Loading Rate (lb/yr) Loading Rate (lb/day)
Bulk Reserve NA 8,169 22
Margin of Safety
The margin of safety (MOS) is that portion of the pollutant loading that is reserved to account for
any uncertainty in the data and computational methodology used for the analysis. For this analysis, the MOS is explicit. Ten percent of the targeted TMDL for sed iment was reserved as the MOS. Using 10% of the TMDL load is based on professional judgment and will provide an additional
level of protection to the designated uses of Hoffer Creek. The MOS used for the sediment TMDL was set at 81,688 lbs./yr.
MOS = 816,876 lbs./yr. (TMDL) * 0.1 = 81,688 lbs./yr. OR MOS = 2,238 lbs./day (TMDL) * 0.1 = 224 lbs./day
21
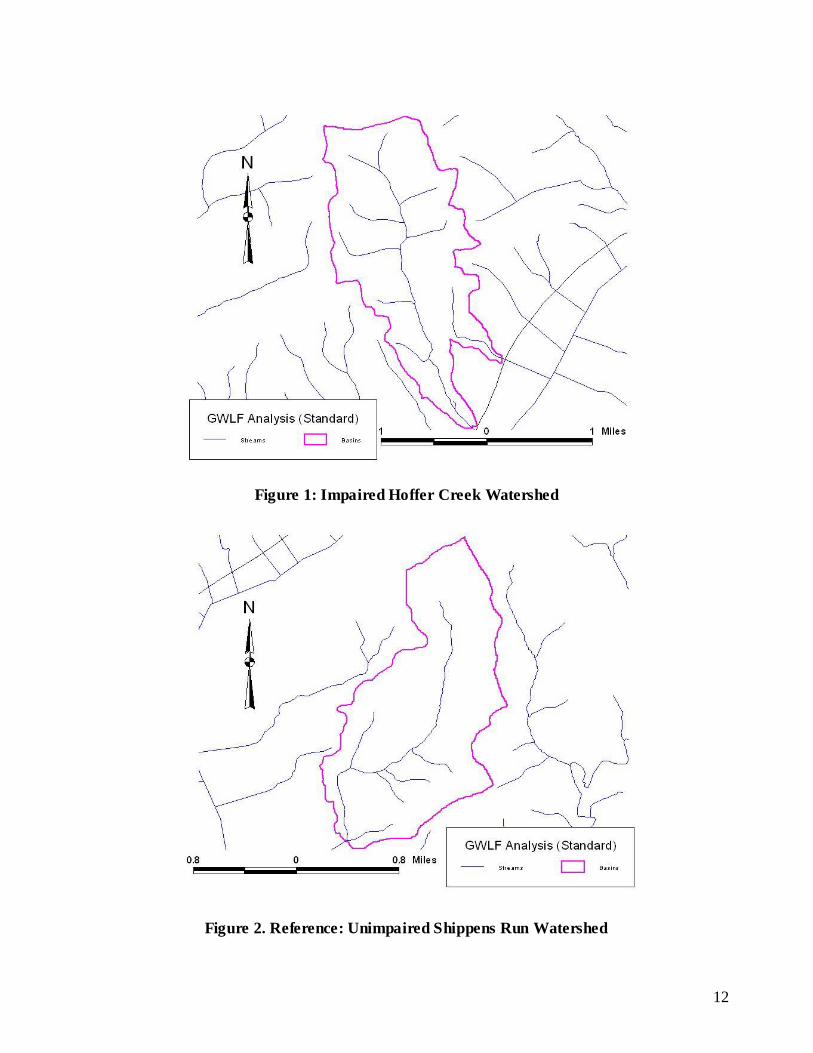
Load Allocation
The load allocation (LA) is that portion of the TMDL that is assigned to nonpoint sources. The LA for sediment was computed by subtracting the MOS value and the WLA from the TMDL value. The
LA for sediment was 727,020 lbs./yr. LA = 816,876 lbs./yr. (TMDL) – 81,688 lbs./yr. (MOS) – 8,169 lbs./yr. (WLA)= 727,020 lbs./yr.
OR LA = 2,238 lbs./day (TMDL) – 224 lbs./day (MOS) – 22 lbs./day (WLA)= 1,992 lbs./day
Adjusted Load Allocation
The adjusted load allocation (ALA) is the actual portion of the LA distributed among those
nonpoint sources receiving reductions. It is computed by subtracting those nonpoint source loads that are not being considered for reductions (loads not reduced (LNR)) from the LA. While the Hoffer Creek Watershed TMDL was developed to address impairments caused by agricultural
activities, hay/pastureland (Hay/Past) and Cropland, they were not the only land uses considered for reductions. Stream banks noted in the Hoffer Creek Watershed were believed to also be a
contributor to the sediment load in the watershed. Land uses/source loads not reduced (LNR) were carried through at their existing loading values (Table 10).
Table 10. Load Allocations, Loads Not Reduced and Adjusted Load Allocations
Sediment (lbs./yr.) Sediment (lbs./day)
Load Allocation 727,020 1,992
Loads Not Reduced: Forest
Low Intensity Development
31,800 7,400 24,400
87.1 20 67
Adjusted Load Allocation 695,220 1,905
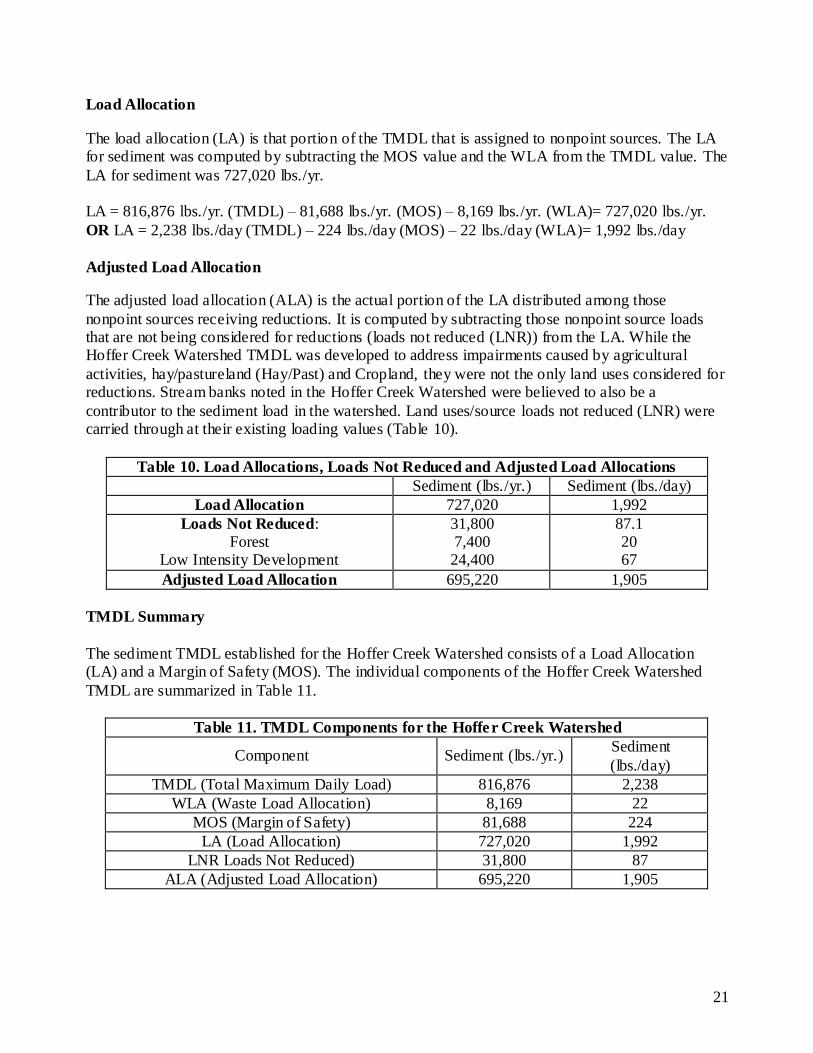
TMDL Summary
The sediment TMDL established for the Hoffer Creek Watershed consists of a Load Allocation (LA) and a Margin of Safety (MOS). The individual components of the Hoffer Creek Watershed
TMDL are summarized in Table 11.
Table 11. TMDL Components for the Hoffer Creek Watershed
Component Sediment (lbs./yr.) Sediment
(lbs./day)
TMDL (Total Maximum Daily Load) 816,876 2,238
WLA (Waste Load Allocation) 8,169 22
MOS (Margin of Safety) 81,688 224
LA (Load Allocation) 727,020 1,992
LNR Loads Not Reduced) 31,800 87
ALA (Adjusted Load Allocation) 695,220 1,905

22
Calculation of Sediment Load Reductions
The adjusted load allocation established in the previous section represents the sediment load that is available for allocation between Hay/Pasture, Cropland, transition land and stream banks in the
Hoffer Creek Watershed. Data needed for load reduction analyses, including land use distribution, were obtained by GIS analysis. The Equal Marginal Percent Reduction (EMPR) allocation method, Attachment B, was used to distribute the ALA between the three land use types and stream banks.
The process is summarized below:
1. Each land use/source load is compared with the total allocable load to determine if any contributor would exceed the allocable load by itself. The evaluation is carried out as if each source is the only contributor to the pollutant load to the receiving waterbody. If the
contributor exceeds the allocable load, that contributor would be reduced to the allocable load. This is the baseline portion of EMPR. For this evaluation no contributor was in
excess of the adjusted load allocation (ALA).
2. After any necessary reductions have been made in the baseline, the multiple analyses are
run. The multiple analyses will sum all of the baseline loads and compare them to the total allocable load. If the allocable load is exceeded, an equal percent reduction will be
made to all contributors’ baseline values. After any necessary reductions in the multiple analyses, the final reduction percentage for each contributor can be computed. For this evaluation the allocable load was exceeded. The equal percent reduction, i.e., the ALA
divided by the summation of the baselines, worked out to a 19.4% reduction for all land uses/sources.
Tables 12 and 13 contain the results of the EMPR for hay/pasture, cropland, transition land and stream banks in the Hoffer Creek Watershed. The load allocation for each land use is shown along
with the percent reduction of current loads necessary to reach the targeted LA.
Table 12. Sediment Load Allocations/Reductions for Land Uses and Stream Banks in the
Hoffer Creek Watershed (Annual Values)
Current Loading
Allowable Loading
Current Load
Load Allocation
Land Use Acres (lbs./acre/yr.) (lbs./acre/yr.) (lbs./yr.) (lbs./yr.) % Reduction
Hay/Pasture 521.4 173.0 139.4 90,200 72,697 19.4
Cropland 313.8 2,135.1 1,720.8 670,000 539,992 19.4
Transition 9.9 2,585.9 2,084.1 25,600 20,633 19.4
Stream Bank
76,800 61,898 19.4
23
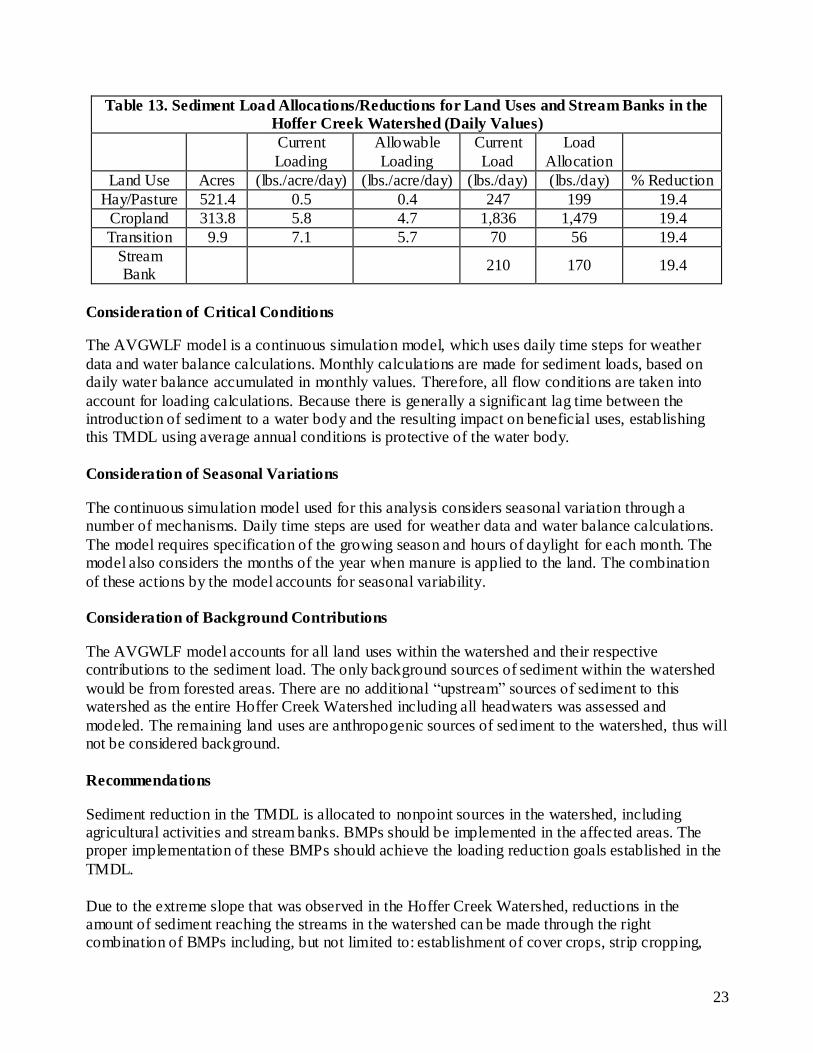
Table 13. Sediment Load Allocations/Reductions for Land Uses and Stream Banks in the
Hoffer Creek Watershed (Daily Values)
Current
Loading
Allowable
Loading
Current
Load
Load
Allocation
Land Use Acres (lbs./acre/day) (lbs./acre/day) (lbs./day) (lbs./day) % Reduction
Hay/Pasture 521.4 0.5 0.4 247 199 19.4
Cropland 313.8 5.8 4.7 1,836 1,479 19.4
Transition 9.9 7.1 5.7 70 56 19.4
Stream Bank
210 170 19.4
Consideration of Critical Conditions
The AVGWLF model is a continuous simulation model, which uses daily time steps for weather
data and water balance calculations. Monthly calculations are made for sediment loads, based on daily water balance accumulated in monthly values. Therefore, all flow conditions are taken into
account for loading calculations. Because there is generally a significant lag time between the introduction of sediment to a water body and the resulting impact on beneficial uses, establishing this TMDL using average annual conditions is protective of the water body.
Consideration of Seasonal Variations
The continuous simulation model used for this analysis considers seasonal variation through a number of mechanisms. Daily time steps are used for weather data and water balance calculations.
The model requires specification of the growing season and hours of daylight for each month. The model also considers the months of the year when manure is applied to the land. The combination
of these actions by the model accounts for seasonal variability. Consideration of Background Contributions
The AVGWLF model accounts for all land uses within the watershed and their respective contributions to the sediment load. The only background sources of sediment within the watershed
would be from forested areas. There are no additional “upstream” sources of sediment to this watershed as the entire Hoffer Creek Watershed including all headwaters was assessed and
modeled. The remaining land uses are anthropogenic sources of sediment to the watershed, thus will not be considered background.
Recommendations
Sediment reduction in the TMDL is allocated to nonpoint sources in the watershed, including agricultural activities and stream banks. BMPs should be implemented in the affected areas. The proper implementation of these BMPs should achieve the loading reduction goals established in the
TMDL.
Due to the extreme slope that was observed in the Hoffer Creek Watershed, reductions in the amount of sediment reaching the streams in the watershed can be made through the right combination of BMPs including, but not limited to: establishment of cover crops, strip cropping,

24
residue management, no till, crop rotation, contour farming, terracing, stabilizing heavy use areas and proper management of storm water. Vegetated or forested buffers are acceptable BMPs to
intercept any runoff from farm fields. For the pasturing of farm animals and animal heavy use areas, acceptable BMPs may include: manure storage, rotational grazing, livestock exclusion fencing and
forested riparian buffers. Some of these BMPs were observed in the Hoffer Creek Watershed; however, they were more extensively used in the unimpaired reference watershed, Shippens Run, with forested riparian buffers being the predominant BMP in use. Since both watersheds have a
moderate amount of agricultural activities, it is apparent that the greater use of BMPs, especially forested riparian buffers, in the reference watershed has contributed to its ability to maintain its
attainment status as a Warm Water Fishes (WWF) stream. Stream banks contribute to the sediment load in Hoffer Creek. Stream bank stabilization projects
would be acceptable BMPs for the eroded stream banks in the area. However, the establishment of forested riparian buffers is the most economical and effective BMP at providing stream bank
stabilization and protection of the banks from freeze/thaw erosion and scouring flows. Forested riparian buffers also provide important natural and durable connectivity of land and water. This connectivity is necessary to provide cover, nesting and nursery sites, shade and stable temperatures,
and viable substrate for aquatic organisms of all layers of the food web.
Important to TMDLs, established forested riparian buffers act as nutrient and sediment sinks. This is because the highly active and concentrated biological communities they maintain will assimilate and remove nutrients and sediment from the water column instead of allowing them to pass
downstream, thus forested riparian buffers work directly toward attaining the goals of the TMDL by reducing pollutant loads. Forested riparian buffers also provide critical habitat to rare and sensitive
amphibious and terrestrial organisms as well as migratory species. While forested riparian buffers are considered the most effective BMP, other possibilities for attaining the desired reductions may exist for the agricultural usages, as well as for the stream banks.
For both the agricultural land uses, further ground truthing should be performed in order to assess
both the extent of existing BMPs, and to determine the most cost effective and environmentally protective combination of BMPs required for meeting the sediment reductions outlined in this report. A combined effort involving key personnel from the regional DEP office, the Snyder County
Conservation District, Susquehanna River Basin Commission (SRBC) and other state and local agencies and/or watershed groups would be the most effective in accomplishing any ground truthing
exercises. Development of a more detailed watershed implementation plan is recommended.
Public Participation
Public notice of the draft TMDL was published in the Pennsylvania Bulletin on June 16, 2012 to
foster public comment on the allowable loads calculated. No public comments were received for the Hoffer Creek Sediment TMDL (Attachment F).
Literature Cited
Haith, D. A.; Mandel, R.; Wu, R. S. for Cornell University Generalized Watershed Loading
Functions Version 2.0 User’s Manual; Ithaca, NY, 1992.

25
Evans, B. M.; Lehning, D. W.; Corradini, K. J. for The Pennsylvania State University AVGWLF Version 7.1 Users Guide; University Park, PA, 2007.

26
Attachment A
Map of Hoffer Creek Watershed

27
Figure A1. Hoffer Creek Watershed

28
Attachment B
Equal Marginal Percent Reduction Method

29
Equal Marginal Percent Reduction (EMPR) (An Allocation Strategy)
The Equal Marginal Percent Reduction (EMPR) allocation method was used to distribute
Adjusted Load Allocations (ALAs) between the appropriate contributing nonpoint sources. The load allocation and EMPR procedures were performed using a MS Excel spreadsheet. The 5 major steps identified in the spreadsheet are summarized below:
Step 1: Calculation of the TMDL based on impaired watershed size and unit area loading
rate of reference watershed. Step 2: Calculation of Adjusted Load Allocation based on TMDL, Margin of Safety, and
existing loads not reduced.
Step 3: Actual EMPR Process:
a. Each land use/source load is compared with the total ALA to
determine if any contributor would exceed the ALA by itself. The evaluation is carried out as if each source is the only contributor to
the pollutant load of the receiving waterbody. If the contributor exceeds the ALA, that contributor would be reduced to the ALA. If a contributor is less than the ALA, it is set at the existing load. This is
the baseline portion of EMPR.
b. After any necessary reductions have been made in the baseline, the multiple analyses are run. The multiple analyses will sum all of the baseline loads and compare them to the ALA. If the ALA is
exceeded, an equal percent reduction will be made to all contributors’ baseline values. After any necessary reductions in the
multiple analyses, the final reduction percentage for each contributor can be computed.
Step 4: Calculation of total loading rate of all sources receiving reductions.
Step 5: Summary of existing loads, final load allocations, and % reduction for each pollutant source.
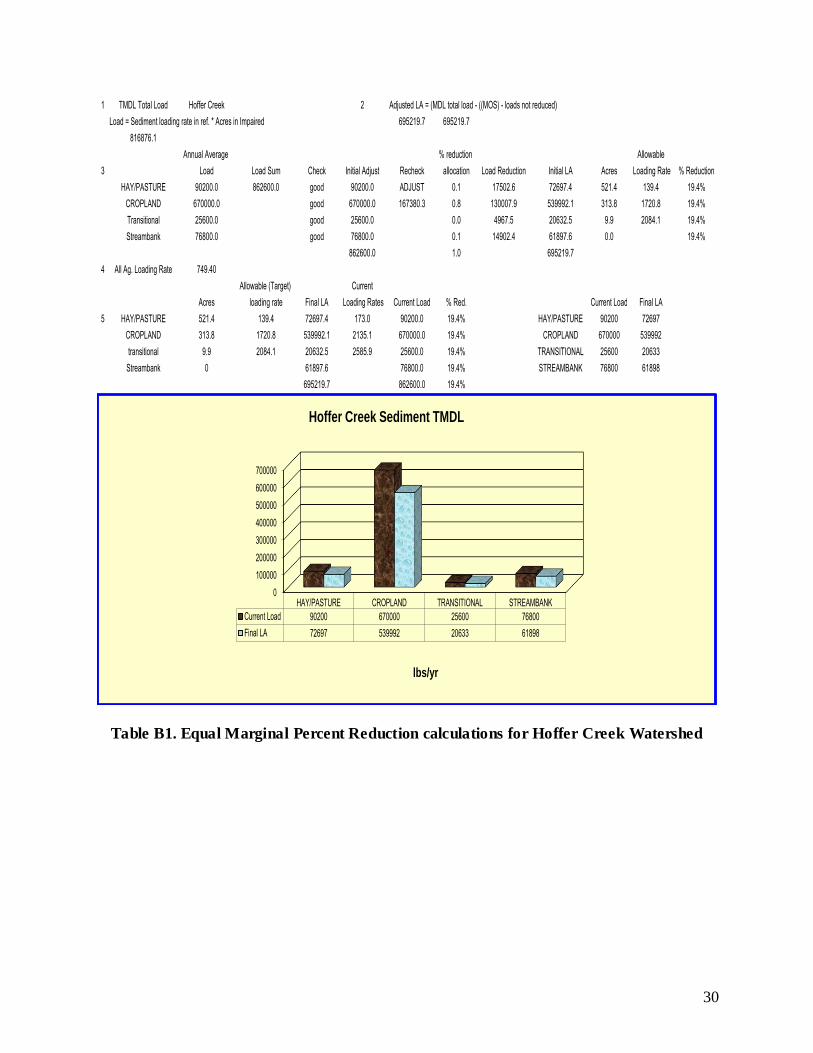
30
1 TMDL Total Load Hoffer Creek 2 Adjusted LA = (MDL total load - ((MOS) - loads not reduced)
Load = Sediment loading rate in ref. * Acres in Impaired 695219.7 695219.7
816876.1
Annual Average % reduction Allowable
3 Load Load Sum Check Initial Adjust Recheck allocation Load Reduction Initial LA Acres Loading Rate % Reduction
HAY/PASTURE 90200.0 862600.0 good 90200.0 ADJUST 0.1 17502.6 72697.4 521.4 139.4 19.4%
CROPLAND 670000.0 good 670000.0 167380.3 0.8 130007.9 539992.1 313.8 1720.8 19.4%
Transitional 25600.0 good 25600.0 0.0 4967.5 20632.5 9.9 2084.1 19.4%
Streambank 76800.0 good 76800.0 0.1 14902.4 61897.6 0.0 19.4%
862600.0 1.0 695219.7
4 All Ag. Loading Rate 749.40
Allowable (Target) Current
Acres loading rate Final LA Loading Rates Current Load % Red. Current Load Final LA
5 HAY/PASTURE 521.4 139.4 72697.4 173.0 90200.0 19.4% HAY/PASTURE 90200 72697
CROPLAND 313.8 1720.8 539992.1 2135.1 670000.0 19.4% CROPLAND 670000 539992
transitional 9.9 2084.1 20632.5 2585.9 25600.0 19.4% TRANSITIONAL 25600 20633
Streambank 0 61897.6 76800.0 19.4% STREAMBANK 76800 61898
695219.7 862600.0 19.4%
0
100000
200000
300000
400000
500000
600000
700000
HAY/PASTURE CROPLAND TRANSITIONAL STREAMBANK
Current Load 90200 670000 25600 76800
Final LA 72697 539992 20633 61898
lbs/yr
Hoffer Creek Sediment TMDL
Table B1. Equal Marginal Percent Reduction calculations for Hoffer Creek Watershed

31
Attachment C
AVGWLF Generated Data Tables

32
Table C1. Data contained in TRANSPRT.DAT for Hoffer Creek Watershed

33
Table C2. Outputs for Hoffer Creek Watershed

34
Table C3. Data contained in TRANSPRT.DAT for Shippens Run Watershed
35
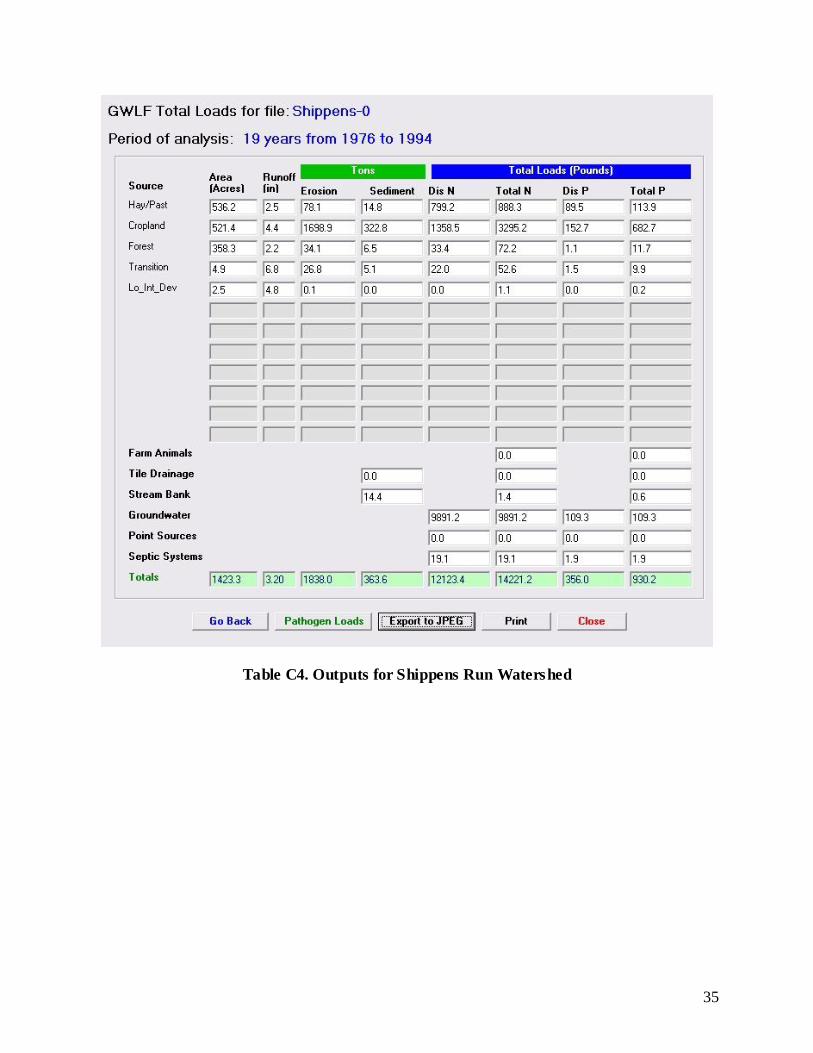
Table C4. Outputs for Shippens Run Watershed
36
Attachment D
Pennsylvania Integrated Water Quality Monitoring and Assessment
Report: Streams, Category 5 Waterbodies, Pollutants Requiring a
TMDL
37

38
Attachment E
Excerpts Justifying Changes between the 1998-2002 Section 303(d)
Lists and the 2004 to present Integrated Water Quality Monitoring
and Assessment Reports
39
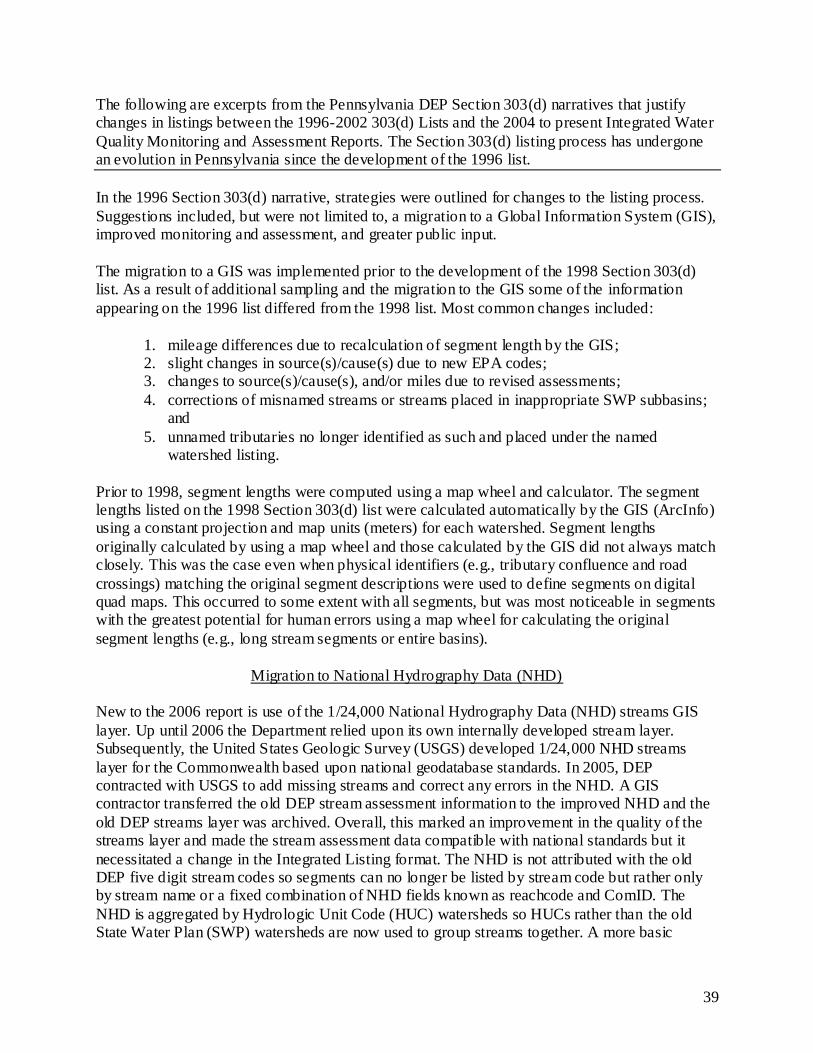
The following are excerpts from the Pennsylvania DEP Section 303(d) narratives that justify changes in listings between the 1996-2002 303(d) Lists and the 2004 to present Integrated Water
Quality Monitoring and Assessment Reports. The Section 303(d) listing process has undergone an evolution in Pennsylvania since the development of the 1996 list.
In the 1996 Section 303(d) narrative, strategies were outlined for changes to the listing process.
Suggestions included, but were not limited to, a migration to a Global Information System (GIS), improved monitoring and assessment, and greater public input.
The migration to a GIS was implemented prior to the development of the 1998 Section 303(d) list. As a result of additional sampling and the migration to the GIS some of the information
appearing on the 1996 list differed from the 1998 list. Most common changes included:
1. mileage differences due to recalculation of segment length by the GIS; 2. slight changes in source(s)/cause(s) due to new EPA codes; 3. changes to source(s)/cause(s), and/or miles due to revised assessments;
4. corrections of misnamed streams or streams placed in inappropriate SWP subbasins; and
5. unnamed tributaries no longer identified as such and placed under the named watershed listing.
Prior to 1998, segment lengths were computed using a map wheel and calculator. The segment lengths listed on the 1998 Section 303(d) list were calculated automatically by the GIS (ArcInfo) using a constant projection and map units (meters) for each watershed. Segment lengths
originally calculated by using a map wheel and those calculated by the GIS did not always match closely. This was the case even when physical identifiers (e.g., tributary confluence and road
crossings) matching the original segment descriptions were used to define segments on digital quad maps. This occurred to some extent with all segments, but was most noticeable in segments with the greatest potential for human errors using a map wheel for calculating the original
segment lengths (e.g., long stream segments or entire basins).
Migration to National Hydrography Data (NHD)
New to the 2006 report is use of the 1/24,000 National Hydrography Data (NHD) streams GIS
layer. Up until 2006 the Department relied upon its own internally developed stream layer. Subsequently, the United States Geologic Survey (USGS) developed 1/24,000 NHD streams
layer for the Commonwealth based upon national geodatabase standards. In 2005, DEP contracted with USGS to add missing streams and correct any errors in the NHD. A GIS contractor transferred the old DEP stream assessment information to the improved NHD and the
old DEP streams layer was archived. Overall, this marked an improvement in the quality of the streams layer and made the stream assessment data compatible with national standards but it
necessitated a change in the Integrated Listing format. The NHD is not attributed with the old DEP five digit stream codes so segments can no longer be listed by stream code but rather only by stream name or a fixed combination of NHD fields known as reachcode and ComID. The
NHD is aggregated by Hydrologic Unit Code (HUC) watersheds so HUCs rather than the old State Water Plan (SWP) watersheds are now used to group streams together. A more basic

40
change was the shift in data management philosophy from one of “dynamic segmentation” to “fixed segments”. The dynamic segmentation records were proving too difficult to manage from
an historical tracking perspective. The fixed segment methods will remedy that problem. The stream assessment data management has gone through many changes over the years as system
requirements and software changed. It is hoped that with the shift to the NHD and OIT’s (Office of Information Technology) fulltime staff to manage and maintain SLIMS the systems and formats will now remain stable over many Integrated Listing cycles.
41
Attachment F
Comment and Response

42
No public comments were received for the Hoffer Creek Sediment TMDL.


