21
SOC Telemed
SOC Telemed
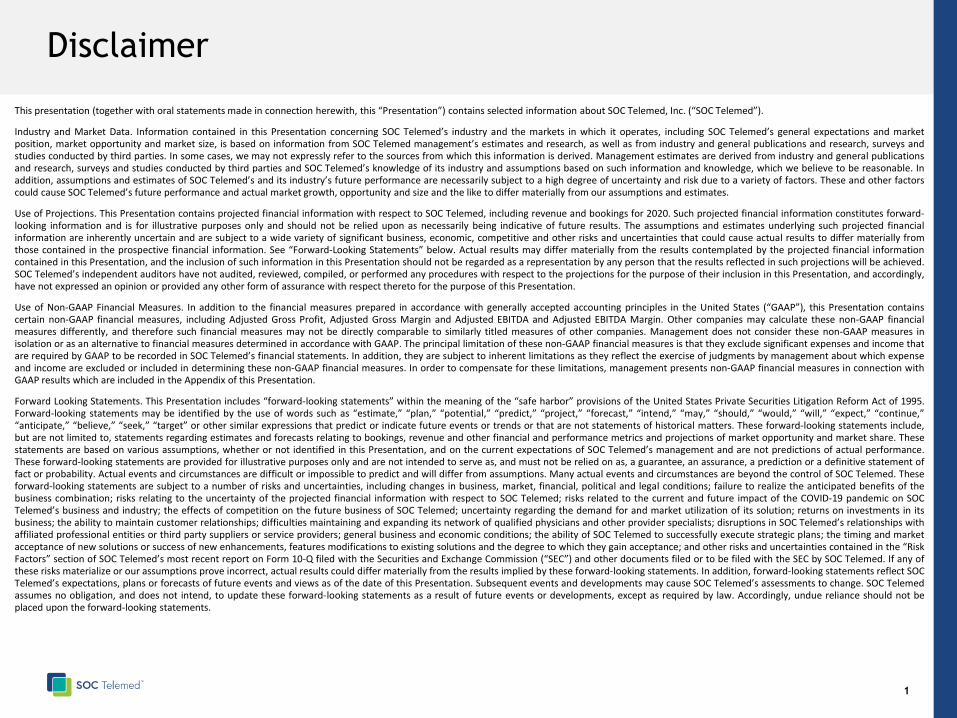
Disclaimer
This presentation (together with oral statements made in connection herewith, this “Presentation”) contains selected information about SOC Telemed, Inc. (“SOC Telemed”).
Industry and Market Data. Information contained in this Presentation concerning SOC Telemed’s industry and the markets in which it operates, including SOC Telemed’s general expectations and marketposition, market opportunity and market size, is based on information from SOC Telemed management’s estimates and research, as well as from industry and general publications and research, surveys andstudies conducted by third parties. In some cases, we may not expressly refer to the sources from which this information is derived. Management estimates are derived from industry and general publicationsand research, surveys and studies conducted by third parties and SOC Telemed’s knowledge of its industry and assumptions based on such information and knowledge, which we believe to be reasonable. Inaddition, assumptions and estimates of SOC Telemed’s and its industry’s future performance are necessarily subject to a high degree of uncertainty and risk due to a variety of factors. These and other factorscould cause SOC Telemed’s future performance and actual market growth, opportunity and size and the like to differ materially from our assumptions and estimates.
Use of Projections. This Presentation contains projected financial information with respect to SOC Telemed, including revenue and bookings for 2020. Such projected financial information constitutes forward-looking information and is for illustrative purposes only and should not be relied upon as necessarily being indicative of future results. The assumptions and estimates underlying such projected financialinformation are inherently uncertain and are subject to a wide variety of significant business, economic, competitive and other risks and uncertainties that could cause actual results to differ materially fromthose contained in the prospective financial information. See “Forward-Looking Statements” below. Actual results may differ materially from the results contemplated by the projected financial informationcontained in this Presentation, and the inclusion of such information in this Presentation should not be regarded as a representation by any person that the results reflected in such projections will be achieved.SOC Telemed’s independent auditors have not audited, reviewed, compiled, or performed any procedures with respect to the projections for the purpose of their inclusion in this Presentation, and accordingly,have not expressed an opinion or provided any other form of assurance with respect thereto for the purpose of this Presentation.
Use of Non-GAAP Financial Measures. In addition to the financial measures prepared in accordance with generally accepted accounting principles in the United States (“GAAP”), this Presentation containscertain non-GAAP financial measures, including Adjusted Gross Profit, Adjusted Gross Margin and Adjusted EBITDA and Adjusted EBITDA Margin. Other companies may calculate these non-GAAP financialmeasures differently, and therefore such financial measures may not be directly comparable to similarly titled measures of other companies. Management does not consider these non-GAAP measures inisolation or as an alternative to financial measures determined in accordance with GAAP. The principal limitation of these non-GAAP financial measures is that they exclude significant expenses and income thatare required by GAAP to be recorded in SOC Telemed’s financial statements. In addition, they are subject to inherent limitations as they reflect the exercise of judgments by management about which expenseand income are excluded or included in determining these non-GAAP financial measures. In order to compensate for these limitations, management presents non-GAAP financial measures in connection withGAAP results which are included in the Appendix of this Presentation.
Forward Looking Statements. This Presentation includes “forward-looking statements” within the meaning of the “safe harbor” provisions of the United States Private Securities Litigation Reform Act of 1995.Forward-looking statements may be identified by the use of words such as “estimate,” “plan,” “potential,” “predict,” “project,” “forecast,” “intend,” “may,” “should,” “would,” “will,” “expect,” “continue,”“anticipate,” “believe,” “seek,” “target” or other similar expressions that predict or indicate future events or trends or that are not statements of historical matters. These forward-looking statements include,but are not limited to, statements regarding estimates and forecasts relating to bookings, revenue and other financial and performance metrics and projections of market opportunity and market share. Thesestatements are based on various assumptions, whether or not identified in this Presentation, and on the current expectations of SOC Telemed’s management and are not predictions of actual performance.These forward-looking statements are provided for illustrative purposes only and are not intended to serve as, and must not be relied on as, a guarantee, an assurance, a prediction or a definitive statement offact or probability. Actual events and circumstances are difficult or impossible to predict and will differ from assumptions. Many actual events and circumstances are beyond the control of SOC Telemed. Theseforward-looking statements are subject to a number of risks and uncertainties, including changes in business, market, financial, political and legal conditions; failure to realize the anticipated benefits of thebusiness combination; risks relating to the uncertainty of the projected financial information with respect to SOC Telemed; risks related to the current and future impact of the COVID-19 pandemic on SOCTelemed’s business and industry; the effects of competition on the future business of SOC Telemed; uncertainty regarding the demand for and market utilization of its solution; returns on investments in itsbusiness; the ability to maintain customer relationships; difficulties maintaining and expanding its network of qualified physicians and other provider specialists; disruptions in SOC Telemed’s relationships withaffiliated professional entities or third party suppliers or service providers; general business and economic conditions; the ability of SOC Telemed to successfully execute strategic plans; the timing and marketacceptance of new solutions or success of new enhancements, features modifications to existing solutions and the degree to which they gain acceptance; and other risks and uncertainties contained in the “RiskFactors” section of SOC Telemed’s most recent report on Form 10-Q filed with the Securities and Exchange Commission (“SEC”) and other documents filed or to be filed with the SEC by SOC Telemed. If any ofthese risks materialize or our assumptions prove incorrect, actual results could differ materially from the results implied by these forward-looking statements. In addition, forward-looking statements reflect SOCTelemed’s expectations, plans or forecasts of future events and views as of the date of this Presentation. Subsequent events and developments may cause SOC Telemed’s assessments to change. SOC Telemedassumes no obligation, and does not intend, to update these forward-looking statements as a result of future events or developments, except as required by law. Accordingly, undue reliance should not beplaced upon the forward-looking statements.
1
2
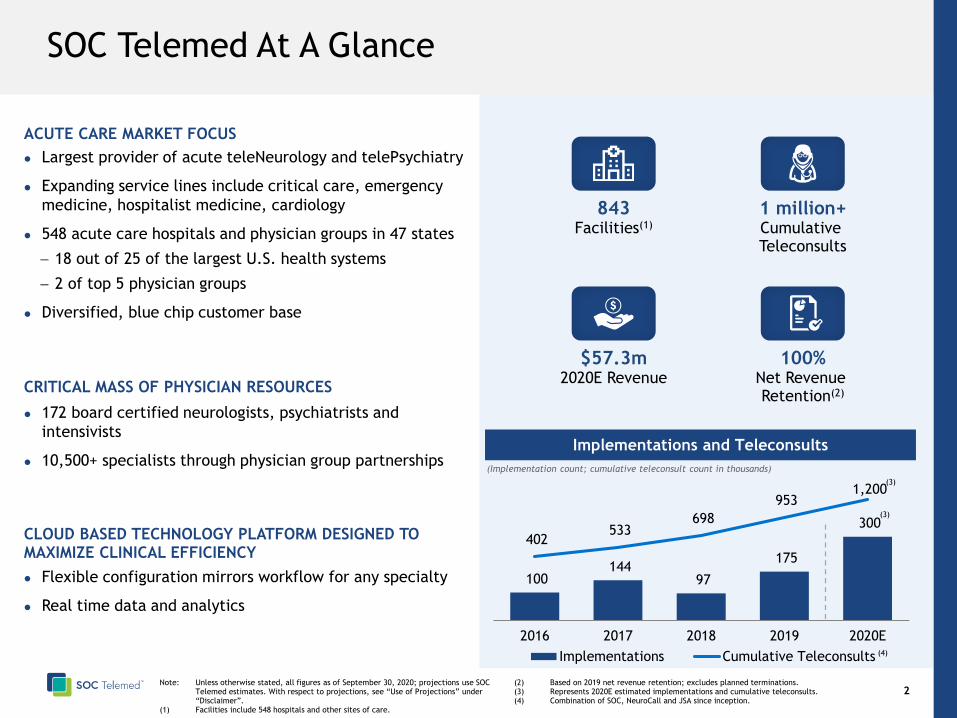
ACUTE CARE MARKET FOCUS
Largest provider of acute teleNeurology and telePsychiatry
Expanding service lines include critical care, emergency
medicine, hospitalist medicine, cardiology
548 acute care hospitals and physician groups in 47 states
− 18 out of 25 of the largest U.S. health systems
− 2 of top 5 physician groups
Diversified, blue chip customer base
CRITICAL MASS OF PHYSICIAN RESOURCES
172 board certified neurologists, psychiatrists and
intensivists
10,500+ specialists through physician group partnerships
CLOUD BASED TECHNOLOGY PLATFORM DESIGNED TO MAXIMIZE CLINICAL EFFICIENCY
Flexible configuration mirrors workflow for any specialty
Real time data and analytics
100 144
97
175
300 402
533 698
953 1,200
2016 2017 2018 2019 2020E
Implementations Cumulative Teleconsults
Implementations and Teleconsults
Note: Unless otherwise stated, all figures as of September 30, 2020; projections use SOC Telemed estimates. With respect to projections, see “Use of Projections” under “Disclaimer”.
(1) Facilities include 548 hospitals and other sites of care.
(2) Based on 2019 net revenue retention; excludes planned terminations.(3) Represents 2020E estimated implementations and cumulative teleconsults.(4) Combination of SOC, NeuroCall and JSA since inception.
(3)
(4)
843Facilities(1)
$57.3m2020E Revenue
100%Net Revenue Retention(2)
1 million+Cumulative Teleconsults
(Implementation count; cumulative teleconsult count in thousands)
(3)
SOC Telemed At A Glance
3
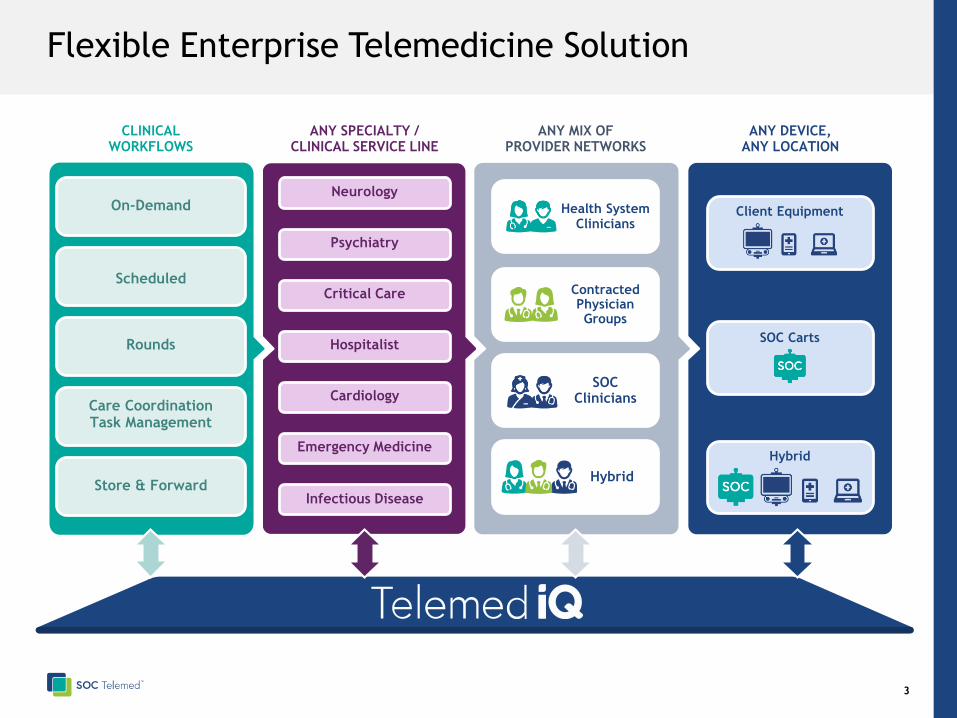
Flexible Enterprise Telemedicine Solution
ANY SPECIALTY /CLINICAL SERVICE LINE
CLINICALWORKFLOWS
ANY MIX OF PROVIDER NETWORKS
ANY DEVICE, ANY LOCATION
Neurology
Psychiatry
Critical Care
Hospitalist
Cardiology
Emergency Medicine
Infectious Disease
SOC Carts
Client Equipment
Hybrid
Health SystemClinicians
Hybrid
SOC Clinicians
Contracted Physician Groups
On-Demand
Scheduled
Rounds
Care Coordination Task Management
Store & Forward
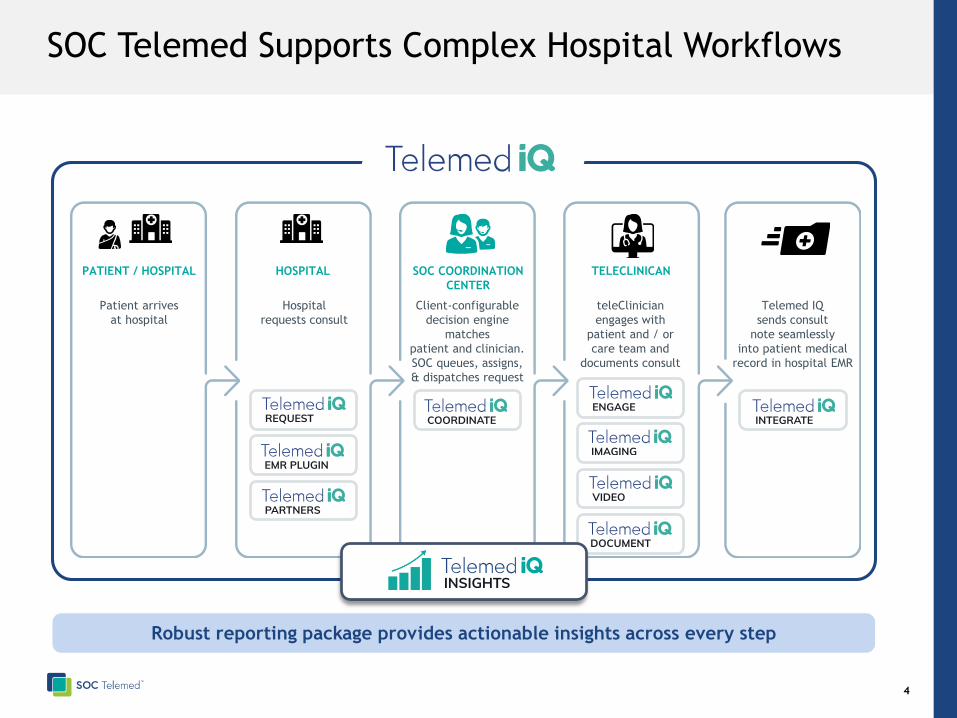
PATIENT / HOSPITAL HOSPITAL SOC COORDINATION
CENTER
TELECLINICAN
Patient arrives
at hospital
Hospital
requests consult
Client-configurable
decision engine
matches
patient and clinician.
SOC queues, assigns,
& dispatches request
teleClinician
engages with
patient and / or
care team and
documents consult
Telemed IQ
sends consult
note seamlessly
into patient medical
record in hospital EMR
Robust reporting package provides actionable insights across every step
4
SOC Telemed Supports Complex Hospital Workflows
5
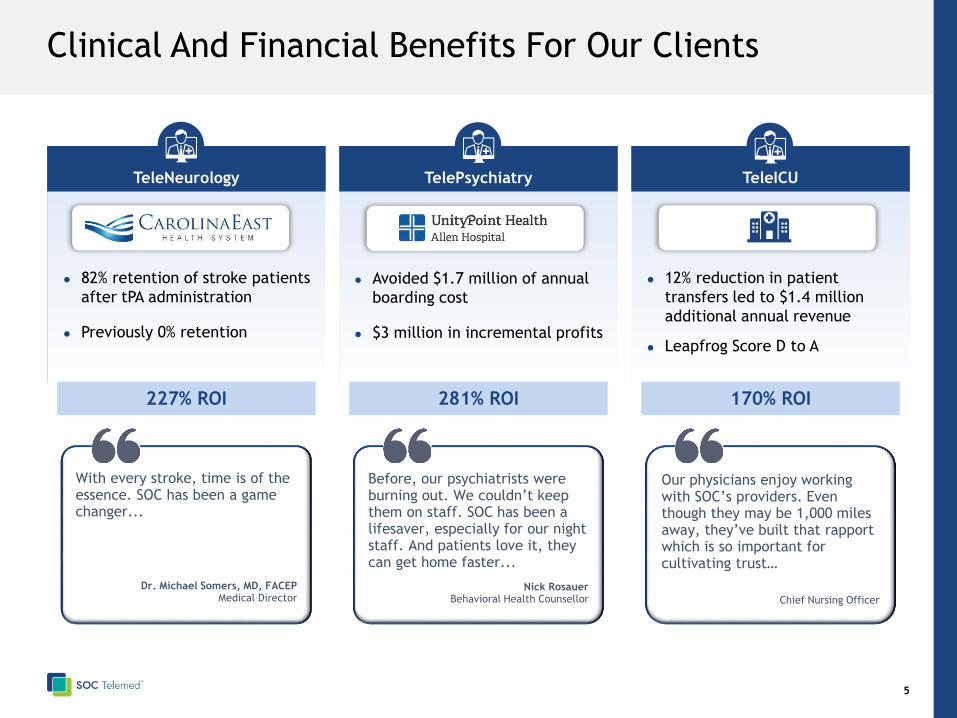
TeleNeurology TelePsychiatry TeleICU
12% reduction in patient
transfers led to $1.4 million
additional annual revenue
Leapfrog Score D to A
Avoided $1.7 million of annual
boarding cost
$3 million in incremental profits
82% retention of stroke patients
after tPA administration
Previously 0% retention
Our physicians enjoy working with SOC’s providers. Even though they may be 1,000 miles away, they’ve built that rapport which is so important for cultivating trust…
Chief Nursing Officer
Before, our psychiatrists were burning out. We couldn’t keep them on staff. SOC has been a lifesaver, especially for our night staff. And patients love it, they can get home faster...
Nick RosauerBehavioral Health Counsellor
With every stroke, time is of the essence. SOC has been a game changer...
Dr. Michael Somers, MD, FACEPMedical Director
227% ROI 281% ROI 170% ROI
Clinical And Financial Benefits For Our Clients

Market Overview &
Growth Strategy
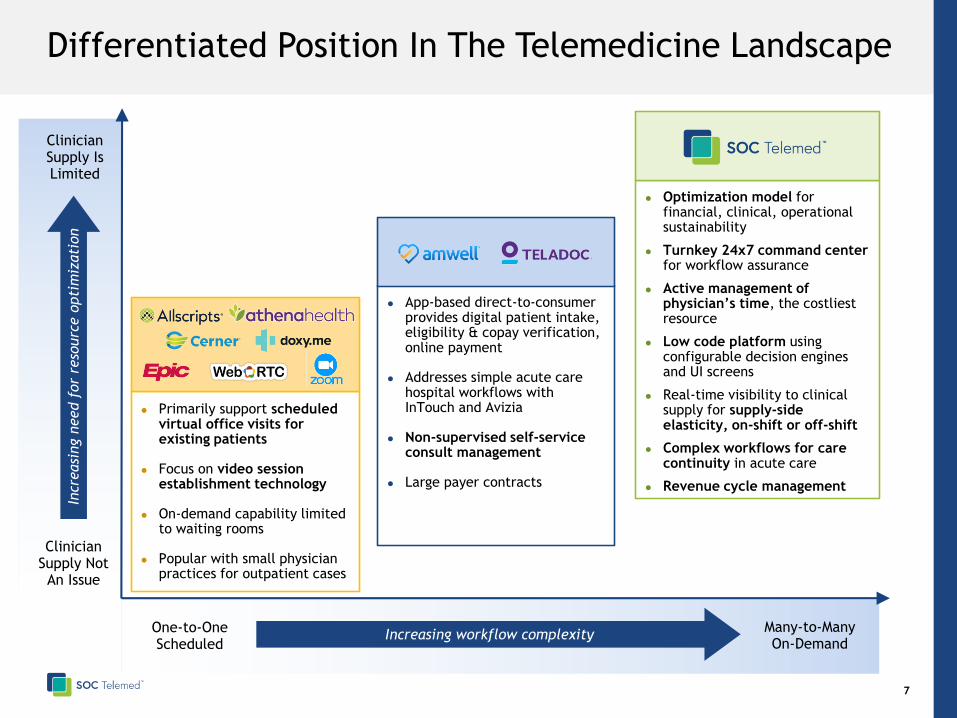
Optimization model for financial, clinical, operational sustainability
Turnkey 24x7 command center for workflow assurance
Active management of physician’s time, the costliest resource
Low code platform using configurable decision engines and UI screens
Real-time visibility to clinical supply for supply-side elasticity, on-shift or off-shift
Complex workflows for care continuity in acute care
Revenue cycle management
7
Differentiated Position In The Telemedicine Landscape
Clinician Supply Is Limited
Clinician Supply Not An Issue
Incr
easi
ng n
eed f
or
reso
urc
e o
pti
miz
ati
on
One-to-OneScheduled
Many-to-ManyOn-Demand
Increasing workflow complexity
App-based direct-to-consumer provides digital patient intake, eligibility & copay verification, online payment
Addresses simple acute care hospital workflows with InTouch and Avizia
Non-supervised self-service consult management
Large payer contracts
Primarily support scheduled virtual office visits for existing patients
Focus on video session establishment technology
On-demand capability limited to waiting rooms
Popular with small physician practices for outpatient cases
8
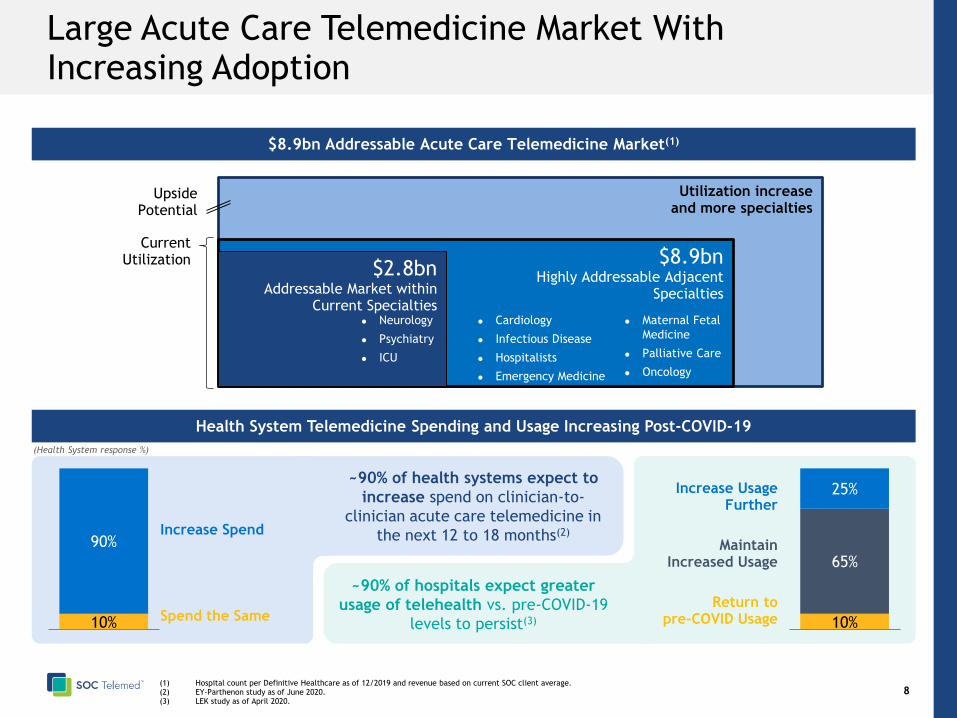
Large Acute Care Telemedicine Market With Increasing Adoption
(1) Hospital count per Definitive Healthcare as of 12/2019 and revenue based on current SOC client average. (2) EY-Parthenon study as of June 2020.(3) LEK study as of April 2020.
UpsidePotential
Current Utilization
Utilization increase and more specialties
$8.9bn Highly Addressable Adjacent
Specialties
$2.8bn Addressable Market within
Current Specialties
Increase Usage Further
$8.9bn Addressable Acute Care Telemedicine Market(1)
Cardiology
Infectious Disease
Hospitalists
Emergency Medicine
Maternal Fetal
Medicine
Palliative Care
Oncology
(Health System response %)
Health System Telemedicine Spending and Usage Increasing Post-COVID-19
10%
65%
25%
10%
90%
Return to pre-COVID UsageSpend the Same
Maintain Increased Usage
Increase Spend
~90% of hospitals expect greater
usage of telehealth vs. pre-COVID-19
levels to persist(3)
~90% of health systems expect to
increase spend on clinician-to-
clinician acute care telemedicine in
the next 12 to 18 months(2)
Neurology
Psychiatry
ICU
9
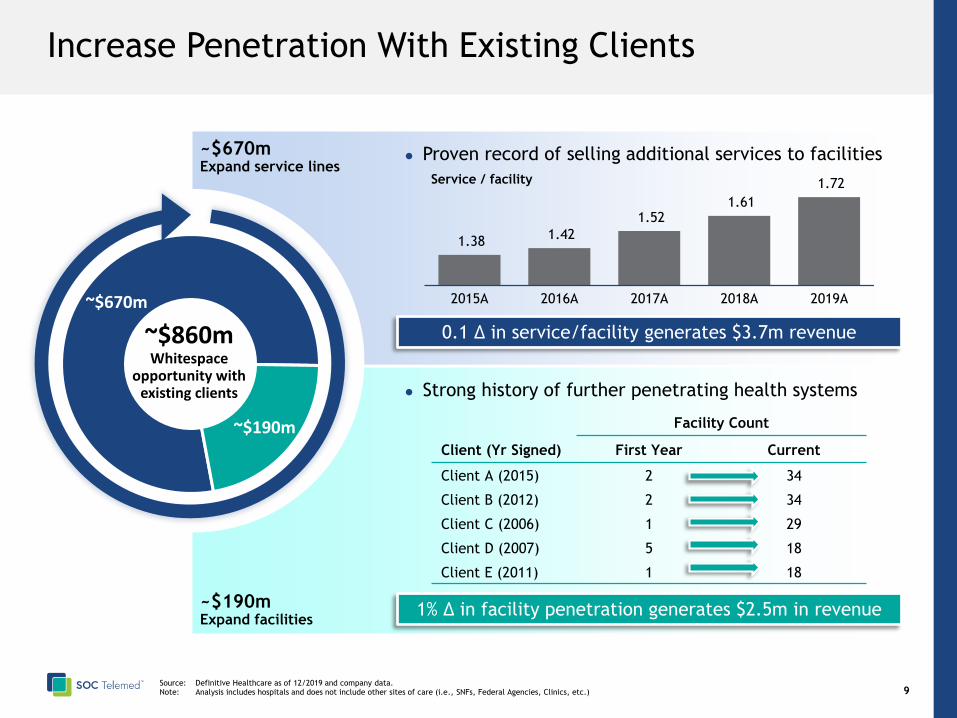
Increase Penetration With Existing Clients
Strong history of further penetrating health systems
Facility Count
Client (Yr Signed) First Year Current
Client A (2015) 2 34
Client B (2012) 2 34
Client C (2006) 1 29
Client D (2007) 5 18
Client E (2011) 1 18
Proven record of selling additional services to facilities
1.38 1.42
1.52 1.61
1.72
2015A 2016A 2017A 2018A 2019A
Service / facility
0.1 Δ in service/facility generates $3.7m revenue
1% Δ in facility penetration generates $2.5m in revenue
~$670m
~$190m
~$860mWhitespace
opportunity withexisting clients
~$670mExpand service lines
~$190mExpand facilities
Source: Definitive Healthcare as of 12/2019 and company data.Note: Analysis includes hospitals and does not include other sites of care (i.e., SNFs, Federal Agencies, Clinics, etc.)
10
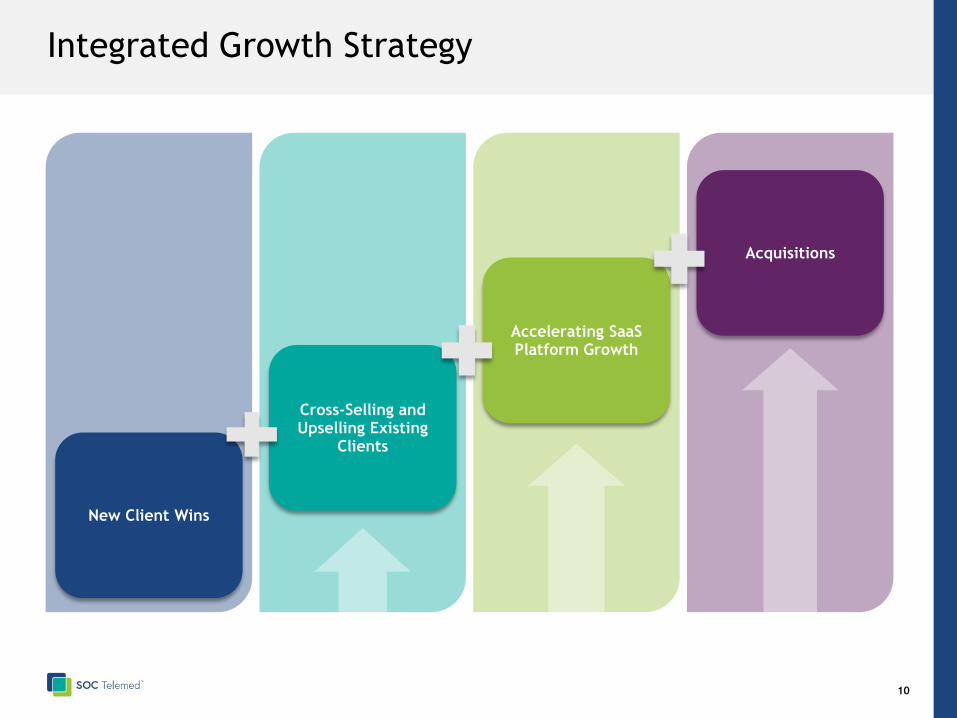
Integrated Growth Strategy
Accelerating SaaS Platform Growth
Acquisitions
New Client Wins
Cross-Selling and Upselling Existing
Clients

Financial Overview
12
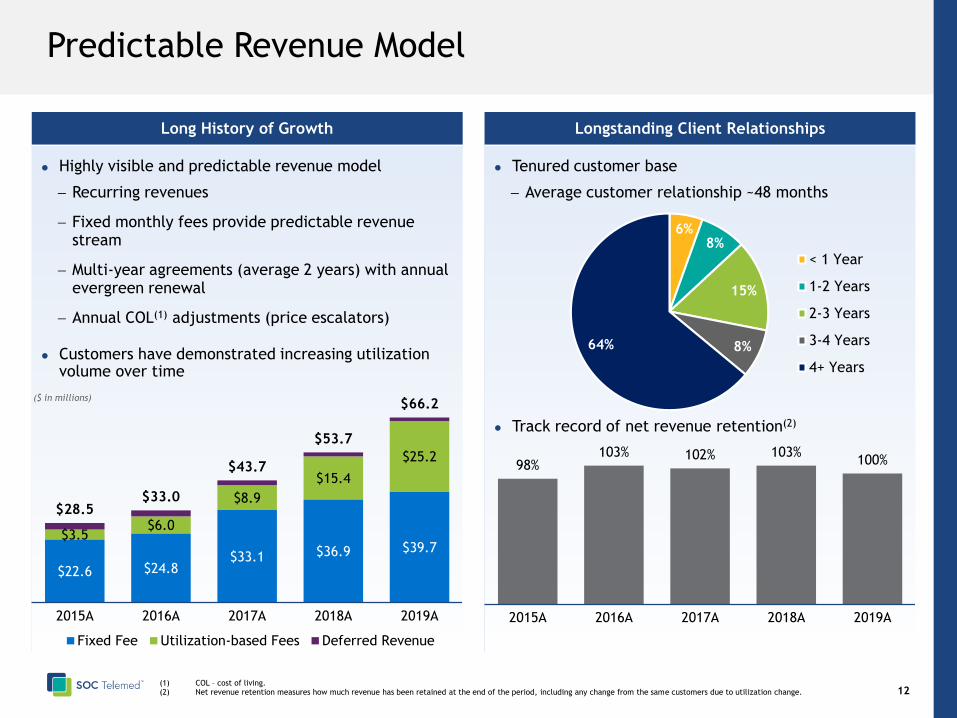
Predictable Revenue Model
Long History of Growth
Highly visible and predictable revenue model
− Recurring revenues
− Fixed monthly fees provide predictable revenue stream
− Multi-year agreements (average 2 years) with annual evergreen renewal
− Annual COL(1) adjustments (price escalators)
Customers have demonstrated increasing utilization volume over time
(1) COL – cost of living. (2) Net revenue retention measures how much revenue has been retained at the end of the period, including any change from the same customers due to utilization change.
$22.6 $24.8$33.1 $36.9 $39.7
$3.5$6.0
$8.9
$15.4
$25.2
$28.5$33.0
$43.7
$53.7
$66.2
2015A 2016A 2017A 2018A 2019A
Fixed Fee Utilization-based Fees Deferred Revenue
($ in millions)
Longstanding Client Relationships
Tenured customer base
− Average customer relationship ~48 months
Track record of net revenue retention(2)
6%8%
15%
8%64%
< 1 Year
1-2 Years
2-3 Years
3-4 Years
4+ Years
98%103% 102% 103%
100%
2015A 2016A 2017A 2018A 2019A
13
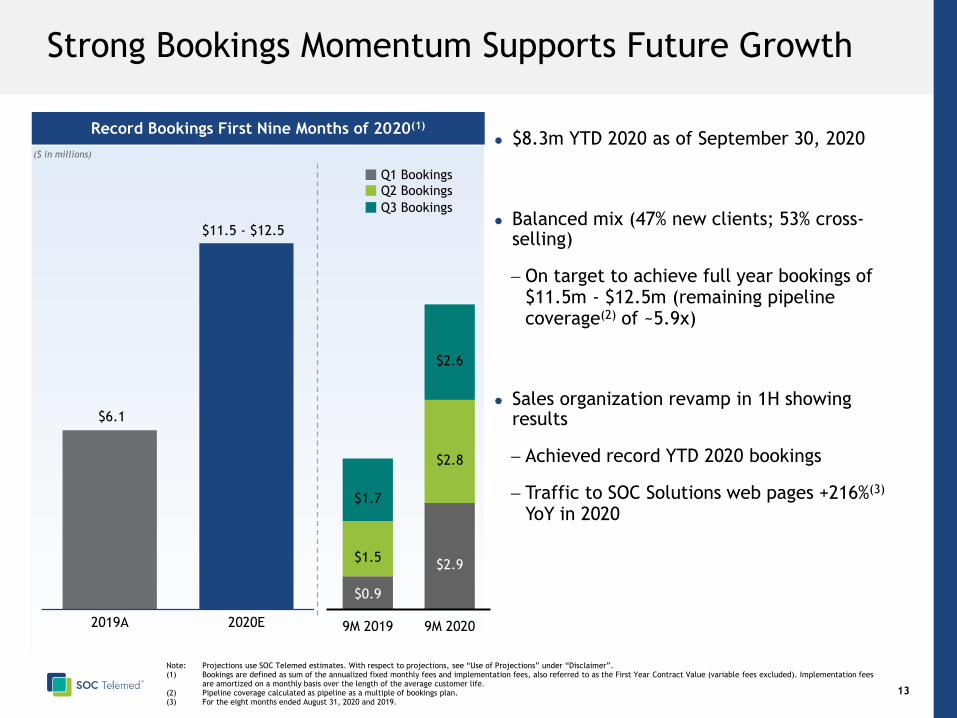
Strong Bookings Momentum Supports Future Growth
Record Bookings First Nine Months of 2020(1)
$8.3m YTD 2020 as of September 30, 2020
Balanced mix (47% new clients; 53% cross-selling)
− On target to achieve full year bookings of $11.5m - $12.5m (remaining pipeline coverage(2) of ~5.9x)
Sales organization revamp in 1H showing results
− Achieved record YTD 2020 bookings
− Traffic to SOC Solutions web pages +216%(3)
YoY in 2020
($ in millions)
$6.1
2019A 2020E
Q1 Bookings
Q2 Bookings
$11.5 - $12.5
Note: Projections use SOC Telemed estimates. With respect to projections, see “Use of Projections” under “Disclaimer”.(1) Bookings are defined as sum of the annualized fixed monthly fees and implementation fees, also referred to as the First Year Contract Value (variable fees excluded). Implementation fees
are amortized on a monthly basis over the length of the average customer life.(2) Pipeline coverage calculated as pipeline as a multiple of bookings plan.(3) For the eight months ended August 31, 2020 and 2019.
Q3 Bookings
$0.9
$2.9 $1.5
$2.8
$1.7
$2.6
9M 2019 9M 2020
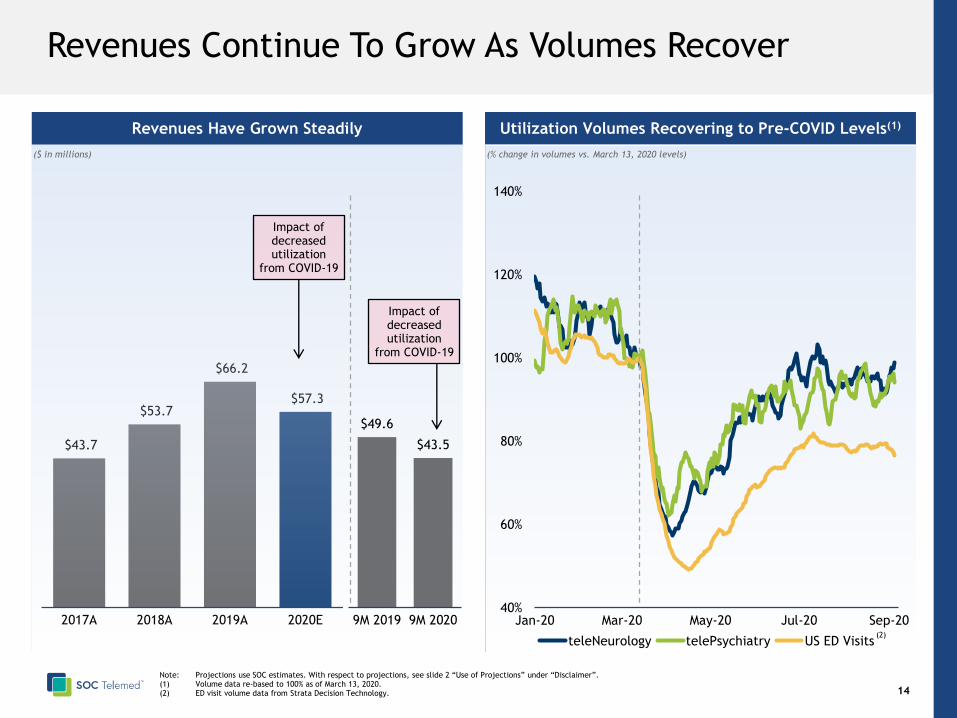
$43.7
$53.7
$66.2
$57.3
2017A 2018A 2019A 2020E
Utilization Volumes Recovering to Pre-COVID Levels(1)
14
Revenues Continue To Grow As Volumes Recover
Revenues Have Grown Steadily
($ in millions)
40%
60%
80%
100%
120%
140%
Jan-20 Mar-20 May-20 Jul-20 Sep-20
teleNeurology telePsychiatry US ED Visits
(% change in volumes vs. March 13, 2020 levels)
Note: Projections use SOC estimates. With respect to projections, see slide 2 “Use of Projections” under “Disclaimer”.(1) Volume data re-based to 100% as of March 13, 2020.(2) ED visit volume data from Strata Decision Technology.
(2)
$49.6
$43.5
9M 2019 9M 2020
Impact of decreased utilization
from COVID-19
Impact of decreased utilization
from COVID-19
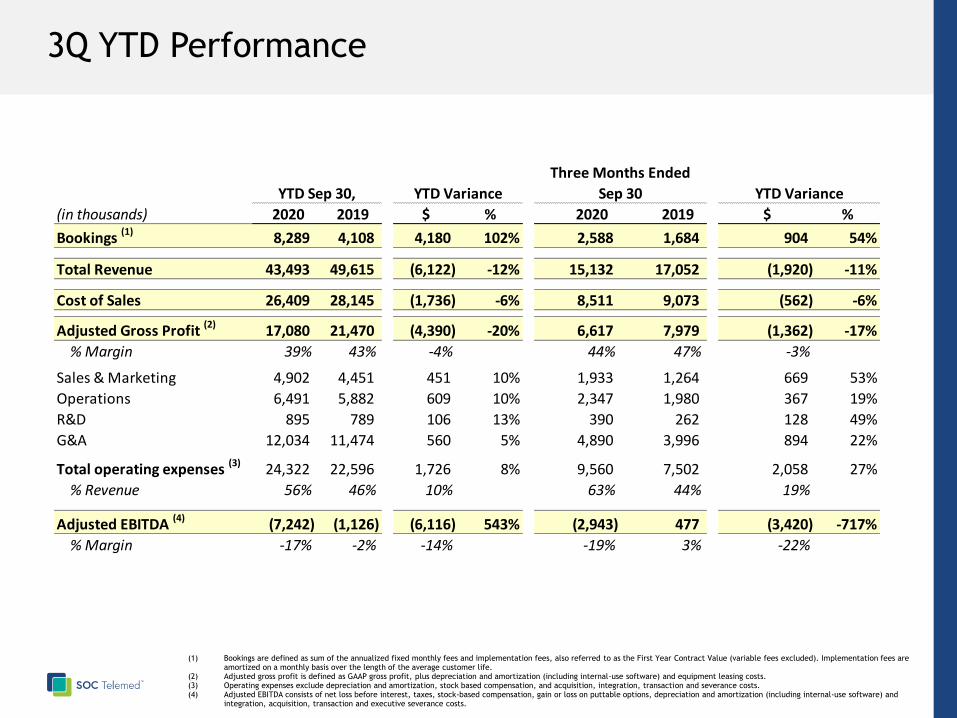
3Q YTD Performance
(1) Bookings are defined as sum of the annualized fixed monthly fees and implementation fees, also referred to as the First Year Contract Value (variable fees excluded). Implementation fees are amortized on a monthly basis over the length of the average customer life.
(2) Adjusted gross profit is defined as GAAP gross profit, plus depreciation and amortization (including internal-use software) and equipment leasing costs.(3) Operating expenses exclude depreciation and amortization, stock based compensation, and acquisition, integration, transaction and severance costs. (4) Adjusted EBITDA consists of net loss before interest, taxes, stock-based compensation, gain or loss on puttable options, depreciation and amortization (including internal-use software) and
integration, acquisition, transaction and executive severance costs.
YTD Sep 30, YTD Variance YTD Variance
(in thousands) 2020 2019 $ % 2020 2019 $ %
Bookings (1) 8,289 4,108 4,180 102% 2,588 1,684 904 54%
Total Revenue 43,493 49,615 (6,122) -12% 15,132 17,052 (1,920) -11%
Cost of Sales 26,409 28,145 (1,736) -6% 8,511 9,073 (562) -6%
Adjusted Gross Profit (2) 17,080 21,470 (4,390) -20% 6,617 7,979 (1,362) -17%
% Margin 39% 43% -4% 44% 47% -3%
Sales & Marketing 4,902 4,451 451 10% 1,933 1,264 669 53%
Operations 6,491 5,882 609 10% 2,347 1,980 367 19%
R&D 895 789 106 13% 390 262 128 49%
G&A 12,034 11,474 560 5% 4,890 3,996 894 22%
Total operating expenses (3) 24,322 22,596 1,726 8% 9,560 7,502 2,058 27%
% Revenue 56% 46% 10% 63% 44% 19%
Adjusted EBITDA (4) (7,242) (1,126) (6,116) 543% (2,943) 477 (3,420) -717%
% Margin -17% -2% -14% -19% 3% -22%
Three Months Ended
Sep 30
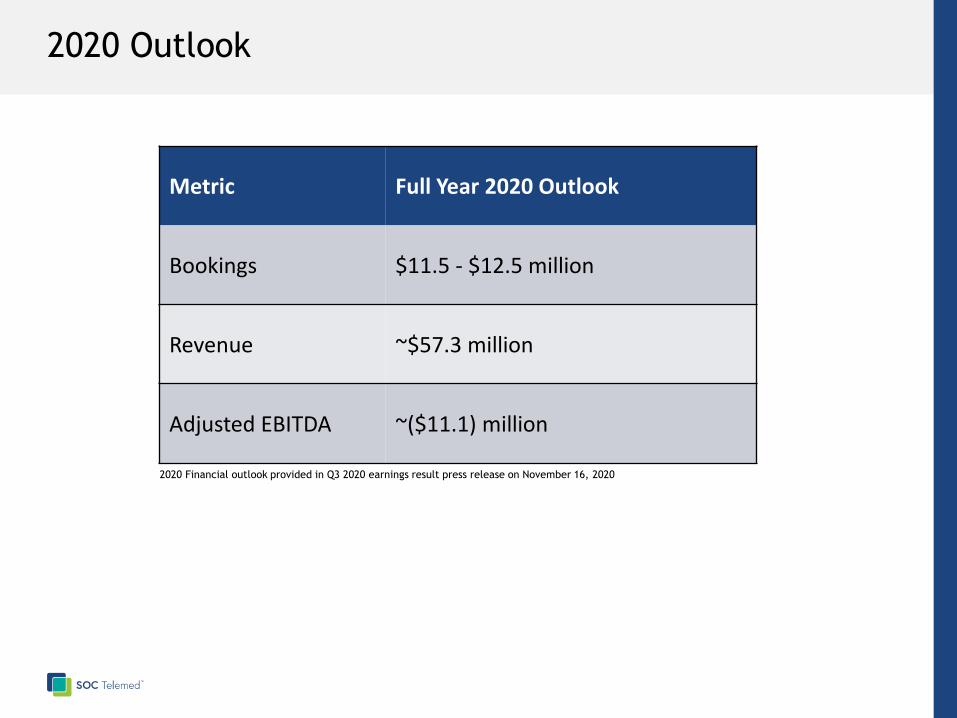
2020 Outlook
Metric Full Year 2020 Outlook
Bookings $11.5 - $12.5 million
Revenue ~$57.3 million
Adjusted EBITDA ~($11.1) million
2020 Financial outlook provided in Q3 2020 earnings result press release on November 16, 2020
17
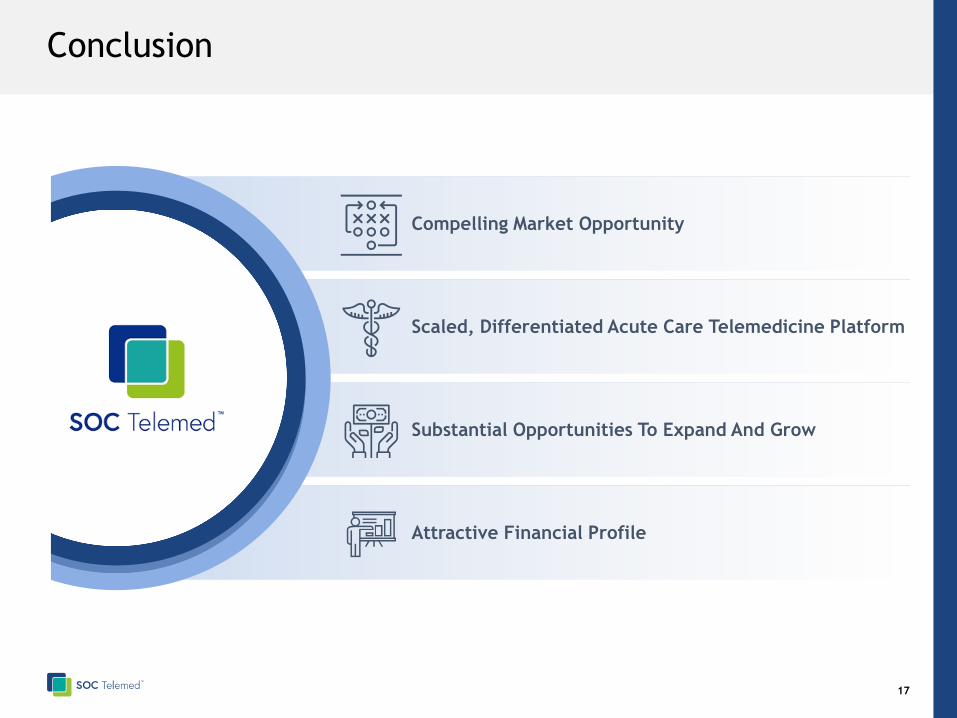
Conclusion
Compelling Market Opportunity
Scaled, Differentiated Acute Care Telemedicine Platform
Substantial Opportunities To Expand And Grow
Attractive Financial Profile

Appendix
19
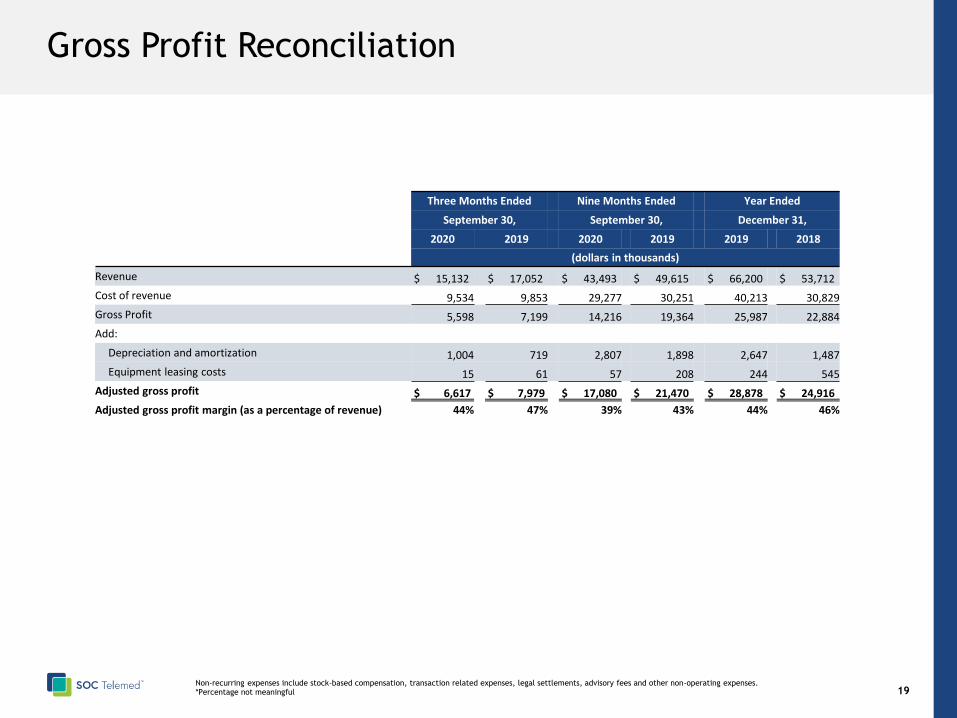
Gross Profit Reconciliation
(1) Non-recurring expenses include stock-based compensation, transaction related expenses, legal settlements, advisory fees and other non-operating expenses.(2) *Percentage not meaningful
Three Months Ended Nine Months Ended Year Ended
September 30, September 30, December 31,
2020 2019 2020 2019 2019 2018
(dollars in thousands)
Revenue $ 15,132 $ 17,052 $ 43,493 $ 49,615 $ 66,200 $ 53,712
Cost of revenue 9,534 9,853 29,277 30,251 40,213 30,829
Gross Profit 5,598 7,199 14,216 19,364 25,987 22,884
Add:
Depreciation and amortization 1,004 719 2,807 1,898 2,647 1,487
Equipment leasing costs 15 61 57 208 244 545
Adjusted gross profit $ 6,617 $ 7,979 $ 17,080 $ 21,470 $ 28,878 $ 24,916
Adjusted gross profit margin (as a percentage of revenue) 44% 47% 39% 43% 44% 46%
20
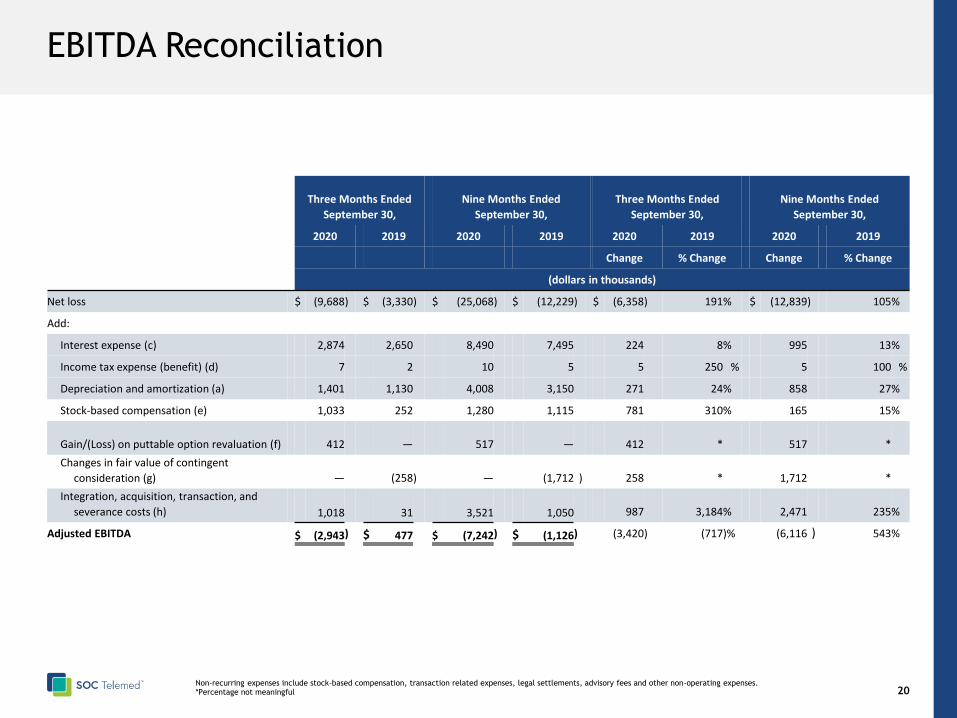
EBITDA Reconciliation
(1) Non-recurring expenses include stock-based compensation, transaction related expenses, legal settlements, advisory fees and other non-operating expenses.(2) *Percentage not meaningful
Three Months Ended
September 30,
Nine Months Ended
September 30,
Three Months Ended
September 30,
Nine Months Ended
September 30,
2020 2019 2020 2019 2020 2019 2020 2019
Change % Change Change % Change
(dollars in thousands)
Net loss $ (9,688) $ (3,330) $ (25,068) $ (12,229) $ (6,358) 191% $ (12,839) 105%
Add:
Interest expense (c) 2,874 2,650 8,490 7,495 224 8% 995 13%
Income tax expense (benefit) (d) 7 2 10 5 5 250 % 5 100 %
Depreciation and amortization (a) 1,401 1,130 4,008 3,150 271 24% 858 27%
Stock-based compensation (e) 1,033 252 1,280 1,115 781 310% 165 15%
Gain/(Loss) on puttable option revaluation (f) 412 — 517 — 412 * 517 *
Changes in fair value of contingent
consideration (g) — (258) — (1,712 ) 258 * 1,712 *
Integration, acquisition, transaction, and
severance costs (h) 1,018 31 3,521 1,050 987 3,184% 2,471 235%
Adjusted EBITDA $ (2,943) $ 477 $ (7,242) $ (1,126) (3,420) (717)% (6,116 ) 543%


