28
Social Media, Marketing and Business Intelligence Stratebi. Open Business Intelligence

Social Media, Marketing and Business Intelligence
Stratebi. Open Business Intelligence

2 Social Media Data
TABLE OF CONTENTS
Social Media Data ........................................................................................................................................... 3
The Benefits Of Analyzing Social Media Data ................................................................. 3
Marketing Campaigns Analysis ................................................................................................... 4
Marketing Campaign Analysis Case Study ........................................................................ 4
Improving Your Enterprise Marketing Management .................................................. 5
How And What To Analyze ...................................................................................................................... 6
Social Media KPIs .................................................................................................................................. 6
ETL Processes For Social Data ............................................................................................................ 12
How To Extract Data ........................................................................................................................ 12
Facebook API .......................................................................................................................................... 12
Social Media Dashboards - Examples ........................................................................................... 14
Sentiment Analysis of Twitter Data ................................................................................................ 17
Case Study ............................................................................................................................................... 17
K-means Algorithm ............................................................................................................................ 20
User Classifier Tree............................................................................................................................ 22
J48 Tree ...................................................................................................................................................... 23
Linear Regression Algorithm ...................................................................................................... 25
Algorithm Comparison Results ................................................................................................. 26
Conclusions .............................................................................................................................................. 28

3 Social Media Data
SOCIAL MEDIA DATA
Nowadays thanks to technology, corporations are overwhelmed by large data
volumes representing business processes and its environment. By virtue of
powerful BI tools such as Pentaho Business Analytics, we will be able to transform
raw data into information, and information into knowledge. It is not enough to own
data and indicators stored in a database, but also we need to know how to take
advantage of them in order to improve decision making process and being more
competitive.
The increasing use of technology and the appearance of Web 2.0 and Social
Networks has changed the way users
surf on the internet. Rather than being
merely an audience, users increasingly
interact with each other. Currently, they
tend to share personal content: reviews,
photos, videos... and as a consequence
every day a very large volume of data
that is not being analyzed now. If we
collect and process social media data we
could be able to build business indicators
which could help in increasing an
organization’s profits. Today there are millions of blogs dealing
with different themes, a wide variety of
social networks, mass media. Maybe Facebook and Twitter are the most well known
but there are many more: Flicker, LinkedIn, MySpace, Google+, Xing ... and all are
sources of valuable information.
THE BENEFITS OF ANALYZING SOCIAL MEDIA DATA
Analyzing Social Media data gathered together from the sources previously
commented any corporation can achieve short-term profits:
Marketing Optimization. Today’s tools are not valid to know in which population
sectors focus our campaigns; however with social media techniques these
capabilities will be acquired.
For example, after publishing a photo of a new product we could count the number
of likes and get valuable information about the users you have attracted
with a promotion, this information will be very useful for oriented
advertising campaigns.
Capture ideas and dissatisfied clients. We will identify client’s needs
and wishes about our products, thanks to this fact we will discover the deficiencies
of our articles and services.
Situational awareness. Using social media data lets us control market trends and
understanding the causes of complaints, armed with these knowledge
executive stakeholders will take every action possible to protect their
brands.
Analyzing comments on Facebook or Twitter we can gain new ideas and discover
the issues that clients have experienced. Furthermore, by means of this
process we will be able to detect future trends and we could be distinctive in
our market.

4 Social Media Data
Sentiment analysis. “What does the world think about us?” or “What does the
world think about our new product?” are only two examples of questions that have
no answer without analyzing social media data. Picking Twitter as example, if a
marketing promotion spreads around the world, several thousands of tweets should
be processed by Text Mining techniques. These methods allow us to extract
sentiments from tweet entities useful to comprehend the opinions of our
organizations and acquiring knowledge.
These days, most entertainment companies monitor the opinions about its
TV series, saving a lot of money removing from the schedule the ones not
financially feasible.
MARKETING CAMPAIGNS ANALYSIS
Every company today has a tool for managing customer
relationships (customer relationship management, CRM)
with a CRM tool you can find, attract, gain and maintain
customers using powerful marketing plans. These tasks
shall be accomplished through marketing strategies
using a wide variety of advertising channels: email
marketing, search engine marketing, affiliate marketing,
display advertising, social networking, social media, and
many others.
From Stratebi, we will help you take maximum
advantage of these channels with a common goal:
optimizing your advertising campaigns to achieve a
higher return on investment.
MARKETING CAMPAIGN ANALYSIS CASE STUDY
Suppose we need to promote an event with all its information contained in a
website, our strategy will be advertising the meeting looking for getting more
knowledge about the event. Three channels will be used for this task and website’s
URL is the link between them:
Mail Marketing: An email will be sent to every person in our CRM. At an
early stage this action will not be directed to a specific sort of contact and
only general information will be included in the message.
Twitter: A set of informational tweets will be published mentioning the
event’s URL.
Facebook: A collection of comments about the event will be published in the
company account timeline.
After carrying out the advertising campaign on the different channels, we will
collect all data extracted from the different sources with the purpose of examining
promotion results. Later with the knowledge acquired in the first stage of the
campaign new enhanced promotions can be taken:
Mail Marketing: statistics regarding email Opens, Clicks, Soft & Hard
Bounces, Unsubscribes and Forwards are obtained.

5 Social Media Data
Twitter: statistics regarding retweets, followers, favorites, sentiment of a
reply (i.e. :-) good feeling, :-( bad feeling) … are collected through this case
of study.
Facebook: Statistics such as likes, comments, and shares of each advertising
post, as well as how much negative feedback each post has received can be
seen.
Putting all available data together the campaign will allow us to analyze the results
in-depth. Besides, the analysis of this information in a unique tool is made possible.
Traditionally the results were analyzed separately for each channel.
IMPROVING YOUR ENTERPRISE MARKETING MANAGEMENT
As seen in the previous example, any company joining data from different
advertising channels (Mail Marketing, digital media and social networks) will
achieve the ability to modify an in process campaign without waiting for final
results.
These days, enterprises launch ad campaigns by means of their marketing
department. These corporative departments follow a work schedule and no
feedback is returned from the promotions until the end of them. For example, if we
launch a promotion for a training boot camp and its registration period extends
during one month; marketing executives will only have visibility of the results at
the end of the period.
From Stratebi, we intend to provide valuable analytics tools to these departments in
order to guarantee a daily evolution monitoring; using this Business Intelligence
systems, campaign managers could make decisions fed by real-time data. This
improvement in the efficiency of the advertising process will impact increasing sales
volume. For example, if during the first week the highest percentage of sales was
produced by people between 20 and 27 years maybe focusing the campaign in
youth sector could be an exceptional idea to boost sales. Furthermore, if you are
provided with real-time information you will get an advantage over your market
competitors.

6 How And What To Analyze
HOW AND WHAT TO ANALYZE
How can I set up KPIs (key performance indicators) for social media data? So, in
terms of analytics we could track the following:
Traffic data: How many visitors did social media drive to your site? Fans and follower data: How many people are in your networks and how
are they developing?
Social content performance: How is the content that you produce
performing on social sites?
Social Interaction data: How are people interacting and sharing your
content on the networks?
Nowadays, there are many online tools to measure your presence on social
networks; however they are limited since some of them don’t include custom KPIs
and others are hosted in cloud servers not optimized for massive analysis.
For these reasons, Stratebi offers its wide experience in the Open Source Business
Intelligence field (Pentaho Suite tool) and encourages you to contact us to create a
project which collects all data available, in this case social media data and take the
best of the information by designing custom KPIs and creating dashboards, reports
and analysis views. Building tailor-made solutions we will be able to analyze the
data from client’s perspective preventing users from others tools restrictions.
Image: Social media data analysis process
SOCIAL MEDIA KPIS
Performance indicators (KPIs) help an organization define and measure progress
toward organizational goals. Nowadays there are many social networks but in this
document we are focusing on KPIs of the most important: Facebook and Twitter.
Facebook.
Facebook is the world’s largest social network, with over 850 million monthly active
users. This social network is valuable as a source of information if used properly.
As everybody knows Facebook contains the following elements to be analyzed:

7 How And What To Analyze
Resources. Photos, videos, statuses, questions, links... are the entities
users will interact with. These resources have common informations: likes,
comments and shares.
People. Facebook collects two types of information: personal details
provided by a user and usage data collected automatically as the user
spends time on the Web site clicking around. Regarding personal
information, the user willfully discloses it, such as name, email address,
telephone number, address, gender and religious views for example.
Facebook now has fine-grained privacy settings for its users. Users can
decide which part of their information should be visible and to whom,
however, by default all the information available in a user profile is public
and as a consequence when studying a campaign with a large sample size
the results produced will be accurate.
Image: Photo.

8 How And What To Analyze
Image: User profile. Mark Zuckerberg Facebook’s founder
Image: Basic Info

9 How And What To Analyze
Image: Favorites page.
Therefore, taking into account the previous facebook resources, the first step is to
define KPIs and measure against them. There are several indicators to track:
Number of shares
Resources with higher interaction rates
Number of likes
Number of comments
Geolocation
Twitter.
Twitter is an online social networking and microblogging service that enables users
to publish and read text-based messages up to 140 characters, known as “tweets”.
Over 350 millions tweets are generated daily and a not inconsiderable number of
them are related to your business or industry, don’t underestimate this knowledge.
Twitter contains the following items to be analyzed:
“Tweets”. A tweet is a post or status update on this social network; they are
little pieces of information containing news, conversations, opinions...
People. Twitter’s users are content creators since they are responsible for
posting messages. Besides, each user has a profile including name, location,
website, biography and this helpful information will be very interesting to be
analysed.

10 How And What To Analyze
Hashtag. The # symbol, called a hashtag, is used to mark keywords or
topics in a Tweet. It was created organically by Twitter users as a way to
categorize messages. This mark will increase efficiency when searching for
opinions.
Image: Twitter user profile page.
Image: Information contained on an individual tweet

11 How And What To Analyze
Image: Twitter search on the hashtag #pentaho
Even though we don’t have much information a priori, nevertheless with the right
twitter KPIs and metrics, you can effectively monitor campaigns to ensure you get
the best financial outcomes:
Number of retweets
Number of favorites
Number of mentions
Total number of followers
Number of replies
Ratio following vs followers
Number of lists I belong to
12 ETL Processes For Social Data
ETL PROCESSES FOR SOCIAL DATA
ETL is the process of extracting data, mostly from different types of systems,
transforming it into a structure that’s more appropriate for reporting and analysis
and finally loading it into the datawarehouse.
On a Social Data analysis large amounts of data will be assessed, i.e. for a simple
facebook post which includes date, location, text content... the amount of likes,
shares and all the reply comments about it must be taken into account. Besides,
each individual interaction includes a facebook user with its corresponding profile,
owing to these vasts amounts of data the creation of a Business Intelligence project
appears necessary to support better business decision-making.
HOW TO EXTRACT DATA
Most popular social networks include resources to extract information from them.
The main tool is the API (Application Programming Interface) which allows a
technical user to retrieve data in multiple formats (XML, JSON).
FACEBOOK API
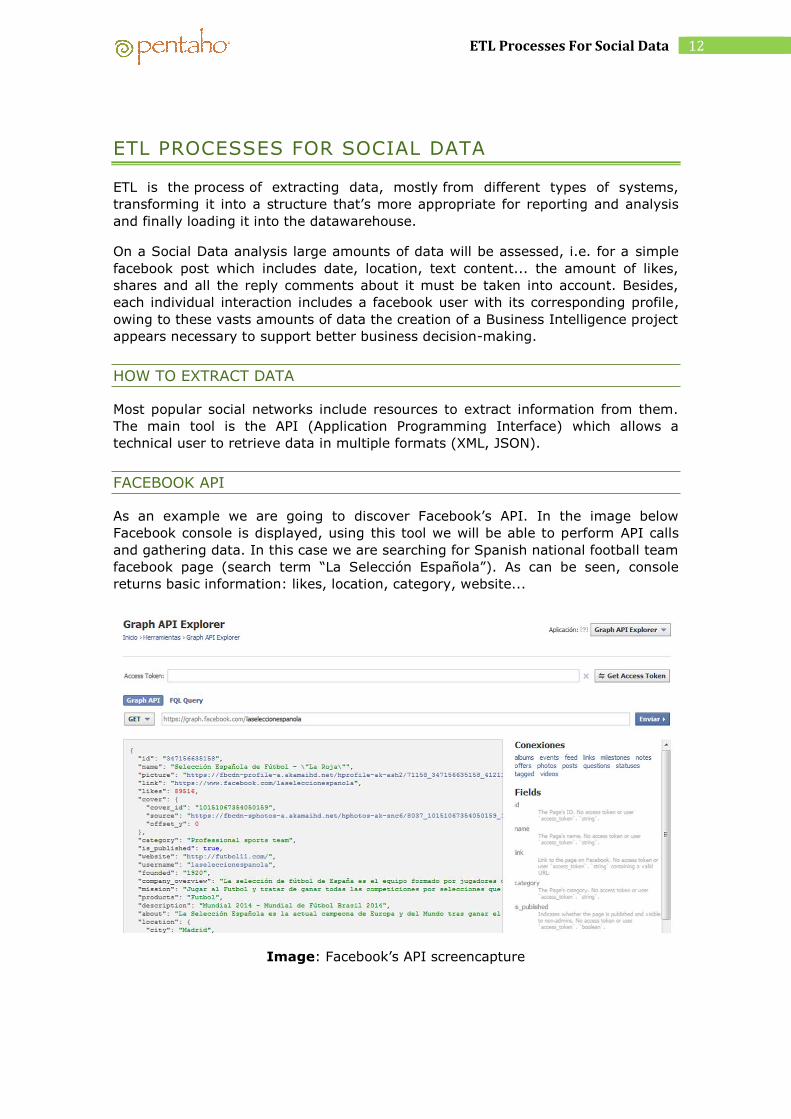
As an example we are going to discover Facebook’s API. In the image below
Facebook console is displayed, using this tool we will be able to perform API calls
and gathering data. In this case we are searching for Spanish national football team
facebook page (search term “La Selección Española”). As can be seen, console
returns basic information: likes, location, category, website...
Image: Facebook’s API screencapture

13 ETL Processes For Social Data
Suppose we want to get the information associated with links published in this
Facebook page since it looks like important for us to find out how is fans response
about its content. In this phase we will be helped by Pentaho Data Integration to
extract data. Below is showed the image of the extraction and filtering information
process. In a first stage a JSON entity is read and in the end we return filtered
results.
Image: Fanpage’s links extraction stages
The following screencapture shows the results obtained, as can be observed the
information retrieved (likes, comments, creation date, URL) corresponds to last 10
TimeLine publications from “La Selección Española de Fútbol” page and particularly
link type posts.
Image: ETL results
Finally, as could be appreciated from the previous example it is quite easy to
extract information from Facebook with the support of Pentaho Data Integration.
The main steps in obtaining information from Facebook’s API is to have very clear
the data we are looking for and of course understanding API tricks.
14 Social Media Dashboards - Examples
SOCIAL MEDIA DASHBOARDS - EXAMPLES
Below a set of examples created with Pentaho suite are exposed. Dashboards have
been designed by STDashboard component a proprietary development of Stratebi.
Image: Pentaho login screenshot
Imagen: Pentaho user console screenshot

15 Social Media Dashboards - Examples
Next image shows basic twitter data throughout time; this is a global analysis and
shows evolution of retweets, mentions, favourites... over time.
Image: Twitter account evolution analysis dashboard
The following dashboard analyzes tweets published by an individual account.
Retweets and replies are represented in a time zone distribution (AM/PM); in
addition to these charts a table summary containing individual tweet stats
(comments, mentions and retweets) is displayed. Moreover a barchart with
weekday as category and retweets, mentions and comments as series is included.
Image: Tweets analysis dashboard

16 Social Media Dashboards - Examples
The image below shows the evolution over time of the new members grouped by
sex of a facebook fan page. Besides, a world map with values displayed as a color
scale is included. This geographical chart allows drilldown on a certain country to
reveal more detailed information.
Image: Facebook’s fanpage evolution dashboard
Lastly, a global summary of fans in a Facebook page is showed. Location, Sex,
Relationship status, Education and Age stats are analysed in this dashboard.
Image: Facebook’s fanpage analysis dashboard

17 Sentiment Analysis of Twitter Data
SENTIMENT ANALYSIS OF TWITTER DATA
Sentiment Analysis, considered one of the most efficient ways to measure social
media’s impact helps us to understand our brand impact across social networks.
The following case study examines Twitter search engine using the terms “Pentaho”
and “Firefox”, however the same methodology can be applied to any other brand or product name.
The technique applied is known as Sentiment Analysis (also known as Opinion
Mining, Sentiment Classification or Affective Computing) consists of extracting and
classifying subjective information (opinions, ideas...) in source materials (tweets in
our case). This procedure uses natural language processing principles since it is the
language spoken by people and as a consequence problems arising from ambiguity
appear. The challenge of discovering real features of a given search term is the keystone of this tool.
The information monitored by this tool will be beneficial for the marketing
department of a company. This procedure could be carried out to analyze
commercial brands (i.e. Coca-Cola, Oracle, Ford...), movie premieres and video
games releases. Aditionally, this technique can be adopted to analyze the tweets for positive or negative sentiment around election candidates.
CASE STUDY
In this case study we start searching on twitter engine the term “pentaho”. We
have choosen this term as recently this open source business intelligence based
corporation released a new product. In the following screenshot we could observe
the process of collecting the source data. A RSS Input step searching tweets
including “pentaho” (Pentaho Data Integration 4.3.0) is employed to obtain data.
Image: Tweet extraction stage PDI screenshot (General Tab)

18 Sentiment Analysis of Twitter Data
In the Fields tab we will get automatically the fields (Title, Link, Description,
Identifier, Publication Date...) retrieved in our search.
Imagen: Tweet extraction stage PDI screenshot (Fields Tab)
Once we have a great number of tweets processed with the help of Pentaho Data
Integration tool (aka Kettle) it is the moment to construct a Tag Cloud having as
source the text of all tweets. This is a first approach to find related words and
expressions. At first glance a person with no knowledge of pentaho term can gain
an insight into it. We should remark the fact that pentaho word is excluded in this
word cloud since it is the connector between all entities.
Image: Pentaho tag cloud.

19 Sentiment Analysis of Twitter Data
Now, we continue considering hashtags included in our sample. Analyzing twitter’s
hashtags will reveal categories to us. Hashtaging you can remark a particular
theme, expressing an opinion or even a personal feeling (examples:
#PentahoWebinar, #IlovePentaho, #BusinessIntelligence, #PeopleIWantToMeet).
Imagen: Hashtag word cloud.
In the screenshot we could check that “pentaho” is obviously the main hashtag,
however “bigdata” and “Pentaho45” tags are also very common. These hashtags
mark the popularity of the latest pentaho suite release and the incorporation of big
data capabilities from the aforementioned software. You may be surprised by
getting so much information from a simple automatic analysis.
In the third phase of this research we are going to carry out a Data Mining study,
nevertheless due to the small sample size (750 tweets) and the nature of them
(after human evalution the great majority express a positive polarity and only 20
tweets express dislike of Pentaho) this study has been aborted. The reason for
rejecting this experiment is the lack of negative polarity cases which are essential
to guarantee the correct function of the learning stage of data mining algorithms.
As an alternative, we are using “Firefox” term to perform the research, with this
new search over 1500 tweets are gathered about the browser. A subset of 400
tweets have been human evaluated and the rest will be SQL script analyzed looking
for words and emoticons expressing sentiments (examples: like, love, nice, cool,
great, hate, crash, crazy, fail, error, , ). After analyzing all tweets we need to
create 2 ARFF (Atribute-Relation File Format) files which will feed Weka Data Mining
tool:
Firefox_total_tweets_set.arff (1500 tweets)
Firefox_training_set.arff (400 tweets)
The training set will be destinated to train the algorithms in our study.

20 Sentiment Analysis of Twitter Data
Image: ARFF file creation ETL screenshot
K-MEANS ALGORITHM
K-means is a greedy clustering method which aims to partition a set of
observations into k clusters in which each observation belongs to the cluster with
the nearest mean. In our study case we will use the Euclidean distance calculated
from each point to the cluster center, this distance will be useful for the grouping
stage of the algorithm. K-means algorithm will be very helpful for us as first
approach since it is a fast and efficient algorithm. Due to the properties of the
source data, we have chosen 3 as k value since it appears possible that we could
distinguish between positive, negative and neutral tweets.
In this research we are going to take advantage of Weka software since it is
included in Pentaho suite. We should initially provide Weka the ARFF file containing
the training set (400 tweets). Next in Cluster tab we will choose SimpleKMeans
algorithm setting manually the field numClusters with number 3, then we should
pick the total tweets set (1500 tweets) as the test set. After configuring the
algorithm settings just press start and Weka will execute the following actions:
1) Get training data as master data and effectuate a learning process.
2) Evaluate total tweets set with the knowledge acquired in the previous step,
in this phase the algorithm makes a prediction about the cluster that each
tweet belongs to. The learning process is named model and can be stored as
a .model file, besides this sort of files can be used in Weka and in PDI Weka
Scoring step.
Training set (human evaluation):
Polarity No. of tweets
Positive 228
Negative 98
Neutral 93
TOTAL 419

21 Sentiment Analysis of Twitter Data
The results obtained show that cluster number 0 includes tweets with negative
opinions as the average value of the negative attributes (negative and
negative_smiley) is the highest. On the other hand, cluster with label 1 stores the
set of 228 tweets human evaluated as positive. Finally in cluster number 2 will
contain neutral entities.
Image: K-means results
K-means algorithm after the learning process, classifies the total tweets set in the
following manner: Cluster 0 (188 tweets), Cluster 1 (395 tweets) and Cluster 2
(967 tweets).
Total tweets set (3-means algorithm automatic evaluation):
Polarity No. of tweets
Positive 395
Negative 188
Neutral 967
TOTAL 1550

22 Sentiment Analysis of Twitter Data
USER CLASSIFIER TREE
In this stage we will manually construct a tree; this created structure is in essence
a model. We build the tree using User Classifier as algorithm on Weka. At the start
of the process a window containing the total data set will appear in the screen,
after clicking on the box a x,y-plane is displayed. Our task is creation of
homogeneous groups of tweets.
Image: User classifier data visualization
Once finished the initial classification phase, we should change to Tree view section
and the following tree model will be shown:
Image: User tree visualizer

23 Sentiment Analysis of Twitter Data
After closing tree edition window, the algorithm is ready to be executed over the
total tweets set, it is important to remember specifying this global set as supplied
test set. The following are the results arising from the execution of the algorithm.
Image: User tree classification results
In the screenshot above we could observe the prediction made: 100 negative
tweets, 138 positive tweets and 893 neutral ones.
J48 TREE
J48 is an open source Java implementation of the C 4.5 algorithm in the weka data
mining tool. C 4.5 is one of the most popular algorithms in Data Mining. The most
important parameter is the pruning confidence level which has direct influence on
tree’s size and its prediction capabilities.
The confidence level tells us how sure we can be. It is expressed as a percentage
and represents how often the true percentage of the population who would pick an
answer lies within the confidence interval. C 4.5 default confidence level value is
25%; the lower the confidence level, the more pruning nodes that are pruned.
Below we could observe the automatically generated tree (don’t forget passing to
the algorithm total tweets set as supplied test set).

24 Sentiment Analysis of Twitter Data
Image: J48 tree visualizer
J48-tree pseudo-code
negative <= 0
| positive <= 0
| | positive_smiley <= 0
| | | negative_smiley <= 0: Neutral (115.0/22.0)
| | | negative_smiley > 0: Bad (3.0)
| | positive_smiley > 0: Good (8.0)
| positive > 0: Good (190.0)
negative > 0: Bad (103.0/14.0)
The following are the results returned by the execution of J48 algorithm:
Image: J 48 tree classification results
In the screenshot above we could observe the prediction made by J48 algorithm:
110 negative tweets, 148 positive tweets and 874 neutral ones.

25 Sentiment Analysis of Twitter Data
In the table below we could view the peformance of these algorithms operating
over the same training set. Results obtained (J48 91% good classified vs User tree
89% good classified) show that J48 method is better than User created one as it
makes the most accurate prediction.
User Tree
Bad Good Neutral Not_classified <-Classified as
89 0 9 0 Bad
Good
classified: 374
12 192 24 0 Good
Bad
classified: 45
0 0 93 0 Neutral % 10,74%
100 138 893 0 Not Classified % 89,26%
J48
Bad Good Neutral Not_classified <-Classified as
92 0 6 0 Bad
Good
classified: 383
14 198 16 0 Good
Bad
classified: 36
0 0 93 0 Neutral % 8,59%
110 147 874 0 Not_Classified % 91,41%
LINEAR REGRESSION ALGORITHM
Finally, we will apply linear regression to our case study, this technique consists in
modelling the relationship between a scalar dependent variable Y , one or more
explanatory variables Xi (1<=i<=n) and k constant ( equation Y= a1X1+ a2X2 +
a3X3+… +anXn+ k).
Before starting the procedural we should normalize variables, on Weka explorer
open Preprocess tab and normalize attributes using normalize filter. Now, we have
the original values re-scalled to the range [0,1] and thanks to this we will reduce
noise caused by high attribute values.
Next, we must open Classify tab and select “Linear Regression” option. In the
screenshot below, we could notice the fact that this algorithm includes the option to
eliminate collinear attributes (collinear vectors: parallel vectors) so as to create the
most accurate line equation.
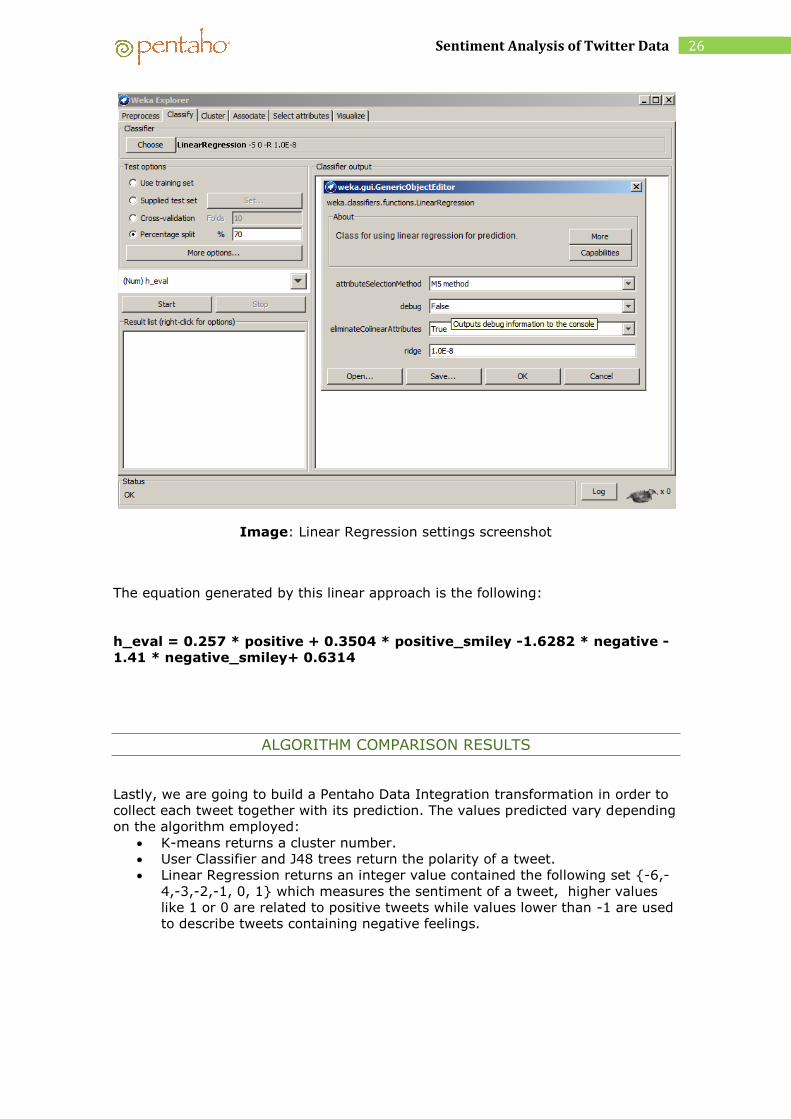
26 Sentiment Analysis of Twitter Data
Image: Linear Regression settings screenshot
The equation generated by this linear approach is the following:
h_eval = 0.257 * positive + 0.3504 * positive_smiley -1.6282 * negative -
1.41 * negative_smiley+ 0.6314
ALGORITHM COMPARISON RESULTS
Lastly, we are going to build a Pentaho Data Integration transformation in order to
collect each tweet together with its prediction. The values predicted vary depending
on the algorithm employed:
K-means returns a cluster number.
User Classifier and J48 trees return the polarity of a tweet.
Linear Regression returns an integer value contained the following set {-6,-
4,-3,-2,-1, 0, 1} which measures the sentiment of a tweet, higher values
like 1 or 0 are related to positive tweets while values lower than -1 are used
to describe tweets containing negative feelings.

27 Sentiment Analysis of Twitter Data
Image: Tweet extraction job Pentaho Data Integration
Finally, a table comparing the algorithms used is shown below. At a glance you can
check that the only error in the table belongs to User classifier prediction, since
predicts as neutral an unquestionable negative tweet. Besides we can observe how
linear regression assigns -3 as value for a tweet that contains several negative
terms expressing dissatisfaction and frustration.
Tweet Cluster User Tree J48
Linear
Regression
Is it just I or is Firefox the browser that hangs
and crashes the most? :-( 0 (Bad) Bad Bad -3
FastestFox - Browse Faster :: Add-ons for
Firefox https://t.co/Khn21Wzo 1 (Good) Good Good 1
Icant believe that firefox has a better ftp client
than android os has. 1 (Good) Good Good 1
FastestFox - Browse Faster :: Add-ons for
Firefox https://t.co/uWQ0Mx5F 1 (Good) Good Good 1
@gregsidelnikov nice but its dont work on
firefox ... 1 (Good) Bad Bad -1
@danmasso Closed out Firefox and started
over. :( 0 (Bad) Neutral Bad -1
Honestly Firefox is annoying me now.
#memorybloat 0 (Bad) Bad Bad -1
#noscript is the most annoying #firefox addon 0 (Bad) Bad Bad -1
RT @Three_Ninjas: Firefox crashes once a day. 0 (Bad) Bad Bad -1
@misterjaydee thanks for the Firefox <3 ^WR 1 (Good) Good Good 1
I hate the new Mozilla Firefox. 0 (Bad) Bad Bad -1
Oh.. #Firefox is cool too #JustSaying 1 (Good) Good Good 1
Firefox is getting slower day by day 0 (Bad) Bad Bad -1
Long story short, thanks @firefox 1 (Good) Good Good 1
@tfaiso firefox and good show 1 (Good) Good Good 1
i hate firefox. 0 (Bad) Bad Bad -1
Image: Algorithm comparison table.
28 Sentiment Analysis of Twitter Data
CONCLUSIONS
The purpose of this paper is to use Pentaho (ETL, STDashboard, Data Mining) tools
for obtaining knowledge hidden on social media data. Besides, we find remarkable
that the effective use of the methods applied in this research would be a valuable
resource for marketing department staff. This paper aims to improve advertising
campaign’s productivity and we strongly recommend you to take the best of the
social data avaible using aforementioned techniques.


