194
Mitigation of Climate Change in Agriculture (MICCA) Programme Background Report 4 Socio-economic Survey EADD-MICCA Pilot Project in Kenya Final report
Mitigation of Climate Change in Agriculture (MICCA) Programme Background Report 4
Socio-economic Survey EADD-MICCA Pilot Project in Kenya
Final report


ii
Mitigation of Climate Change in Agriculture (MICCA) Programme Background Report 4
Socio-economic Survey EADD-MICCA Pilot Project in Kenya
Final report
MICCA Programme
Pilot Project: Enhancing agricultural mitigation within the East Africa Dairy Development (EADD) Project in Kenya
Luise Zagst
Food and Agriculture Organization of the United Nations (FAO) Climate, Energy and Tenure Division (NRC)
MICCA Programme
FAO
April 2012

iii
The conclusions given in this report are considered appropriate for the time of its preparation. They may be modified in the light of further knowledge gained at subsequent stages of the project. The papers and case studies contained in this report have been reproduced as submitted by the participating organizations, which are responsible for the accuracy of the information reported.
The designations employed and the presentation of material in this information product do not imply the expression of any opinion whatsoever on the part of the FAO concerning the legal or development status of any country, territory, city or area or of its authorities, or concerning the delimitation of its frontiers or boundaries.
The mention of specific companies or products of manufacturers, whether or not these have been patented, does not imply that these have been endorsed or recommended by FAO in preference to others of a similar nature that are not mentioned. The views expressed in this information product are those of the author(s) and do not necessarily reflect the views of FAO.
© FAO 2012

1
CONTENTS
0. Executive summary ................................................................................................................... 3
1. Introduction .............................................................................................................................. 6 1.1 The MICCA Programme and its pilot projects .................................................................................... 6 1.2 EADD and MICCA Programme cooperation ....................................................................................... 6 1.3 Objectives of the socio‐economic study ............................................................................................ 6
2. Methodology ............................................................................................................................. 8 2.1 Sample size ...................................................................................................................................... 8 2.2 Research instruments ....................................................................................................................... 9 2.3 Data collection ................................................................................................................................. 9
3. Findings ................................................................................................................................... 10 3.1 Demographics ................................................................................................................................ 10 3.2 Household and farm setting ........................................................................................................... 11
3.2.1 Household assets and energy ........................................................................................................... 11 3.2.2 Farm assets and farming practice .................................................................................................... 12
3.3 Livestock ........................................................................................................................................ 12 3.3.1 Herd set‐up ....................................................................................................................................... 13 3.3.2 Milk production and usage ............................................................................................................... 15 3.3.3 Feeds and fodder production ............................................................................................................ 18 3.3.4 Manure management ....................................................................................................................... 19
3.4 Cropping ........................................................................................................................................ 21 3.4.1 Types of agricultural practices .......................................................................................................... 21 3.4.2 Climate‐smart agriculture ................................................................................................................ 21 3.4.3 Crop production ................................................................................................................................ 22 3.4.4Tree planting ..................................................................................................................................... 25
3.5 Markets, labour and food security .................................................................................................. 26 3.5.1 Visited markets ................................................................................................................................. 26 3.5.2 Required on‐farm labour .................................................................................................................. 27 3.5.3 Food security ..................................................................................................................................... 28
3.6 Project participation ....................................................................................................................... 29 3.6.1 Project participants in the sample .................................................................................................... 29 3.6.2 Investments and current costs .......................................................................................................... 30 3.6.3 Evaluation of project and benefits .................................................................................................... 31
3.7 Non‐participants ........................................................................................................................... 32 3.7.1 Reasons for non‐participation ......................................................................................................... 32 3.7.2 Requirements and willingness to join .............................................................................................. 33
3.8 Climate change ............................................................................................................................... 34 3.8.1 Awareness and experience with climate change .............................................................................. 34 3.8.2 Adaptation and preparedness .......................................................................................................... 35
3.9 Household economics..................................................................................................................... 36 3.9.1 Sources of revenues .......................................................................................................................... 36 3.9.2 Expenditures ..................................................................................................................................... 38 3.9.3 Balanced household income ............................................................................................................. 39 3.9.4 Economic assessment and priorities ................................................................................................. 41
4. Conclusions and Recommendations ......................................................................................... 44
Literature .................................................................................................................................... 46
Annex A. Socio‐economic Survey MICCA Kenya 2011 ................................................................... 47
Annex B: Tables per question (q) in household questionnaire .................................................... 71
Annex C. Conversion of weights and volumes ............................................................................ 187
Annex D. List of Indigenous Trees mentioned in the Household Survey ..................................... 188

2

3
0. EXECUTIVE SUMMARY
Working within FAO’s main efforts of sustainable food security, nutrition and productivity, the Mitigation of Climate Change in Agriculture (MICCA) Programme‘s main goal is to help developing countries contribute to climate change mitigation in agriculture and move towards low‐carbon emission agriculture. In Kenya, the MICCA Programme, in collaboration with the East African Dairy Development Project (EADD), is focusing on introducing climate‐smart agriculture into the livestock sector.
The objective of this socio‐economic survey is to collect data on current livelihoods and agricultural practices, and gain a greater knowledge about the impacts of climate change among small‐holder farmers in the project areas. The survey design should be utilized in the same way or adjusted as a tool to evaluate the outcomes and impacts on the socio‐economic situation of other MICCA Programme activities, such as capacity development and greenhouse gas assessments.
In the survey, 357 households were visited by six enumerators in six locations at the Kaptumo EADD site. Focus groups and key informants were also interviewed. The households were selected randomly and are representative of the locations. The team is aware of possible interviewer effects and other factors affecting the validity and reliability of data.
The demographics within the sample are in line with national statistics. It is heartening to note that the level of school attendance is quite high in the sample. Household and farm assets are rather basic (mobile phones, radios, hoes and shovels). Only a few individual households can afford more luxurious items (refrigerators, cars, carts, threshers). Almost all households use wood as their main energy resource, with an average per capita wood consumption of 3.1 kg (median 2.4 kg) per day. These figures are much higher than the national average of 1.5 kg.
The majority of the interviewees (91.9 percent) practice both cropping and livestock. The most common animals are cattle (92 percent) and chickens. This reflects the Kalenjin cultural tradition of raising large livestock, rather than smaller animals, like goats or sheep. The herds are made up of cross‐breeds of Aryshire and Friesian. Households own on average 5.4 animals, with project participants owning generally one additional animal. This runs contrary to the EADD approach, which emphasizes down‐sizing famers herds while improving their overall milk productivity on the farm.
More than two‐thirds of all respondents keep their cattle predominantly on paddocks (63.9 percent). Less than one‐quarter keep them grazing on communal land (21.4 pecent), and another 9.9 percent tether their animals. The land used for paddock is on average 0.9 acres. No farmer in the household survey has installed a zero‐grazing unit. The concept of zero grazing is known among farmers and promoted by the Kaptumo Division and EADD.
The daily average volume of milk per cow in the sample is 4.2 to 4.8 litres. The daily average volume for all cows per farm is 9.8 litres. Project participants produce on average three litres more than non‐participants. Almost all households use their milk for their own consumption and sell their surplus on a regular basis. Although the income figures from milk sales for project participants are not much higher than the overall sample values (8.5 percent mean, 14.7 percent median) they are significantly higher than those of non‐participants (15 percent mean; 23.2 percent median). Calculations show that the monthly income generated from selling milk accounts for 30 percent of the monthly household income (mean).
The main feed for livestock is grass. Two‐thirds of the farmers feed Napier grass mainly to milk cows. About three‐quarters of the farmers use feed supplements, one‐quarter use feed concentrates, and a
4
rather small number use crop residues as feed. The reasons why on‐farm fodder production is not higher include a shortage of land, limited finances and lack of knowledge. However, the awareness of the impact of improved fodder on milk production and the willingness to learn about it is evident. Farmers apply manure on their own fields, especially for fodder crops, or discard it in the surrounding land. Most of the manure however is wasted by grazing cattle on paddocks. Using climate‐smart agriculture principles to improve manure management and providing training on applying manure on appropriate crops could contribute to more on‐farm fodder and crop production. This could be important entry point for the MICCA Programme in its cooperation with the EADD.
Farmers plant up to six different types of crops on an average size land of 2.2 acres per farm. Maize is the predominant crop (23.2 percent of all given answers), followed by beans (14.9 percent), bananas (12.2 percent) and tea (12.1 percent). Almost all crops (besides tea) are grown for the farmers’ own consumption with surpluses being sold. The annual average income is between 25 000 KSH1 and 50 000 KSH per crop. The average annual income per household is 212 020 KSH (median 62 000 KSH). Project participants earn almost 40 percent more than the sample average and 2.5 times more than non‐participants. Climate variability is considered a problem for agriculture, but in the broader scheme is perceived as a rather small issue. The most pressing problems are related to diseases and crop quality. It is worth noting the high prevalence of sustainable and climate‐smart agriculture practices (some are implemented by more than 90 percent of the sample) in the area.
In the last 12 months, an average of 24 130 trees were planted by 118 farmers, and 4 917 trees were protected. For the MICCA Programme, it is heartening to see such a high number of the sample already planting and protecting trees. The farmers willingness to engage in agroforestry and their awareness of its benefits are necessary prerequisites for introducing different types of trees that are valuable both for fodder production and for climate change mitigation.
EADD participants made up about 37.9 percent of all interviewees. Supplying milk to the chilling plant is the most common form of participation. The main reasons for joining the project are stability of milk prices and regular pay, which leads to higher incomes. Only a few participants joined for reasons related to better breeds, cropping or fodder related topics (of interest to the MICCA Programme).
Almost three‐quarters had initial investment costs, primarily for shares, membership fees and registration fees. All of these costs are related to EADD investments and are not necessarily an indicator for investments required for climate‐smart agriculture. Regular ongoing costs mentioned in a few cases are for labour, equipment, medicines and fodder. Almost all participants see more benefits than disadvantages in joining the project.
The most common reasons farmers gave for not participating in the project were that they do not produce enough milk (40.3 percent) and lack the required knowledge and training about the project or livestock breeding (23.7 percent). Some farmers also mentioned that they did not to have enough money to join. Results show that farmers would be willing to invest almost four times the average amount actually required (based on expenditures of current project participants) to improve their agricultural productivity These investments would represent 5.7 percent of the average annual income (mean) and 3.4 percent of the median annual household income.
Climate change is predominantly experienced as changes in rain availability rather than in temperature variations or other indicators. More diseases and higher household expenditures are
1 1 USD = 91 KSH, September 2011
5
seen as the most striking impacts of climate change on families. Cropping (low yields and diseases) is clearly the main area where the impact of climate change can be seen and where farmers have already made adaptations in response to the changing conditions. However, there are many opportunities for adopting additional adaptive strategies.
The main sources of household income are cropping and raising livestock. Households have up to five economically active members. Less than a quarter of these households receive financial support from external sources (relatives, credit). The average balanced annual household income is about 30 percent higher for project participants than for the overall sample value. The annual household income for non‐project participants is about 20 percent lower than the sample average and about 40 percent lower than those of project participants. Using the annual gross national income (GNI) per capita of 790 USD (World Bank 2010), the per capita mean value of the annual balanced income of 737 USD is only slightly lower than the national value. However, the median value (50 percent of all respondents in the sample) of 261 USD is only a third of the national GNI per capita value. Based on poverty lines commonly used by the World Bank, three‐quarters of the sample live below the 1.25 USD line per day and 86.9 percent under the 2 USD line per day.
Nevertheless, almost three‐quarters of the sample consider their household situation as ‘moderate’ and have enough money for basics. Only 5 households considered themselves as very poor. Generally, women‐headed households perceive their situation less positively. When farmers were asked about their household priorities if more money were to became available, the most common responses given were buying food and livestock.
The following entry points for the MICCA Programme and EADD are recommended:
supporting on‐farm fodder production with climate‐smart agricultural tools in ways that will lead to higher milk production, less emissions, efficient manure management and possibly zero grazing.
providing knowledge on climate change and raising awareness about how to adopt agricultural practices to climate variability
offering tools to mitigate climate change through climate‐smart agriculture and agroforestry.
Furthermore, it is essential to provide a clear transparent introduction of EADD and the MICCA Programme in villages, and communicate to farmers the conditions, costs and benefits of joining the project. The MICCA Programme should work through existing groups or persons in the villages as multipliers. The Programme should address women and men equally, as both are involved in household decision‐making.

6
1. INTRODUCTION
1.1 The MICCA Programme and its pilot projects Working within FAO’s main efforts of sustainable food security, nutrition and productivity, the Mitigation of Climate Change in Agriculture (MICCA) Programme‘s main goal is to help developing countries contribute to climate change mitigation in agriculture and move towards low‐carbon emission agriculture. It is developing and implementing four pilot projects in developing countries to integrate climate‐smart practices into farming systems and provide evidence that smallholders can contribute to mitigating climate change when appropriate technologies are selected. Pilot projects focus on agricultural activities, such as livestock and rice cultivation, that tend to have high emissions and a high potential for their reduction.
1.2 EADD and MICCA Programme cooperation Each of the MICCA Programme’s pilot projects is a collaborative effort carried out in partnership with national and international partners within the framework of larger agricultural development projects. In Kenya, the MICCA Programme is working with EADD, led by Heifer International together with the World Agroforestry Center (ICRAF), the International Livestock Research Institute (ILRI), Technoserve and African Breeding Services (ABS). The objective of this pilot project is to integrate climate‐smart activities into existing livestock systems. Livestock is an integral part of many farming systems and the largest contributor to greenhouse gas emissions in the agricultural sector. In addition, many livestock breeds cannot be genetically improved fast enough to adapt to climate change. Livestock generates about 1.5 percent of total global gross domestic product (GDP). In developing countries, livestock contributes over 50 percent of the agricultural GDP and employs about 1.3 billion people, creating livelihoods for about one billion of the world's poor. For this reason, developing climate‐smart practices in livestock‐based systems is critical for achieving sustainable livelihoods in the context of climate change. The integration of trees and soil management practices can increase soil carbon accumulation and offset livestock‐related emissions.
EADD is being implemented in Kenya, Rwanda and Uganda. The Project’s overall goal is to help one million people lift themselves out of poverty through more profitable production and marketing of milk. Since 2009, 19 sites have been identified in Kenya, and ‘hubs’ are being established. The hubs provide chilling plants to store and increase the volumes of sold milk; agro‐veterinary services and other services; and shops for necessities, such as medication and improved fodder. EADD is working also with existing animal health services to improve artificial insemination and vaccinations in the region (Background taken from the Project Proposal, MICCA 2011).
The MICCA Programme and EADD agreed to cooperate in the Kaptumo site, which encompasses a chilling facility in Ndurio (5 000 litre tank ‐ installed) and in Kaptumo (10 000 litre tank – planned). The hubs are managed by Dairy Farmer Business Associations (DFBA), which are shareholders in the plant and predominantly located within the community. The Kaptumo site began collecting milk in September 2010, producing 851 litres per day. The team was able to increase production to 7 500 litres per day within one year.
1.3 Objectives of the socio-economic study The objective of this socio‐economic survey is to collect data on current livelihoods and agricultural practices, and gain a greater knowledge about the impacts of climate change among small‐holder farmers in the project areas. The MICCA Programme recognizes that project partners have been working with the respective communities for almost two years and notes that the project’s initial
7
impact and changes to farmers’ livelihoods are clearly visible. The data from this study should be seen as a snapshot of the current situation, as other studies have been undertaken before cooperation with the MICCA Programme began. An extensive baseline study in the Kaptumo project area before the implementation of the EADD Project was conducted by the group of EADD organizations in 2009. The study covered project sites in Kenya, Uganda and Rwanda (EADD 2009). Where applicable, the 2009 study provides essential background information and serves a reference paper for this study.
In addition, the results from this socio‐economic survey should assist the MICCA Programme and project partners to draft a sustainable and locally adapted action for the development of future interventions. The survey collaborated with the capacity development, life cycle analysis and GHG assessment activities of the MICCA Programme in the development of climate‐related awareness and activities.
The study design (see next chapter) was developed for the present study and should be utilized as an evaluation tool after the three‐year project ends. In this way, changes and impacts due to the MICCA Programme’s interventions can be identified and measured. Based on the experiences and lesson learned from this current study, the questionnaire may change in the later evaluation. After an analysis of the data and the development of indicators upon which change should be monitored, some questions might be deleted from the evaluation questionnaire with certain issues addressed in a more focused and detailed manner.
8
2. METHODOLOGY
2.1 Sample size The MICCA Programme team in cooperation with the EADD team agreed to focus its future interventions on the Kaptumo EADD site, which serves six locations in the area: Kaptumo, Kaboi, Koyo, Ndurio, Kapsoas and Kapkolei. The site includes 227 000 households (number provided by EADD coordinator in Eldoret, 2011). Taking a confidence level of 95 percent and a confidence interval of 5.5 percent, a sample size of 313 households should be surveyed. Taking a lower confidence interval of 5 percent a sample size of 378 households would be more precise, based on the following sample size calculation.
ss =
Z 2 * (p) * (1‐p)
c 2
Z = Z value (e.g. 1.95 for 95% confidence level); p = percentage picking a choice, expressed as decimal; c = confidence interval, expressed as decimal2
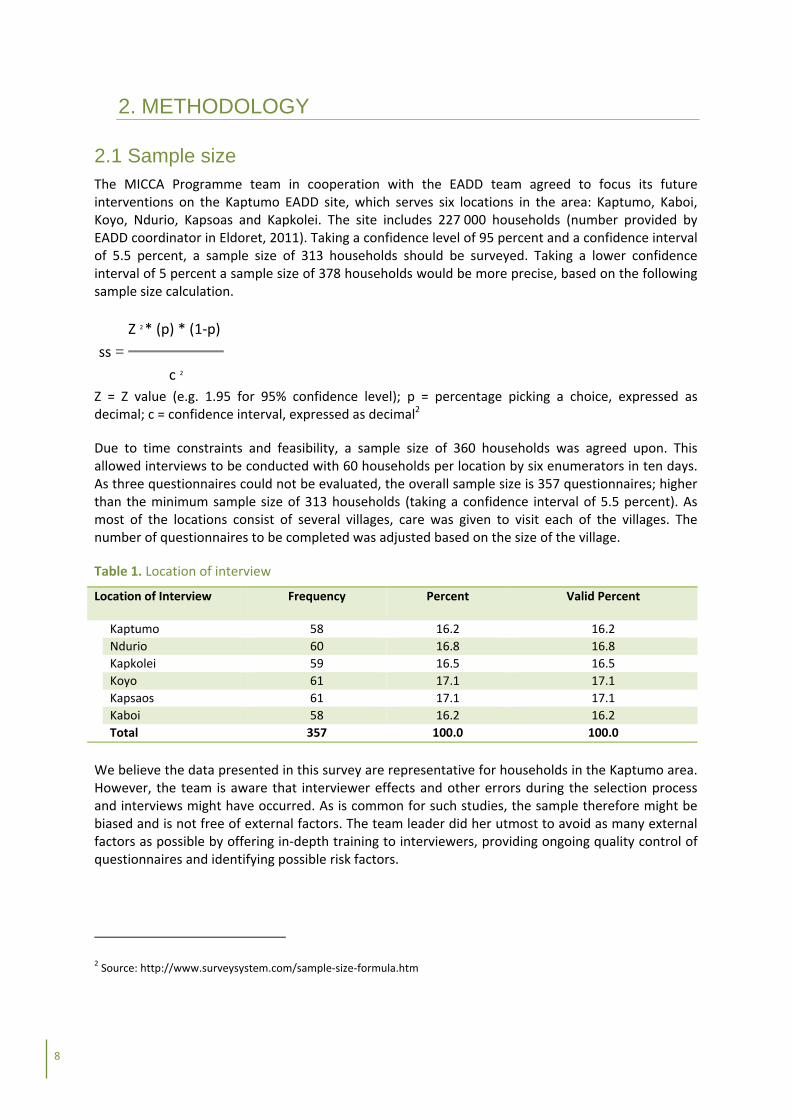
Due to time constraints and feasibility, a sample size of 360 households was agreed upon. This allowed interviews to be conducted with 60 households per location by six enumerators in ten days. As three questionnaires could not be evaluated, the overall sample size is 357 questionnaires; higher than the minimum sample size of 313 households (taking a confidence interval of 5.5 percent). As most of the locations consist of several villages, care was given to visit each of the villages. The number of questionnaires to be completed was adjusted based on the size of the village.
Table 1. Location of interview
Location of Interview Frequency Percent Valid Percent
Kaptumo 58 16.2 16.2
Ndurio 60 16.8 16.8
Kapkolei 59 16.5 16.5
Koyo 61 17.1 17.1
Kapsaos 61 17.1 17.1
Kaboi 58 16.2 16.2
Total 357 100.0 100.0
We believe the data presented in this survey are representative for households in the Kaptumo area. However, the team is aware that interviewer effects and other errors during the selection process and interviews might have occurred. As is common for such studies, the sample therefore might be biased and is not free of external factors. The team leader did her utmost to avoid as many external factors as possible by offering in‐depth training to interviewers, providing ongoing quality control of questionnaires and identifying possible risk factors.
2 Source: http://www.surveysystem.com/sample‐size‐formula.htm

9
Picture 1. Focus group discussion in Ndurio
2.2 Research instruments The household questionnaire (see Annex A) consists of 58 questions divided into sections on demographics, household and farm assets, household economics, farm management (cropping and livestock), food security and access to markets. One section focuses solely on farmers experiences with and awareness of climate change and their preparedness strategies.
In addition to the quantitative household survey, focus group discussions with farmer groups, stakeholders and key informants were conducted. The questions developed for those interviews have to be understood primarily as guiding questions as discussions were expanded to other topics where possible.
2.3 Data collection The survey followed a random selection approach in which enumerators conducted interviews in all areas of the village, starting from one central location and interviewing every third house. In locations where households were very scattered, every second house was visited. This approach ensured that all parts of the villages were included in the survey. The enumerators were very familiar with the locations and knew the subdivisions and their boundaries very well. Focus groups were organized by the project office and constituted a diverse group: adopters and non‐adopters, farmer groups who employed climate‐smart agriculture practices temporarily or not at all, as well as women’s groups or mixed groups.
Unfortunately communication to set up the meetings was sometimes patchy. As a result a smaller number of interviews were conducted.
A two‐day training session with enumerators, an assistant and data clerk was held. The session included the testing of the survey instrument in Kaptumo followed by a round of feedback from the enumerators and editing of the final questionnaire. The data collection took place between 5‐16 September, 2011. Interviews were held in Swahili and translated into the local language if needed.
Each household was given a household code which will allow other project components to identify whether the households have been included in the sample or not. This code consists of a two letter location code, the initials of the household head and the year of his/her birth. In addition global positioning system (GPS) coordinates have been taken of the visited households. All data provided by the interviewees will be treated anonymously and family names will not be given out to third parties. For this reason, the list of household codes is not attached to this report. However, it can be obtained from the MICCA Programme office ([email protected]).
The data was analysed with statistical software PSPP which is an open source version of the standard SPSS software. The data are in .sav format and can be transferred into other formats, such as Microsoft Excel. The data set is available in a CD‐Rom. Tables of each question can be found in Annex B.
10
3. FINDINGS
This chapter presents the main findings of the household questionnaire and, where applicable, the findings of the focus group discussions. The analysis focuses on the aspects most important for the MICCA Programme.
3.1 Demographics Visits were made to 357 households in six locations. On average the households contain five persons, with a minimum of one and a maximum of nine household members. In 50 percent of all cases (median value) two adults live in a household. Households having children number 271, with an average of three and a maximum of six per household. Out of 357 households, 50 percent have one elderly person over 65 years. About 38 percent of all interviewed farmers participated in some way in EADD activities and considers themselves to be project participants. More data on project participants will be presented in chapter 3.6.
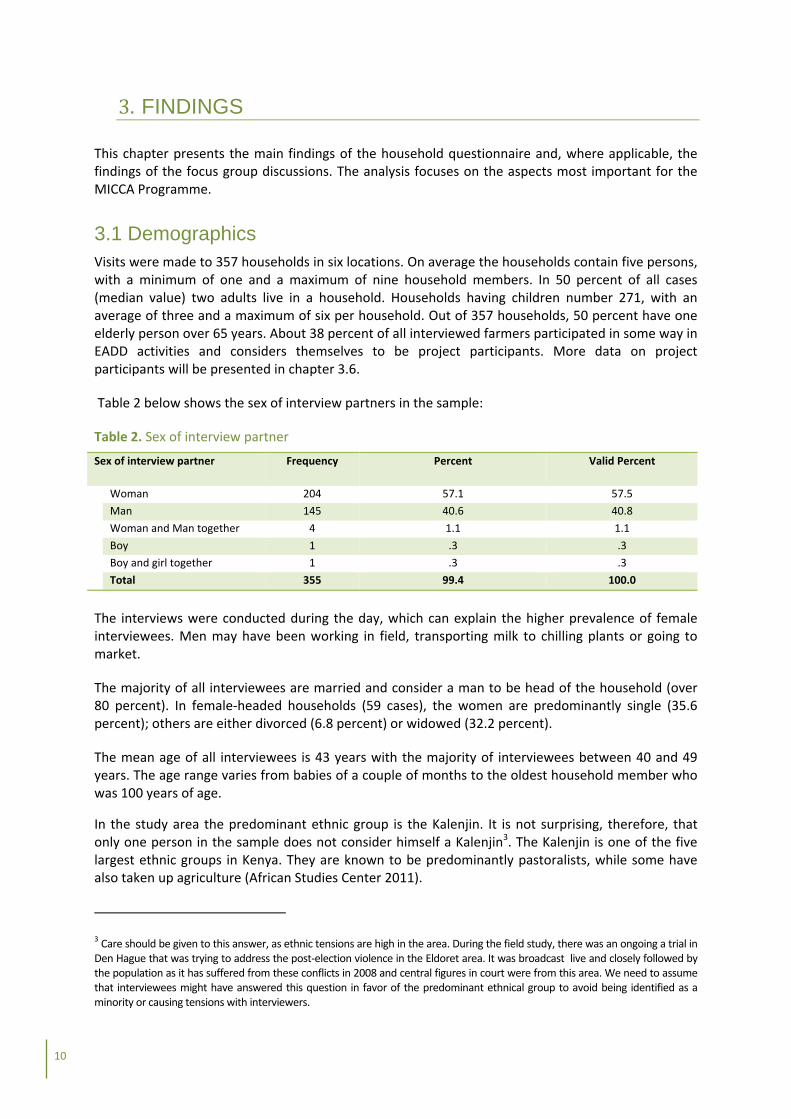
Table 2 below shows the sex of interview partners in the sample:
Table 2. Sex of interview partner
Sex of interview partner Frequency Percent Valid Percent
Woman 204 57.1 57.5
Man 145 40.6 40.8
Woman and Man together 4 1.1 1.1
Boy 1 .3 .3
Boy and girl together 1 .3 .3
Total 355 99.4 100.0
The interviews were conducted during the day, which can explain the higher prevalence of female interviewees. Men may have been working in field, transporting milk to chilling plants or going to market.
The majority of all interviewees are married and consider a man to be head of the household (over 80 percent). In female‐headed households (59 cases), the women are predominantly single (35.6 percent); others are either divorced (6.8 percent) or widowed (32.2 percent).
The mean age of all interviewees is 43 years with the majority of interviewees between 40 and 49 years. The age range varies from babies of a couple of months to the oldest household member who was 100 years of age.
In the study area the predominant ethnic group is the Kalenjin. It is not surprising, therefore, that only one person in the sample does not consider himself a Kalenjin3. The Kalenjin is one of the five largest ethnic groups in Kenya. They are known to be predominantly pastoralists, while some have also taken up agriculture (African Studies Center 2011).
3 Care should be given to this answer, as ethnic tensions are high in the area. During the field study, there was an ongoing a trial in Den Hague that was trying to address the post‐election violence in the Eldoret area. It was broadcast live and closely followed by the population as it has suffered from these conflicts in 2008 and central figures in court were from this area. We need to assume that interviewees might have answered this question in favor of the predominant ethnical group to avoid being identified as a minority or causing tensions with interviewers.
11
In 28 households, the survey found one person that has never been to school, and in twelve cases two people have not been to school. Those who had not attended school are mainly elderly. In two households, one person (both invalids) under 14 was found who has never been to school. The majority of households have members that have been to school and/or have left it already. Taking the median, 279 households have two children currently in school. The high rate of school attendance can also be seen in seven cases where up to six children are currently enrolled in school. The high rate of school attendance can be explained by the free education policy enacted by the Kenyan government in 2008.
3.2 Household and farm setting
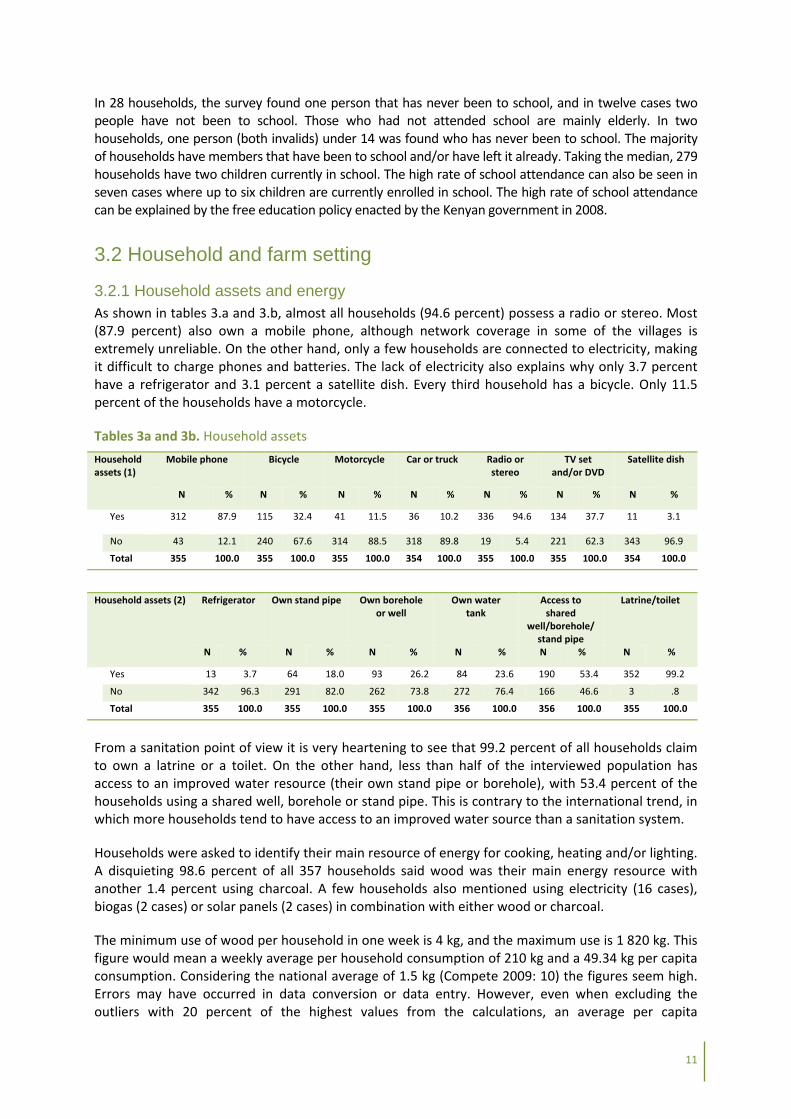
3.2.1 Household assets and energy As shown in tables 3.a and 3.b, almost all households (94.6 percent) possess a radio or stereo. Most (87.9 percent) also own a mobile phone, although network coverage in some of the villages is extremely unreliable. On the other hand, only a few households are connected to electricity, making it difficult to charge phones and batteries. The lack of electricity also explains why only 3.7 percent have a refrigerator and 3.1 percent a satellite dish. Every third household has a bicycle. Only 11.5 percent of the households have a motorcycle.
Tables 3a and 3b. Household assets
Household assets (1)
Mobile phone Bicycle Motorcycle Car or truck Radio or stereo
TV set and/or DVD
Satellite dish
N % N % N % N % N % N % N %
Yes 312 87.9 115 32.4 41 11.5 36 10.2 336 94.6 134 37.7 11 3.1
No 43 12.1 240 67.6 314 88.5 318 89.8 19 5.4 221 62.3 343 96.9
Total 355 100.0 355 100.0 355 100.0 354 100.0 355 100.0 355 100.0 354 100.0
Household assets (2) Refrigerator Own stand pipe Own borehole or well
Own water tank
Access to shared
well/borehole/stand pipe
Latrine/toilet
N % N % N % N % N % N %
Yes 13 3.7 64 18.0 93 26.2 84 23.6 190 53.4 352 99.2
No 342 96.3 291 82.0 262 73.8 272 76.4 166 46.6 3 .8
Total 355 100.0 355 100.0 355 100.0 356 100.0 356 100.0 355 100.0
From a sanitation point of view it is very heartening to see that 99.2 percent of all households claim to own a latrine or a toilet. On the other hand, less than half of the interviewed population has access to an improved water resource (their own stand pipe or borehole), with 53.4 percent of the households using a shared well, borehole or stand pipe. This is contrary to the international trend, in which more households tend to have access to an improved water source than a sanitation system.
Households were asked to identify their main resource of energy for cooking, heating and/or lighting. A disquieting 98.6 percent of all 357 households said wood was their main energy resource with another 1.4 percent using charcoal. A few households also mentioned using electricity (16 cases), biogas (2 cases) or solar panels (2 cases) in combination with either wood or charcoal.
The minimum use of wood per household in one week is 4 kg, and the maximum use is 1 820 kg. This figure would mean a weekly average per household consumption of 210 kg and a 49.34 kg per capita consumption. Considering the national average of 1.5 kg (Compete 2009: 10) the figures seem high. Errors may have occurred in data conversion or data entry. However, even when excluding the outliers with 20 percent of the highest values from the calculations, an average per capita

12
requirement per week would be 22.1 kg (median 17.1 kg) and daily requirement per capita of 3.2 kg (median 2.4 kg). The results are still quite high and need to be treated carefully. In a future survey, other methods will be required to measure the daily consumption and enumerators need to be trained on estimating and capturing measurements explicitly.
The MICCA Programme would be interested in seeing the absolute figures decrease substantially in the final evaluation survey after having engaged in activities to raise awareness on reforestation and agroforestry and providing alternative energy solutions (biogas, low‐energy cookers).
3.2.2 Farm assets and farming practice The majority of all visited farms (91.9 percent) practice cropping and keep livestock on a self‐employed basis. Only 23 cases (6.4 percent) crop exclusively and only 6 cases (1.7 percent) keep livestock exclusively. The same situation applies for women‐headed households, although the percentage of those exclusively raising livestock is slightly higher (6.8 percent) than for the overall sample. Those women mainly own chicken and goats.
When asked about their farm assets, 20 interviewees did not give any answer. They may have not known if they owned their respective assets, preferred not to answer or did not have any assets. Out of 335 farmers who answered this question, 99.7 percent own a hoe, 82.4 percent a shovel and 69.9 percent a machete. The latter figure might be higher, as interviewees may not have understood the word ‘machete’ and the interviewer may not have explicitly asked about it in the local language.
Improved farming assets like ploughs, carts, tractors and threshers are not common in the study area. Only a few responses were given regarding assets required for improved/advanced dairy farming, such as milking parlours, milking machines and teat dips. Less than half of all respondents have separate areas for human and animals, and even fewer households (19.9 percent) have any barns at all. This implies an immense hygiene and health risk, especially for children in the household, and an inefficient use of manure. The low numbers given for pulverizer ownership (2 cases) and chaff cutters (11 cases) give an indication of the low fodder production among dairy farmers. More information on fodder production will be presented in chapter 3.3.
3.3 Livestock A general problem in the area, according to EADD staff and Kaptumo Livestock Division representatives, is the increasing milk deficit due to growing population. The expanding population is also causing farm sizes to shrink. The free ranging of cattle is not possible anymore as the land is too densely populated. Other problems seen by the Livestock Division in Kaptumo include, increasing prices for inputs, like medicine and feeds; the high costs of fodder production; and the tendency to use fertilizer for food production instead of fodder production. According to key informants, the number of cattle per household should be decreased and the remaining cattle improved by artificial insemination and proper feeding.
The majority of interviewed households own cows (331 out of 357, or 92 percent), followed by 238 households that own chickens. Only 93 household own goats, and 98 households own sheep. Donkeys are owned by 17 households and no one owns pigs. Similar distributions are found among female‐headed households, although the percentage of women raising chicken and goats is slightly higher than for the rest of the sample. The average number of three goats or sheep (mean value) per farm shows that for smaller animals the herds are not as large as for cattle. The average size of a household cattle herd size is 5.4 heads (mean value). This distribution can be explained by the Kalenjin culture which promotes cattle raising as a means of attaining wealth and status. Owning goats and sheep are for ‘…poorer and less affluent people…’ or just children (Idenya Interview) and is not considered as prestigious raising livestock. High cultural value is given to cows, but not to poultry or goats.
13
_
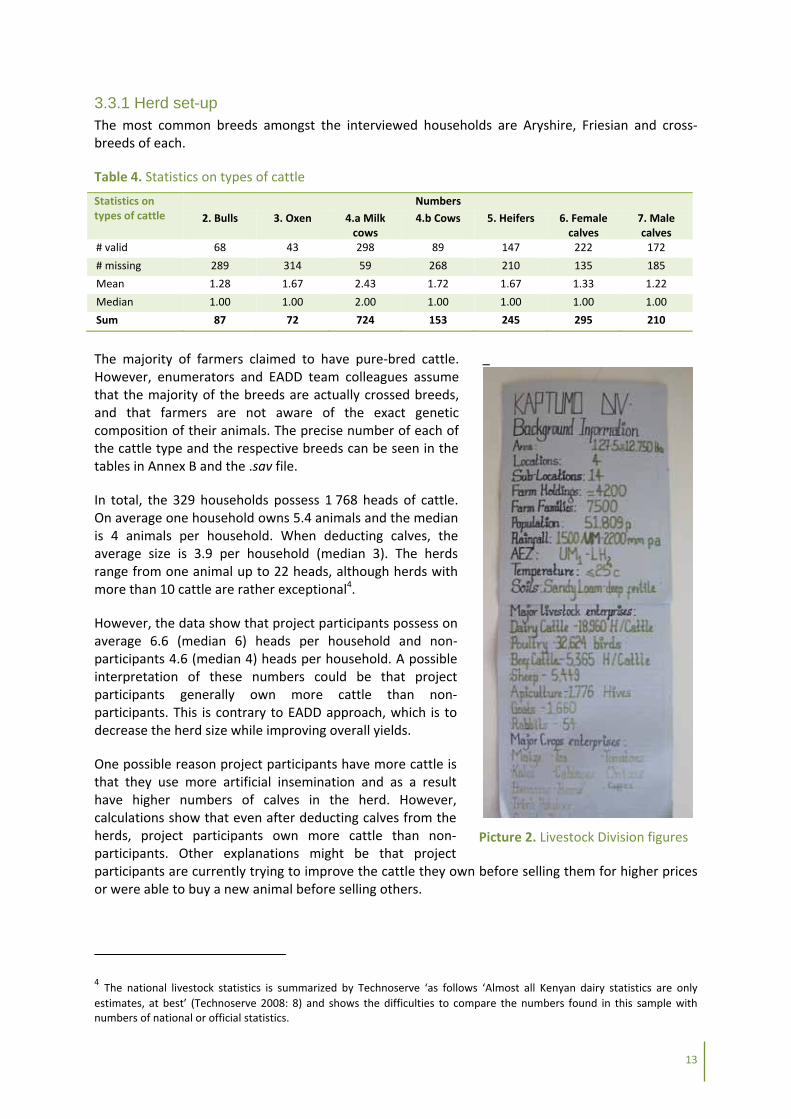
Picture 2. Livestock Division figures
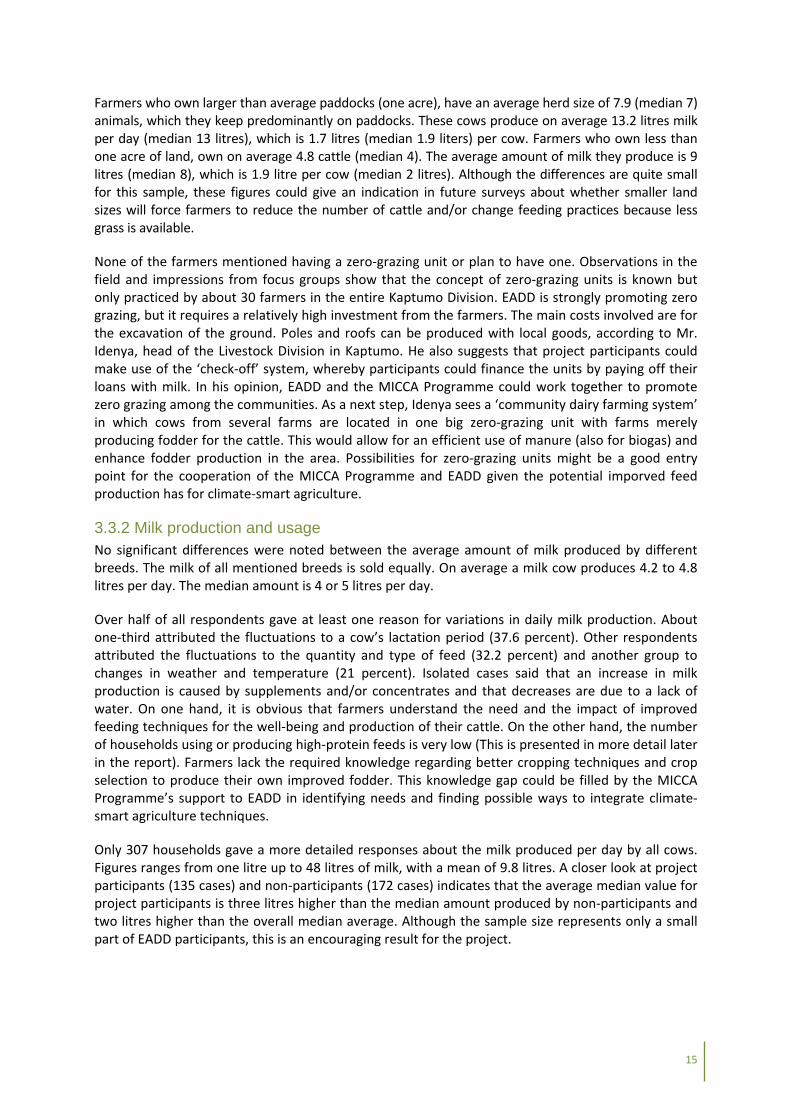
3.3.1 Herd set-up The most common breeds amongst the interviewed households are Aryshire, Friesian and cross‐breeds of each.
Table 4. Statistics on types of cattle
Statistics on types of cattle
Numbers
2. Bulls 3. Oxen 4.a Milk cows
4.b Cows 5. Heifers 6. Female calves
7. Male calves
# valid 68 43 298 89 147 222 172
# missing 289 314 59 268 210 135 185
Mean 1.28 1.67 2.43 1.72 1.67 1.33 1.22
Median 1.00 1.00 2.00 1.00 1.00 1.00 1.00
Sum 87 72 724 153 245 295 210
The majority of farmers claimed to have pure‐bred cattle. However, enumerators and EADD team colleagues assume that the majority of the breeds are actually crossed breeds, and that farmers are not aware of the exact genetic composition of their animals. The precise number of each of the cattle type and the respective breeds can be seen in the tables in Annex B and the .sav file.
In total, the 329 households possess 1 768 heads of cattle. On average one household owns 5.4 animals and the median is 4 animals per household. When deducting calves, the average size is 3.9 per household (median 3). The herds range from one animal up to 22 heads, although herds with more than 10 cattle are rather exceptional4.
However, the data show that project participants possess on average 6.6 (median 6) heads per household and non‐participants 4.6 (median 4) heads per household. A possible interpretation of these numbers could be that project participants generally own more cattle than non‐participants. This is contrary to EADD approach, which is to decrease the herd size while improving overall yields.
One possible reason project participants have more cattle is that they use more artificial insemination and as a result have higher numbers of calves in the herd. However, calculations show that even after deducting calves from the herds, project participants own more cattle than non‐participants. Other explanations might be that project participants are currently trying to improve the cattle they own before selling them for higher prices or were able to buy a new animal before selling others.
4 The national livestock statistics is summarized by Technoserve ‘as follows ‘Almost all Kenyan dairy statistics are only
estimates, at best’ (Technoserve 2008: 8) and shows the difficulties to compare the numbers found in this sample with numbers of national or official statistics.
14
According to the Livestock Division of Kaptumo (see picture 2) there are 24 000 heads of cattle in the division, with 3 000 pure exotic breeds, 14 200 crosses of exotic and 5 000 bulls (for beef production). Zebus are predominant in the southern part of the division, and none were recorded in the sample.
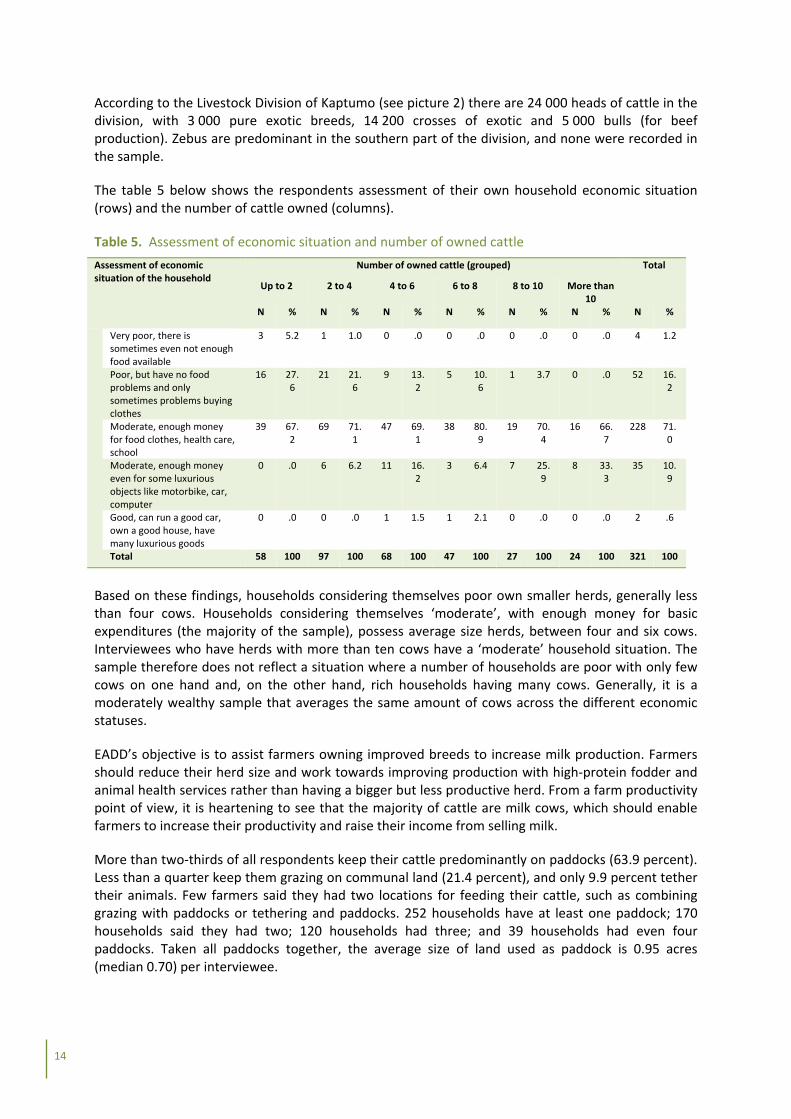
The table 5 below shows the respondents assessment of their own household economic situation (rows) and the number of cattle owned (columns).
Table 5. Assessment of economic situation and number of owned cattle
Assessment of economic situation of the household
Number of owned cattle (grouped) Total
Up to 2 2 to 4 4 to 6 6 to 8 8 to 10 More than 10
N % N % N % N % N % N % N %
Very poor, there is sometimes even not enough food available
3 5.2 1 1.0 0 .0 0 .0 0 .0 0 .0 4 1.2
Poor, but have no food problems and only sometimes problems buying clothes
16 27.6
21 21.6
9 13.2
5 10.6
1 3.7 0 .0 52 16.2
Moderate, enough money for food clothes, health care, school
39 67.2
69 71.1
47 69.1
38 80.9
19 70.4
16 66.7
228 71.0
Moderate, enough money even for some luxurious objects like motorbike, car, computer
0 .0 6 6.2 11 16.2
3 6.4 7 25.9
8 33.3
35 10.9
Good, can run a good car, own a good house, have many luxurious goods
0 .0 0 .0 1 1.5 1 2.1 0 .0 0 .0 2 .6
Total 58 100 97 100 68 100 47 100 27 100 24 100 321 100
Based on these findings, households considering themselves poor own smaller herds, generally less than four cows. Households considering themselves ‘moderate’, with enough money for basic expenditures (the majority of the sample), possess average size herds, between four and six cows. Interviewees who have herds with more than ten cows have a ‘moderate’ household situation. The sample therefore does not reflect a situation where a number of households are poor with only few cows on one hand and, on the other hand, rich households having many cows. Generally, it is a moderately wealthy sample that averages the same amount of cows across the different economic statuses.
EADD’s objective is to assist farmers owning improved breeds to increase milk production. Farmers should reduce their herd size and work towards improving production with high‐protein fodder and animal health services rather than having a bigger but less productive herd. From a farm productivity point of view, it is heartening to see that the majority of cattle are milk cows, which should enable farmers to increase their productivity and raise their income from selling milk.
More than two‐thirds of all respondents keep their cattle predominantly on paddocks (63.9 percent). Less than a quarter keep them grazing on communal land (21.4 percent), and only 9.9 percent tether their animals. Few farmers said they had two locations for feeding their cattle, such as combining grazing with paddocks or tethering and paddocks. 252 households have at least one paddock; 170 households said they had two; 120 households had three; and 39 households had even four paddocks. Taken all paddocks together, the average size of land used as paddock is 0.95 acres (median 0.70) per interviewee.
15
Farmers who own larger than average paddocks (one acre), have an average herd size of 7.9 (median 7) animals, which they keep predominantly on paddocks. These cows produce on average 13.2 litres milk per day (median 13 litres), which is 1.7 litres (median 1.9 liters) per cow. Farmers who own less than one acre of land, own on average 4.8 cattle (median 4). The average amount of milk they produce is 9 litres (median 8), which is 1.9 litre per cow (median 2 litres). Although the differences are quite small for this sample, these figures could give an indication in future surveys about whether smaller land sizes will force farmers to reduce the number of cattle and/or change feeding practices because less grass is available.
None of the farmers mentioned having a zero‐grazing unit or plan to have one. Observations in the field and impressions from focus groups show that the concept of zero‐grazing units is known but only practiced by about 30 farmers in the entire Kaptumo Division. EADD is strongly promoting zero grazing, but it requires a relatively high investment from the farmers. The main costs involved are for the excavation of the ground. Poles and roofs can be produced with local goods, according to Mr. Idenya, head of the Livestock Division in Kaptumo. He also suggests that project participants could make use of the ‘check‐off’ system, whereby participants could finance the units by paying off their loans with milk. In his opinion, EADD and the MICCA Programme could work together to promote zero grazing among the communities. As a next step, Idenya sees a ‘community dairy farming system’ in which cows from several farms are located in one big zero‐grazing unit with farms merely producing fodder for the cattle. This would allow for an efficient use of manure (also for biogas) and enhance fodder production in the area. Possibilities for zero‐grazing units might be a good entry point for the cooperation of the MICCA Programme and EADD given the potential imporved feed production has for climate‐smart agriculture.
3.3.2 Milk production and usage No significant differences were noted between the average amount of milk produced by different breeds. The milk of all mentioned breeds is sold equally. On average a milk cow produces 4.2 to 4.8 litres per day. The median amount is 4 or 5 litres per day.
Over half of all respondents gave at least one reason for variations in daily milk production. About one‐third attributed the fluctuations to a cow’s lactation period (37.6 percent). Other respondents attributed the fluctuations to the quantity and type of feed (32.2 percent) and another group to changes in weather and temperature (21 percent). Isolated cases said that an increase in milk production is caused by supplements and/or concentrates and that decreases are due to a lack of water. On one hand, it is obvious that farmers understand the need and the impact of improved feeding techniques for the well‐being and production of their cattle. On the other hand, the number of households using or producing high‐protein feeds is very low (This is presented in more detail later in the report). Farmers lack the required knowledge regarding better cropping techniques and crop selection to produce their own improved fodder. This knowledge gap could be filled by the MICCA Programme’s support to EADD in identifying needs and finding possible ways to integrate climate‐smart agriculture techniques.
Only 307 households gave a more detailed responses about the milk produced per day by all cows. Figures ranges from one litre up to 48 litres of milk, with a mean of 9.8 litres. A closer look at project participants (135 cases) and non‐participants (172 cases) indicates that the average median value for project participants is three litres higher than the median amount produced by non‐participants and two litres higher than the overall median average. Although the sample size represents only a small part of EADD participants, this is an encouraging result for the project.

16
Table 6. Overall amount of produced milk per day
Overall amount of produced milk per day (in litres)
PROJECT PARTICIPANTS NON‐PARTICIPANTS
N Valid 135 172
N Missing 0 49
Mean 11.5 8.4
Median 10.0 8.0
Minimum 1.5 1.0
Maximum 40.0 48.0
Sum 1552.0 1453.0
Graph 1 shows that the majority of households sell their milk and use the milk for their own consumption. Only four households reported that they did not consume the milk they produced. This could either be a mistake in data entry, an incorrect answer or the respondents may have been commercial farmers.
Graph 1. Use of milk
Only 10 percent of the respondents produce ‘murzik‘, a local beverage fermented in a closed container (gourd) and treated with a special aroma from plants for about a week. Focus group discussions and key informants emphasize that the shortage of milk caused by the increase in population and land scarcity does not allow farmers to continue the production of this traditional drink. As a result, murzik has become a rarity in the area. On average 7.2 litres are sold per day per household and 3.2 litres are kept for household consumption. Some households mentioned that they give milk away for free (about 1.5 litres per day).
Putting those numbers in relation to the overall milk per day available for the household, on average 66 percent (median) is sold and 33 percent (median) is consumed by household members. In 31 cases, household members consume 100 percent of their milk themselves and do not sell anything. There is no significant noticeable difference for female‐headed households.
None of the households conserve milk in form of ‘lala‘ (another type of fermented milk) or yoghurt nor sell other dairy products. Apparently yoghurt is not common in the area due to the lack of electricity and the consequent storage difficulties. Although the climatic conditions would allow the
17
yoghurt production, one interviewee mentioned that he would not know where to get bacteria, or what to do with it.
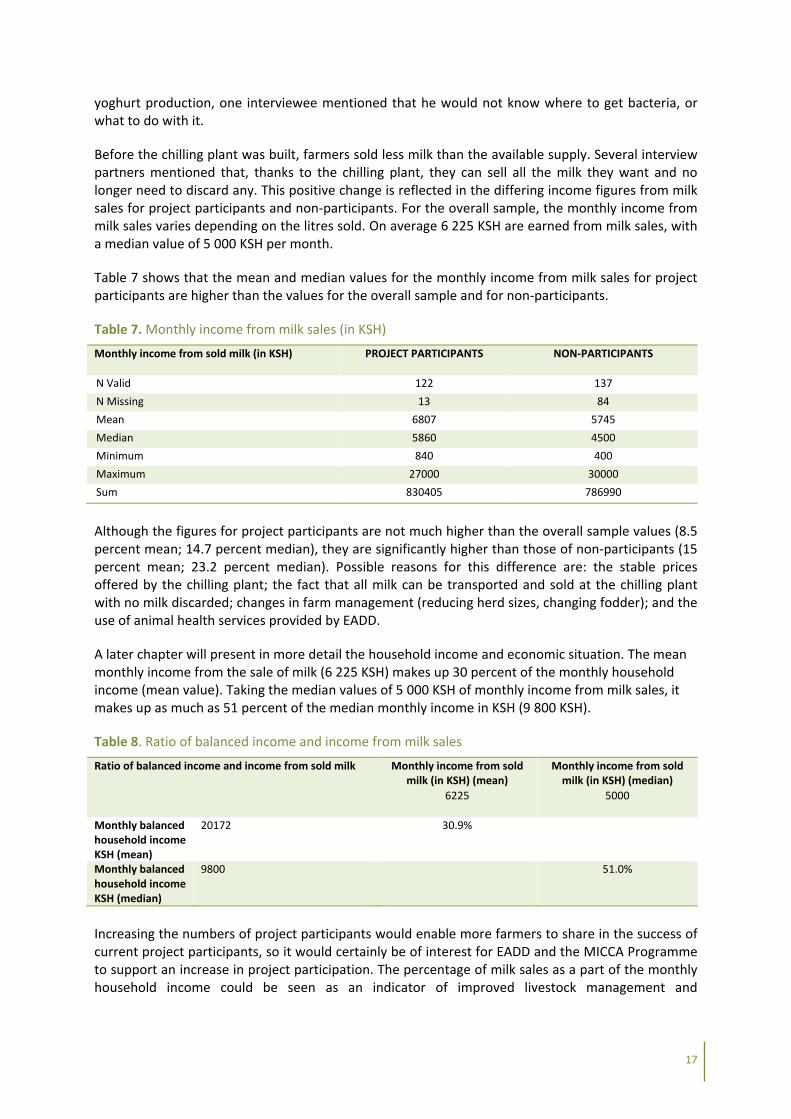
Before the chilling plant was built, farmers sold less milk than the available supply. Several interview partners mentioned that, thanks to the chilling plant, they can sell all the milk they want and no longer need to discard any. This positive change is reflected in the differing income figures from milk sales for project participants and non‐participants. For the overall sample, the monthly income from milk sales varies depending on the litres sold. On average 6 225 KSH are earned from milk sales, with a median value of 5 000 KSH per month.
Table 7 shows that the mean and median values for the monthly income from milk sales for project participants are higher than the values for the overall sample and for non‐participants.
Table 7. Monthly income from milk sales (in KSH)
Monthly income from sold milk (in KSH) PROJECT PARTICIPANTS NON‐PARTICIPANTS
N Valid 122 137
N Missing 13 84
Mean 6807 5745
Median 5860 4500
Minimum 840 400
Maximum 27000 30000
Sum 830405 786990
Although the figures for project participants are not much higher than the overall sample values (8.5 percent mean; 14.7 percent median), they are significantly higher than those of non‐participants (15 percent mean; 23.2 percent median). Possible reasons for this difference are: the stable prices offered by the chilling plant; the fact that all milk can be transported and sold at the chilling plant with no milk discarded; changes in farm management (reducing herd sizes, changing fodder); and the use of animal health services provided by EADD.
A later chapter will present in more detail the household income and economic situation. The mean monthly income from the sale of milk (6 225 KSH) makes up 30 percent of the monthly household income (mean value). Taking the median values of 5 000 KSH of monthly income from milk sales, it makes up as much as 51 percent of the median monthly income in KSH (9 800 KSH).
Table 8. Ratio of balanced income and income from milk sales
Ratio of balanced income and income from sold milk Monthly income from sold milk (in KSH) (mean)
Monthly income from sold milk (in KSH) (median)
6225 5000
Monthly balanced household income KSH (mean)
20172 30.9%
Monthly balanced household income KSH (median)
9800 51.0%
Increasing the numbers of project participants would enable more farmers to share in the success of current project participants, so it would certainly be of interest for EADD and the MICCA Programme to support an increase in project participation. The percentage of milk sales as a part of the monthly household income could be seen as an indicator of improved livestock management and
18
demonstrate the possible positive impact on food security and the general socio‐economic household situation.
It should also be noted that not all farmers sell their milk to the Kaptumo chilling plant or not exclusively to the plant. There are other chilling plants in the area that might be even more easily accessible than Kaptumo for some households. Others sell their milk in local or regional markets (see chapter 3.5) or to ‘hawkers’ who pick up the milk at the farm and take it to a more distant location. The hawkers do not necessarily have stable prices and do not pay in a reliable manner. In addition, the hawker’s price is often lower than the one provided by the chilling plant. However, due to the poor transport and road infrastructure, not all farmers can easily reach the Kaptumo chilling plant and, therefore, depend on hawkers and smaller markets.
3.3.3 Feeds and fodder production In focus group discussions, farmers revealed that most of the feeds used are of low quality. One reason given for this was the farmers’ lack of knowledge regarding the production and storage of fodder. Another complaint farmers made was about a lack of seeds that would allow them to produce more maize and use the surplus yield or crop residues as feed. It also became apparent that cultural beliefs affect feeding practices. For example, many farmers consider that using crop residues for feed is bad for cattle. This also explains why more farmers are not producing their own fodder.
The majority of interviewed households feed their cattle with fresh grass without distinguishing between different types of cattle. As outlined above, animals are feed either on a paddock, tethered or left to graze on communal land. Six of the farmers interviewed have to buy fresh grass, as they do not produce enough themselves. They pay on average 205 KSH per week. Only one farmer stated that he required 150 kg of fresh grass per week per head. All the others respondents failed to estimate the required volume of grass feed.
Two‐thirds of all farmers are feeding Napier grass (214 cases) to their cattle, and in 24 percent of those households only to milk cows. All households produce their Napier grass themselves and do not need to buy it. Only 175 farmers were able to estimate the required amount of Napier grass for their cattle. Volumes are given in bucket‐loads, wheel barrows, sacks and kg. Those units were converted into kg based on figures provided by the local assistant and ILRI (see Annex C). On average 224 kg of Napier grass per household are required for all their cattle per week (median 120 kg). The majority uses between 50 and 300 kg; volumes below and above that are exceptional.
One‐third of all farmers feed their animals crop residues; the majority to all cattle, and only 2.8 percent to milk cows. The ratio5 is very low and does not exceed 20 percent of the daily fodder ratio. The average is around 9 percent. Only two households buy crop residues, paying 100 KSH and 750 KSH per week for this. Although only a small percentage in this sample uses crop residues as feed, at least there is an awareness of the possible positive impact crop residues can have on milk production.
Only one‐quarter of the interviewed households feed concentrates to their cows. Half of this group reports feeding concentrates to all their cows, whereas the other half only feeds high‐protein concentrates to milk cows. A small number (4 percent) of farmers produce the concentrate themselves (using molasses and sweet potato vines or dairy meal and maize). Farmers spend between 25 KSH and 3 000 KSH on concentrates per week and on average 380 KSH (median 150 KSH).
5 Unfortunately, only a few households and/or enumerators understood the need to evaluate the daily ratio of the single fodder components. Therefore, the given answers are rather low and can only be understood as trends.

19
Three‐quarters of the farmers feed supplements (salts and minerals) to their cattle. The ratio in the daily fodder scheme is very low, with 1 or 2 percent as the main percentage indicated. Supplements are explicitly fed to milk cows. In one case, the supplements were also given to a heifer. The required amount per cattle per week is on average 1.3 kg. In all cases, the supplements have to be bought. Costs range between 8 and 600 KSH, with a mean price of 132 KSH.
To summarize the different feeding systems, the main feeds are fresh grass and Napier grass, which are high in protein, but not high enough to improve the milk quantity and quality, according to EADD staff and other livestock experts in the area. The positive impact of feeding concentrates, supplements and crop residues are visible, and these feeding practices should be reinforced by the project.
The number of households producing high‐protein crops like Lucerne and Dismodium is expected to increase during future project phases. Practices, such as drying crop residues and pulverizing them to produce concentrates are currently not common, but they could be an entry point for cooperation between the MICCA Programme and EADD.
Interviewees gave many reasons for not producing their own cattle fodder. Insufficient land to plant fodder crops (55.5 percent) is the main reason, followed by lack of finances (27 percent) and lack of knowledge (8.8 percent) concerning cropping techniques and crop selection. Only a few interviewees (8.8 percent) said that they did not see the necessity of fodder production at all. This shows the widespread awareness among the population about the need to improve fodder production and the willingness to learn about it. This offers an excellent opportunity for the MICCA Programme to promote climate‐smart agriculture practices to produce more and improved fodder crops as well as crops whose residues can be used to produce dried concentrates. Intensive training should be developed to work with farmers on adequate crop selection, cultivation and processing to achieve the desired increases in milk production.
In addition to improved feed management, another way to improve dairy production is through cattle breeding using artificial insemination with improved semen. EADD is offering artificial insemination services and has seen a steep increase in the use of these services. 84 households said they had used artificial insemination over the last 12 months; about two thirds have tried it once, and 21 percent twice.
3.3.4 Manure management Manure management is an essential element in climate change mitigation and a possible focus area for future cooperation between the MICCA Programme and EADD. Manure can be used to fertilize soils and enhance fodder crop production or the production of crops whose residues can be used for fodder. In addition, manure is a producer of greenhouse gases, methane and nitrous oxide. It is also a health and water quality hazard. Improper manure management is harmful to community well‐being and contributes to climate change.

20
_
Picture 3. Manure used as construction material
Graph 2. Use of manure
Graph 2 shows that the majority of farmers use manure on their own field (312 cases, 87 percent). A substantial number even apply it to fodder crops. At the same time, more than one‐third of the farmers discard the manure in the surrounding area. About three‐quarters use the manure as construction material, predominantly for animal shelters (see picture 3).
In only a few cases is manure used as fuel, biogas or compost. The use of manure as an alternative energy resource is not common. However, its use as fertilizer is known to more than two‐thirds of the interviewed households. In focus group discussions, the idea was raised to use manure as fuel for fires to reduce the deforestation in the area. Participants shared the view that they lack the knowledge about which crops they should and could apply manure to improve production.
Because livestock is kept in paddocks or sent to graze on communal land, manure cannot be collected easily and reused for other purposes. Rain washes away substantial amounts of manure, making it impossible to collect. From a manure management point of view, the current predominant way of keeping cattle (on paddocks) clearly makes an efficient and adequate use of manure difficult. Assisting farmers with manure management and promoting on‐farm fodder and crop production through improved manure management could be another important entry point for the MICCA Programme. Zero grazing could be one approach for achieving better manure management.

21
3.4 Cropping
3.4.1 Types of agricultural practices Except for four households, all interviewees practice some form of cropping. The majority of the 354 households interviewed cultivate on their own fields. Less than 8 percent cultivate on leased fields. About one‐third cultivate a single main plot, while another third cultivates several fields. Horticulture and gardening is very common (81.3 percent). Planting and harvesting trees is practiced by only one‐third of the households interviewed. Harvesting bushes and fruit is done by only 13.6 percent of the households. The majority of farmers produce food for their own consumption and have some surplus food to sell. Only 12 households practice subsistence farming.
There were many different responses given to questions about agricultural problems. The most frequently cited problems are diseases (34.7 percent) followed by lack of seeds (19.2 percent). During farm visits and interviews with farmer groups, it was apparent that the last seed order/distribution was covered with a fungus that caused low maize yield and damaged the soil. In focus groups, the team learned that farmers still use those infected crops as fodder for their cattle, which constitutes a major health hazard.
Farmers mentioned that access to water for animals and people can be a problem. Apparently, incidences of water‐borne diseases are high and access to safe water is low. In addition, cattle watering along the river side and cattle tracks leading to and from the water sources are causing soil erosion. According to some focus group discussion participants, the topsoil is decreasing and overstocking is causing less grass to grow.
Farmers also complain about expensive inputs, such as fertilizers and equipment (9.4 percent). A lack of knowledge and training in areas such as improved farming techniques and crop selections was mentioned by 7.8 percent of the interviewees. Lack of finances (5.3 percent), low yields (3.9 percent) and lack of market access (3.4 percent) were some of the other problems mentioned. Problems related to weather (changes in weather, hailstorms, more rain and natural calamities) accounted for 5 percent of the responses. This leads to the conclusion that climate variability is considered a problem, but is perceived as a relatively small issue. More striking problems are connected to diseases and crop quality.
3.4.2 Climate-smart agriculture About 90 percent of all interviewees stated they knew about conservation agriculture. Often enumerators had to explain the term by outlining different cropping techniques with farmers then confirming whether or not they practice them. Most common of theses practices are ridge cultivation (93.8 percent), planting in rows (91.0 percent), planting hedge rows (91.2 percent), application of manure (90.4 percent), crop rotation (83.9 percent) and timely weeding (80.7 percent). Almost all interviewees stated they applied fertilizer on their fields. The question was intended to refer to organic fertilizer, but given the high response rate, we have to assume that many respondents understood that the question referred to the application of chemical/inorganic fertilizer. It is worth noting the high prevalence of sustainable and climate‐smart agriculture practices common in the area. There is a general openness to climate‐smart agriculture, which represents another entry point for the MICCA Programme.
22
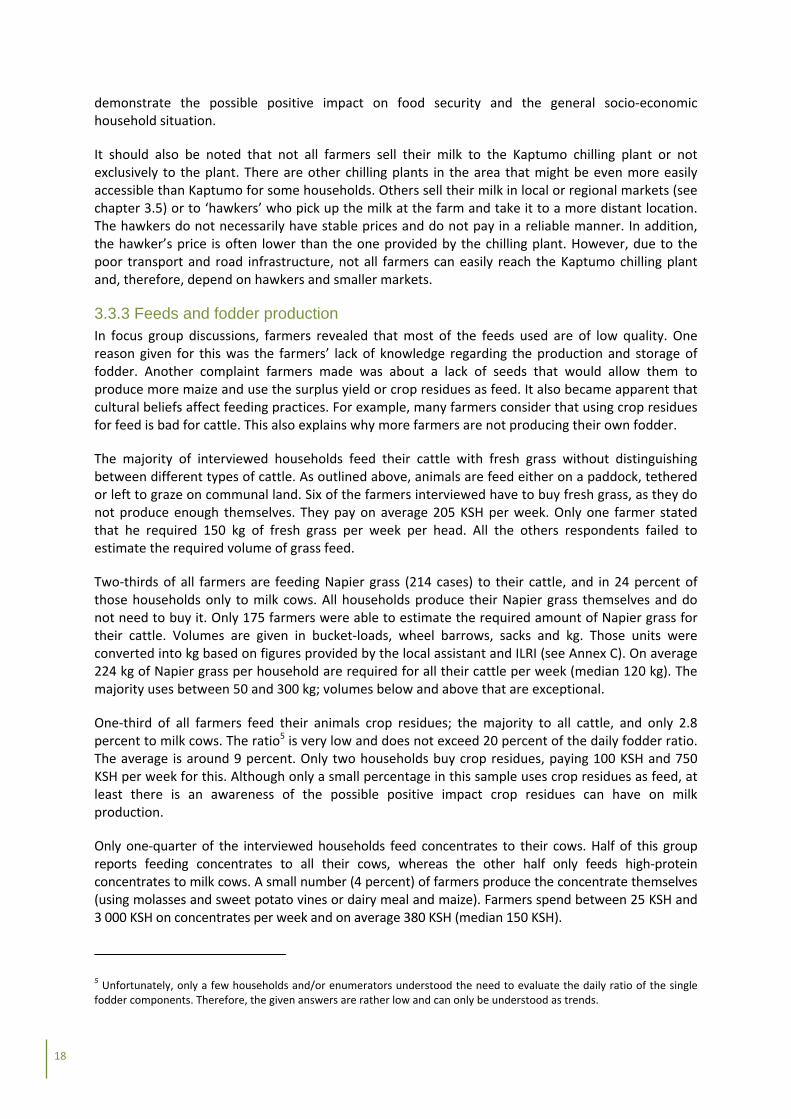
Graph 3. Techniques most beneficial to cropping and livestock
The most beneficial techniques for cropping and raising livestock are also the techniques practiced by most of the interviewees. Planting hedge rows is practiced by 91.2 percent of the interviewees. However, this practice is not considered to be very beneficial (It was only mentioned in a single case as being beneficial for cropping or livestock). In terms of techniques that benefit livestock, the application of manure is the most given answer. This can be explained by the fact that manure is applied to the Napier grass that the farmers cultivate themselves and possibly to crops whose residues are used as fodder.
Terraces can be beneficial because fodder, like Napier grass can then be planted along slopes and other fodder plants are not washed away by rains. Other techniques that could enhance fodder production, such as cover crops, double digging or crop rotation are not considered very beneficial for raising livestock.
The most important finding is that cropping techniques that can be considered as climate‐smart are commonly practiced in the project area. The general openness for and use of such techniques among the population is a good entry point for the MICCA Programme, which would be able to build on existing practices and expertise. Project interventions would not have to start from scratch, but could emphasize the benefits and impacts of existing practices when combined other techniques currently still ‘unpopular’. In almost half of the cases, the father of the family decided to use these practices, and in a quarter of cases the mother. Men as well as women should be considered as household decision makers, and both men and women should be considered in any project interventions.
3.4.3 Crop production All farmers engaged in cropping plant a broad variety of crops; 279 households plant up to 6 types of crops, 33 households have up to seven crops, and seven households cultivate eight different types of

23
crops. Maize is the predominant crop, (planted by 23.2 percent of all interviewees), followed by beans (14.9 percent), bananas (12.2 percent) and tea (12.1 percent). Napier grass is planted by 7.8 percent of all interviewees. However, enumerators in the first few days did not note when respondents said they planted grasses. From previous figures, we know we know that at least 214 households are feeding Napier grass to their cattle and produce it themselves. This is exactly double the numbers of responses to this question. In addition, vegetables (6.5 percent), avocados (6.3 percent) and potatoes (4.6 percent) are also relatively common. Other crops, cultivated by fewer households, are cabbages and kales, guava and passion fruits, yams and sweet potatoes, sugar cane, coffee and sorghum.
For each of the given crops the farmer estimated the plot size. At this point, it would be difficult to present the average plot sizes for each crop. This information can be extracted from the respective data table in annex B and might be valuable for emission calculations or other analyses. For evaluations in the coming years, rather than calculating the exact sizes of the different plots, it might be more worthwhile to see whether there have been changes in the crop selection, whether more crops or their residues are being used for fodder, and whether farmers decided to plant more resilient crops. Adding up all the plots used for the different crops, the survey found that 769.90 acres are being used for cropping activities by all farmers. The average size being cultivated by a farmer is 2.2 acres (median 1.5 acres), ranging from 0.03 to 20.59 acres.
The graphs below shows the different types of crops being treated with manure, inorganic fertilizer, pesticides and herbicides. The team leader and assistant explained the differences between these inputs to the respondents several times. Based on the high responses given for herbicides and pesticides, we have to assume that enumerators as well as interviewees are not fully aware of the difference.
Graph 4a. Inputs applied to crops (1)
24
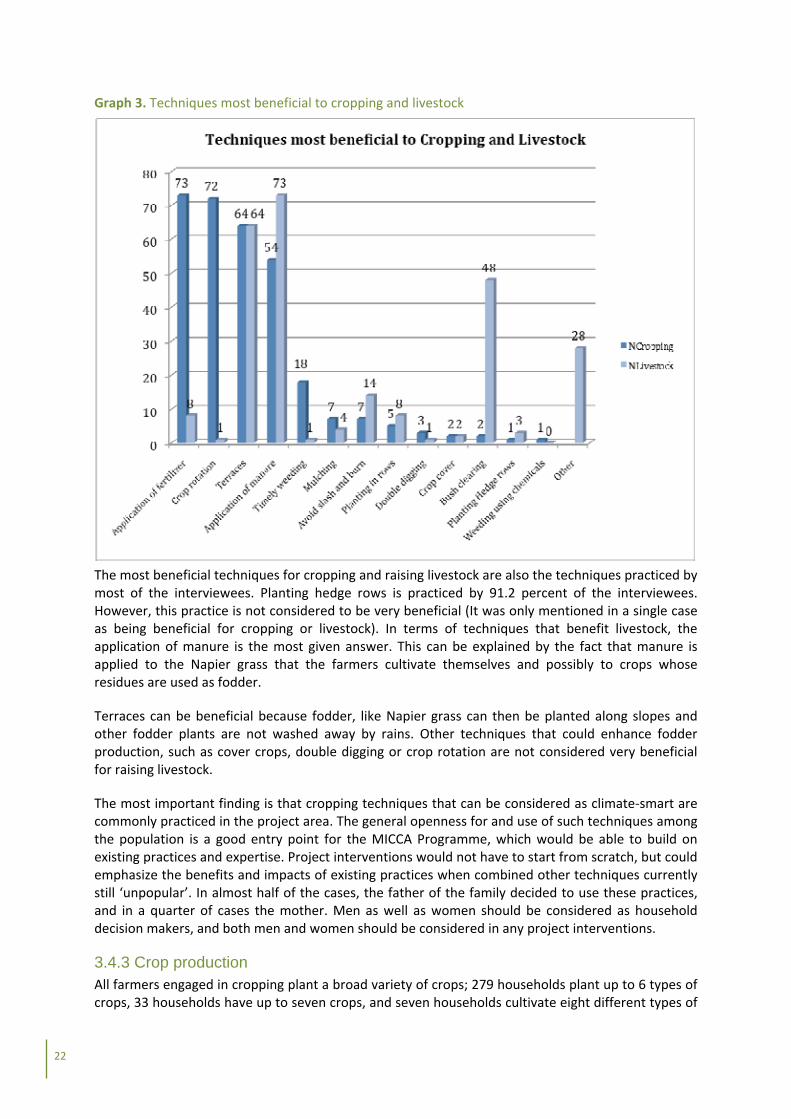
Graph 4b. Inputs applied to crops (2)
From graphs 4a and 4b it can be seen that manure is mainly applied to Napier grass and bananas, whereas fertilizer and other inorganic matter is mostly applied to maize and tea, the two predominant cash crops in the area. Avocados, tomatoes, passion fruits, coffee, kales, onion and potatoes are treated less often with inputs than others.
Except for Napier grass, all the other crops are marketed. The data show that all the tea produced is sold, whereas for most other crops, a portion is used for household consumption before selling the surplus.
Looking at the revenues from all crop sales, the average annnual income is between 25 000 KSH and 50 000 KSH per crop. Most revenues are generated from maize, tea, banana and bean production. Adding up all revenues from these crops, a household can make on average 212 020 KSH (median 62 000 KSH) per year by selling crops. In the sample, the minimum amount a household generated annually from crop production was 500 KSH and 6 027 700 KSH the maximum. For more detailed tables see. Annex B.
As mentioned in an earlier paragraph, the yields for project participants are higher than for non‐participants. This is also reflected in the income figures generated by crop sales.
Table 9. All annual revenue from all crops sales (in KSH)
All annual revenue from all sold crops (KSH)
PROJECT PARTICIPANTS NON‐PARTICIPANTS
Valid 127 204
Missing 8 17
Mean 338 989 133 910
Median 83 000 55 550
Minimum 1500 500
Maximum 6027700 2023500
Sum 43051542 27317520
The mean average income from crop sales for project participants is almost 40 percent higher than the sample average and 2.5 times higher than the mean average for non‐participants. Looking at median values, the difference is about 25 percent between the sample average and the average for
25
project participants, and 33 percent between project participants and non‐participants. Although EADD is not yet extensively promoting conservation agriculture or agricultural techniques in general, this is a noteworthy point. The differences could be explained by the fact that project participants have become more market oriented since joining the project and can afford more inputs due to increased income from milk. As a result they can generate higher yields than non‐participants. Although the absolute numbers have to be treated with caution due to small sample sizes, it is still a significant difference.
About one‐third of all interviewees also produce other agricultural goods including, eggs (48.7 percent), honey (19.2 percent), chicken (20 percent), sheep and goats (each 5 percent). In most cases, the livestock is kept on the farm and sold or slaughtered. Honey and eggs are also sold. The overall annual revenue from such additional goods averages 9 143 KSH (median 6 000 KSH). Only 10 percent of the respondents earn more than 20 000 KSH.
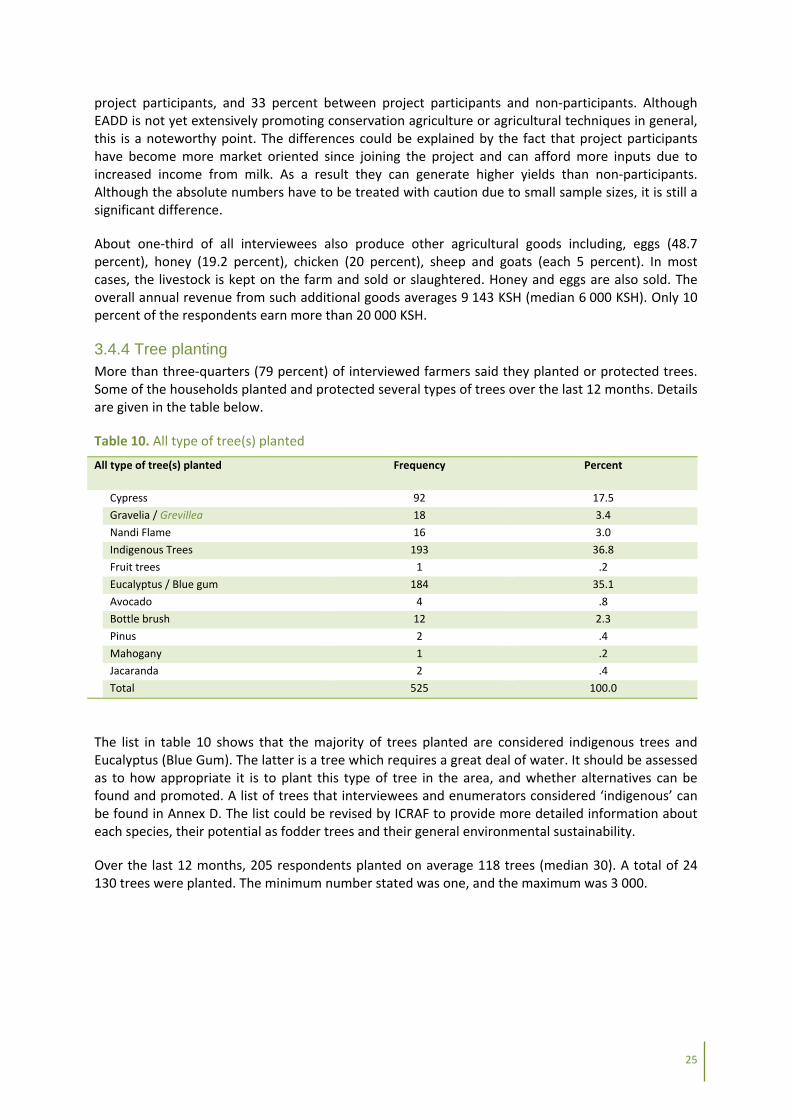
3.4.4 Tree planting More than three‐quarters (79 percent) of interviewed farmers said they planted or protected trees. Some of the households planted and protected several types of trees over the last 12 months. Details are given in the table below.
Table 10. All type of tree(s) planted
All type of tree(s) planted Frequency Percent
Cypress 92 17.5
Gravelia / Grevillea 18 3.4
Nandi Flame 16 3.0
Indigenous Trees 193 36.8
Fruit trees 1 .2
Eucalyptus / Blue gum 184 35.1
Avocado 4 .8
Bottle brush 12 2.3
Pinus 2 .4
Mahogany 1 .2
Jacaranda 2 .4
Total 525 100.0
The list in table 10 shows that the majority of trees planted are considered indigenous trees and Eucalyptus (Blue Gum). The latter is a tree which requires a great deal of water. It should be assessed as to how appropriate it is to plant this type of tree in the area, and whether alternatives can be found and promoted. A list of trees that interviewees and enumerators considered ‘indigenous’ can be found in Annex D. The list could be revised by ICRAF to provide more detailed information about each species, their potential as fodder trees and their general environmental sustainability.
Over the last 12 months, 205 respondents planted on average 118 trees (median 30). A total of 24 130 trees were planted. The minimum number stated was one, and the maximum was 3 000.
26
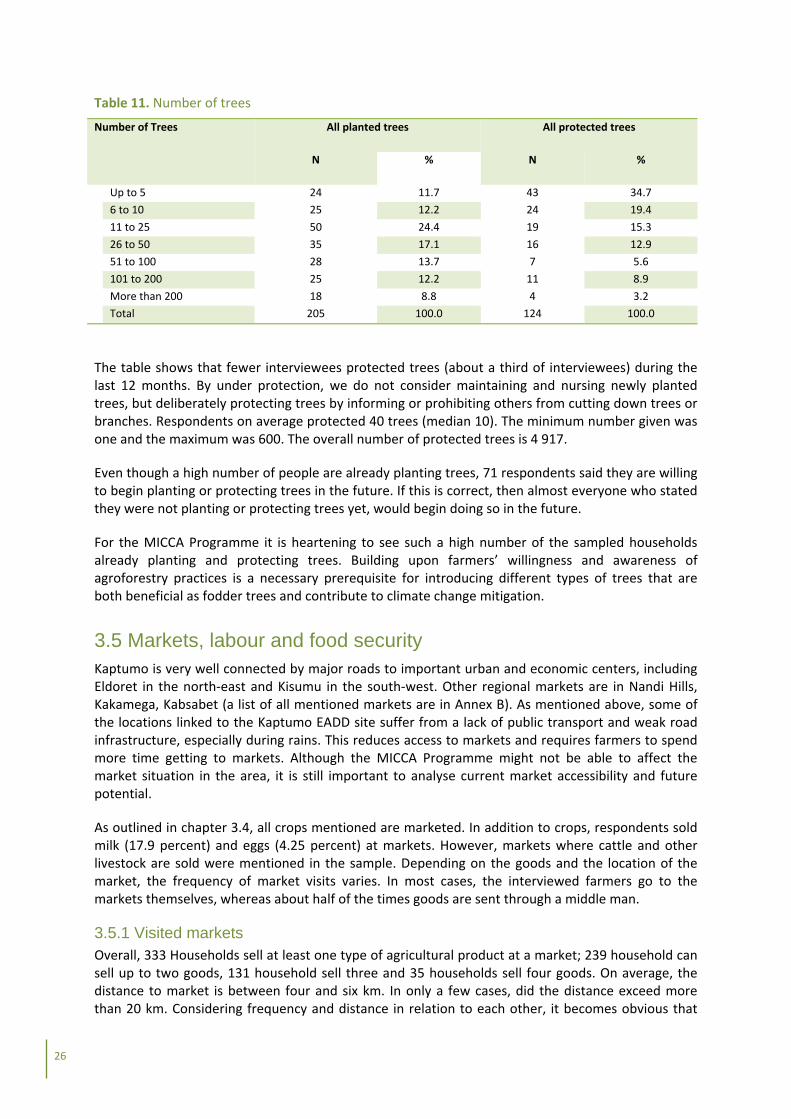
Table 11. Number of trees
Number of Trees All planted trees All protected trees
N % N %
Up to 5 24 11.7 43 34.7
6 to 10 25 12.2 24 19.4
11 to 25 50 24.4 19 15.3
26 to 50 35 17.1 16 12.9
51 to 100 28 13.7 7 5.6
101 to 200 25 12.2 11 8.9
More than 200 18 8.8 4 3.2
Total 205 100.0 124 100.0
The table shows that fewer interviewees protected trees (about a third of interviewees) during the last 12 months. By under protection, we do not consider maintaining and nursing newly planted trees, but deliberately protecting trees by informing or prohibiting others from cutting down trees or branches. Respondents on average protected 40 trees (median 10). The minimum number given was one and the maximum was 600. The overall number of protected trees is 4 917.
Even though a high number of people are already planting trees, 71 respondents said they are willing to begin planting or protecting trees in the future. If this is correct, then almost everyone who stated they were not planting or protecting trees yet, would begin doing so in the future.
For the MICCA Programme it is heartening to see such a high number of the sampled households already planting and protecting trees. Building upon farmers’ willingness and awareness of agroforestry practices is a necessary prerequisite for introducing different types of trees that are both beneficial as fodder trees and contribute to climate change mitigation.
3.5 Markets, labour and food security Kaptumo is very well connected by major roads to important urban and economic centers, including Eldoret in the north‐east and Kisumu in the south‐west. Other regional markets are in Nandi Hills, Kakamega, Kabsabet (a list of all mentioned markets are in Annex B). As mentioned above, some of the locations linked to the Kaptumo EADD site suffer from a lack of public transport and weak road infrastructure, especially during rains. This reduces access to markets and requires farmers to spend more time getting to markets. Although the MICCA Programme might not be able to affect the market situation in the area, it is still important to analyse current market accessibility and future potential.
As outlined in chapter 3.4, all crops mentioned are marketed. In addition to crops, respondents sold milk (17.9 percent) and eggs (4.25 percent) at markets. However, markets where cattle and other livestock are sold were mentioned in the sample. Depending on the goods and the location of the market, the frequency of market visits varies. In most cases, the interviewed farmers go to the markets themselves, whereas about half of the times goods are sent through a middle man.
3.5.1 Visited markets Overall, 333 Households sell at least one type of agricultural product at a market; 239 household can sell up to two goods, 131 household sell three and 35 households sell four goods. On average, the distance to market is between four and six km. In only a few cases, did the distance exceed more than 20 km. Considering frequency and distance in relation to each other, it becomes obvious that
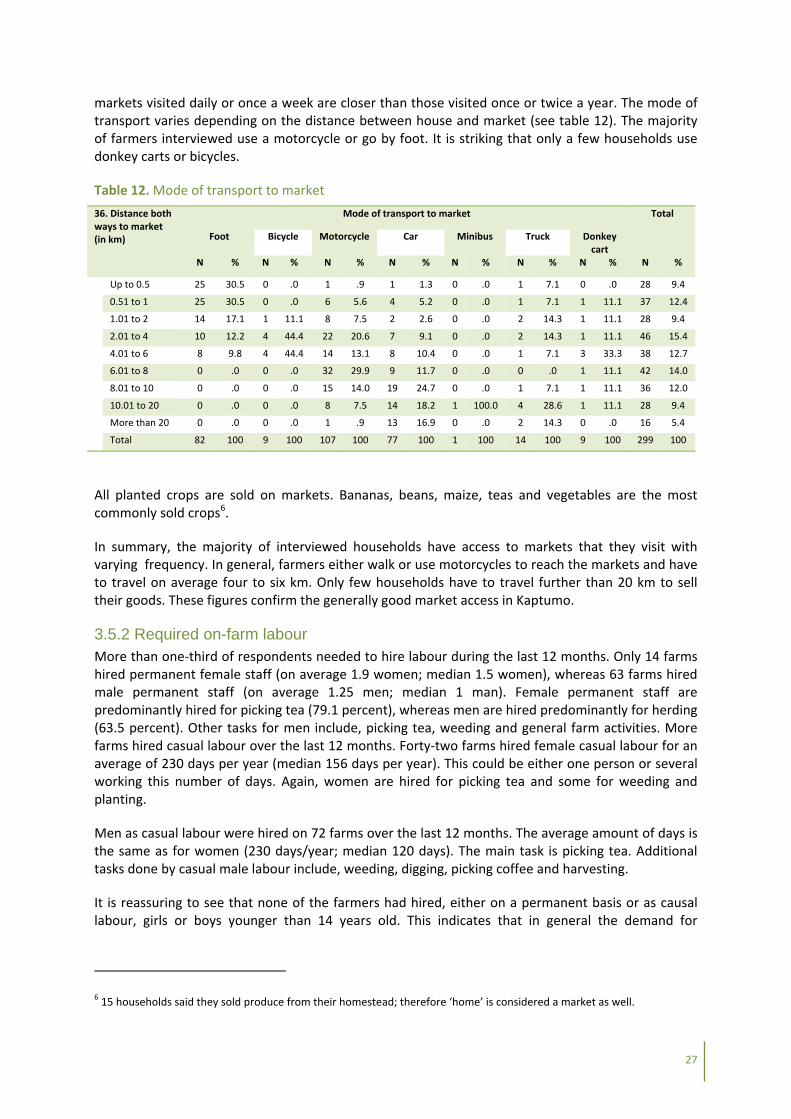
27
markets visited daily or once a week are closer than those visited once or twice a year. The mode of transport varies depending on the distance between house and market (see table 12). The majority of farmers interviewed use a motorcycle or go by foot. It is striking that only a few households use donkey carts or bicycles.
Table 12. Mode of transport to market
36. Distance both ways to market (in km)
Mode of transport to market Total
Foot Bicycle Motorcycle Car Minibus Truck Donkey cart
N % N % N % N % N % N % N % N %
Up to 0.5 25 30.5 0 .0 1 .9 1 1.3 0 .0 1 7.1 0 .0 28 9.4
0.51 to 1 25 30.5 0 .0 6 5.6 4 5.2 0 .0 1 7.1 1 11.1 37 12.4
1.01 to 2 14 17.1 1 11.1 8 7.5 2 2.6 0 .0 2 14.3 1 11.1 28 9.4
2.01 to 4 10 12.2 4 44.4 22 20.6 7 9.1 0 .0 2 14.3 1 11.1 46 15.4
4.01 to 6 8 9.8 4 44.4 14 13.1 8 10.4 0 .0 1 7.1 3 33.3 38 12.7
6.01 to 8 0 .0 0 .0 32 29.9 9 11.7 0 .0 0 .0 1 11.1 42 14.0
8.01 to 10 0 .0 0 .0 15 14.0 19 24.7 0 .0 1 7.1 1 11.1 36 12.0
10.01 to 20 0 .0 0 .0 8 7.5 14 18.2 1 100.0 4 28.6 1 11.1 28 9.4
More than 20 0 .0 0 .0 1 .9 13 16.9 0 .0 2 14.3 0 .0 16 5.4
Total 82 100 9 100 107 100 77 100 1 100 14 100 9 100 299 100
All planted crops are sold on markets. Bananas, beans, maize, teas and vegetables are the most commonly sold crops6.
In summary, the majority of interviewed households have access to markets that they visit with varying frequency. In general, farmers either walk or use motorcycles to reach the markets and have to travel on average four to six km. Only few households have to travel further than 20 km to sell their goods. These figures confirm the generally good market access in Kaptumo.
3.5.2 Required on-farm labour More than one‐third of respondents needed to hire labour during the last 12 months. Only 14 farms hired permanent female staff (on average 1.9 women; median 1.5 women), whereas 63 farms hired male permanent staff (on average 1.25 men; median 1 man). Female permanent staff are predominantly hired for picking tea (79.1 percent), whereas men are hired predominantly for herding (63.5 percent). Other tasks for men include, picking tea, weeding and general farm activities. More farms hired casual labour over the last 12 months. Forty‐two farms hired female casual labour for an average of 230 days per year (median 156 days per year). This could be either one person or several working this number of days. Again, women are hired for picking tea and some for weeding and planting.
Men as casual labour were hired on 72 farms over the last 12 months. The average amount of days is the same as for women (230 days/year; median 120 days). The main task is picking tea. Additional tasks done by casual male labour include, weeding, digging, picking coffee and harvesting.
It is reassuring to see that none of the farmers had hired, either on a permanent basis or as causal labour, girls or boys younger than 14 years old. This indicates that in general the demand for
6 15 households said they sold produce from their homestead; therefore ‘home’ is considered a market as well.

28
_
Picture 4: Wooden granary
additional labour is for tea plantations and livestock herding. The work load or demand for additional staff for cropping tasks seems rather low.
3.5.3 Food security About 80 percent of all interviewees stated they were able to provide food for their household primarily from their own production. Only two households were never able to provide food for their families. All the others were sometimes able to provide food from their own production. These numbers confirm findings in chapter 3.4 indicating that the majority of respondents produce agricultural goods for their own consumption and sell the surplus.
Table 13. Number of months able to provide food from own farm
Number of months able to provide food from own farm
Frequency Percent Valid Percent
1‐3 months per year 14 3.9 4.0
Up to 6 months per year 35 9.8 9.9
Up to 9 months per year 66 18.5 18.6
The whole year 142 39.8 40.1
Even more than a year 1 .3 .3
Very irregular 96 26.9 27.1
Total 354 99.2 100.0
The table shows that the area must be somewhat affluent with 40 percent of respondents able provide food for the whole year and about one‐third able to provide food for up to six or nine months. On the other hand, a third of households can only provide food on an irregular basis from their own production.
To be able to provide food all year round, a system for storing food (or fodder) is essential. About two‐thirds of interviewees store food or fodder. The majority use wooden granaries as shown in picture 4. About one‐third of all farmers store food, and one‐quarter store both food and fodder. On average, storage capacity varies between 3 510 kg to 3 913 kg. The MICCA Programme would like to see storage capacity increase further. Increased food storage capacity would help ensure food security, and more storage for fodder crops and dried fodder might encourage farmers to produce more fodder on‐farm.
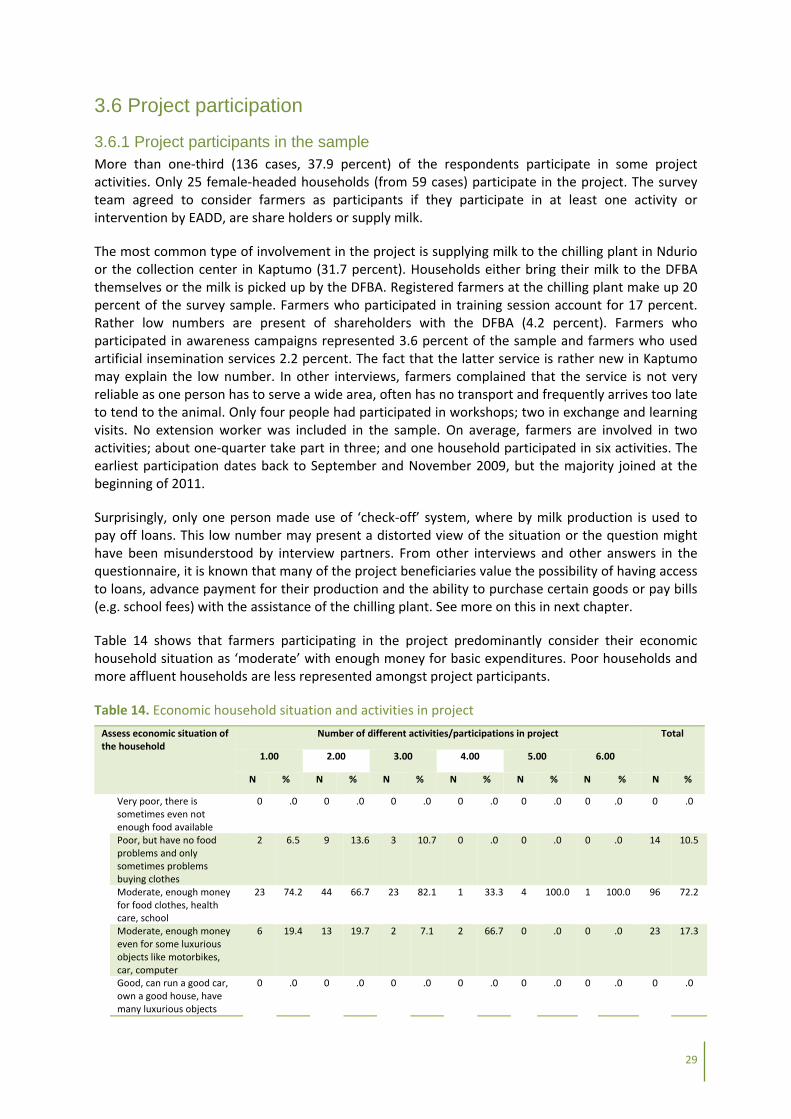
29
3.6 Project participation
3.6.1 Project participants in the sample More than one‐third (136 cases, 37.9 percent) of the respondents participate in some project activities. Only 25 female‐headed households (from 59 cases) participate in the project. The survey team agreed to consider farmers as participants if they participate in at least one activity or intervention by EADD, are share holders or supply milk.
The most common type of involvement in the project is supplying milk to the chilling plant in Ndurio or the collection center in Kaptumo (31.7 percent). Households either bring their milk to the DFBA themselves or the milk is picked up by the DFBA. Registered farmers at the chilling plant make up 20 percent of the survey sample. Farmers who participated in training session account for 17 percent. Rather low numbers are present of shareholders with the DFBA (4.2 percent). Farmers who participated in awareness campaigns represented 3.6 percent of the sample and farmers who used artificial insemination services 2.2 percent. The fact that the latter service is rather new in Kaptumo may explain the low number. In other interviews, farmers complained that the service is not very reliable as one person has to serve a wide area, often has no transport and frequently arrives too late to tend to the animal. Only four people had participated in workshops; two in exchange and learning visits. No extension worker was included in the sample. On average, farmers are involved in two activities; about one‐quarter take part in three; and one household participated in six activities. The earliest participation dates back to September and November 2009, but the majority joined at the beginning of 2011.
Surprisingly, only one person made use of ‘check‐off’ system, where by milk production is used to pay off loans. This low number may present a distorted view of the situation or the question might have been misunderstood by interview partners. From other interviews and other answers in the questionnaire, it is known that many of the project beneficiaries value the possibility of having access to loans, advance payment for their production and the ability to purchase certain goods or pay bills (e.g. school fees) with the assistance of the chilling plant. See more on this in next chapter.
Table 14 shows that farmers participating in the project predominantly consider their economic household situation as ‘moderate’ with enough money for basic expenditures. Poor households and more affluent households are less represented amongst project participants.
Table 14. Economic household situation and activities in project
Assess economic situation of the household
Number of different activities/participations in project Total
1.00 2.00 3.00 4.00 5.00 6.00
N % N % N % N % N % N % N %
Very poor, there is sometimes even not enough food available
0 .0 0 .0 0 .0 0 .0 0 .0 0 .0 0 .0
Poor, but have no food problems and only sometimes problems buying clothes
2 6.5 9 13.6 3 10.7 0 .0 0 .0 0 .0 14 10.5
Moderate, enough money for food clothes, health care, school
23 74.2 44 66.7 23 82.1 1 33.3 4 100.0 1 100.0 96 72.2
Moderate, enough money even for some luxurious objects like motorbikes, car, computer
6 19.4 13 19.7 2 7.1 2 66.7 0 .0 0 .0 23 17.3
Good, can run a good car, own a good house, have many luxurious objects
0 .0 0 .0 0 .0 0 .0 0 .0 0 .0 0 .0

30
Total 31 100 66 100 28 100 3 100 4 100 1 100 133 100
For EADD and the MICCA Programme it is noteworthy that none of the six very poor households in the sample are project participants, and only 14 households out of 57 households that consider themselves as poor are participating in the project. There are two possible reasons for this: (i) the project is so successful that farmers who participate in the project do not consider themselves poor anymore or (ii) poor households cannot afford cattle and so do not produce milk, making them ineligible to participate in the project. Given that the MICCA Programme focuses on contributing to food security, this is an important aspect that requires further research.
In half of all households (135) a man made the decision to join the project. About one‐third of the decisions were made by female members of the house. In the other cases, the decision was made by men and women together. Consequently any intervention planned by the MICCA Programme would need to address women and men equally as both are decision makers on household level.
Based on responses from the household questionnaire and focus groups, the main reasons for joining the project are price stability and increased pay, both of which lead to higher incomes. Only a few respondents joined the project for access to better animal breeds or farm services. Due to awareness raising activities and specific MICCA Programme training sessions focusing on climate‐smart agricultural practices, fodder production and manure management may also be reasons why farmers want to join the project.
3.6.2 Investments and current costs When asked about the initial investments for joining the project, only 126 interviewees gave a repsonse. Almost three‐quarters had initial investment costs, whereas a third did not have any expenditures.
Table 15. Investments and costs (in KSH)
Investments and costs (in KSH)
Initial investment Total
Membership fee
Share Registration fee Purchase of animals
N % N % N % N % N %
100 48 78.7 0 .0 15 83.3 0 .0 63 70.0
200 1 1.6 0 .0 0 .0 0 .0 1 1.1
500 3 4.9 0 .0 0 .0 0 .0 3 3.3
800 0 .0 0 .0 1 5.6 0 .0 1 1.1
1000 9 14.8 7 77.8 1 5.6 0 .0 17 18.9
1100 0 .0 2 22.2 1 5.6 0 .0 3 3.3
16000 0 .0 0 .0 0 .0 1 50.0 1 1.1
26000 0 .0 0 .0 0 .0 1 50.0 1 1.1
Total 61 100.0 9 100.0 18 100.0 2 100.0 90 100.0
Table 15 shows that the majority of respondents spent money on shares, membership fees and registration fees. Very few houses had to purchase animals, equipment or land. Taking all initial payments into account, households made initial investments of 3 480 KSH (median 100 KSH). The big difference between median and mean can be explained by the fact that the majority of expenditures were allocated to registration fees (one‐time payment of 100 KSH). In addition, other expenditures are primarily EADD‐related investments, such as the registration fees, equipment for cattle and veterinary services, and not necessarily an indicator for investments required for climate‐smart agriculture.

31
EADD offers participants the possibility to become a shareholder in the DFBA of Kaptumo chilling plant, with the standard price set at 1 000 KSH. A one‐time membership/registration fee of 100 KSH also needs to be paid to access certain services. However, farmers who only supply their milk to the DFBA do not necessarily need to pay a registration fee. The statistics on memberships or shareholders do not accurately reflect how many farmers are actually supplying milk, as they omit unregistered milk suppliers. A more reliable figure on milk suppliers is provided by the monthly payment books/cards managed by the DFBA staff.
Expenditures for animals (between 18 000 and 26 000 KSH), equipment (20 000 KSH) and land (150 000 KSH) has been necessary only for single households. Those expenditures are also not necessarily used for climate‐smart agriculture activities. None of the interviewees explicitly said they spent money on equipment for activities to increase fodder production, plant trees, etc.
More than half of the project participants (65 cases) have regular ongoing costs. Three out of 65 households have to pay for labour (between 5 000 and 18 000 KSH per year); six have additional costs for equipment (350 to 2 400 KSH); seven have additional costs for other resources, like drugs and fodder (4 000 to 24 000 KSH); and 13 farmers now pay for veterinary services (200 to 15 000 KSH) on a regular annual basis. 56 households declared that they require more time for agricultural work now; on average 349 hours per year (median 365 h per year) with a minimum of twelve hours per year up to 1 095 hours per year.
The overall amount of ongoing costs (excluding shares, membership fees and additional time) could only be calculated for 21 cases (The majority of the 65 cases only mentioned the need additional time but no fiscal expenses). These ongoing costs average 8 588 KSH (median 5 000 KSH) and range from 350 KSH to 39 700 KSH per year. These costs represent 3.5 percent of the balanced annual household income (0.4 percent of the median annual household income) – a relatively low additional costs for the household.
Again, the main expenditures are allocated to livestock related issues including veterinary services, drugs, fodder and labour (to herd or milk the animals). No significant conclusion can be drawn in regard to expenditures for climate‐smart agriculture, as they are mostly EADD‐ and livestock‐related costs.
3.6.3 Evaluation of project and benefits Almost 90 percent of all project participants see more benefits in project participation than disadvantages. Seven percent see the benefits and disadvantages evenly balanced, and only 3.9 percent of the respondents see more disadvantages.
The main benefits mentioned were access to loans (37.3 percent), followed by improved income (24 percent) and reliable pay (15.7 percent). The two latter aspects are similar to responses given regarding the reasons for joining the project. One can conclude that participants’ expectations when they joined the project have been realized, and that benefits continue to be perceived. Other livestock‐related answers regarding benefits, such as access to artificial insemination, transport of milk, better markets for milk and improved animal health were given by individual households. A benefit mentioned by 4.1 percent of the respondents was training and gaining knowledge. This could be an entry point to build on for the MICCA Programme in its ongoing cooperation with EADD.
The disadvantages are seen as less‐than‐expected payments and milk rejection. Others gave personal reasons. Overall only ten famers mentioned disadvantages.
Since joining the project, three‐quarters of the interviewed project participants have seen an increase in their income. The main reason for the increase is additional milk production (82.3

32
percent) and generally healthier more productive animals (15.2 percent). Project participation led to an additional average annual income of 7 243 KSH (median 3 560 KSH) for 75 households. This minimum increase was 1 000 KSH, and the maximum was 36 000 KSH per year. The detailed distribution of income from additional sources of income is outlined below:
Table 16. Additional income due to additional source of income
Additional income in KSH in last 12 months for type 1
First type of additional income / business Total
Healthier animals
Additional milk Higher price per liter milk
Selling clothes
N % N % N % N % N %
Up to 1500 4 33.3 7 11.5 0 .0 0 .0 11 14.7
1501 to 2000 1 8.3 11 18.0 0 .0 0 .0 12 16.0
2001 to 3000 2 16.7 11 18.0 0 .0 0 .0 13 17.3
3001 to 4000 2 16.7 8 13.1 0 .0 0 .0 10 13.3
4001 to 8000 0 .0 9 14.8 1 100.0 0 .0 10 13.3
8001 to 12000 2 16.7 3 4.9 0 .0 0 .0 5 6.7
More than 12000 1 8.3 12 19.7 0 .0 1 100.0 14 18.7
Total 12 100.0 61 100.0 1 100.0 1 100.0 75 100.0
3.7 Non-participants Based on the numbers above, 135 households consider themselves as project participants, with 222 households not participating in any EADD imitative and not supplying milk to the chilling plant. As some interview partners often did not necessarily know how to respond, the overall sample size of non‐participants is reduced for some questions.
3.7.1 Reasons for non-participation In half of the cases, the father made the decision not to join the project. In about one‐third of the households, women made the decision. In less than 10 percent of the households, the decision was made jointly by men and women. The remaining households either did not know who made the decision or were not informed about the project, so did not have to make a decision.
The main reasons farmers gave for not participating in the project was lack of sufficient quantities of milk (40.3 percent) and lack the required knowledge and training about the project or livestock breeding (23.7 percent). Almost 10 percent of non‐participants do not have any cows. Single cases mentioned delayed payments, lack of finances, project costs (either the membership fee or the share) and personal reasons. Apparently, initiatives like the chilling plant had failed in the past (even the DFBA reports this). Some farmers are afraid that the project will also fail and are hesitant to join. Another complaint expressed is that a large share of the milk price is taken by Savings and Credit Co‐operative Society (SACCO)7 which reduces farmers’ income.
As indicated above, project costs are rather low. There may have been misunderstandings and rumors that created the impression of exaggerated participation costs. To avoid such misconceptions, more awareness raising activities may be required highlighting the actual costs of joining the project and describing the possible benefits and additional revenue.
7 SACCO is cooperatve that offer loans and micro‐credit facilities to their members. Farmers use those facilities to ask for loans and pay off school fees, health services and the like. The DFBA works as a guarantor by offering the ‘check‐off’, meaning farmers can pay off their loans with produced milk.

33
3.7.2 Requirements and willingness to join Many diverse answers were given about farmers’ needs before joining the project.
Graph 5. Requirements to join project
Graph 5 shows that the main requirement farmers requested to join the project was more training; demonstration of successful examples; assurances of immediate and direct benefits and revenue; lower costs of initial investments; and generally more assistance from the project. Aspects regarding labour and equipment were not as important. This graph and other given answers show that finances are the main issue in this area. Farmers want to invest less and see direct results.
When asked about their willingness to invest to improve agricultural yields, the majority of farmers said they would be willing to invest on average 13 860 KSH as a one‐time investment (median 4 000 KSH). The minimum amount was 200 KSH and the maximum 200 000 KSH. A Comparison of this number with the actual investment required to join the project indicates that farmers would be willing to spend almost 4 times the average amount actually required as an investment when joining the project (taking the mean amount it is 40 times more).
Table 17. Ratio of investments willing to make (in KSH)
Ratio of investments willing to make (in KSH) Investment willing to make (mean)
Investment willing to make (median)
13860 4000
Investment for project participation (mean) (by project participants)
3480 398%
Investment for project participation (median) (by project participants)
100 4000%
Annual balanced hh income KSH (mean)
242062 5.7%
Annual balanced hh income KSH (median)
117600 3.4%
Annual ongoing costs (mean) 8588 161.4%
Annual ongoing costs (median) 500 800%
In relation to the average household income (balanced), the amount farmers would be willing to invest represents 5.7 percent of the average annual income (mean) and 3.4 percent of the median
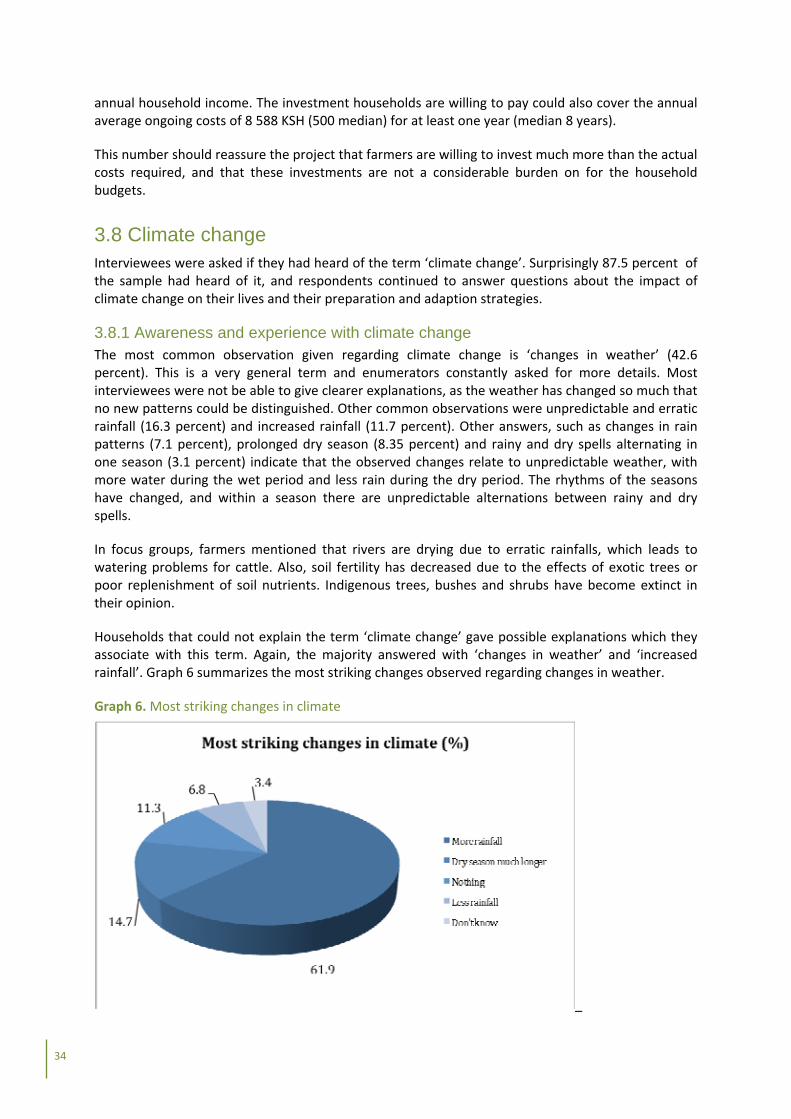
34
annual household income. The investment households are willing to pay could also cover the annual average ongoing costs of 8 588 KSH (500 median) for at least one year (median 8 years).
This number should reassure the project that farmers are willing to invest much more than the actual costs required, and that these investments are not a considerable burden on for the household budgets.
3.8 Climate change Interviewees were asked if they had heard of the term ‘climate change’. Surprisingly 87.5 percent of the sample had heard of it, and respondents continued to answer questions about the impact of climate change on their lives and their preparation and adaption strategies.
3.8.1 Awareness and experience with climate change The most common observation given regarding climate change is ‘changes in weather’ (42.6 percent). This is a very general term and enumerators constantly asked for more details. Most interviewees were not be able to give clearer explanations, as the weather has changed so much that no new patterns could be distinguished. Other common observations were unpredictable and erratic rainfall (16.3 percent) and increased rainfall (11.7 percent). Other answers, such as changes in rain patterns (7.1 percent), prolonged dry season (8.35 percent) and rainy and dry spells alternating in one season (3.1 percent) indicate that the observed changes relate to unpredictable weather, with more water during the wet period and less rain during the dry period. The rhythms of the seasons have changed, and within a season there are unpredictable alternations between rainy and dry spells.
In focus groups, farmers mentioned that rivers are drying due to erratic rainfalls, which leads to watering problems for cattle. Also, soil fertility has decreased due to the effects of exotic trees or poor replenishment of soil nutrients. Indigenous trees, bushes and shrubs have become extinct in their opinion.
Households that could not explain the term ‘climate change’ gave possible explanations which they associate with this term. Again, the majority answered with ‘changes in weather’ and ‘increased rainfall’. Graph 6 summarizes the most striking changes observed regarding changes in weather.
Graph 6. Most striking changes in climate
_

35
These results are in line with the statements given by the interviewees that they observe more rainfall and prolonged dry seasons. They indicate that climate change is predominantly experienced by less or more water, rather than through changes in temperature or other indicators.
For almost a quarter of all respondents, the most striking impact of climate change on their families are increased diseases, such as flu and pneumonia. This accounts for the second most commonly stated impact of climate change: increased expenditures on such things as drugs, medication and warmer clothing. Food expenditures have also increased as a result of destroyed crops. The impacts are closely interrelated: the destruction of crops causes lower yields, which reduces production, causing food shortages, lowering household incomes and increasing household expenditures on food and other items.
Graph 7. Impact on families due to climate change
The above trends are reflected in the answers regarding the impact of climate change on agriculture and livestock. About one‐third of respondents emphasized the reduced production and yields (30.3 percent) resulting of climate change, whereas 14.8 percent mention the death of livestock. A decrease in milk production was observed by 12.6 percent of the respondents and the destruction of crops by 12 percent. Erosion is mentioned by 7.3 percent of the respondents in the household‐based questionnaire, but it is mentioned very often in focus group discussions.
On the other hand, some farmers have also seen some positive impact due to climate change, noting an increase in farm production (2.5 percent), improved milk production (2.2 percent), and more available feed (1.4 percent). No changes at all were observed by 3.1 percent of the farmers.
3.8.2 Adaptation and preparedness When asked how they have modified their agriculture and livestock practices as a result of observed climate change, almost one‐quarter of the farmers said they have made no changes at all. About 10 percent had started to build terraces to adapt to the increase in rainfall (to avoid erosion) and use slopes for cropping. Another 10 percent reduced their herd to require less fodder and land and concentrated on improving the milk production of the smaller herd. Some other responses to climate change mentioned by less than 10 percent of the respondents include, changing to crops that prefer
36
drier conditions, grow faster and produce higher yields (8.2 percent); changing planting practices, such as planting in rows (6.8 percent); planting cover crops; using manure or double digging; building sheds to protect livestock, especially against hailstorms (6.8 percent); and growing animal feed (5.3 percent).
Strategies to prepare for future changes resulting from climate variability are similar to those already made, but there are some variations. The same number of people who had made no changes yet are not planning to change anything in the future either. The most common answer regarding future preparedness was building sheds (19.5 percent) followed by timely planting and harvesting (16.4 percent). Building terraces (9.2 percent), building and using a food or fodder storage container (6.2 percent), growing other crops (5.8 percent) and growing trees (5.1 percent) were also mentioned. Again, fodder or livestock related issues were not often mentioned.
Farmers in focus group discussions spoke about reducing deforestation and increasing afforestation. They want to avoid planting exotic trees, which have had a negative impact on soils. To control erosion, they increase terracing and generally reduce farming on sloppy and swampy grounds.
From the given answers it is clear that the farmers can easily identify the observed changes in weather. However, the reasons they give for these changes are mainly examples of changes in weather, rather than explanations for why these changes occur. In focus groups interview, partners were aware that their activities also contribute to such changes in the weather. Clearing forests to plant food crops, farming of sloppy and swampy grounds and overstocking are seen as factors created by the farmers themselves that cause environmental degradation.
Cropping is obviously the main factor where the impact of climate change can be observed and where farmers already have made changes to adapt to the changing conditions. There is clearly room to implement more adaptive strategies. The need to assist farmers with cropping techniques and crop selection could be the main contribution of the MICCA Programme’s cooperation with EADD. As mentioned above, climate‐smart agriculture techniques and the right crop selection for food and fodder production could be sustainable approaches to local climate change mitigation and adaptation strategies.
3.9 Household economics This chapter looks at the different sources of household revenue and the actual income rendered from it. It also assesses the economic household situation of respondents and how the household economic situation might impact other issues of interest for the MICCA Programme.
3.9.1 Sources of revenues Interviewees were asked to state the source of revenue for each economically active household member. Even though family members worked on the same farm, income from their ‘own’ agriculture and livestock has been noted separately. However, it is difficult to distinguish for each family member working on the same farm a specific ‘income’. For this reason, one household income was calculated for all economically active household members. The majority of interviewees mentioned several sources of revenue for one economically active household member. 293 households have at least two economically active household members; 61 households have up to three economically active household members; 23 households have up to four economically active members; and ten households have up to five economically active household members.

37
Graph 8. All sources of revenue
Graph 8 clearly shows that the majority of all economically active household members in the sample cultivate their own crops (46.6 percent) and have their own livestock (39.8 percent). Some government employees (4.5 percent) and privately employed persons (2.4 percent) are also inlcuded. It must be stated that these persons are also likely to have cultivate their own crops and raise livestock, and therefore appear in both categories. The self‐employed, which includes shop and other business owners accounted for 3.4 percent of the respondents. Only single cases are seasonal workers or paid farm labourers. Only one respondent receives assistance from the government. Sixteen respondents receive a pension.
As stated earlier, the majority of farmers both cultivate crops and raise livestock. The number of farmers practicing only one of these activities is very low. Only four households do not have any economically active household member. We have to assume that these households either refused to answer this question or practice subsistence farming and do not consider the self‐consumed yields as an income. Other than these four households, all the other households (353) have at least one economically active household member.
The majority of respondents working as a government employee earn between 100 000 KSH and 600 000 KSH per year. Ten of these respondents make even more. Farmers mostly make between 50 000 and 400 000 KSH from agriculture and livestock production. Although the groups are very different in their sizes, these figures indicate that more money can be made from paid labour in government structures than in agriculture.
Household income is calculated on the basis of revenue from the sale of crops, livestock and other farming products, and the other paid economic activities that have been mentioned. These numbers must be treated with caution, as individuals tend to give unrealistic estimates that are intended to reflect favorably on the project. We therefore understand the given numbers and further calculations based on those figures represent estimates rather than exact and fully reliable data.
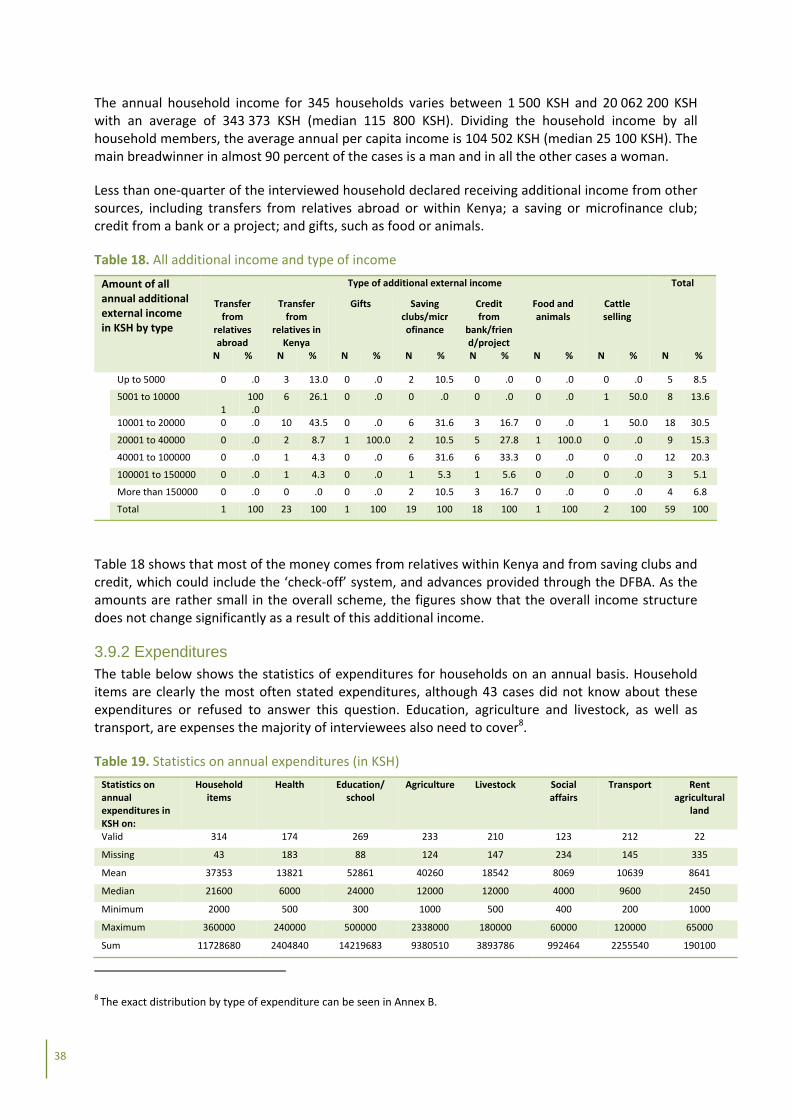
38
The annual household income for 345 households varies between 1 500 KSH and 20 062 200 KSH with an average of 343 373 KSH (median 115 800 KSH). Dividing the household income by all household members, the average annual per capita income is 104 502 KSH (median 25 100 KSH). The main breadwinner in almost 90 percent of the cases is a man and in all the other cases a woman.
Less than one‐quarter of the interviewed household declared receiving additional income from other sources, including transfers from relatives abroad or within Kenya; a saving or microfinance club; credit from a bank or a project; and gifts, such as food or animals.
Table 18. All additional income and type of income
Amount of all annual additional external income in KSH by type
Type of additional external income Total
Transfer from
relatives abroad
Transfer from
relatives in Kenya
Gifts Saving clubs/microfinance
Credit from
bank/friend/project
Food and animals
Cattle selling
N % N % N % N % N % N % N % N %
Up to 5000 0 .0 3 13.0 0 .0 2 10.5 0 .0 0 .0 0 .0 5 8.5
5001 to 10000 1
100.0
6 26.1 0 .0 0 .0 0 .0 0 .0 1 50.0 8 13.6
10001 to 20000 0 .0 10 43.5 0 .0 6 31.6 3 16.7 0 .0 1 50.0 18 30.5
20001 to 40000 0 .0 2 8.7 1 100.0 2 10.5 5 27.8 1 100.0 0 .0 9 15.3
40001 to 100000 0 .0 1 4.3 0 .0 6 31.6 6 33.3 0 .0 0 .0 12 20.3
100001 to 150000 0 .0 1 4.3 0 .0 1 5.3 1 5.6 0 .0 0 .0 3 5.1
More than 150000 0 .0 0 .0 0 .0 2 10.5 3 16.7 0 .0 0 .0 4 6.8
Total 1 100 23 100 1 100 19 100 18 100 1 100 2 100 59 100
Table 18 shows that most of the money comes from relatives within Kenya and from saving clubs and credit, which could include the ‘check‐off’ system, and advances provided through the DFBA. As the amounts are rather small in the overall scheme, the figures show that the overall income structure does not change significantly as a result of this additional income.
3.9.2 Expenditures The table below shows the statistics of expenditures for households on an annual basis. Household items are clearly the most often stated expenditures, although 43 cases did not know about these expenditures or refused to answer this question. Education, agriculture and livestock, as well as transport, are expenses the majority of interviewees also need to cover8.
Table 19. Statistics on annual expenditures (in KSH)
Statistics on annual expenditures in KSH on:
Household items
Health Education/ school
Agriculture Livestock Social affairs
Transport Rent agricultural
land
Valid 314 174 269 233 210 123 212 22
Missing 43 183 88 124 147 234 145 335
Mean 37353 13821 52861 40260 18542 8069 10639 8641
Median 21600 6000 24000 12000 12000 4000 9600 2450
Minimum 2000 500 300 1000 500 400 200 1000
Maximum 360000 240000 500000 2338000 180000 60000 120000 65000
Sum 11728680 2404840 14219683 9380510 3893786 992464 2255540 190100
8 The exact distribution by type of expenditure can be seen in Annex B.
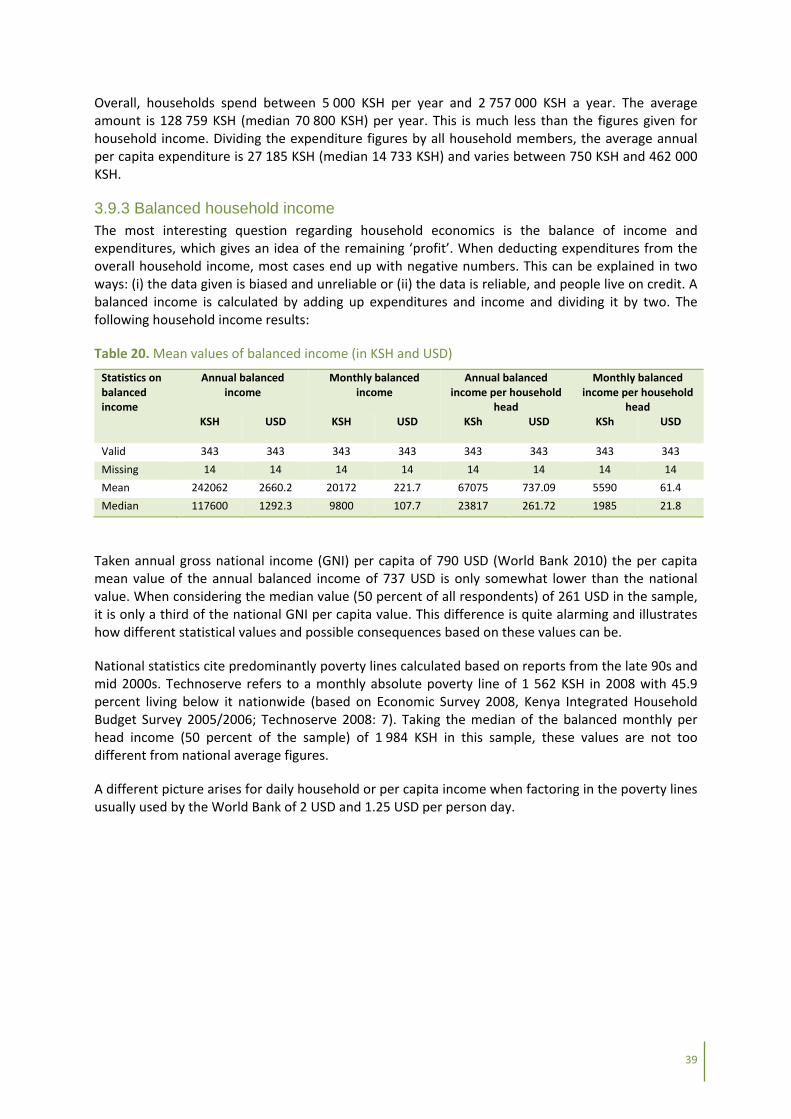
39
Overall, households spend between 5 000 KSH per year and 2 757 000 KSH a year. The average amount is 128 759 KSH (median 70 800 KSH) per year. This is much less than the figures given for household income. Dividing the expenditure figures by all household members, the average annual per capita expenditure is 27 185 KSH (median 14 733 KSH) and varies between 750 KSH and 462 000 KSH.
3.9.3 Balanced household income The most interesting question regarding household economics is the balance of income and expenditures, which gives an idea of the remaining ‘profit’. When deducting expenditures from the overall household income, most cases end up with negative numbers. This can be explained in two ways: (i) the data given is biased and unreliable or (ii) the data is reliable, and people live on credit. A balanced income is calculated by adding up expenditures and income and dividing it by two. The following household income results:
Table 20. Mean values of balanced income (in KSH and USD)
Statistics on balanced income
Annual balanced income
Monthly balanced income
Annual balanced income per household
head
Monthly balanced income per household
head KSH USD KSH USD KSh USD KSh USD
Valid 343 343 343 343 343 343 343 343
Missing 14 14 14 14 14 14 14 14
Mean 242062 2660.2 20172 221.7 67075 737.09 5590 61.4
Median 117600 1292.3 9800 107.7 23817 261.72 1985 21.8
Taken annual gross national income (GNI) per capita of 790 USD (World Bank 2010) the per capita mean value of the annual balanced income of 737 USD is only somewhat lower than the national value. When considering the median value (50 percent of all respondents) of 261 USD in the sample, it is only a third of the national GNI per capita value. This difference is quite alarming and illustrates how different statistical values and possible consequences based on these values can be.
National statistics cite predominantly poverty lines calculated based on reports from the late 90s and mid 2000s. Technoserve refers to a monthly absolute poverty line of 1 562 KSH in 2008 with 45.9 percent living below it nationwide (based on Economic Survey 2008, Kenya Integrated Household Budget Survey 2005/2006; Technoserve 2008: 7). Taking the median of the balanced monthly per head income (50 percent of the sample) of 1 984 KSH in this sample, these values are not too different from national average figures.
A different picture arises for daily household or per capita income when factoring in the poverty lines usually used by the World Bank of 2 USD and 1.25 USD per person day.
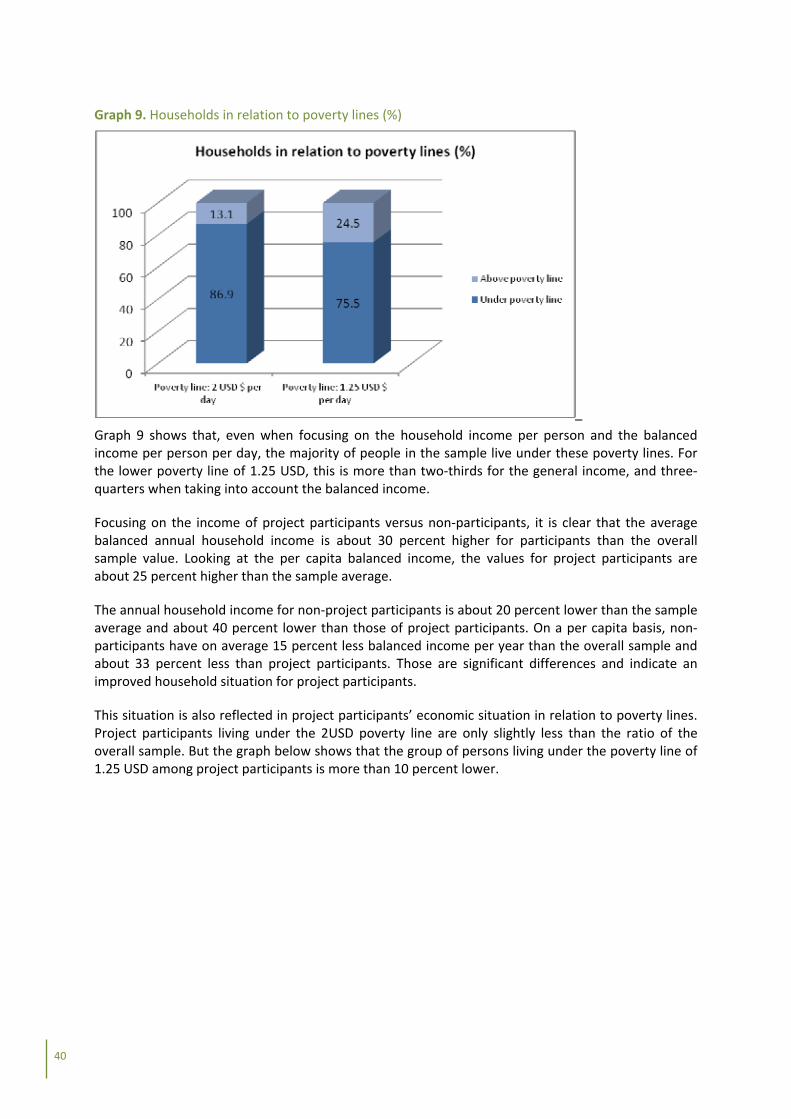
40
Graph 9. Households in relation to poverty lines (%)
_
Graph 9 shows that, even when focusing on the household income per person and the balanced income per person per day, the majority of people in the sample live under these poverty lines. For the lower poverty line of 1.25 USD, this is more than two‐thirds for the general income, and three‐quarters when taking into account the balanced income.
Focusing on the income of project participants versus non‐participants, it is clear that the average balanced annual household income is about 30 percent higher for participants than the overall sample value. Looking at the per capita balanced income, the values for project participants are about 25 percent higher than the sample average.
The annual household income for non‐project participants is about 20 percent lower than the sample average and about 40 percent lower than those of project participants. On a per capita basis, non‐participants have on average 15 percent less balanced income per year than the overall sample and about 33 percent less than project participants. Those are significant differences and indicate an improved household situation for project participants.
This situation is also reflected in project participants’ economic situation in relation to poverty lines. Project participants living under the 2USD poverty line are only slightly less than the ratio of the overall sample. But the graph below shows that the group of persons living under the poverty line of 1.25 USD among project participants is more than 10 percent lower.
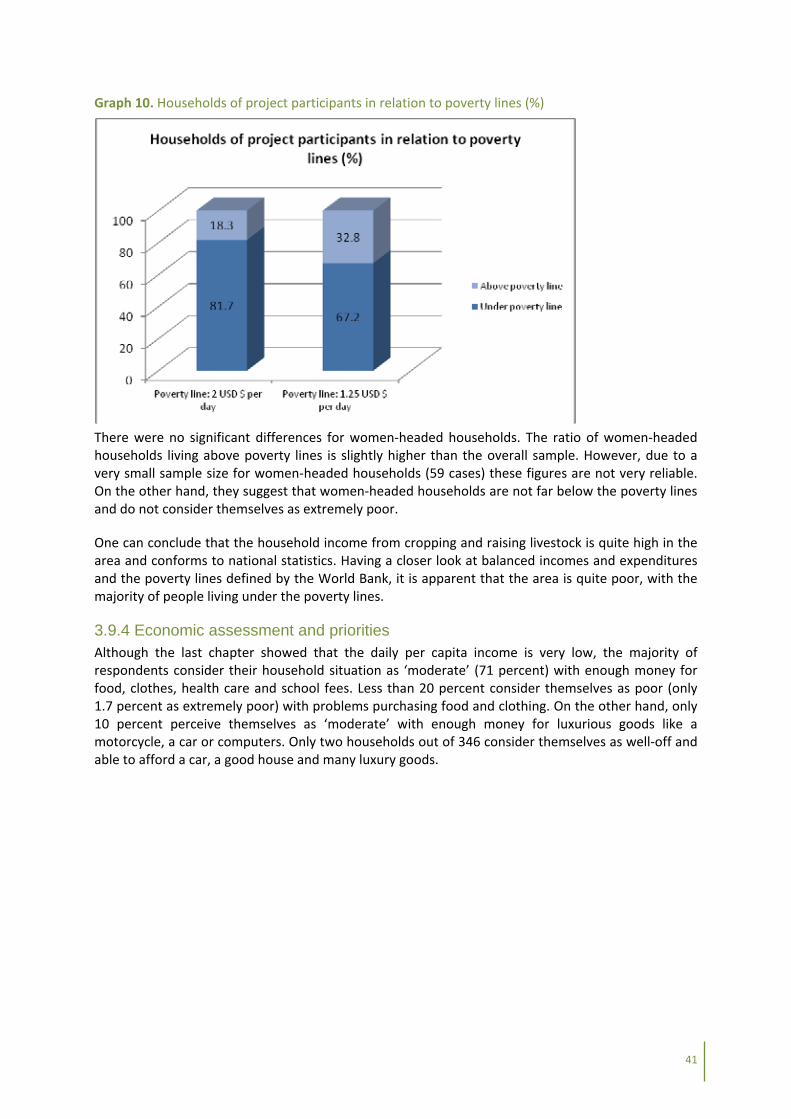
41
Graph 10. Households of project participants in relation to poverty lines (%)
There were no significant differences for women‐headed households. The ratio of women‐headed households living above poverty lines is slightly higher than the overall sample. However, due to a very small sample size for women‐headed households (59 cases) these figures are not very reliable. On the other hand, they suggest that women‐headed households are not far below the poverty lines and do not consider themselves as extremely poor.
One can conclude that the household income from cropping and raising livestock is quite high in the area and conforms to national statistics. Having a closer look at balanced incomes and expenditures and the poverty lines defined by the World Bank, it is apparent that the area is quite poor, with the majority of people living under the poverty lines.
3.9.4 Economic assessment and priorities Although the last chapter showed that the daily per capita income is very low, the majority of respondents consider their household situation as ‘moderate’ (71 percent) with enough money for food, clothes, health care and school fees. Less than 20 percent consider themselves as poor (only 1.7 percent as extremely poor) with problems purchasing food and clothing. On the other hand, only 10 percent perceive themselves as ‘moderate’ with enough money for luxurious goods like a motorcycle, a car or computers. Only two households out of 346 consider themselves as well‐off and able to afford a car, a good house and many luxury goods.
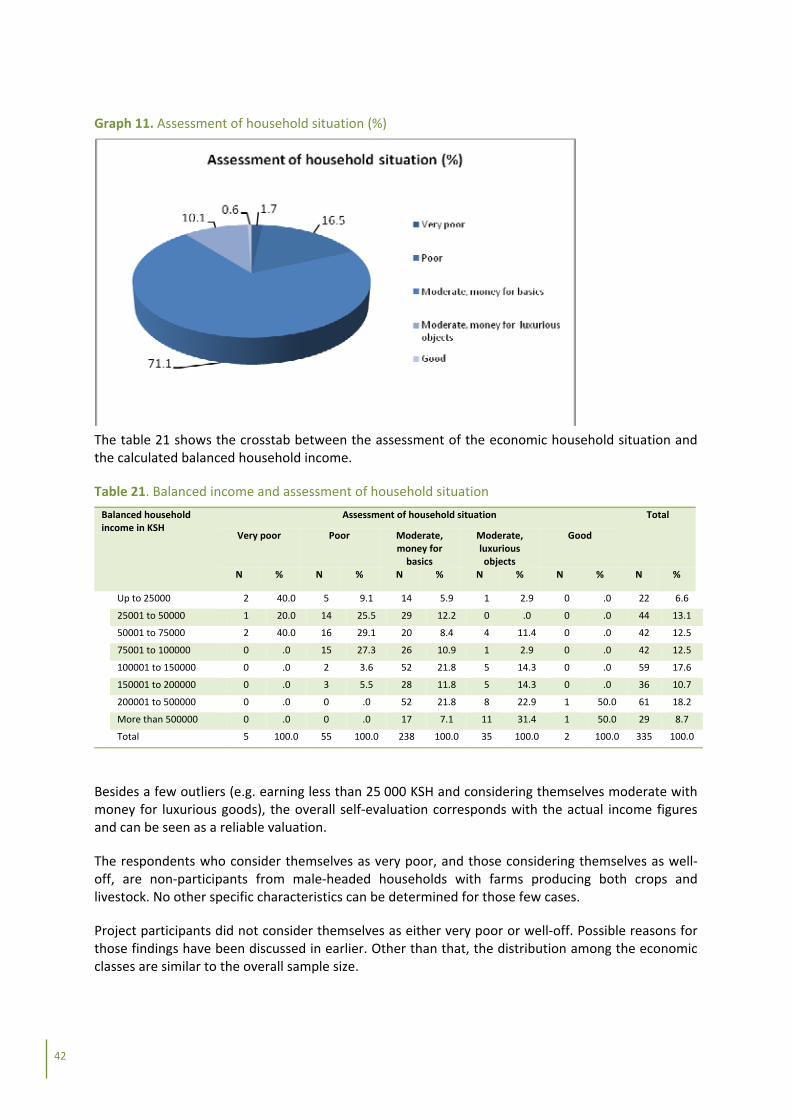
42
Graph 11. Assessment of household situation (%)
The table 21 shows the crosstab between the assessment of the economic household situation and the calculated balanced household income.
Table 21. Balanced income and assessment of household situation
Balanced household income in KSH
Assessment of household situation Total
Very poor Poor Moderate, money for basics
Moderate, luxurious objects
Good
N % N % N % N % N % N %
Up to 25000 2 40.0 5 9.1 14 5.9 1 2.9 0 .0 22 6.6
25001 to 50000 1 20.0 14 25.5 29 12.2 0 .0 0 .0 44 13.1
50001 to 75000 2 40.0 16 29.1 20 8.4 4 11.4 0 .0 42 12.5
75001 to 100000 0 .0 15 27.3 26 10.9 1 2.9 0 .0 42 12.5
100001 to 150000 0 .0 2 3.6 52 21.8 5 14.3 0 .0 59 17.6
150001 to 200000 0 .0 3 5.5 28 11.8 5 14.3 0 .0 36 10.7
200001 to 500000 0 .0 0 .0 52 21.8 8 22.9 1 50.0 61 18.2
More than 500000 0 .0 0 .0 17 7.1 11 31.4 1 50.0 29 8.7
Total 5 100.0 55 100.0 238 100.0 35 100.0 2 100.0 335 100.0
Besides a few outliers (e.g. earning less than 25 000 KSH and considering themselves moderate with money for luxurious goods), the overall self‐evaluation corresponds with the actual income figures and can be seen as a reliable valuation.
The respondents who consider themselves as very poor, and those considering themselves as well‐off, are non‐participants from male‐headed households with farms producing both crops and livestock. No other specific characteristics can be determined for those few cases.
Project participants did not consider themselves as either very poor or well‐off. Possible reasons for those findings have been discussed in earlier. Other than that, the distribution among the economic classes are similar to the overall sample size.

43
In women‐headed households, some respondents considered their economic situation as poor (in one case as very poor), but the majority consider it as moderate.
Table 22. Assessment of household situation (women‐headed household)
Assessment of household situation (women headed household)
Frequency Percent Valid Percent
Very poor, there is sometimes even not enough food available
1 1.7 1.8
Poor, but have no food problems and only sometimes problems buying clothes
14 23.7 24.6
Moderate, enough money for food clothes, health care, school
31 52.5 54.4
Moderate, enough money even for some luxurious objects like motorbikes, car, computer
11 18.6 19.3
Total 57 96.6 100.0
Interviewees had the opportunity to state their three main priorities if they had more money available. The results are presented in table 23.
Table 23. All mentioned priorities
All mentioned priorities First Priority Second Priority Third Priority All priorities
N % N % N % N %
Better Food 93 27.2 28 8.1 12 3.6 133 13.1
Better Clothes 1 .3 3 .9 4 1.2 8 .8
Repair house 13 3.8 16 4.6 43 13.0 72 7.1
Better health services 2 .6 19 5.5 60 18.1 81 7.9
Better schools 47 13.7 32 9.2 60 18.1 139 13.6
Better water 2 .6 12 3.5 13 3.9 27 2.6
Electricity supply 6 1.8 13 3.8 15 4.5 34 3.3
Buy car or motorbike 3 .9 6 1.7 8 2.4 17 1.7
Open shop/business 17 5.0 24 6.9 16 4.8 57 5.6
Start Professional training 1 .3 1 .3 1 .3 3 .3
Buy livestock 82 24.0 79 22.8 31 9.4 192 18.8
Hire farm staff 1 .3 3 .9 0 .0 4 .4
Buy livestock goods/equipment
36 10.5 46 13.3 37 11.2 119 11.7
Buy seeds 4 1.2 0 .0 4 .4
Buy agricultural goods/equipment
36 10.5 60 17.3 30 9.1 126 12.4
Other 2 .6 0 .0 1 .3 3 .3
Total 342 100.0 346 100.0 331 100.0 1019 100.0
Although most of the households assess their economic situation as moderate with only few problems regarding food and clothing, better food (27.2 percent) is the most often given first priority. Not surprisingly for the project area, the second priority item mentioned is livestock (24 percent) followed by better schooling (13.7 percent). Purchasing goods and equipment specifically for livestock was mentioned by 10.5 of the respondents and a further 10 percent said they would buy agricultural goods and equipment in general. Considering all the given priorities, the answers are more or less the same, with households requirements reflecting basic needs (food, school) and livestock‐related concerns. Again, the figures could be biased, as respondents might have answered in favor of livestock‐related priorities knowing they were being interviewed by a partner involved with EADD. In the future, after a number of trainings sessions have been organized outlining the benefits of climate‐smart agriculture in combination with raising livestock, more cropping‐related priorities may be expressed.
44
4. CONCLUSIONS AND RECOMMENDATIONS
The data analysis shows that the current focus of EADD, and by extension the farmers, is on raising livestock, improving milk production and developing businesses. So far, the project’s main activities have been setting up farmer groups, establishing relations between the DFBA and milk suppliers and raising awareness about the project to get local support. Considering the chilling plant only started operations in September 2010, the growing number of milk suppliers and share holders, as well as the continual increase in supplied milk, represent a real measure of success for the project. It is an ideal time for the MICCA Programme to come on board and develop interventions together with EADD to build upon existing structures established by the project (farmer groups, contact farmers, functioning DFBA, etc,) and widen the scope of activities to include climate‐smart agriculture and agroforestry as a means to increase food and fodder production and mitigate climate change.
These ideas are shared by the representative from the Kaptumo division, Mr Idenya, who would like to see more assistance in appropriate use of fodder, the cultivation of fodder legumes and the use of crop residues. This used to be the traditional approach “…which was lost along the way”, according to him (Idenya 2011). He would welcome the MICCA Programme’s support in introducing fodder trees to farmers and developing a nursery with local seeds. Possibilities should be explored for combine tea planting and climate‐smart agriculture. The management team of the DFBA would also appreciate more training in the use of manure on different types of fodder grasses and an increase in on‐farm production of feed concentrates.
In fruitful focus group discussions, farmers shared their ideas on where the MICCA Programme could provide future assistance. Suggestions include more awareness raising on EADD and MICCA Programme cooperation, assistance in developing organizational capacity development, more training on on‐farm income diversification (e.g. advantages of small livestock targeted to women), finance (e.g. for the zero‐grazing construction) or exchange and study visits. Farmers were very interested to learn more about the production and conservation of feed, soil nutrition and rain water harvesting. Others asked for more demonstration plots that would give more visibility to successful practices and serve as a model in the village. The chairman of the DFBA sums it up by saying “… seeing is believing…”.
Obviously, the MICCA Programme and EADD are not be in a position to address all these ‘wishes’ as some are not within their mandate or project objectives. However, some of the ideas proposed are supported by the survey’s findings and can serve as the basis for the following recommendations regarding the further involvement of the MICCA Programme.
I. The MICCA Programme’s main entry point is supporting on‐farm fodder production with climate‐smart agricultural tools in ways that will lead to higher milk production, fewer emissions, efficient manure management and possibly zero grazing. The Programme could: o build upon existing knowledge and practices regarding climate‐smart agriculture and
fodder production, offer technical assistance on these practices to ensure planting and harvesting is done using climate‐smart agricultural tools and principles;
o provide assistance through technical support on crop selection for fodder and the use and processing (e.g. with pulverizers) of crop residues; and
o promote improved manure management and analyse with EADD the compatibleness of zero‐grazing units and develop strategies for their implementation if they are found to be appropriate (via check‐offs, required materials and costs).

45
II. The MICCA Programme can provide knowledge on climate change and raise awareness about how to adopt agricultural practices in response to increased climate variability. The Programme could: o raise awareness about the causes and impact of climate change and the role farmers
play in contributing to and mitigating climate change; and o show that climate‐smart agriculture enables farmers to adapt to changes in climate
and weather, increase their yields and enhance local food security.
III. The MICCA Programme’s main objective is climate change mitigation and is well‐placed position to offer tools to mitigate climate change through climate‐smart agriculture and agroforestry. The Programme could: o assist in training sessions on climate‐smart agriculture techniques and principles for
food and fodder production, emphasizing manure management; o stress food and fodder storage as a mean of safeguarding food security and
implementing climate change preparedness strategies; o intensify awareness on agroforestry and tree planting; o develop a strategy (establishing nursery, selling seeds, training farmers) to plant trees
beneficial to fodder production and climate change mitigation; and o work on alternative energy sources (like biogas generation from manure) to decrease
fuel wood requirements.
More general aspects which should be considered and addressed in further interventions include:
o a clear introduction of EADD and the MICCA Programme in the villages with transparent communication of project objectives and activities; and
o preparing a set of messages for general awareness activities about EADD and the MICCA Programme addressing the following topics among non‐project participants: conditions of joining the project, real costs of joining the project (like registration fees, prices of shares), calculated potential costs versus potential profit (more yields) and work with existing groups or individuals in the villages as multipliers.
To carry out these recommendations, coordination among all project components is necessary. Greater coordination will help identify areas where activities will overlap and where synergies may arise. Possible strategies and activities need to be developed together to avoid duplicating efforts and to identify target audiences, activities, methodologies and indicators for monitoring and evaluating change. Findings should be compiled in an activity plan for all components. This plan could represent the road map for the cooperation of EADD and the MICCA Programme for the project site.
All planned interventions should address women and men equally, as survey results indicate that both men and women are involved in household decisions. In addition, as Mr Idenya from the Kaptumo Livestock Division added in his interview: “All kind of planned activities require ownership by people on the ground, no ‘spoon feeding’ projects are welcomed as they will not be sustainable.”

46
LITERATURE
COMPETE 2009: Sixth Framework Programme FP6‐2004‐INCO‐DEV‐3 Priroity A.2.3.: Managing Arid and Semi‐arid Ecosystems. Third Periodic Activity Report. http://www.compete‐bioafrica.net/improved_land/COMPETE_D2‐2_D2‐3_Traditional,%20improved%20and%20modern%20bioenergy%20systems%20for%20semi‐arid%20and%20arid%20Africa_final_090803.pdf (12.12.2011).
Technoserve 2008: The Dairy Value Chain in Kenya.
http://mahider.ilri.org/bitstream/handle/10568/2407/Dairy%20Value%20Chain%20Kenya%20Report.pdf;jsessionid=DDFF0F3B44A44C8CFE6EDC5CF768E428?sequence=1
EADD 2009: Baseline Surveys Report. Report 1. Survey Methodology & Overview. Key results
of the household survey. MICCA 2011: Pilot Project Proposal. (unpublished document) African Studies Center 2011: East Africa Living Encyclopedia. Kenya Ethnic Groups. University of Pennsylvania.
http://www.africa.upenn.edu/NEH/kethnic.htm
World Bank 2010: Data. Kenya http://data.worldbank.org/country/kenya
47
ANNEX A. SOCIO-ECONOMIC SURVEY MICCA KENYA 2011
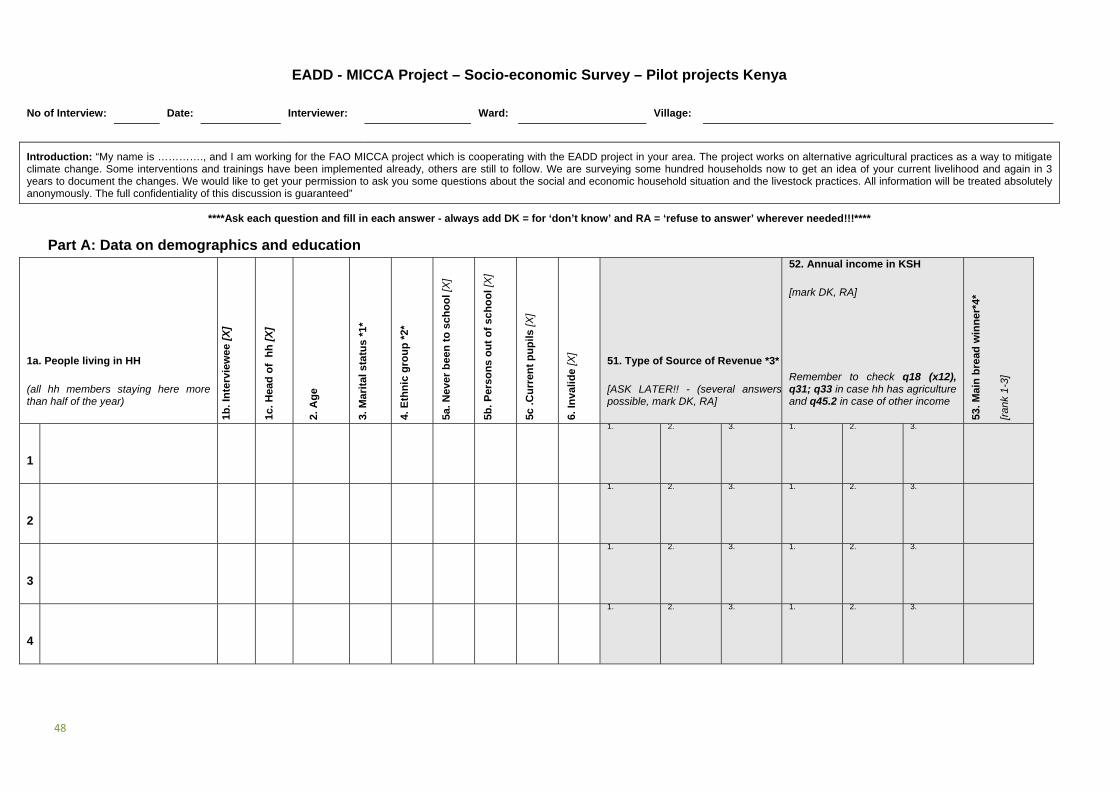
48
EADD - MICCA Project – Socio-economic Survey – Pilot projects Kenya
No of Interview: Date: Interviewer: Ward: Village:
Introduction: “My name is …………., and I am working for the FAO MICCA project which is cooperating with the EADD project in your area. The project works on alternative agricultural practices as a way to mitigate climate change. Some interventions and trainings have been implemented already, others are still to follow. We are surveying some hundred households now to get an idea of your current livelihood and again in 3 years to document the changes. We would like to get your permission to ask you some questions about the social and economic household situation and the livestock practices. All information will be treated absolutely anonymously. The full confidentiality of this discussion is guaranteed”
****Ask each question and fill in each answer - always add DK = for ‘don’t know’ and RA = ‘refuse to answer’ wherever needed!!!****
Part A: Data on demographics and education
1a. People living in HH
(all hh members staying here more than half of the year)
1b. I
nte
rvie
wee
[X
]
1c. H
ead
of
hh
[X
]
2. A
ge
3. M
arit
al s
tatu
s *
1*
4. E
thn
ic g
rou
p *
2*
5a. N
ever
bee
n t
o s
cho
ol [
X]
5b. P
erso
ns
ou
t o
f sc
ho
ol [
X]
5c .C
urr
ent
pu
pil
s [X
]
6. In
vali
de
[X]
51. Type of Source of Revenue *3*
[ASK LATER!! - (several answerspossible, mark DK, RA]
52. Annual income in KSH
[mark DK, RA]
Remember to check q18 (x12), q31; q33 in case hh has agriculture and q45.2 in case of other income
53. M
ain
bre
ad w
inn
er*4
*
[rank
1-3
]
1
1. 2. 3. 1. 2. 3.
2
1. 2. 3. 1. 2. 3.
3
1. 2. 3. 1. 2. 3.
4
1. 2. 3. 1. 2. 3.
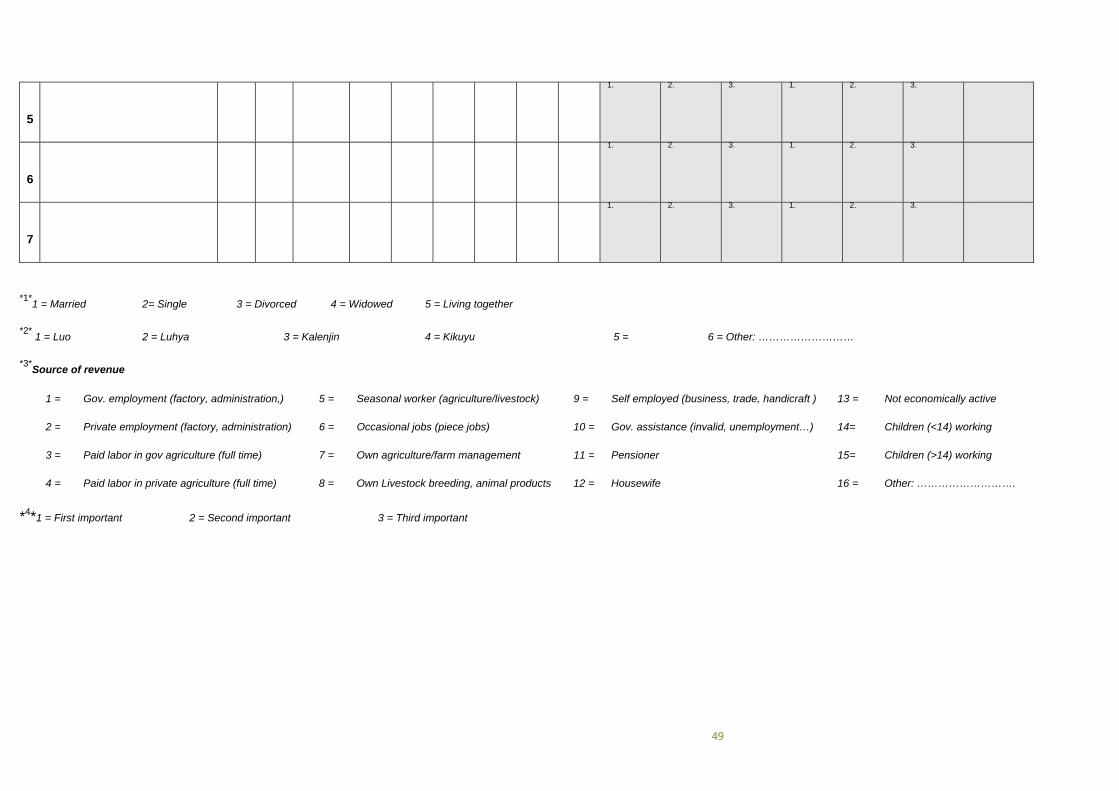
49
5
1. 2. 3. 1. 2. 3.
6
1. 2. 3. 1. 2. 3.
7
1. 2. 3. 1. 2. 3.
*1*1 = Married 2= Single 3 = Divorced 4 = Widowed 5 = Living together
*2* 1 = Luo 2 = Luhya 3 = Kalenjin 4 = Kikuyu 5 = 6 = Other: ………………………
*3*Source of revenue
1 = Gov. employment (factory, administration,) 5 = Seasonal worker (agriculture/livestock) 9 = Self employed (business, trade, handicraft ) 13 = Not economically active
2 = Private employment (factory, administration) 6 = Occasional jobs (piece jobs) 10 = Gov. assistance (invalid, unemployment…) 14= Children (<14) working
3 = Paid labor in gov agriculture (full time) 7 = Own agriculture/farm management 11 = Pensioner 15= Children (>14) working
4 = Paid labor in private agriculture (full time) 8 = Own Livestock breeding, animal products 12 = Housewife 16 = Other: ……………………….
*4*1 = First important 2 = Second important 3 = Third important

50
PART B: PROJECT INVOLVEMENT
7.1 Did you ever participate in one of the EADD projects interventions like trainings, awareness activities?
1 = Yes 2 = No 88 = DK 99 = RA
7.2 In which of the following project interventions (implemented by EADD) did you/are you participating (trainings, support, …)?
Interventions
Yes
[mark x] Joined/participated in (mm/YYYY)
1. Participated in Training
2. Participated in Workshops
3. Participated in awareness and demonstration campaigns
4. Registered farmer at chilling facility
5. Shareholder with DFBA
6. Milk supplier
7. Learning/Exchange trips
8. Cattle received AI
9. Extension worker/trainer
10. Access to ‘check off’ from DFBA
11. Other:
DFBA = Dairy farmer Business Association
AI = Artificial Insemination
HOUSEHOLD IDENTIFICATION VARIABLES
Village code [2 letters] Initial hh head Birth year hh head
Name of household head:_______________________________________

51
Kaptumo = KT Kaboi = KB
Ndurio = ND Koyo = KY
Kapkolei = KL Kapsaos = KS
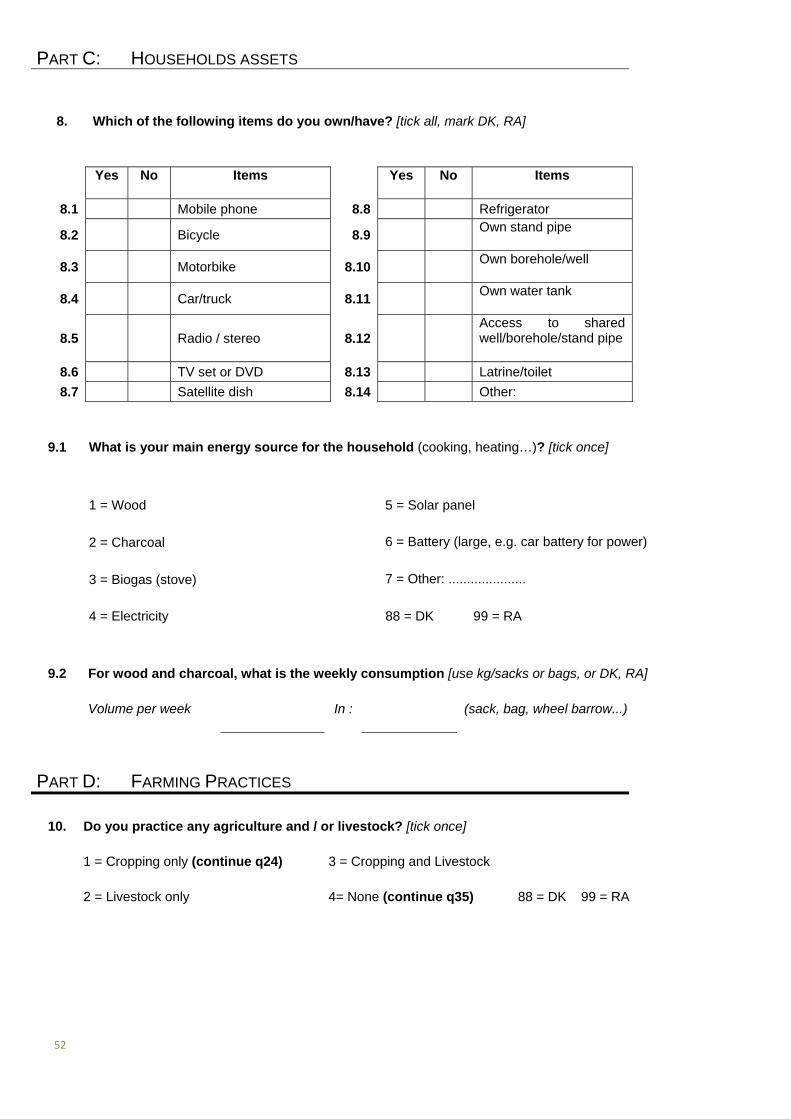
52
PART C: HOUSEHOLDS ASSETS
8. Which of the following items do you own/have? [tick all, mark DK, RA]
Yes No Items Yes No Items
8.1 Mobile phone 8.8 Refrigerator
8.2 Bicycle 8.9 Own stand pipe
8.3 Motorbike 8.10 Own borehole/well
8.4 Car/truck 8.11 Own water tank
8.5 Radio / stereo 8.12 Access to shared well/borehole/stand pipe
8.6 TV set or DVD 8.13 Latrine/toilet
8.7 Satellite dish 8.14 Other:
9.1 What is your main energy source for the household (cooking, heating…)? [tick once]
1 = Wood 5 = Solar panel
2 = Charcoal 6 = Battery (large, e.g. car battery for power)
3 = Biogas (stove) 7 = Other: .....................
4 = Electricity 88 = DK 99 = RA
9.2 For wood and charcoal, what is the weekly consumption [use kg/sacks or bags, or DK, RA]
Volume per week In : (sack, bag, wheel barrow...)
PART D: FARMING PRACTICES
10. Do you practice any agriculture and / or livestock? [tick once]
1 = Cropping only (continue q24) 3 = Cropping and Livestock
2 = Livestock only 4= None (continue q35) 88 = DK 99 = RA

53
11. Does your farm have the following? [tick all, mark DK, RA]
Yes No Items Yes No Items
11.1 Shovel 11.9 Milking parlour
11.2 Hoe 11.10 Milking machine
Machete Teat dip
11.3 Plough 11.11 Knap sack sprayer
11.4 Mechanical plough 11.12
Separation from animal and human
11.5 Ox/donkey cart 11.13 Barn for Livestock
11.6 Tractor 11.14 Pulveriser
11.7 Thresher 11.15 Chaff cutter
11.8 Biogas digester 11.16 Other:
12. In case you own livestock, what kind of livestock do you own? [tick all, mark DK, RA]
Livestock No of Livestock No of
12.1 Pigs 12.4 Chicken
12.2 Goats 12.5 Cattle
12.3 Sheep 12.6 Donkeys
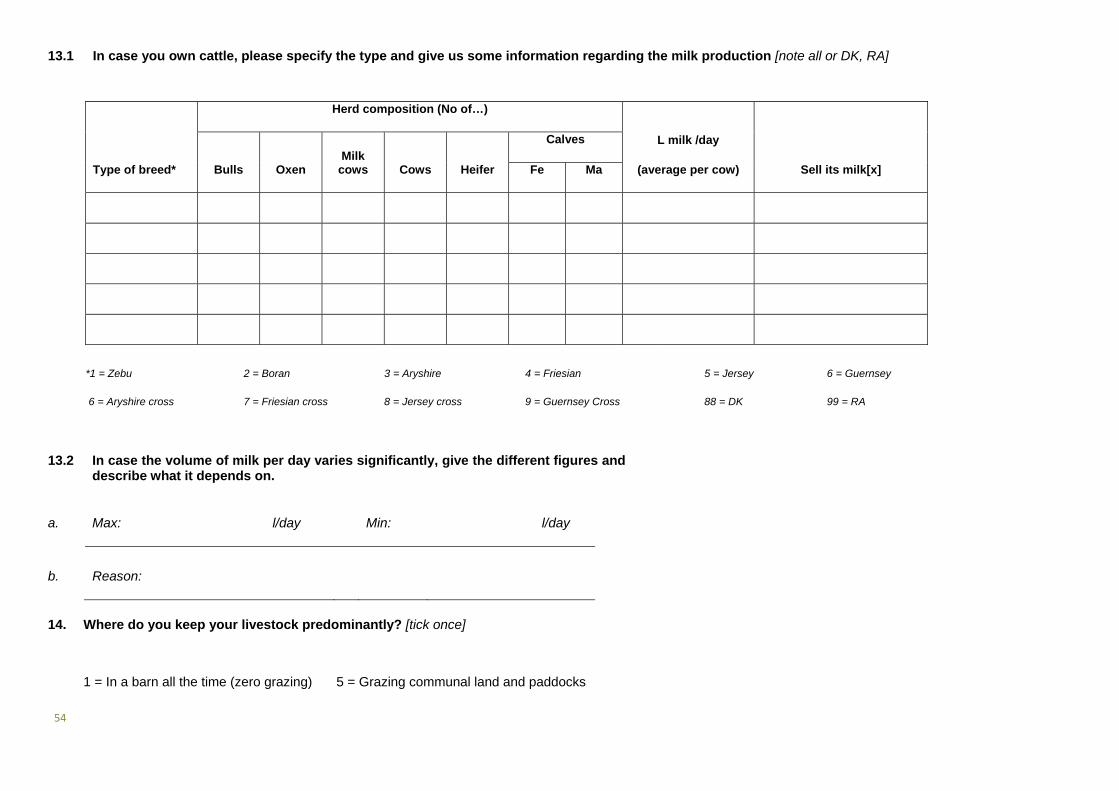
54
13.1 In case you own cattle, please specify the type and give us some information regarding the milk production [note all or DK, RA]
Type of breed*
Herd composition (No of…)
L milk /day
(average per cow) Sell its milk[x] Bulls Oxen Milk
cows Cows Heifer
Calves
Fe Ma
*1 = Zebu 2 = Boran 3 = Aryshire 4 = Friesian 5 = Jersey 6 = Guernsey
6 = Aryshire cross 7 = Friesian cross 8 = Jersey cross 9 = Guernsey Cross 88 = DK 99 = RA
14. Where do you keep your livestock predominantly? [tick once]
1 = In a barn all the time (zero grazing) 5 = Grazing communal land and paddocks
13.2 In case the volume of milk per day varies significantly, give the different figures and describe what it depends on.
a. Max: l/day Min: l/day
b. Reason:

55
2 = On paddocks 6 = Grazing, paddocks, barn
3 = Grazing on communal land 7 = Other: ..........................
3 = In barn and grazing communal land 88 = DK 99 = RA
4 = In barn and paddocks
15. Please specify the sizes of plots used for livestock (paddocks) [note all or DK, RA]
Plots/ paddocks
Size of plots Space for # of cattle on it
m2 Square Point Acres
15.1 1.
15.2 2.
15.3 3.
15.4 4.
Square = 0.05 Acres Point = 0.1 Acres
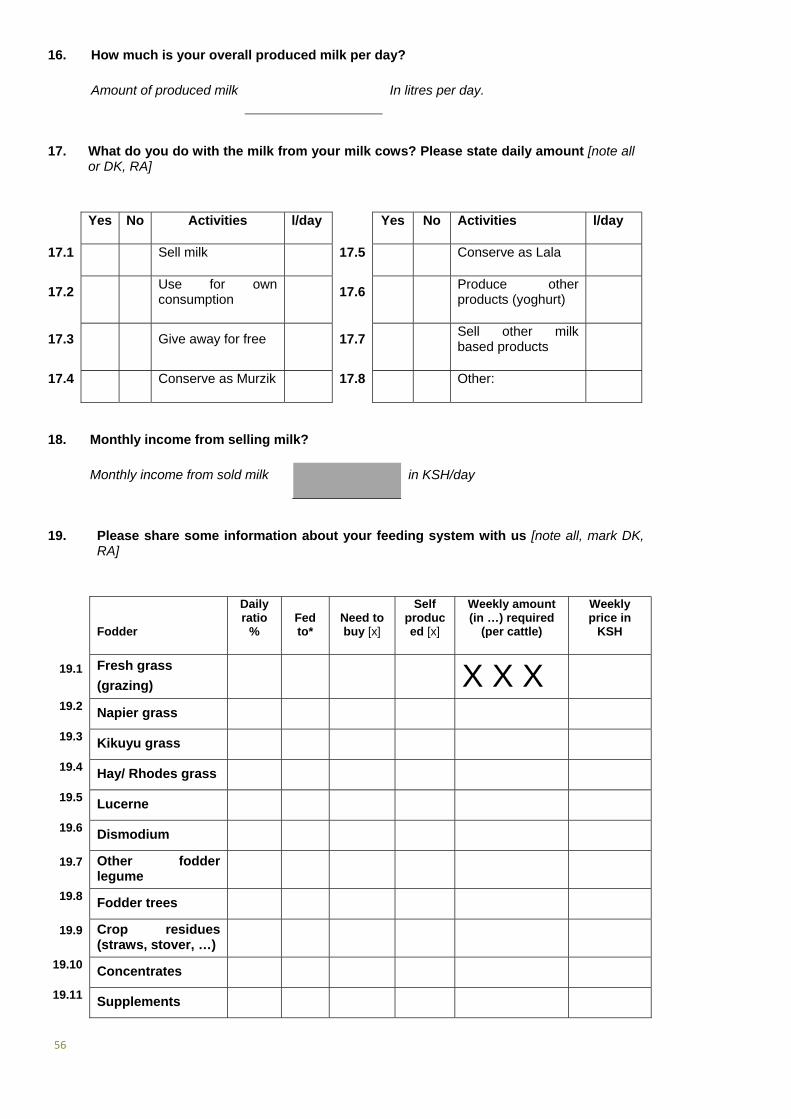
56
16. How much is your overall produced milk per day?
Amount of produced milk In litres per day.
17. What do you do with the milk from your milk cows? Please state daily amount [note all or DK, RA]
Yes No Activities l/day Yes No Activities l/day
17.1
Sell milk 17.5 Conserve as Lala
17.2
Use for own consumption
17.6Produce other products (yoghurt)
17.3
Give away for free 17.7Sell other milk based products
17.4
Conserve as Murzik 17.8 Other:
18. Monthly income from selling milk?
Monthly income from sold milk in KSH/day
19. Please share some information about your feeding system with us [note all, mark DK, RA]
Fodder
Daily ratio
% Fed to*
Need to buy [x]
Self produced [x]
Weekly amount (in …) required
(per cattle)
Weekly price in
KSH
19.1 Fresh grass
(grazing)
X X X
19.2 Napier grass
19.3 Kikuyu grass
19.4 Hay/ Rhodes grass
19.5 Lucerne
19.6 Dismodium
19.7 Other fodder legume
19.8 Fodder trees
19.9 Crop residues (straws, stover, …)
19.10 Concentrates
19.11 Supplements
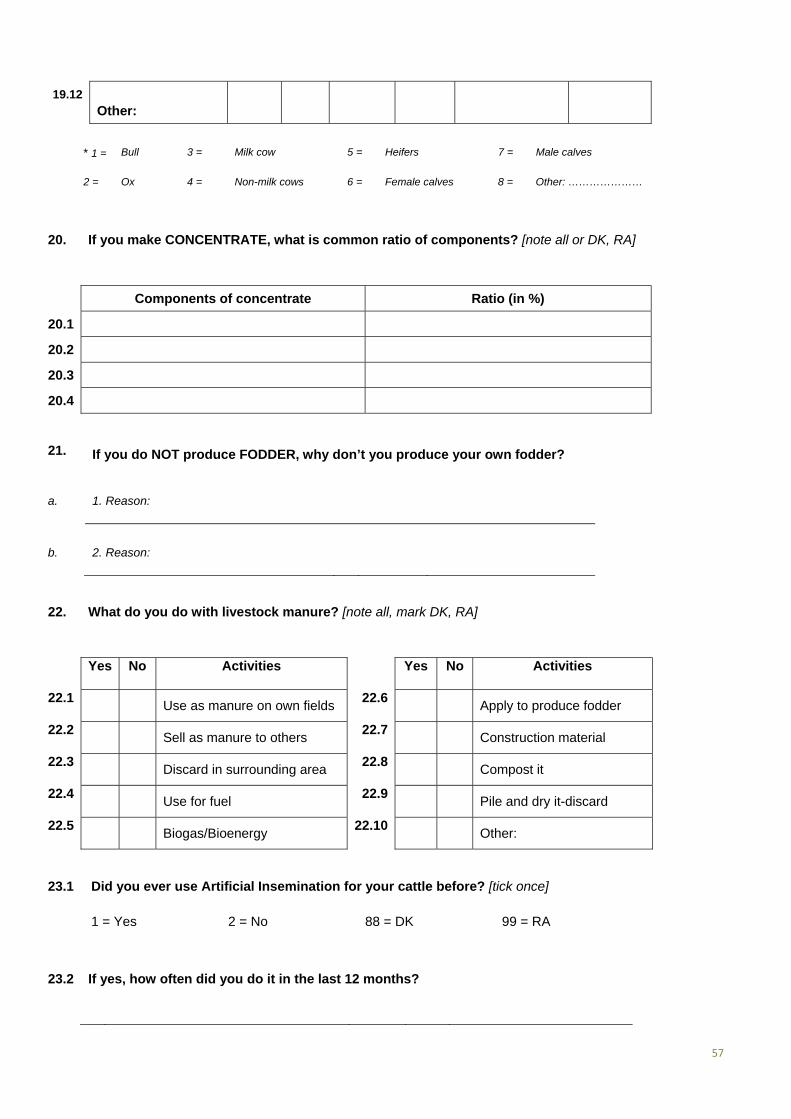
57
19.12
Other:
* 1 = Bull 3 = Milk cow 5 = Heifers 7 = Male calves
2 = Ox 4 = Non-milk cows 6 = Female calves 8 = Other: …………………
20. If you make CONCENTRATE, what is common ratio of components? [note all or DK, RA]
Components of concentrate Ratio (in %)
20.1
20.2
20.3
20.4
21. If you do NOT produce FODDER, why don’t you produce your own fodder?
a. 1. Reason:
b. 2. Reason:
22. What do you do with livestock manure? [note all, mark DK, RA]
Yes No Activities Yes No Activities
22.1 Use as manure on own fields
22.6Apply to produce fodder
22.2 Sell as manure to others
22.7Construction material
22.3 Discard in surrounding area
22.8Compost it
22.4 Use for fuel
22.9Pile and dry it-discard
22.5 Biogas/Bioenergy
22.10Other:
23.1 Did you ever use Artificial Insemination for your cattle before? [tick once]
1 = Yes 2 = No 88 = DK 99 = RA
23.2 If yes, how often did you do it in the last 12 months?

58
Breed of the cow used AI on Frequency of AI/year
*1 = Zebu 2 = Boran 3 = Aryshire 4 = Friesian 5 = Jersey 6 = Guernsey
6 = Aryshire cross 7 = Friesian cross 8 = Jersey cross 9 = Guernsey Cross 88 = DK 99 = RA
PART E: CROPPING PRACTICES
24. Do you practice any cropping (incl. of vegetables, fruits, trees,…)? [tick once]
1 = Yes 2 = No (continue q35) 88 = DK 99 = RA
25. What kind of cropping do you practice today? [tick all, mark DK, RA]
Yes No Activities Yes No Activities
25.1 Horticulture / Garden
25.8Leased field
25.2 Cultivating one main field
25.9 Subsistence farming only
25.3 Cultivating several fields
25.10 Sell crops only (mangos, tea, maize…)
25.4 Cultivating communal land
25.11 Own consumption and selling of crops
25.5 Planting and harvesting trees
25.12Shifting cultivation
25.6 Cultivating on group field
25.13 Harvest bushes and fruits
25.7 Own field
25.14Other:
26.1 Do you face any problems regarding agriculture? [tick once]
1 = Yes 2 = No 88 = DK 99 = RA
26.2 If YES, what are the main problems (invasion from cattle, less yield, diseases….)?
a. 1. Problem
b. 2. Problem

59
27. Do you know anything about conservation agriculture (CA)? [tick once]
1 = Yes 2 = No 88 = DK 99 = RA
28. Do you practice the following techniques? [tick all, mark DK, RA]
Yes No Techniques Yes No Techniques
28.1 Double digging
28.9 Application of fertilizer
28.2 Mulching
28.10 Timely weeding
28.3 Avoid slash and burn
28.11 Weeding using chemicals
28.4 Crop rotation
28.12 Bush clearing
28.5 Planting in rows
28.13 No/minimum tillage
28.6 Planting hedge rows
28.14 Ridge cultivation
28.7 Crop cover
28.15 Terraces
28.8 Application of manure
28.16 Other
29. Who decided to adopt/use those specific techniques?
Who decided:
30. Which of those techniques (q30) have been most beneficial to increase your agricultural productivity (cropping & livestock)?
a. 1.Cropping:
b. 2. Livestock:
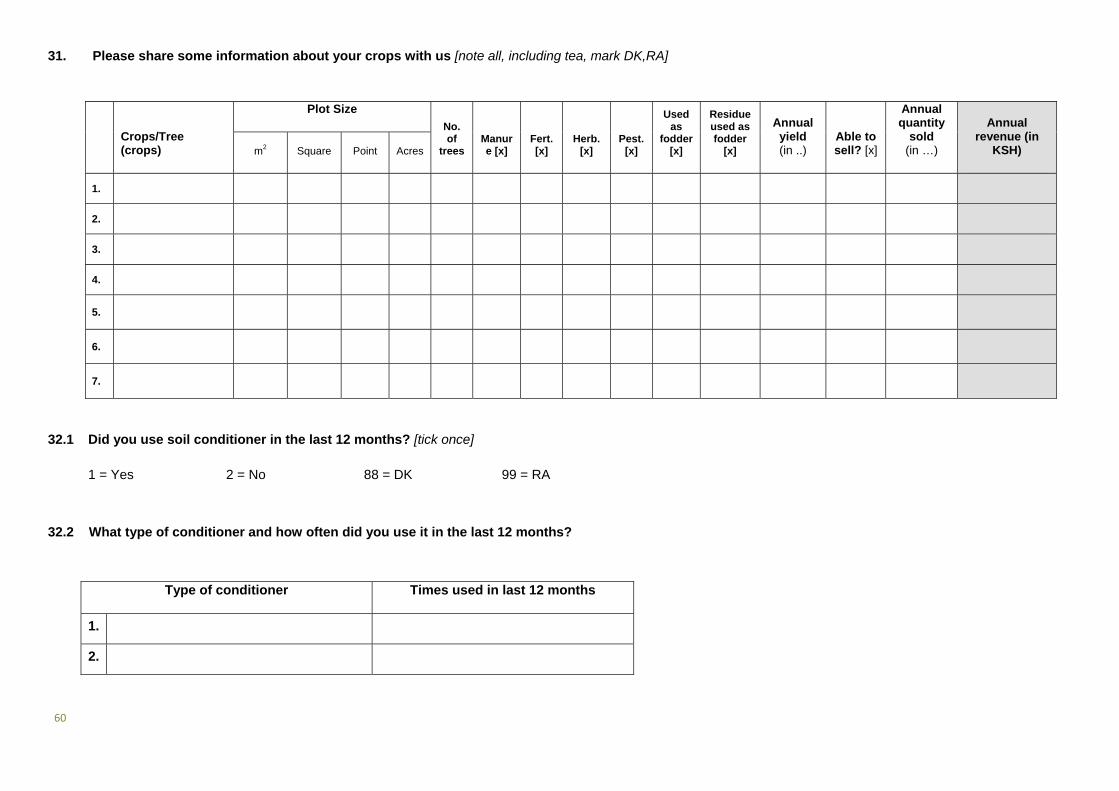
60
31. Please share some information about your crops with us [note all, including tea, mark DK,RA]
Crops/Tree (crops)
Plot Size
No. of
trees Manure [x]
Fert. [x]
Herb. [x]
Pest. [x]
Used as
fodder [x]
Residue used as fodder
[x]
Annual yield (in ..)
Able to sell? [x]
Annual quantity
sold (in …)
Annual revenue (in
KSH) m2 Square Point Acres
1.
2.
3.
4.
5.
6.
7.
32.1 Did you use soil conditioner in the last 12 months? [tick once]
1 = Yes 2 = No 88 = DK 99 = RA
32.2 What type of conditioner and how often did you use it in the last 12 months?
Type of conditioner Times used in last 12 months
1.
2.
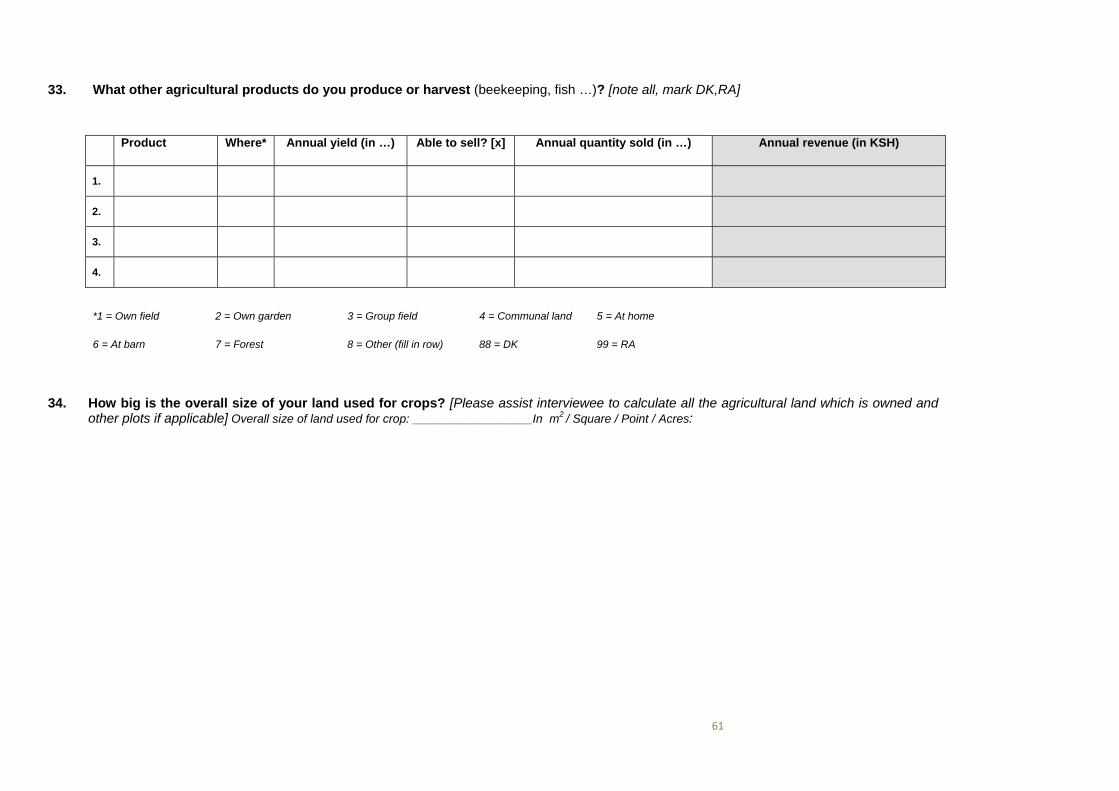
61
33. What other agricultural products do you produce or harvest (beekeeping, fish …)? [note all, mark DK,RA]
Product Where* Annual yield (in …) Able to sell? [x] Annual quantity sold (in …) Annual revenue (in KSH)
1.
2.
3.
4.
*1 = Own field 2 = Own garden 3 = Group field 4 = Communal land 5 = At home
6 = At barn 7 = Forest 8 = Other (fill in row) 88 = DK 99 = RA
34. How big is the overall size of your land used for crops? [Please assist interviewee to calculate all the agricultural land which is owned and other plots if applicable] Overall size of land used for crop: __________________In m2 / Square / Point / Acres:

62
35.1 Did you plant or protect trees in the last 12 months? [tick once]
1 = Yes 2 = No 88 = DK 99 = RA
35.2 If Yes, what kind and how many?
Type of trees
No of planted trees / (unit)
No of deliberately protected trees / (unit)
On own land [x]
1.
2.
3.
35.3 If NO, are you planning to plant and protect trees in the near future? [tick once]
1 = Yes 2 = No 88 = DK 99 = RA
PART F: MARKET, LABOUR AND FOOD SECURITY
36. Where are the next markets that you sell your products? Please state all markets you travel to on a regular basis (at least four times a year). [note all, also markets for milk]
Name of market / village/location
Sold goods (incl. fodder legume,
milk.) Frequency - Self*
Frequency – middle
man*
Distance (both ways
in km) Mode of transport
1.
2.
3.
4.
*1 = Twice a year 2 = Every three months 3 = Every second month 4 = Monthly
5 = Every second week 6 = Every week 7 = Twice a week 8 = Daily
9 = Other……………… 88 = DK 99 = RA
37.1 Did you hire staff/laborer on your farm in the last 12 months? [tick once]

63
1 = Yes 2 = No 88 = DK 99 = RA
38. If yes, how many and for how long? [note all, mark DK,RA
Staff
Permanent staff/laborer Casual Laborer
No of Main tasks Man day/year Main tasks
38.1 Women
38.2 Men
38.3 Girls under 14
38.4 Boys under 14
39.1 Are you able to provide food for your family from your own products? [tick once]
1 = Yes 2 = Sometimes 3 = Never 88 = DK 99 = RA
39.2 How many months (in the last 12 months) per year are you able to provide food from your own agricultural practices for your family? [tick once]
1 = 1-3 months per year 6 = Could not provide for family back then
2 = up to 6 months per year 7 = Very irregular
3 = Up to 9 months per year 8 = Other: .....................
4 = The whole year 88 = DK
5 = Even more than for a year 99 = RA
40.1 Do you have any food or fodder storage devices? [tick once]
1 = Yes 2 = No 88 = DK 99 = RA
40.2 If yes, what type of storage do you have: [note all, mark DK,RA
Type of food storage: Capacity (unit):
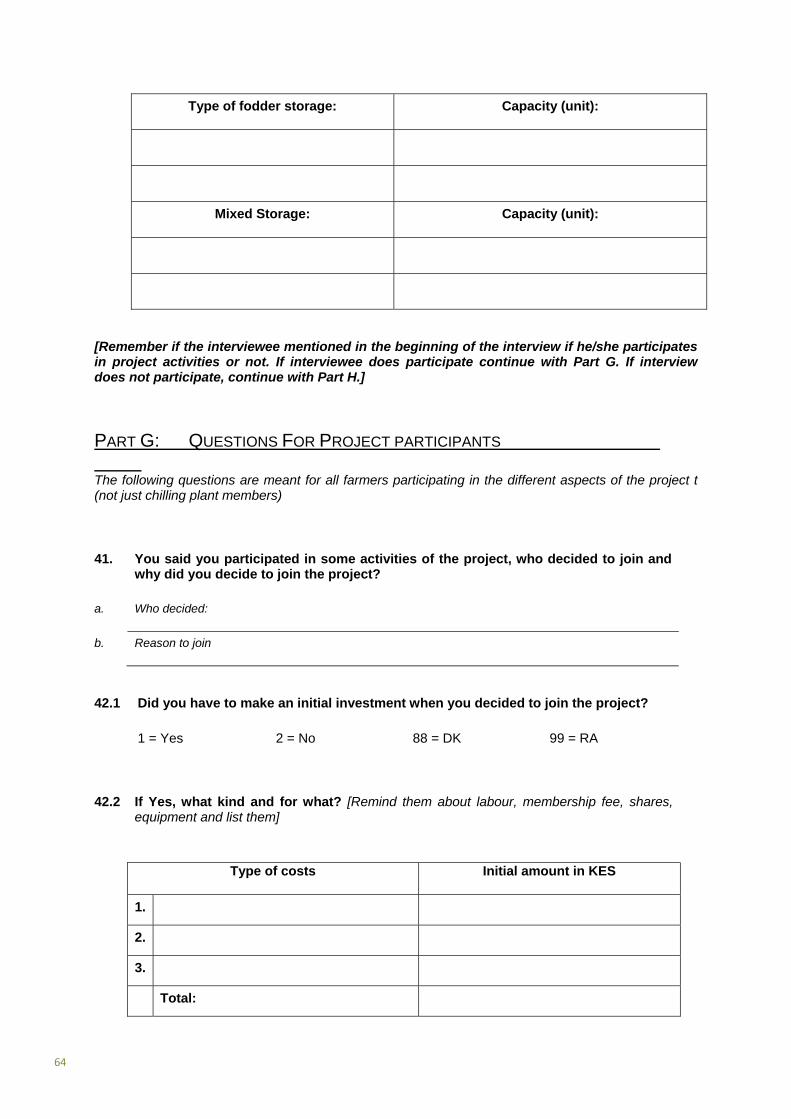
64
Type of fodder storage: Capacity (unit):
Mixed Storage: Capacity (unit):
[Remember if the interviewee mentioned in the beginning of the interview if he/she participates in project activities or not. If interviewee does participate continue with Part G. If interview does not participate, continue with Part H.]
PART G: QUESTIONS FOR PROJECT PARTICIPANTS The following questions are meant for all farmers participating in the different aspects of the project t (not just chilling plant members)
41. You said you participated in some activities of the project, who decided to join and why did you decide to join the project?
a. Who decided:
b. Reason to join
42.1 Did you have to make an initial investment when you decided to join the project?
1 = Yes 2 = No 88 = DK 99 = RA
42.2 If Yes, what kind and for what? [Remind them about labour, membership fee, shares, equipment and list them]
Type of costs Initial amount in KES
1.
2.
3.
Total:
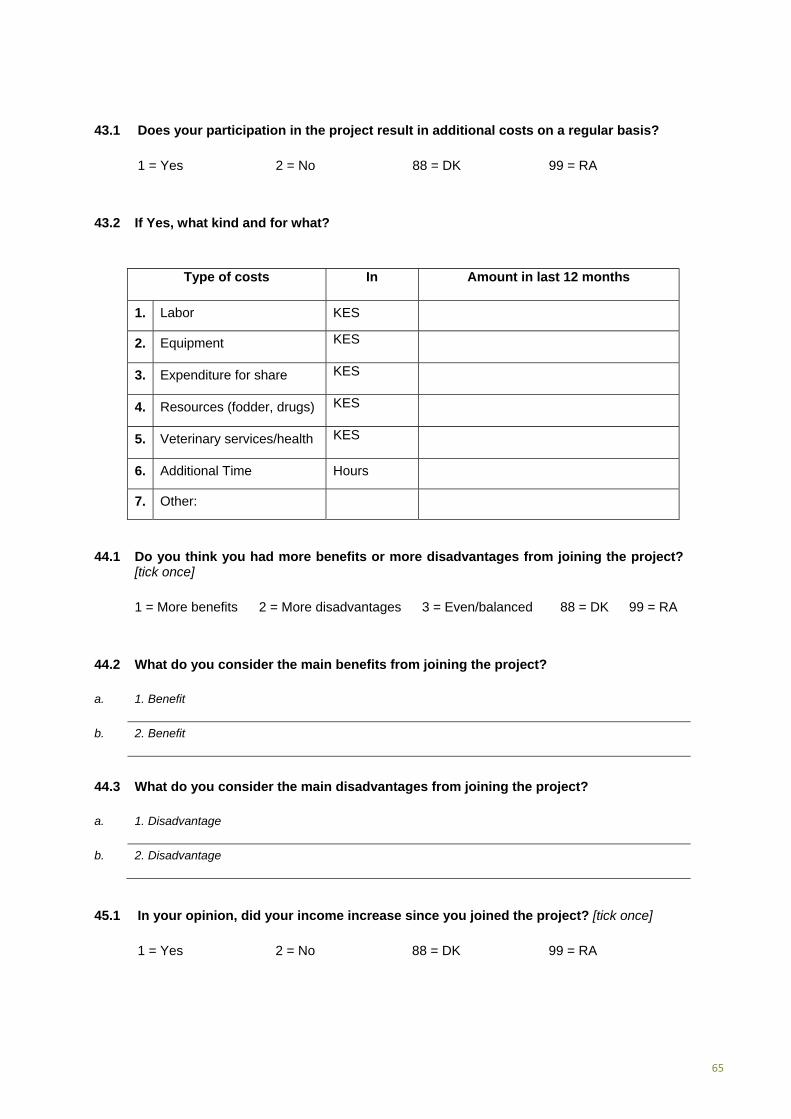
65
43.1 Does your participation in the project result in additional costs on a regular basis?
1 = Yes 2 = No 88 = DK 99 = RA
43.2 If Yes, what kind and for what?
Type of costs In Amount in last 12 months
1. Labor KES
2. Equipment KES
3. Expenditure for share KES
4. Resources (fodder, drugs) KES
5. Veterinary services/health KES
6. Additional Time Hours
7. Other:
44.1 Do you think you had more benefits or more disadvantages from joining the project? [tick once]
1 = More benefits 2 = More disadvantages 3 = Even/balanced 88 = DK 99 = RA
44.2 What do you consider the main benefits from joining the project?
a. 1. Benefit
b. 2. Benefit
44.3 What do you consider the main disadvantages from joining the project?
a. 1. Disadvantage
b. 2. Disadvantage
45.1 In your opinion, did your income increase since you joined the project? [tick once]
1 = Yes 2 = No 88 = DK 99 = RA
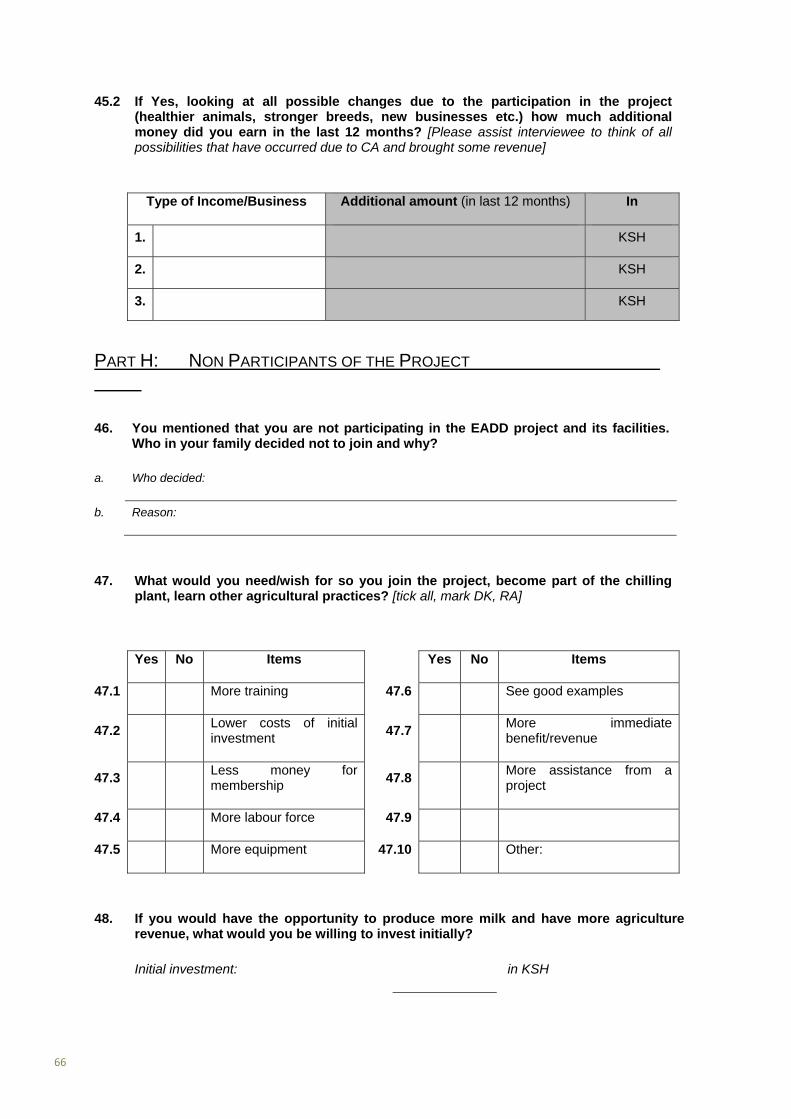
66
45.2 If Yes, looking at all possible changes due to the participation in the project (healthier animals, stronger breeds, new businesses etc.) how much additional money did you earn in the last 12 months? [Please assist interviewee to think of all possibilities that have occurred due to CA and brought some revenue]
Type of Income/Business Additional amount (in last 12 months) In
1. KSH
2. KSH
3. KSH
PART H: NON PARTICIPANTS OF THE PROJECT
46. You mentioned that you are not participating in the EADD project and its facilities. Who in your family decided not to join and why?
a. Who decided:
b. Reason:
47. What would you need/wish for so you join the project, become part of the chilling plant, learn other agricultural practices? [tick all, mark DK, RA]
Yes No Items Yes No Items
47.1
More training 47.6 See good examples
47.2
Lower costs of initial investment
47.7More immediate benefit/revenue
47.3
Less money for membership
47.8More assistance from a project
47.4
More labour force 47.9
47.5
More equipment 47.10 Other:
48. If you would have the opportunity to produce more milk and have more agriculture revenue, what would you be willing to invest initially?
Initial investment: in KSH

67
PART I: CLIMATE AND MITIGATION AWARENESS AND KNOWLEDGE
49.1 Have you ever heard of the term ‘Climate Change’? [tick once, mark DK, RA]
1 = Yes 2 = No 88 = DK 99 = RA
49.2 If YES, what is it?
a. 1. Explanation:
b. 2. Explanation:
49.3 If NO, what could it be?
a. 1. Explanation:
b. 2. Explanation:
50. What is the most striking change in weather and climate that you could observe over the last decade? [Please explain interviewee the basics of climate change and concentrate on weather variability] [tick once]
1 = Nothing [continue q51] 5 = Dry season much longer
2 = More rainfall 6 = Other……….
3 = Less rainfall
4 = More floods 88 = DK 99 = RA
50.1 In case you observed changes, what impact did it have on you and your family?
a. Impact 1:
b. Impact 2:
50.2 What impact did it have on your livestock/agriculture?
a. Impact 1:
b. Impact 2:

68
50.3 Due to observed changes, what did you change regarding your livestock and agriculture or other issues?
a. Change 1:
b. Change 2:
50.4 What are you already doing or planning to do to be prepared for such incidences/changes in the future?
a. Preparation 1:
b. Preparation 2:
PART J: ECONOMIC SITUATION
51. to 53. Interviewer: Ask questions 51 to 53 in Table on page 1
54.1 Do you have additional sources of household income? [tick once]
1 = Yes 2 = No 88 = DK 99 = RA
54.2 If Yes, what kind of sources? [tick all, mark DK, RA]
Type of Sources* Amount per year in KSH
a. 1.
b. 2.
C 3.
*1=Transfer from relative abroad 2 = Transfer from relative in Kenya 3 = Gifts
4 = Saving Clubs/Microfinance 5 = Credit from bank/friend/project 6 = Food and animals
7 = Other (fill in row 8 = Other: ………………………… 88 = DK 99 = RA
55. Please share with us your monthly expenditures in KSH. [Reassure the interviewee that information will be treated anonymously at all times. Note monthly OR anural amount, preferably monthl. Enter DK/RA were applicable.]
Items of Expenditure KSH/month KSH/year

69
55.1 Household expenditures (food, soap, phone, taxes)
55.2 Health
55.3 Education/School
55.4 Agriculture (incl. of staff, equipment) Check questions above
55.5 Livestock (incl. of staff, veterinary services) Check questions above
55.6 Social expenditures (gifts, weddings)
55.7 Transport
55.8 Rent: agricultural land
55.9 Rent: for house
55.10 Total
56. How do you assess the economic situation of your household? [tick only once]
1 = Very poor, there is sometimes even not enough food available
4 = Moderate, enough money even for some luxurious objects like motorbikes, car or computer
2 = Poor, but have no food problems and only sometimes problems to buy clothes
5 = Good, can run a good car, own good house, have many luxurious objects
3 = Moderate, enough money for food, clothes, health care, school
88 = DK 99 = RA
57. If you would have the ability to spend more money from additional income what would be your priorities? [respondent should give priority numbers from 1 (very important), 2 (a bit less important) to 3 (less important); please ask the question openly and tick respective given answers]
Priority Items Priority Items
57.1 Better food 57.9 Open shop or start business
57.2 Better clothes 57.10
Start professional training / studies
57.3 Repair, rebuilt house 57.11 Buy livestock
57.4 Better health services 57.12 Hire farm staff
57.5
Better schools (clothing, books)
57.13Buy livestock goods/equipment
57.6
Better water/sanitation/ sewerage system
57.14 Buy seeds/trees
57.7 Electricity supply 57.15
Buy agricultural goods/equipment

70
57.8 Buy car or motorbike 57.16 Other:
Enumerator, please thank the interview partner for their efforts and time!
58. Evaluation of interview:
How do you assess the sincerity of the interviewed person?
1 = Sincere
2 = Not sincere
3 = Can not estimate the sincerity
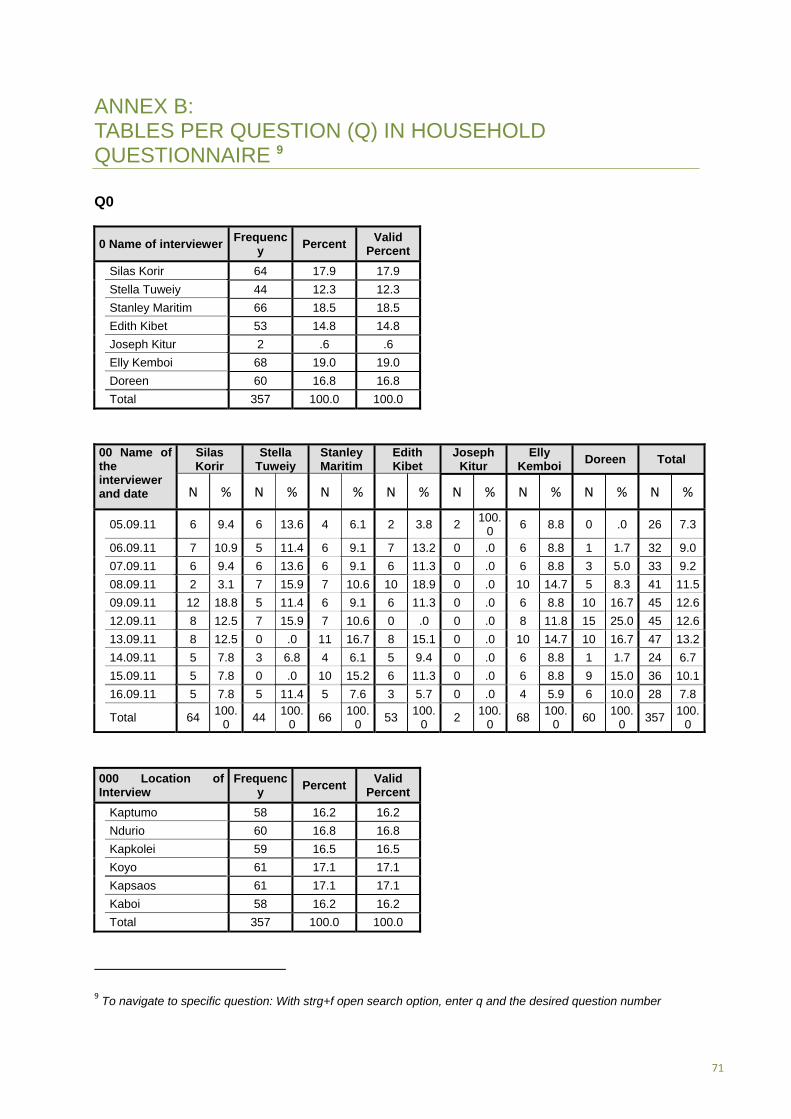
71
ANNEX B: TABLES PER QUESTION (Q) IN HOUSEHOLD QUESTIONNAIRE 9
Q0
0 Name of interviewer Frequenc
y Percent
Valid Percent
Silas Korir 64 17.9 17.9
Stella Tuweiy 44 12.3 12.3
Stanley Maritim 66 18.5 18.5
Edith Kibet 53 14.8 14.8
Joseph Kitur 2 .6 .6
Elly Kemboi 68 19.0 19.0
Doreen 60 16.8 16.8
Total 357 100.0 100.0
00 Name of the interviewer and date
Silas Korir
Stella Tuweiy
Stanley Maritim
Edith Kibet
Joseph Kitur
Elly Kemboi
Doreen Total
N % N % N % N % N % N % N % N %
05.09.11 6 9.4 6 13.6 4 6.1 2 3.8 2 100.
0 6 8.8 0 .0 26 7.3
06.09.11 7 10.9 5 11.4 6 9.1 7 13.2 0 .0 6 8.8 1 1.7 32 9.0
07.09.11 6 9.4 6 13.6 6 9.1 6 11.3 0 .0 6 8.8 3 5.0 33 9.2
08.09.11 2 3.1 7 15.9 7 10.6 10 18.9 0 .0 10 14.7 5 8.3 41 11.5
09.09.11 12 18.8 5 11.4 6 9.1 6 11.3 0 .0 6 8.8 10 16.7 45 12.6
12.09.11 8 12.5 7 15.9 7 10.6 0 .0 0 .0 8 11.8 15 25.0 45 12.6
13.09.11 8 12.5 0 .0 11 16.7 8 15.1 0 .0 10 14.7 10 16.7 47 13.2
14.09.11 5 7.8 3 6.8 4 6.1 5 9.4 0 .0 6 8.8 1 1.7 24 6.7
15.09.11 5 7.8 0 .0 10 15.2 6 11.3 0 .0 6 8.8 9 15.0 36 10.1
16.09.11 5 7.8 5 11.4 5 7.6 3 5.7 0 .0 4 5.9 6 10.0 28 7.8
Total 64 100.
0 44
100.0
66 100.
0 53
100.0
2 100.
0 68
100.0
60 100.
0 357
100.0
000 Location of Interview
Frequency
Percent Valid
Percent
Kaptumo 58 16.2 16.2
Ndurio 60 16.8 16.8
Kapkolei 59 16.5 16.5
Koyo 61 17.1 17.1
Kapsaos 61 17.1 17.1
Kaboi 58 16.2 16.2
Total 357 100.0 100.0
9 To navigate to specific question: With strg+f open search option, enter q and the desired question number
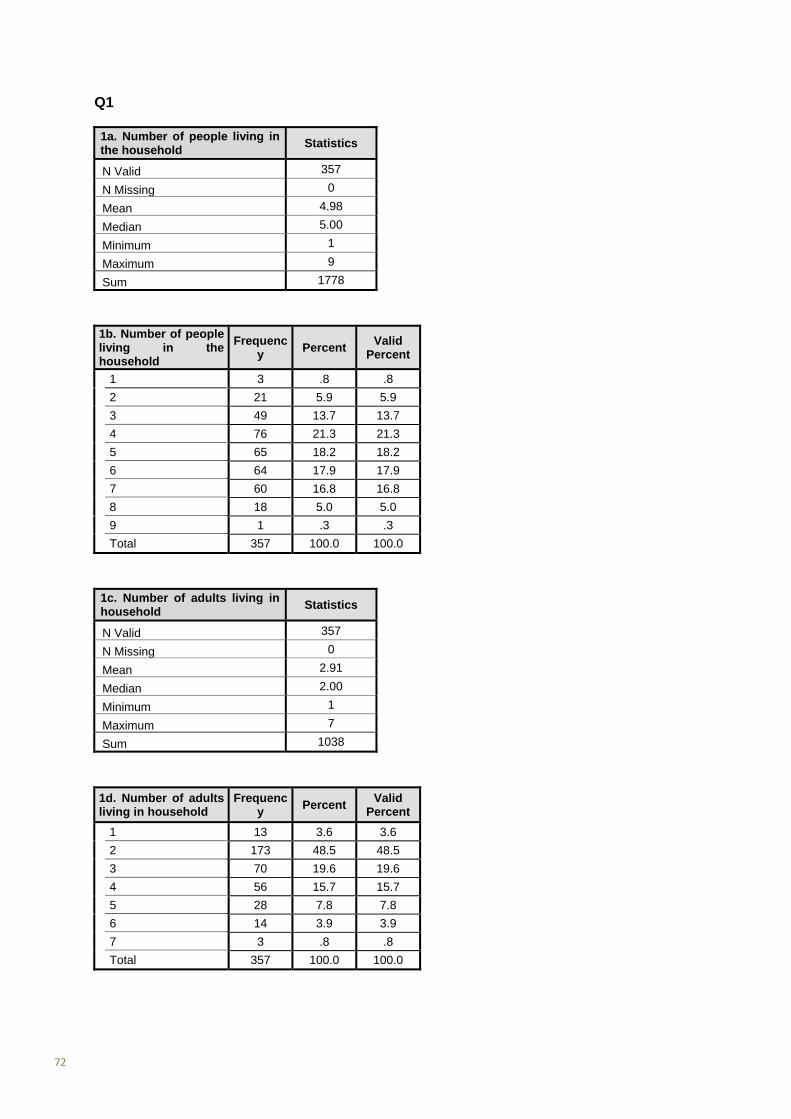
72
Q1
1a. Number of people living in the household
Statistics
N Valid 357
N Missing 0
Mean 4.98
Median 5.00
Minimum 1
Maximum 9
Sum 1778
1b. Number of people living in the household
Frequency
Percent Valid
Percent
1 3 .8 .8
2 21 5.9 5.9
3 49 13.7 13.7
4 76 21.3 21.3
5 65 18.2 18.2
6 64 17.9 17.9
7 60 16.8 16.8
8 18 5.0 5.0
9 1 .3 .3
Total 357 100.0 100.0
1c. Number of adults living in household
Statistics
N Valid 357
N Missing 0
Mean 2.91
Median 2.00
Minimum 1
Maximum 7
Sum 1038
1d. Number of adults living in household
Frequency
Percent Valid
Percent
1 13 3.6 3.6
2 173 48.5 48.5
3 70 19.6 19.6
4 56 15.7 15.7
5 28 7.8 7.8
6 14 3.9 3.9
7 3 .8 .8
Total 357 100.0 100.0

73
1f. Number of children living in household
Frequency
Percent Valid
Percent
1 59 16.5 21.8
2 74 20.7 27.3
3 62 17.4 22.9
4 47 13.2 17.3
5 21 5.9 7.7
6 8 2.2 3.0
Total 271 75.9 100.0
1g. Number of elderly (over 65) living in the household
Statistics
N Valid 89
N Missing 268
Mean 1.37
Median 1.00
Minimum 1
Maximum 2
Sum 122
1h. Number of elderly (over 65) living in the household
Frequency
Percent Valid
Percent
1 56 15.7 62.9
2 33 9.2 37.1
Total 89 24.9 100.0
1i. Sex of interview partner
Frequency
Percent Valid
Percent
Woman 204 57.1 57.5
Man 145 40.6 40.8 Woman and Man together
4 1.1 1.1
Boy 1 .3 .3
Boy and girl together 1 .3 .3
Total 355 99.4 100.0
1e. Number of children living in household
Statistics
N Valid 271
N Missing 86
Mean 2.71
Median 3.00
Minimum 1
Maximum 6
Sum 734
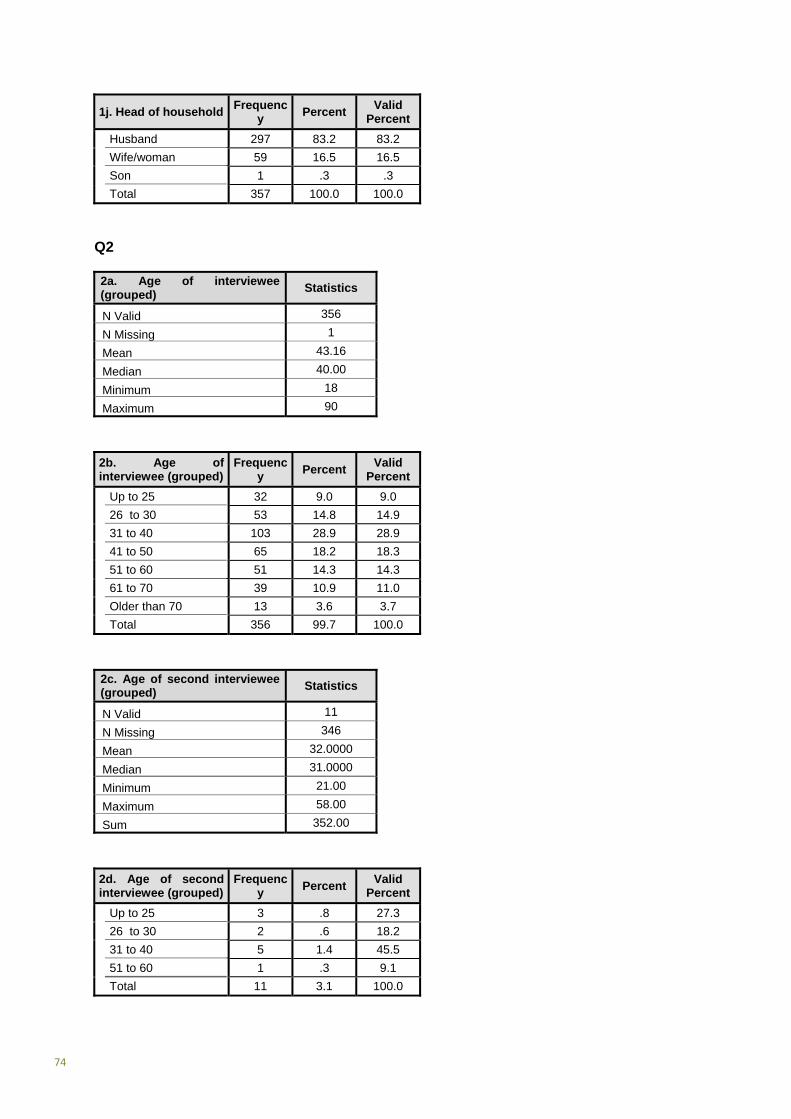
74
1j. Head of household Frequenc
y Percent
Valid Percent
Husband 297 83.2 83.2
Wife/woman 59 16.5 16.5
Son 1 .3 .3
Total 357 100.0 100.0
Q2
2a. Age of interviewee (grouped)
Statistics
N Valid 356
N Missing 1
Mean 43.16
Median 40.00
Minimum 18
Maximum 90
2b. Age of interviewee (grouped)
Frequency
Percent Valid
Percent
Up to 25 32 9.0 9.0
26 to 30 53 14.8 14.9
31 to 40 103 28.9 28.9
41 to 50 65 18.2 18.3
51 to 60 51 14.3 14.3
61 to 70 39 10.9 11.0
Older than 70 13 3.6 3.7
Total 356 99.7 100.0
2c. Age of second interviewee (grouped)
Statistics
N Valid 11
N Missing 346
Mean 32.0000
Median 31.0000
Minimum 21.00
Maximum 58.00
Sum 352.00
2d. Age of second interviewee (grouped)
Frequency
Percent Valid
Percent
Up to 25 3 .8 27.3
26 to 30 2 .6 18.2
31 to 40 5 1.4 45.5
51 to 60 1 .3 9.1
Total 11 3.1 100.0
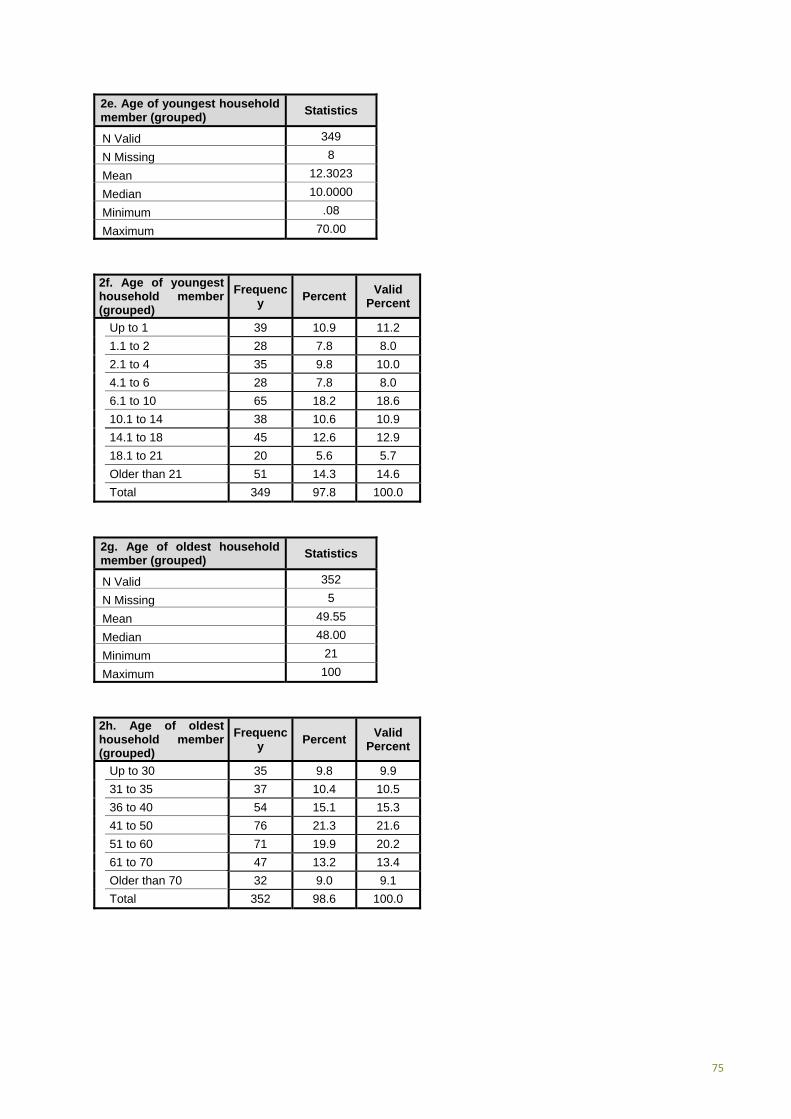
75
2e. Age of youngest household member (grouped)
Statistics
N Valid 349
N Missing 8
Mean 12.3023
Median 10.0000
Minimum .08
Maximum 70.00
2f. Age of youngest household member (grouped)
Frequency
Percent Valid
Percent
Up to 1 39 10.9 11.2
1.1 to 2 28 7.8 8.0
2.1 to 4 35 9.8 10.0
4.1 to 6 28 7.8 8.0
6.1 to 10 65 18.2 18.6
10.1 to 14 38 10.6 10.9
14.1 to 18 45 12.6 12.9
18.1 to 21 20 5.6 5.7
Older than 21 51 14.3 14.6
Total 349 97.8 100.0
2g. Age of oldest household member (grouped)
Statistics
N Valid 352
N Missing 5
Mean 49.55
Median 48.00
Minimum 21
Maximum 100
2h. Age of oldest household member (grouped)
Frequency
Percent Valid
Percent
Up to 30 35 9.8 9.9
31 to 35 37 10.4 10.5
36 to 40 54 15.1 15.3
41 to 50 76 21.3 21.6
51 to 60 71 19.9 20.2
61 to 70 47 13.2 13.4
Older than 70 32 9.0 9.1
Total 352 98.6 100.0
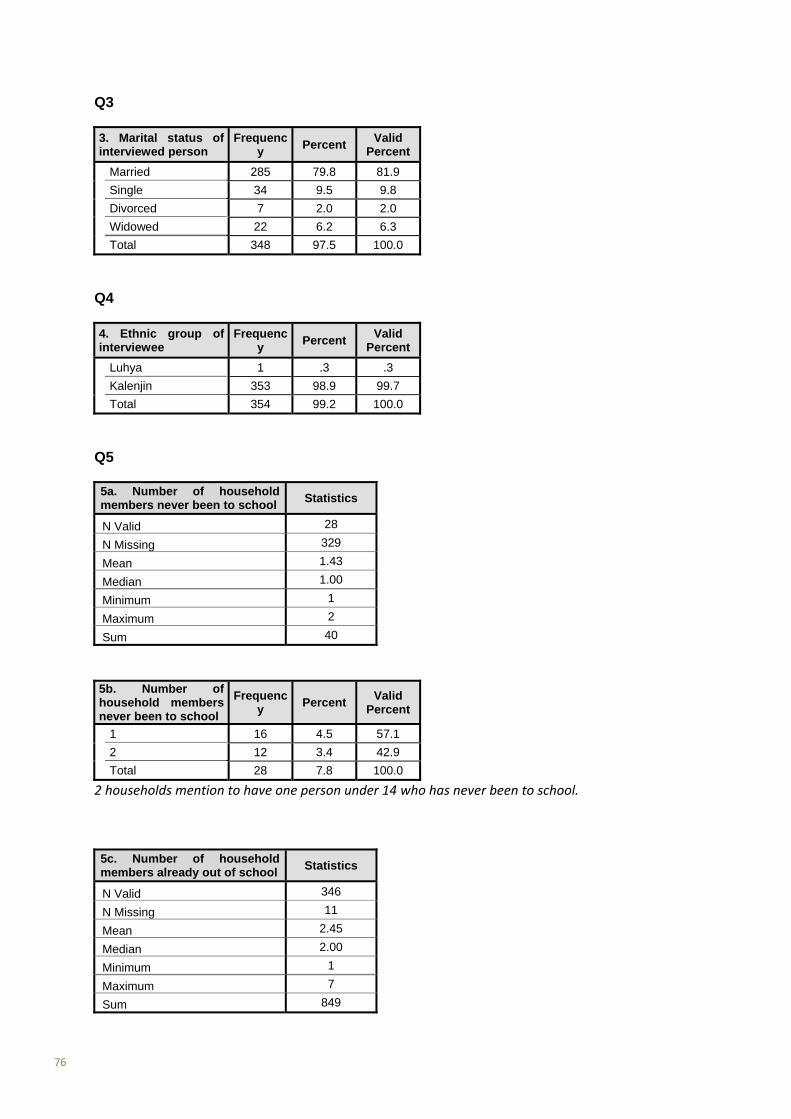
76
Q3
3. Marital status of interviewed person
Frequency
Percent Valid
Percent
Married 285 79.8 81.9
Single 34 9.5 9.8
Divorced 7 2.0 2.0
Widowed 22 6.2 6.3
Total 348 97.5 100.0
Q4
4. Ethnic group of interviewee
Frequency
Percent Valid
Percent
Luhya 1 .3 .3
Kalenjin 353 98.9 99.7
Total 354 99.2 100.0
Q5
5a. Number of household members never been to school
Statistics
N Valid 28
N Missing 329
Mean 1.43
Median 1.00
Minimum 1
Maximum 2
Sum 40
5b. Number of household members never been to school
Frequency
Percent Valid
Percent
1 16 4.5 57.1
2 12 3.4 42.9
Total 28 7.8 100.0
2 households mention to have one person under 14 who has never been to school.
5c. Number of household members already out of school
Statistics
N Valid 346
N Missing 11
Mean 2.45
Median 2.00
Minimum 1
Maximum 7
Sum 849

77
5d. Number of household members already out of school
Frequency
Percent Valid
Percent
1 30 8.4 8.7
2 211 59.1 61.0
3 54 15.1 15.6
4 28 7.8 8.1
5 16 4.5 4.6
6 6 1.7 1.7
7 1 .3 .3
Total 346 96.9 100.0
In two households (one and two) children less than 14 years old have already left school.
5e. Number of household members currently in school
Statistics
N Valid 279
N Missing 78
Mean 2.71
Median 2.00
Minimum 1
Maximum 6
Sum 756
5f. Number of household members currently in school
Frequency
Percent Valid
Percent
1 61 17.1 21.9
2 80 22.4 28.7
3 59 16.5 21.1
4 44 12.3 15.8
5 28 7.8 10.0
6 7 2.0 2.5
Total 279 78.2 100.0
Q6
6. Number of invalid children in the household
Frequency
Percent Valid
Percent
1 4 1.1 66.7
2 2 .6 33.3
Total 6 1.7 100.0
7 households mention to have an adult invalid household member.

78
Q7
7a. Interviewee participated in the project
Frequency
Percent Valid
Percent
Yes 136 37.8 37.9
No 220 61.9 62.1
Total 356 99.7 100.0
7b. Interviewee participated in the project (1)
Participation in Training
Participation in Workshop
Participation in awareness campaigns
Registered farmer at
chilling plant
Shareholder with DFBA
Yes 61 17.1 4 1.1 13 3.6 74 20.7 15 4.2
No 296 82.9 353 98.9 344 96.4 283 79.3 342 95.8
Total 357 100.0 357 100.0 357 100.0 357 100.0 357 100.0
7c.Interviewee participated in the project (2)
Milk supplier
Participation in Learning
and Exchange trips
Cattle has received AI
Extension worker or trainer for
EADD
Access to 'check off'
Yes 113 31.7 2 0.6 8 2.2 0 0 1 0.3
No 244 68.3 355 99.4 349 97.8 357 100.0 356 99.7
Total 357 100.0 357 100.0 357 100.0 357 100.0 357 100.0
The term ‘check off’ might have been misunderstood by interview partners. From other interviews and other answers in the questionnaire, it is known that many of the project beneficiaries value the possibility to have access to loans, get paid in advance and purchase certain goods or pay certain bills (e.g. school fees) with the assistance of the chilling plant. See questions XYZ
7d. Number of different activities/participations in project
Statistics
N Valid 136
N Missing 221
Mean 2.1397
Median 2.0000
Minimum 1.00
Maximum 6.00
Sum 291.00
7e. Number of different activities/participations in project
Frequency
Percent Valid
Percent
1.00 32 9.0 23.5
2.00 67 18.8 49.3
3.00 29 8.1 21.3
4.00 3 .8 2.2
5.00 4 1.1 2.9
6.00 1 .3 .7
Total 136 38.1 100.0
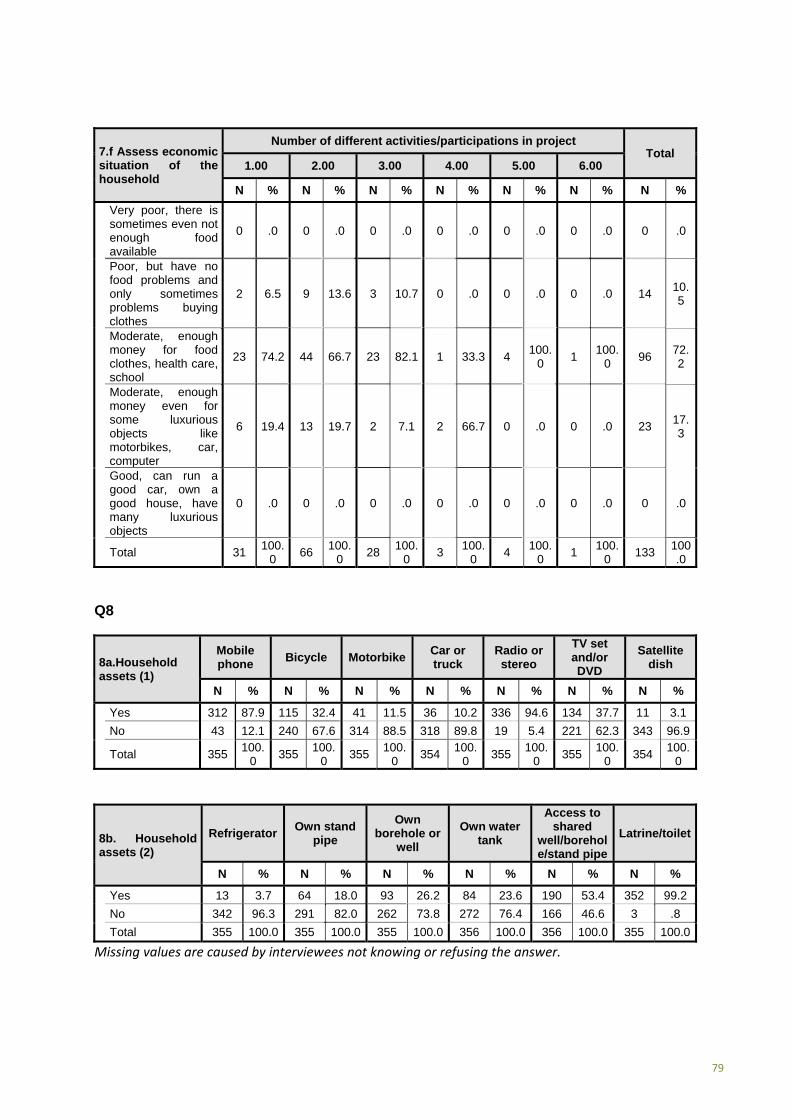
79
7.f Assess economic situation of the household
Number of different activities/participations in project Total
1.00 2.00 3.00 4.00 5.00 6.00
N % N % N % N % N % N % N %
Very poor, there is sometimes even not enough food available
0 .0 0 .0 0 .0 0 .0 0 .0 0 .0 0 .0
Poor, but have no food problems and only sometimes problems buying clothes
2 6.5 9 13.6 3 10.7 0 .0 0 .0 0 .0 14 10.5
Moderate, enough money for food clothes, health care, school
23 74.2 44 66.7 23 82.1 1 33.3 4 100.
0 1
100.0
96 72.2
Moderate, enough money even for some luxurious objects like motorbikes, car, computer
6 19.4 13 19.7 2 7.1 2 66.7 0 .0 0 .0 23 17.3
Good, can run a good car, own a good house, have many luxurious objects
0 .0 0 .0 0 .0 0 .0 0 .0 0 .0 0 .0
Total 31 100.
0 66
100.0
28 100.
0 3
100.0
4 100.
0 1
100.0
133 100.0
Q8
8a.Household assets (1)
Mobile phone
Bicycle MotorbikeCar or truck
Radio or stereo
TV set and/or DVD
Satellite dish
N % N % N % N % N % N % N %
Yes 312 87.9 115 32.4 41 11.5 36 10.2 336 94.6 134 37.7 11 3.1
No 43 12.1 240 67.6 314 88.5 318 89.8 19 5.4 221 62.3 343 96.9
Total 355 100.
0 355
100.0
355 100.
0 354
100.0
355 100.
0 355
100.0
354 100.
0
8b. Household assets (2)
Refrigerator Own stand
pipe
Own borehole or
well
Own water tank
Access to shared
well/borehole/stand pipe
Latrine/toilet
N % N % N % N % N % N %
Yes 13 3.7 64 18.0 93 26.2 84 23.6 190 53.4 352 99.2
No 342 96.3 291 82.0 262 73.8 272 76.4 166 46.6 3 .8
Total 355 100.0 355 100.0 355 100.0 356 100.0 356 100.0 355 100.0
Missing values are caused by interviewees not knowing or refusing the answer.

80
Q9
9a. Main energy resource of household
Frequency
Percent Valid
Percent
Wood 352 98.6 98.6
Charcoal 5 1.4 1.4
Total 357 100.0 100.0
9b. Second main energy resource of household
Frequency
Percent Valid
Percent
Biogas (stove) 2 .6 11.1
Electricity 16 4.5 88.9
Total 18 5.0 100.0
2 households mention to have Solar panel as their third source of energy.
9c.Wood required per week per hh in kg
Statistics
N Valid 340
N Missing 12
Mean 210.9000
Median 140.0000
Minimum 4.00
Maximum 1820.00
Sum 71706.00
The minimum consumption of wood per household in one week is 4kg and a maximum of 1820kg. The average is 210kg per household per week and the median can be found at 140kg per week.
Looking at the per capita consumption in the household the minimum is 0.67kg per week and the maximum 455kg, with a mean average of 49.34kg and 30kg as the median average.
9d. Wood required per week per hh in kg (grouped)
Frequency
Percent Valid
Percent
Up to 25 18 5.1 5.3
26 to 50 39 11.1 11.5
51 to100 62 17.6 18.2
101 to 150 60 17.0 17.6
151 to 200 50 14.2 14.7
201 to 300 60 17.0 17.6
301 to 500 28 8.0 8.2
More than 500 23 6.5 6.8
Total 340 96.6 100.0
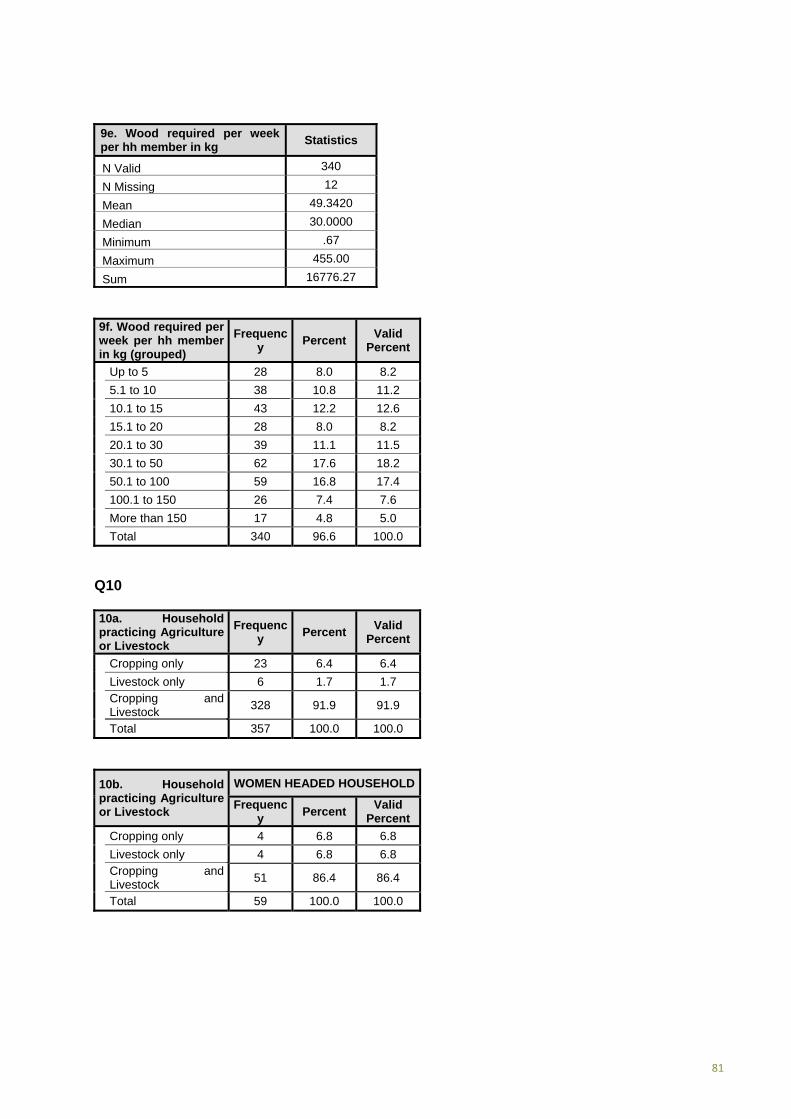
81
9e. Wood required per week per hh member in kg
Statistics
N Valid 340
N Missing 12
Mean 49.3420
Median 30.0000
Minimum .67
Maximum 455.00
Sum 16776.27
9f. Wood required per week per hh member in kg (grouped)
Frequency
Percent Valid
Percent
Up to 5 28 8.0 8.2
5.1 to 10 38 10.8 11.2
10.1 to 15 43 12.2 12.6
15.1 to 20 28 8.0 8.2
20.1 to 30 39 11.1 11.5
30.1 to 50 62 17.6 18.2
50.1 to 100 59 16.8 17.4
100.1 to 150 26 7.4 7.6
More than 150 17 4.8 5.0
Total 340 96.6 100.0
Q10
10a. Household practicing Agriculture or Livestock
Frequency
Percent Valid
Percent
Cropping only 23 6.4 6.4
Livestock only 6 1.7 1.7 Cropping and Livestock
328 91.9 91.9
Total 357 100.0 100.0
10b. Household practicing Agriculture or Livestock
WOMEN HEADED HOUSEHOLD
Frequency
Percent Valid
Percent
Cropping only 4 6.8 6.8
Livestock only 4 6.8 6.8 Cropping and Livestock
51 86.4 86.4
Total 59 100.0 100.0

82
Q11
11a. Farm assets (1)
Shovel Hoe Machete Plough Mechanica
l Plough
Ox or donkey
cart Tractor Thresher
Biogas digester
N % N % N % N % N % N % N % N % N %
Yes 277 82.4 334 99.7 235 69.9 59 17.6 3 .9 26 7.7 5 1.5 2 .6 2 .6
No 59 17.6 1 .3 101 30.1 277 82.4 333 99.1 310 92.3 331 98.5 334 99.4 334 99.4
Total 336 100.0 335 100.0 336 100.0 336 100.0 336 100.0 336 100.0 336 100.0 336 100.0 336 100.0
11b. Farm assets (2)
Milking parlour
Milking machine
Teat dip Knap sack
sprayer
Separation from animal
and human
Barn for livestock
Pulveriser
Chaff cutter
N % N % N % N % N % N % N % N %
Yes 151 44.9 2 .6 4 1.2 229 68.2 137 40.9 67 19.9 2 .6 11 3.3
No 185 55.1 334 99.4 332 98.8 107 31.8 198 59.1 269 80.1 334 99.4 325 96.7
Total 336 100.
0 336
100.0
336 100.
0 336
100.0
335100.
0 336
100.0
336 100.
0 336
100.0
Missing values are caused by interviewees not knowing or refusing the answer.
Q12
12a. Statistics of livestock
Number of owned
pigs
Number of owned goats
Number of owned sheep
Number of owned
chicken
Number of owned cattle
Number of owned donkey
N Valid 0 93 98 238 331 17
N Missing 357 264 259 119 26 340
Mean 4.5806 3.73 11.46 5.46 1.41
Median 3.0000 3.00 10.00 5.00 1.00
Minimum 1.00 1 1 1 1
Maximum 30.00 18 100 22 4
Sum 426.00 366 2727 1808 24
12b. Number of owned goats
Frequency PercentValid
Percent
1.00 13 3.6 14.0
2.00 20 5.6 21.5
3.00 16 4.5 17.2
4.00 21 5.9 22.6
5.00 8 2.2 8.6
6.00 1 .3 1.1
7.00 1 .3 1.1
8.00 1 .3 1.1
10.00 7 2.0 7.5
20.00 4 1.1 4.3
30.00 1 .3 1.1
Total 93 26.1 100.0

83
12c. Number of owned sheep
Frequency Percent Valid Percent
1 16 4.5 16.3
2 24 6.7 24.5
3 19 5.3 19.4
4 13 3.6 13.3
5 9 2.5 9.2
6 3 .8 3.1
7 5 1.4 5.1
8 4 1.1 4.1
10 3 .8 3.1
15 1 .3 1.0
18 1 .3 1.0
Total 98 27.5 100.0
12d. Number of owned chicken (grouped)
Frequency PercentValid
Percent
Up to 2 19 5.3 8.0
2 to 4 23 6.4 9.7
4 to 6 43 12.0 18.1
6 to 8 20 5.6 8.4
8 to 10 68 19.0 28.6
10 to 15 27 7.6 11.3
15 to 20 18 5.0 7.6
More than 20 20 5.6 8.4
Total 238 66.7 100.0
12e. Number of owned cattle (grouped)
Frequency PercentValid
Percent
Up to 2 60 16.8 18.1
2 to 4 100 28.0 30.2
4 to 6 70 19.6 21.1
6 to 8 48 13.4 14.5
8 to 10 27 7.6 8.2
More than 10 26 7.3 7.9
Total 331 92.7 100.0
12f. Number of owned donkey Frequency Percent
Valid Percent
1 12 3.4 70.6
2 4 1.1 23.5
4 1 .3 5.9
Total 17 4.8 100.0
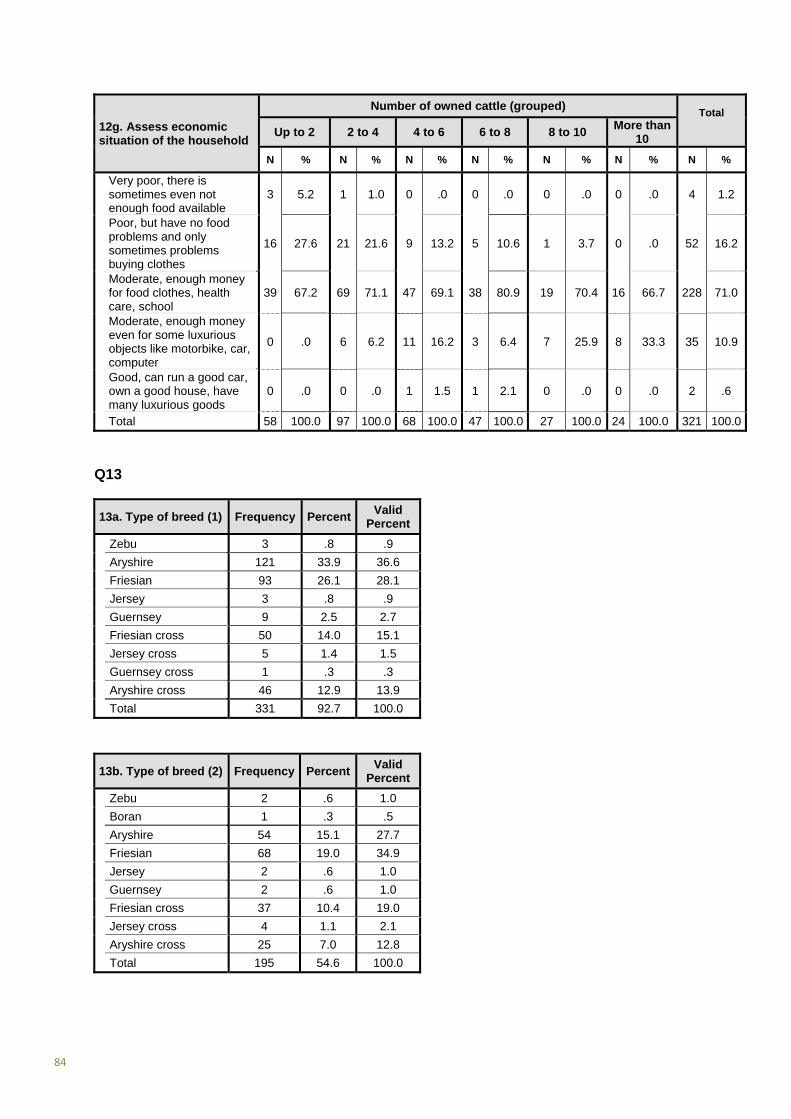
84
12g. Assess economic situation of the household
Number of owned cattle (grouped) Total
Up to 2 2 to 4 4 to 6 6 to 8 8 to 10 More than
10
N % N % N % N % N % N % N %
Very poor, there is sometimes even not enough food available
3 5.2 1 1.0 0 .0 0 .0 0 .0 0 .0 4 1.2
Poor, but have no food problems and only sometimes problems buying clothes
16 27.6 21 21.6 9 13.2 5 10.6 1 3.7 0 .0 52 16.2
Moderate, enough money for food clothes, health care, school
39 67.2 69 71.1 47 69.1 38 80.9 19 70.4 16 66.7 228 71.0
Moderate, enough money even for some luxurious objects like motorbike, car, computer
0 .0 6 6.2 11 16.2 3 6.4 7 25.9 8 33.3 35 10.9
Good, can run a good car, own a good house, have many luxurious goods
0 .0 0 .0 1 1.5 1 2.1 0 .0 0 .0 2 .6
Total 58 100.0 97 100.0 68 100.0 47 100.0 27 100.0 24 100.0 321 100.0
Q13
13a. Type of breed (1) Frequency PercentValid
Percent
Zebu 3 .8 .9
Aryshire 121 33.9 36.6
Friesian 93 26.1 28.1
Jersey 3 .8 .9
Guernsey 9 2.5 2.7
Friesian cross 50 14.0 15.1
Jersey cross 5 1.4 1.5
Guernsey cross 1 .3 .3
Aryshire cross 46 12.9 13.9
Total 331 92.7 100.0
13b. Type of breed (2) Frequency PercentValid
Percent
Zebu 2 .6 1.0
Boran 1 .3 .5
Aryshire 54 15.1 27.7
Friesian 68 19.0 34.9
Jersey 2 .6 1.0
Guernsey 2 .6 1.0
Friesian cross 37 10.4 19.0
Jersey cross 4 1.1 2.1
Aryshire cross 25 7.0 12.8
Total 195 54.6 100.0
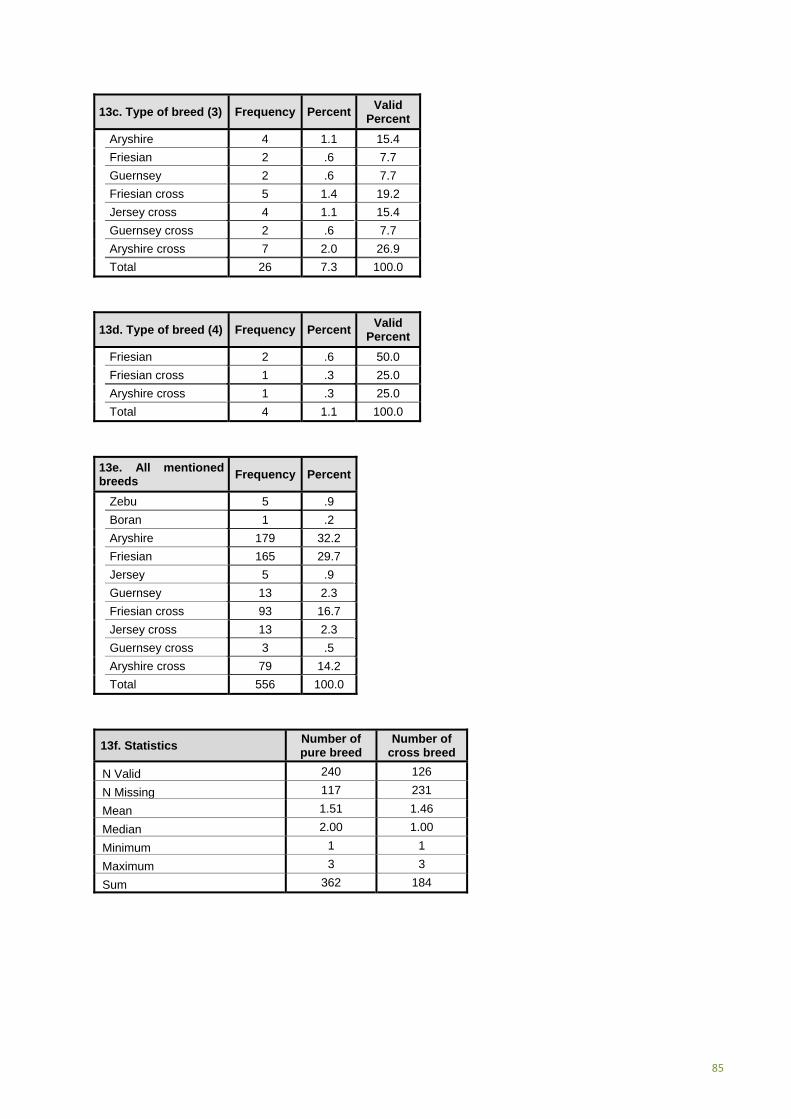
85
13c. Type of breed (3) Frequency PercentValid
Percent
Aryshire 4 1.1 15.4
Friesian 2 .6 7.7
Guernsey 2 .6 7.7
Friesian cross 5 1.4 19.2
Jersey cross 4 1.1 15.4
Guernsey cross 2 .6 7.7
Aryshire cross 7 2.0 26.9
Total 26 7.3 100.0
13d. Type of breed (4) Frequency PercentValid
Percent
Friesian 2 .6 50.0
Friesian cross 1 .3 25.0
Aryshire cross 1 .3 25.0
Total 4 1.1 100.0
13e. All mentioned breeds
Frequency Percent
Zebu 5 .9
Boran 1 .2
Aryshire 179 32.2
Friesian 165 29.7
Jersey 5 .9
Guernsey 13 2.3
Friesian cross 93 16.7
Jersey cross 13 2.3
Guernsey cross 3 .5
Aryshire cross 79 14.2
Total 556 100.0
13f. Statistics Number of pure breed
Number of cross breed
N Valid 240 126
N Missing 117 231
Mean 1.51 1.46
Median 2.00 1.00
Minimum 1 1
Maximum 3 3
Sum 362 184

86
13g. Number of pure breed
Frequency PercentValid
Percent
1 119 33.3 49.6
2 120 33.6 50.0
3 1 .3 .4
Total 240 67.2 100.0
13h. Number of cross breed
Frequency PercentValid
Percent
1 72 20.2 57.1
2 50 14.0 39.7
3 4 1.1 3.2
Total 126 35.3 100.0
13i. Statistics 2. Number
of bulls 3. Number
of oxen
4.a Number of milk cows
4.b Number of cows
5. Number of heifers
6. Number of female
calves
7. Number of male calves
N Valid 68 43 298 89 147 222 172
N Missing 289 314 59 268 210 135 185
Mean 1.28 1.67 2.43 1.72 1.67 1.33 1.22
Median 1.00 1.00 2.00 1.00 1.00 1.00 1.00
Minimum 1 1 1 1 1 1 1
Maximum 3 7 8 7 7 4 5
Sum 87 72 724 153 245 295 210
13j. 2 Number of bulls Frequency PercentValid
Percent
1 51 14.3 75.0
2 15 4.2 22.1
3 2 .6 2.9
Total 68 19.0 100.0
13k. 3 Number of oxen
Frequency PercentValid
Percent
1 26 7.3 60.5
2 11 3.1 25.6
3 3 .8 7.0
4 2 .6 4.7
7 1 .3 2.3
Total 43 12.0 100.0

87
13l. 4a Number of milk cows
Frequency PercentValid
Percent
1 93 26.1 31.2
2 90 25.2 30.2
3 57 16.0 19.1
4 32 9.0 10.7
5 14 3.9 4.7
6 6 1.7 2.0
7 2 .6 .7
8 4 1.1 1.3
Total 298 83.5 100.0
13m. 4b Number of cows
Frequency PercentValid
Percent
1 53 14.8 59.6
2 19 5.3 21.3
3 12 3.4 13.5
4 2 .6 2.2
5 1 .3 1.1
6 1 .3 1.1
7 1 .3 1.1
Total 89 24.9 100.0
13n. 5 Number of heifers
Frequency PercentValid
Percent
1 86 24.1 58.5
2 45 12.6 30.6
3 8 2.2 5.4
4 2 .6 1.4
5 2 .6 1.4
6 1 .3 .7
7 3 .8 2.0
Total 147 41.2 100.0
13o. 6 Number of female calves
Frequency PercentValid
Percent
1 157 44.0 70.7
2 59 16.5 26.6
3 4 1.1 1.8
4 2 .6 .9
Total 222 62.2 100.0
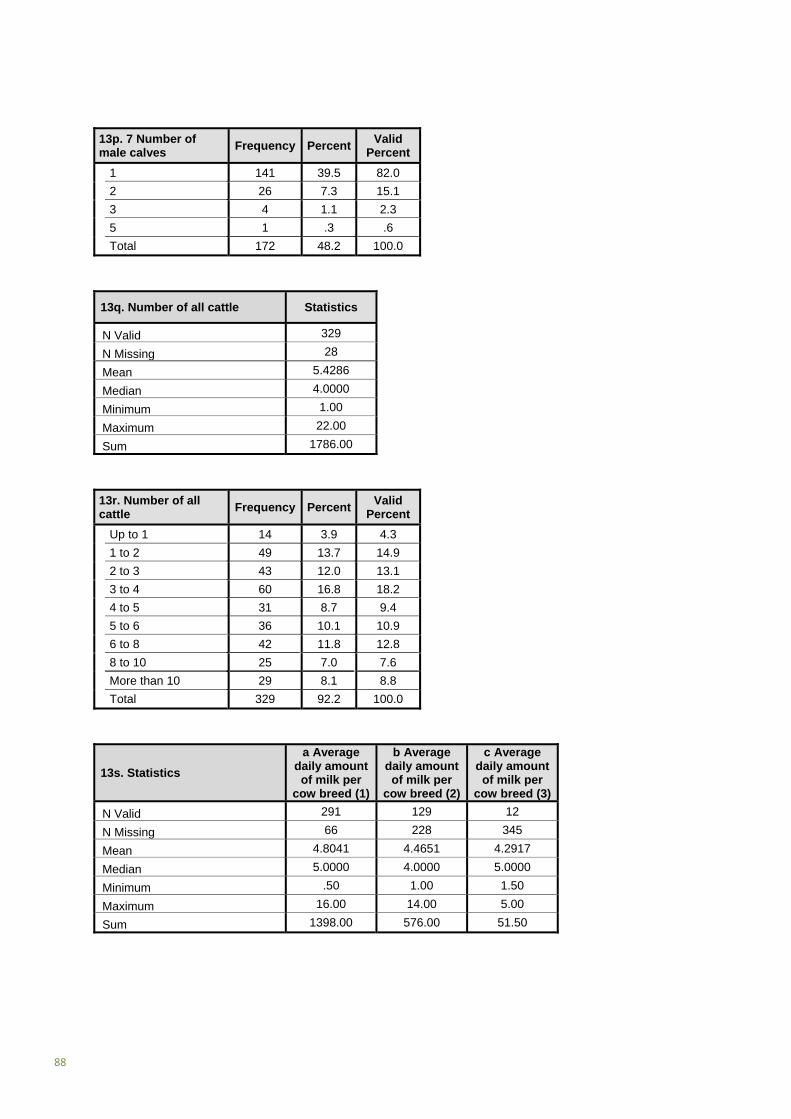
88
13p. 7 Number of male calves
Frequency PercentValid
Percent
1 141 39.5 82.0
2 26 7.3 15.1
3 4 1.1 2.3
5 1 .3 .6
Total 172 48.2 100.0
13q. Number of all cattle Statistics
N Valid 329
N Missing 28
Mean 5.4286
Median 4.0000
Minimum 1.00
Maximum 22.00
Sum 1786.00
13r. Number of all cattle
Frequency PercentValid
Percent
Up to 1 14 3.9 4.3
1 to 2 49 13.7 14.9
2 to 3 43 12.0 13.1
3 to 4 60 16.8 18.2
4 to 5 31 8.7 9.4
5 to 6 36 10.1 10.9
6 to 8 42 11.8 12.8
8 to 10 25 7.0 7.6
More than 10 29 8.1 8.8
Total 329 92.2 100.0
13s. Statistics
a Average daily amount of milk per
cow breed (1)
b Average daily amount of milk per
cow breed (2)
c Average daily amount of milk per
cow breed (3)
N Valid 291 129 12
N Missing 66 228 345
Mean 4.8041 4.4651 4.2917
Median 5.0000 4.0000 5.0000
Minimum .50 1.00 1.50
Maximum 16.00 14.00 5.00
Sum 1398.00 576.00 51.50

89
13s. a Average daily amount of milk per cow breed (1)
Frequency PercentValid
Percent
Up to 2 l 36 10.1 12.4
2.1 to 3l 58 16.2 19.9
3.1 to 4l 47 13.2 16.2
4.1 to 5l 76 21.3 26.1
5.1 to 6l 24 6.7 8.2
6.1 to 8l 28 7.8 9.6
8.1 to 10l 13 3.6 4.5
More than 10l 9 2.5 3.1
Total 291 81.5 100.0
13s. b Average daily amount of milk per cow breed (2)
Frequency PercentValid
Percent
Up to 2 l 25 7.0 19.4
2.1 to 3l 19 5.3 14.7
3.1 to 4l 32 9.0 24.8
4.1 to 5l 20 5.6 15.5
5.1 to 6l 13 3.6 10.1
6.1 to 8l 14 3.9 10.9
8.1 to 10l 4 1.1 3.1
More than 10l 2 .6 1.6
Total 129 36.1 100.0
13s. c Average daily amount of milk per cow breed (3)
Frequency PercentValid
Percent
Up to 2 l 1 .3 8.3
2.1 to 3l 1 .3 8.3
3.1 to 4l 3 .8 25.0
4.1 to 5l 7 2.0 58.3
Total 12 3.4 100.0
13t. a Sell milk of breed (1)
Frequency PercentValid
Percent
Zebu 3 .8 1.2
Aryshire 90 25.2 35.3
Friesian 75 21.0 29.4
Jersey 1 .3 .4
Guernsey 4 1.1 1.6
Friesian cross 45 12.6 17.6
Jersey cross 1 .3 .4
Guernsey cross 1 .3 .4
Aryshire cross 35 9.8 13.7
Total 255 71.4 100.0

90
13t. b Sell milk of breed (2)
Frequency PercentValid
Percent
Zebu 1 .3 .9
Boran 1 .3 .9
Aryshire 32 9.0 29.9
Friesian 41 11.5 38.3
Jersey 1 .3 .9
Friesian cross 16 4.5 15.0
Jersey cross 2 .6 1.9
Aryshire cross 13 3.6 12.1
Total 107 30.0 100.0
13t. c Sell milk of breed (3)
Frequency PercentValid
Percent
Friesian 1 .3 14.3
Guernsey 2 .6 28.6
Friesian cross 2 .6 28.6
Jersey cross 1 .3 14.3
Guernsey cross 1 .3 14.3
Total 7 2.0 100.0
13u. Reason (1) for variation in average volume of milk per day per cow
Frequency PercentValid
Percent
Changes in weather/temperature
43 12.0 21.0
Diseases 2 .6 1.0
Lack of water 5 1.4 2.4
Lactation period 77 21.6 37.6 Quantity/type of feeds
66 18.5 32.2
Feeding concentrates/supplements (increase)
6 1.7 2.9
Drop during rain 5 1.4 2.4
Time of the day 1 .3 .5
Total 205 57.4 100.0
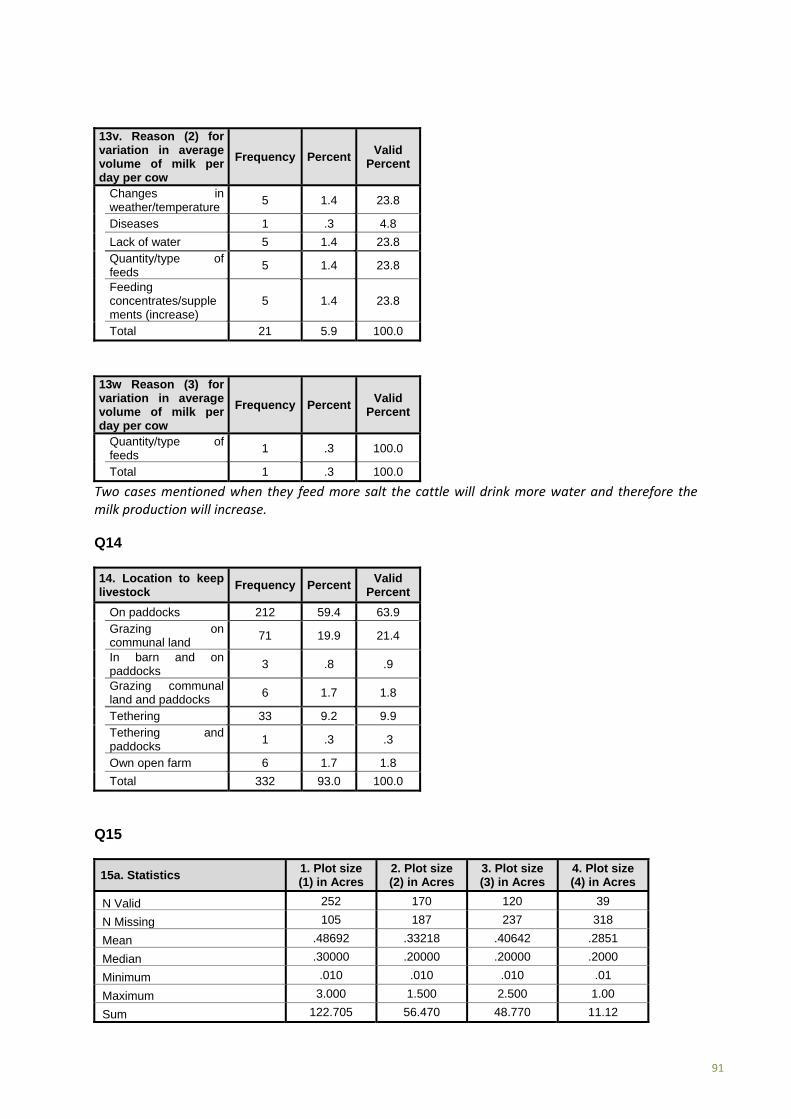
91
13v. Reason (2) for variation in average volume of milk per day per cow
Frequency PercentValid
Percent
Changes in weather/temperature
5 1.4 23.8
Diseases 1 .3 4.8
Lack of water 5 1.4 23.8 Quantity/type of feeds
5 1.4 23.8
Feeding concentrates/supplements (increase)
5 1.4 23.8
Total 21 5.9 100.0
13w Reason (3) for variation in average volume of milk per day per cow
Frequency PercentValid
Percent
Quantity/type of feeds
1 .3 100.0
Total 1 .3 100.0
Two cases mentioned when they feed more salt the cattle will drink more water and therefore the milk production will increase.
Q14
14. Location to keep livestock
Frequency PercentValid
Percent
On paddocks 212 59.4 63.9 Grazing on communal land
71 19.9 21.4
In barn and on paddocks
3 .8 .9
Grazing communal land and paddocks
6 1.7 1.8
Tethering 33 9.2 9.9 Tethering and paddocks
1 .3 .3
Own open farm 6 1.7 1.8
Total 332 93.0 100.0
Q15
15a. Statistics 1. Plot size (1) in Acres
2. Plot size (2) in Acres
3. Plot size (3) in Acres
4. Plot size (4) in Acres
N Valid 252 170 120 39
N Missing 105 187 237 318
Mean .48692 .33218 .40642 .2851
Median .30000 .20000 .20000 .2000
Minimum .010 .010 .010 .01
Maximum 3.000 1.500 2.500 1.00
Sum 122.705 56.470 48.770 11.12
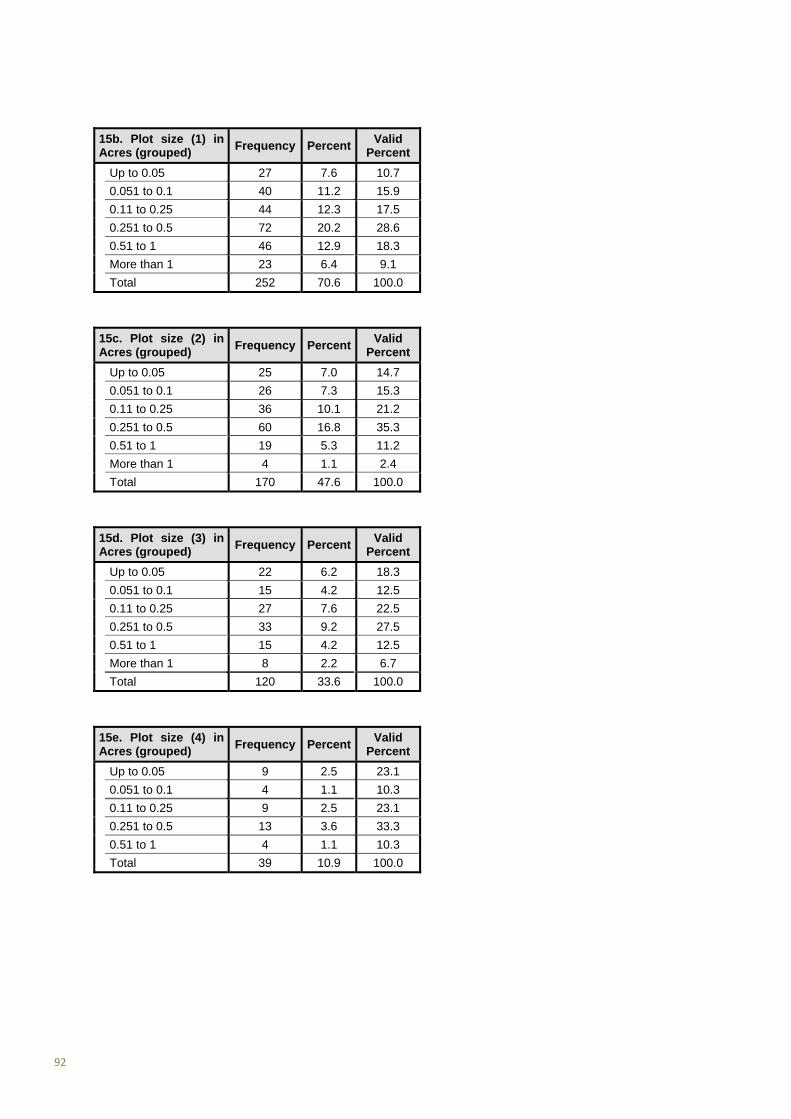
92
15b. Plot size (1) in Acres (grouped)
Frequency PercentValid
Percent
Up to 0.05 27 7.6 10.7
0.051 to 0.1 40 11.2 15.9
0.11 to 0.25 44 12.3 17.5
0.251 to 0.5 72 20.2 28.6
0.51 to 1 46 12.9 18.3
More than 1 23 6.4 9.1
Total 252 70.6 100.0
15c. Plot size (2) in Acres (grouped)
Frequency PercentValid
Percent
Up to 0.05 25 7.0 14.7
0.051 to 0.1 26 7.3 15.3
0.11 to 0.25 36 10.1 21.2
0.251 to 0.5 60 16.8 35.3
0.51 to 1 19 5.3 11.2
More than 1 4 1.1 2.4
Total 170 47.6 100.0
15d. Plot size (3) in Acres (grouped)
Frequency PercentValid
Percent
Up to 0.05 22 6.2 18.3
0.051 to 0.1 15 4.2 12.5
0.11 to 0.25 27 7.6 22.5
0.251 to 0.5 33 9.2 27.5
0.51 to 1 15 4.2 12.5
More than 1 8 2.2 6.7
Total 120 33.6 100.0
15e. Plot size (4) in Acres (grouped)
Frequency PercentValid
Percent
Up to 0.05 9 2.5 23.1
0.051 to 0.1 4 1.1 10.3
0.11 to 0.25 9 2.5 23.1
0.251 to 0.5 13 3.6 33.3
0.51 to 1 4 1.1 10.3
Total 39 10.9 100.0

93
15f. Statistics Average size per cattle on
plot (1)
Average size per cattle on
plot (2)
Average size per cattle on
plot (3)
Average size per cattle on
plot (4)
N Valid 250 170 120 39
N Missing 107 187 237 318
Mean .11654 .074946 .079967 .054367
Median .08333 .060000 .058571 .050000
Minimum .002 .0025 .0029 .0029
Maximum 1.500 .3333 1.0000 .1250
Sum 29.135 12.7409 9.5961 2.1203
15g. Average size per cattle on plot (1) (grouped)
Frequency PercentValid
Percent
Up to 0.01 27 7.6 10.8
0.011 to 0.025 19 5.3 7.6
0.0251 to 0.05 47 13.2 18.8
0.051 to 0.075 26 7.3 10.4
0.0751 to 0.1 41 11.5 16.4
0.101 to 0.15 30 8.4 12.0
0.151 to 0.3 45 12.6 18.0
More than 0.3 15 4.2 6.0
Total 250 70.0 100.0
15h. Average size per cattle on plot (2) (grouped)
Frequency Percent Valid
Percent
Up to 0.01 26 7.3 15.3
0.011 to 0.025 13 3.6 7.6
0.0251 to 0.05 42 11.8 24.7
0.051 to 0.075 25 7.0 14.7
0.0751 to 0.1 28 7.8 16.5
0.101 to 0.15 22 6.2 12.9
0.151 to 0.3 13 3.6 7.6
More than 0.3 1 .3 .6
Total 170 47.6 100.0
15i. Average size per cattle on plot (3) (grouped)
Frequency Percent Valid
Percent
Up to 0.01 23 6.4 19.2
0.011 to 0.025 11 3.1 9.2
0.0251 to 0.05 24 6.7 20.0
0.051 to 0.075 23 6.4 19.2
0.0751 to 0.1 17 4.8 14.2
0.101 to 0.15 12 3.4 10.0
0.151 to 0.3 5 1.4 4.2
More than 0.3 5 1.4 4.2
Total 120 33.6 100.0
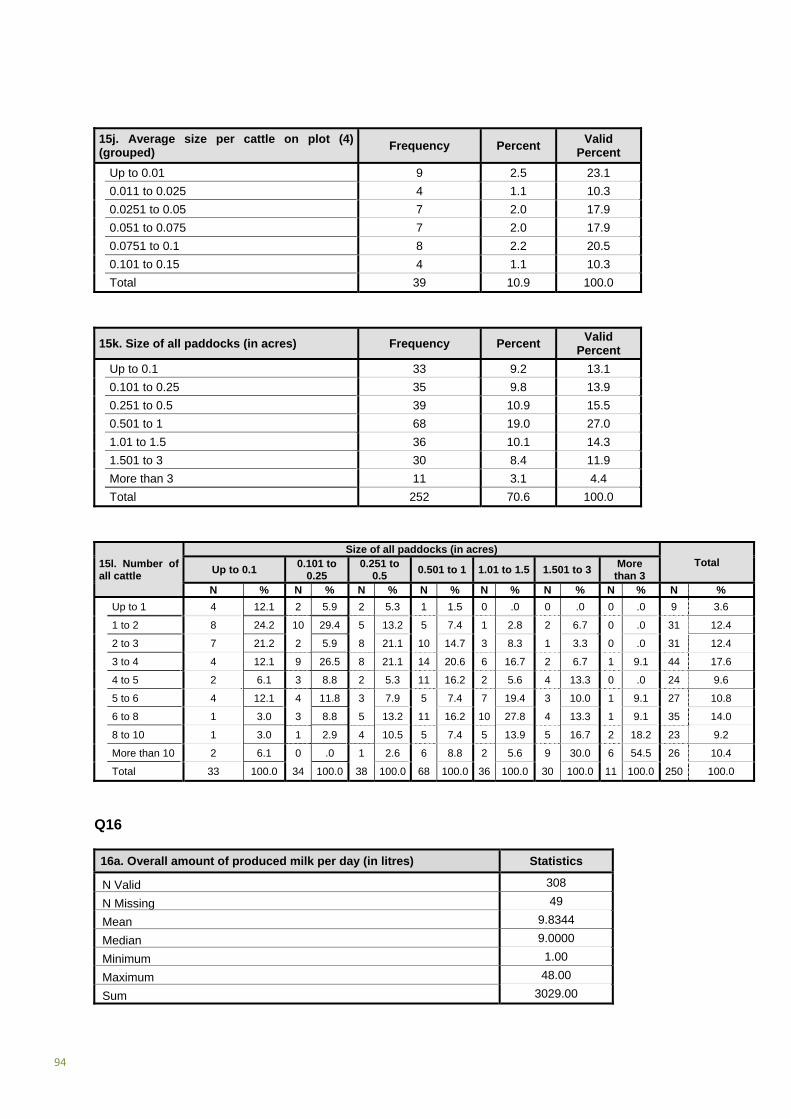
94
15j. Average size per cattle on plot (4) (grouped)
Frequency Percent Valid
Percent
Up to 0.01 9 2.5 23.1
0.011 to 0.025 4 1.1 10.3
0.0251 to 0.05 7 2.0 17.9
0.051 to 0.075 7 2.0 17.9
0.0751 to 0.1 8 2.2 20.5
0.101 to 0.15 4 1.1 10.3
Total 39 10.9 100.0
15k. Size of all paddocks (in acres) Frequency Percent Valid
Percent
Up to 0.1 33 9.2 13.1
0.101 to 0.25 35 9.8 13.9
0.251 to 0.5 39 10.9 15.5
0.501 to 1 68 19.0 27.0
1.01 to 1.5 36 10.1 14.3
1.501 to 3 30 8.4 11.9
More than 3 11 3.1 4.4
Total 252 70.6 100.0
15l. Number of all cattle
Size of all paddocks (in acres) Total
Up to 0.1 0.101 to
0.25 0.251 to
0.5 0.501 to 1 1.01 to 1.5 1.501 to 3
More than 3
N % N % N % N % N % N % N % N %
Up to 1 4 12.1 2 5.9 2 5.3 1 1.5 0 .0 0 .0 0 .0 9 3.6
1 to 2 8 24.2 10 29.4 5 13.2 5 7.4 1 2.8 2 6.7 0 .0 31 12.4
2 to 3 7 21.2 2 5.9 8 21.1 10 14.7 3 8.3 1 3.3 0 .0 31 12.4
3 to 4 4 12.1 9 26.5 8 21.1 14 20.6 6 16.7 2 6.7 1 9.1 44 17.6
4 to 5 2 6.1 3 8.8 2 5.3 11 16.2 2 5.6 4 13.3 0 .0 24 9.6
5 to 6 4 12.1 4 11.8 3 7.9 5 7.4 7 19.4 3 10.0 1 9.1 27 10.8
6 to 8 1 3.0 3 8.8 5 13.2 11 16.2 10 27.8 4 13.3 1 9.1 35 14.0
8 to 10 1 3.0 1 2.9 4 10.5 5 7.4 5 13.9 5 16.7 2 18.2 23 9.2
More than 10 2 6.1 0 .0 1 2.6 6 8.8 2 5.6 9 30.0 6 54.5 26 10.4
Total 33 100.0 34 100.0 38 100.0 68 100.0 36 100.0 30 100.0 11 100.0 250 100.0
Q16
16a. Overall amount of produced milk per day (in litres) Statistics
N Valid 308
N Missing 49
Mean 9.8344
Median 9.0000
Minimum 1.00
Maximum 48.00
Sum 3029.00
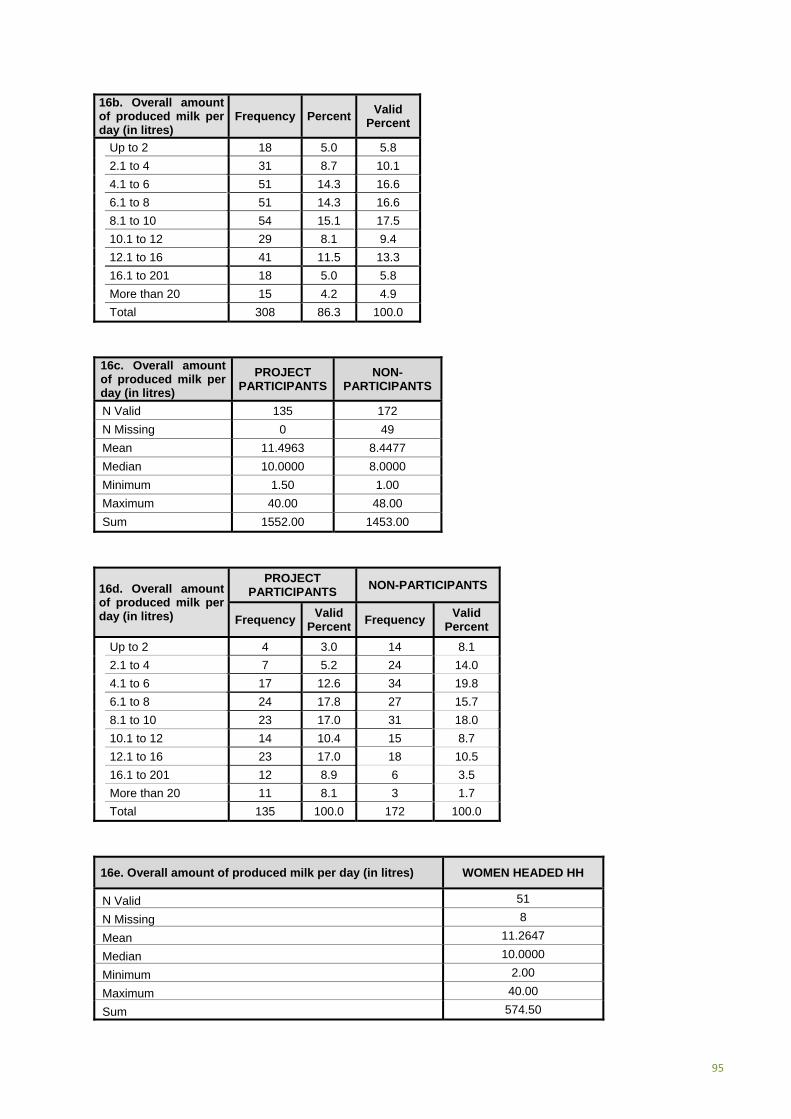
95
16b. Overall amount of produced milk per day (in litres)
Frequency PercentValid
Percent
Up to 2 18 5.0 5.8
2.1 to 4 31 8.7 10.1
4.1 to 6 51 14.3 16.6
6.1 to 8 51 14.3 16.6
8.1 to 10 54 15.1 17.5
10.1 to 12 29 8.1 9.4
12.1 to 16 41 11.5 13.3
16.1 to 201 18 5.0 5.8
More than 20 15 4.2 4.9
Total 308 86.3 100.0
16c. Overall amount of produced milk per day (in litres)
PROJECT PARTICIPANTS
NON-PARTICIPANTS
N Valid 135 172
N Missing 0 49
Mean 11.4963 8.4477
Median 10.0000 8.0000
Minimum 1.50 1.00
Maximum 40.00 48.00
Sum 1552.00 1453.00
16d. Overall amount of produced milk per day (in litres)
PROJECT PARTICIPANTS
NON-PARTICIPANTS
Frequency Valid
PercentFrequency
Valid Percent
Up to 2 4 3.0 14 8.1
2.1 to 4 7 5.2 24 14.0
4.1 to 6 17 12.6 34 19.8
6.1 to 8 24 17.8 27 15.7
8.1 to 10 23 17.0 31 18.0
10.1 to 12 14 10.4 15 8.7
12.1 to 16 23 17.0 18 10.5
16.1 to 201 12 8.9 6 3.5
More than 20 11 8.1 3 1.7
Total 135 100.0 172 100.0
16e. Overall amount of produced milk per day (in litres) WOMEN HEADED HH
N Valid 51
N Missing 8
Mean 11.2647
Median 10.0000
Minimum 2.00
Maximum 40.00
Sum 574.50
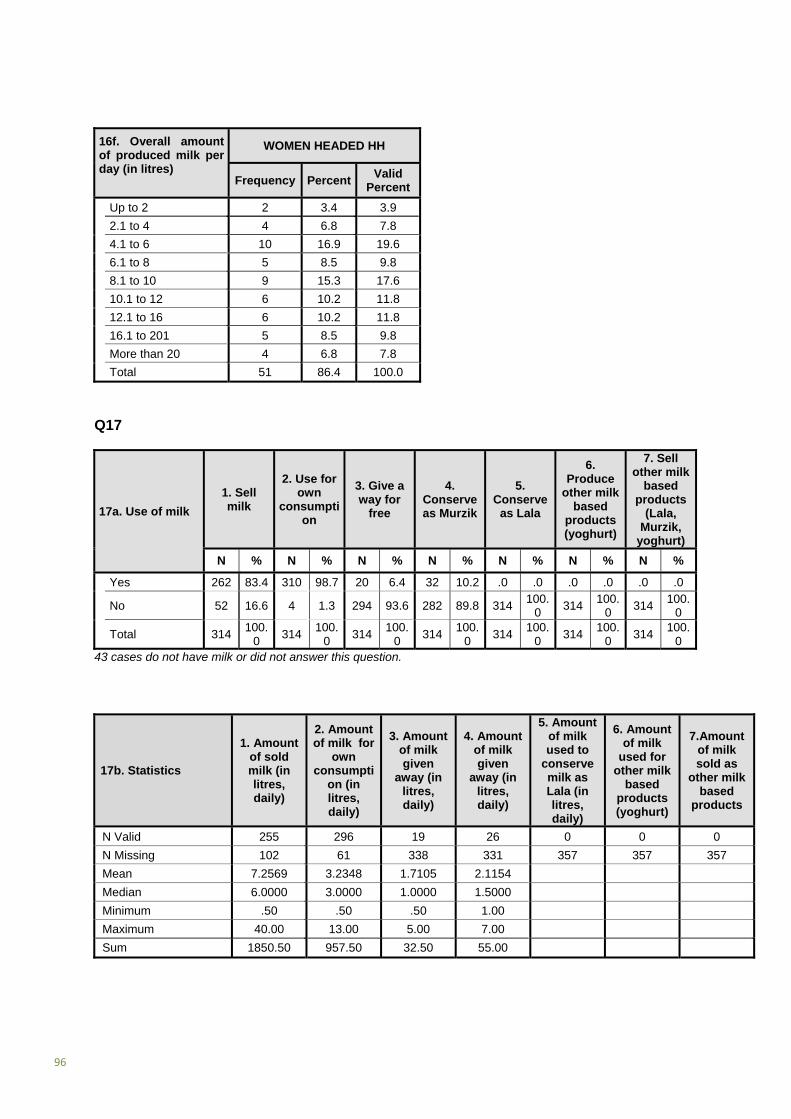
96
16f. Overall amount of produced milk per day (in litres)
WOMEN HEADED HH
Frequency PercentValid
Percent
Up to 2 2 3.4 3.9
2.1 to 4 4 6.8 7.8
4.1 to 6 10 16.9 19.6
6.1 to 8 5 8.5 9.8
8.1 to 10 9 15.3 17.6
10.1 to 12 6 10.2 11.8
12.1 to 16 6 10.2 11.8
16.1 to 201 5 8.5 9.8
More than 20 4 6.8 7.8
Total 51 86.4 100.0
Q17
17a. Use of milk
1. Sell milk
2. Use for own
consumption
3. Give a way for
free
4. Conserve as Murzik
5. Conserve
as Lala
6. Produce
other milk based
products (yoghurt)
7. Sell other milk
based products
(Lala, Murzik,
yoghurt)
N % N % N % N % N % N % N %
Yes 262 83.4 310 98.7 20 6.4 32 10.2 .0 .0 .0 .0 .0 .0
No 52 16.6 4 1.3 294 93.6 282 89.8 314 100.
0 314
100.0
314 100.
0
Total 314 100.
0 314
100.0
314 100.
0 314
100.0
314 100.
0 314
100.0
314 100.
0 43 cases do not have milk or did not answer this question.
17b. Statistics
1. Amount of sold milk (in litres, daily)
2. Amount of milk for
own consumpti
on (in litres, daily)
3. Amount of milk given
away (in litres, daily)
4. Amount of milk given
away (in litres, daily)
5. Amount of milk used to
conserve milk as Lala (in litres, daily)
6. Amount of milk
used for other milk
based products (yoghurt)
7.Amount of milk sold as
other milk based
products
N Valid 255 296 19 26 0 0 0
N Missing 102 61 338 331 357 357 357
Mean 7.2569 3.2348 1.7105 2.1154
Median 6.0000 3.0000 1.0000 1.5000
Minimum .50 .50 .50 1.00
Maximum 40.00 13.00 5.00 7.00
Sum 1850.50 957.50 32.50 55.00
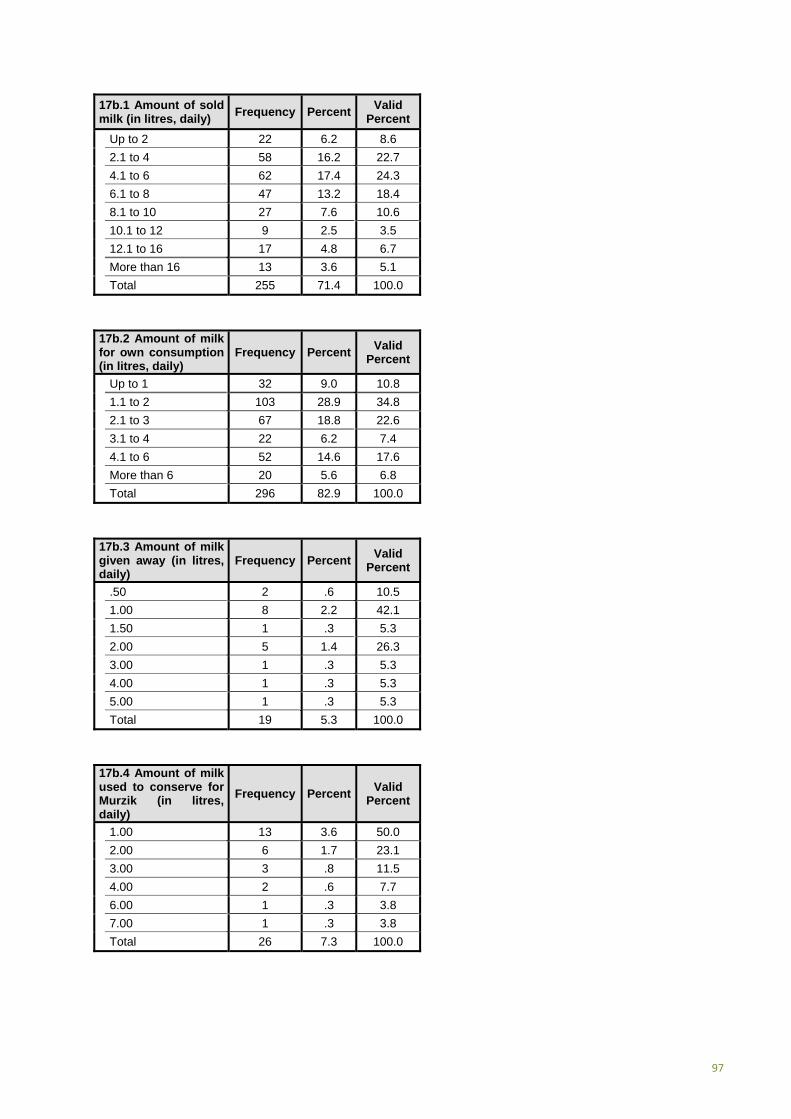
97
17b.1 Amount of sold milk (in litres, daily)
Frequency PercentValid
Percent
Up to 2 22 6.2 8.6
2.1 to 4 58 16.2 22.7
4.1 to 6 62 17.4 24.3
6.1 to 8 47 13.2 18.4
8.1 to 10 27 7.6 10.6
10.1 to 12 9 2.5 3.5
12.1 to 16 17 4.8 6.7
More than 16 13 3.6 5.1
Total 255 71.4 100.0
17b.2 Amount of milk for own consumption (in litres, daily)
Frequency PercentValid
Percent
Up to 1 32 9.0 10.8
1.1 to 2 103 28.9 34.8
2.1 to 3 67 18.8 22.6
3.1 to 4 22 6.2 7.4
4.1 to 6 52 14.6 17.6
More than 6 20 5.6 6.8
Total 296 82.9 100.0
17b.3 Amount of milk given away (in litres, daily)
Frequency PercentValid
Percent
.50 2 .6 10.5
1.00 8 2.2 42.1
1.50 1 .3 5.3
2.00 5 1.4 26.3
3.00 1 .3 5.3
4.00 1 .3 5.3
5.00 1 .3 5.3
Total 19 5.3 100.0
17b.4 Amount of milk used to conserve for Murzik (in litres, daily)
Frequency PercentValid
Percent
1.00 13 3.6 50.0
2.00 6 1.7 23.1
3.00 3 .8 11.5
4.00 2 .6 7.7
6.00 1 .3 3.8
7.00 1 .3 3.8
Total 26 7.3 100.0

98
17c. Statistics 1. Ratio of sold milk
of overall milk (in %, per day)
2. Ratio of own consumed milk of overall milk (in %,
per day)
3. Ratio of milk given away of
overall milk (in %, per day)
4. Ratio of milk used for Murzik of overall milk (in %,
per day)
N Valid 255 295 19 26
N Missing 102 62 338 331
Mean 65.0903 41.1586 17.2556 19.4274
Median 66.6667 33.3333 14.2857 15.4762
Minimum .13 3.57 4.17 3.33
Maximum 100.00 200.00 40.00 50.00
Sum 16598.02 12141.77 327.86 505.11
17c.1 Ratio of sold milk of overall milk (in %, per day) (grouped)
Frequency PercentValid
Percent
Up to 40 23 6.4 9.0
40.01 to 50 30 8.4 11.8
50.01 to 60 39 10.9 15.3
60.01 to 70 66 18.5 25.9
70.01 to 80 65 18.2 25.5
80.01 to 90 26 7.3 10.2
More than 90 6 1.7 2.4
Total 255 71.4 100.0
3 household mention to sell 100% of their produced milk.
17d. 2 Ratio of own consumed milk of overall milk (in %, per day)
Frequency PercentValid
Percent
Up to 10 10 2.8 3.4
10.01 to 20 54 15.1 18.3
20.01 to 30 60 16.8 20.3
30.01 to 40 76 21.3 25.8
40.01 to 50 37 10.4 12.5
50.01 to 70 19 5.3 6.4
70.01 90 7 2.0 2.4
More than 90 32 9.0 10.8
Total 295 82.6 100.0
31 cases mention to consume 100% of their produced milk.

99
17d.3 Ratio of milk given away of overall milk (in %, per day)
Frequency PercentValid
Percent
4.17 1 .3 5.3
6.67 1 .3 5.3
8.33 1 .3 5.3
10.00 5 1.4 26.3
12.50 1 .3 5.3
14.29 1 .3 5.3
15.00 1 .3 5.3
20.00 3 .8 15.8
25.00 1 .3 5.3
28.57 1 .3 5.3
30.00 1 .3 5.3
33.33 1 .3 5.3
40.00 1 .3 5.3
Total 19 5.3 100.0
17d.4 Ratio of milk used for Murzik of overall milk (in %, per day)
Frequency
Percent Valid
Percent
3.33 1 .3 3.8
6.67 1 .3 3.8
7.69 3 .8 11.5
8.33 2 .6 7.7
11.11 1 .3 3.8
11.54 1 .3 3.8
12.50 1 .3 3.8
13.33 2 .6 7.7
14.29 1 .3 3.8
16.67 2 .6 7.7
20.00 4 1.1 15.4
22.22 1 .3 3.8
23.08 1 .3 3.8
33.33 1 .3 3.8
42.86 1 .3 3.8
44.44 1 .3 3.8
50.00 2 .6 7.7
Total 26 7.3 100.0
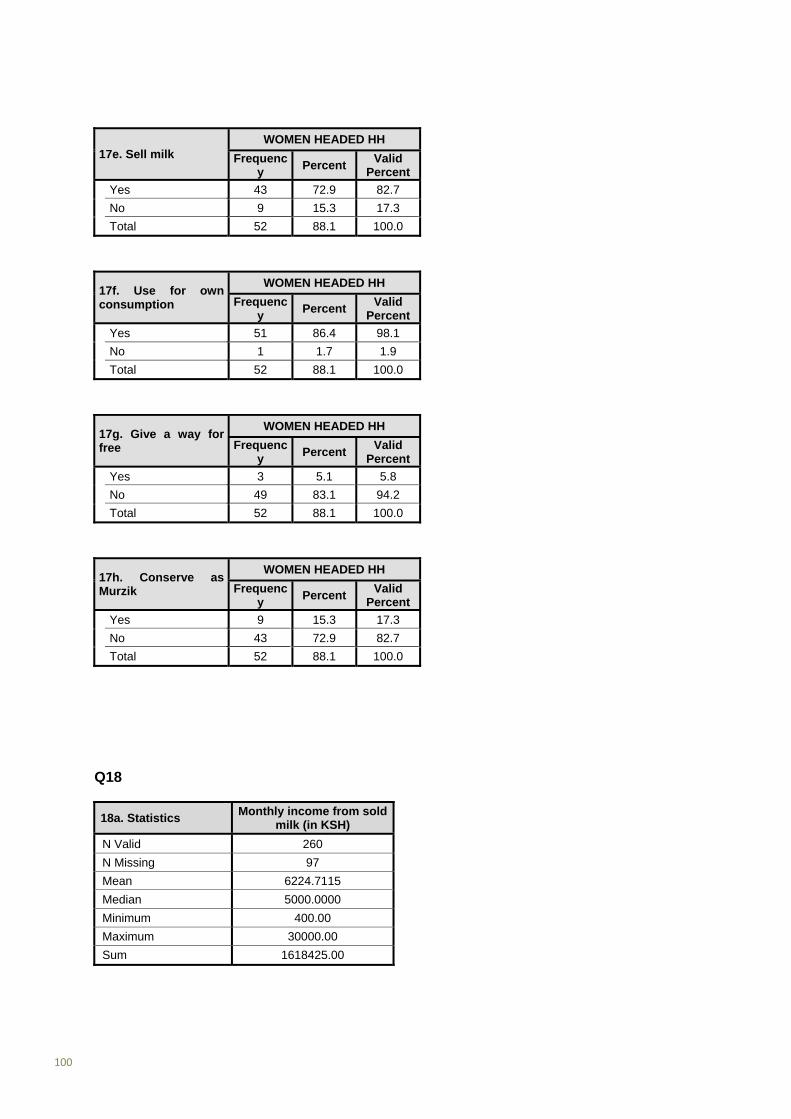
100
17e. Sell milk WOMEN HEADED HH
Frequency
Percent Valid
Percent
Yes 43 72.9 82.7
No 9 15.3 17.3
Total 52 88.1 100.0
17f. Use for own consumption
WOMEN HEADED HH
Frequency
Percent Valid
Percent
Yes 51 86.4 98.1
No 1 1.7 1.9
Total 52 88.1 100.0
17g. Give a way for free
WOMEN HEADED HH
Frequency
Percent Valid
Percent
Yes 3 5.1 5.8
No 49 83.1 94.2
Total 52 88.1 100.0
17h. Conserve as Murzik
WOMEN HEADED HH
Frequency
Percent Valid
Percent
Yes 9 15.3 17.3
No 43 72.9 82.7
Total 52 88.1 100.0
Q18
18a. Statistics Monthly income from sold
milk (in KSH)
N Valid 260
N Missing 97
Mean 6224.7115
Median 5000.0000
Minimum 400.00
Maximum 30000.00
Sum 1618425.00

101
18b. Monthly income from sold milk (in KSH) (grouped)
Frequency
Percent Valid
Percent
Up to 2000 49 13.7 18.8
2001 to 3000 31 8.7 11.9
3001 to 4000 27 7.6 10.4
4001 to 6000 42 11.8 16.2
6001 to 8000 37 10.4 14.2
8001 to 10000 39 10.9 15.0
10001 to 14000 20 5.6 7.7
More than 14000 15 4.2 5.8
Total 260 72.8 100.0
18c. Monthly income from sold milk (in KSH)
PROJECT PARTICIPANTS
NON-PARTICIPANTS
N Valid 122 137
N Missing 13 84
Mean 6806.5984 5744.4526
Median 5860.0000 4500.0000
Minimum 840.00 400.00
Maximum 27000.00 30000.00
Sum 830405.00 786990.00
18d. Monthly income from sold milk (in KSH) (grouped)
PROJECT PARTICIPANTS
NON-PARTICIPANTS
Frequency
Valid Percent
Frequency
Valid Percent
Up to 2000 20 16.4 28 20.4
2001 to 3000 14 11.5 17 12.4
3001 to 4000 9 7.4 18 13.1
4001 to 6000 20 16.4 22 16.1
6001 to 8000 18 14.8 19 13.9
8001 to 10000 21 17.2 18 13.1
10001 to 14000 11 9.0 9 6.6
More than 14000 9 7.4 6 4.4
Total 122 100.0 137 100.0
18e. Monthly income from sold milk (in KSH) (grouped)
WOMEN HEADED HH
N Valid 43
N Missing 16
Mean 6318.8372
Median 5000.0000
Minimum 1000.00
Maximum 18000.00
Sum 271710.00
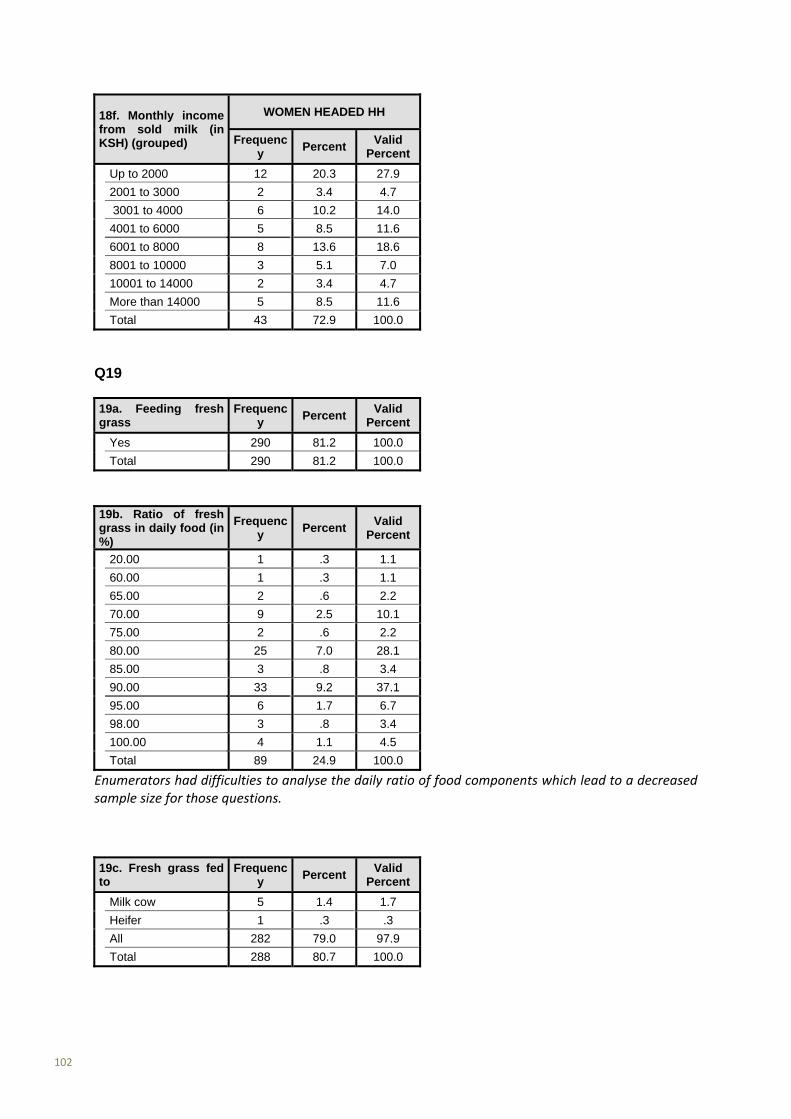
102
18f. Monthly income from sold milk (in KSH) (grouped)
WOMEN HEADED HH
Frequency
Percent Valid
Percent
Up to 2000 12 20.3 27.9
2001 to 3000 2 3.4 4.7
3001 to 4000 6 10.2 14.0
4001 to 6000 5 8.5 11.6
6001 to 8000 8 13.6 18.6
8001 to 10000 3 5.1 7.0
10001 to 14000 2 3.4 4.7
More than 14000 5 8.5 11.6
Total 43 72.9 100.0
Q19
19a. Feeding fresh grass
Frequency
Percent Valid
Percent
Yes 290 81.2 100.0
Total 290 81.2 100.0
19b. Ratio of fresh grass in daily food (in %)
Frequency
Percent Valid
Percent
20.00 1 .3 1.1
60.00 1 .3 1.1
65.00 2 .6 2.2
70.00 9 2.5 10.1
75.00 2 .6 2.2
80.00 25 7.0 28.1
85.00 3 .8 3.4
90.00 33 9.2 37.1
95.00 6 1.7 6.7
98.00 3 .8 3.4
100.00 4 1.1 4.5
Total 89 24.9 100.0
Enumerators had difficulties to analyse the daily ratio of food components which lead to a decreased sample size for those questions.
19c. Fresh grass fed to
Frequency
Percent Valid
Percent
Milk cow 5 1.4 1.7
Heifer 1 .3 .3
All 282 79.0 97.9
Total 288 80.7 100.0
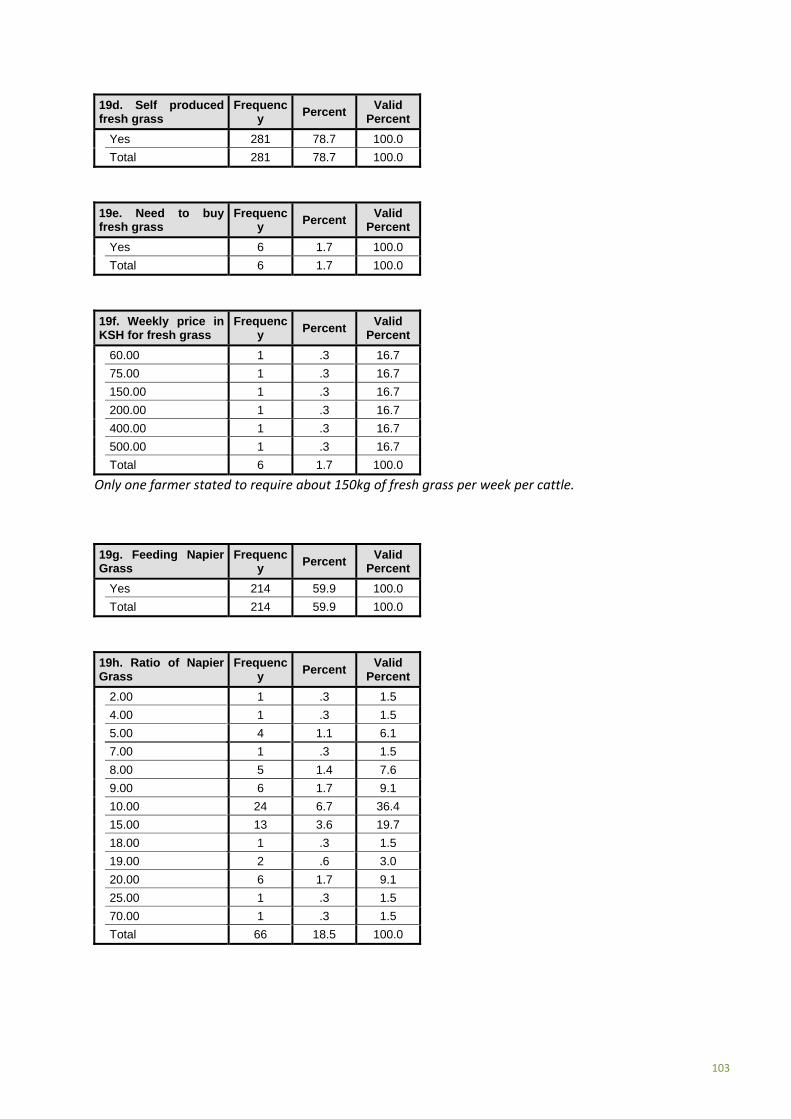
103
19d. Self produced fresh grass
Frequency
Percent Valid
Percent
Yes 281 78.7 100.0
Total 281 78.7 100.0
19e. Need to buy fresh grass
Frequency
Percent Valid
Percent
Yes 6 1.7 100.0
Total 6 1.7 100.0
19f. Weekly price in KSH for fresh grass
Frequency
Percent Valid
Percent
60.00 1 .3 16.7
75.00 1 .3 16.7
150.00 1 .3 16.7
200.00 1 .3 16.7
400.00 1 .3 16.7
500.00 1 .3 16.7
Total 6 1.7 100.0
Only one farmer stated to require about 150kg of fresh grass per week per cattle.
19g. Feeding Napier Grass
Frequency
Percent Valid
Percent
Yes 214 59.9 100.0
Total 214 59.9 100.0
19h. Ratio of Napier Grass
Frequency
Percent Valid
Percent
2.00 1 .3 1.5
4.00 1 .3 1.5
5.00 4 1.1 6.1
7.00 1 .3 1.5
8.00 5 1.4 7.6
9.00 6 1.7 9.1
10.00 24 6.7 36.4
15.00 13 3.6 19.7
18.00 1 .3 1.5
19.00 2 .6 3.0
20.00 6 1.7 9.1
25.00 1 .3 1.5
70.00 1 .3 1.5
Total 66 18.5 100.0

104
19i. Napier Grass fed to
Frequency
Percent Valid
Percent
Milk cow 51 14.3 24.2
Heifer 1 .3 .5
Female Calves 1 .3 .5
All 158 44.3 74.9
Total 211 59.1 100.0
19j. Self produced Napier Grass
Frequency
Percent Valid
Percent
Yes 214 59.9 100.0
Total 214 59.9 100.0
None of the 214 households feeding Napier grass does not need to buy Napier Grass.
19k. All required Napier grass in kg
Statistics
N Valid 175
N Missing 182
Mean 224.2514
Median 120.0000
Minimum 2.00
Maximum 1800.00
Sum 39244.00
19l. All required Napier grass in kg (grouped)
Frequency
Percent Valid
Percent
Up to 50 11 3.1 6.3
51 to 75 24 6.7 13.7
76 to 100 50 14.0 28.6
101 to 150 19 5.3 10.9
151 to 300 34 9.5 19.4
301 to 600 25 7.0 14.3
More than 600 12 3.4 6.9
Total 175 49.0 100.0
19.3 Kikuyu Grass
Only 3 households feed Kikuyu grass to their cattle; one feed milk cows, two households feed it to all their cattle; the amount are 45kg, 3 bags and 1 wheel barrow.
19.4 Hay
Eight farmers feed hay to their cattle; 2 are feeding their milk cows and 6 all their cattle with it. Five households produce their own hay. Only three could recall the required amount: 3 wheel barrow,

105
60kg and 7 bundles of hay. Three need to buy it (two pay 800 KSH per sack and one pays 8000KSH but can not recall the amount).
19.5 Lucerne
Only two households are feeding lucerne (to their milk cows) and produce it themselves. One interviewee could not estimate the required weekly amount, the other mentioned requiring 8kg per week.
19.6 Dismodium
The same two households that planted and fed lucerne to their milk cows are the same households who plant and feed dismodium to their milk cows. It is self produced and one of the required 7kg per week whereas the other interviewee could not recall the exact amount fed to his cattle.
19.7 Fodder legume
Four households feed fodder legume to their cattle (one only to milk cows, other three to all cattle type) and produce it themselves. Only 2 households shared the required amount with the enumerators: 3 kg and 7bags.
19.8. Fodder trees
None of the interviewed farmers is feeding fruits or leaves from fodder trees.
19m. Feeding crop residue
Frequency
Percent Valid
Percent
Yes 115 32.2 100.0
Total 115 32.2 100.0
19n. Ratio of crop residue
Frequency
Percent Valid
Percent
2.00 1 .3 2.9
3.00 1 .3 2.9
4.00 4 1.1 11.4
5.00 3 .8 8.6
8.00 2 .6 5.7
9.00 8 2.2 22.9
10.00 7 2.0 20.0
14.00 1 .3 2.9
15.00 4 1.1 11.4
19.00 4 1.1 11.4
Total 35 9.8 100.0

106
19o. Crop residue fed to
Frequency
Percent Valid
Percent
Milk cow 10 2.8 8.8
All 103 28.9 91.2
Total 113 31.7 100.0
2 households need to buy crop residue and pay 100 KSH and 750 KSH per week.
19p. Feeding concentrates
Frequency
Percent Valid
Percent
Yes 89 24.9 100.0
Total 89 24.9 100.0
One farmer feeds about 2% the other about 8% of overall daily food with concentrate.
19q. Concentrates fed to
Frequency
Percent Valid
Percent
Milk cow 45 12.6 51.7
All 42 11.8 48.3
Total 87 24.4 100.0
19r. Need to buy concentrates
Frequency
Percent Valid
Percent
Yes 73 20.4 100.0
Total 73 20.4 100.0
19s. Self produced concentrates
Frequency
Percent Valid
Percent
Yes 16 4.5 100.0
Total 16 4.5 100.0
Two households mentioned producing their concentrate from (1) molasses (for the milk cows, buying 1.25l for 250KSh and requiring 10l for one week) and (2) sweet potato vines
One farmer makse his concentrate of maize/whole meal (80%) and dairy meal (20%).
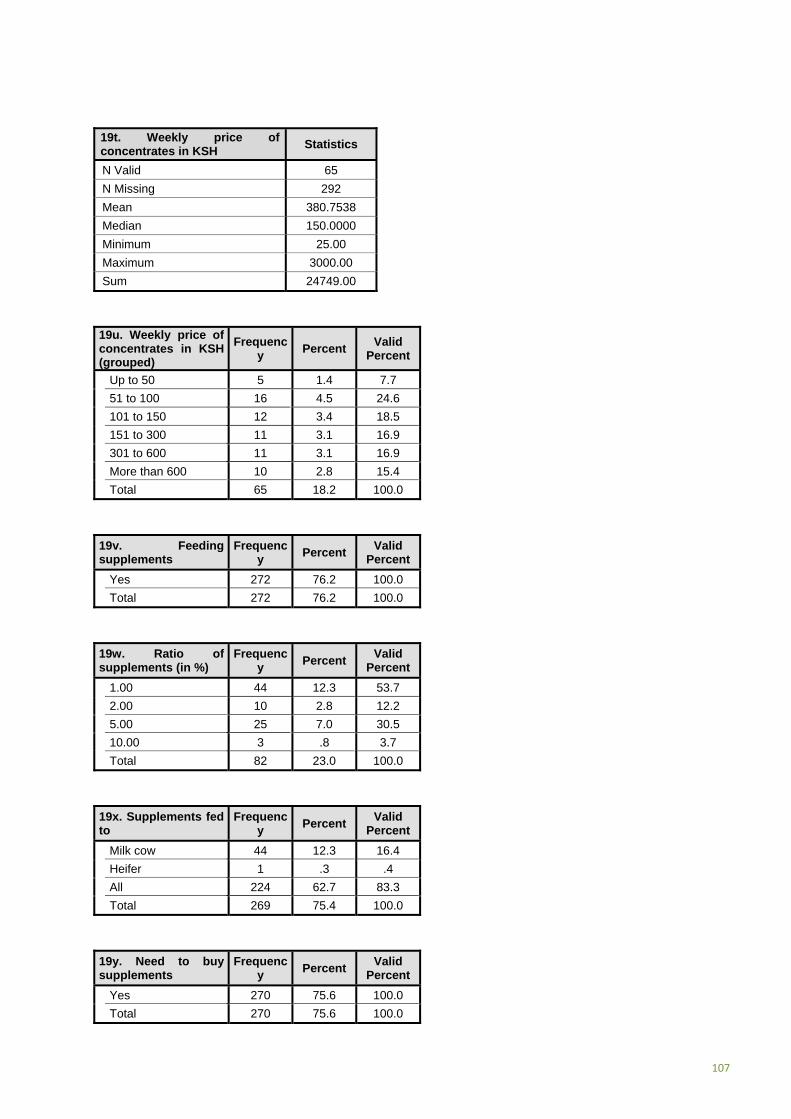
107
19t. Weekly price of concentrates in KSH
Statistics
N Valid 65
N Missing 292
Mean 380.7538
Median 150.0000
Minimum 25.00
Maximum 3000.00
Sum 24749.00
19u. Weekly price of concentrates in KSH (grouped)
Frequency
Percent Valid
Percent
Up to 50 5 1.4 7.7
51 to 100 16 4.5 24.6
101 to 150 12 3.4 18.5
151 to 300 11 3.1 16.9
301 to 600 11 3.1 16.9
More than 600 10 2.8 15.4
Total 65 18.2 100.0
19v. Feeding supplements
Frequency
Percent Valid
Percent
Yes 272 76.2 100.0
Total 272 76.2 100.0
19w. Ratio of supplements (in %)
Frequency
Percent Valid
Percent
1.00 44 12.3 53.7
2.00 10 2.8 12.2
5.00 25 7.0 30.5
10.00 3 .8 3.7
Total 82 23.0 100.0
19x. Supplements fed to
Frequency
Percent Valid
Percent
Milk cow 44 12.3 16.4
Heifer 1 .3 .4
All 224 62.7 83.3
Total 269 75.4 100.0
19y. Need to buy supplements
Frequency
Percent Valid
Percent
Yes 270 75.6 100.0
Total 270 75.6 100.0
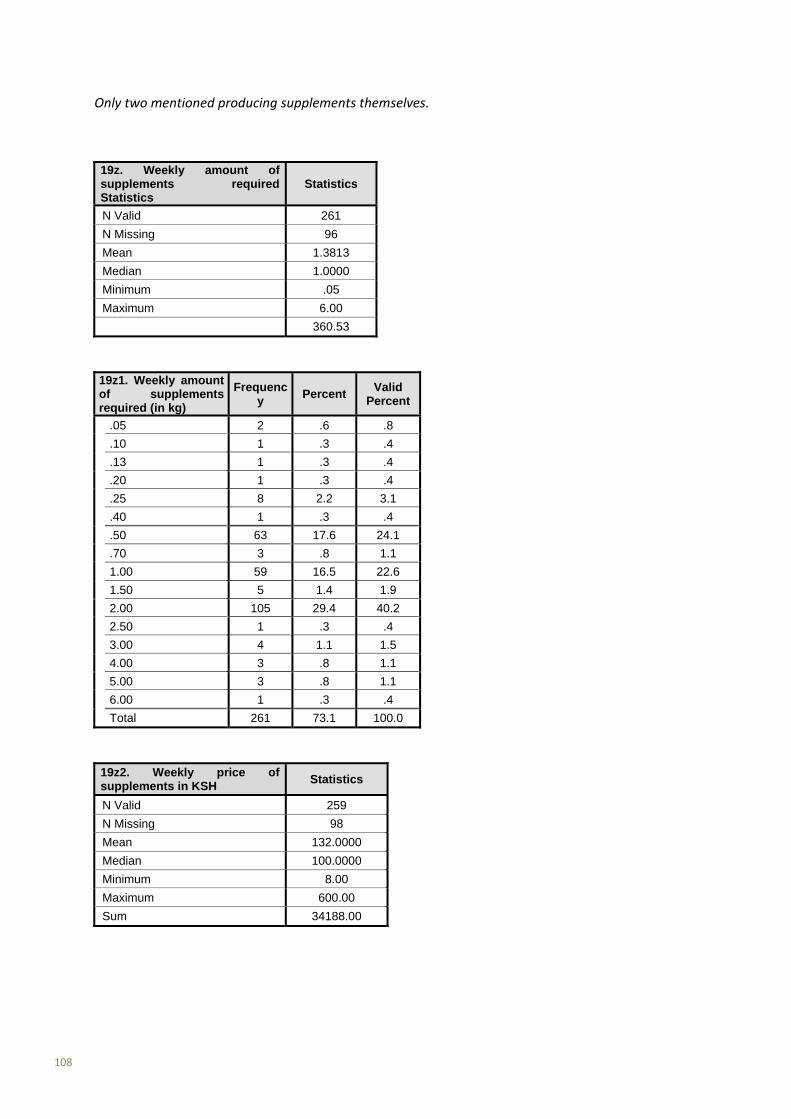
108
Only two mentioned producing supplements themselves.
19z. Weekly amount of supplements required Statistics
Statistics
N Valid 261
N Missing 96
Mean 1.3813
Median 1.0000
Minimum .05
Maximum 6.00
360.53
19z1. Weekly amount of supplements required (in kg)
Frequency
Percent Valid
Percent
.05 2 .6 .8
.10 1 .3 .4
.13 1 .3 .4
.20 1 .3 .4
.25 8 2.2 3.1
.40 1 .3 .4
.50 63 17.6 24.1
.70 3 .8 1.1
1.00 59 16.5 22.6
1.50 5 1.4 1.9
2.00 105 29.4 40.2
2.50 1 .3 .4
3.00 4 1.1 1.5
4.00 3 .8 1.1
5.00 3 .8 1.1
6.00 1 .3 .4
Total 261 73.1 100.0
19z2. Weekly price of supplements in KSH
Statistics
N Valid 259
N Missing 98
Mean 132.0000
Median 100.0000
Minimum 8.00
Maximum 600.00
Sum 34188.00
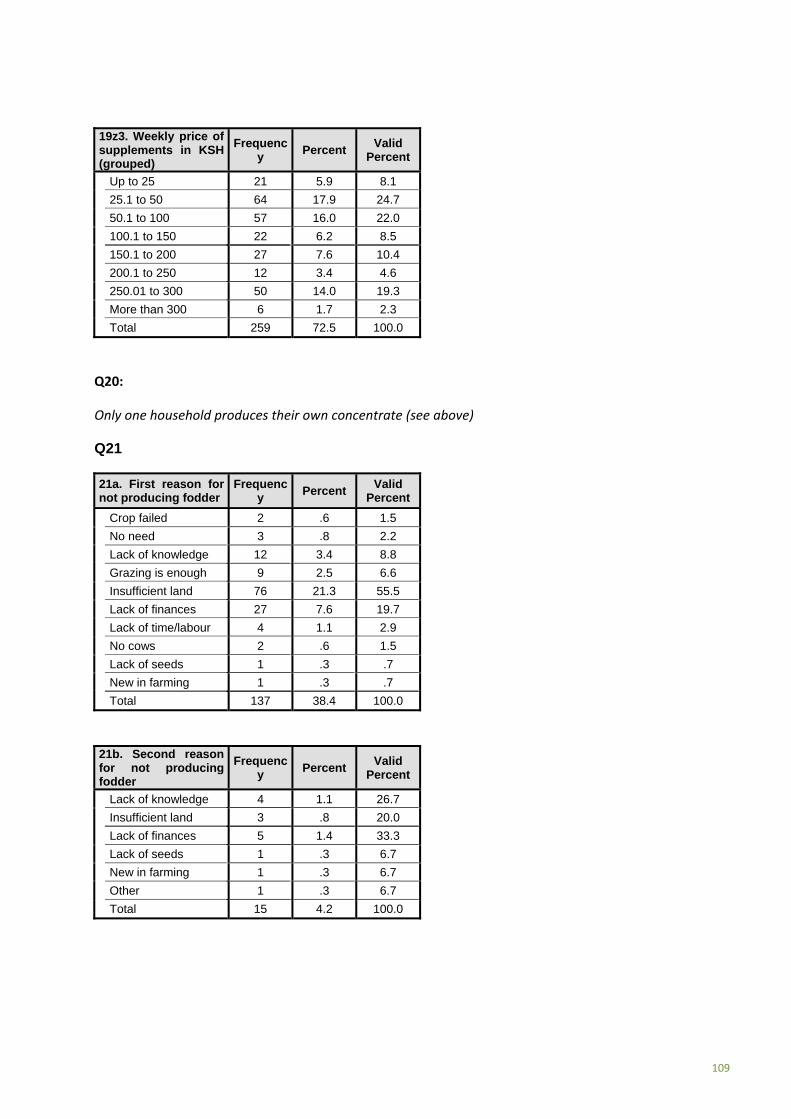
109
19z3. Weekly price of supplements in KSH (grouped)
Frequency
Percent Valid
Percent
Up to 25 21 5.9 8.1
25.1 to 50 64 17.9 24.7
50.1 to 100 57 16.0 22.0
100.1 to 150 22 6.2 8.5
150.1 to 200 27 7.6 10.4
200.1 to 250 12 3.4 4.6
250.01 to 300 50 14.0 19.3
More than 300 6 1.7 2.3
Total 259 72.5 100.0
Q20:
Only one household produces their own concentrate (see above)
Q21
21a. First reason for not producing fodder
Frequency
Percent Valid
Percent
Crop failed 2 .6 1.5
No need 3 .8 2.2
Lack of knowledge 12 3.4 8.8
Grazing is enough 9 2.5 6.6
Insufficient land 76 21.3 55.5
Lack of finances 27 7.6 19.7
Lack of time/labour 4 1.1 2.9
No cows 2 .6 1.5
Lack of seeds 1 .3 .7
New in farming 1 .3 .7
Total 137 38.4 100.0
21b. Second reason for not producing fodder
Frequency
Percent Valid
Percent
Lack of knowledge 4 1.1 26.7
Insufficient land 3 .8 20.0
Lack of finances 5 1.4 33.3
Lack of seeds 1 .3 6.7
New in farming 1 .3 6.7
Other 1 .3 6.7
Total 15 4.2 100.0
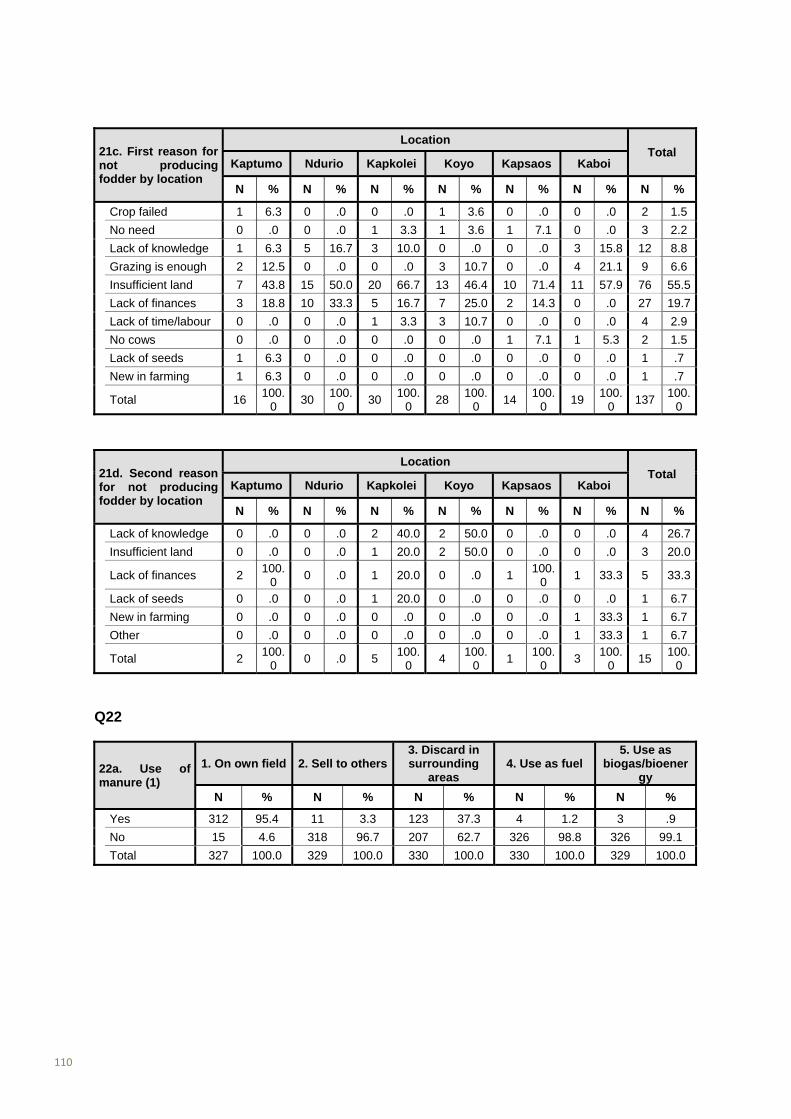
110
21c. First reason for not producing fodder by location
Location Total
Kaptumo Ndurio Kapkolei Koyo Kapsaos Kaboi
N % N % N % N % N % N % N %
Crop failed 1 6.3 0 .0 0 .0 1 3.6 0 .0 0 .0 2 1.5
No need 0 .0 0 .0 1 3.3 1 3.6 1 7.1 0 .0 3 2.2
Lack of knowledge 1 6.3 5 16.7 3 10.0 0 .0 0 .0 3 15.8 12 8.8
Grazing is enough 2 12.5 0 .0 0 .0 3 10.7 0 .0 4 21.1 9 6.6
Insufficient land 7 43.8 15 50.0 20 66.7 13 46.4 10 71.4 11 57.9 76 55.5
Lack of finances 3 18.8 10 33.3 5 16.7 7 25.0 2 14.3 0 .0 27 19.7
Lack of time/labour 0 .0 0 .0 1 3.3 3 10.7 0 .0 0 .0 4 2.9
No cows 0 .0 0 .0 0 .0 0 .0 1 7.1 1 5.3 2 1.5
Lack of seeds 1 6.3 0 .0 0 .0 0 .0 0 .0 0 .0 1 .7
New in farming 1 6.3 0 .0 0 .0 0 .0 0 .0 0 .0 1 .7
Total 16 100.
0 30
100.0
30 100.
0 28
100.0
14 100.
0 19
100.0
137 100.
0
21d. Second reason for not producing fodder by location
Location Total
Kaptumo Ndurio Kapkolei Koyo Kapsaos Kaboi
N % N % N % N % N % N % N %
Lack of knowledge 0 .0 0 .0 2 40.0 2 50.0 0 .0 0 .0 4 26.7
Insufficient land 0 .0 0 .0 1 20.0 2 50.0 0 .0 0 .0 3 20.0
Lack of finances 2 100.
0 0 .0 1 20.0 0 .0 1
100.0
1 33.3 5 33.3
Lack of seeds 0 .0 0 .0 1 20.0 0 .0 0 .0 0 .0 1 6.7
New in farming 0 .0 0 .0 0 .0 0 .0 0 .0 1 33.3 1 6.7
Other 0 .0 0 .0 0 .0 0 .0 0 .0 1 33.3 1 6.7
Total 2 100.
0 0 .0 5
100.0
4 100.
0 1
100.0
3 100.
0 15
100.0
Q22
22a. Use of manure (1)
1. On own field 2. Sell to others3. Discard in surrounding
areas 4. Use as fuel
5. Use as biogas/bioener
gy
N % N % N % N % N %
Yes 312 95.4 11 3.3 123 37.3 4 1.2 3 .9
No 15 4.6 318 96.7 207 62.7 326 98.8 326 99.1
Total 327 100.0 329 100.0 330 100.0 330 100.0 329 100.0

111
22b. Use of manure (2)
6. Apply to fodder
7. Construction material
8. Compost it
9. Pile and dry it
N % N % N % N %
Yes 217 65.8 249 75.5 14 4.2 9 2.7
No 113 34.2 81 24.5 316 95.8 321 97.3
Total 330 100.
0 330
100.0
330 100.
0 330
100.0
Q23
23a. Use Artificial Insemination
Frequency
Percent Valid
Percent
Yes 62 17.4 18.8
No 268 75.1 81.2
Total 330 92.4 100.0
23b. Type of breed of the cow used AI on (1)
Frequency
Percent Valid
Percent
Aryshire 24 6.7 39.3
Friesian 28 7.8 45.9
Friesian cross 4 1.1 6.6
Jersey cross 1 .3 1.6
Aryshire cross 4 1.1 6.6
Total 61 17.1 100.0
23c. Frequency of AI on breed (type 1) in last 12 months
Frequency
Percent Valid
Percent
1.00 40 11.2 65.6
2.00 14 3.9 23.0
3.00 4 1.1 6.6
4.00 3 .8 4.9
Total 61 17.1 100.0
23d. Type of breed of the cow used AI on (2)
Frequency
Percent Valid
Percent
Aryshire 10 2.8 41.7
Friesian 8 2.2 33.3
Friesian cross 4 1.1 16.7
Aryshire cross 2 .6 8.3
Total 24 6.7 100.0

112
23e. Frequency of AI on breed (type 2) in last 12 months
Frequency
Percent Valid
Percent
1.00 16 4.5 69.6
2.00 4 1.1 17.4
3.00 2 .6 8.7
5.00 1 .3 4.3
Total 23 6.4 100.0
23f . Frequency of AI in last 12 months
Breed AI used on Total
Aryshire Friesian Friesian
cross Jersey cross
Aryshire cross
N % N % N % N % N % N %
1 35 7.3 32 60.4 9 64.3 1 100.
0 7 63.6 56 66.7
2 11 21.2 14 26.4
1 3 21.4 0 .0 4 36.4 18 21.4
3 4 7.7 4 7.5 1 7.1 0 .0 0 .0 6 7.1
4 1 2 2 3.8 1 7.1 0 .0 0 .0 3 3.6
5 1 2 1 1.9 0 .0 0 .0 0 .0 1 1.2
Total 52 100.
0 53
100.0
14 100.
0 1
100.0
11 100.
0 84 100.0
Q24
24. Practice cropping Frequenc
y Percent
Valid Percent
Yes 350 98.0 98.9
No 4 1.1 1.1
Total 354 99.2 100.0
Q25
25a. Type of cropping
1. Practice Horticultur
e/ gardening
2. Cultivating one main
field
3. Cultivating
several fields
4. Cultivating communal
land
5. Planting and
harvesting trees
6. Cultivating on group
fields
7. Cultivating
on own field
N % N % N % N % N % N % N %
Yes 287 81.3 113 32.3 115 32.6 2 .6 95 26.9 8 2.3 341 96.6
No 66 18.7 240 67.7 238 67.4 351 99.4 258 73.1 344 97.7 12 3.4
Total 353 100.
0 353
100.0
353 100.
0 353
100.0
353 100.
0 352
100.0
353 100.
0
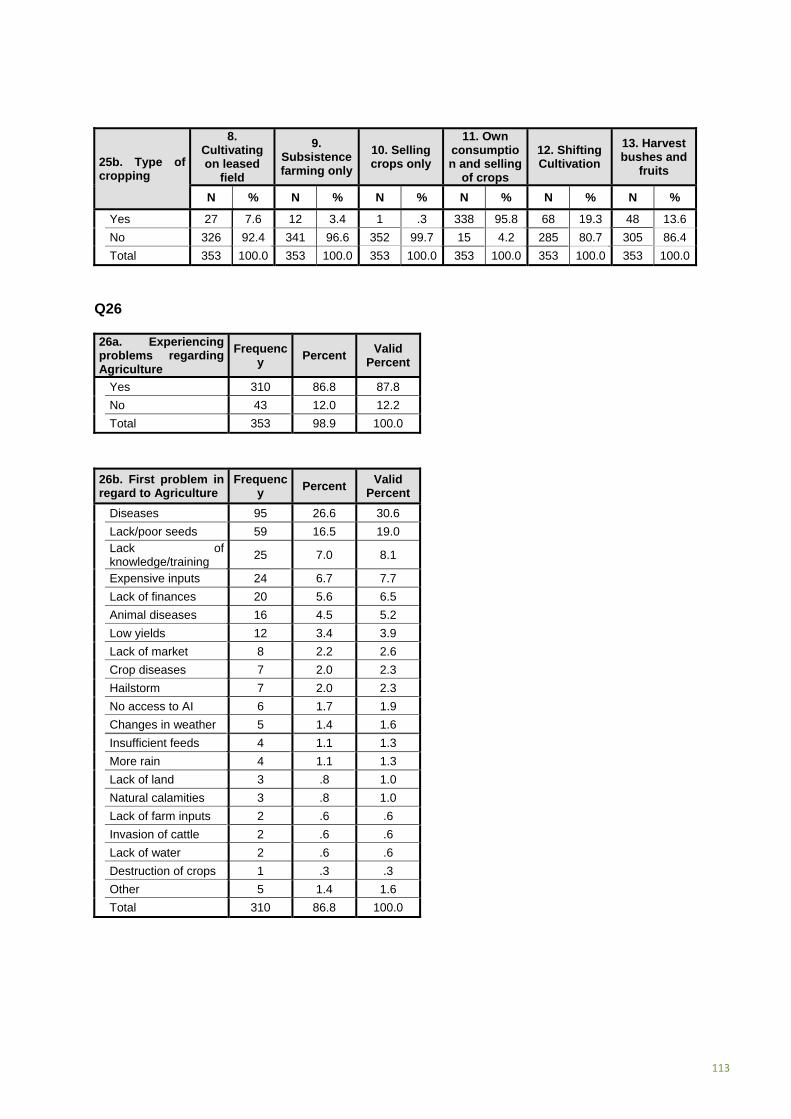
113
25b. Type of cropping
8. Cultivating on leased
field
9. Subsistence farming only
10. Selling crops only
11. Own consumption and selling
of crops
12. Shifting Cultivation
13. Harvest bushes and
fruits
N % N % N % N % N % N %
Yes 27 7.6 12 3.4 1 .3 338 95.8 68 19.3 48 13.6
No 326 92.4 341 96.6 352 99.7 15 4.2 285 80.7 305 86.4
Total 353 100.0 353 100.0 353 100.0 353 100.0 353 100.0 353 100.0
Q26
26a. Experiencing problems regarding Agriculture
Frequency
Percent Valid
Percent
Yes 310 86.8 87.8
No 43 12.0 12.2
Total 353 98.9 100.0
26b. First problem in regard to Agriculture
Frequency
Percent Valid
Percent
Diseases 95 26.6 30.6
Lack/poor seeds 59 16.5 19.0 Lack of knowledge/training
25 7.0 8.1
Expensive inputs 24 6.7 7.7
Lack of finances 20 5.6 6.5
Animal diseases 16 4.5 5.2
Low yields 12 3.4 3.9
Lack of market 8 2.2 2.6
Crop diseases 7 2.0 2.3
Hailstorm 7 2.0 2.3
No access to AI 6 1.7 1.9
Changes in weather 5 1.4 1.6
Insufficient feeds 4 1.1 1.3
More rain 4 1.1 1.3
Lack of land 3 .8 1.0
Natural calamities 3 .8 1.0
Lack of farm inputs 2 .6 .6
Invasion of cattle 2 .6 .6
Lack of water 2 .6 .6
Destruction of crops 1 .3 .3
Other 5 1.4 1.6
Total 310 86.8 100.0
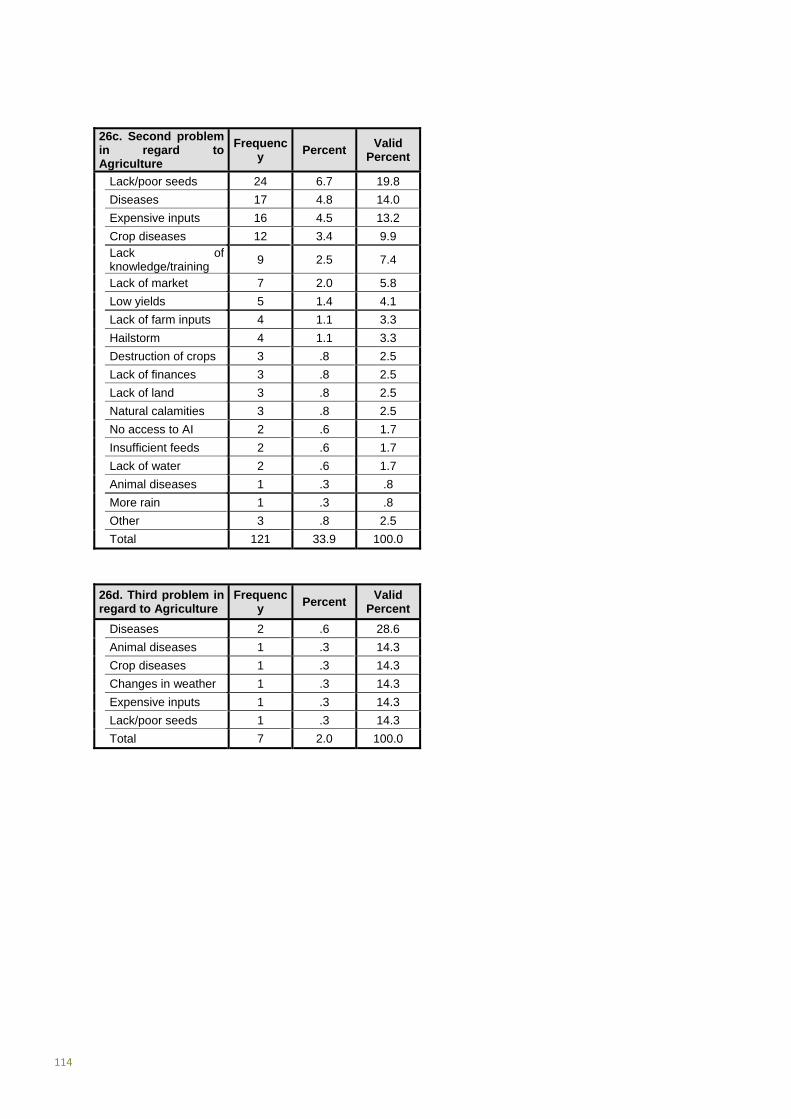
114
26c. Second problem in regard to Agriculture
Frequency
Percent Valid
Percent
Lack/poor seeds 24 6.7 19.8
Diseases 17 4.8 14.0
Expensive inputs 16 4.5 13.2
Crop diseases 12 3.4 9.9 Lack of knowledge/training
9 2.5 7.4
Lack of market 7 2.0 5.8
Low yields 5 1.4 4.1
Lack of farm inputs 4 1.1 3.3
Hailstorm 4 1.1 3.3
Destruction of crops 3 .8 2.5
Lack of finances 3 .8 2.5
Lack of land 3 .8 2.5
Natural calamities 3 .8 2.5
No access to AI 2 .6 1.7
Insufficient feeds 2 .6 1.7
Lack of water 2 .6 1.7
Animal diseases 1 .3 .8
More rain 1 .3 .8
Other 3 .8 2.5
Total 121 33.9 100.0
26d. Third problem in regard to Agriculture
Frequency
Percent Valid
Percent
Diseases 2 .6 28.6
Animal diseases 1 .3 14.3
Crop diseases 1 .3 14.3
Changes in weather 1 .3 14.3
Expensive inputs 1 .3 14.3
Lack/poor seeds 1 .3 14.3
Total 7 2.0 100.0
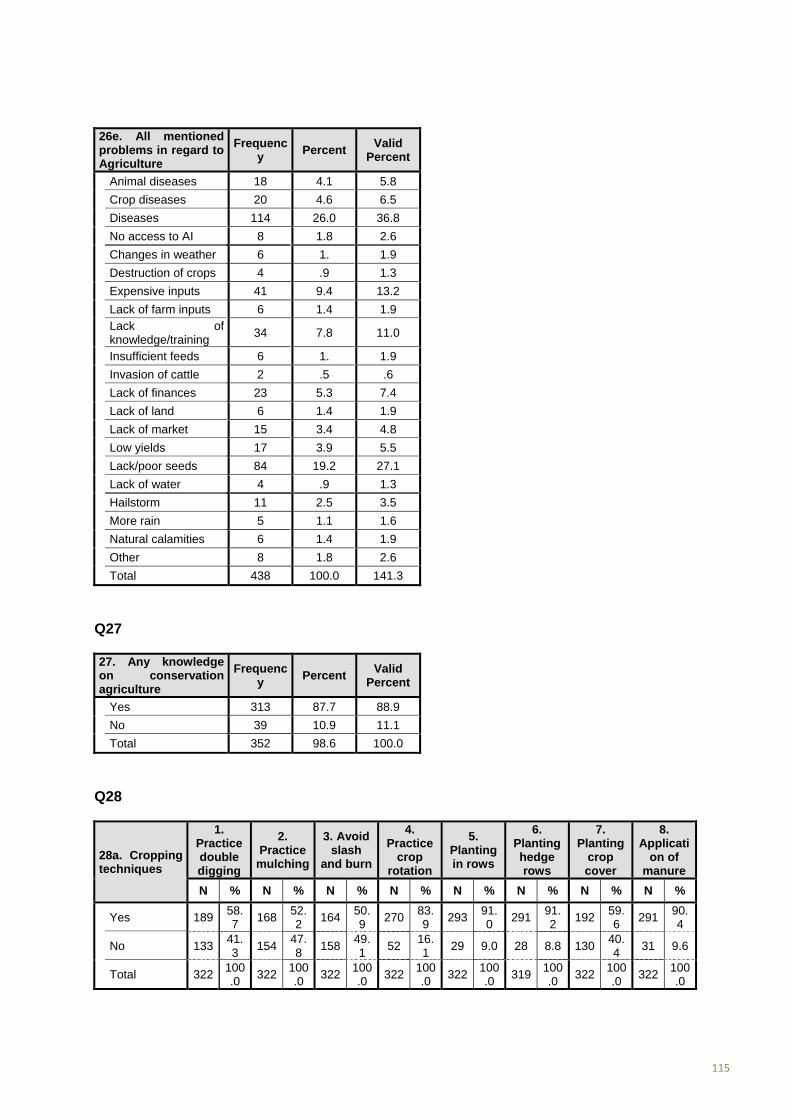
115
26e. All mentioned problems in regard to Agriculture
Frequency
Percent Valid
Percent
Animal diseases 18 4.1 5.8
Crop diseases 20 4.6 6.5
Diseases 114 26.0 36.8
No access to AI 8 1.8 2.6
Changes in weather 6 1. 1.9
Destruction of crops 4 .9 1.3
Expensive inputs 41 9.4 13.2
Lack of farm inputs 6 1.4 1.9 Lack of knowledge/training
34 7.8 11.0
Insufficient feeds 6 1. 1.9
Invasion of cattle 2 .5 .6
Lack of finances 23 5.3 7.4
Lack of land 6 1.4 1.9
Lack of market 15 3.4 4.8
Low yields 17 3.9 5.5
Lack/poor seeds 84 19.2 27.1
Lack of water 4 .9 1.3
Hailstorm 11 2.5 3.5
More rain 5 1.1 1.6
Natural calamities 6 1.4 1.9
Other 8 1.8 2.6
Total 438 100.0 141.3
Q27
27. Any knowledge on conservation agriculture
Frequency
Percent Valid
Percent
Yes 313 87.7 88.9
No 39 10.9 11.1
Total 352 98.6 100.0
Q28
28a. Cropping techniques
1. Practice double digging
2. Practice
mulching
3. Avoid slash
and burn
4. Practice
crop rotation
5. Planting in rows
6. Planting hedge rows
7. Planting
crop cover
8. Applicati
on of manure
N % N % N % N % N % N % N % N %
Yes 189 58.7
168 52.2
16450.9
27083.9
29391.0
29191.2
192 59.6
29190.4
No 133 41.3
154 47.8
15849.1
52 16.1
29 9.0 28 8.8 130 40.4
31 9.6
Total 322 100.0
322 100.0
322100.0
322100.0
322100.0
319100.0
322 100.0
322100.0
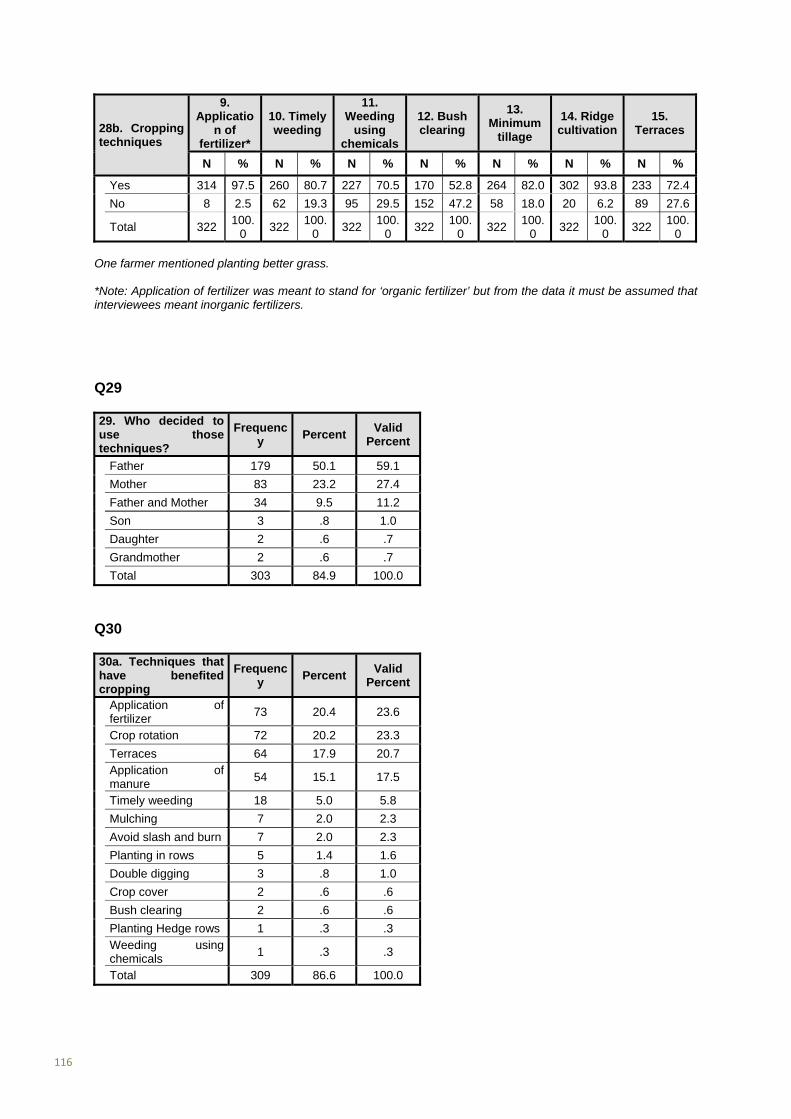
116
28b. Cropping techniques
9. Applicatio
n of fertilizer*
10. Timely weeding
11. Weeding
using chemicals
12. Bush clearing
13. Minimum
tillage
14. Ridge cultivation
15. Terraces
N % N % N % N % N % N % N %
Yes 314 97.5 260 80.7 227 70.5 170 52.8 264 82.0 302 93.8 233 72.4
No 8 2.5 62 19.3 95 29.5 152 47.2 58 18.0 20 6.2 89 27.6
Total 322 100.
0 322
100.0
322 100.
0 322
100.0
322 100.
0 322
100.0
322 100.
0 One farmer mentioned planting better grass. *Note: Application of fertilizer was meant to stand for ‘organic fertilizer’ but from the data it must be assumed that interviewees meant inorganic fertilizers.
Q29
29. Who decided to use those techniques?
Frequency
Percent Valid
Percent
Father 179 50.1 59.1
Mother 83 23.2 27.4
Father and Mother 34 9.5 11.2
Son 3 .8 1.0
Daughter 2 .6 .7
Grandmother 2 .6 .7
Total 303 84.9 100.0
Q30
30a. Techniques that have benefited cropping
Frequency
Percent Valid
Percent
Application of fertilizer
73 20.4 23.6
Crop rotation 72 20.2 23.3
Terraces 64 17.9 20.7 Application of manure
54 15.1 17.5
Timely weeding 18 5.0 5.8
Mulching 7 2.0 2.3
Avoid slash and burn 7 2.0 2.3
Planting in rows 5 1.4 1.6
Double digging 3 .8 1.0
Crop cover 2 .6 .6
Bush clearing 2 .6 .6
Planting Hedge rows 1 .3 .3 Weeding using chemicals
1 .3 .3
Total 309 86.6 100.0

117
30b. Techniques that have benefited livestock
Frequency PercentValid
Percent
Application of manure
73 20.4 28.6
Terraces 64 17.9 25.1
Bush clearing 48 13.4 18.8
Other 27 7.6 10.6
Avoid slash and burn 14 3.9 5.5
Planting in rows 8 2.2 3.1 Application of fertilizer
8 2.2 3.1
Mulching 4 1.1 1.6
Planting Hedge rows 3 .8 1.2
Crop cover 2 .6 .8
Double digging 1 .3 .4
Crop rotation 1 .3 .4
Timely weeding 1 .3 .4
Good feeding 1 .3 .4
Total 255 71.4 100.0
27 farmers added that proper feeding and fodder production have the best benefit for livestock. Q31
31a. All planted crops Frequency Percent
Beans 206 14.9
Potatoes 64 4.6
Maize 320 23.2
Tea 167 12.1
Onion 12 .9
Vegetables 90 6.5
Avocado 87 6.3
Bananas 168 12.2
Cabbage 38 2.8
Kales 21 1.5
Napier Grass 107 7.8
Cypress 1 .1
Fruits trees 3 .2
Passion fruits 15 1.1
Sweet potatoes 11 .8
Pumpkin 1 .1
Sugar cane 11 .8
Tomatoes 10 .7
Yams 4 .3
Trees 1 .1
Pineapple 3 .2
Lemon 2 .1
Guavas 2 .1
Coffee 31 2.2
Sorghum 3 .2
Total 1378 100.0

118
357 households mentioned all together 1 378 different types of crops. 279 households have up to 6 crops, 33 households have up to 7 crops and 7 households mentioned even 8 different crops planted on their land.
31b. All sizes of planted crops
Frequency Percent
Up to 0.05 266 20.2
0.051 to 0.1 218 16.6
0.101 to 0.25 184 14.0
0.251 to 0.5 305 23.2
0.501 to 0.75 46 3.5
0.751 to 1 161 12.3
1.001 to 1.5 33 2.5
1.501 to 2 58 4.4
More than 2 43 3.3
Total 1314 100
31c. Overall size of all crops planted
Statistics
Valid 350
Missing 7
Mean 2.1997
Median 1.5000
Minimum .03
Maximum 20.59
Sum 769.90
31d. Overall size of all crops planted
Frequency PercentValid
Percent
Up to 0.25 50 14.0 14.3
0.251 to 0.5 24 6.7 6.9
0.501 to 1 50 14.0 14.3
1.001 to 1.5 56 15.7 16.0
1.501 to 2 40 11.2 11.4
2.001 to 3 57 16.0 16.3
3.001 to 5 44 12.3 12.6
More than 5 29 8.1 8.3
Total 350 98.0 100.0
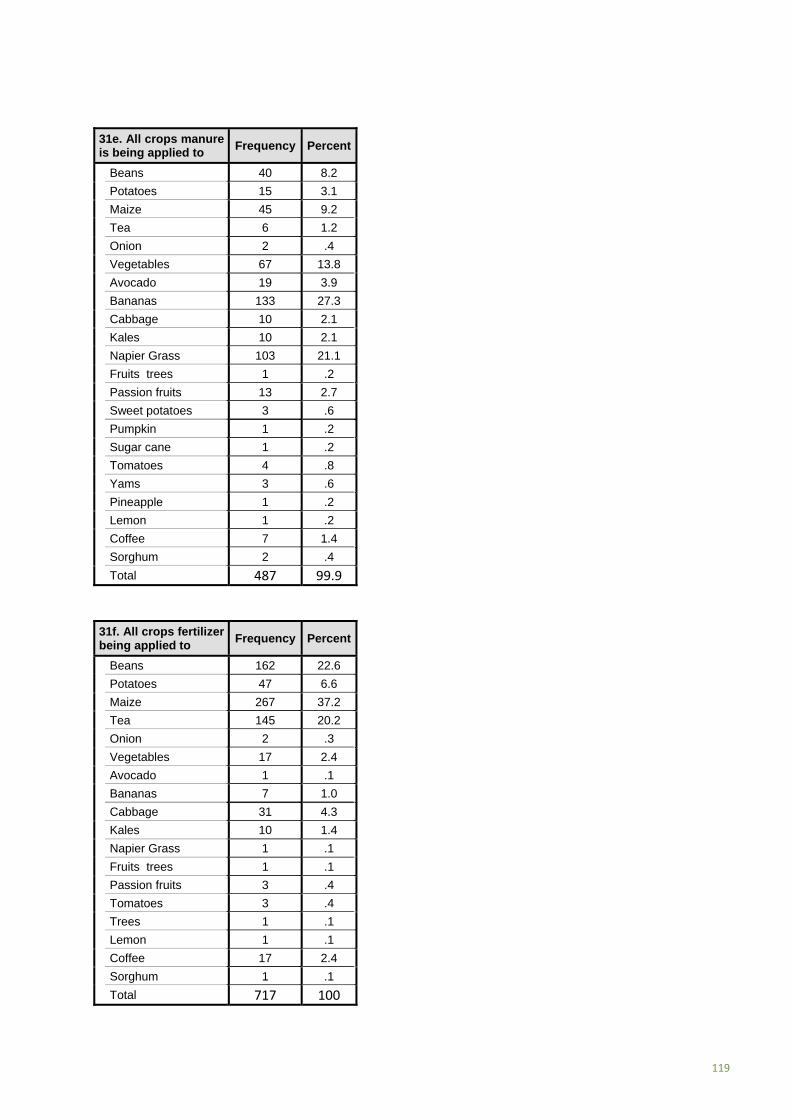
119
31e. All crops manure is being applied to
Frequency Percent
Beans 40 8.2
Potatoes 15 3.1
Maize 45 9.2
Tea 6 1.2
Onion 2 .4
Vegetables 67 13.8
Avocado 19 3.9
Bananas 133 27.3
Cabbage 10 2.1
Kales 10 2.1
Napier Grass 103 21.1
Fruits trees 1 .2
Passion fruits 13 2.7
Sweet potatoes 3 .6
Pumpkin 1 .2
Sugar cane 1 .2
Tomatoes 4 .8
Yams 3 .6
Pineapple 1 .2
Lemon 1 .2
Coffee 7 1.4
Sorghum 2 .4
Total 487 99.9
31f. All crops fertilizer being applied to
Frequency Percent
Beans 162 22.6
Potatoes 47 6.6
Maize 267 37.2
Tea 145 20.2
Onion 2 .3
Vegetables 17 2.4
Avocado 1 .1
Bananas 7 1.0
Cabbage 31 4.3
Kales 10 1.4
Napier Grass 1 .1
Fruits trees 1 .1
Passion fruits 3 .4
Tomatoes 3 .4
Trees 1 .1
Lemon 1 .1
Coffee 17 2.4
Sorghum 1 .1
Total 717 100

120
31g. All crops herbicides being applied to
Frequency Percent
Beans 17 11.9
Potatoes 11 7.7
Maize 24 16.8
Tea 55 38.5
Onion 1 .7
Vegetables 8 5.6
Bananas 6 4.2
Kales 3 2.1
Passion fruits 2 1.4
Tomatoes 1 .7
Trees 1 .7
Coffee 14 9.8
Total 143 100
31h. All crops pesticides being applied to
Frequency Percent
Beans 118 33.4
Potatoes 49 13.9
Maize 48 13.6
Tea 17 4.8
Onion 4 1.1
Vegetables 47 13.3
Bananas 5 1.4
Cabbage 36 10.2
Kales 9 2.5
Napier Grass 1 .3
Passion fruits 6 1.7
Tomatoes 8 2.3
Trees 1 .3
Coffee 4 1.1
Total 353 99.9
31i. All crops being used as fodder
Frequency Percent
Beans 2 1.2
Maize 36 21.4
Tea 1 .6
Bananas 16 9.5
Kales 1 .6
Napier Grass 111 66.1
Sorghum 1 .6
Total 168 100

121
31j. All crops its residue used as fodder
Percent
Beans 137 26.6
Potatoes 11 2.1
Maize 230 44.7
Tea 1 .2
Vegetables 20 3.9
Avocado 1 .2
Bananas 101 19.6
Cabbage 2 .4
Kales 2 .4
Napier Grass 2 .4
Sweet potatoes 5 1.0
Coffee 1 .2
Sorghum 2 .4
Total 515.0 100
31k. All annual yield in kg Statistics
Valid 343 Missing 14 Mean 6645.3426 Median 3410.0000 Minimum 45.00 Maximum 90450.00 Sum 2279352.50
14 respondents do not have cropping or no yield in last 12 months
31l. All annual yield in kg
Frequency PercentValid
Percent
Up to 500 25 7.0 7.3
501 to 1000 38 10.6 11.1
1001 to 1500 30 8.4 8.7
1501 to 2000 32 9.0 9.3
2001 to 2500 16 4.5 4.7
2501 to 5000 72 20.2 21.0
5001 to 7500 41 11.5 12.0
7501 to 10000 27 7.6 7.9
10001 to 15000 32 9.0 9.3
More than 15000 30 8.4 8.7
Total 343 96.1 100.0
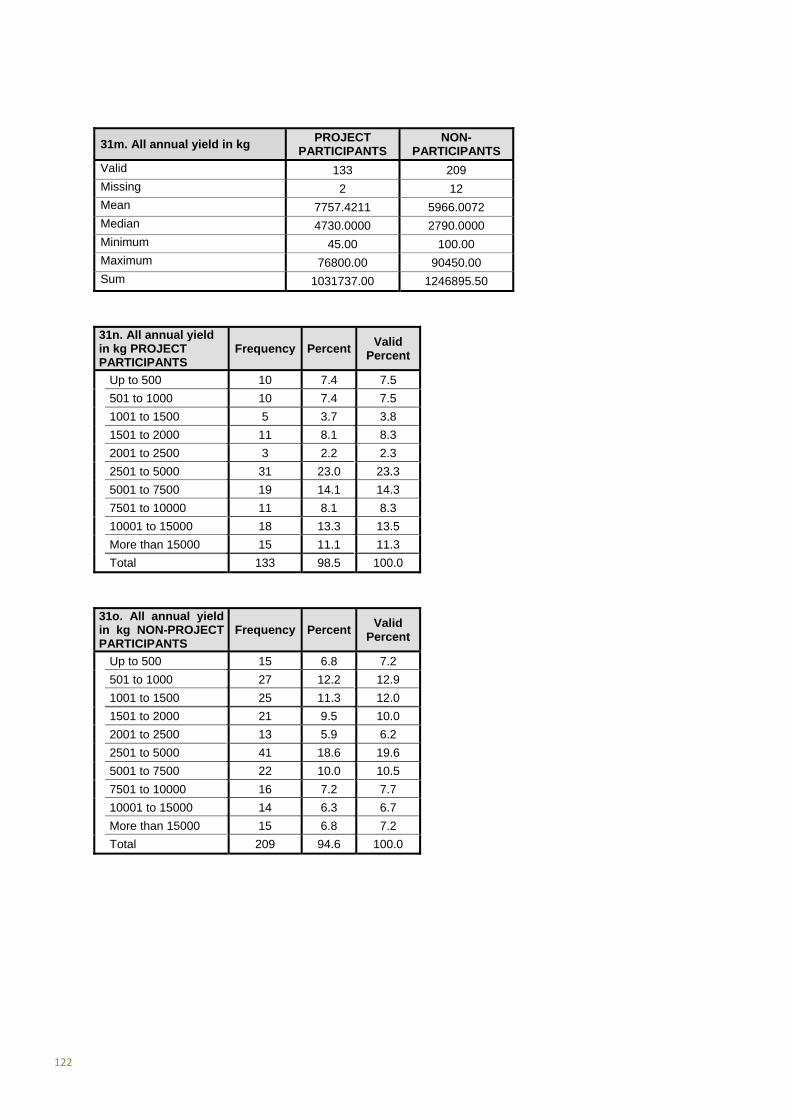
122
31m. All annual yield in kg PROJECT
PARTICIPANTS NON-
PARTICIPANTS
Valid 133 209 Missing 2 12 Mean 7757.4211 5966.0072 Median 4730.0000 2790.0000 Minimum 45.00 100.00 Maximum 76800.00 90450.00 Sum 1031737.00 1246895.50
31n. All annual yield in kg PROJECT PARTICIPANTS
Frequency PercentValid
Percent
Up to 500 10 7.4 7.5
501 to 1000 10 7.4 7.5
1001 to 1500 5 3.7 3.8
1501 to 2000 11 8.1 8.3
2001 to 2500 3 2.2 2.3
2501 to 5000 31 23.0 23.3
5001 to 7500 19 14.1 14.3
7501 to 10000 11 8.1 8.3
10001 to 15000 18 13.3 13.5
More than 15000 15 11.1 11.3
Total 133 98.5 100.0
31o. All annual yield in kg NON-PROJECT PARTICIPANTS
Frequency PercentValid
Percent
Up to 500 15 6.8 7.2
501 to 1000 27 12.2 12.9
1001 to 1500 25 11.3 12.0
1501 to 2000 21 9.5 10.0
2001 to 2500 13 5.9 6.2
2501 to 5000 41 18.6 19.6
5001 to 7500 22 10.0 10.5
7501 to 10000 16 7.2 7.7
10001 to 15000 14 6.3 6.7
More than 15000 15 6.8 7.2
Total 209 94.6 100.0
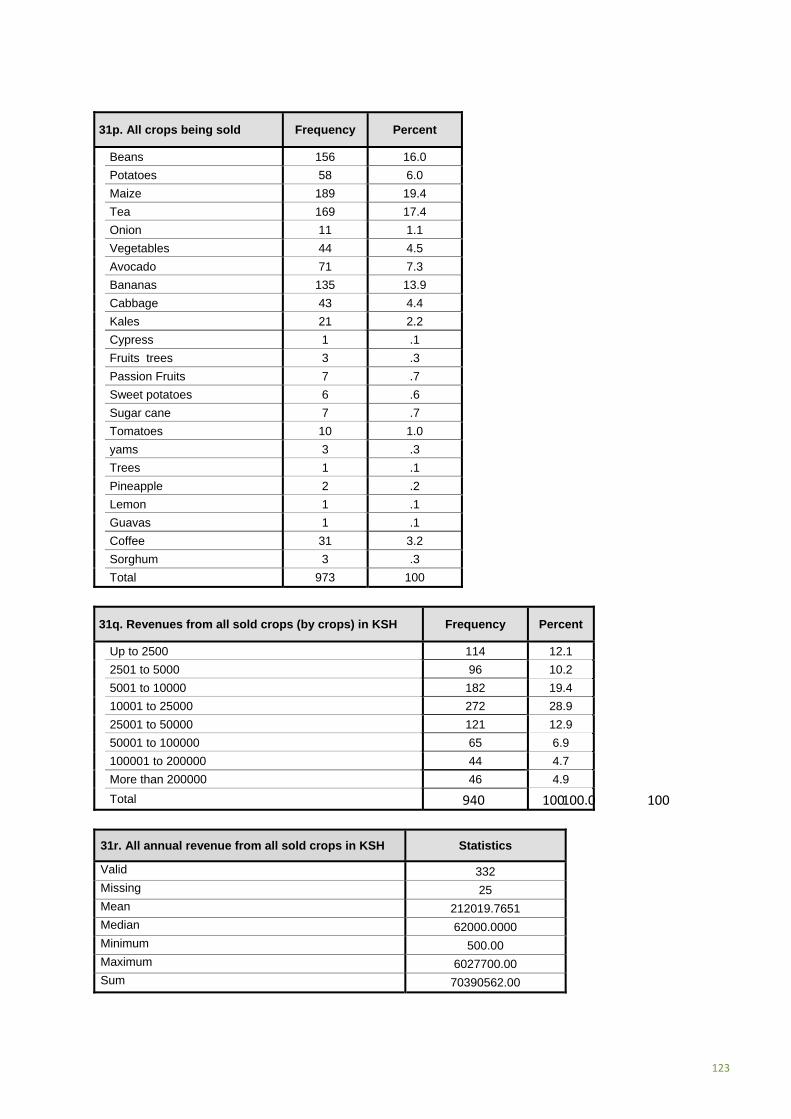
123
31p. All crops being sold Frequency Percent
Beans 156 16.0
Potatoes 58 6.0
Maize 189 19.4
Tea 169 17.4
Onion 11 1.1
Vegetables 44 4.5
Avocado 71 7.3
Bananas 135 13.9
Cabbage 43 4.4
Kales 21 2.2
Cypress 1 .1
Fruits trees 3 .3
Passion Fruits 7 .7
Sweet potatoes 6 .6
Sugar cane 7 .7
Tomatoes 10 1.0
yams 3 .3
Trees 1 .1
Pineapple 2 .2
Lemon 1 .1
Guavas 1 .1
Coffee 31 3.2
Sorghum 3 .3
Total 973 100
31q. Revenues from all sold crops (by crops) in KSH Frequency Percent
Up to 2500 114 12.1
2501 to 5000 96 10.2
5001 to 10000 182 19.4
10001 to 25000 272 28.9
25001 to 50000 121 12.9
50001 to 100000 65 6.9
100001 to 200000 44 4.7
More than 200000 46 4.9
Total 940 100 100.0 100
31r. All annual revenue from all sold crops in KSH Statistics
Valid 332 Missing 25 Mean 212019.7651 Median 62000.0000 Minimum 500.00 Maximum 6027700.00 Sum 70390562.00
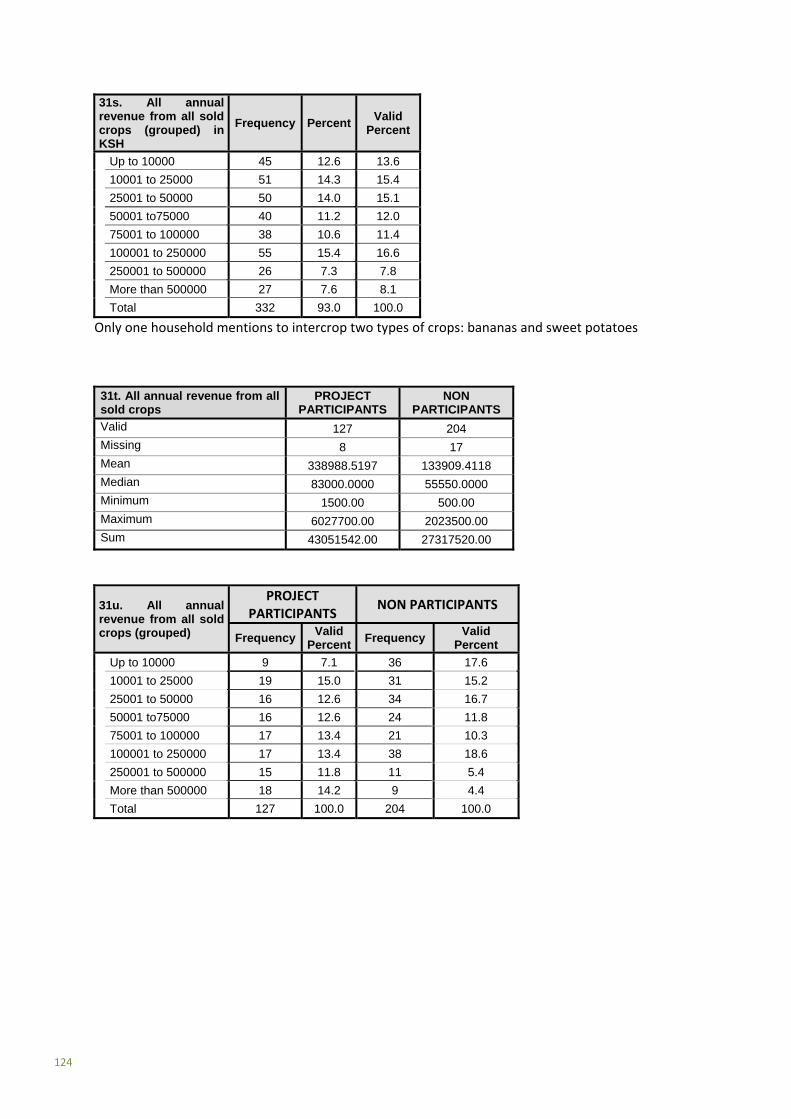
124
31s. All annual revenue from all sold crops (grouped) in KSH
Frequency PercentValid
Percent
Up to 10000 45 12.6 13.6
10001 to 25000 51 14.3 15.4
25001 to 50000 50 14.0 15.1
50001 to75000 40 11.2 12.0
75001 to 100000 38 10.6 11.4
100001 to 250000 55 15.4 16.6
250001 to 500000 26 7.3 7.8
More than 500000 27 7.6 8.1
Total 332 93.0 100.0
Only one household mentions to intercrop two types of crops: bananas and sweet potatoes
31t. All annual revenue from all sold crops
PROJECT PARTICIPANTS
NON PARTICIPANTS
Valid 127 204 Missing 8 17 Mean 338988.5197 133909.4118 Median 83000.0000 55550.0000 Minimum 1500.00 500.00 Maximum 6027700.00 2023500.00 Sum 43051542.00 27317520.00
31u. All annual revenue from all sold crops (grouped)
PROJECT PARTICIPANTS
NON PARTICIPANTS
Frequency Valid
PercentFrequency
Valid Percent
Up to 10000 9 7.1 36 17.6
10001 to 25000 19 15.0 31 15.2
25001 to 50000 16 12.6 34 16.7
50001 to75000 16 12.6 24 11.8
75001 to 100000 17 13.4 21 10.3
100001 to 250000 17 13.4 38 18.6
250001 to 500000 15 11.8 11 5.4
More than 500000 18 14.2 9 4.4
Total 127 100.0 204 100.0

125
Q32
32. Use of soil conditioner
Frequency PercentValid
Percent
Yes 5 1.4 1.6
No 310 86.8 98.4
Total 315 88.2 100.0
All five cases mention to use lime as a soil conditioner and only once a year.
Q33
33a. All other agricultural product
Frequency Percent
Honey 22 19.1304
348
Fish 1 0.86956
522
Sheep 5 4.34782
609 Chicken 23 20
Goats 5 4.34782
609
Seedlings 1 0.86956
522
Bananas 1 0.86956
522
Rabbits 1 0.86956
522
Eggs 56 48.6956
522 Total 115 100
85 households mention at least one other agricultural product, 27 households have at least 2 additional agricultural goods and 3 household mention a third agricultural good.
33b. All locations of additional agricultural products
Frequency
Percent
Own field 62 59.0
Own garden 22 21.0
Group field 1 1.0
At home 20 19.0
Total 105 100
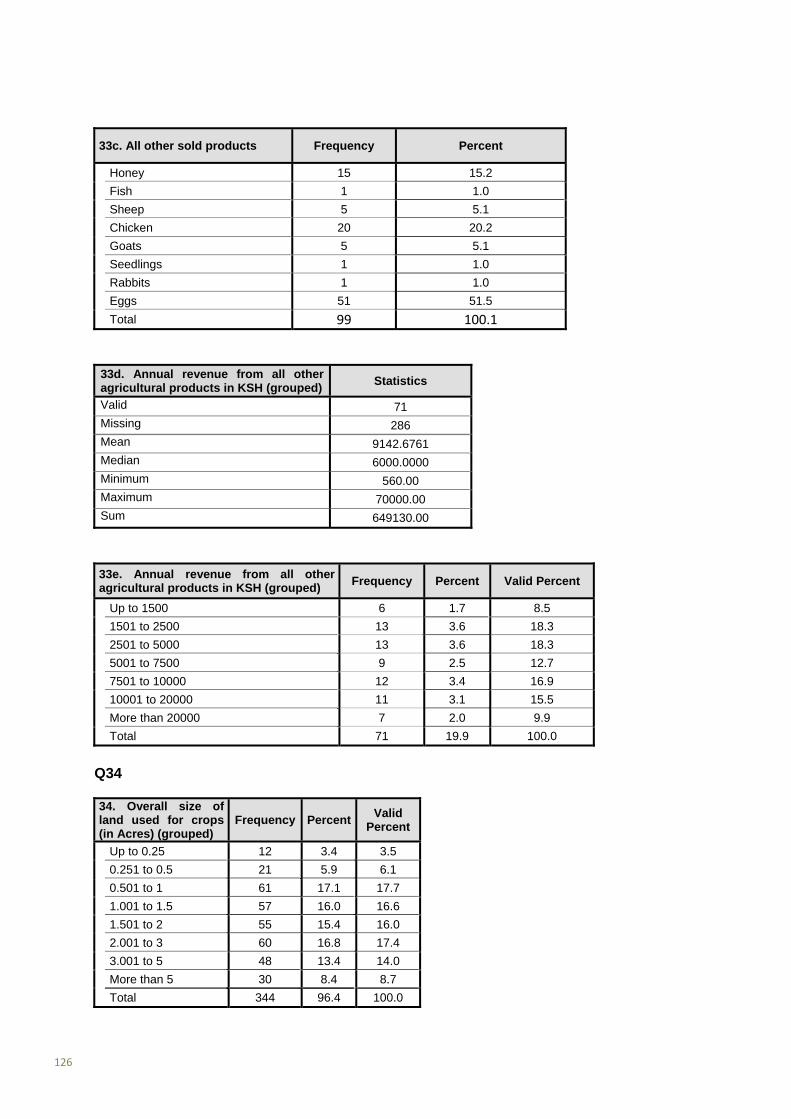
126
33c. All other sold products Frequency Percent
Honey 15 15.2
Fish 1 1.0
Sheep 5 5.1
Chicken 20 20.2
Goats 5 5.1
Seedlings 1 1.0
Rabbits 1 1.0
Eggs 51 51.5
Total 99 100.1
33d. Annual revenue from all other agricultural products in KSH (grouped)
Statistics
Valid 71 Missing 286 Mean 9142.6761 Median 6000.0000 Minimum 560.00 Maximum 70000.00 Sum 649130.00
33e. Annual revenue from all other agricultural products in KSH (grouped)
Frequency Percent Valid Percent
Up to 1500 6 1.7 8.5
1501 to 2500 13 3.6 18.3
2501 to 5000 13 3.6 18.3
5001 to 7500 9 2.5 12.7
7501 to 10000 12 3.4 16.9
10001 to 20000 11 3.1 15.5
More than 20000 7 2.0 9.9
Total 71 19.9 100.0
Q34
34. Overall size of land used for crops (in Acres) (grouped)
Frequency PercentValid
Percent
Up to 0.25 12 3.4 3.5
0.251 to 0.5 21 5.9 6.1
0.501 to 1 61 17.1 17.7
1.001 to 1.5 57 16.0 16.6
1.501 to 2 55 15.4 16.0
2.001 to 3 60 16.8 17.4
3.001 to 5 48 13.4 14.0
More than 5 30 8.4 8.7
Total 344 96.4 100.0
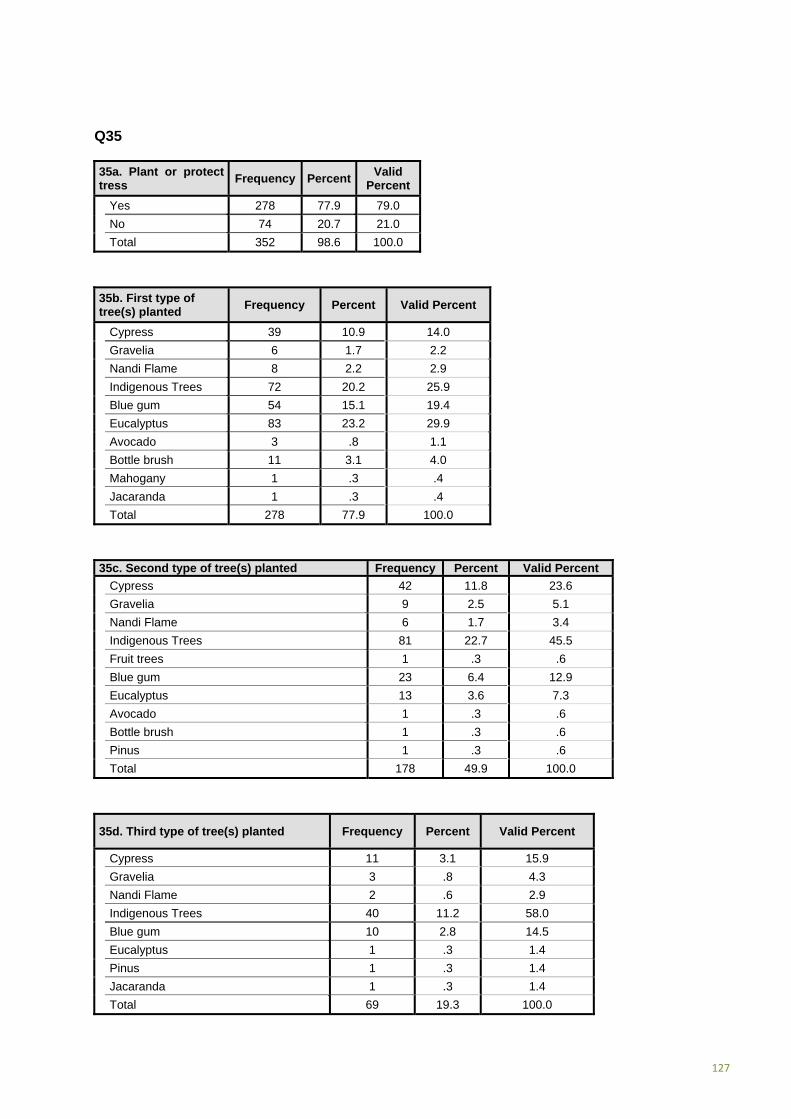
127
Q35
35a. Plant or protect tress
Frequency PercentValid
Percent
Yes 278 77.9 79.0
No 74 20.7 21.0
Total 352 98.6 100.0
35b. First type of tree(s) planted
Frequency Percent Valid Percent
Cypress 39 10.9 14.0
Gravelia 6 1.7 2.2
Nandi Flame 8 2.2 2.9
Indigenous Trees 72 20.2 25.9
Blue gum 54 15.1 19.4
Eucalyptus 83 23.2 29.9
Avocado 3 .8 1.1
Bottle brush 11 3.1 4.0
Mahogany 1 .3 .4
Jacaranda 1 .3 .4
Total 278 77.9 100.0
35c. Second type of tree(s) planted Frequency Percent Valid Percent
Cypress 42 11.8 23.6
Gravelia 9 2.5 5.1
Nandi Flame 6 1.7 3.4
Indigenous Trees 81 22.7 45.5
Fruit trees 1 .3 .6
Blue gum 23 6.4 12.9
Eucalyptus 13 3.6 7.3
Avocado 1 .3 .6
Bottle brush 1 .3 .6
Pinus 1 .3 .6
Total 178 49.9 100.0
35d. Third type of tree(s) planted Frequency Percent Valid Percent
Cypress 11 3.1 15.9
Gravelia 3 .8 4.3
Nandi Flame 2 .6 2.9
Indigenous Trees 40 11.2 58.0
Blue gum 10 2.8 14.5
Eucalyptus 1 .3 1.4
Pinus 1 .3 1.4
Jacaranda 1 .3 1.4
Total 69 19.3 100.0

128
35e. All type of tree(s) planted
Frequency
Percent
Cypress 92 17.5
Gravelia 18 3.4
Nandi Flame 16 3.0
Indigenous Trees 193 36.8
Fruit trees 1 .2
Blue gum 87 16.6
Eucalyptus 97 18.5
Avocado 4 .8
Bottle brush 12 2.3
Pinus 2 .4
Mahogany 1 .2
Jacaranda 2 .4
Total 525 100.0
35f. Number of different types of trees
Frequency
Percent Valid
Percent
1.00 100 28.0 36.4
2.00 108 30.3 39.3
3.00 67 18.8 24.4
Total 275 77.0 100.0
35g. Number of tree(s) planted for type 1
Frequency
Percent Valid
Percent
Up to 5 33 9.2 17.5
6 to 10 38 10.6 20.1
11 to 25 36 10.1 19.0
26 to 50 28 7.8 14.8
51 to 100 25 7.0 13.2
101 to 200 15 4.2 7.9
More than 200 14 3.9 7.4
Total 189 52.9 100.0
35h. Number of tree(s) planted for type 2
Frequency
Percent Valid
Percent
Up to 5 37 10.4 32.5
6 to 10 34 9.5 29.8
11 to 25 13 3.6 11.4
26 to 50 16 4.5 14.0
51 to 100 8 2.2 7.0
101 to 200 1 .3 .9
More than 200 5 1.4 4.4
Total 114 31.9 100.0
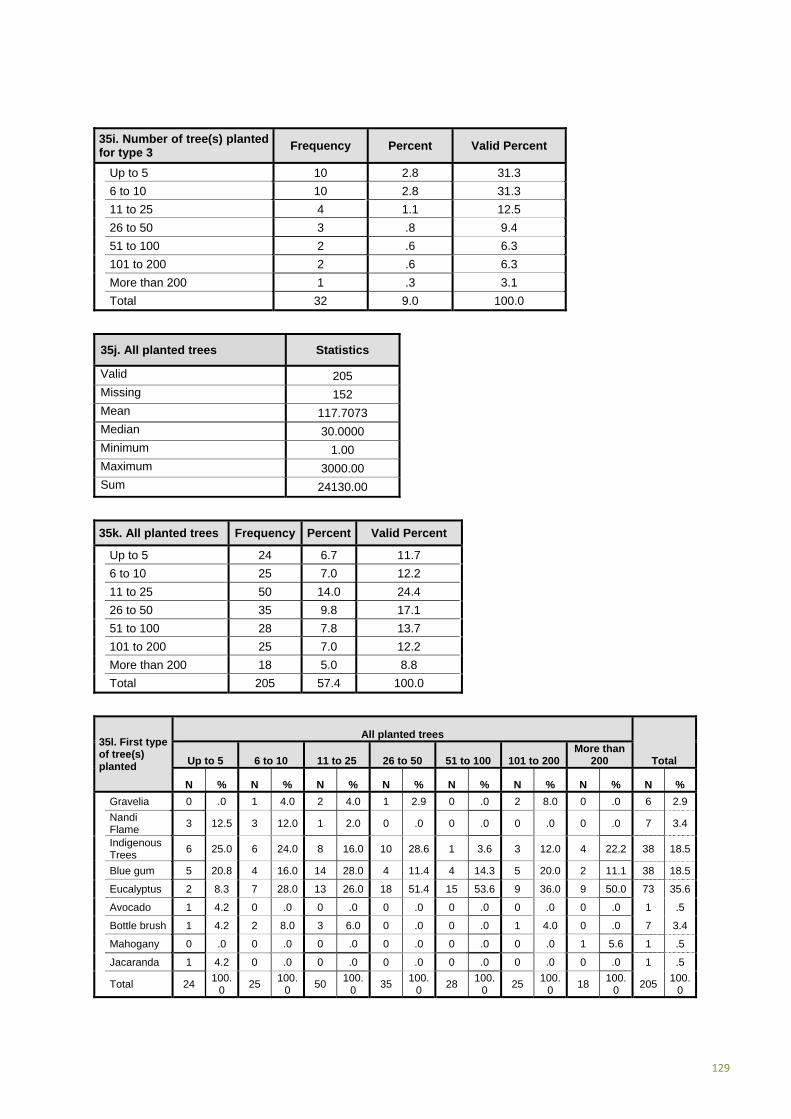
129
35i. Number of tree(s) planted for type 3
Frequency Percent Valid Percent
Up to 5 10 2.8 31.3
6 to 10 10 2.8 31.3
11 to 25 4 1.1 12.5
26 to 50 3 .8 9.4
51 to 100 2 .6 6.3
101 to 200 2 .6 6.3
More than 200 1 .3 3.1
Total 32 9.0 100.0
35j. All planted trees Statistics
Valid 205 Missing 152 Mean 117.7073 Median 30.0000 Minimum 1.00 Maximum 3000.00 Sum 24130.00
35k. All planted trees Frequency Percent Valid Percent
Up to 5 24 6.7 11.7
6 to 10 25 7.0 12.2
11 to 25 50 14.0 24.4
26 to 50 35 9.8 17.1
51 to 100 28 7.8 13.7
101 to 200 25 7.0 12.2
More than 200 18 5.0 8.8
Total 205 57.4 100.0
35l. First type of tree(s) planted
All planted trees
Total Up to 5 6 to 10 11 to 25 26 to 50 51 to 100 101 to 200 More than
200
N % N % N % N % N % N % N % N %
Gravelia 0 .0 1 4.0 2 4.0 1 2.9 0 .0 2 8.0 0 .0 6 2.9
Nandi Flame
3 12.5 3 12.0 1 2.0 0 .0 0 .0 0 .0 0 .0 7 3.4
Indigenous Trees
6 25.0 6 24.0 8 16.0 10 28.6 1 3.6 3 12.0 4 22.2 38 18.5
Blue gum 5 20.8 4 16.0 14 28.0 4 11.4 4 14.3 5 20.0 2 11.1 38 18.5
Eucalyptus 2 8.3 7 28.0 13 26.0 18 51.4 15 53.6 9 36.0 9 50.0 73 35.6
Avocado 1 4.2 0 .0 0 .0 0 .0 0 .0 0 .0 0 .0 1 .5
Bottle brush 1 4.2 2 8.0 3 6.0 0 .0 0 .0 1 4.0 0 .0 7 3.4
Mahogany 0 .0 0 .0 0 .0 0 .0 0 .0 0 .0 1 5.6 1 .5
Jacaranda 1 4.2 0 .0 0 .0 0 .0 0 .0 0 .0 0 .0 1 .5
Total 24 100.
0 25
100.0
50 100.
0 35
100.0
28 100.
0 25
100.0
18 100.
0 205
100.0
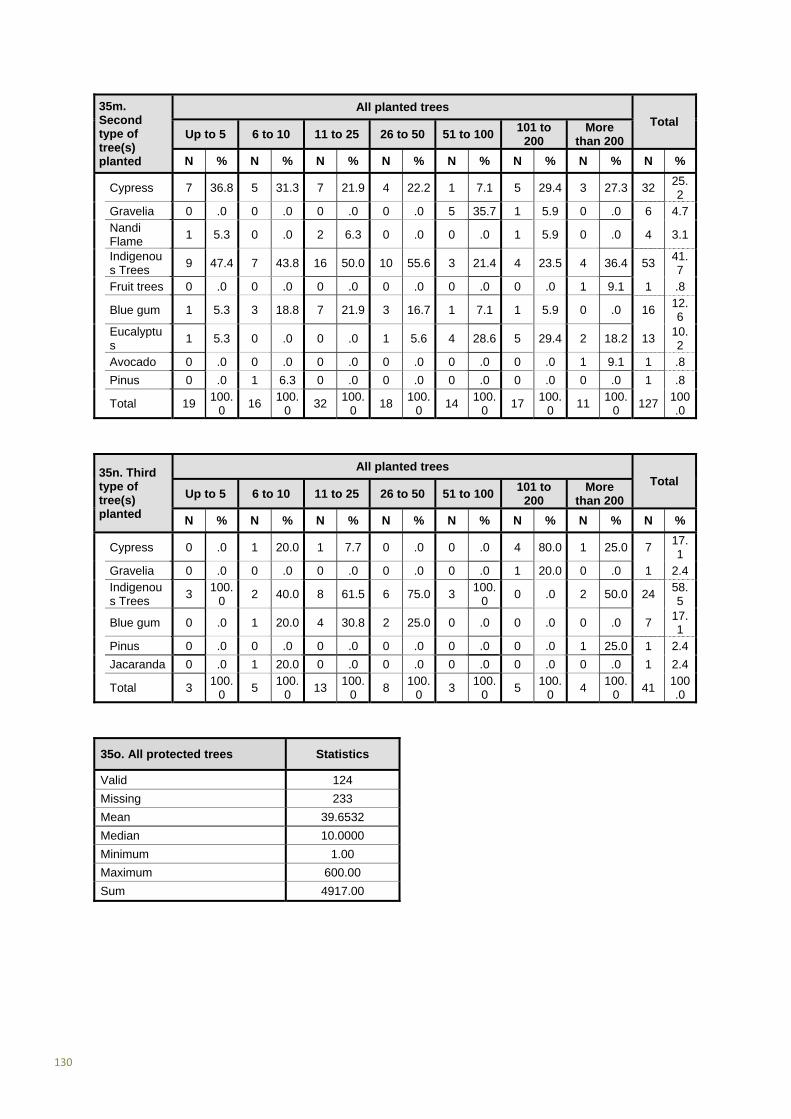
130
35m. Second type of tree(s) planted
All planted trees Total
Up to 5 6 to 10 11 to 25 26 to 50 51 to 100101 to
200 More
than 200
N % N % N % N % N % N % N % N %
Cypress 7 36.8 5 31.3 7 21.9 4 22.2 1 7.1 5 29.4 3 27.3 32 25.2
Gravelia 0 .0 0 .0 0 .0 0 .0 5 35.7 1 5.9 0 .0 6 4.7 Nandi Flame
1 5.3 0 .0 2 6.3 0 .0 0 .0 1 5.9 0 .0 4 3.1
Indigenous Trees
9 47.4 7 43.8 16 50.0 10 55.6 3 21.4 4 23.5 4 36.4 53 41.7
Fruit trees 0 .0 0 .0 0 .0 0 .0 0 .0 0 .0 1 9.1 1 .8
Blue gum 1 5.3 3 18.8 7 21.9 3 16.7 1 7.1 1 5.9 0 .0 16 12.6
Eucalyptus
1 5.3 0 .0 0 .0 1 5.6 4 28.6 5 29.4 2 18.2 13 10.2
Avocado 0 .0 0 .0 0 .0 0 .0 0 .0 0 .0 1 9.1 1 .8
Pinus 0 .0 1 6.3 0 .0 0 .0 0 .0 0 .0 0 .0 1 .8
Total 19 100.
0 16
100.0
32 100.
0 18
100.0
14 100.
0 17
100.0
11 100.
0 127
100.0
35n. Third type of tree(s) planted
All planted trees Total
Up to 5 6 to 10 11 to 25 26 to 50 51 to 100101 to
200 More
than 200
N % N % N % N % N % N % N % N %
Cypress 0 .0 1 20.0 1 7.7 0 .0 0 .0 4 80.0 1 25.0 7 17.1
Gravelia 0 .0 0 .0 0 .0 0 .0 0 .0 1 20.0 0 .0 1 2.4 Indigenous Trees
3 100.
0 2 40.0 8 61.5 6 75.0 3
100.0
0 .0 2 50.0 24 58.5
Blue gum 0 .0 1 20.0 4 30.8 2 25.0 0 .0 0 .0 0 .0 7 17.1
Pinus 0 .0 0 .0 0 .0 0 .0 0 .0 0 .0 1 25.0 1 2.4
Jacaranda 0 .0 1 20.0 0 .0 0 .0 0 .0 0 .0 0 .0 1 2.4
Total 3 100.
0 5
100.0
13 100.
0 8
100.0
3 100.
0 5
100.0
4 100.
0 41
100.0
35o. All protected trees Statistics
Valid 124
Missing 233
Mean 39.6532
Median 10.0000
Minimum 1.00
Maximum 600.00
Sum 4917.00

131
35p. All protected trees
Frequency
Percent Valid
Percent
Up to 5 43 12.0 34.7
6 to 10 24 6.7 19.4
11 to 25 19 5.3 15.3
26 to 50 16 4.5 12.9
51 to 100 7 2.0 5.6
101 to 200 11 3.1 8.9
More than 200 4 1.1 3.2
Total 124 34.7 100.0
35q.First type of tree(s) planted
All protected trees Total
Up to 5 6 to 10 11 to 25 26 to 50 51 to 100101 to
200 More
than 200
N % N % N % N % N % N % N % N %
Cypress 8 18.6 3 12.5 1 5.3 2 12.5 2 28.6 0 .0 0 .0 16 12.9
Gravelia 0 .0 2 8.3 1 5.3 0 .0 0 .0 1 9.1 0 .0 4 3.2 Nandi Flame
2 4.7 0 .0 0 .0 0 .0 0 .0 0 .0 0 .0 2 1.6
Indigenous Trees
18 41.9 9 37.5 8 42.1 1 6.3 1 14.3 2 18.2 1 25.0 40 32.3
Blue gum 5 11.6 5 20.8 4 21.1 2 12.5 0 .0 1 9.1 0 .0 17 13.7
Eucalyptus
3 7.0 5 20.8 5 26.3 8 50.0 4 57.1 6 54.5 3 75.0 34 27.4
Avocado 2 4.7 0 .0 0 .0 0 .0 0 .0 0 .0 0 .0 2 1.6 Bottle brush
4 9.3 0 .0 0 .0 3 18.8 0 .0 1 9.1 0 .0 8 6.5
Jacaranda 1 2.3 0 .0 0 .0 0 .0 0 .0 0 .0 0 .0 1 .8
Total 43 100.
0 24
100.0
19 100.
0 16
100.0
7 100.
0 11
100.0
4 100.
0 124
100.0
35r. Second type of tree(s) planted
All protected trees
Total Up to 5 6 to 10 11 to 25 26 to 50
51 to 100
101 to 200
More than 200
N % N % N % N % N % N % N % N %
Cypress 9 31.0
2 15.4
1 7.1 3 30.0
0 .0 1 16.7
1 50.0 17 21.5
Gravelia 1 3.4 0 .0 2 14.3
1 10.0
2 40.0
1 16.7
0 .0 7 8.9
Nandi Flame
0 .0 2 15.4
0 .0 0 .0 0 .0 1 16.7
0 .0 3 3.8
Indigenous Trees
16 55.2
9 69.2
8 57.1
5 50.0
0 .0 2 33.3
1 50.0 41 51.9
Fruit trees 0 .0 0 .0 0 .0 0 .0 0 .0 1 16.7
0 .0 1 1.3
Blue gum 1 3.4 0 .0 3 21.4
0 .0 0 .0 0 .0 0 .0 4 5.1
Eucalyptus
1 3.4 0 .0 0 .0 1 10.0
3 60.0
0 .0 0 .0 5 6.3
Bottle brush
1 3.4 0 .0 0 .0 0 .0 0 .0 0 .0 0 .0 1 1.3
Total 29 100.0
13 100.0
14 100.0
10 100.0
5 100.0
6 100.0
2 100.0 79 100.0

132
35s. Third type of tree(s) planted
All protected trees Total
Up to 5 6 to 10 11 to 25 26 to 50 51 to 100
101 to 200
More than 200
N % N % N % N % N % N % N % N %
Cypress 2 22.2
0 .0 1 50.0
0 .0 1 33.3
1 50.0
0 .0 5 20.0
Gravelia 0 .0 0 .0 0 .0 0 .0 1 33.3
0 .0 0 .0 1 4.0
Indigenous Trees
3 33.3
6 100.0
1 50.0
2 100.0
1 33.3
1 50.0
1 100.0 15 60.0
Blue gum 2 22.2
0 .0 0 .0 0 .0 0 .0 0 .0 0 .0 2 8.0
Eucalyptus
1 11.1
0 .0 0 .0 0 .0 0 .0 0 .0 0 .0 1 4.0
Jacaranda 1 11.1
0 .0 0 .0 0 .0 0 .0 0 .0 0 .0 1 4.0
Total 9 100.0
6 100.0
2 100.0
2 100.0
3 100.0
2 100.0
1 100.0 25 100.0
35t.1 Plant or protect tress PROJECT PARTICIPANTS
Frequency PercentValid
Percent
Yes 110 81.5 83.3
No 22 16.3 16.7
Total 132 97.8 100.0
35u. Planning to protect trees in future
Frequency PercentValid
Percent
Yes 71 19.9 100.0
Total 71 19.9 100.0

133
Q36
36a. All sold goods at market
Frequency Percent
Beans 97 13.1
Potatoes 46 6.2
Maize 89 12.1
Tea 82 11.1
Onion 6 .8
Vegetables 34 4.6
Avocado 29 3.9
Bananas 100 13.6
Chicks/Chicken 18 2.4
Milk 132 17.9
Cabbages 19 2.6
Kales 10 1.4
Passions 8 1.1
Sweet Potatoes 3 .4
Rabbits 1 .1
Honey 4 .5
Goat 2 .3
Sugarcane 3 .4
Eggs 31 4.2
Coffee 16 2.2
Sorghum 3 .4
Tomato 5 .7
Total 738 100.0
333 Households sell at least one good at the market, 239 households can sell two goods, 131 households can sell 3 and 35 households can sell 4 goods at market.
36.b Frequency of going to market (self)
Frequency
Percent
twice a year 184 35.2
every three weeks 39 7.5
every second month 19 3.6
monthly 29 5.6
Every second week 27 5.2
every week 59 11.3
twice a week 13 2.5
daily 113 21.6
Once a year 38 7.3
Three times a year 1 .2
Total 522 100
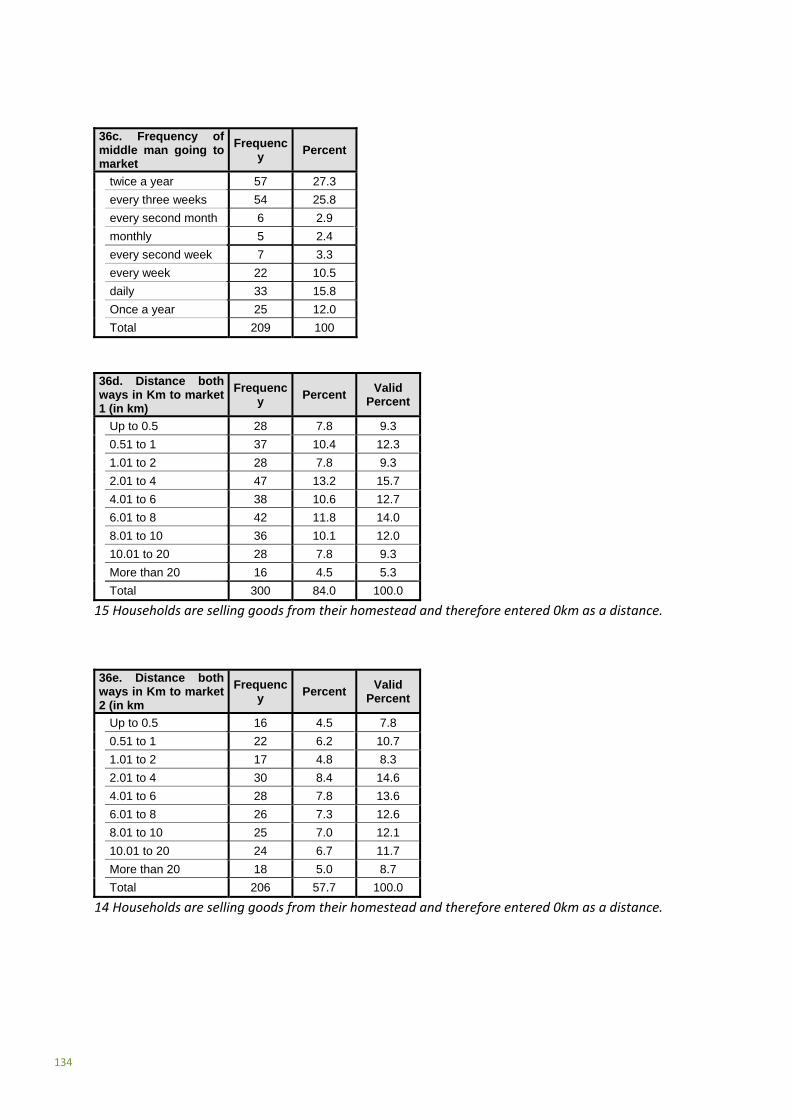
134
36c. Frequency of middle man going to market
Frequency
Percent
twice a year 57 27.3
every three weeks 54 25.8
every second month 6 2.9
monthly 5 2.4
every second week 7 3.3
every week 22 10.5
daily 33 15.8
Once a year 25 12.0
Total 209 100
36d. Distance both ways in Km to market 1 (in km)
Frequency
Percent Valid
Percent
Up to 0.5 28 7.8 9.3
0.51 to 1 37 10.4 12.3
1.01 to 2 28 7.8 9.3
2.01 to 4 47 13.2 15.7
4.01 to 6 38 10.6 12.7
6.01 to 8 42 11.8 14.0
8.01 to 10 36 10.1 12.0
10.01 to 20 28 7.8 9.3
More than 20 16 4.5 5.3
Total 300 84.0 100.0
15 Households are selling goods from their homestead and therefore entered 0km as a distance.
36e. Distance both ways in Km to market 2 (in km
Frequency
Percent Valid
Percent
Up to 0.5 16 4.5 7.8
0.51 to 1 22 6.2 10.7
1.01 to 2 17 4.8 8.3
2.01 to 4 30 8.4 14.6
4.01 to 6 28 7.8 13.6
6.01 to 8 26 7.3 12.6
8.01 to 10 25 7.0 12.1
10.01 to 20 24 6.7 11.7
More than 20 18 5.0 8.7
Total 206 57.7 100.0
14 Households are selling goods from their homestead and therefore entered 0km as a distance.

135
36f. Mode of transport to market 1
Frequency
Percent Valid
Percent
Foot 89 24.9 28.6
Bicycle 9 2.5 2.9
Motor bike 111 31.1 35.7
Car 78 21.8 25.1
Minibus 1 .3 .3
Truck 14 3.9 4.5
Donkey cart 9 2.5 2.9
Total 311 87.1 100.0
36g. Mode of transport to market 2
Frequency
Percent Valid
Percent
Foot 52 14.6 24.6
Bicycle 3 .8 1.4
Motor bike 70 19.6 33.2
Car 65 18.2 30.8
Minibus 1 .3 .5
Truck 12 3.4 5.7
Donkey cart 8 2.2 3.8
Total 211 59.1 100.0
36h. Distance both ways to market 1 (in km)
Mode of transport to market 1 Total
Foot Bicycle Motor bike
Car Minibus Truck Donkey
cart
N % N % N % N % N % N % N % N %
Up to 0.5 25 30.5 0 .0 1 .9 1 1.3 0 .0 1 7.1 0 .0 28 9.4
0.51 to 1 25 30.5 0 .0 6 5.6 4 5.2 0 .0 1 7.1 1 11.1 37 12.4
1.01 to 2 14 17.1 1 11.1 8 7.5 2 2.6 0 .0 2 14.3 1 11.1 28 9.4
2.01 to 4 10 12.2 4 44.4 22 20.6 7 9.1 0 .0 2 14.3 1 11.1 46 15.4
4.01 to 6 8 9.8 4 44.4 14 13.1 8 10.4 0 .0 1 7.1 3 33.3 38 12.7
6.01 to 8 0 .0 0 .0 32 29.9 9 11.7 0 .0 0 .0 1 11.1 42 14.0
8.01 to 10 0 .0 0 .0 15 14.0 19 24.7 0 .0 1 7.1 1 11.1 36 12.0
10.01 to 20
0 .0 0 .0 8 7.5 14 18.2 1 100.
0 4 28.6 1 11.1 28 9.4
More than 20
0 .0 0 .0 1 .9 13 16.9 0 .0 2 14.3 0 .0 16 5.4
Total 82 100.
0 9
100.0
107100.
0 77
100.0
1 100.
0 14
100.0
9 100.
0 299
100.0

136
36i. Distance both ways to market 2 (in km)
Mode of transport to market 2 Total
Foot Bicycle Motor bike
Car Minibus Truck Donkey
cart
N % N % N % N % N % N % N % N %
Up to 0.5 15 34.9 0 .0 0 .0 1 1.6 0 .0 0 .0 0 .0 16 8.1
0.51 to 1 8 18.6 0 .0 6 8.8 7 10.9 0 .0 0 .0 1 14.3 22 11.1
1.01 to 2 5 11.6 1 33.3 8 11.8 1 1.6 0 .0 1 8.3 0 .0 16 8.1
2.01 to 4 8 18.6 1 33.3 11 16.2 5 7.8 0 .0 1 8.3 1 14.3 27 13.6
4.01 to 6 6 14.0 1 33.3 8 11.8 8 12.5 0 .0 2 16.7 2 28.6 27 13.6
6.01 to 8 0 .0 0 .0 18 26.5 4 6.3 0 .0 1 8.3 0 .0 23 11.6
8.01 to 10 0 .0 0 .0 8 11.8 15 23.4 0 .0 1 8.3 1 14.3 25 12.6
10.01 to 20
0 .0 0 .0 8 11.8 12 18.8 0 .0 4 33.3 0 .0 24 12.1
More than 20
1 2.3 0 .0 1 1.5 11 17.2 1 100.
0 2 16.7 2 28.6 18 9.1
Total 43 100.
0 3
100.0
68 100.
0 64
100.0
1 100.
0 12
100.0
7 100.
0 198
100.0
Q37
37. Hired staff/laborer in the last 12 months
Frequency
Percent Valid
Percent
Yes 132 37.0 37.9
No 216 60.5 62.1
Total 348 97.5 100.0
Q38
38a. Number of permanent hired female staff
Statistics
Valid 14 Missing 343 Mean 1.9286 Median 1.5000 Minimum 1.00 Maximum 6.00 Sum 27.00

137
38b. Number of permanent hired female staff
Frequency
Percent Valid
Percent
1.00 7 2.0 50.0
2.00 4 1.1 28.6
3.00 2 .6 14.3
6.00 1 .3 7.1
Total 14 3.9 100.0
38c. Task of permanent hired female staff
Frequency
Percent Valid
Percent
Tea plucking 12 3.4 85.7
Milking and herding 1 .3 7.1
House help 1 .3 7.1
Total 14 3.9 100.0
38d. Number of hired casual labour - female (days per year)
Statistics
Valid 42 Missing 315 Mean 230.6190 Median 156.0000 Minimum 6.00 Maximum 1440.00 Sum 9686.00
38e. Number of hired casual labour - female (days per year)
Frequency
Percent Valid
Percent
Up to 24 3 .8 7.1
25 to 48 8 2.2 19.0
49 to 120 7 2.0 16.7
121 to 240 8 2.2 19.0
241 to 360 9 2.5 21.4
361 to 480 4 1.1 9.5
More than 480 3 .8 7.1
Total 42 11.8 100.0

138
38f. Task of hired casual labour - female
Frequency
Percent Valid
Percent
Tea plucking 34 9.5 79.1 Weeding and planting
1 .3 2.3
Weeding 7 2.0 16.3 Harvesting and weeding
1 .3 2.3
Total 43 12.0 100.0
38g. Number of permanent hired male staff
Statistics
Valid 63 Missing 294 Mean 1.2540 Median 1.0000 Minimum 1.00 Maximum 4.00 Sum 79.00
38h. Number of permanent hired male staff
Frequency
Percent Valid
Percent
1.00 52 14.6 82.5
2.00 7 2.0 11.1
3.00 3 .8 4.8
4.00 1 .3 1.6
Total 63 17.6 100.0
38i. Task of permanent hired male staff
Frequency
Percent Valid
Percent
Tea plucking 6 1.7 9.5 Weeding and planting
1 .3 1.6
Weeding 3 .8 4.8
Herding 40 11.2 63.5
General farming 9 2.5 14.3 Plucking and weeding
1 .3 1.6
Herding and plucking 3 .8 4.8
Total 63 17.6 100.0

139
38j. Number of hired casual labour - male (days per year)
Statistics
Valid 72 Missing 285 Mean 231.3472 Median 120.0000 Minimum 8.00 Maximum 2880.00 Sum 16657.00
38k. Number of hired casual labour - male (days per year)
Frequency
Percent Valid
Percent
Up to 24 6 1.7 8.3
25 to 48 11 3.1 15.3
49 to 120 20 5.6 27.8
121 to 240 13 3.6 18.1
241 to 360 14 3.9 19.4
361 to 480 4 1.1 5.6
More than 480 4 1.1 5.6
Total 72 20.2 100.0
38l. Task of hired casual labour - male
Frequency
Percent Valid
Percent
Tea plucking 42 11.8 57.5 Weeding and planting
1 .3 1.4
Weeding 10 2.8 13.7 Harvesting and weeding
4 1.1 5.5
Plucking and weeding
1 .3 1.4
Milking and feeding 1 .3 1.4
Digging and weeding 4 1.1 5.5
Digging 3 .8 4.1
Harvesting 2 .6 2.7
Plucking and digging 2 .6 2.7 Coffee plucking and weeding
3 .8 4.1
Total 73 20.4 100.0
None of the interviewed households hires girls or boys less than 14 years of age.
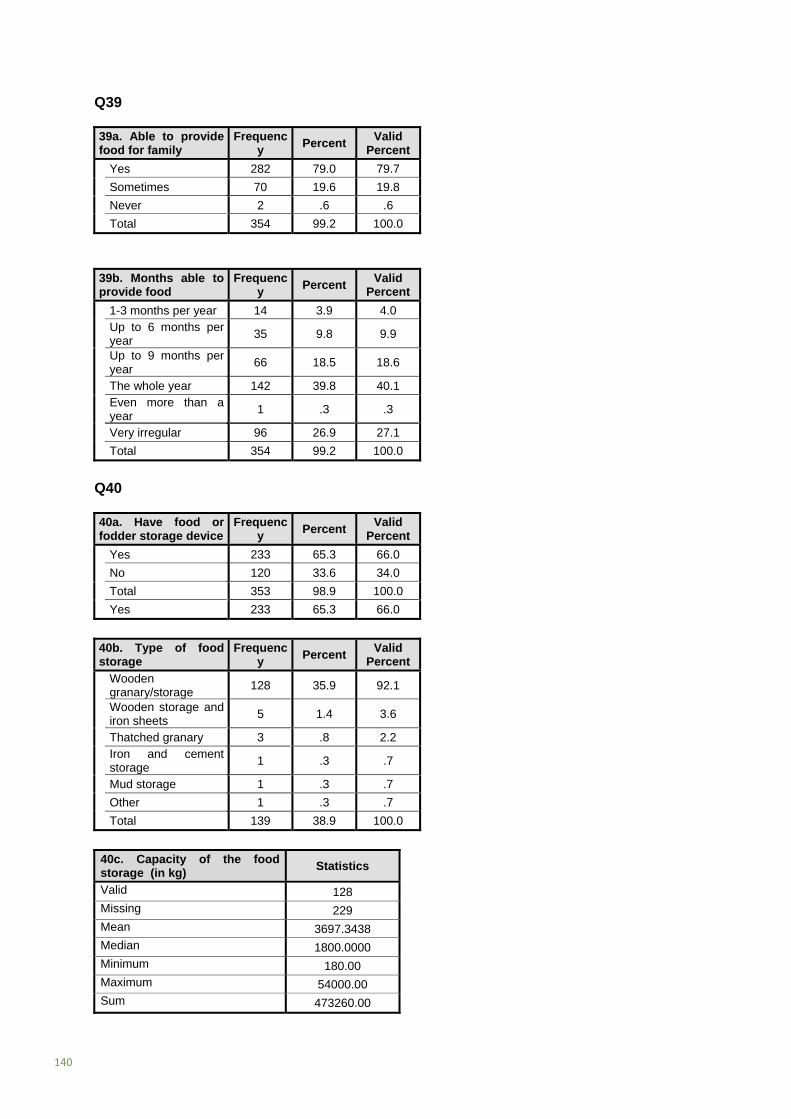
140
Q39
39a. Able to provide food for family
Frequency
Percent Valid
Percent
Yes 282 79.0 79.7
Sometimes 70 19.6 19.8
Never 2 .6 .6
Total 354 99.2 100.0
39b. Months able to provide food
Frequency
Percent Valid
Percent
1-3 months per year 14 3.9 4.0 Up to 6 months per year
35 9.8 9.9
Up to 9 months per year
66 18.5 18.6
The whole year 142 39.8 40.1 Even more than a year
1 .3 .3
Very irregular 96 26.9 27.1
Total 354 99.2 100.0
Q40
40a. Have food or fodder storage device
Frequency
Percent Valid
Percent
Yes 233 65.3 66.0
No 120 33.6 34.0
Total 353 98.9 100.0
Yes 233 65.3 66.0
40b. Type of food storage
Frequency
Percent Valid
Percent
Wooden granary/storage
128 35.9 92.1
Wooden storage and iron sheets
5 1.4 3.6
Thatched granary 3 .8 2.2 Iron and cement storage
1 .3 .7
Mud storage 1 .3 .7
Other 1 .3 .7
Total 139 38.9 100.0
40c. Capacity of the food storage (in kg)
Statistics
Valid 128 Missing 229 Mean 3697.3438 Median 1800.0000 Minimum 180.00 Maximum 54000.00 Sum 473260.00
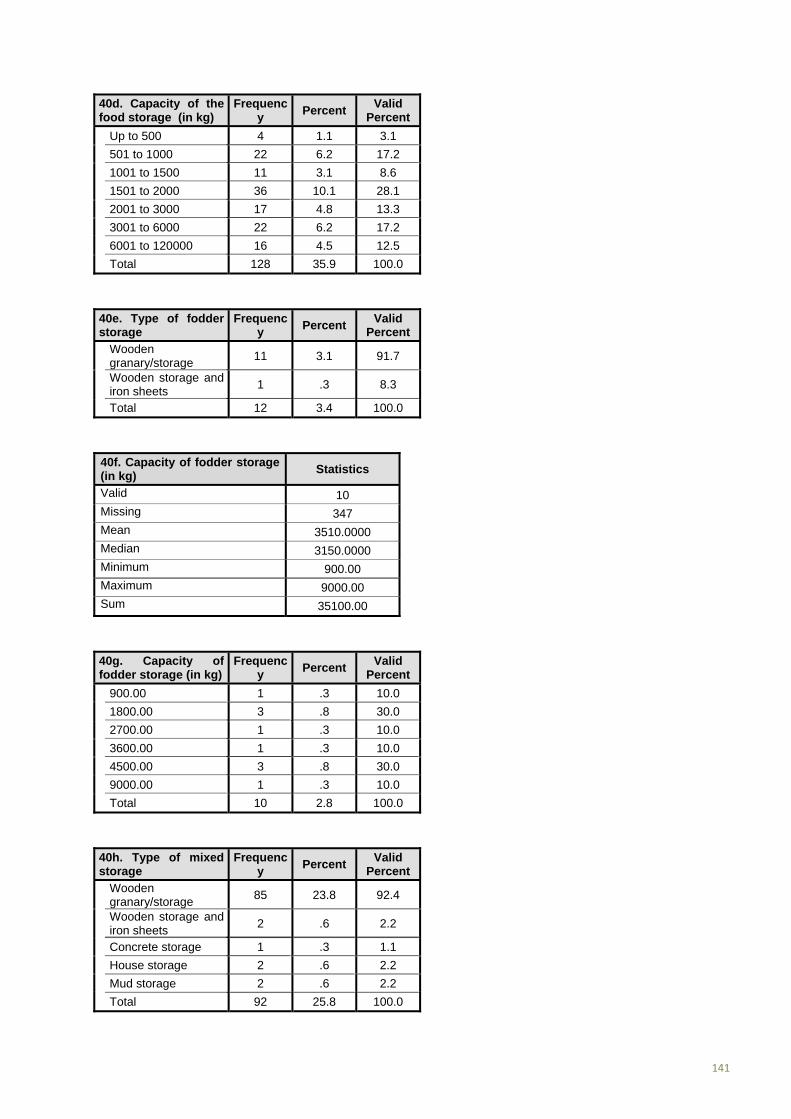
141
40d. Capacity of the food storage (in kg)
Frequency
Percent Valid
Percent
Up to 500 4 1.1 3.1
501 to 1000 22 6.2 17.2
1001 to 1500 11 3.1 8.6
1501 to 2000 36 10.1 28.1
2001 to 3000 17 4.8 13.3
3001 to 6000 22 6.2 17.2
6001 to 120000 16 4.5 12.5
Total 128 35.9 100.0
40e. Type of fodder storage
Frequency
Percent Valid
Percent
Wooden granary/storage
11 3.1 91.7
Wooden storage and iron sheets
1 .3 8.3
Total 12 3.4 100.0
40f. Capacity of fodder storage (in kg)
Statistics
Valid 10 Missing 347 Mean 3510.0000 Median 3150.0000 Minimum 900.00 Maximum 9000.00 Sum 35100.00
40g. Capacity of fodder storage (in kg)
Frequency
Percent Valid
Percent
900.00 1 .3 10.0
1800.00 3 .8 30.0
2700.00 1 .3 10.0
3600.00 1 .3 10.0
4500.00 3 .8 30.0
9000.00 1 .3 10.0
Total 10 2.8 100.0
40h. Type of mixed storage
Frequency
Percent Valid
Percent
Wooden granary/storage
85 23.8 92.4
Wooden storage and iron sheets
2 .6 2.2
Concrete storage 1 .3 1.1
House storage 2 .6 2.2
Mud storage 2 .6 2.2
Total 92 25.8 100.0
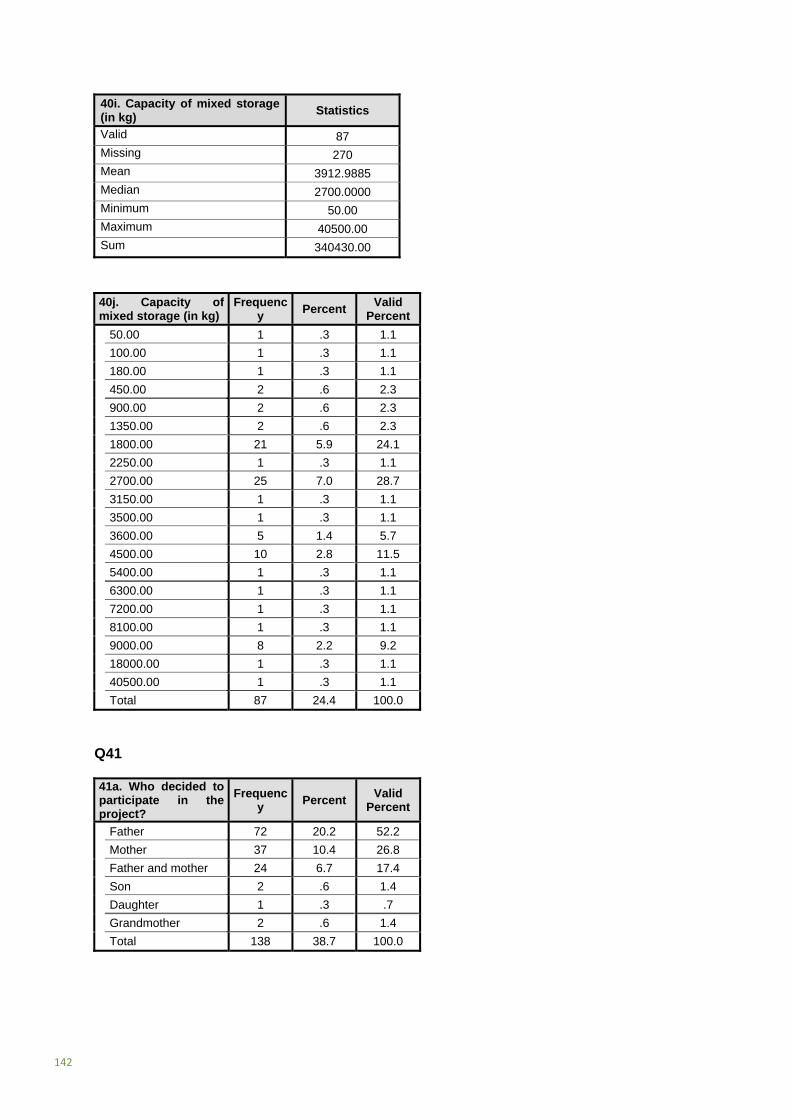
142
40i. Capacity of mixed storage (in kg)
Statistics
Valid 87 Missing 270 Mean 3912.9885 Median 2700.0000 Minimum 50.00 Maximum 40500.00 Sum 340430.00
40j. Capacity of mixed storage (in kg)
Frequency
Percent Valid
Percent
50.00 1 .3 1.1
100.00 1 .3 1.1
180.00 1 .3 1.1
450.00 2 .6 2.3
900.00 2 .6 2.3
1350.00 2 .6 2.3
1800.00 21 5.9 24.1
2250.00 1 .3 1.1
2700.00 25 7.0 28.7
3150.00 1 .3 1.1
3500.00 1 .3 1.1
3600.00 5 1.4 5.7
4500.00 10 2.8 11.5
5400.00 1 .3 1.1
6300.00 1 .3 1.1
7200.00 1 .3 1.1
8100.00 1 .3 1.1
9000.00 8 2.2 9.2
18000.00 1 .3 1.1
40500.00 1 .3 1.1
Total 87 24.4 100.0
Q41
41a. Who decided to participate in the project?
Frequency
Percent Valid
Percent
Father 72 20.2 52.2
Mother 37 10.4 26.8
Father and mother 24 6.7 17.4
Son 2 .6 1.4
Daughter 1 .3 .7
Grandmother 2 .6 1.4
Total 138 38.7 100.0
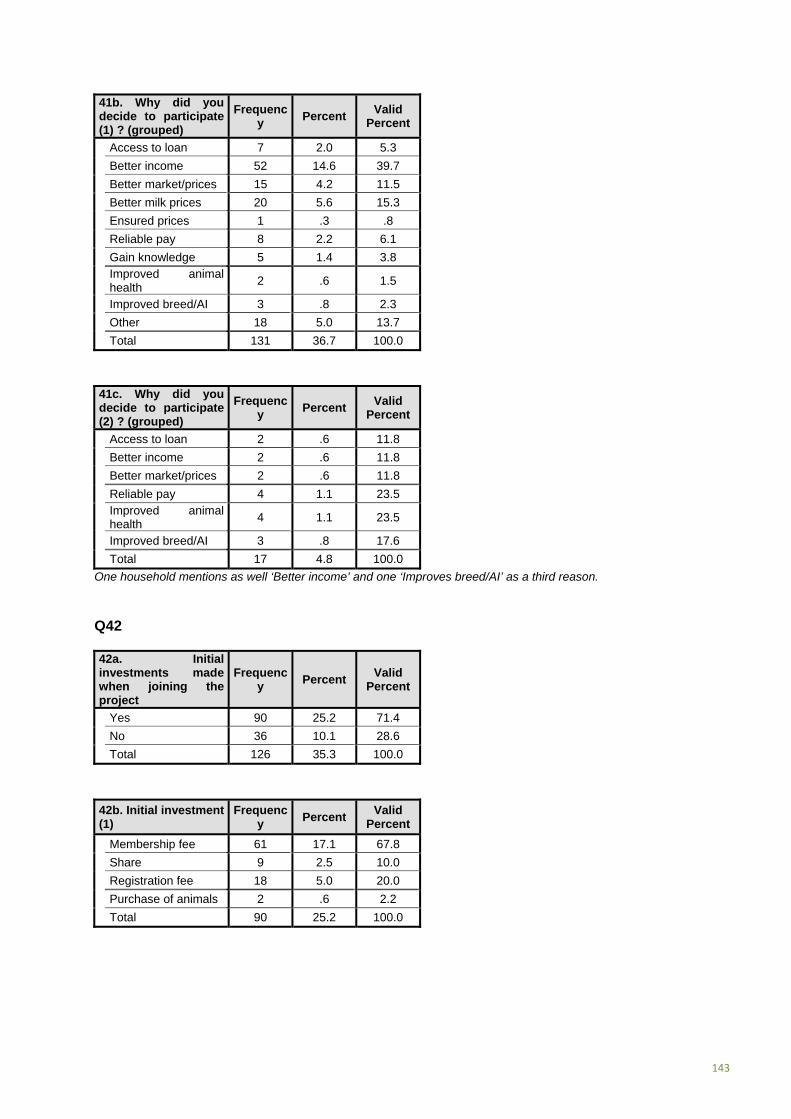
143
41b. Why did you decide to participate (1) ? (grouped)
Frequency
Percent Valid
Percent
Access to loan 7 2.0 5.3
Better income 52 14.6 39.7
Better market/prices 15 4.2 11.5
Better milk prices 20 5.6 15.3
Ensured prices 1 .3 .8
Reliable pay 8 2.2 6.1
Gain knowledge 5 1.4 3.8 Improved animal health
2 .6 1.5
Improved breed/AI 3 .8 2.3
Other 18 5.0 13.7
Total 131 36.7 100.0
41c. Why did you decide to participate (2) ? (grouped)
Frequency
Percent Valid
Percent
Access to loan 2 .6 11.8
Better income 2 .6 11.8
Better market/prices 2 .6 11.8
Reliable pay 4 1.1 23.5 Improved animal health
4 1.1 23.5
Improved breed/AI 3 .8 17.6
Total 17 4.8 100.0
One household mentions as well ‘Better income’ and one ‘Improves breed/AI’ as a third reason.
Q42
42a. Initial investments made when joining the project
Frequency
Percent Valid
Percent
Yes 90 25.2 71.4
No 36 10.1 28.6
Total 126 35.3 100.0
42b. Initial investment (1)
Frequency
Percent Valid
Percent
Membership fee 61 17.1 67.8
Share 9 2.5 10.0
Registration fee 18 5.0 20.0
Purchase of animals 2 .6 2.2
Total 90 25.2 100.0
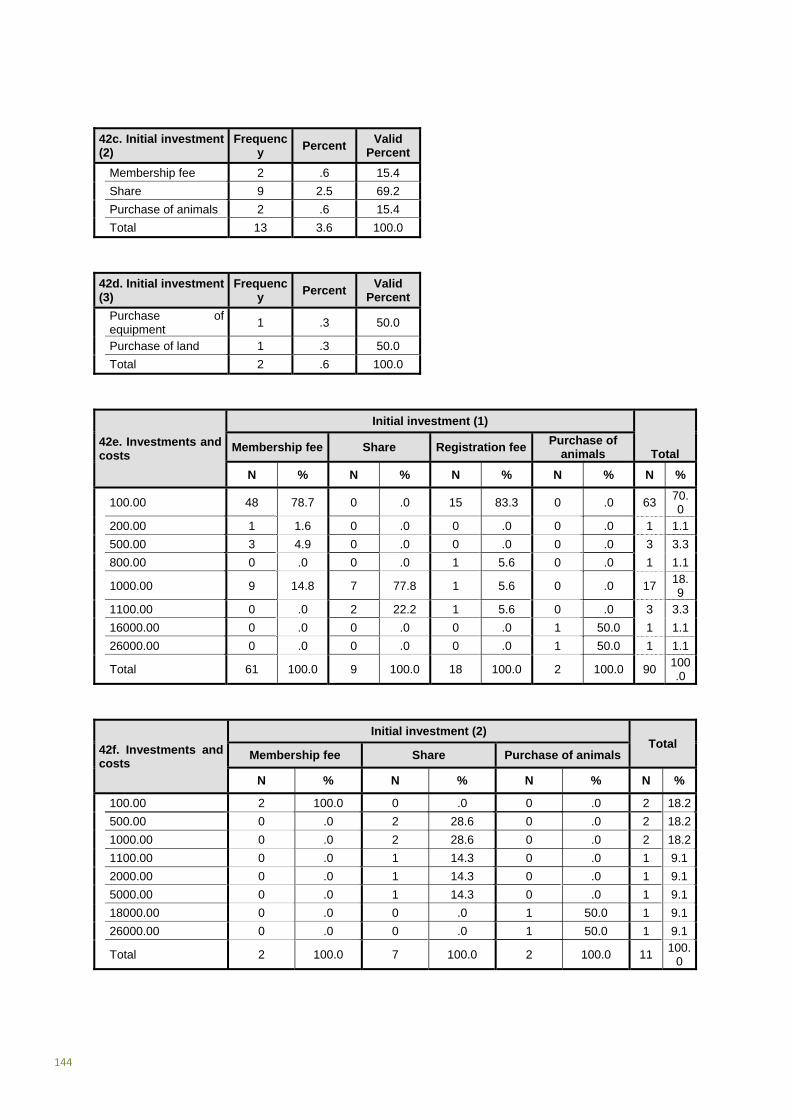
144
42c. Initial investment (2)
Frequency
Percent Valid
Percent
Membership fee 2 .6 15.4
Share 9 2.5 69.2
Purchase of animals 2 .6 15.4
Total 13 3.6 100.0
42d. Initial investment (3)
Frequency
Percent Valid
Percent
Purchase of equipment
1 .3 50.0
Purchase of land 1 .3 50.0
Total 2 .6 100.0
42e. Investments and costs
Initial investment (1)
Total Membership fee Share Registration fee
Purchase of animals
N % N % N % N % N %
100.00 48 78.7 0 .0 15 83.3 0 .0 63 70.0
200.00 1 1.6 0 .0 0 .0 0 .0 1 1.1
500.00 3 4.9 0 .0 0 .0 0 .0 3 3.3
800.00 0 .0 0 .0 1 5.6 0 .0 1 1.1
1000.00 9 14.8 7 77.8 1 5.6 0 .0 17 18.9
1100.00 0 .0 2 22.2 1 5.6 0 .0 3 3.3
16000.00 0 .0 0 .0 0 .0 1 50.0 1 1.1
26000.00 0 .0 0 .0 0 .0 1 50.0 1 1.1
Total 61 100.0 9 100.0 18 100.0 2 100.0 90 100.0
42f. Investments and costs
Initial investment (2) Total
Membership fee Share Purchase of animals
N % N % N % N %
100.00 2 100.0 0 .0 0 .0 2 18.2
500.00 0 .0 2 28.6 0 .0 2 18.2
1000.00 0 .0 2 28.6 0 .0 2 18.2
1100.00 0 .0 1 14.3 0 .0 1 9.1
2000.00 0 .0 1 14.3 0 .0 1 9.1
5000.00 0 .0 1 14.3 0 .0 1 9.1
18000.00 0 .0 0 .0 1 50.0 1 9.1
26000.00 0 .0 0 .0 1 50.0 1 9.1
Total 2 100.0 7 100.0 2 100.0 11 100.
0

145
42g. Investments and costs
Initial investment (3) Total
Purchase of equipment Purchase of land
N % N % N %
20000.00 1 100.0 0 .0 1 50.0
150000.00 0 .0 1 100.0 1 50.0
Total 1 100.0 1 100.0 2 100.0
42h. Amount in KSH of all initial investments (inclusive of shares and fees)
Statistics
N Valid 91
N Missing 266
Mean 3480.2198
Median 100.0000
Minimum 100.00
Maximum 151100.00
Sum 316700.00
42i. Amount in KSH of all initial investments (inclusive of shares and fees)
Frequency
Percent Valid
Percent
100.00 56 15.7 61.5
200.00 1 .3 1.1
500.00 3 .8 3.3
600.00 1 .3 1.1
800.00 1 .3 1.1
1000.00 12 3.4 13.2
1100.00 4 1.1 4.4
1200.00 2 .6 2.2
1300.00 1 .3 1.1
2100.00 1 .3 1.1
5100.00 1 .3 1.1
6000.00 2 .6 2.2
16000.00 1 .3 1.1
22000.00 1 .3 1.1
25600.00 1 .3 1.1
27000.00 2 .6 2.2
151100.00 1 .3 1.1
Total 91 25.5 100.0

146
Q43
43a. Regular additional costs due to project participation
Frequency
Percent Valid
Percent
Yes 65 18.2 54.6
No 54 15.1 45.4
Total 119 33.3 100.0
43b. Amount in KSH for additional cost in labour
Frequency
Percent Valid
Percent
5000.00 1 .3 33.3
15000.00 1 .3 33.3
18000.00 1 .3 33.3
Total 3 .8 100.0
43c. Amount in KSH for additional cost in equipment
Frequency Percent
Valid Percent
350.00 1 .3 16.7 600.00 1 .3 16.7 800.00 1 .3 16.7 1000.00 1 .3 16.7 2000.00 1 .3 16.7 2400.00 1 .3 16.7 Total 6 1.7 100.0
43d. Amount in KSH for additional cost in share expenditure
Frequency Percent
Valid Percent
100.00 3 .8 33.3 1000.00 1 .3 11.1 1200.00 1 .3 11.1 3000.00 1 .3 11.1 5000.00 3 .8 33.3 Total 9 2.5 100.0
This question caused confusion as the project does not require regular membership or other fees. Therefore the given figures are perceived as initial investments and have been included in the calculation of the overall amount of initial investments (table 42ff).

147
43e. Amount in KSH for additional cost in resources (drugs, fodder)
Frequency
Percent Valid
Percent
4000.00 1 .3 14.3
5600.00 1 .3 14.3
12000.00 2 .6 28.6
13000.00 1 .3 14.3
15000.00 1 .3 14.3
24000.00 1 .3 14.3
Total 7 2.0 100.0
43f. Amount in KSH for additional cost in veterinary services
Frequency
Percent Valid
Percent
200.00 1 .3 7.7
1000.00 1 .3 7.7
1200.00 1 .3 7.7
1500.00 1 .3 7.7
1800.00 2 .6 15.4
2400.00 3 .8 23.1
5000.00 1 .3 7.7
6200.00 1 .3 7.7
8700.00 1 .3 7.7
15000.00 1 .3 7.7
Total 13 3.6 100.0
43g. Additional time per year (in h)
Statistics
N Valid 56
N Missing 301
Mean 180.0000
Median 143.0000
Minimum 1.00
Maximum 730.00
Sum 10080.00

148
CORRECTED
43i. Additional time per year (in h) – corrected
Statistics
N Valid 56
N Missing 301
Mean 349.0000
Median 365.0000
Minimum 12.00
Maximum 1095.00
Sum 19544.00
43h. Additional time per year (in h)
Frequency
Percent Valid
Percent
]
1.00 17 4.8 30.4
2.00 3 .8 5.4
3.00 1 .3 1.8
12.00 1 .3 1.8
24.00 1 .3 1.8
60.00 1 .3 1.8
64.00 1 .3 1.8
91.00 1 .3 1.8
120.00 1 .3 1.8
136.00 1 .3 1.8
150.00 1 .3 1.8
180.00 2 .6 3.6
182.00 1 .3 1.8
205.00 1 .3 1.8
315.00 1 .3 1.8
340.00 1 .3 1.8
350.00 1 .3 1.8
360.00 4 1.1 7.1
365.00 15 4.2 26.8
730.00 1 .3 1.8
Total 56 15.7 100.0

149
43j. Additional time per year (in h) - corrected
Frequency
Percent Valid
Percent
]
12.00 1 .3 1.8
24.00 1 .3 1.8
60.00 1 .3 1.8
64.00 1 .3 1.8
91.00 1 .3 1.8
120.00 1 .3 1.8
136.00 1 .3 1.8
150.00 1 .3 1.8
180.00 2 .6 3.6
182.00 1 .3 1.8
205.00 1 .3 1.8
315.00 1 .3 1.8
340.00 1 .3 1.8
350.00 1 .3 1.8
360.00 4 1.1 7.1
365.00 32 9.0 57.1
730.00 4 1.1 7.1
1095.00 1 .3 1.8
Total 56 15.7 100.0
43k. Amount in KSH of all additional costs (exclusive of shares, fees and time)
Statistics
N Valid 21
N Missing 336
Mean 8588.0952
Median 5000.0000
Minimum 350.00
Maximum 39700.00
Sum 180350.00

150
43l. Amount in KSH of all additional costs (exclusive of shares, fees and time)
Frequency
Percent Valid
Percent
]
350.00 1 .3 4.8
600.00 1 .3 4.8
800.00 1 .3 4.8
1000.00 1 .3 4.8
1800.00 2 .6 9.5
2000.00 1 .3 4.8
2400.00 3 .8 14.3
5000.00 1 .3 4.8
5500.00 1 .3 4.8
6200.00 1 .3 4.8
6800.00 1 .3 4.8
13000.00 1 .3 4.8
14400.00 1 .3 4.8
15000.00 2 .6 9.5
20000.00 1 .3 4.8
24200.00 1 .3 4.8
39700.00 1 .3 4.8
Total 21 5.9 100.0
Q44
44a. Benefits or Disadvantages from joining the project
Frequency
Percent Valid
Percent
More benefits 114 31.9 89.1
More disadvantages 5 1.4 3.9
Evenly balanced 9 2.5 7.0
Total 128 35.9 100.0
44b. First main benefit accrued (grouped)
Frequency
Percent Valid
Percent
Access to AI 5 1.4 4.1
Access to loan 45 12.6 37.2
Transport of milk 6 1.7 5.0
Improved income 29 8.1 24.0
Good market for milk 4 1.1 3.3 Good market for other products
1 .3 .8
Improved animal health
2 .6 1.7
Reliable payment 19 5.3 15.7 Training/gain knowledge
5 1.4 4.1
Proximity to plant 3 .8 2.5
Other 2 .6 1.7
Total 121 33.9 100.0

151
44c. Second main benefit accrued (grouped)
Frequency
Percent Valid
Percent
Access to AI 4 1.1 14.3
Access to loan 7 2.0 25.0
Transport of milk 2 .6 7.1
Improved income 5 1.4 17.9
Good market for milk 1 .3 3.6 Good market for other products
1 .3 3.6
Reliable payment 2 .6 7.1 Training/gain knowledge
5 1.4 17.9
Other 1 .3 3.6
Total 28 7.8 100.0
44d. Main disadvantages experienced (1)
Frequency
Percent Valid
Percent
None 347 97.2 97.2
Delayed payments 1 .3 .3 Fluctuation in milk prices
1 .3 .3
Less pay than expected
2 .6 .6
Long distance from the farm
1 .3 .3
Milk rejection 2 .6 .6
More expensive 1 .3 .3
Sacco charges 1 .3 .3 Self transport of milk to chilling plant
1 .3 .3
Total 357 100.0 100.0
One other household mentions the Sacco charges as a disadvantage as well.
Q45
45a. Observed increase in income
Frequency
Percent Valid
Percent
Yes 82 23.0 75.9
No 26 7.3 24.1
Total 108 30.3 100.0
45b. First type of additional income / business
Frequency
Percent Valid
Percent
Healthier animals 12 3.4 15.2
Additional milk 65 18.2 82.3 Higher price per liter milk
1 .3 1.3
Selling clothes 1 .3 1.3
Total 79 22.1 100.0

152
45c. Additional income in KSH in last 12 months
Statistics
N Valid 75
N Missing 282
Mean 7243.0667
Median 3560.0000
Minimum 1000.00
Maximum 36000.00
Sum 543230.00
45d. Additional income in KSH in last 12 months
Frequency Percent
Valid Percent
Up to 1500 11 3.1 14.7 1501 to 2000 12 3.4 16.0 2001 to 3000 13 3.6 17.3 3001 to 4000 10 2.8 13.3 4001 to 8000 10 2.8 13.3 8001 to 12000 5 1.4 6.7 More than 12000 14 3.9 18.7 Total 75 21.0 100.0
45e. Additional income in KSH in last 12 months for type 1
45.2 First type of additional income / business Total Healthier
animals Additional milk
Higher price per litre milk
Selling clothes
N % N % N % N % N %
Up to 1500 4 33.3 7 11.5 0 .0 0 .0 11 14.7
1501 to 2000 1 8.3 11 18.0 0 .0 0 .0 12 16.0
2001 to 3000 2 16.7 11 18.0 0 .0 0 .0 13 17.3
3001 to 4000 2 16.7 8 13.1 0 .0 0 .0 10 13.3
4001 to 8000 0 .0 9 14.8 1 100.0 0 .0 10 13.3
8001 to 12000 2 16.7 3 4.9 0 .0 0 .0 5 6.7
More than 12000 1 8.3 12 19.7 0 .0 1 100.0 14 18.7
Total 12 100.0 61 100.0 1 100.0 1 100.0 75 100.0
Q46
46a. Who decided not to join the project?
Frequency
Percent Valid
Percent
Father 103 28.9 50.0
Mother 68 19.0 33.0
Father and Mother 20 5.6 9.7
No body 15 4.2 7.3
Total 206 57.7 100.0
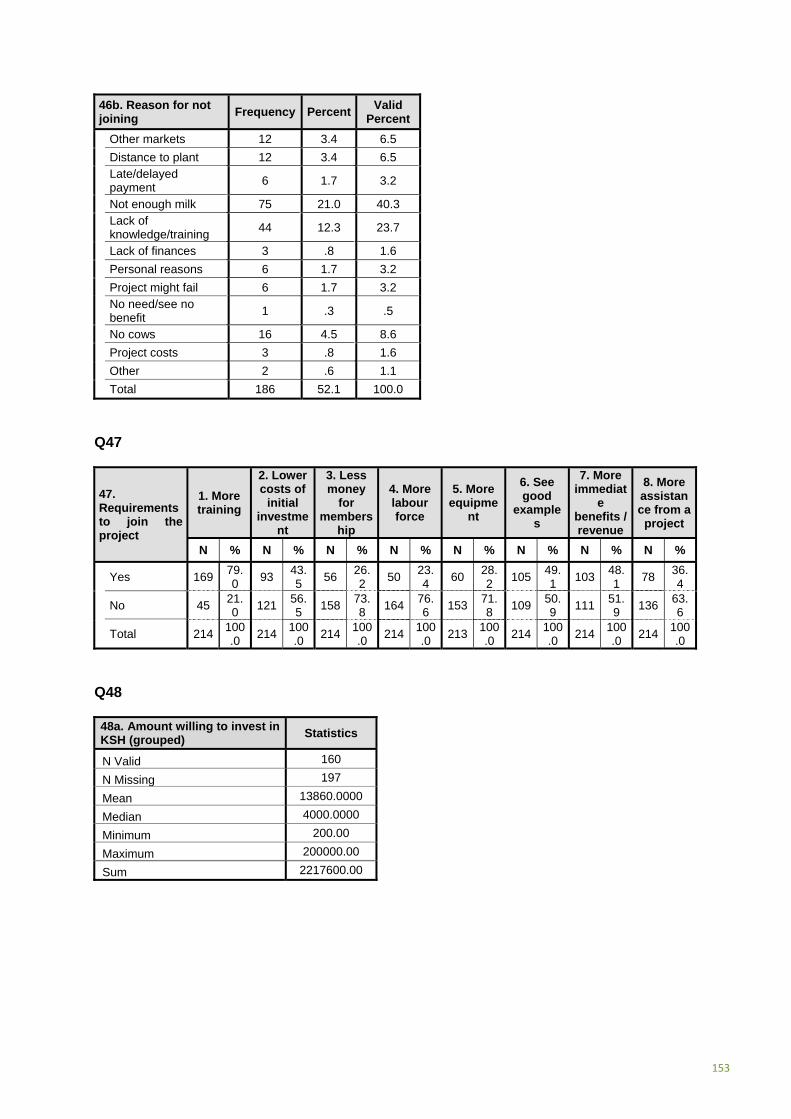
153
46b. Reason for not joining
Frequency PercentValid
Percent
Other markets 12 3.4 6.5
Distance to plant 12 3.4 6.5 Late/delayed payment
6 1.7 3.2
Not enough milk 75 21.0 40.3 Lack of knowledge/training
44 12.3 23.7
Lack of finances 3 .8 1.6
Personal reasons 6 1.7 3.2
Project might fail 6 1.7 3.2 No need/see no benefit
1 .3 .5
No cows 16 4.5 8.6
Project costs 3 .8 1.6
Other 2 .6 1.1
Total 186 52.1 100.0
Q47
47. Requirements to join the project
1. More training
2. Lower costs of
initial investme
nt
3. Less money
for members
hip
4. More labour force
5. More equipme
nt
6. See good
examples
7. More immediat
e benefits / revenue
8. More assistance from a project
N % N % N % N % N % N % N % N %
Yes 169 79.0
93 43.5
56 26.2
50 23.4
60 28.2
10549.1
103 48.1
78 36.4
No 45 21.0
121 56.5
15873.8
16476.6
15371.8
10950.9
111 51.9
13663.6
Total 214 100.0
214 100.0
214100.0
214100.0
213100.0
214100.0
214 100.0
214100.0
Q48
48a. Amount willing to invest in KSH (grouped)
Statistics
N Valid 160
N Missing 197
Mean 13860.0000
Median 4000.0000
Minimum 200.00
Maximum 200000.00
Sum 2217600.00

154
48b. Amount willing to invest in KSH (grouped)
Frequency PercentValid
Percent
Up to 1000 16 4.5 10.0
1001 to 1500 18 5.0 11.3
1501 to 2000 28 7.8 17.5
2001 to 4000 19 5.3 11.9
4001 to 6000 12 3.4 7.5
6001 to 8000 6 1.7 3.8
8001 to 16000 27 7.6 16.9
16000 to 32000 22 6.2 13.8
More than 32000 12 3.4 7.5
Total 160 44.8 100.0
Q49
49a. Knowledge about the term 'Climate Change'
Frequency PercentValid
Percent
Yes 308 86.3 87.5
No 44 12.3 12.5
Total 352 98.6 100.0
49b. First explanation of 'Climate Change' (grouped)
Frequency PercentValid
Percent
Changes in weather 139 38.9 45.3
Colder temperature 7 2.0 2.3
Changes of seasons 6 1.7 2.0 Alterations in one season
10 2.8 3.3
Unpredictable weather
4 1.1 1.3
Change in rain patterns
21 5.9 6.8
Prolonged rainfall 6 1.7 2.0 Unpredictable/erratic rainfall
52 14.6 16.9
Increased rainfall 34 9.5 11.1 Prolonged dry season
21 5.9 6.8
Less rain 2 .6 .7
Changes in planting 2 .6 .7
Global warming 1 .3 .3 Warmer temperatures
1 .3 .3
Other 1 .3 .3
Total 307 86.0 100.0

155
49c. Second explanation of 'Climate Change' (grouped)
Frequency Percent Valid
Percent
Colder temperature 1 .3 5.3
Changes of seasons 1 .3 5.3
Change in rain patterns 2 .6 10.5
Prolonged rainfall 2 .6 10.5
Unpredictable/erratic rainfall 1 .3 5.3
Increased rainfall 4 1.1 21.1
Prolonged dry season 6 1.7 31.6
Global warming 1 .3 5.3
Warmer temperatures 1 .3 5.3
Total 19 5.3 100.0
49d. All explanations of 'Climate Change' (grouped)
Frequency Percent
Changes in weather 139 42.6
Colder temperature 8 2.5
Changes of seasons 7 2.1 Alterations in one season
10 3.1
Unpredictable weather
4 1.2
Change in rain patterns
23 7.1
Prolonged rainfall 8 2.5 Unpredictable/erratic rainfall
53 16.3
Increased rainfall 38 11.7 Prolonged dry season
27 8.3
Less rain 2 .6
Changes in planting 2 .6
Global warming 2 .6 Warmer temperatures
2 .6
Other 1 .3
Total 307 94.2
49e. First possible meaning of 'Climate Change'
Frequency PercentValid
Percent
Change in weather 7 2.0 38.9
Increased rainfall 4 1.1 22.2 Increase and decrease in rainfall
2 .6 11.1
Unpredictable rain 2 .6 11.1 Alterations in one season
1 .3 5.6
More sunny days 1 .3 5.6
Decrease in rainfall 1 .3 5.6
Total 18 5.0 100.0
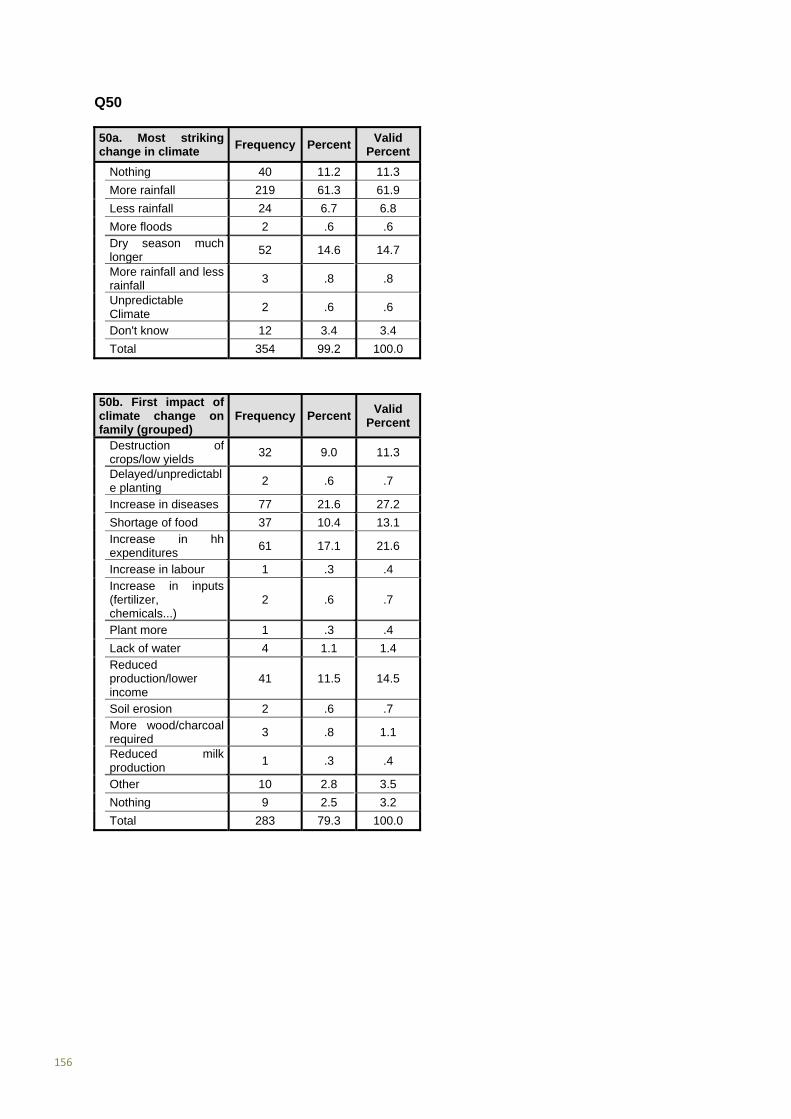
156
Q50
50a. Most striking change in climate
Frequency PercentValid
Percent
Nothing 40 11.2 11.3
More rainfall 219 61.3 61.9
Less rainfall 24 6.7 6.8
More floods 2 .6 .6 Dry season much longer
52 14.6 14.7
More rainfall and less rainfall
3 .8 .8
Unpredictable Climate
2 .6 .6
Don't know 12 3.4 3.4
Total 354 99.2 100.0
50b. First impact of climate change on family (grouped)
Frequency PercentValid
Percent
Destruction of crops/low yields
32 9.0 11.3
Delayed/unpredictable planting
2 .6 .7
Increase in diseases 77 21.6 27.2
Shortage of food 37 10.4 13.1 Increase in hh expenditures
61 17.1 21.6
Increase in labour 1 .3 .4 Increase in inputs (fertilizer, chemicals...)
2 .6 .7
Plant more 1 .3 .4
Lack of water 4 1.1 1.4 Reduced production/lower income
41 11.5 14.5
Soil erosion 2 .6 .7 More wood/charcoal required
3 .8 1.1
Reduced milk production
1 .3 .4
Other 10 2.8 3.5
Nothing 9 2.5 3.2
Total 283 79.3 100.0
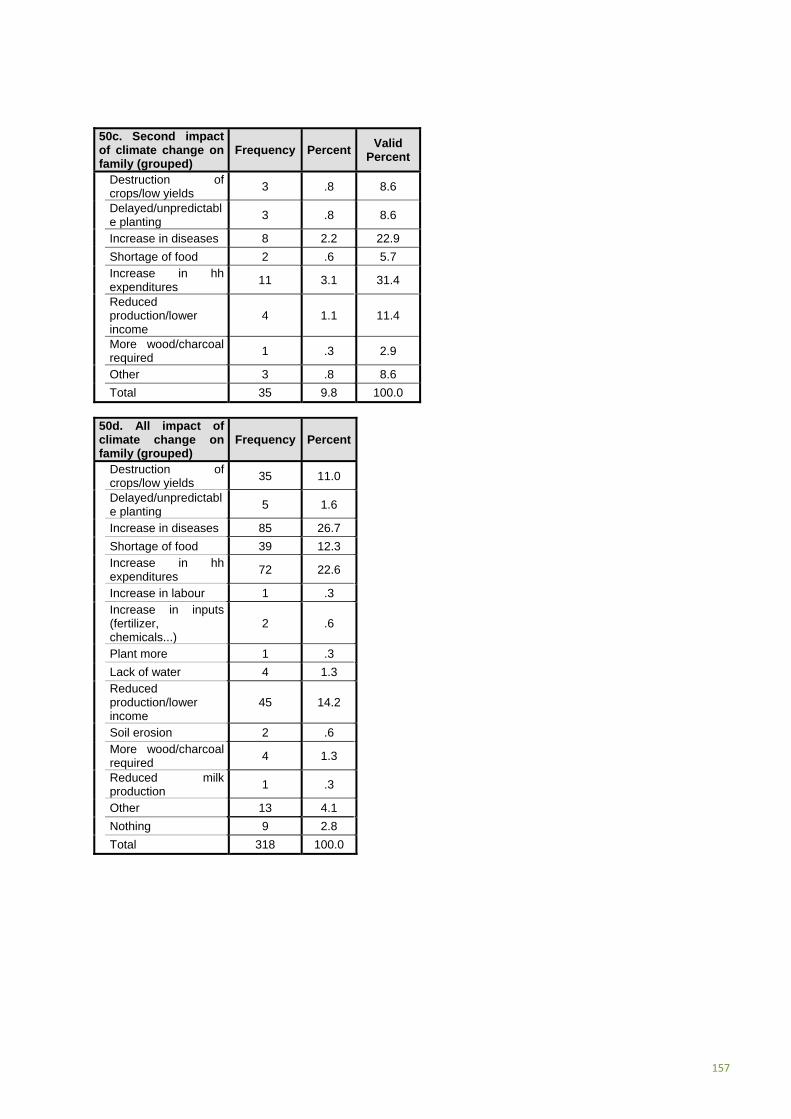
157
50c. Second impact of climate change on family (grouped)
Frequency PercentValid
Percent
Destruction of crops/low yields
3 .8 8.6
Delayed/unpredictable planting
3 .8 8.6
Increase in diseases 8 2.2 22.9
Shortage of food 2 .6 5.7 Increase in hh expenditures
11 3.1 31.4
Reduced production/lower income
4 1.1 11.4
More wood/charcoal required
1 .3 2.9
Other 3 .8 8.6
Total 35 9.8 100.0
50d. All impact of climate change on family (grouped)
Frequency Percent
Destruction of crops/low yields
35 11.0
Delayed/unpredictable planting
5 1.6
Increase in diseases 85 26.7
Shortage of food 39 12.3 Increase in hh expenditures
72 22.6
Increase in labour 1 .3 Increase in inputs (fertilizer, chemicals...)
2 .6
Plant more 1 .3
Lack of water 4 1.3 Reduced production/lower income
45 14.2
Soil erosion 2 .6 More wood/charcoal required
4 1.3
Reduced milk production
1 .3
Other 13 4.1
Nothing 9 2.8
Total 318 100.0

158
50e1. First impact of climate change on family (grouped)
PROJECT PARTICIPANTS
NON-PARTICIPANTS
Frequency Valid
PercentFrequency
Valid Percent
Destruction of crops/low yields
8 7.2 24 14.0
Delayed/unpredictable planting
1 .9 1 .6
Increase in diseases 35 31.5 42 24.4
Shortage of food 12 10.8 25 14.5 Increase in hh expenditures
26 23.4 35 20.3
Increase in inputs (fertilizer, chemicals...)
1 .9 1 .6
Lack of water 2 1.8 1 .6 Reduced production/lower income
16 14.4 1 .6
Soil erosion 2 1.8 2 1.2 Reduced milk production
1 .9 25 14.5
More wood/charcoal required
3 1.7
Other 2 1.8 8 4.7
Nothing 5 4.5 4 2.3
Total 111 100.0 172 100.0
50e2. Second impact of climate change on family (grouped)
PROJECT PARTICIPANTS
NON-PARTICIPANTS
Frequency Valid
PercentFrequency
Valid Percent
Destruction of crops/low yields
3 13.6
Delayed/unpredictable planting
1 7.7 2 9.1
Increase in diseases 2 15.4 6 27.3
Shortage of food 1 7.7 1 4.5 Increase in hh expenditures
4 30.8 7 31.8
Reduced production/lower income
3 23.1 1 4.5
More wood/charcoal required
1 4.5
Other 2 15.4 1 4.5
Total 13 100.0 22 100.0

159
50f1. First impact of climate change on family (grouped)
WOMEN HEADED HOUSEHOLD
Frequency PercentValid
Percent
Destruction of crops/low yields
5 8.5 11.1
Increase in diseases 13 22.0 28.9
Shortage of food 3 5.1 6.7 Increase in hh expenditures
11 18.6 24.4
Increase in labour 1 1.7 2.2 Reduced production/lower income
9 15.3 20.0
Soil erosion 1 1.7 2.2
Nothing 2 3.4 4.4
Total 45 76.3 100.0
50f2. Second impact of climate change on family (grouped)
WOMEN HEADED HOUSEHOLD
Frequency PercentValid
Percent
Reduced production/lower income
1 1.7 33.3
Other 2 3.4 66.7
Total 3 5.1 100.0
50g. First impact of climate change on livestock/agriculture (grouped)
Frequency PercentValid
Percent
Livestock diseases 8 2.2 2.7
Diseases 10 2.8 3.4
Death of livestock 50 14.0 17.0
Destruction of crops 30 8.4 10.2 Reduced production/yield
93 26.1 31.6
Increased production/yield
9 2.5 3.1
Destruction of structures
1 .3 .3
Decreased milk production
40 11.2 13.6
Improved milk production
7 2.0 2.4
Lack of water 5 1.4 1.7 Lack of / expensive implements
2 .6 .7
Erosion 17 4.8 5.8
More feed 4 1.1 1.4
Less feed 5 1.4 1.7
Other 2 .6 .7
No changes 11 3.1 3.7
Total 294 82.4 100.0
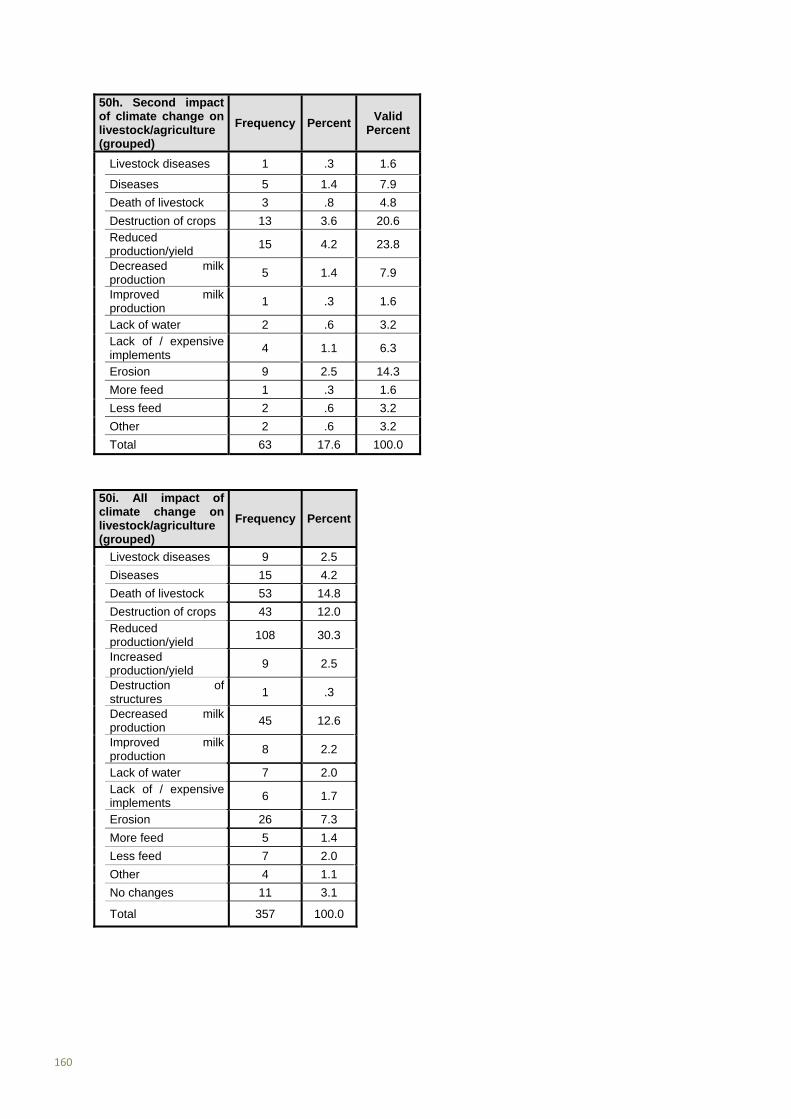
160
50h. Second impact of climate change on livestock/agriculture (grouped)
Frequency PercentValid
Percent
Livestock diseases 1 .3 1.6
Diseases 5 1.4 7.9
Death of livestock 3 .8 4.8
Destruction of crops 13 3.6 20.6 Reduced production/yield
15 4.2 23.8
Decreased milk production
5 1.4 7.9
Improved milk production
1 .3 1.6
Lack of water 2 .6 3.2 Lack of / expensive implements
4 1.1 6.3
Erosion 9 2.5 14.3
More feed 1 .3 1.6
Less feed 2 .6 3.2
Other 2 .6 3.2
Total 63 17.6 100.0
50i. All impact of climate change on livestock/agriculture (grouped)
Frequency Percent
Livestock diseases 9 2.5
Diseases 15 4.2
Death of livestock 53 14.8
Destruction of crops 43 12.0 Reduced production/yield
108 30.3
Increased production/yield
9 2.5
Destruction of structures
1 .3
Decreased milk production
45 12.6
Improved milk production
8 2.2
Lack of water 7 2.0 Lack of / expensive implements
6 1.7
Erosion 26 7.3
More feed 5 1.4
Less feed 7 2.0
Other 4 1.1
No changes 11 3.1
Total 357 100.0
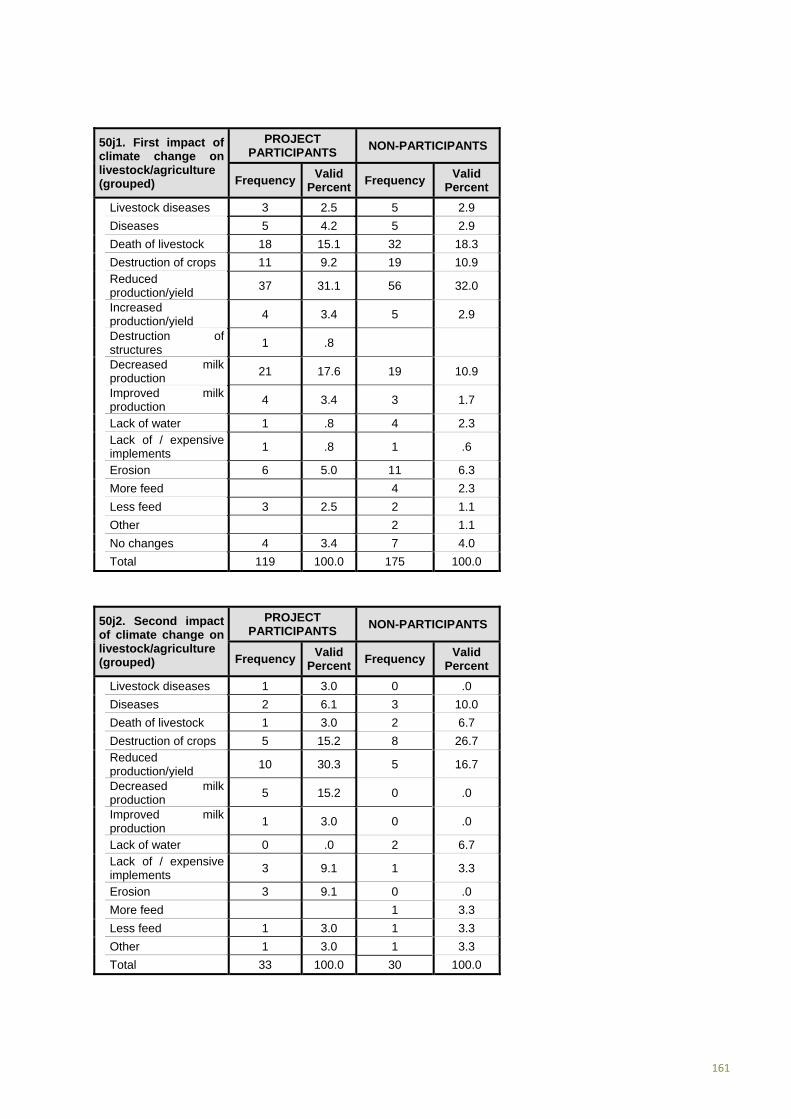
161
50j1. First impact of climate change on livestock/agriculture (grouped)
PROJECT PARTICIPANTS
NON-PARTICIPANTS
Frequency Valid
PercentFrequency
Valid Percent
Livestock diseases 3 2.5 5 2.9
Diseases 5 4.2 5 2.9
Death of livestock 18 15.1 32 18.3
Destruction of crops 11 9.2 19 10.9 Reduced production/yield
37 31.1 56 32.0
Increased production/yield
4 3.4 5 2.9
Destruction of structures
1 .8
Decreased milk production
21 17.6 19 10.9
Improved milk production
4 3.4 3 1.7
Lack of water 1 .8 4 2.3 Lack of / expensive implements
1 .8 1 .6
Erosion 6 5.0 11 6.3
More feed 4 2.3
Less feed 3 2.5 2 1.1
Other 2 1.1
No changes 4 3.4 7 4.0
Total 119 100.0 175 100.0
50j2. Second impact of climate change on livestock/agriculture (grouped)
PROJECT PARTICIPANTS
NON-PARTICIPANTS
Frequency Valid
PercentFrequency
Valid Percent
Livestock diseases 1 3.0 0 .0
Diseases 2 6.1 3 10.0
Death of livestock 1 3.0 2 6.7
Destruction of crops 5 15.2 8 26.7 Reduced production/yield
10 30.3 5 16.7
Decreased milk production
5 15.2 0 .0
Improved milk production
1 3.0 0 .0
Lack of water 0 .0 2 6.7 Lack of / expensive implements
3 9.1 1 3.3
Erosion 3 9.1 0 .0
More feed 1 3.3
Less feed 1 3.0 1 3.3
Other 1 3.0 1 3.3
Total 33 100.0 30 100.0
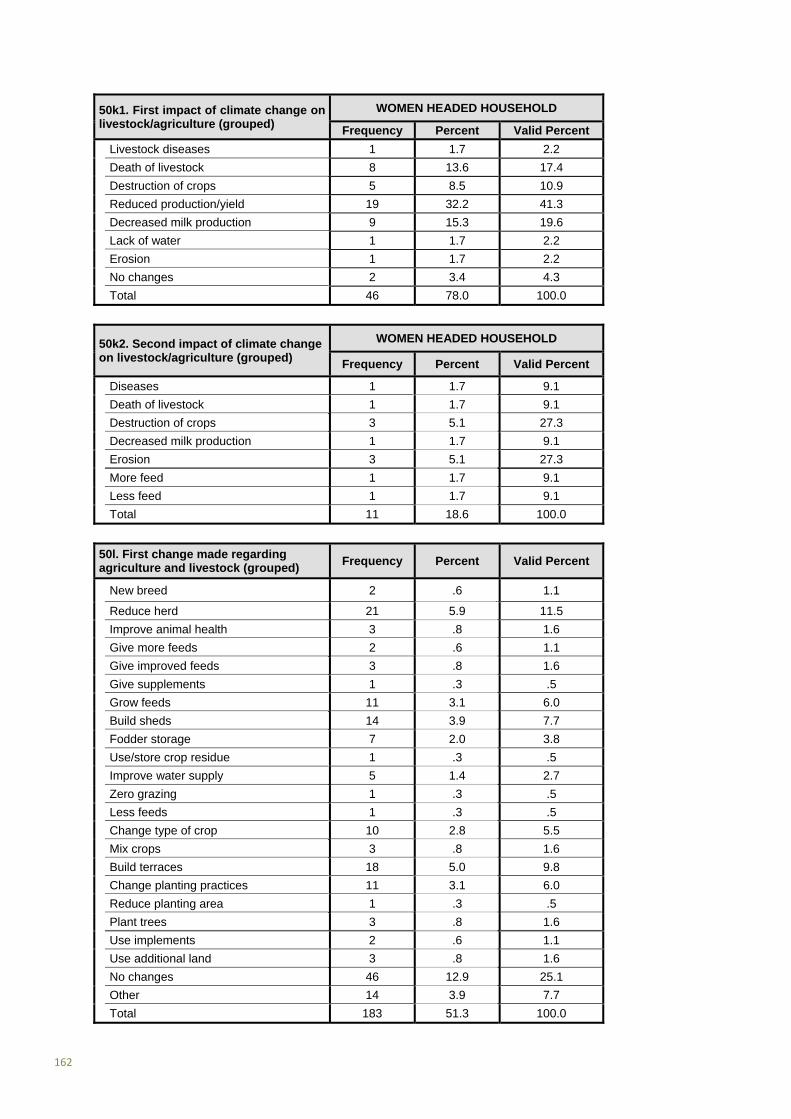
162
50k1. First impact of climate change on livestock/agriculture (grouped)
WOMEN HEADED HOUSEHOLD
Frequency Percent Valid Percent
Livestock diseases 1 1.7 2.2
Death of livestock 8 13.6 17.4
Destruction of crops 5 8.5 10.9
Reduced production/yield 19 32.2 41.3
Decreased milk production 9 15.3 19.6
Lack of water 1 1.7 2.2
Erosion 1 1.7 2.2
No changes 2 3.4 4.3
Total 46 78.0 100.0
50k2. Second impact of climate change on livestock/agriculture (grouped)
WOMEN HEADED HOUSEHOLD
Frequency Percent Valid Percent
Diseases 1 1.7 9.1
Death of livestock 1 1.7 9.1
Destruction of crops 3 5.1 27.3
Decreased milk production 1 1.7 9.1
Erosion 3 5.1 27.3
More feed 1 1.7 9.1
Less feed 1 1.7 9.1
Total 11 18.6 100.0
50l. First change made regarding agriculture and livestock (grouped)
Frequency Percent Valid Percent
New breed 2 .6 1.1
Reduce herd 21 5.9 11.5
Improve animal health 3 .8 1.6
Give more feeds 2 .6 1.1
Give improved feeds 3 .8 1.6
Give supplements 1 .3 .5
Grow feeds 11 3.1 6.0
Build sheds 14 3.9 7.7
Fodder storage 7 2.0 3.8
Use/store crop residue 1 .3 .5
Improve water supply 5 1.4 2.7
Zero grazing 1 .3 .5
Less feeds 1 .3 .5
Change type of crop 10 2.8 5.5
Mix crops 3 .8 1.6
Build terraces 18 5.0 9.8
Change planting practices 11 3.1 6.0
Reduce planting area 1 .3 .5
Plant trees 3 .8 1.6
Use implements 2 .6 1.1
Use additional land 3 .8 1.6
No changes 46 12.9 25.1
Other 14 3.9 7.7
Total 183 51.3 100.0

163
50m. Second change made regarding agriculture and livestock (grouped)
Frequency PercentValid
Percent
Give more feeds 1 .3 4.2
Fodder storage 2 .6 8.3
Change type of crop 7 2.0 29.2
Mix crops 1 .3 4.2
Build terraces 4 1.1 16.7 Change planting practices
3 .8 12.5
Reduce planting area 1 .3 4.2
Use implements 4 1.1 16.7
Other 1 .3 4.2
Total 24 6.7 100.0
50n. All changes made regarding agriculture and livestock (grouped)
Frequency Percent
New breed 2 1.0
Reduce herd 21 10.1 Improve animal health
3 1.4
Give more feeds 3 1.4
Give improved feeds 3 1.4
Give supplements 1 .5
Grow feeds 11 5.3
Build sheds 14 6.8
Fodder storage 9 4.3 Use/store crop residue
1 .5
Improve water supply 5 2.4
Zero grazing 1 .5
Less feeds 1 .5
Change type of crop 17 8.2
Mix crops 4 1.9
Build terraces 22 10.6 Change planting practices
14 6.8
Reduce planting area 2 1.0
Plant trees 3 1.4
Use implements 6 2.9
Use additional land 3 1.4
No changes 46 22.2
Other 15 7.2
Total 207 100.0
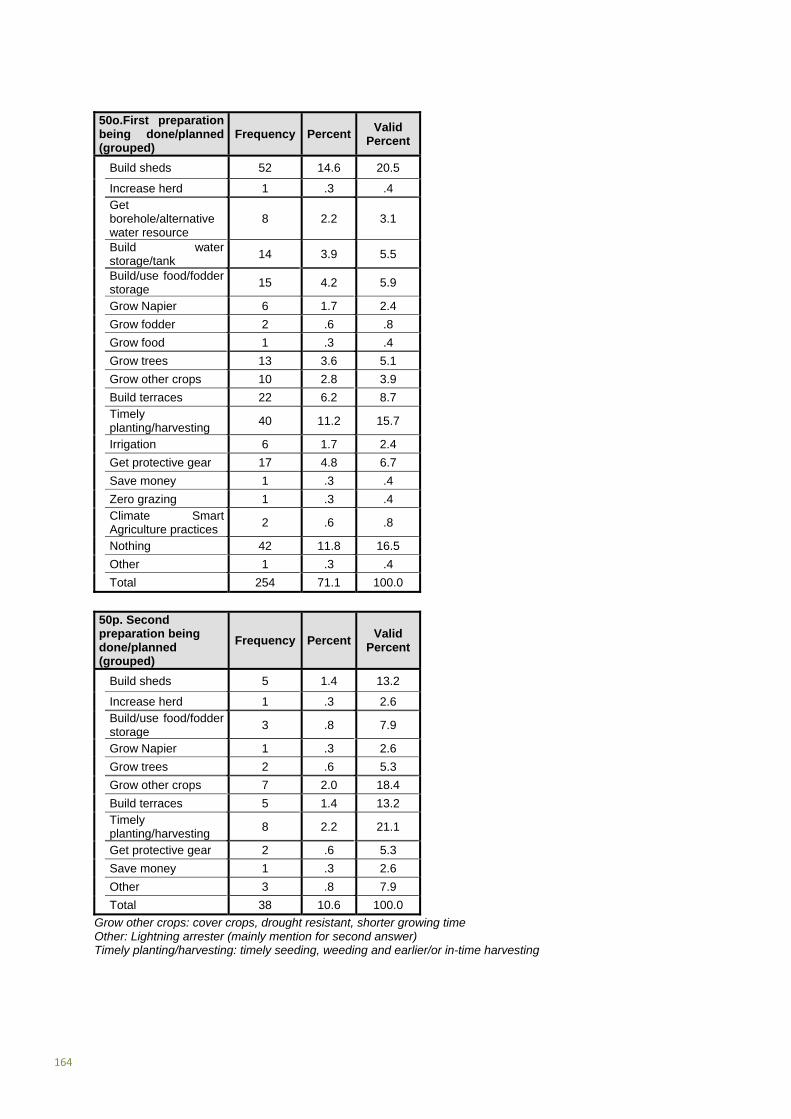
164
50o.First preparation being done/planned (grouped)
Frequency PercentValid
Percent
Build sheds 52 14.6 20.5
Increase herd 1 .3 .4 Get borehole/alternative water resource
8 2.2 3.1
Build water storage/tank
14 3.9 5.5
Build/use food/fodder storage
15 4.2 5.9
Grow Napier 6 1.7 2.4
Grow fodder 2 .6 .8
Grow food 1 .3 .4
Grow trees 13 3.6 5.1
Grow other crops 10 2.8 3.9
Build terraces 22 6.2 8.7 Timely planting/harvesting
40 11.2 15.7
Irrigation 6 1.7 2.4
Get protective gear 17 4.8 6.7
Save money 1 .3 .4
Zero grazing 1 .3 .4 Climate Smart Agriculture practices
2 .6 .8
Nothing 42 11.8 16.5
Other 1 .3 .4
Total 254 71.1 100.0
50p. Second preparation being done/planned (grouped)
Frequency PercentValid
Percent
Build sheds 5 1.4 13.2
Increase herd 1 .3 2.6 Build/use food/fodder storage
3 .8 7.9
Grow Napier 1 .3 2.6
Grow trees 2 .6 5.3
Grow other crops 7 2.0 18.4
Build terraces 5 1.4 13.2 Timely planting/harvesting
8 2.2 21.1
Get protective gear 2 .6 5.3
Save money 1 .3 2.6
Other 3 .8 7.9
Total 38 10.6 100.0
Grow other crops: cover crops, drought resistant, shorter growing time Other: Lightning arrester (mainly mention for second answer) Timely planting/harvesting: timely seeding, weeding and earlier/or in-time harvesting

165
50q. All preparations being done/planned (grouped)
Frequency Percent
Build sheds 57 19.5
Increase herd 2 .7
Get borehole 8 2.7 Build water storage/tank
14 4.8
Build/use food/fodder storage
18 6.2
Grow Napier 7 2.4
Grow fodder 2 .7
Grow food 1 .3
Grow trees 15 5.1
Grow other crops 17 5.8
Build terraces 27 9.2 Timely planting/harvesting
48 16.4
Irrigation 6 2.1
Get protective gear 19 6.5
Save money 2 .7
Zero grazing 1 .3 Climate Smart Agriculture practices
2 .7
Nothing 42 14.4
Other 4 1.4
Total 292 100.0
Q51
51a. First source of revenue for first economically active hh member
Frequency PercentValid
Percent
Gov employment 35 9.8 9.9
Private employment 17 4.8 4.8 Paid labour in private agriculture
2 .6 .6
Occasional jobs 1 .3 .3
Own agriculture 272 76.2 77.1 Own livestock breeding, animal products
7 2.0 2.0
Self employed 7 2.0 2.0
Pensioner 12 3.4 3.4
Total 353 98.9 100.0
4 households either have no source of income or refused to answer!
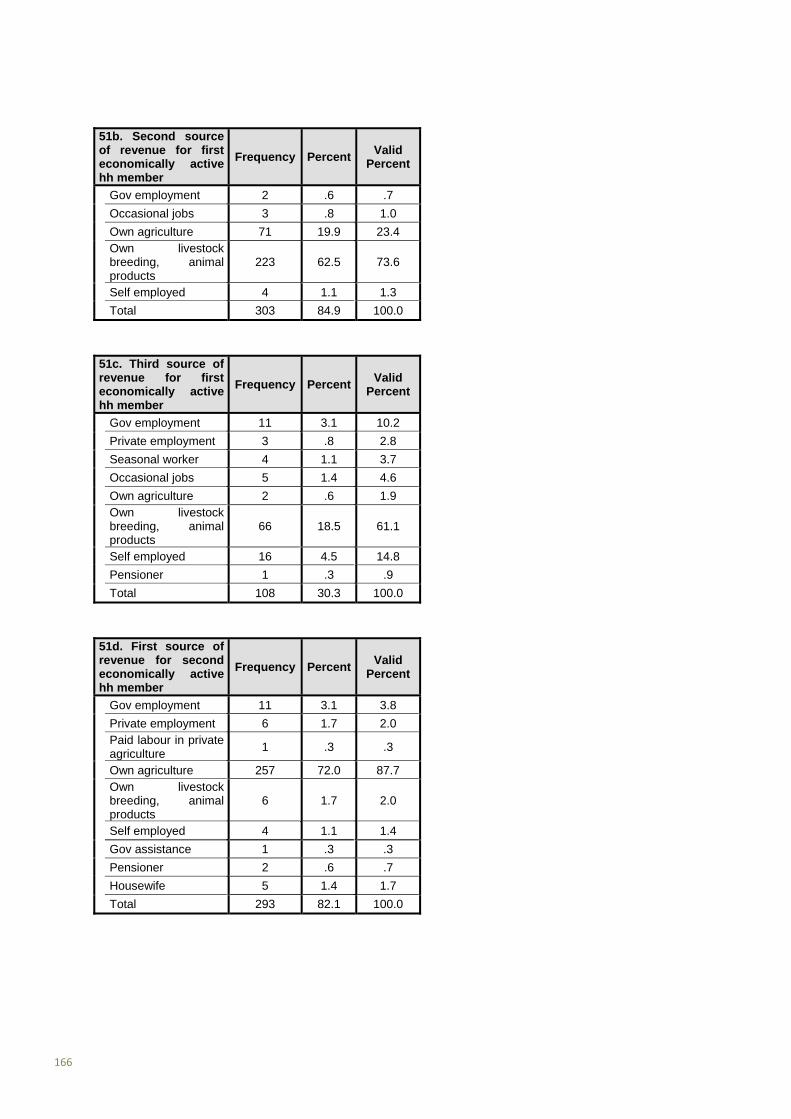
166
51b. Second source of revenue for first economically active hh member
Frequency PercentValid
Percent
Gov employment 2 .6 .7
Occasional jobs 3 .8 1.0
Own agriculture 71 19.9 23.4 Own livestock breeding, animal products
223 62.5 73.6
Self employed 4 1.1 1.3
Total 303 84.9 100.0
51c. Third source of revenue for first economically active hh member
Frequency PercentValid
Percent
Gov employment 11 3.1 10.2
Private employment 3 .8 2.8
Seasonal worker 4 1.1 3.7
Occasional jobs 5 1.4 4.6
Own agriculture 2 .6 1.9 Own livestock breeding, animal products
66 18.5 61.1
Self employed 16 4.5 14.8
Pensioner 1 .3 .9
Total 108 30.3 100.0
51d. First source of revenue for second economically active hh member
Frequency PercentValid
Percent
Gov employment 11 3.1 3.8
Private employment 6 1.7 2.0 Paid labour in private agriculture
1 .3 .3
Own agriculture 257 72.0 87.7 Own livestock breeding, animal products
6 1.7 2.0
Self employed 4 1.1 1.4
Gov assistance 1 .3 .3
Pensioner 2 .6 .7
Housewife 5 1.4 1.7
Total 293 82.1 100.0
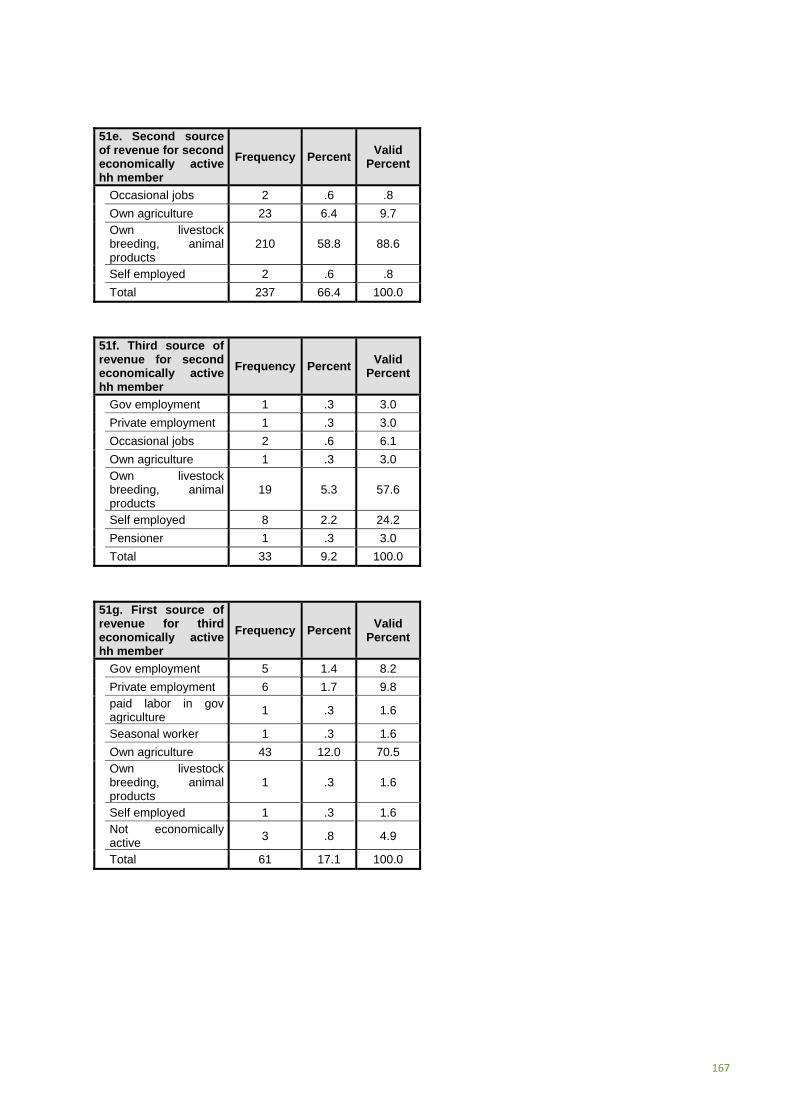
167
51e. Second source of revenue for second economically active hh member
Frequency PercentValid
Percent
Occasional jobs 2 .6 .8
Own agriculture 23 6.4 9.7 Own livestock breeding, animal products
210 58.8 88.6
Self employed 2 .6 .8
Total 237 66.4 100.0
51f. Third source of revenue for second economically active hh member
Frequency PercentValid
Percent
Gov employment 1 .3 3.0
Private employment 1 .3 3.0
Occasional jobs 2 .6 6.1
Own agriculture 1 .3 3.0 Own livestock breeding, animal products
19 5.3 57.6
Self employed 8 2.2 24.2
Pensioner 1 .3 3.0
Total 33 9.2 100.0
51g. First source of revenue for third economically active hh member
Frequency PercentValid
Percent
Gov employment 5 1.4 8.2
Private employment 6 1.7 9.8 paid labor in gov agriculture
1 .3 1.6
Seasonal worker 1 .3 1.6
Own agriculture 43 12.0 70.5 Own livestock breeding, animal products
1 .3 1.6
Self employed 1 .3 1.6 Not economically active
3 .8 4.9
Total 61 17.1 100.0

168
51h. Second source of revenue for third economically active hh member
Frequency PercentValid
Percent
Own agriculture 3 .8 7.1 Own livestock breeding, animal products
39 10.9 92.9
Total 42 11.8 100.0
51i. Third source of revenue for third economically active hh member
Frequency PercentValid
Percent
Occasional jobs 1 .3 16.7 Own livestock breeding, animal products
2 .6 33.3
Self employed 3 .8 50.0
Total 6 1.7 100.0
51j. First source of revenue for forth economically active hh member
Frequency PercentValid
Percent
Gov employment 2 .6 8.7
Private employment 3 .8 13.0
Own agriculture 17 4.8 73.9 Not economically active
1 .3 4.3
Total 23 6.4 100.0
51k. Second source of revenue for forth economically active hh member
Frequency PercentValid
Percent
Own livestock breeding, animal products
14 3.9 87.5
Self employed 2 .6 12.5
Total 16 4.5 100.0
51l. Third source of revenue for forth economically active hh member
Frequency PercentValid
Percent
Self employed 2 .6 100.0
Total 2 .6 100.0

169
51m. First source of revenue for fifth economically active hh member
Frequency PercentValid
Percent
Paid labour in private agriculture
1 .3 10.0
Own agriculture 8 2.2 80.0 Own livestock breeding, animal products
1 .3 10.0
Total 10 2.8 100.0
51n. Second source of revenue for fifth economically active hh member
Frequency PercentValid
Percent
Own livestock breeding, animal products
7 2.0 87.5
Self employed 1 .3 12.5
Total 8 2.2 100.0
51o. Third source of revenue for fifth economically active hh member
Frequency PercentValid
Percent
Self employed 1 .3 100.0
Total 1 .3 100.0
51p. All sources of revenue from all hh members
Frequency Percent
Gov employment 67 4.5
Private employment 36 2.4 paid labor in gov agriculture
1 .1
Paid labour in private agriculture
4 .3
Seasonal worker 5 .3
Occasional jobs 14 .9
Own agriculture 697 46.6 Own livestock breeding, animal products
595 39.8
Self employed 51 3.4
Gov assistance 1 .1
Pensioner 16 1.1
Housewife 5 .3 Not economically active
4 .3
Total 1496 100.0

170
51q. All household income for all hh members in KSH
Statistics
Valid 345 Missing 12 Mean 343373.9246 Median 115800.0000 Minimum 1500.00 Maximum 20062200.00 Sum 118464004.00
51r. All household income for all hh members in KSH
Frequency PercentValid
Percent
Up to 25000 46 12.9 13.3
25001 to 50000 38 10.6 11.0
50001 to 100000 63 17.6 18.3
100001 to 200000 92 25.8 26.7
200001 to 400000 61 17.1 17.7
400001 to 600000 17 4.8 4.9
More than 600000 28 7.8 8.1
Total 345 96.6 100.0
51s. All household income divided by hh members in KSH (grouped)
Statistics
Valid 345 Missing 12 Mean 104502.3590 Median 25100.0000 Minimum 300.00 Maximum 10031100.00 Sum 36053313.85
51t.All household income divided by hh members in KSH (grouped)
Frequency PercentValid
Percent
Up to 5000 44 12.3 12.8
5001 to 10000 36 10.1 10.4
10001 to 20000 67 18.8 19.4
20001 to 30000 48 13.4 13.9
30001 to 40000 34 9.5 9.9
40001 to 50000 26 7.3 7.5
50001 to 100000 50 14.0 14.5
100001 to 200000 17 4.8 4.9
More than 200000 23 6.4 6.7
Total 345 96.6 100.0

171
51u. All sources of revenue from all hh members
All household income for all hh members in KSH (grouped)
Total Up to 25000
25001 to 50000
50001 to 100000
100001 to
200000
200001 to
400000
400001 to 600000
More than
60000
N % N % N % N % N % N % N % N %
Gov employment 0 0 3 1.9 7 2.8 13 3.4 23 8.2 8 8.9 10 7.2 64 4.4
Private employment
0 0 3 1.9 4 1.6 9 2.3 8 2.9 4 4.4 5 3.6 33 2.3
paid labor in gov agriculture
0 0 0 0 0 0 0 0 0 0 1 1.1 0 0 1 0.1
Paid labour in private agriculture
0 0 0 0 0 0 3 0.8 1 0.4 0 0 0 0 4 0.3
Seasonal worker 1 0.7 4 2.5 0 0 0 0 0 0 0 0 0 0 5 0.3
Occasional jobs 2 1.5 2 1.3 2 0.8 7 1.8 1 0.4 0 0 0 0 14 1
Own agriculture 84 61.3
71 44.7
121 48 17645.5
12243.7
34 37.8 56 40.6
664 46.1
Own livestock breeding, animal products
44 32.1
66 41.5
10240.5
16542.6
11440.9
36 40 54 39.1
581 40.3
Self employed 6 4.4 9 5.7 16 6.3 10 2.6 5 1.8 4 4.4 1 0.7 51 3.5
Gov assistance 0 0 0 0 0 0 0 0 1 0.4 0 0 0 0 1 0.1
Pensioner 0 0 0 0 0 0 2 0.5 2 0.7 3 3.3 9 6.5 16 1.1
Housewife 0 0 0 0 0 0 1 0.3 2 0.7 0 0 2 1.4 5 0.3
Not economically active
0 0 1 0.6 0 0 1 0.3 0 0 0 0 1 0.7 3 0.2
Total 137 100 159 100.1
252 100 387100.1
279100.1
90 99.9138
99.8
1442
100
Q52
52a. Main bread winner
Frequency PercentValid
Percent
Man 265 74.2 86.6
Woman 41 11.5 13.4
Total 306 85.7 100.0
52b. Second main bread winner
Frequency PercentValid
Percent
Man 4 1.1 2.8
Woman 139 38.9 97.2
Total 143 40.1 100.0
52c. Third main bread winner
Frequency PercentValid
Percent
Man 1 .3 33.3
Woman 2 .6 66.7
Total 3 .8 100.0
The third bread winner was most often a daughter or a son from an elderly couple.
Note: Due to a numbering mistake in the questionnaire, there is no question nr. 53.

172
Q54
54a. Additional sources of income
Frequency PercentValid
Percent
Yes 76 21.3 21.5
No 277 77.6 78.5
Total 353 98.9 100.0
54b. First type of additional (external) sources of income
Frequency PercentValid
Percent
Transfer from relatives abroad
5 1.4 6.7
Transfer from relatives in Kenya
27 7.6 36.0
Saving clubs/microfinance
19 5.3 25.3
Credit from bank/friend/project
21 5.9 28.0
Food and animals 1 .3 1.3
Cattle selling 2 .6 2.7
Total 75 21.0 100.0
54c. Second type of additional (external) sources of income
Frequency PercentValid
Percent
Transfer from relatives in Kenya
1 .3 14.3
Gifts 1 .3 14.3 Saving clubs/microfinance
2 .6 28.6
Credit from bank/friend/project
3 .8 42.9
Total 7 2.0 100.0
54d. Third type of additional (external) sources of income
Frequency PercentValid
Percent
Gifts 1 .3 100.0
System 356 99.7 100.0
54e. Amount of all annual additional external income in KSH
Statistics
Valid 357 Missing 0 Mean 8131.0924 Median .0000 Minimum .00 Maximum 300000.00 Sum 2902800.00
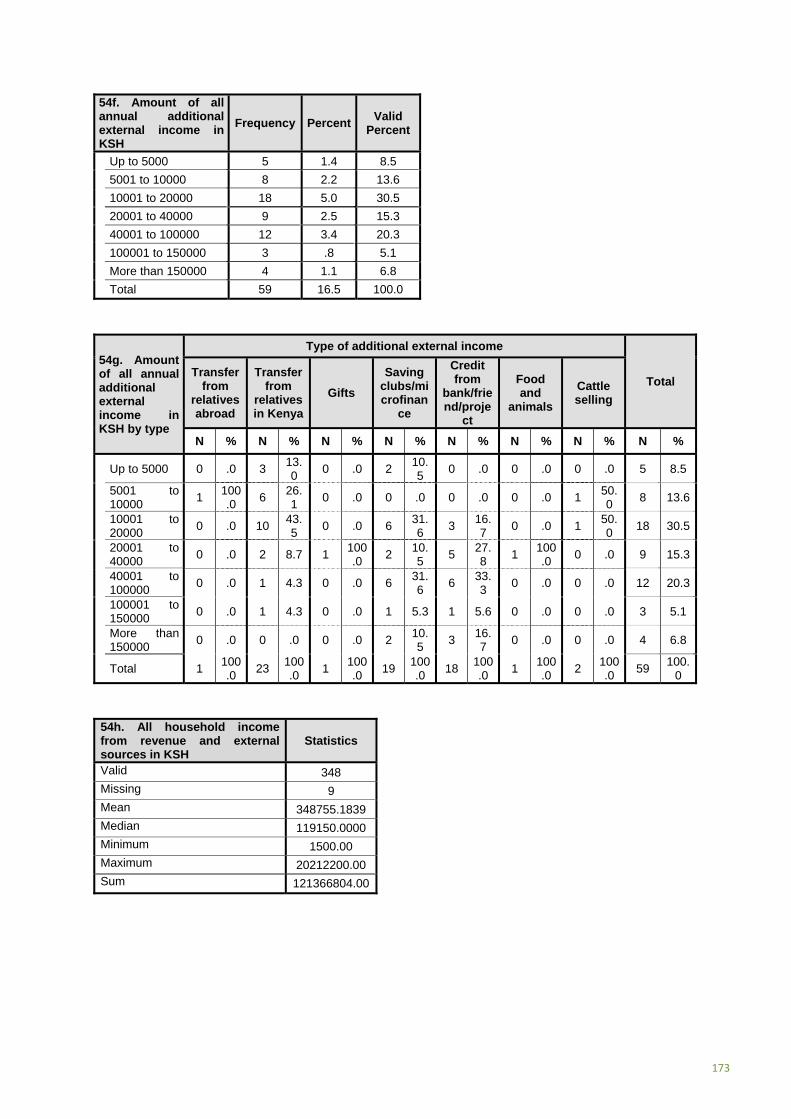
173
54f. Amount of all annual additional external income in KSH
Frequency PercentValid
Percent
Up to 5000 5 1.4 8.5
5001 to 10000 8 2.2 13.6
10001 to 20000 18 5.0 30.5
20001 to 40000 9 2.5 15.3
40001 to 100000 12 3.4 20.3
100001 to 150000 3 .8 5.1
More than 150000 4 1.1 6.8
Total 59 16.5 100.0
54g. Amount of all annual additional external income in KSH by type
Type of additional external income
Total Transfer
from relatives abroad
Transfer from
relatives in Kenya
Gifts
Saving clubs/microfinan
ce
Credit from
bank/friend/proje
ct
Food and
animals
Cattle selling
N % N % N % N % N % N % N % N %
Up to 5000 0 .0 3 13.0
0 .0 2 10.5
0 .0 0 .0 0 .0 5 8.5
5001 to 10000
1 100.0
6 26.1
0 .0 0 .0 0 .0 0 .0 1 50.0
8 13.6
10001 to 20000
0 .0 10 43.5
0 .0 6 31.6
3 16.7
0 .0 1 50.0
18 30.5
20001 to 40000
0 .0 2 8.7 1 100.0
2 10.5
5 27.8
1 100.0
0 .0 9 15.3
40001 to 100000
0 .0 1 4.3 0 .0 6 31.6
6 33.3
0 .0 0 .0 12 20.3
100001 to 150000
0 .0 1 4.3 0 .0 1 5.3 1 5.6 0 .0 0 .0 3 5.1
More than 150000
0 .0 0 .0 0 .0 2 10.5
3 16.7
0 .0 0 .0 4 6.8
Total 1 100.0
23 100.0
1 100.0
19 100.0
18 100.0
1 100.0
2 100.0
59 100.
0
54h. All household income from revenue and external sources in KSH
Statistics
Valid 348 Missing 9 Mean 348755.1839 Median 119150.0000 Minimum 1500.00 Maximum 20212200.00 Sum 121366804.00

174
54i. All household income from revenue and external sources in KSH (grouped)
Frequency PercentValid
Percent
Up to 25000 48 13.4 13.8
25001 to 50000 39 10.9 11.2
50001 to 100000 60 16.8 17.2
100001 to 200000 89 24.9 25.6
200001 to 400000 63 17.6 18.1
400001 to 600000 19 5.3 5.5
More than 60000 30 8.4 8.6
Total 348 97.5 100.0
54j. All household income from revenue and external sources in KSH divided by hh members (grouped)
Statistics
Valid 348 Missing 9 Mean 105233.7038 Median 25845.2381 Minimum 300.00 Maximum 10106100.00 Sum 36621328.92
54k. All household income from revenue and external sources in KSH divided by hh members (grouped)
Frequency PercentValid
Percent
Up to 5000 46 12.9 13.2
5001 to 10000 35 9.8 10.1
10001 to 20000 65 18.2 18.7
20001 to 30000 51 14.3 14.7
30001 to 40000 31 8.7 8.9
40001 to 50000 25 7.0 7.2
50001 to 100000 53 14.8 15.2
100001 to 200000 19 5.3 5.5
More than 200000 23 6.4 6.6
Total 348 97.5 100.0

175
Q55
55a. Statistics on annual expenditures in KSH on:
Household items
Health Education/
school Agriculture Livestock
Social affairs
Transport Rent for
agricultural land
Valid 314 174 269 233 210 123 212 22
Missing 43 183 88 124 147 234 145 335
Mean 37352.4841 13820.9195 52861.2751 40259.6996 18541.8381 8068.8130 10639.3396 8640.9091
Median 21600.0000 6000.0000 24000.0000 12000.0000 12000.0000 4000.0000 9600.0000 2450.0000
Minimum 2000.00 500.00 300.00 1000.00 500.00 400.00 200.00 1000.00
Maximum 360000.00 240000.00 500000.00 2338000.00 180000.00 60000.00 120000.00 65000.00
Sum 11728680.00 2404840.00 14219683.00 9380510.00 3893786.00 992464.00 2255540.00 190100.00
None of the interviewees was spending rent for housing.
55b. Household expenditures (annually in KSH) (grouped)
Frequency PercentValid
Percent
Up to 10000 53 14.8 16.9
10001 to 15000 43 12.0 13.7
15001 to 20000 27 7.6 8.6
20001 to 25000 75 21.0 23.9
25001 to 50000 50 14.0 15.9
50001 to 75000 38 10.6 12.1
75001 to 150000 19 5.3 6.1
More than 150000 9 2.5 2.9
Total 314 88.0 100.0
55c. Health expenditures (annually in KSH) (grouped)
Frequency PercentValid
Percent
Up to 1000 12 3.4 6.9
1001to 2000 18 5.0 10.3
2001 to 3000 15 4.2 8.6
3001 to 4000 10 2.8 5.7
4001 to 8000 43 12.0 24.7
8001 to 12000 40 11.2 23.0
12001 to 24000 17 4.8 9.8
24001 to 48000 8 2.2 4.6
More than 48000 11 3.1 6.3
Total 174 48.7 100.0
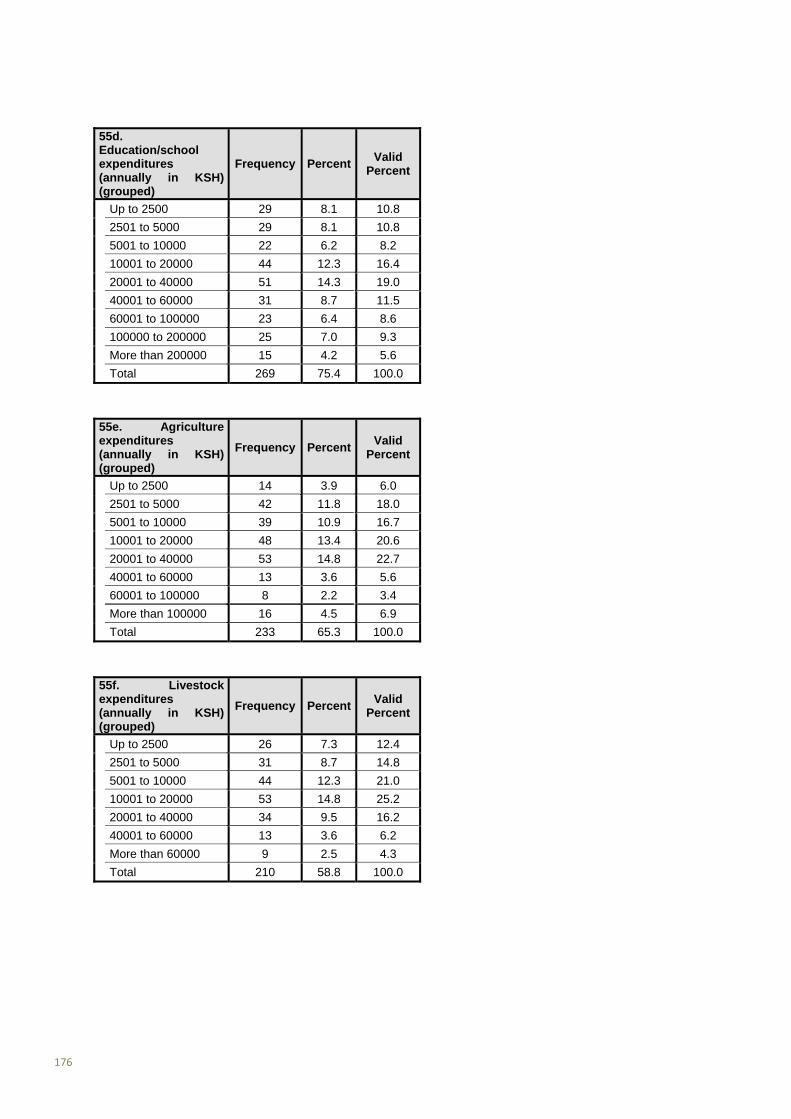
176
55d. Education/school expenditures (annually in KSH) (grouped)
Frequency PercentValid
Percent
Up to 2500 29 8.1 10.8
2501 to 5000 29 8.1 10.8
5001 to 10000 22 6.2 8.2
10001 to 20000 44 12.3 16.4
20001 to 40000 51 14.3 19.0
40001 to 60000 31 8.7 11.5
60001 to 100000 23 6.4 8.6
100000 to 200000 25 7.0 9.3
More than 200000 15 4.2 5.6
Total 269 75.4 100.0
55e. Agriculture expenditures (annually in KSH) (grouped)
Frequency PercentValid
Percent
Up to 2500 14 3.9 6.0
2501 to 5000 42 11.8 18.0
5001 to 10000 39 10.9 16.7
10001 to 20000 48 13.4 20.6
20001 to 40000 53 14.8 22.7
40001 to 60000 13 3.6 5.6
60001 to 100000 8 2.2 3.4
More than 100000 16 4.5 6.9
Total 233 65.3 100.0
55f. Livestock expenditures (annually in KSH) (grouped)
Frequency PercentValid
Percent
Up to 2500 26 7.3 12.4
2501 to 5000 31 8.7 14.8
5001 to 10000 44 12.3 21.0
10001 to 20000 53 14.8 25.2
20001 to 40000 34 9.5 16.2
40001 to 60000 13 3.6 6.2
More than 60000 9 2.5 4.3
Total 210 58.8 100.0

177
55g. Social expenditures (annually in KSH) (grouped)
Frequency PercentValid
Percent
Up to 1000 14 3.9 11.4
1001 to 2000 24 6.7 19.5
2001 to 4000 24 6.7 19.5
4001 to 6000 24 6.7 19.5
6001 to 10000 10 2.8 8.1
10001 to 20000 15 4.2 12.2
More than 20000 12 3.4 9.8
Total 123 34.5 100.0
55h. Transport expenditures (annually in KSH) (grouped)
Frequency PercentValid
Percent
Up to 2000 21 5.9 9.9
2001 to 4000 36 10.1 17.0
4001 to 6000 38 10.6 17.9
6001 to 12000 89 24.9 42.0
12001 to 24000 18 5.0 8.5
More than 24000 10 2.8 4.7
Total 212 59.4 100.0
55i. Rent for agricultural land (annually in KSH) (grouped) Frequency Percent
Valid Percent
1000.00 1 .3 4.5 1400.00 1 .3 4.5 1500.00 4 1.1 18.2 1800.00 1 .3 4.5 2000.00 3 .8 13.6 2400.00 1 .3 4.5 2500.00 1 .3 4.5 3000.00 2 .6 9.1 4000.00 2 .6 9.1 5000.00 1 .3 4.5 6000.00 1 .3 4.5 7000.00 1 .3 4.5 12000.00 1 .3 4.5 60000.00 1 .3 4.5 65000.00 1 .3 4.5 Total 22 6.2 100.0
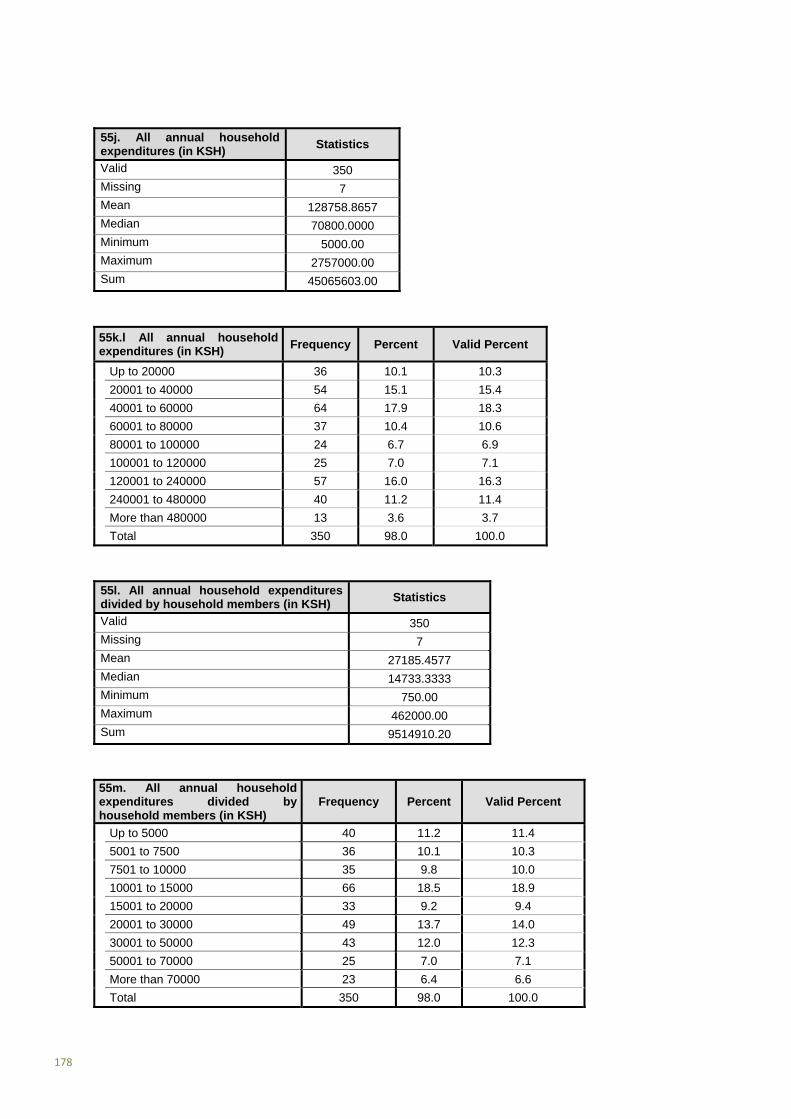
178
55j. All annual household expenditures (in KSH)
Statistics
Valid 350 Missing 7 Mean 128758.8657 Median 70800.0000 Minimum 5000.00 Maximum 2757000.00 Sum 45065603.00
55k.l All annual household expenditures (in KSH)
Frequency Percent Valid Percent
Up to 20000 36 10.1 10.3
20001 to 40000 54 15.1 15.4
40001 to 60000 64 17.9 18.3
60001 to 80000 37 10.4 10.6
80001 to 100000 24 6.7 6.9
100001 to 120000 25 7.0 7.1
120001 to 240000 57 16.0 16.3
240001 to 480000 40 11.2 11.4
More than 480000 13 3.6 3.7
Total 350 98.0 100.0
55l. All annual household expenditures divided by household members (in KSH)
Statistics
Valid 350 Missing 7 Mean 27185.4577 Median 14733.3333 Minimum 750.00 Maximum 462000.00 Sum 9514910.20
55m. All annual household expenditures divided by household members (in KSH)
Frequency Percent Valid Percent
Up to 5000 40 11.2 11.4
5001 to 7500 36 10.1 10.3
7501 to 10000 35 9.8 10.0
10001 to 15000 66 18.5 18.9
15001 to 20000 33 9.2 9.4
20001 to 30000 49 13.7 14.0
30001 to 50000 43 12.0 12.3
50001 to 70000 25 7.0 7.1
More than 70000 23 6.4 6.6
Total 350 98.0 100.0
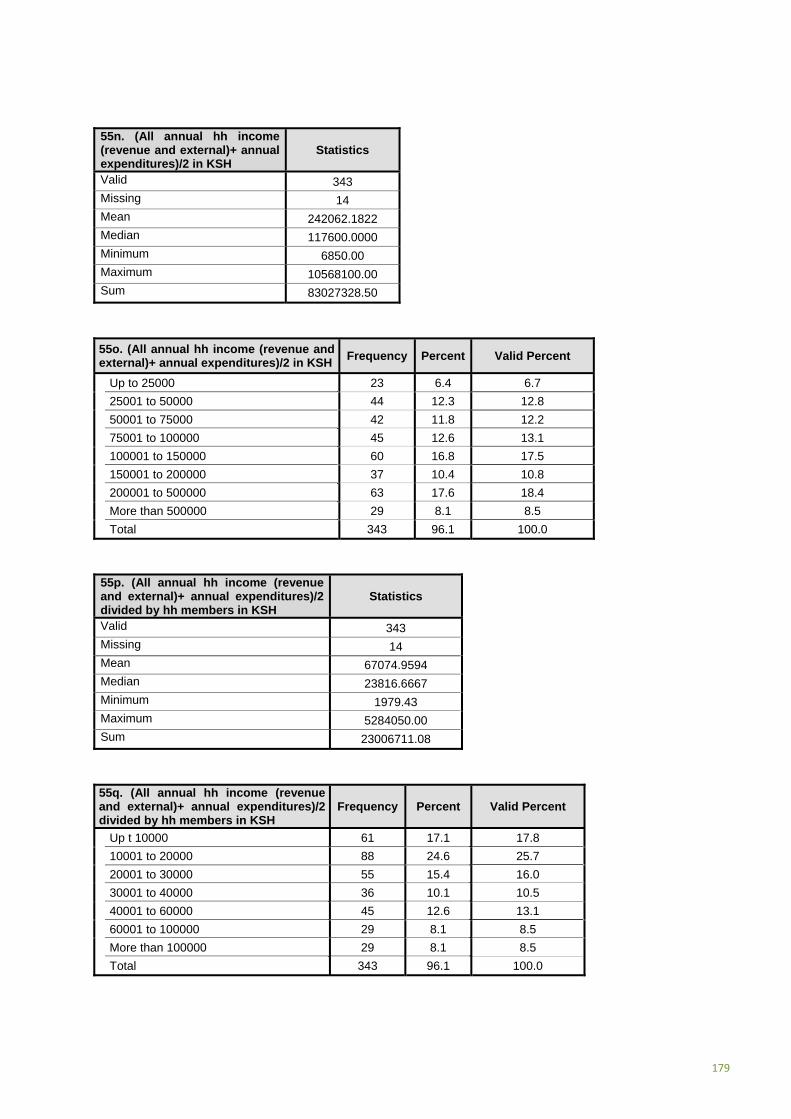
179
55n. (All annual hh income (revenue and external)+ annual expenditures)/2 in KSH
Statistics
Valid 343 Missing 14 Mean 242062.1822 Median 117600.0000 Minimum 6850.00 Maximum 10568100.00 Sum 83027328.50
55o. (All annual hh income (revenue and external)+ annual expenditures)/2 in KSH
Frequency Percent Valid Percent
Up to 25000 23 6.4 6.7
25001 to 50000 44 12.3 12.8
50001 to 75000 42 11.8 12.2
75001 to 100000 45 12.6 13.1
100001 to 150000 60 16.8 17.5
150001 to 200000 37 10.4 10.8
200001 to 500000 63 17.6 18.4
More than 500000 29 8.1 8.5
Total 343 96.1 100.0
55p. (All annual hh income (revenue and external)+ annual expenditures)/2 divided by hh members in KSH
Statistics
Valid 343 Missing 14 Mean 67074.9594 Median 23816.6667 Minimum 1979.43 Maximum 5284050.00 Sum 23006711.08
55q. (All annual hh income (revenue and external)+ annual expenditures)/2 divided by hh members in KSH
Frequency Percent Valid Percent
Up t 10000 61 17.1 17.8
10001 to 20000 88 24.6 25.7
20001 to 30000 55 15.4 16.0
30001 to 40000 36 10.1 10.5
40001 to 60000 45 12.6 13.1
60001 to 100000 29 8.1 8.5
More than 100000 29 8.1 8.5
Total 343 96.1 100.0
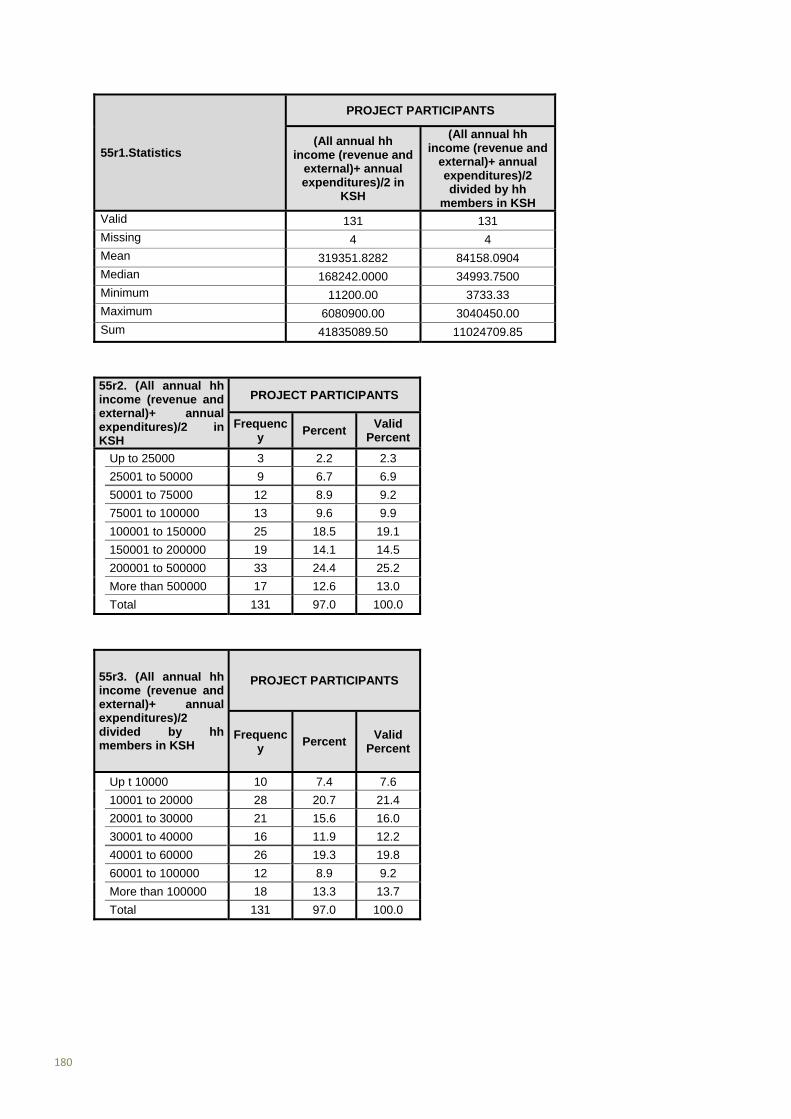
180
55r1.Statistics
PROJECT PARTICIPANTS
(All annual hh income (revenue and
external)+ annual expenditures)/2 in
KSH
(All annual hh income (revenue and
external)+ annual expenditures)/2 divided by hh
members in KSH Valid 131 131 Missing 4 4 Mean 319351.8282 84158.0904 Median 168242.0000 34993.7500 Minimum 11200.00 3733.33 Maximum 6080900.00 3040450.00 Sum 41835089.50 11024709.85
55r2. (All annual hh income (revenue and external)+ annual expenditures)/2 in KSH
PROJECT PARTICIPANTS
Frequency
Percent Valid
Percent
Up to 25000 3 2.2 2.3
25001 to 50000 9 6.7 6.9
50001 to 75000 12 8.9 9.2
75001 to 100000 13 9.6 9.9
100001 to 150000 25 18.5 19.1
150001 to 200000 19 14.1 14.5
200001 to 500000 33 24.4 25.2
More than 500000 17 12.6 13.0
Total 131 97.0 100.0
55r3. (All annual hh income (revenue and external)+ annual expenditures)/2 divided by hh members in KSH
PROJECT PARTICIPANTS
Frequency
Percent Valid
Percent
Up t 10000 10 7.4 7.6
10001 to 20000 28 20.7 21.4
20001 to 30000 21 15.6 16.0
30001 to 40000 16 11.9 12.2
40001 to 60000 26 19.3 19.8
60001 to 100000 12 8.9 9.2
More than 100000 18 13.3 13.7
Total 131 97.0 100.0
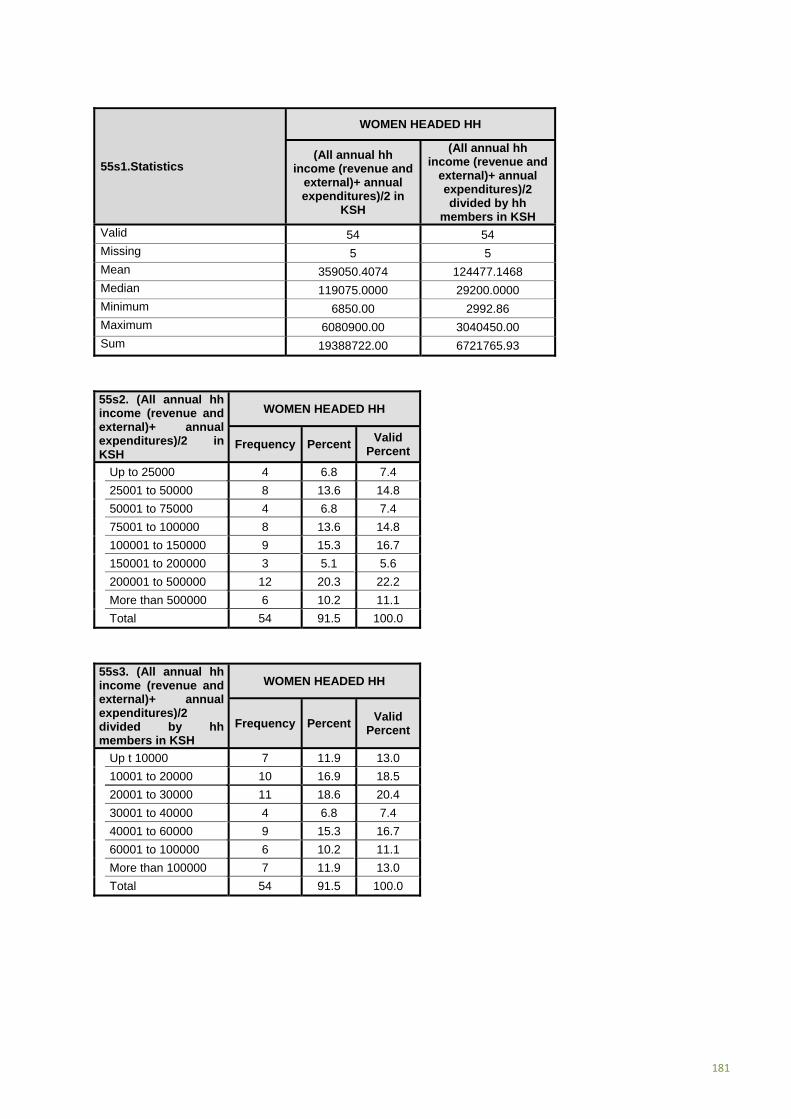
181
55s1.Statistics
WOMEN HEADED HH
(All annual hh income (revenue and
external)+ annual expenditures)/2 in
KSH
(All annual hh income (revenue and
external)+ annual expenditures)/2 divided by hh
members in KSH Valid 54 54 Missing 5 5 Mean 359050.4074 124477.1468 Median 119075.0000 29200.0000 Minimum 6850.00 2992.86 Maximum 6080900.00 3040450.00 Sum 19388722.00 6721765.93
55s2. (All annual hh income (revenue and external)+ annual expenditures)/2 in KSH
WOMEN HEADED HH
Frequency PercentValid
Percent
Up to 25000 4 6.8 7.4
25001 to 50000 8 13.6 14.8
50001 to 75000 4 6.8 7.4
75001 to 100000 8 13.6 14.8
100001 to 150000 9 15.3 16.7
150001 to 200000 3 5.1 5.6
200001 to 500000 12 20.3 22.2
More than 500000 6 10.2 11.1
Total 54 91.5 100.0
55s3. (All annual hh income (revenue and external)+ annual expenditures)/2 divided by hh members in KSH
WOMEN HEADED HH
Frequency PercentValid
Percent
Up t 10000 7 11.9 13.0
10001 to 20000 10 16.9 18.5
20001 to 30000 11 18.6 20.4
30001 to 40000 4 6.8 7.4
40001 to 60000 9 15.3 16.7
60001 to 100000 6 10.2 11.1
More than 100000 7 11.9 13.0
Total 54 91.5 100.0
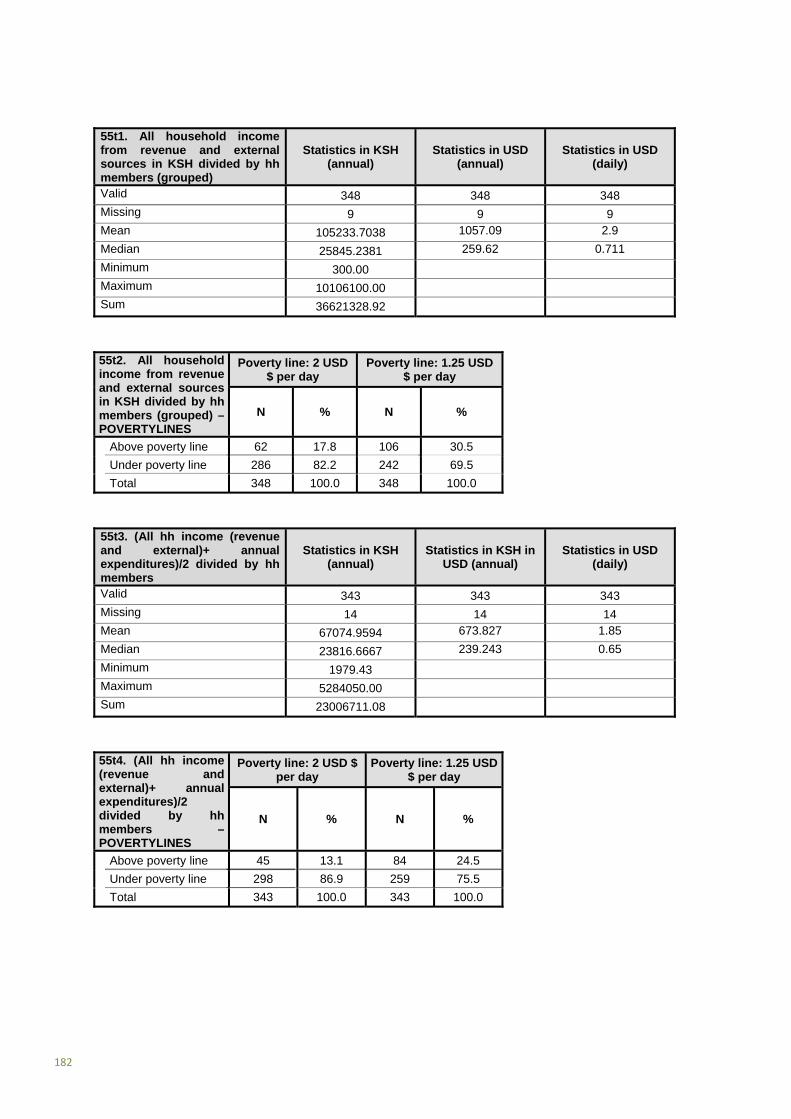
182
55t1. All household income from revenue and external sources in KSH divided by hh members (grouped)
Statistics in KSH (annual)
Statistics in USD (annual)
Statistics in USD (daily)
Valid 348 348 348 Missing 9 9 9 Mean 105233.7038 1057.09 2.9
Median 25845.2381 259.62 0.711
Minimum 300.00
Maximum 10106100.00
Sum 36621328.92
55t2. All household income from revenue and external sources in KSH divided by hh members (grouped) – POVERTYLINES
Poverty line: 2 USD $ per day
Poverty line: 1.25 USD $ per day
N % N %
Above poverty line 62 17.8 106 30.5
Under poverty line 286 82.2 242 69.5
Total 348 100.0 348 100.0
55t3. (All hh income (revenue and external)+ annual expenditures)/2 divided by hh members
Statistics in KSH (annual)
Statistics in KSH in USD (annual)
Statistics in USD (daily)
Valid 343 343 343 Missing 14 14 14 Mean 67074.9594 673.827 1.85
Median 23816.6667 239.243 0.65
Minimum 1979.43
Maximum 5284050.00
Sum 23006711.08
55t4. (All hh income (revenue and external)+ annual expenditures)/2 divided by hh members – POVERTYLINES
Poverty line: 2 USD $ per day
Poverty line: 1.25 USD $ per day
N % N %
Above poverty line 45 13.1 84 24.5
Under poverty line 298 86.9 259 75.5
Total 343 100.0 343 100.0

183
55t5. (All hh income (revenue and external)+ annual expenditures)/2 divided by hh members – POVERTYLINES
WOMEN HEADED HH
Poverty line: 2 USD $ per day
Poverty line: 1.25 USD $ per day
N % N %
Above poverty line 11 20.4 19 35.2
Under poverty line 43 79.6 35 64.8
Total 54 100.0 59 100.0
55t6. (All hh income (revenue and external)+ annual expenditures)/2 divided by hh members – POVERTYLINES
PROJECT PARTICIPANTS
Poverty line: 2 USD $ per day
Poverty line: 1.25 USD $ per day
N % N %
Above poverty line 24 18.3 43 32.8
Under poverty line 107 81.7 88 67.2
Total 131 100.0 131 100.0
Q56
56a. Assess economic situation of the household
Frequency Percent Valid
Percent
Very poor, there is sometimes even not enough food available
6 1.7 1.7
Poor, but have no food problems and only sometimes problems buying clothes
57 16.0 16.5
Moderate, enough money for food clothes, health care, school
246 68.9 71.1
Moderate, enough money even for some luxurious objects like motorbikes, car, computer
35 9.8 10.1
Good, can run a good car, own a good house, have many luxurious objects
2 .6 .6
Total 346 96.9 100.0

184
56b. Assess economic situation of the household
PEOJECT PARTICIPANTS
Frequency Percent Valid Percent
Poor, but have no food problems and only sometimes problems buying clothes
14 10.4 10.6
Moderate, enough money for food clothes, health care, school
95 70.4 72.0
Moderate, enough money even for some luxurious objects like motorbikes, car, computer
23 17.0 17.4
Total 132 97.8 100.0
56c. Assess economic situation of the householdWOMEN HEADED HH
Frequency Percent Valid Percent
Very poor, there is sometimes even not enough food available
1 1.7 1.8
Poor, but have no food problems and only sometimes problems buying clothes
14 23.7 24.6
Moderate, enough money for food clothes, health care, school
31 52.5 54.4
Moderate, enough money even for some luxurious objects like motorbikes, car, computer
11 18.6 19.3
Total 57 96.6 100.0
Q57
57a. First priority of household in case of additional money
Frequency PercentValid
Percent
Better Food 93 26.1 27.2
Better Clothes 1 .3 .3
Repair house 13 3.6 3.8 Better health services
2 .6 .6
Better schools 47 13.2 13.7
Better water 2 .6 .6
Electricity supply 6 1.7 1.8
Buy car or motorbike 3 .8 .9
Open shop/business 17 4.8 5.0 Start Professional training
1 .3 .3
Buy livestock 82 23.0 24.0
Hire farm staff 1 .3 .3 Buy livestock goods/equipment
36 10.1 10.5
Buy agricultural goods/equipment
36 10.1 10.5
Greenhouse 2 .6 .6
Total 342 95.8 100.0
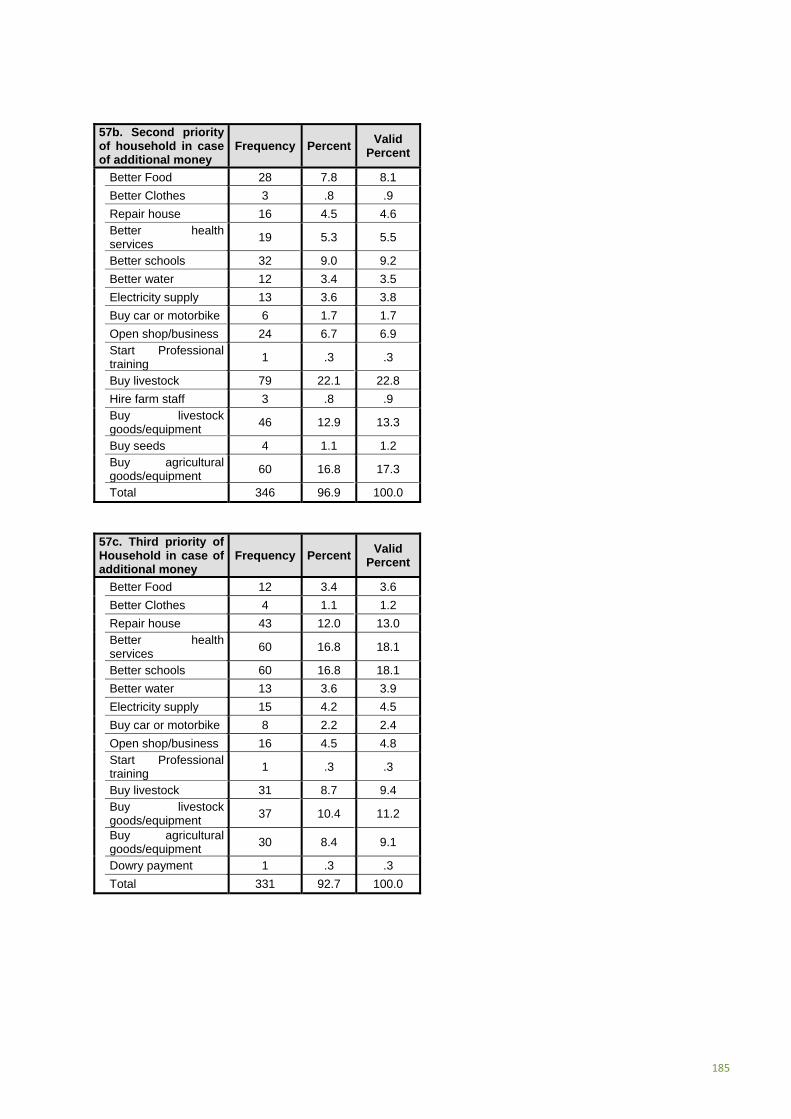
185
57b. Second priority of household in case of additional money
Frequency PercentValid
Percent
Better Food 28 7.8 8.1
Better Clothes 3 .8 .9
Repair house 16 4.5 4.6 Better health services
19 5.3 5.5
Better schools 32 9.0 9.2
Better water 12 3.4 3.5
Electricity supply 13 3.6 3.8
Buy car or motorbike 6 1.7 1.7
Open shop/business 24 6.7 6.9 Start Professional training
1 .3 .3
Buy livestock 79 22.1 22.8
Hire farm staff 3 .8 .9 Buy livestock goods/equipment
46 12.9 13.3
Buy seeds 4 1.1 1.2 Buy agricultural goods/equipment
60 16.8 17.3
Total 346 96.9 100.0
57c. Third priority of Household in case of additional money
Frequency PercentValid
Percent
Better Food 12 3.4 3.6
Better Clothes 4 1.1 1.2
Repair house 43 12.0 13.0 Better health services
60 16.8 18.1
Better schools 60 16.8 18.1
Better water 13 3.6 3.9
Electricity supply 15 4.2 4.5
Buy car or motorbike 8 2.2 2.4
Open shop/business 16 4.5 4.8 Start Professional training
1 .3 .3
Buy livestock 31 8.7 9.4 Buy livestock goods/equipment
37 10.4 11.2
Buy agricultural goods/equipment
30 8.4 9.1
Dowry payment 1 .3 .3
Total 331 92.7 100.0

186
57d. All mentioned priorities
First Priority
Second Priority
Third Priority
All priorities
N % N % N % N %
Better Food 93 27.2 28 8.1 12 3.6 133 13.1
Better Clothes 1 .3 3 .9 4 1.2 8 .8
Repair house 13 3.8 16 4.6 43 13.0 72 7.1 Better health services
2 .6 19 5.5 60 18.1 81 7.9
Better schools 47 13.7 32 9.2 60 18.1 139 13.6
Better water 2 .6 12 3.5 13 3.9 27 2.6
Electricity supply 6 1.8 13 3.8 15 4.5 34 3.3
Buy car or motorbike 3 .9 6 1.7 8 2.4 17 1.7
Open shop/business 17 5.0 24 6.9 16 4.8 57 5.6 Start Professional training
1 .3 1 .3 1 .3 3 .3
Buy livestock 82 24.0 79 22.8 31 9.4 192 18.8
Hire farm staff 1 .3 3 .9 0 .0 4 .4 Buy livestock goods/equipment
36 10.5 46 13.3 37 11.2 119 11.7
Buy seeds 4 1.2 0 .0 4 .4 Buy agricultural goods/equipment
36 10.5 60 17.3 30 9.1 126 12.4
Other 2 .6 0 .0 1 .3 3 .3
Total 342 100.
0 346
100.0
331 100.
0 1019
100.0
57e. Other household priorities
Frequency PercentValid
Percent
None 342 95.8 95.8
Biogas construction 2 .6 .6 Buy cows for dowry payment
1 .3 .3
Buy land 6 1.7 1.7
Increase business 1 .3 .3 Increase land for cropping
1 .3 .3
Plant tea 3 .8 .8
Rearing of chicken 1 .3 .3
Total 357 100.0 100.0
Q58
58. Evaluation of interview
Frequency PercentValid
Percent
Sincere 229 64.1 65.2
Not Sincere 8 2.2 2.3 Can not estimate the sincerity
114 31.9 32.5
Total 351 98.3 100.0
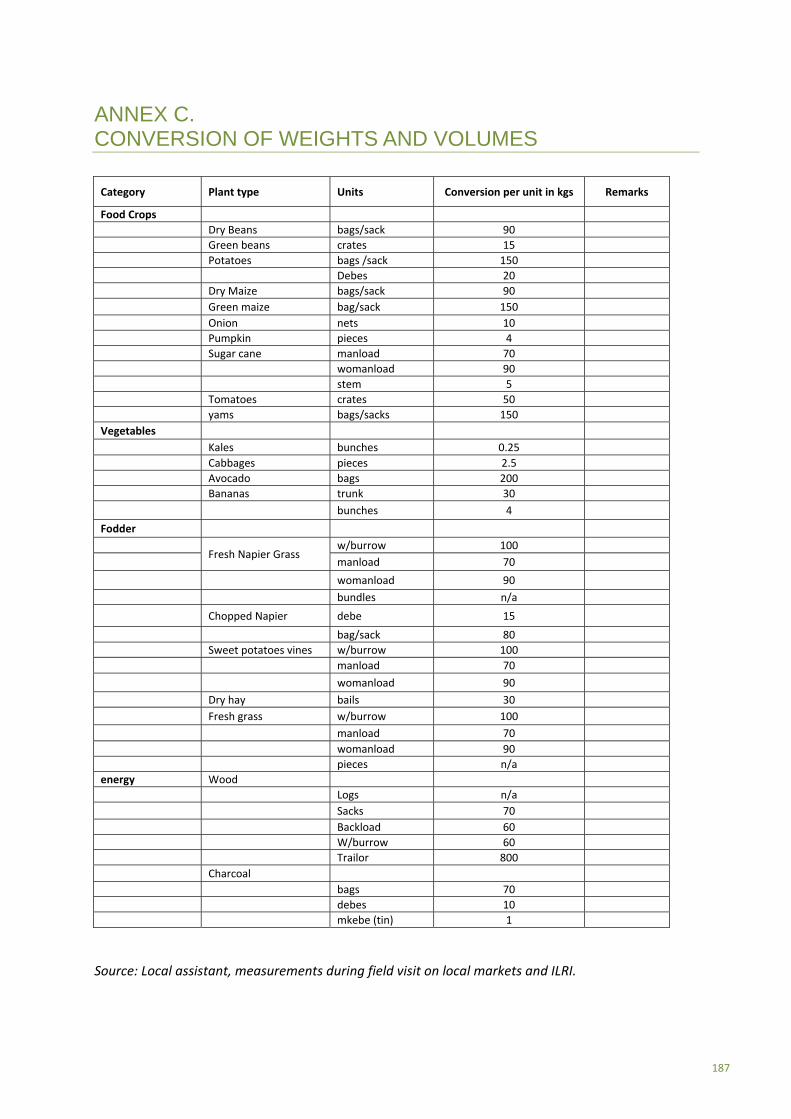
187
ANNEX C. CONVERSION OF WEIGHTS AND VOLUMES
Category Plant type Units Conversion per unit in kgs Remarks
Food Crops
Dry Beans bags/sack 90
Green beans crates 15
Potatoes bags /sack 150
Debes 20
Dry Maize bags/sack 90
Green maize bag/sack 150
Onion nets 10
Pumpkin pieces 4
Sugar cane manload 70
womanload 90
stem 5
Tomatoes crates 50
yams bags/sacks 150
Vegetables
Kales bunches 0.25
Cabbages pieces 2.5
Avocado bags 200
Bananas trunk 30
bunches 4
Fodder
Fresh Napier Grass
w/burrow 100
manload 70
womanload 90
bundles n/a
Chopped Napier debe 15
bag/sack 80
Sweet potatoes vines w/burrow 100
manload 70
womanload 90
Dry hay bails 30
Fresh grass w/burrow 100
manload 70
womanload 90
pieces n/a
energy Wood
Logs n/a
Sacks 70
Backload 60
W/burrow 60
Trailor 800
Charcoal
bags 70
debes 10
mkebe (tin) 1
Source: Local assistant, measurements during field visit on local markets and ILRI.

188
ANNEX D. LIST OF INDIGENOUS TREES MENTIONED IN THE HOUSEHOLD SURVEY
Name of Tree Planted trees
N %
Biribriet 1 0.55
Bodo 1 0.55
Chebitoik 2 1.1
Chemakaldet 1 0.55
Chepnoewet 2 1.1
Getibalaya 1 0.55
Grotton 1 0.55
Jacaranda 1 0.55
Kagarwet 1 0.55
Kenduiywet 1 0.55
Kimolwet 1 0.55
Lamaiwet 5 2.75
Marindari 1 0.55
Masimetonic 1 0.55
Masineitet 35 19.25
Mchai 1 0.55
Menellins 1 0.55
Mobeet 10 5.5
Moboniek 1 0.55
Mogoiwet 3 1.65
Moseneitat 1 0.55
Oriot 1 0.55
Prunus Efricana 1 0.55
Sagawatiet 8 4.4
Sayet 4 2.2
Senetwet 2 1.1
Sikswet 1 0.55
Siriat 1 0.55
Sogot 1 0.55
Sogowotiet 1 0.55
Soiyet 7 3.85
Tebesonik 32 17.6
Tebeswet 41 22.55
Teldet 1 0.55
Tendwet 6 3.3
Wattle trees 1 0.55
Total 180 100


