0 Slide 0 Biodiversity - Socioeconomic Conditions & Trends Socioeconomic Conditions and Trends in Washington State July 2006 Towards a Biodiversity Conservation Strategy: Prepared by Cascadia Consulting Group, Inc.
I. Population growth and migration are increasing the pressure to convert working lands to residential and commercial uses, especially in prime wildlife habitat in lowlands and along rivers. Native habitat loss and fragmentation are the leading threats to biodiversity. Conversion is a major force in the Puget Trough and Columbia Plateau ecoregions.
II. Family foresters and farmers steward some of the richest habitat but also face the greatest pressure to develop because of financial, regulatory, and inheritance issues. Family forest lands and threatened high quality farmland are concentrated in the Puget Trough, Northwest Coast, Columbia Plateau, and Okanogan ecoregions.
III. Climate change will likely pose significant threats to Washington’s biodiversity by changing entire ecosystems, increasing the influx of exotic species, and escalating conflicts over water, in which wildlife such as salmon have suffered historically.
IV. The shift in Washington’s economy towards knowledge and service-based industries creates both new opportunities and poses new threats for the state’s biodiversity, compared with manufacturing and resource based industries of the past.
V. Tourism, if properly managed, can provide many benefits for biodiversity conservation. Tourists are attracted to Washington by its natural environment, which supports and is supported by biodiversity. Tourism brings substantial benefits to rural areas. Protecting natural areas in rural areas can increase economic growth and help offset losses in extraction industries while at the same time enhancing native habitat for biodiversity.
VI. People care about related issues that support biodiversity, such as clean water, but they lack awareness about biodiversity itself. While people are willing to pay to protect the environment, biodiversity is not yet a major issue.
This report compiles information from a wide variety of sources, including:- WA state agencies and commissions
WA Department of AgricultureWA Department of Community Trade and Economic DevelopmentWA Department Natural ResourcesWA Economic and Revenue Forecast CouncilWA Office of Financial Management
Federal data collection agenciesCensusUSDA Economic Research Service
University-affiliated research institutionsCenter for Real Estate Research (WSU)Climate Impacts Group (UW)Rural Technology Initiative (UW)
Industry associations and environmental organizationsAmerican Farmland TrustBiodiversity PartnershipDefenders of WildlifeThe Nature ConservancyWashington Forest Protection Association
Peer-reviewed journal articles
7
(1)
(1) Map from Jesse Langdon, The Nature Conservancy (Received May 2006)
The Washington Biodiversity Council uses ecoregions as one geographic basis for conservation planning. Unlike political boundaries, such as county or state lines, ecoregions are defined by patterns in vegetation, geology, hydrology, and other natural attributes. This report will frequently use ecoregional boundaries to connect socioeconomic data, usually compiled along political boundaries, with conservation areas.
A. Population GrowthHow is population growth expected to affect biodiversity in the future?
B. Demographic StructureWhat are the trends in Washington’s demographic structure?How will changing demographic structure likely affect biodiversity?
C. Geographic Distribution How is population growth expected to be distributed among cities, suburbs, and rural areas throughout Washington?How will migration affect biodiversity?
Key Question: How is population growth expected to affect biodiversity in the future?
Significant population growth over the next 30 years is expected to exert increasing pressure on Washington’s biodiversity resources. - Population growth affects biodiversity through:
Native habitat conversion to residential and commercial developmentPollution from sewage, stormwater runoff, and vehiclesResource consumption of timber, minerals, and energyIncreased native habitat fragmentation from new roads and highways
- Washington’s current population of 6.3 million is projected to grow 37% to 8.5 million by 2030. (1)
- Much of this growth is expected to occur in the Puget Sound region as well as in Spokane County and Clark County, adversely affecting biodiversity in the Puget Trough and Columbia Plateau ecoregions. (2)
(1) Washington Office of Financial Management “Forecast of the State Population by Age and Sex: 1990 to 2030 (November 2005 Forecast)” Accessed online May 2006 (http://www.ofm.wa.gov/pop/stfc/default.asp)
(2) Office of Financial Management “Washington State County Growth Management Population Projections: 2000 to 2025” Accessed online May 2006. (http://www.ofm.wa.gov/pop/gma/projections.asp)
Key Question: What are the trends in Washington’s demographic structure?
Washington’s population is growing, but not all age groups are growing at the same rate.- Washington currently has just
over 700,000 residents age 65 or older, accounting for 11% of all residents. By 2030, their numbers will more than double to about 1.7 million, or 19% of all residents. (1)
- The share of population under age 15 will decline slightly over the next 25 years, potentially changing the relative demand for large-lot suburban housing.
Washington's Population Projections by Age Group 1975-2025(p)
0
1,000
2,000
3,000
4,000
5,000
6,000
7,000
8,000
9,000
1975 1985 1995 2005 2015(p) 2025(p) 2030(p)
Thou
sand
s
Year
Pers
ons
65+45-6425-4415-240-14
Washington's Population Demographics by Age Group 1975-2025(p)
0%
20%
40%
60%
80%
100%
1975 1985 1995 2005 2015(p) 2025(p) 2030(p)
YearSh
are
of P
opul
atio
n
65+45-6425-4415-240-14
(1) Washington Office of Financial Management “Forecast of the State Population by Age and Sex: 1990 to 2030 (November 2005 Forecast)” Accessed online May 2006 (http://www.ofm.wa.gov/pop/stfc/default.asp)
Key Question: How will changing demographic structure likely affect biodiversity?
The rise of the baby boom generation spurred suburban tract housing. Their retirement may similarly influence development patterns and how rapidly native habitat is converted to housing.- Research is inconclusive but hypothesizes that retirees may: (1)
Remain in their current homes;Downsize into a smaller urban home, reducing their impact on sprawl;Move to new homes in rural areas, driving native habitat loss and harming biodiversity; orBoth downsize and buy a second home in the country.
- Which effect is larger remains unclear, but their choices will have a huge impact on urban form, land use, and native habitat around the state.
Family foresters and farmers are also aging, reducing the numberof stewards protecting undeveloped land. (See Working Landssection)
(1) Personal Communication with Glenn Crellin, Director of the Washington Center for Real Estate Research, Washington State University (June 5, 2006)
Key Question: How is population growth expected to be distributed among cities, suburbs, and rural areas throughout Washington?
Most of the current population as well as growth over the next 20 years (by absolute numbers) is expected to occur in the central Puget Sound region.- Nearly 50% of the population growth is projected to occur in four
Puget Sound counties (King, Snohomish, Pierce, and Kitsap). (1)- Over the past 5 years:
Major cities and suburbs—Seattle, Renton, Issaquah—have gained the most residents by number.But rural cities are growing at a faster rate—Snoqualmie, DuPont, Bonney Lake. (2)
- Much growth in the Puget Trough ecoregion is occurring on 5-acre parcels in rural areas outside the urban core, chipping away at native habitat for biodiversity, as people accept longer commutes in return for less expensive and larger houses and lots. (3)
(1) Office of Financial Management “Washington State County Growth Management Population Projections: 2000 to 2025” Accessed online May 2006. (http://www.ofm.wa.gov/pop/gma/projections.asp)
(2) Puget Sound Regional Council “Puget Sound Trends: Population of Cities and Towns” No.D3 (September 2005). Accessed online May 2006 (http://www.psrc.org/datapubs/pubs/trends)
(3) Personal communication with Doug Peters, Senior Planner, Growth Management Services, CTED (May 4, 2006)
Some rural counties are also likely to experience high percentages of growth, though their overall populations may remain fairly small.- Outside the central Puget Sound
region, Spokane and Clark counties will gain the most new residents, accepting 16% of the state’s growth. (1)
- Population growth in rural areas impacts biodiversity more than in urban areas because it is more likely to occur in high quality habitat, and a sprawling development pattern tends to consume more land and resources per new resident. (3)
- Other counties outside the Puget Trough ecoregion that are projected to grow rapidly include over the next 20 years include: (2)
(1) Office of Financial Management “Washington State County Growth Management Population Projections: 2000 to 2025” Accessed online May 2006. (http://www.ofm.wa.gov/pop/gma/projections.asp)
(2) Office of Financial Management “Washington State County Growth Management Population Projections: 2000 to 2025” Accessed online May 2006. (http://www.ofm.wa.gov/pop/gma/projections.asp)
(3) Burchell RW and Mukherji S. “Conventional Development Versus Managed Growth: The Costs of Sprawl.” American Journal of Public Health. December 2003; v.91, n.9; pp1534-1540
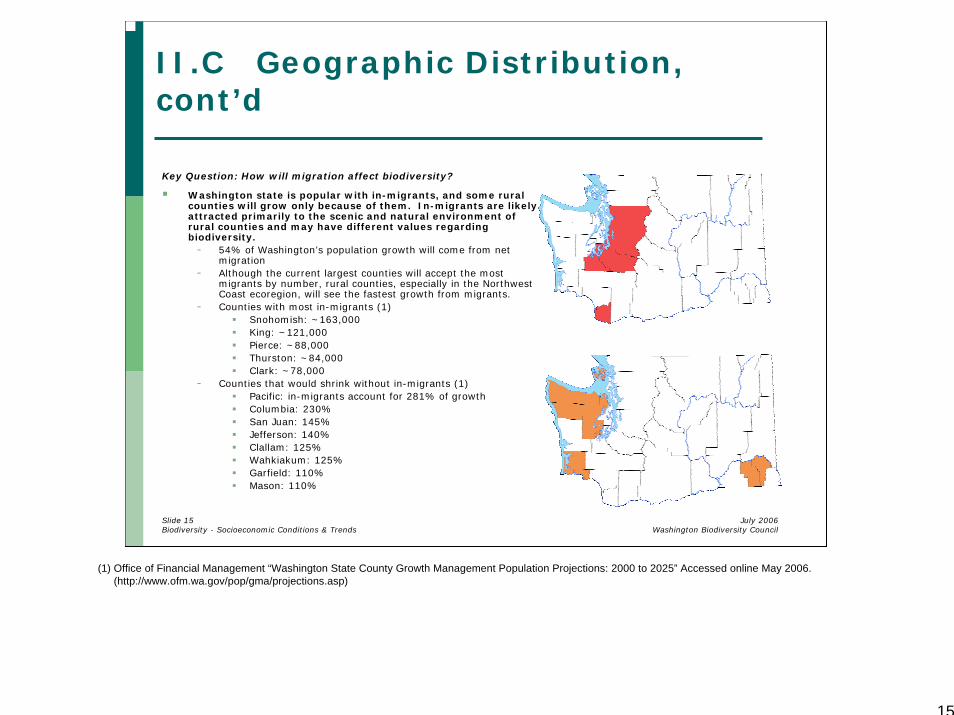
Key Question: How will migration affect biodiversity?
Washington state is popular with in-migrants, and some rural counties will grow only because of them. In-migrants are likely attracted primarily to the scenic and natural environment of rural counties and may have different values regarding biodiversity.- 54% of Washington’s population growth will come from net
migration- Although the current largest counties will accept the most
migrants by number, rural counties, especially in the Northwest Coast ecoregion, will see the fastest growth from migrants.
- Counties with most in-migrants (1)Snohomish: ~163,000King: ~121,000Pierce: ~88,000Thurston: ~84,000Clark: ~78,000
- Counties that would shrink without in-migrants (1)Pacific: in-migrants account for 281% of growthColumbia: 230%San Juan: 145%Jefferson: 140%Clallam: 125%Wahkiakum: 125%Garfield: 110%Mason: 110%
(1) Office of Financial Management “Washington State County Growth Management Population Projections: 2000 to 2025” Accessed online May 2006. (http://www.ofm.wa.gov/pop/gma/projections.asp)
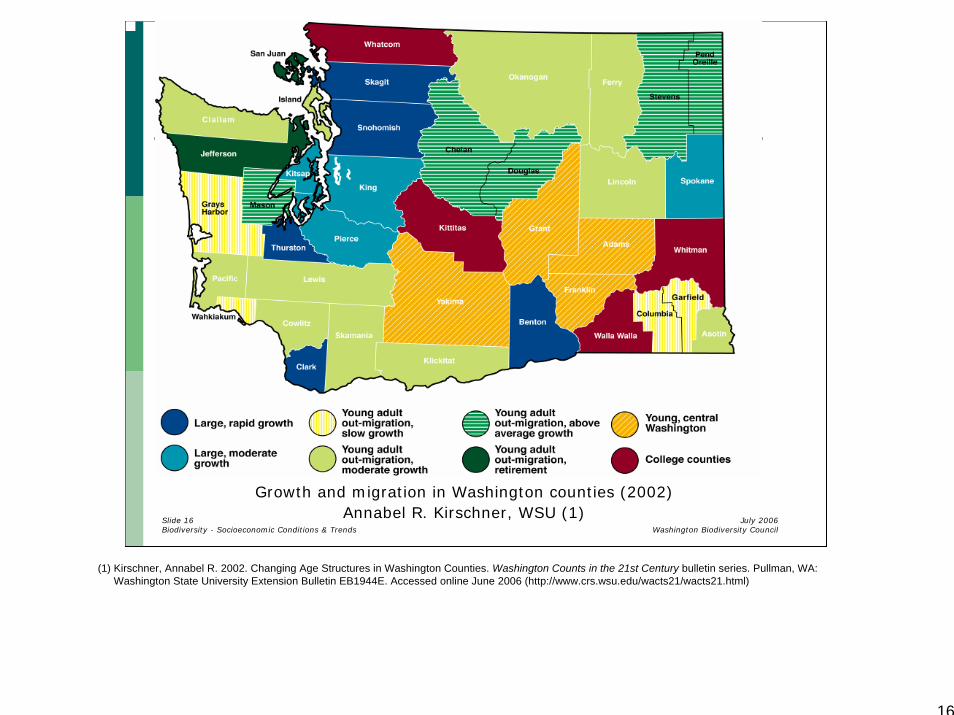
Growth and migration in Washington counties (2002)Annabel R. Kirschner, WSU (1)
(1) Kirschner, Annabel R. 2002. Changing Age Structures in Washington Counties. Washington Counts in the 21st Century bulletin series. Pullman, WA: Washington State University Extension Bulletin EB1944E. Accessed online June 2006 (http://www.crs.wsu.edu/wacts21/wacts21.html)
A. Washington’s population is growing rapidly, especially in the Puget Trough and Columbia Plateau ecoregions. These new residents will need places to live and work. Unless growth is channeled into already developed areas and away from native habitat, land conversion in the rich lowlands and wetlands could severely reduce biodiversity, especially in the Puget Trough ecoregion.
B. While urban areas will gain the most new residents, rural areas in the Okanogan, Columbia Plateau, and Northwest Coast ecoregions will face the most rapid growth as a percentage of current population. Rapid population growth in rural areas threatens biodiversity in those regions, particularly since development in rural areas tends to be habitat-consuming sprawl.
C. Retiring baby boomers could create a shift in development patterns as radical as the rise of the suburbs of the 1950s, benefiting biodiversity if they choose compact urban centers and harming it if most move to rural areas or build second homes in wildlife–rich areas like the Northwest Coast, the Cascades, the Okanogan region.
A. General Economic TrendsIn which sectors do we expect economic growth in Washington, and how does that activity relate to biodiversity?
B. Resource-based IndustriesWhat is the role of working forests and farmlands in economic development?What is the status of working lands, and what are the trends?What factors affect trends in working lands conversion?What trends are emerging in agriculture, forestry, and energy, and how do those affect biodiversity?
C. Knowledge- & Service-based IndustriesWhat is the role of knowledge/service industries in economic development?What are the trends for those industries?What attributes draw those industries to a region, and how does that relate to biodiversity?
D. Recreation & TourismWhat is the role of recreation/tourism in economic development?What are the trends for those industries?What attributes support tourism/recreation, and how does that relate to biodiversity?
E. GlobalizationWhat are the impacts of globalization and the global economy on biodiversity?
F. ConsumerismHow is consumerism expected to affect biodiversity in the future?
Key Question: In which sectors do we expect economic growth in Washington, and how does that activity relate to biodiversity?
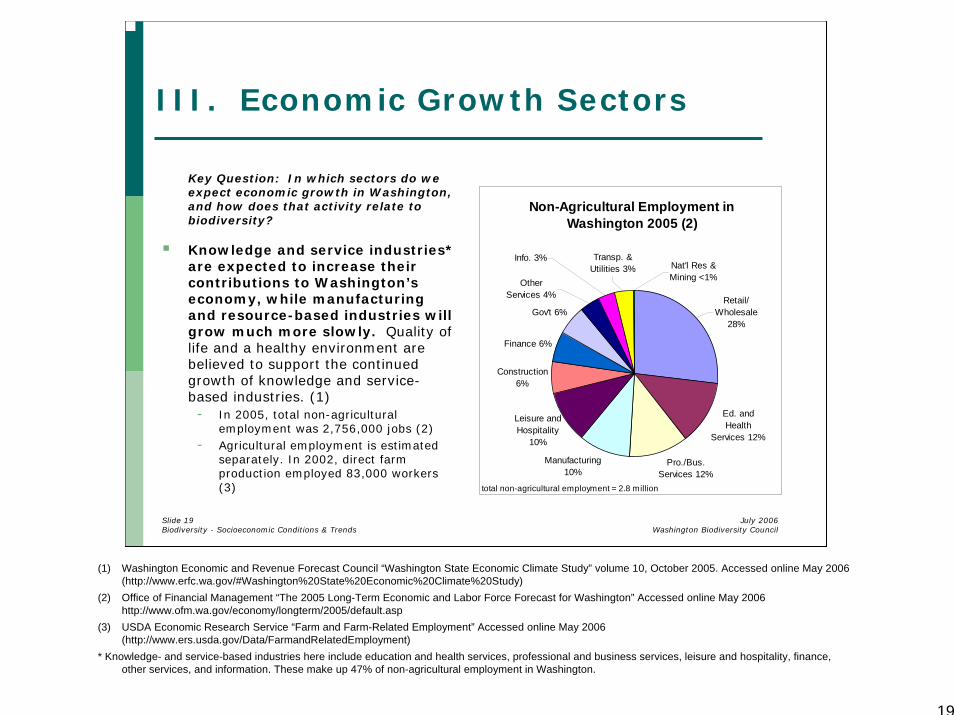
Knowledge and service industries* are expected to increase their contributions to Washington’s economy, while manufacturing and resource-based industries will grow much more slowly. Quality of life and a healthy environment are believed to support the continued growth of knowledge and service-based industries. (1)- In 2005, total non-agricultural
employment was 2,756,000 jobs (2)- Agricultural employment is estimated
separately. In 2002, direct farm production employed 83,000 workers (3)
Non-Agricultural Employment in Washington 2005 (2)
Ed. and Health
Services 12%
Pro./Bus. Services 12%
Leisure and Hospitality
10%
Construction 6%
Finance 6%
Gov't 6%
Manufacturing 10%
Nat'l Res & Mining <1%
Transp. & Utilities 3%
Info. 3%
Other Services 4% Retail/
Wholesale 28%
total non-agricultural employment = 2.8 million
(1) Washington Economic and Revenue Forecast Council “Washington State Economic Climate Study” volume 10, October 2005. Accessed online May 2006 (http://www.erfc.wa.gov/#Washington%20State%20Economic%20Climate%20Study)
(2) Office of Financial Management “The 2005 Long-Term Economic and Labor Force Forecast for Washington” Accessed online May 2006 http://www.ofm.wa.gov/economy/longterm/2005/default.asp
(3) USDA Economic Research Service “Farm and Farm-Related Employment” Accessed online May 2006 (http://www.ers.usda.gov/Data/FarmandRelatedEmployment)
* Knowledge- and service-based industries here include education and health services, professional and business services, leisure and hospitality, finance, other services, and information. These make up 47% of non-agricultural employment in Washington.
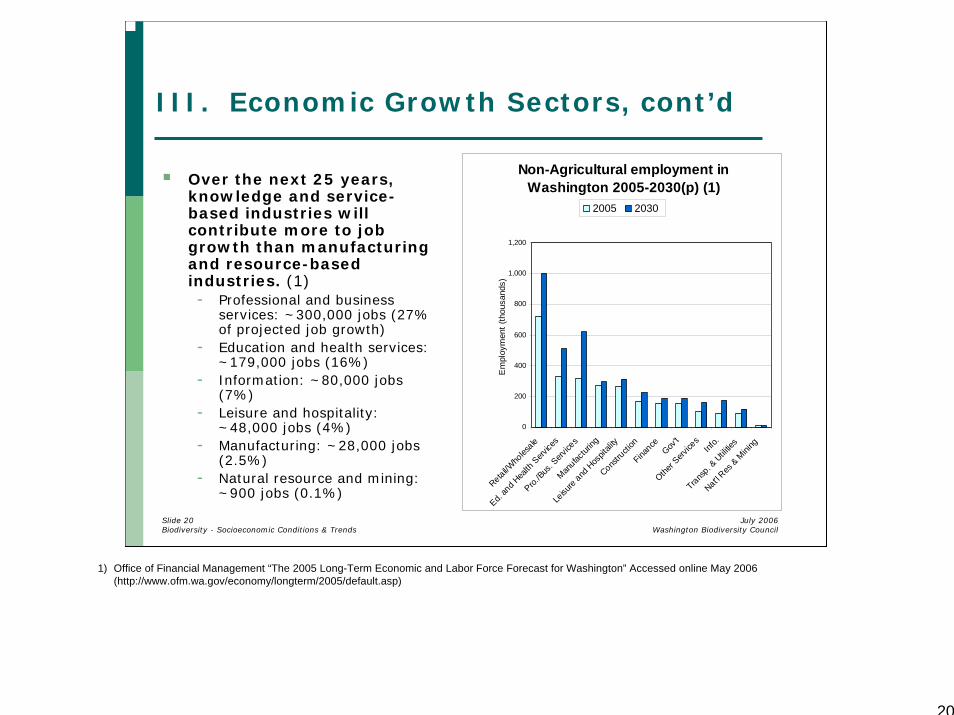
Over the next 25 years, knowledge and service-based industries will contribute more to job growth than manufacturing and resource-based industries. (1)- Professional and business
services: ~300,000 jobs (27% of projected job growth)
- Education and health services: ~179,000 jobs (16%)
- Information: ~80,000 jobs (7%)
- Leisure and hospitality: ~48,000 jobs (4%)
- Manufacturing: ~28,000 jobs (2.5%)
- Natural resource and mining: ~900 jobs (0.1%)
Non-Agricultural employment in Washington 2005-2030(p) (1)
0
200
400
600
800
1,000
1,200
Retail/Who
lesale
Ed. an
d Hea
lth S
ervice
s
Pro./Bus
. Serv
ices
Manufac
turing
Leisu
re and H
ospit
ality
Constru
ction
FinanceGov
't
Other S
ervice
sInf
o.
Transp. &
Utili
ties
Nat'l Res
& M
ining
Em
ploy
men
t (th
ousa
nds)
2005 2030
1) Office of Financial Management “The 2005 Long-Term Economic and Labor Force Forecast for Washington” Accessed online May 2006 (http://www.ofm.wa.gov/economy/longterm/2005/default.asp)
Economic growth in the central Puget Sound region follows state patterns and shows growth outside central cities.- In central Puget Sound, most job growth is occurring outside of Seattle and King
County, which could increase native habitat conversion to urban uses. In 2003-2004, central cities and traditional employment centers lost jobs (Seattle, Renton, Bellevue) while outer suburban cities grew fastest (Auburn, Redmond, Shoreline). (1)King County lost jobs in 2002-2004, and Kitsap and Pierce Counties both expanded their jobs faster than Snohomish County. (1)
- Job growth in the central Puget Sound region has generally followed the statewide trends. (1)
Finance, services, education, government, and construction grew from 2002-2004.Manufacturing declined.
(1) Puget Sound Regional Council “Puget Sound Trends: Employment in Cities and Counties” Accessed online May 2006 (http://www.psrc.org/datapubs/pubs/trends/)
Key Question: What is the role of working forestlands in economic stability?
Working forestlands are important to economic stability in rural counties.- The forest products industry
provides 42,000 jobs to the state, less than 2% of total employment, but it provides a large percentage of employment in some rural counties. (1)
- The most timber-dependent counties are: (1)
Grays Harbor: 2,800 jobs (12% of total employment)Cowlitz: 4,900 jobs (15%)Stevens: 1,100 jobs (11%)Pend Oreille: 350 jobs (11%)Wahkiakum: 150 jobs (15%)
(1) Washington Forest Protection Association “Forest Facts and Figures” May 2005. Accessed online May 2006 (http://www.forestsandfish.com/PressRoom/pdfs/FFF-2005new.pdf)
Key Question: What is the status of working forestlands, and what are the trends?
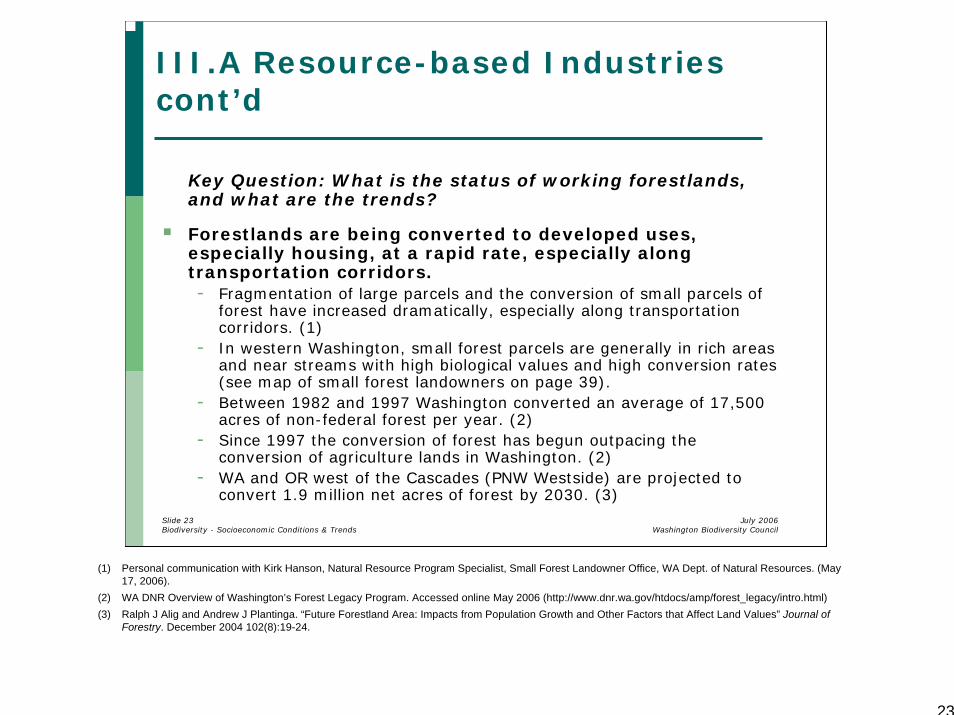
Forestlands are being converted to developed uses, especially housing, at a rapid rate, especially along transportation corridors.- Fragmentation of large parcels and the conversion of small parcels of
forest have increased dramatically, especially along transportation corridors. (1)
- In western Washington, small forest parcels are generally in rich areas and near streams with high biological values and high conversion rates (see map of small forest landowners on page 39).
- Between 1982 and 1997 Washington converted an average of 17,500 acres of non-federal forest per year. (2)
- Since 1997 the conversion of forest has begun outpacing the conversion of agriculture lands in Washington. (2)
- WA and OR west of the Cascades (PNW Westside) are projected to convert 1.9 million net acres of forest by 2030. (3)
(1) Personal communication with Kirk Hanson, Natural Resource Program Specialist, Small Forest Landowner Office, WA Dept. of Natural Resources. (May 17, 2006).
(2) WA DNR Overview of Washington’s Forest Legacy Program. Accessed online May 2006 (http://www.dnr.wa.gov/htdocs/amp/forest_legacy/intro.html)(3) Ralph J Alig and Andrew J Plantinga. “Future Forestland Area: Impacts from Population Growth and Other Factors that Affect Land Values” Journal of
Key Question: What trends are emerging in forestry, and how do those affect biodiversity?
Market-based factors are increasing interest in voluntary certification for wildlife-friendly or climate-friendly forestry.- 4.8 million acres—nearly 22% of Washington’s total forestland—are
enrolled in the Sustainable Forestry Initiative (SFI), an industry-led certification system limited to the US. Of those, 4.6 million have been independently certified within the SFI system. (1)
- By contrast, only 86,000 acres are certified by the Forest Stewardship Council, an international system generally considered more comprehensive and stricter. (2)
(1) Personal communication from Jason Metnick, Manager—Sustainable Forestry and Forest Policy, American Forest & Paper Association. July 18, 2006.(2) Personal communication from Katie Miller, Communications Director, Forestry Stewardship Council US. June 1, 2006.
Key Questions: What factors affect trends in working land conversion?
High real estate values combined with taxes, regulations, and other costs induce conversion to development.- Development is spurred by relative land values.
In 38 counties in PNW Westside, the average value of land in urban use is 111 times higher than in forest use. (1)The highest forestland values are 25 times less than the lowest urban values, by county. (1)
- Regulations that ensure forests are harvested sustainably make forestry more costly and may induce conversion to development. Top challenges cited by family foresters are taxes, maintenance costs, and time commitment. They also mention health care costs as a reason to sell land. (2)
- Farmers are also squeezed between high input prices—diesel, fertilizer, labor—and high real estate prices. Regulations and taxes can add to the burden. Inheritance can be an issue in some but not all locations. (3)
(1) Ralph J Alig and Andrew J Plantinga. “Future Forestland Area: Impacts from Population Growth and Other Factors that Affect Land Values” Journal of Forestry. December 2004 102(8):19-24.
(2) Peter Nelson “Examining Washington’s Working Forest Stakeholders” discussion paper from Saving Washington’s Working Forest Land Base forum in November 2004. Accessed online May 2006 (http://www.nwenvironmentalforum.org/news.htm)
(3) Personal communication with Britt Dudek, District Manager, Foster Creek Conservation District. July 17, 2006. Britt also said that inheritance can result in selling the family farm, sometimes because of inheritance taxes but often because the next generation chooses not to farm. This can lead to conversion, but in some counties, such as Douglas, the land usually stays in farming with a new owner.
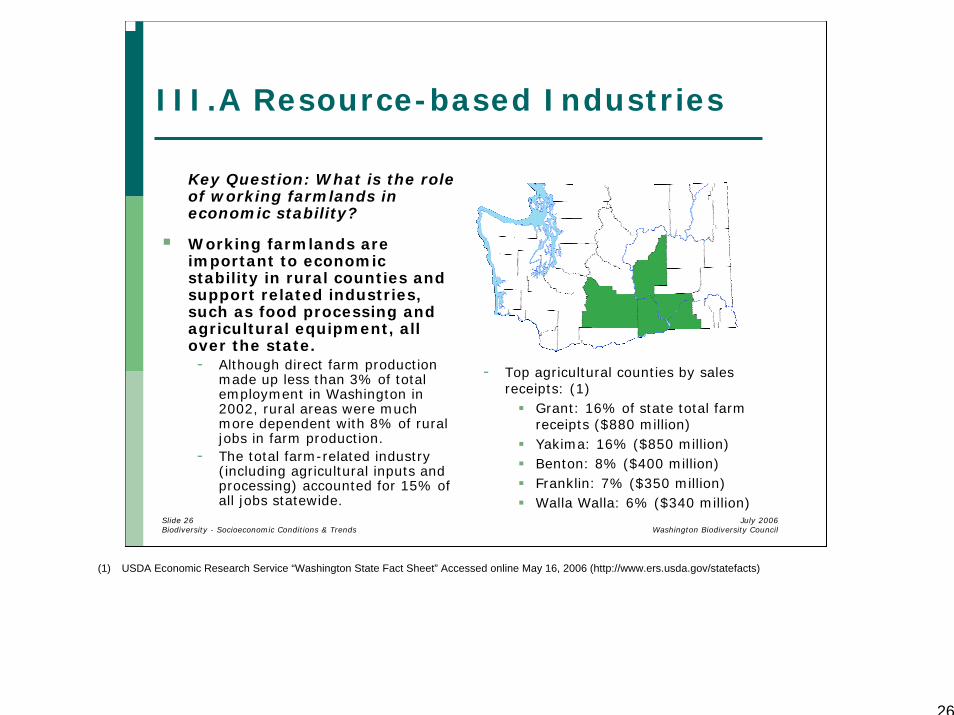
Key Question: What is the role of working farmlands in economic stability?
Working farmlands are important to economic stability in rural counties and support related industries, such as food processing and agricultural equipment, all over the state.- Although direct farm production
made up less than 3% of total employment in Washington in 2002, rural areas were much more dependent with 8% of rural jobs in farm production.
- The total farm-related industry (including agricultural inputs and processing) accounted for 15% of all jobs statewide.
- Top agricultural counties by sales receipts: (1)
Grant: 16% of state total farm receipts ($880 million)Yakima: 16% ($850 million)Benton: 8% ($400 million)Franklin: 7% ($350 million)Walla Walla: 6% ($340 million)
(1) USDA Economic Research Service “Washington State Fact Sheet” Accessed online May 16, 2006 (http://www.ers.usda.gov/statefacts)
Key Question: What trends are emerging in agriculture, and how do those affect biodiversity?
Market-based factors are increasing interest in voluntary certification for organic, wildlife-friendly, or climate-friendly farming.- The Food Alliance certifies farms and ranches that reduce pesticide/hormone use, conserve
soil and water resources, and protect and enhance wildlife native habitat. These farms then carry the Food Alliance label, which presumably commands a higher price. (1)
Currently, 22 farms and ranches, covering 66,000 acres in Washington are Food Alliance certified. (2)
A small but growing number of Washington’s farmlands are certified organic. Organic farming may impact biodiversity less than conventional farming, but more research is needed. (3)- WSDA certified organic farmland acreage increased 400% from 1997 to 2005, now covering
over 60,000 acres, although this is less than 1% of all cropland in Washington. (4)- In 2005 there were 570 organic farms, up from 560 in 2002 and 290 in 1997. (4)- Barriers to organic certification include
The length of time (3 years) between eliminating chemical pesticides/fertilizers and permission to use the organic label; (4)The complex paper work required to become certified; andExemptions for small farms (less than $5,000 in annual sales) who can use an organic label without certifying. (4)
(1) The Food Alliance “Food Alliance Certification” Accessed online May 2006 (http://www.foodalliance.org/certification/index.html) [The Food Alliance is not organic in that they encourage pesticide reduction instead of elimination, but they do offer credit for broader conservation efforts.]
(2) The Food Alliance, personal communication from Heather Saam. May 25, 2006.(3) D.G. Hole et al. “Does Organic Farming Benefit Biodiversity?” Biological Conservation 2005 122:113-130.(4) WSDA Organic Food Program. Accessed online May 2006 (http://agr.wa.gov/FoodAnimal/Organic)
Key Question: What trends are emerging in energy generation, and how do those affect biodiversity?
Biofuels reduce greenhouse gas emissions but could induce conversion of native habitat to farmland. Washington’s biofuels industry is likely to grow because of Washington’s renewable fuel standard.- Washington’s new renewable fuel standard mandates that at least 2% of total diesel sales are
biodiesel and 2% of gasoline sales are ethanol by 2008, potentially increasing to 5% and 10% in the future.(1)
- Biofuels in WA are primarily from canola grown in rotation with wheat on existing fields. In the future, ethanol may come from cellulose in wheat straw (by-product) and/or switch grass. (2) Switch grass is native to the tall grass prairie in the Midwest but not to Washington. (3)
Wind farms reduce greenhouse gas emissions but can disturb native habitat. They still pose a collision threat to birds and bats, but the threat can be reduced by improved siting and operations.Washington already has several major wind projects and may gain more if I-937 passes. Washington currently has three operating wind projects with a total maximum capacity of 385 MW. (4)- I-937, which will be on the November 2006 ballot, would require major Washington utilities to
increase renewable energy sources, such as wind and solar, to 15% of the electricity supply by 2020. (5)
(1) Washington State Senate Bill 6508 (companion House Bill 2738), signed March 30, 2006. Accessed online June 2006 (http://apps.leg.wa.gov/billinfo/summary.aspx?bill=6508&year=2006)
(2) Personal Communication with Peter Moulton, Harvesting Clean Energy Program Coordinator, Climate Solutions. April 24, 2006.(3) Keyser, Justin S. “Switchgrass (Panicum virgatum)” The Natural Source: An Educator’s Guide to South Dakota’s Natural Resources. Accessed online July
2006 (http://www.northern.edu/natsource/GRASSES/Switch1.htm)(4) Renewable Northwest Project “Renewable Energy Projects Serving Northwest Load” Accessed online May 2006
(http://www.rnp.org/Projects/projectlist.php)(5) Secretary of the State of Washington “Elections: Initiatives to the People” Accessed online July 2006
Key Question: What is the role of knowledge/service industries in economic development? What are the trends for those industries? What attributes draw those industries to a region?
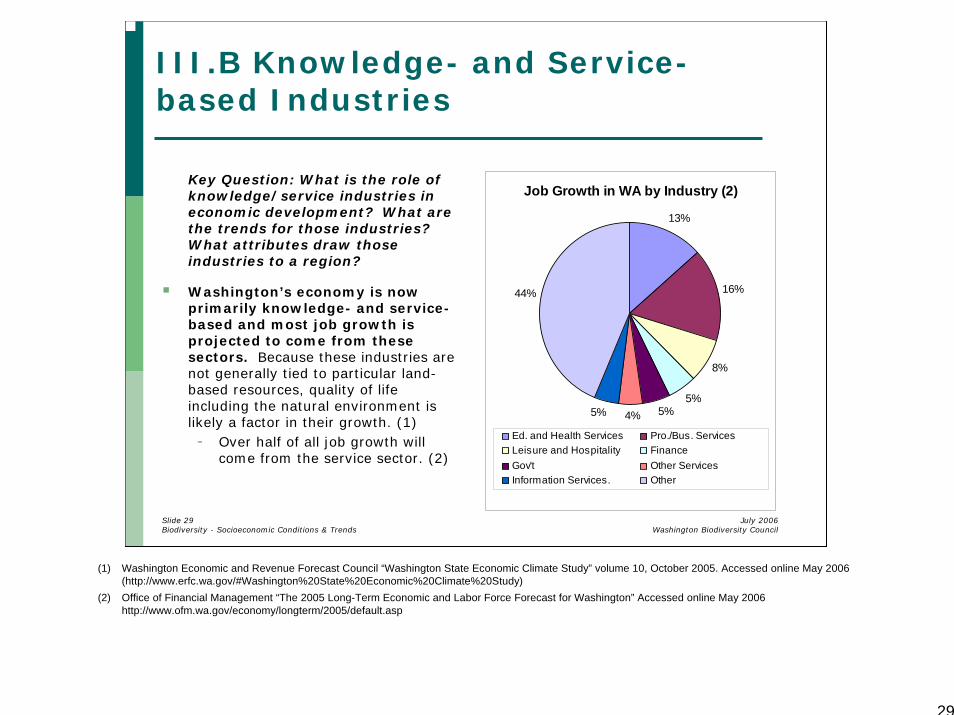
Washington’s economy is now primarily knowledge- and service-based and most job growth is projected to come from these sectors. Because these industries are not generally tied to particular land-based resources, quality of life including the natural environment is likely a factor in their growth. (1)- Over half of all job growth will
come from the service sector. (2)
Job Growth in WA by Industry (2)
13%
16%
8%
5%5%4%5%
44%
Ed. and Health Services Pro./Bus. ServicesLeisure and Hospitality FinanceGov't Other ServicesInformation Services. Other
(1) Washington Economic and Revenue Forecast Council “Washington State Economic Climate Study” volume 10, October 2005. Accessed online May 2006 (http://www.erfc.wa.gov/#Washington%20State%20Economic%20Climate%20Study)
(2) Office of Financial Management “The 2005 Long-Term Economic and Labor Force Forecast for Washington” Accessed online May 2006 http://www.ofm.wa.gov/economy/longterm/2005/default.asp
Key Question: How do trends in knowledge/service industries relate to biodiversity?
The shift towards a service-based economy will have a mixed impact on biodiversity.- While working farms and forests are better habitat than the paved
development that goes along with a service economy, service jobscould be located densely in cities to use less land per job, potentially reducing overall native habitat loss in Washington. (1)
- Infrastructure supporting the service economy—roads, buildings, technology, etc.—can have more or less impact on biodiversity, both in Washington and globally, depending on how sustainably it is produced and disposed of. (2)
(1) Blann, Kristen “Habitat in Agricultural Landscapes: How Much is Enough?” Defenders of Wildlife (2006) Accessed online June 2006 (http://www.biodiversitypartners.org/pubs/Ag/index.shtml)
(2) See Ehrlich, Paul R. et al. “Knowledge and the Environment” Ecological Economics (1999) 30:267-284 for a related discussion on several aspects on the role of increasing knowledge on the environment.
Key Question: What is the role of recreation/tourism in economic development? What are the trends for those industries?
Leisure and hospitality* account for 10% of jobs in the state with a projected 4% growth over the next 25 years. (1)- The WA State Tourism Office estimates that in
2002, 142,000 jobs were generated by travel. (2)- State tax receipts from travel in 2005 were $590
million; local tax receipts were $200 million. (2)
Most travel-related jobs* are in urban counties, but travel has the most impact in rural counties.- In 2004, travel-generated employment was
highest in King (50,000 jobs, or 4% of total employment), Pierce (11,000 or 3%), Spokane (9,000 or 4%), and Snohomish (8,000 or 4%). (2)
- In recent years, travel-related employment has grown fastest on the coast and in King County. The travel industry is now picking up after the recent recession. (2)
*Numbers may not add up because employment measures are collected differently.
- Rural counties depend more on travel-related employment: (2)
Skamania: 25% of total county employment (740 jobs)Pacific: 20% (2,000)San Juan: 17% (2,000)Grays Harbor: 13% (4,000)Jefferson 12% (2,000)Chelan: 10% (5,000)
(1) Office of Financial Management “The 2005 Long-Term Economic and Labor Force Forecast for Washington” Accessed online May 2006 http://www.ofm.wa.gov/economy/longterm/2005/default.asp
(2) Dean Runyan Associates “Washington State Statewide Travel Impacts & Visitor Volume 1991-2005p” Washington State Tourism Office. December 2005. Accessed online May 2006 (http://www.experiencewashington.com/images/pdf/R_ImpactStatewide2005p.pdf)
Key Question: What attributes support tourism/recreation, and how does that relate to biodiversity?
Tourists* come for a variety of reasons, but Washington’s competitive advantage is its natural environment.- Studies haven’t asked whether
visitors come for “biodiversity,”but they do show that the natural environment is a part of more visitors’ activities in WA than in the nation as a whole.
23% of visitors in 2003 went to a state/national park, while 9% went to a museum/science exhibit. (1)17% of visitors went hiking while 8% went to a show/entertainment. (1)
- Washington ranks higher than the US average on all sightseeing and sports/recreation products. (1)
*Tourists meaning visitors who are not on a business trip or visiting relatives or friends
Visitors in 2003 Experienced (1)
48%
39%
30% 30% 28%
17%
46%
28%22% 24%
17% 17%14%
10%
0%
10%
20%
30%
40%
50%
60%
Riv
ers/
lake
s
Mou
ntai
ns
Wild
erne
ssar
eas
Nat
ural
envi
ronm
ent
Rur
alfa
rmin
gar
eas
Wild
life
they
don'
t usu
ally
see Hik
ing
WAUS avg
(1) Longwoods International “Washington State Visitor Profile A Report On The 2003 Travel Year” Washington State Tourism Office. November 2004. Accessed online May 2006 (http://www.experiencewashington.com/images/pdf/R_VisitorProfileLongwoods2003.pdf)
Parks and protected public lands support both biodiversity and tourism.- The presence of public lands is positively correlated with economic
growth in the West. The effect is largest on rural areas. (1)Unprotected public lands near protected areas (more likely used for tourism, e.g. skiing) and protected areas themselves are more closely associated with economic growth than industrial public lands not near protected areas (more likely used for resource extraction)
- The total direct economic impact of WA State Parks was $1.2 billion in 2000. By one estimate, spending on all outdoor recreation in Washington was $4.1 billion in 2000. (2)
- By another estimate, wildlife-associated recreation generated $2.7 billion in spending in 2000—42% in wildlife viewing, 58% in hunting/fishing. (2)
- However, this spending may occur mostly in urban areas (where equipment is purchased and travel arrangements are made) instead of in rural areas that need the revenue to support biodiversity protection.
(1) Sonoran Prosperity Report: “Prosperity in the 21st Century West” Sonoran Institute. Accessed online May 2006 (http://www.sonoran.org/programs/prosperity.html)
(2) Dean Runyan Associates “Washington State: Economic Impacts of Visitors in National Parks” Washington State Parks and Recreation Commission. June 2002. Accessed online May 2006 (http://www.deanrunyan.com/pdf/wastparks02.pdf)
Key Question: What are the impacts of globalization and the global economy on biodiversity?
International markets make Washington’s natural resources subject to global demand. Timber harvesting and agricultural cultivation fluctuate as their global prices rise and fall.- Washington is the most
trade dependent state.Foreign goods exports averaged 17% of Washington personal income in 2000-2004, higher than in any other state. (1)
- From 1990 to 1999, export of agriculture, lumber, and mining declined while export of industrial machinery/computer equipment, electronic & electrical equipment, and instruments rose. (3)
International trade agreements such as the WTO can induce Washington’s farmers and foresters to harvest less sustainably so that they can compete on price with unsustainably-produced foreign goods.- The WTO does not allow countries to differentiate (i.e.
impose tariffs or import restrictions) between two products that are physically alike, even if one was produced sustainably and one produced using more resources and releasing more pollution. (4)
Washington Exports 2004 (billions)(2)
$4.2
$2.7
$6.2$17.7
Transportationequipment
Agriculturalproducts
Computer andelectronicproductsOther
(1) Washington State Economic and Revenue Forecasting Council “Washington State Economic Climate Study” October 2005 Accessed online May 2006 (http://www.erfc.wa.gov/pubs/clim1005.pdf)
(2) Washington Office of Financial Management “Value of Washington Exports” 2004 data. Accessed online May 2006 (http://www.ofm.wa.gov/trends/htm/fig106.asp)
(3) Washington State Office of Financial Management “International Trade and Washington Exports – Research Brief 8” May 2000. Accessed online May 2006 ( http://www.ofm.wa.gov/researchbriefs/brief008.pdf)
(4) Gary P. Sampson “The Environmentalist Paradox: The World Trade Organization's Challenges” Harvard International Review (Winter 2002) 23(4):56-62. See also (http://www.wto.org/english/tratop_e/envir_e/envir_backgrnd_e/contents_e.htm)
Key Question: How is consumerism expected to affect biodiversity in the future?
Over-consumption uses our natural resources at an unsustainable rate and can leave little high-quality habitat for native species. (1)- While regulations and initiatives can
preserve biodiversity in Washington itself, consumption in Washington of imported goods reduces biodiversity elsewhere, shifting the problem onto other states and nations.
The US consumes an unsustainable amount of world resources as measured by its global footprint—the average amount of land used to produce the goods and services consumed at current levels.- Earth had 1.8 global hectares of
biologically productive land per person in 2002, assuming none is set aside for wildlife. (1)
- The world’s footprint was 2.2 global ha/person, exceeding Earth’s capacity to sustain the population by 22%. (1)
- The US used 9.7 global ha/person, so if everyone on the planet consumed at the American rate, they would exceed Earth’s capacity by 780%. We would need 8.8 Earths to sustain the world at that rate. (1)
The size of new single-family homes in the US has more than doubled since the 1940s (from 1,100 to 2,340 sq.ft.). Accounting for smaller family size, living area per person has tripled since the 1950s. (2)
Consumption of World Resources (1)
0 2 4 6 8 10
US
Canada
EU
China
global ha/person
(1) Global Footprint Network, 2005. National Footprint and Biocapacity Accounts, 2005 Edition. Available at http://www.footprintnetwork.org.(2) Alex Wilson and Jessica Boehland “Small is Beautiful: U.S. House Size, Resource Use, and the Environment” Journal of Industrial Economy Winter-Spring
A. Working lands, especially in Western Washington, face pressure to develop from a variety of sources including population growth, migration, the economics of real estate prices. These areas typically harbor fewer native species than undisturbed areas, but they provide significantly more native habitat than suburban development.
B. The knowledge and service industries make up a large part of Washington’s economy and will contribute most of the growth in employment over the next 25 years. The shift to a service economy will likely have a mixed impact on biodiversity. Quality of life, which includes factors like healthy natural areas that also support biodiversity, is considered to be a factor in attracting workers.
C. Washington’s natural environment, including the biodiversity that it supports, is its competitive advantage in tourism. More tourists to Washington go hiking than go to a show/entertainment. Nearly half of all visitors experience our rivers, lakes, or mountains. Tourism helps support rural economies, especially in the Northwest Coast ecoregion, and may offer motivation for stewardship of natural areas and biodiversity.
Where are working lands primarily located, and how does that intersect with biodiversity?Who are major landowners of key areas for biodiversity?How are forest and farm ownership patterns changing?
B. HousingHow do housing and sprawl relate to biodiversity?Where is housing primarily located? Where is sprawl occurring?What is the impact of second-home purchases?
C. Climate ChangeHow will climate change affect Washington?How might climate change affect biodiversity in Washington?
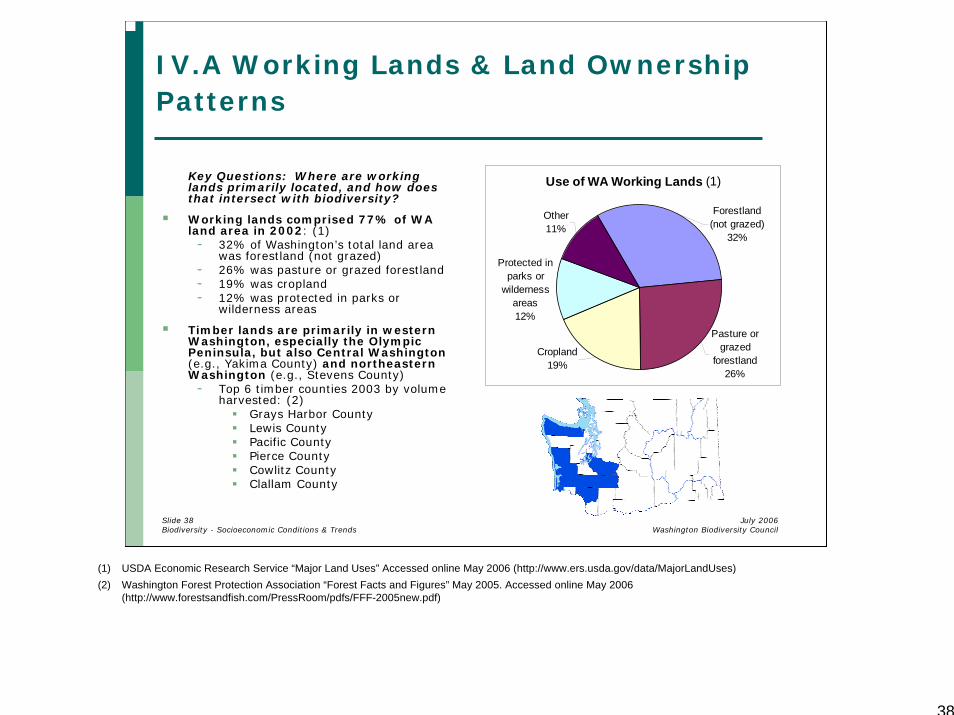
Key Questions: Where are working lands primarily located, and how does that intersect with biodiversity?
Working lands comprised 77% of WA land area in 2002: (1)- 32% of Washington’s total land area
was forestland (not grazed)- 26% was pasture or grazed forestland- 19% was cropland- 12% was protected in parks or
wilderness areas
Timber lands are primarily in western Washington, especially the Olympic Peninsula, but also Central Washington (e.g., Yakima County) and northeastern Washington (e.g., Stevens County)- Top 6 timber counties 2003 by volume
harvested: (2)Grays Harbor CountyLewis CountyPacific CountyPierce CountyCowlitz CountyClallam County
Use of WA Working Lands (1)
Pasture or grazed
forestland26%
Forestland (not grazed)
32%
Other 11%
Protected in parks or
wilderness areas12%
Cropland19%
(1) USDA Economic Research Service “Major Land Uses” Accessed online May 2006 (http://www.ers.usda.gov/data/MajorLandUses)(2) Washington Forest Protection Association “Forest Facts and Figures” May 2005. Accessed online May 2006
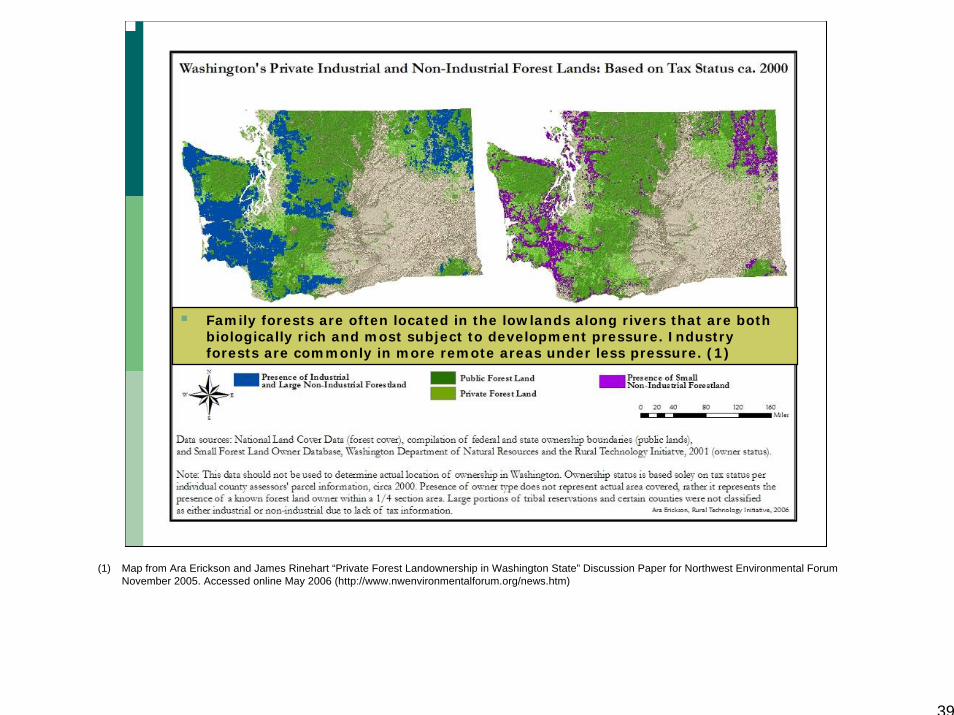
Family forests are often located in the lowlands along rivers that are both biologically rich and most subject to development pressure. Industry forests are commonly in more remote areas under less pressure. (1)
(1) Map from Ara Erickson and James Rinehart “Private Forest Landownership in Washington State” Discussion Paper for Northwest Environmental Forum November 2005. Accessed online May 2006 (http://www.nwenvironmentalforum.org/news.htm)
IV.A Working Lands & Land Ownership Patterns cont’d
How do forestland and farmland affect biodiversity?
Any change to native vegetation cover can impact biodiversity by making the habitat more or less suitable for different native species. (1)- Timber harvesting can threaten native biodiversity through
disturbance, native vegetation loss, and habitat fragmentation.- Agriculture can threaten biodiversity through disturbance, native
vegetation loss, water diversion, pesticides, and fertilizers.
Nonetheless, forest- and farmland are likely preferable to paved development as somewhat better habitat and as a buffer for less disturbed areas.
(1) Kristen Blann “Habitat in Agricultural Landscapes: How Much is Enough?” The Biodiversity Partnership. Accessed online June 29, 2006 (http://www.biodiversitypartners.org/pubs/Ag/index.shtml)
IV.A Working Lands & Land Ownership Patterns cont’d
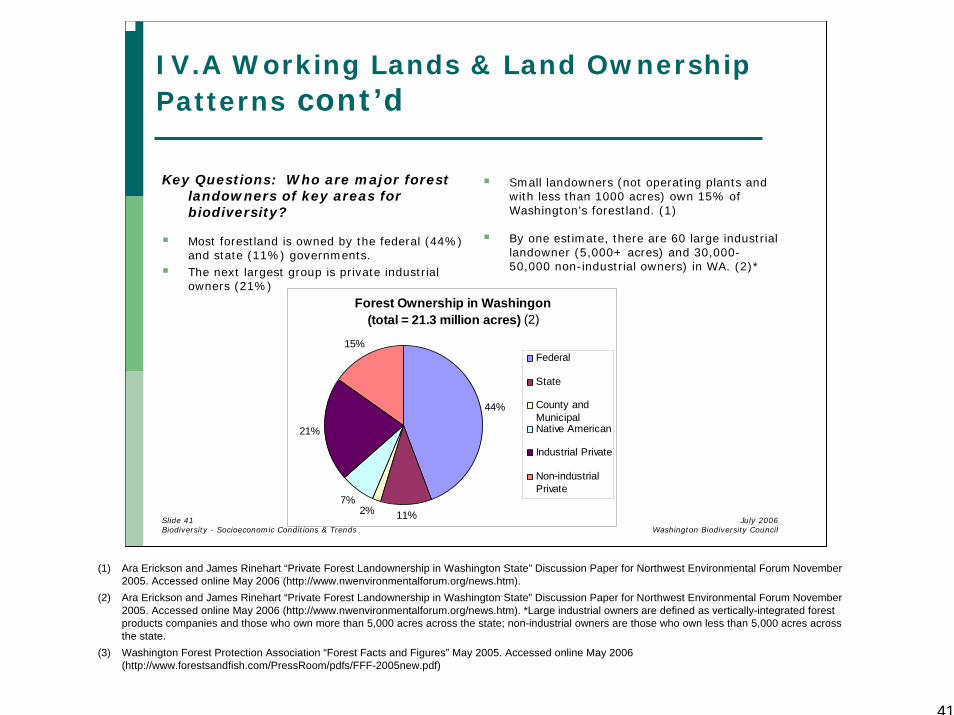
Key Questions: Who are major forest landowners of key areas for biodiversity?
Most forestland is owned by the federal (44%) and state (11%) governments.The next largest group is private industrial owners (21%)
Small landowners (not operating plants and with less than 1000 acres) own 15% of Washington’s forestland. (1)
By one estimate, there are 60 large industrial landowner (5,000+ acres) and 30,000-50,000 non-industrial owners) in WA. (2)*
Forest Ownership in Washingon(total = 21.3 million acres) (2)
44%
11%2%7%
21%
15%Federal
State
County andMunicipalNative American
Industrial Private
Non-industrialPrivate
(1) Ara Erickson and James Rinehart “Private Forest Landownership in Washington State” Discussion Paper for Northwest Environmental Forum November 2005. Accessed online May 2006 (http://www.nwenvironmentalforum.org/news.htm).
(2) Ara Erickson and James Rinehart “Private Forest Landownership in Washington State” Discussion Paper for Northwest Environmental Forum November 2005. Accessed online May 2006 (http://www.nwenvironmentalforum.org/news.htm). *Large industrial owners are defined as vertically-integrated forest products companies and those who own more than 5,000 acres across the state; non-industrial owners are those who own less than 5,000 acres acrossthe state.
(3) Washington Forest Protection Association “Forest Facts and Figures” May 2005. Accessed online May 2006 (http://www.forestsandfish.com/PressRoom/pdfs/FFF-2005new.pdf)
Key Questions: How are forest ownership patterns changing?
Nationally, family foresters are aging and will soon transfer land to the next generation.- More than 60% of current forest owners are older than 55. (1)- 10% of family forest owners plan to transfer land in the next 5 years. (1)- The next generation wants to inherit the family forest, but less than half have
been or want to be involved in forest management. (1)- Barriers to keeping forestland, and thus drivers to conversion, are: (2)
Complex and costly state regulationsHigh real estate pricesSocial pressures—a lack of appreciation for family foresters and how they differ from industry foresters.Inheritance issues—the next generation is less likely to want to become foresters and inheritance taxes can make conversion necessary.
IV.A Working Lands & Land Ownership Patterns cont’d
(1) Catherine Mater “The New Generation of Private Forest Landowners: Brace for Change” The Pinchot Letter Winter 2005 10(2):1-4(2) Personal communication with Kirk Hanson, Natural Resource Program Specialist, Small Forest Landowner Office, WA Dept. of Natural Resources. (May
IV.A Working Lands & Land Ownership Patterns cont’d
Key Questions: How are farm ownership patterns changing?
Farmland is rapidly being converted to development.- Between 1987 and
1997, Washington converted 81,000 acres of prime farmland to other uses. (1)
- The rate of conversion sped up by 30% such that between 1992 and 1997 Washington converted 9,160 acres per year. (1)
(1) American Farmland Trust “Farming On the Edge: Listing of Loss by State” Accessed online May 2006 (http://www.farmland.org/resources/fote/states/allStates.asp)
(2) American Farmland Trust “Farming On the Edge: State Maps” Accessed online May 2006 (http://www.farmland.org/resources/fote/states/default.asp)
IV.A Working Lands & Land Ownership Patterns cont’d
Washington farmers are aging with few young replacements.- Between 1997 and 2002, the
average age of a principal farm operator in Washington increased from 54.7 to 56.6. (1)
- Washington’s farmers are older and aging faster than the national average of 55.3. (1)
- However, national data show that the average age of all farm operators is slightly less—53.2—because second and third operators tend to be younger. But even if each of these operators takes over a farm, they would replace fewer than half of current principals. (2)
WA Principal Farm Operators
02000400060008000
1000012000
Under25
years
25 to34
years
35 to44
years
45 to54
years
55 to59
years
60 to64
years
65 to69
years
70yearsandover
Num
ber o
f Prin
cipa
l Far
m o
pera
tors
- In 2002, 50% of Washington’s principle farm operators were age 55 or older. Only 18% were under age 45. (1)
(1) USDA, National Agricultural Statistics Service “Table 40. Tenure, Number of Operators, Type of Organization, and Principal Operator Characteristics: 2002 and 1997” 2002 Census of Agriculture – State Data. Accessed online June 29, 2006 (http://www.nass.usda.gov/Statistics_by_Subject/Demographics/index.asp)
(2) Rich Allen and Ginger Harris “What We Know About the Demographics of U.S. Farm Operators” USDA, National Agricultural Statistics Service February 25, 2005. Accessed online June 29, 2006 (http://www.nass.usda.gov/census/census02/otheranalysis/demographicpaper022505.htm)
What trends in land use could affect biodiversity?
Proposals to protect private property rights such as Initiative 933 could substantially alter state and local land use protections to preserve public values, including biodiversity.- For example, Oregon’s Measure 37 requires government agencies that
restrict the use of private property, including development restrictions, to pay landowners for financial losses or to waive the restrictions. (1)
- Claims in Oregon currently add up to $3.3 billion and average $2.3 million per claim. (2)
- If state and local governments are unable to pay the claims, it may result in significant limitations on land-use planning.
(1) Secretary of the State of Washington “Elections: Initiatives to the People” Accessed online July 2006 (http://www.secstate.wa.gov/elections/initiatives/people.aspx)
(2) Eric de Place “The 284 Million Dollar Question” Sightline Institute Daily Score (May 12, 2006) Accessed online June 26, 2006 (http://www.sightline.org/daily_score/archive/2006/05/12/the-284-million-dollar-question)
Key Question: How do housing and sprawl affect biodiversity?
Sprawl (1) threatens biodiversity by contributing to native habitat loss, invasive species, and water quantity and quality problems, all major threats to species and ecosystems. (2)- Native habitat loss and fragmentation are the leading threats to biodiversity.
Today pressure comes from conversion to residential and commercial uses, rather than to agricultural as in the past. Native habitat fragmentation especially harms species that have large ranges (such as wolves) or that require interior rather than edge habitat. (2)
- Roads also cause many problems: they fragment native habitat, provide corridors for invasive and exotic species, increase wildlife-automobile collisions, change storm water run-off patterns, and introduce pollution from vehicles. (2,3)
- Compact development, such as apartments or townhouses in mixed-use neighborhoods, have a smaller footprint and require fewer roads per resident than do single-family homes, especially on large, dispersed lots.
- Sprawl consumes 21% more undeveloped land (native habitat loss) and requires building 10% more road-miles (native habitat fragmentation) than does compact development. (4)
- Conversion typically occurs in the lowlands and wetlands, rich areas for biodiversity. (2)
(1) Sprawl is generally characterized by low-density development, a division of land uses (residential from commercial), and branching instead of grid-like street pattern, all leading to automobile dependence. See also: Ewing, Reid “Is Los Angeles-Style Sprawl Desirable?” Journal of American Planning Association. Winter 1997; v.63, n.1; pp.107-126.
(2) Biodiversity Partnership “Habitat Conservation and Sprawl” Accessed online May 2006 (http://www.biodiversitypartners.org/habconser/sprawl.shtml)(3) Defenders of Wildlife “Ecological Effects of Roads on Wildlife” Habitat and Highways Campaign. Accessed online May 2006
(http://www.defenders.org/habitat/highways/new/ecology.html)(4) Burchell RW and Mukherji S. “Conventional Development Versus Managed Growth: The Costs of Sprawl.” American Journal of Public Health. December
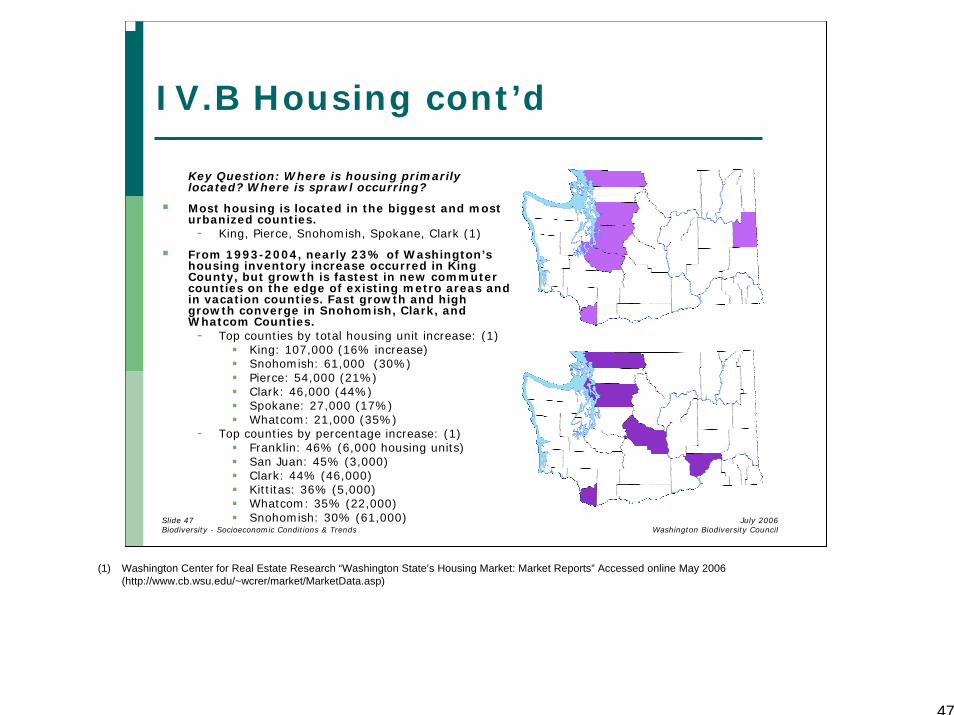
Key Question: Where is housing primarily located? Where is sprawl occurring?
Most housing is located in the biggest and most urbanized counties.- King, Pierce, Snohomish, Spokane, Clark (1)
From 1993-2004, nearly 23% of Washington’s housing inventory increase occurred in King County, but growth is fastest in new commuter counties on the edge of existing metro areas and in vacation counties. Fast growth and high growth converge in Snohomish, Clark, and Whatcom Counties.- Top counties by total housing unit increase: (1)
(1) Washington Center for Real Estate Research “Washington State’s Housing Market: Market Reports” Accessed online May 2006 (http://www.cb.wsu.edu/~wcrer/market/MarketData.asp)
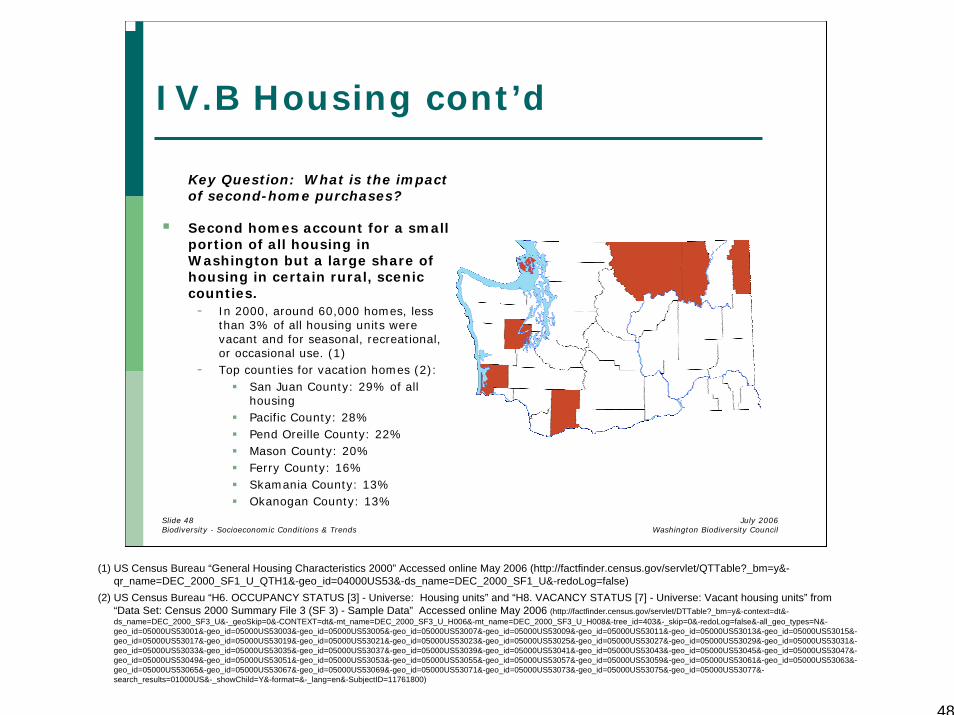
Key Question: What is the impact of second-home purchases?
Second homes account for a small portion of all housing in Washington but a large share of housing in certain rural, scenic counties.- In 2000, around 60,000 homes, less
than 3% of all housing units were vacant and for seasonal, recreational, or occasional use. (1)
- Top counties for vacation homes (2): San Juan County: 29% of all housingPacific County: 28%Pend Oreille County: 22%Mason County: 20%Ferry County: 16%Skamania County: 13%Okanogan County: 13%
(1) US Census Bureau “General Housing Characteristics 2000” Accessed online May 2006 (http://factfinder.census.gov/servlet/QTTable?_bm=y&-qr_name=DEC_2000_SF1_U_QTH1&-geo_id=04000US53&-ds_name=DEC_2000_SF1_U&-redoLog=false)
(2) US Census Bureau “H6. OCCUPANCY STATUS [3] - Universe: Housing units” and “H8. VACANCY STATUS [7] - Universe: Vacant housing units” from “Data Set: Census 2000 Summary File 3 (SF 3) - Sample Data” Accessed online May 2006 (http://factfinder.census.gov/servlet/DTTable?_bm=y&-context=dt&-ds_name=DEC_2000_SF3_U&-_geoSkip=0&-CONTEXT=dt&-mt_name=DEC_2000_SF3_U_H006&-mt_name=DEC_2000_SF3_U_H008&-tree_id=403&-_skip=0&-redoLog=false&-all_geo_types=N&-geo_id=05000US53001&-geo_id=05000US53003&-geo_id=05000US53005&-geo_id=05000US53007&-geo_id=05000US53009&-geo_id=05000US53011&-geo_id=05000US53013&-geo_id=05000US53015&-geo_id=05000US53017&-geo_id=05000US53019&-geo_id=05000US53021&-geo_id=05000US53023&-geo_id=05000US53025&-geo_id=05000US53027&-geo_id=05000US53029&-geo_id=05000US53031&-geo_id=05000US53033&-geo_id=05000US53035&-geo_id=05000US53037&-geo_id=05000US53039&-geo_id=05000US53041&-geo_id=05000US53043&-geo_id=05000US53045&-geo_id=05000US53047&-geo_id=05000US53049&-geo_id=05000US53051&-geo_id=05000US53053&-geo_id=05000US53055&-geo_id=05000US53057&-geo_id=05000US53059&-geo_id=05000US53061&-geo_id=05000US53063&-geo_id=05000US53065&-geo_id=05000US53067&-geo_id=05000US53069&-geo_id=05000US53071&-geo_id=05000US53073&-geo_id=05000US53075&-geo_id=05000US53077&-search_results=01000US&-_showChild=Y&-format=&-_lang=en&-SubjectID=11761800)
Key Question: How will climate change affect Washington?
Washington will have warmer weather overall and a different precipitation pattern. These changes will stress ecosystems and increase conflicts around water resources, such as maintaining in-stream flows for salmon and other wildlife. (1)- Spring will start sooner, extending the growing season.- Summers will be warmer and drier with more intense droughts.- Winters will be warmer and wetter, with fewer frosts and less
mountain snow pack.
(1) Climate Impacts Group. “Forest Biodiversity” fact sheet. University of Washington. June, 2004. Accessed online May 2006 (http://cses.washington.edu/db/pdf/cigforestfsall495.pdf)
Key Question: How might climate change affect biodiversity in Washington?
The geographic range and survival of both ecosystems and individual species will be impacted.- Shrubland/grassland, maritime forests, and alpine vegetation are
likely to decrease. (1)- Climate change will affect individual species differently, potentially
creating communities with a new mix of species. (2)- Species already rare or at the edge of their climate range are most at
risk. (2)- A more intense summer drought may increase the frequency and
severity of forest fires and insect outbreaks. (2)- Warmer winters may allow frost-sensitive species from the Southwest
to expand into eastern Washington. (2)
(1) Ronald P. Neilson et al. “The Potential Impacts of Climate Change on Washington Ecosystems” (Draft for conference: Global Warming in the Pacific Northwest: Consequences & Choices June 8 & 9, 2006 -- Seattle, WA). Received from author May 2006.
(2) Climate Impacts Group. “Forest Biodiversity” fact sheet. University of Washington. June, 2004. Accessed online May 2006 (http://cses.washington.edu/db/pdf/cigforestfsall495.pdf)
A. Family forests are primarily located in the Puget Trough, Northwest Coast, and Okanogan ecoregions in lowlands and along rivers, prime habitat for biodiversity.Family foresters face strong pressure to convert to residential/commercial uses because of high residential prices, complex regulations and paperwork, a lack of appreciation for their contribution to stewardship, and inheritance issues.
B. High quality farmlands in the Puget Trough and parts of the Columbia Plateau and Okanogan ecoregions, especially around metropolitan areas, are rapidly being lost to development. Family farmers face similar issues as family foresters.
C. Sprawl threatens biodiversity by contributing to native habitat loss, invasive species, and water quantity and quality problems—all major threats to species and ecosystems.
D. Most housing is located in the most urbanized counties and growth is fastest at the edge of existing metropolitan areas, especially in the Puget Trough ecoregion and the Cascades, threatening biodiversity in areas that have little undisturbed habitat remaining.
E. Second homes pose added threats to biodiversity in rural counties. They make up a significant portion of all housing units in certain rural counties, especially in the Okanogan and Northwest Coast ecoregions.
F. Climate change will likely pose significant threats Washington’s biodiversity by changing entire ecosystems, increasing the influx of exotic species, and escalating conflicts over water in which wildlife such as salmon have historically been the loser.
A. Public Perceptions of Biodiversity & Related Environmental Quality Issues
What does biodiversity mean to people? Where does this issue stand relative to others? Do they see it as a problem?What values do people respond to? What motivates people to action?What education is needed?What is the current value that citizens place on biodiversity? How do you make biodiversity “worth something”?How do small private landowners view these issues?
B. Willingness to Pay for Biodiversity & Related Environmental Quality Issues
What environmental benefits and conservation projects are people willing to pay for?How much are people willing to pay for biodiversity, habitat conservation, or other environmental benefits?
C. Attitudes by GroupHow do demographic or cultural differences influence perceptions of biodiversity?How does educational attainment influence perceptions of biodiversity?How do age and gender influence perceptions of biodiversity?How do religious values influence perceptions of biodiversity?
V.A Public Perceptions of Biodiversity & Related Environmental Quality Issues
Key Question: What does biodiversity mean to people? Where does this issue stand relative to others? Do they see it as a problem?
People don’t know what biodiversity means.- In a nationwide survey, 41% of respondents couldn’t recognize the definition of biodiversity.
(1)
Biodiversity is not a top issue; however, many people do care about related environmental concerns.- In statewide surveys since 1995, no more than 6% of voters have rated environmental issues
as their top issue. (2)- In the Puget Sound region, the environment is not a top issue. (2)
31% say transportation/traffic is the top concern8% say environmental issues8% say economy/jobs
- Biodiversity is also not a top concern among environmental issues in Puget Sound. (2)22% say water quality18% say urban growth
- Nationally, pollution is the top environmental concern, somewhat above extinction of plant and animal species. Survey participants report that they worry “a great deal” about (3):
Pollution of drinking water (54%)Contamination of soil and water by toxic waste (52%)Pollution of rivers, lakes, and reservoirs (51%)The loss of tropical rain forests (40%)Extinction of plant and animal species (34%)
(1) Kevin Coyle, Environmental Literacy in America, National Environmental Education and Training Foundation (September 2005). Accessed online May 2006 (http://www.resourcesaver.org/file/toolmanager/CustomO16C45F65913.pdf)
(2) Cited in Bob Moore and Jill Dehlin “Secondary Research Review with Executive Summary” Memorandum from Moore Information to Puget Sound Partnership. April 18, 2006.
(3) Joseph Carroll “Water Pollution Tops Americans’ Environmental Concerns” Gallup News Service Poll in March 13-16, 2006, released April 21, 2006.
V.A Public Perceptions of Biodiversity & Related Environmental Quality Issues cont’d
Key Question: What values do people respond to? What motivates people to action?
People care most about water quality.- A statewide survey found that voters ranked projects protecting water quality as
more important than projects preserving habitat and wetlands. (1)
People are motivated by the health of their children, a legacy for future generations, and spiritual values.- A nationwide survey in 1996 found that the most important reasons to protect
the environment are: (1)A healthy, pleasing environment for your family: 79%For future generations: 71%Respecting nature as God’s work: 67%
- When the survey participants were forced to chose the single most important reason, most chose “for future generations”. (1)
(1) Cited in Bob Moore and Jill Dehlin “Secondary Research Review with Executive Summary” Memorandum from Moore Information to Puget Sound Partnership. April 18, 2006.
V.A Public Perceptions of Biodiversity & Related Environmental Quality Issues cont’d
Key Question: What education is needed?
Most Americans don’t know what biodiversity means, but they do recognize habitat loss as its major threat.- In 2000, only 41% of Americans recognized the definition of
biodiversity on a multiple choice quiz. (1)- By contrast, 74% knew the most common reason for extinction of
animal and plant species was habitat loss. (1)- These numbers may be slightly higher in Washington because the
West scores higher on average than other regions.
(1) Kevin Coyle, Environmental Literacy in America, National Environmental Education and Training Foundation (September 2005). Accessed online May 2006 (http://www.resourcesaver.org/file/toolmanager/CustomO16C45F65913.pdf)
V.A Public Perceptions of Biodiversity & Related Environmental Quality Issues cont’d
Key Question: What is the current value that citizens place on biodiversity? How do you make biodiversity “worth something”?
Significant research exists on why people want to protect the environment in general, but our review found little information on why people want to preserve biodiversity specifically.- People seem to value the aesthetics and other benefits (clean water,
places to hike) that accompany biodiversity, rather than biodiversity itself. (1)
- Tying biodiversity to other things they value, such as a healthy forest ecosystem that preserves water quality and provides recreationalopportunities, could make biodiversity worth more to them.
(1) Cited in Bob Moore and Jill Dehlin “Secondary Research Review with Executive Summary” Memorandum from Moore Information to Puget Sound Partnership. April 18, 2006.
V.A Public Perceptions of Biodiversity & Related Environmental Quality Issues cont’d
Key Question: How do family foresters view these issues?
Family foresters in WA see themselves as stewards of the land and manage for personal values as well as for timber production- Survey respondents from WA in
2001 said that they place medium to high value on more than just the production of timber. (1)
- In the same survey, 71% said they are willing to work with others to protect threatened and endangered species while 87% agree that we should focus on ecosystems rather than individual species. (1)
- These findings corroborate previous surveys in Washington finding that family foresters manage for more than just timber income. (2)
How Family Foresters Value their Land (1)
89%
78%
75%
68%
56%
52%
28%
0% 20% 40% 60% 80% 100%
Scenic/aesthetic beauty
Protection of nature
Land investment
Legacy for children
Production of timber
Recreation other than hunting/fishing
Hunting and fishing
Family Foresters Land Management Objectives (2)
93%
85%
83%
78%
72%
15%
0% 20% 40% 60% 80% 100%
Personal satisfaction
Legacy for children
Scenic beauty/aesthetics
Income from timber
To protect fish and wildlife
Commercial development
(1) Small Forest Landowner Office “ 2001 Statewide Survey of Small Forest Landowners” Washington Department of Natural Resources. Olympia, WA.(2) Lien, K. 1999. “Surveys of NIPFs Show Changes in Activity” Rural Technology Initiative, University of Washington College of Forest Resources. Seattle,
V.A Public Perceptions of Biodiversity & Related Environmental Quality Issues cont’d
Family foresters report that they try to be good stewards of theland, including managing for biodiversity, but they face severalbarriers. (1)- Family foresters see themselves as managing their land intensively and spending
a lot of time “on the ground”.- They reportedly value “diversity” but define it differently
Species diversity includes non-native species (e.g., Douglas fir in an historically oak ecosystem)Structural diversity preferences differ among landowners—some want variety (big trees, brush), some want mainly open space for deer.
- Management depends on their view of human relationships with natureSome manage intensively for a balance of timber and conservation(introducing non-natives for more “diversity”)Other leave nature alone (even if invasive species take over)
- They do not generally consider their forest in the context of the greater watershed/ecosystem
- They do generally manage for the long term—50 years ahead- They do not generally like extra paperwork and the loss of autonomy and privacy
that goes with public conservation programs, but they may be willing to practice conservation on their own.
(1) A. Paige Fischer and John Bliss “Mental and Biophysical Terrains of Biodiversity Conservation of Oak Woodland on Family Forests” in David M Baumgartner Proceedings of Human Dimensions of Family, Farm, and Community Forestry International Symposium, March 29 – April 1, 2004. WSU, Pullman, WA. WSU Extension MISC0526.
V.A Public Perceptions of Biodiversity & Related Environmental Quality Issues cont’d
How do industrial foresters view these issues?
In 1997, private forest landowners in Washington collaborated with tribes, government resource agencies, the Governor’s office, and environmental groups to create the Forest and Fish Law. Timber is the first sector to collaborate on a plan to protect fish and water quality.
In addition, some forest landowners, likely industrial, voluntarily participate in the Sustainable Forestry Initiative. In Washington, 4.8 million acres are currently enrolled. (1) Participants agree to adopt a written policy to achieve sustainable principles including:- Practicing land stewardship that integrates timber harvesting with conservation
of biological diversity, wildlife and aquatic habitat- Managing land of special biological significance “to promote a diversity of wildlife
habitats, forest types, and ecological or natural community types” (2)
(1) Personal communication from Jason Metnick, Manager—Sustainable Forestry and Forest Policy, American Forest & Paper Association. July 18, 2006.(2) Sustainable Forestry Initiative Program “Sustainable Forestry Initiative® Standard (SFIS): 2005–2009 Edition”
V.A Public Perceptions of Biodiversity & Related Environmental Quality Issues cont’d
Key Question: How do family farmers view these issues?
Farmers also report that they see themselves as stewards of the land who are threatened by development.- 54% of small farmers feel that their contribution to land stewardship is not
appreciated by the public. (1)- Interestingly, while 66% of farmers agree that local governments should restrict
development in key agricultural areas and 44% say that land restrictions are needed to protect against urban sprawl:(1)
81% agree that government should compensate farmers if they are restricted from selling their land74% agree that farmers should be paid for participating in wildlife programs
Ranchers understand and value a diversity of species, even if they don’t use that term.- Ranchers recognize that a healthy landscape will provide better forage for their
livestock than an overgrazed landscape.- Their interest in biodiversity stems more from economics than from an abstract
environmental ethic, so they may not define it in terms of native species. (2)
(1) WSU Center for Sustaining Agriculture and Natural Resources “Washington Farmer Views on Environmental Policy” CSANR Research Brief 2005-04-09. Accessed online May 2006 (http://csanr.wsu.edu/InfoSources/EnvironmentalPolicy1.pdf. See also (http://www.crs.wsu.edu/outreach/rj/agsurvey)
(2) Personal communication with Britt Dudek, District Manager, Foster Creek Conservation District. July 17, 2006.
V.B Willingness to Pay for Biodiversity & Related Environmental Quality Issues
Key Question: What environmental benefits and conservation projects are people willing to pay for?
People are more willing to pay for protecting water quality than for preserving habitat- A recent statewide survey found that more voters rated as very
important projects that protect water quality than preserving habitat and wetlands. (1)
- A recent study in the Oregon Coast Range found people most willing to pay for preserving and increasing old growth forests. They found a much lower preference for increasing biodiversity reserve lands.Willingness to pay for endangered species and salmon habitat wasintermediate. (2)
(1) Cited in Bob Moore and Jill Dehlin “Secondary Research Review with Executive Summary” Memorandum from Moore Information to Puget Sound Partnership. April 18, 2006.
(2) Brian Garber-Yonts et al “Public Values for Biodiversity Conservation Policies in the Oregon Coast Range” Forest Science (2004) 50(5):589-602.
V.B Willingness to Pay for Biodiversity & Related Environmental Quality Issues cont’d
Key Question: How much are people willing to pay for biodiversity, habitat conservation, or other environmental benefits?
A 1997 study in Washington found urban and rural residents both willing to pay for biodiversity. (1)- Urban households were willing to pay $450 per year to restore forest
biodiversity to 75% of pre-European levels. Rural residents were willing to pay $225.
- Urban and rural residents displayed a similar willingness to accept job losses for increased biodiversity and forest aesthetics. They would accept 5,000 fewer jobs for $200 worth of biodiversity benefits.
(1) Center for International Trade in Forest Products “Cost and Compromise: Determining the Public’s Willingness to Pay for Values Received from Forests”Fact Sheet #35. February 1999. Accessed online May 2006 (http://www.cintrafor.org/RESEARCH_TAB/links/Fs/FS35.htm). See also: Weihuan Xu et al. “Valuing Biodiversity, Aesthetics, and Job Losses Associated with Ecosystem Management Using Stated Preferences” Forest Science April 2003 49(2):247-257.
Key Question: How do demographic or cultural differences influence perceptions of biodiversity?
Urban residents are more willing to pay for biodiversity, but not all rural residents are alike. (1)- A recent study in Washington found that urban residents are willing to
pay more for biodiversity at all levels surveyed than are rural residents.
- However, rural residents are not homogenous. - Residents in timber counties are willing to pay more than residents in
non-timber rural counties.
No studies were found that considered how perceptions of biodiversity differ among long-time and more recent residents of Washington.
(1) Weihuan Xu et al. “Valuing Biodiversity, Aesthetics, and Job Loses Associated with Ecosystem Management Using Stated Preferences” Forest ScienceApril 2003 49(2):247-257.
Key Question: How does educational attainment influence perceptions of biodiversity?
People with higher educational attainment are more likely to have basic environmental knowledge, which tends to lead to more pro-environment behavior.- Nationally, people with more education scored better on a quiz of basic
environmental knowledge. (1)High school or less: 48% correctSome college: 63% correctCollege grad or more: 72% correct
- Nationally, environmentally knowledgeable people are more likely to engage in pro-environment behavior. (1)
10% more likely to save energy at home50% more likely to recycle50% more likely to avoid using chemicals in yard care
- In Washington, 90% of residents age 25 and older have a high school degree or higher and 30% have a bachelors degree or higher, compared to 85% and 28% nationally. (2)
(1) Kevin Coyle, Environmental Literacy in America, National Environmental Education and Training Foundation (September 2005). Accessed online May 2006 (http://www.resourcesaver.org/file/toolmanager/CustomO16C45F65913.pdf)
(2) US Census Bureau “Educational Attainment in the United States 2004” Accessed online May 2006 (http://www.census.gov/population/www/socdemo/education/cps2004.html)
Key Question: How do age and gender influence perceptions of biodiversity?
Women are more likely to want more environmental protection than are men. (1)- Nationally in 2000, men were more likely than women to think
environmental laws had gone too far (20% vs. 11%), while women were more likely than men to think they had not gone far enough (49% vs. 42%)
Younger Americans are more likely to want more environmental protection. (1)- In 2000, older Americans (especially 65+) were more likely to think
environmental laws had gone too far, while younger Americans were more likely to think they had not gone far enough.
(1) Kevin Coyle, Environmental Literacy in America, National Environmental Education and Training Foundation (September 2005). Accessed online May 2006 (http://www.resourcesaver.org/file/toolmanager/CustomO16C45F65913.pdf)
Key Question: How do religious values influence perceptions of biodiversity?
Differing religious views may influence perceptions of biodiversity.- Groups such as the Evangelical Environmental Network and the
National Association of Evangelicals (30 million members) promote Creation Care—protecting the environment as God’s creation. (1,2)
- Some groups view protecting the environment as being of no practical value because the Rapture as imminent. (2)
- Others, such as the Wise-Use movement, see the earth as man’s dominion to use as it serves him.
(1) National Council of Churches of Christ, Eco-Justice Program: Biodiversity. Accessed online May 2006 (http://www.nccecojustice.org/biohome.htm)(2) Jones, Melissa “Evangelicals and ’Creation Care’” National Catholic Reporter June 17, 2006 41(32):4-6
A. Most people don’t see biodiversity as their top environmental concern, but they do care about related issues, such as water quality andrecreation. Among environmental issues, water quality and urban growth aremost important to Puget Sound residents.
B. Nationally, people are motivated to protect the environment by the health of their families, leaving a legacy for future generations, and spiritual values.
C. Many Washingtonians, both urban and rural, report that they are willing to pay for forest biodiversity in both monetary costs and reduced timber employment.
D. Small private landowners often view themselves as stewards of the landand desire support and recognition for their efforts.
E. Women and younger people are more likely to want more environmental protection than are men. And people with higher educational attainment are more likely to have basic environmental knowledge, which tends to lead to more pro-environment behavior.
F. The rise of the evangelical environmental movement could create new partnership opportunities.