35
SOCIOECONOMIC FACTORS AND THE INCIDENCE OF FIRE Federal Emergency Management Agency United States Fire Administration National Fire Data Center FA 170 / June 1997
SOCIOECONOMIC FACTORS AND
THE INCIDENCE OF FIRE
Federal Emergency Management AgencyUnited States Fire Administration
National Fire Data Center
FA 170 / June 1997
SOCIOECONOMIC FACTORS AND
THE INCIDENCE OF FIRE
June, 1997
Federal Emergency Management AgencyUnited States Fire Administration
National Fire Data Center
FA 170 / June 1997
This publication was produced under contract EMW-95-C-4717 by TriData Corporation for the United StatesFire Administration, Federal Emergency Management Agency. Any information, findings, conclusions, orrecommendations expressed in this publication do not necessarily reflect the views of the Federal EmergencyManagement Agency or the United States Fire administration.

TABLE OF CONTENTS
INTRODUCTION ............................................................................................... 1
Why Study Socioeconomic Factors of Fire Risk?................................................. 1Existing Literature................................................................................................. 2
Part I. Socioeconomic Indicators of Increased Fires Rates................... 2
Part II. How Income Level Affects Fire Risk in Urban Areas ................ 10
Socioeconomic Factors at the Level of the Neighborhood ................................... 10Vacant and Abandoned Buildings................................................................ 11
Neighborhood Decline.................................................................................. 11 Arson ........................................................................................................... 12Socioeconomic Factors at the Level of the Household ........................................ 13 Housing Quality .......................................................................................... 13
Smoke Detectors .................................................................................... 15 Housing Affordability ................................................................................. 17 Housing Structure ........................................................................................ 18
Single Parent Households and the Presence of Children....................... 18Fire Risks of Elderly Persons ................................................................ 21Overcrowded Households....................................................................... 21
Socioeconomic Factors at the Individual Level .................................................... 22 Careless Smoking and Alcohol and Drug Abuse ......................................... 22 Low Levels of Education ............................................................................. 23 Housing Tenure and Fire Risk ..................................................................... 23 Social Pathology and Fire Risk .................................................................... 24
Part III. How Poverty Affects Fire Risk in Rural Areas ........................... 24
Part IV. Why Study Socioeconomic Factors of Fire Risk? ....................... 25
Part V. Future Research ............................................................................. 26
REFERENCES .................................................................................................... 29

1
SOCIOECONOMIC FACTORS AND THE INCIDENCE OF FIRE
INTRODUCTIONOver the past 100 years, the risk of fire in America’s homes has decreased dramatically.
Myriad changes have helped make us safer, including the adoption and enforcement of
building codes, changes in the way we heat our homes and cook food, and widespread use
of smoke detectors. Still, each year in the U.S. there are over 400,000 fires in residential
structures, and these fire kill and injure many people. Between 1983 and 1990, an average
of 74 percent of all fire deaths occurred in residential fires, as did an average of 66 percent
of all fire injuries.1 However, research indicates that the risk of a fire in the home is not
the same for everyone. Climate, building stock characteristics, and human factors
importantly influence fire rates. This working paper concentrates on the last two
categories, building stock characteristics and human factors. The intent is to identify
socioeconomic factors that influence the complex and varied relationships between
buildings, humans, and the occurrence of residential fires.
Why Study Socioeconomic Factors of Fire Risk?
Why is it necessary to study socioeconomic factors related to increased fire risk? The most
important reason is that socioeconomic factors are among the best known predictors of fire
rates at the neighborhood level. While structural factors of buildings have an effect on the
incidence of fire, of equal or greater importance today is how humans use and maintain
those buildings. Year after year, the primary causes of residential structure fires include
cooking, heating, incendiary or suspicious causes, smoking, and other causes directly
related to human activities. Together these causes accounted for over 66 percent of all
residential fires in 1994.2
1 United States Fire Administration. Fire in the United States, 1983 - 1990. Washington, D.C.: Federal
Emergency Management Agency, United States Fire Administration, 1990, p. 33 and pp. 51-52.2 National Fire Incident Reporting System database.

2
To explore how socioeconomic factors are related to fire rates, this paper is divided into
five sections. The first section presents findings from research aimed at identifying the
socioeconomic characteristics most closely related to increased fire rates. In the second
section, the nature of the relationships between socioeconomic factors and differential fire
rates is explored. The third section briefly addresses fire risks in rural locations, while the
fourth and fifth sections review the importance of studying socioeconomic factors and
suggest topics for future research, respectively. A comprehensive review of all the
literature on this subject is beyond the scope of this working paper, but a supplementary
bibliography is included to assist other researchers.
Existing Literature
Most of the seminal studies relating socioeconomic characteristics to fire rates were
conducted and published in the late 1970s. Since that time, the limited amount of research
that has been conducted is contained mostly in unpublished doctoral dissertations and
master’s theses, restricting its availability to other researchers and policy makers. While
the studies published in the late 1970s greatly advanced our understanding of the
socioeconomic characteristics most closely associated with increased fire risk,
contemporary published research is necessary to verify the continued relevance of these
relationships. Similarly, population shifts have changed the very communities researchers
investigated, suggesting that older studies need to be replicated to ascertain the effects of
these changes. Regardless of these shortcomings, the existing literature points to specific
socioeconomic characteristics that should be considered in the design of future research
studies. The section below cites specific studies identifying those socioeconomic
characteristics most commonly linked to higher fire rates.
Part I. Socioeconomic Indicators of Increased Fire Rates
Virtually every study of socioeconomic characteristics has shown that lower levels of
income are either directly or indirectly tied to an increased risk of fire. An early study
attempting to quantify this relationship was published by Schaenman, Hall, Schainblatt,
Swartz, and Karter in 1977. This work had several important findings. The first was that
inter-city comparisons of fire rates were not useful. The authors found that significant
variations in fire rates in given cities from year to year made it untenable to use
socioeconomic variables to explain variations in fire rates across cities. For this reason,
Schaenman et al. refocused their efforts on studying intra-city variations in fire rates,

3
using census tracts as their unit of analysis. They investigated six separate sets of census
data. These included data for four cities (Charlotte, NC, St. Petersburg, FL, San Diego,
CA, and Seattle, WA), one county (Fairfax County, VA), and a combination set with data
from three of the cities and Fairfax County. The authors found that three variables were
most effective in explaining variations in fire rates. These were parental presence, or the
percentage of children under the age of 18 living with both parents; poverty, defined as the
percentage of persons whose incomes fell below the poverty line; and under-education, or
the percentage of persons over the age of 25 who had fewer than eight years of schooling.
Each of these variables tested alone explained an average of over 39 percent of the
variation in fire rates between census tracts for each of the cities, for Fairfax County, and
for the combination data set.3
While these three variables were important in explaining variation in fire rates, seven other
variables explained some of the variation, but not as much. These were good education, or
the percent of persons over the age of 25 who had at least a high school education; race, or
percentage black; home ownership, or percentage of year-round housing units that were
owner-occupied; adequate income, or the percentage of families with annual incomes
greater than $15,000; housing crowdedness, or the percentage of year-round housing units
with more than one persons per room; and two interaction variables, one for education and
race and one for race and poverty. Each of these variables accounted for at least 20 percent
of the variation in fire rates between census tracts in each of the six data sets.4
Two other variables explained some of the variation in fire rates in only some of the tests.
Housing vacancy, or the percentage of year-round dwelling units that were vacant, was a
moderately strong predictor for Seattle, St. Petersburg, and the combination data set. The
age of housing structures, or the percentage of housing units in structures that were
constructed prior to 1940, explained a moderate amount of fire rate variation in Fairfax
County and St. Petersburg only.5 This variation from city to city in the explanatory power
of different socioeconomic variables demonstrates the sensitivity of these sorts of analyses
to local conditions. It also reminds readers to be particularly cautious in interpreting data
3 Philip Schaenman, John R. Hall, Jr., Alfred H. Schainblatt, Joseph A. Swartz, and Michael J. Karter.
Procedures for Improving the Measurement of Local Fire Protection Effectiveness. Boston: National Fire
Protection Association, 1977, p. 54 and pp. 57-58.4 Schaenman, et al., 1977, pp. 57-59.5 Schaenman, et al., 1977, p. 59.
4
from studies that use socioeconomic variables to explain variations in city-wide fire rates.
Wide variations in socioeconomic indicators and fire rates at the census tract level are
obscured by city-level analyses, with the result that city-level studies are difficult to
interpret and comparisons between different cities can be made only with caution.
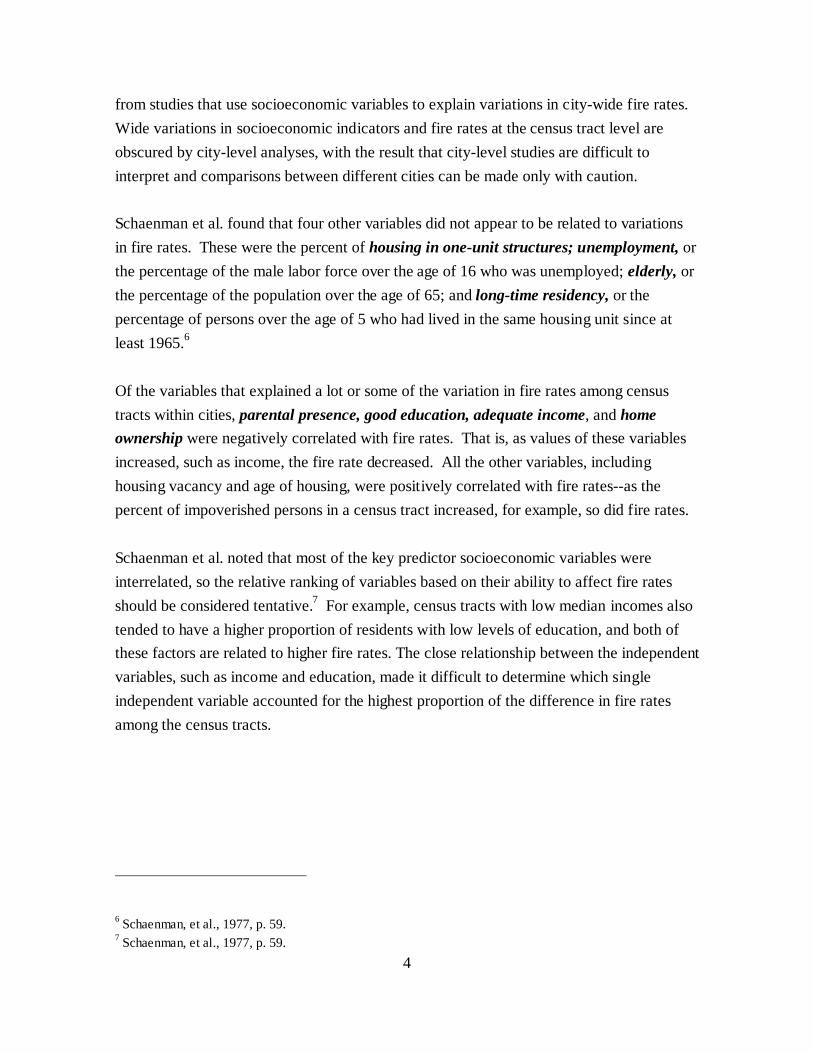
Schaenman et al. found that four other variables did not appear to be related to variations
in fire rates. These were the percent of housing in one-unit structures; unemployment, or
the percentage of the male labor force over the age of 16 who was unemployed; elderly, or
the percentage of the population over the age of 65; and long-time residency, or the
percentage of persons over the age of 5 who had lived in the same housing unit since at
least 1965.6
Of the variables that explained a lot or some of the variation in fire rates among census
tracts within cities, parental presence, good education, adequate income, and home
ownership were negatively correlated with fire rates. That is, as values of these variables
increased, such as income, the fire rate decreased. All the other variables, including
housing vacancy and age of housing, were positively correlated with fire rates--as the
percent of impoverished persons in a census tract increased, for example, so did fire rates.
Schaenman et al. noted that most of the key predictor socioeconomic variables were
interrelated, so the relative ranking of variables based on their ability to affect fire rates
should be considered tentative.7 For example, census tracts with low median incomes also
tended to have a higher proportion of residents with low levels of education, and both of
these factors are related to higher fire rates. The close relationship between the independent
variables, such as income and education, made it difficult to determine which single
independent variable accounted for the highest proportion of the difference in fire rates
among the census tracts.
6 Schaenman, et al., 1977, p. 59.7 Schaenman, et al., 1977, p. 59.

5
Another study of intra-city variations in fire rates was published in 1978 by Karter and
Donner. For five cities, they presented data on the socioeconomic characteristic and the
building characteristic they found to be most highly related to increased fire rates. After
identifying the relevant characteristics, they used them to divide census tracts within each
city into “low fire risk” and “high fire risk” categories and then calculated mean fire rates
for each group. The difference in these average fire rates represented the increased fire
risk for the group of high risk census tracts. The results for the five cities are summarized
in Table 1.8
Table 1.9
City SocioeconomicCharacteristic
Difference in Mean FireRate
BuildingCharacteristic
Difference in Mean FireRate
Syracuse, NY Family stabilitya Average fire rates werealmost 4 times as high intracts with low familystability
Crowdednessb Average fire rates werealmost 4 times as high intracts ranked high oncrowding
Newark, NJ Povertyc Average fire rates werealmost 2 times as high intracts with high levels ofpoverty
Ownershipd Average fire rates were morethan 2 times as high in tractswith lower home ownershiprates
Phoenix, AZ Poverty Average fire rates werealmost 3 times as high intracts with high levels ofpoverty
Crowdedness Average fire rates were morethan 2 times as high in tractsranked high on crowding
Toledo, OH Poverty Average fire rates weremore than 2 times as highin tracts with high levelsof poverty
Ownership Average fire rates were morethan 2 times as high in tractswith lower home ownershiprates
Kansas City, MO Family stability Average fire rates werealmost 2 times as high intracts with low familystability
Vacancye Average fire rates werealmost 2 times as high intracts with high vacancyrates
a percentage of person who are under 18 and living with both parents (Schaenman et al. call this variable“parental presence”)b percentage of year-round housing units with at least 1.01 persons per roomc percentage of persons below the poverty leveld percentage of year-round housing units that are owner-occupiede percentage of year-round housing units that are vacant
8 Michael Karter, Jr. and Allan Donner. “The Effect of Demographics on Fire Rates.” Fire Journal. Vol.
72, no. 1 (January) 1978, p. 53.9 Karter and Donner, 1978, pp. 53-65.

6
As indicated in Table 1, the socioeconomic factors related to fire rates are sensitive to each
city’s unique conditions, and these can be traced back through the history of a city’s
populations and its buildings. In particular, cities are sensitive to population shifts such as
the movements of large numbers of people into and out of a city. In this sense the
continued movement of middle- and upper-income residents out of cities to the suburbs
and the increasing isolation of the poorest residents in some inner-city neighborhoods has
important effects on the socioeconomic characteristics of cities and urban housing stocks.10
Though the housing stock appears to be “given” at any moment in time, the quality of any
one housing unit is tied to the fortunes of those who occupy it and, particularly in the case
of rental properties, continued maintenance by owners. This interplay of population and
housing stocks in turn has profound implications for fire rates in different census tracts, as
indicated by the studies above.
To learn more about higher fire rates in low income areas of large cities, Gunther (1981)
studied fire-cause patterns in Toledo, Ohio neighborhoods. He divided Toledo’s census
tracks into five groups with different income and race characteristics. Using regression
analysis, Gunther was able to show that there was a strong negative relationship between
income and fire rates. As income rose, there was a significant drop in the fire rate, though
this rate of decline slowed in the two census track groups with the highest median incomes
where fire rates were low overall. Similarly there were strong negative relationships
between income and four out of the seven fire causes he investigated, specifically fires
with incendiary/suspicious, smoking, cooking, or children playing origins. For each of
these causes regression analysis suggested that the census tract groups with lower median
incomes had markedly higher fire rate. Importantly, each of these causes is generally tied
directly to human actions, rather than being caused by mechanical malfunction. This
suggests that public education is the tool most readily available to help reduce the
occurrence of these types of fires.11
10 Harvard University Joint Center for Housing Studies. 1996. Into the 21st Century: The State of theNation’s Housing. Cambridge, MA: The Joint Center for Housing Studies, 1996, pp. 2-3.11 Paul Gunther. 1981. “Fire-Cause Patterns for Different Socioeconomic Neighborhoods in Toledo, OH.”Fire Journal. Vol. 75, no. 3 (May), pp. 54-58.

7
The other three fire causes Gunther studied were fires caused by heating sources, electrical
distribution within a housing unit, and appliances. He found that there was no strong
income effect on fire rates within these categories of fire cause. In fact, there was no
significant difference at all between the five income groups for appliance fires, and for
heating fires, the two groups with the lowest median incomes had fire rates lower than the
next highest income group. Gunther attributed this latter finding to the likelihood that a
greater percentage of families living in the lowest two income groups lived in private
apartments or public housing units where central heating systems were professionally
installed and maintained, thus reducing the risk of fire. Electrical distribution revealed a
slight but not statistically significant relationship to income.12
While the effects of income on fire rates were relatively easy to discern in the data, the
effects of race were less so. Gunther found that the overall incidence of fires from all
causes did not appear to be related to race after the effects of income were accounted for.
For individual causes of fires, Gunther maintained that the data were less clear, but he did
not provide any evidence showing a significant effect for race apart from income.13
Recent work by Jennings (1996) represents an attempt to conceptualize the complex
interrelationships between environmental, structural, and human factors as they relate to
fire. Greater understanding of the role played by socioeconomic factors is critical for at
least two reasons. First, they have been shown, as reported above, to be powerful
predictors of the incidence of fire in different types of neighborhoods. Second, Jennings
claims that socioeconomic and environmental factors outweigh fire suppression factors,
such as fire department resources, in determining losses from fires. These losses include
both the dollar value of loss to property and the rate of injury and death among humans.14
In addition, the relative importance of socioeconomic factors for understanding residential
fire risk has likely been rising in recent decades as technological changes, including broad-
based installation of smoke detectors, have reduced the risk of fire for most U.S.
households. Since fire risks have not declined at the same rate for all groups of people,
12 Gunther, 1981, pp. 57-58.13 Gunther, 1981, pp. 56-58.14 Jennings, Charles R. Urban Residential Fires: An Empirical Analysis of Building Stock andSocioeconomic Characteristics for Memphis, Tennessee. Unpublished doctoral dissertation, 1996, pp. 105-
107.

8
socioeconomic factors are likely becoming more important for explaining relative
residential fire risks.
Jennings’ conceptual model of fire initiation and fire loss appears in Figure 1.15 For fires
originating indoors (Class 1 and Class 2 fires), the model depicts interactions between four
socioeconomic factors: characteristics of the building stock, characteristics of the social or
household system, household demographics, and household economic factors. These
interactions can lead to fire ignition indirectly, with no immediate human action, or
directly, through human carelessness, misuse of equipment, or intent (arson).
Figure 1. Conceptual Model of Fire Initiation and Fire Loss ©
Class 1: “Interior, Proximate HumanAction”
Class 2: “Interior, Non-ProximateHuman Action”
Jennings, 1996
FireLosses
FireIgnition
Building Stockage, quality, size
Social/Household Systemfamily structure
Demographicshousehold size, very young or old householders
Economicsincome, maintenance
BuildingStockexits, number of units,protective features,structural type
Social andDemographicnumber of occupants,intoxicated/impaireddue to age, substanceabuse
Behavioral Fire Scenarioscarelessness, misuse, arson
Mitigating Factors
Ignition Factors
Class 3: Exterior Fires
Physical/Natural Environment
To test the appropriateness of this model for explaining differences in fire rates, Jennings
used multiple regression analysis on fire rate data for different census tracts within the city
of Memphis, Tennessee. After a review of the literature and the merits of different
15 Jennings, Charles, 1996, p. 122.
9
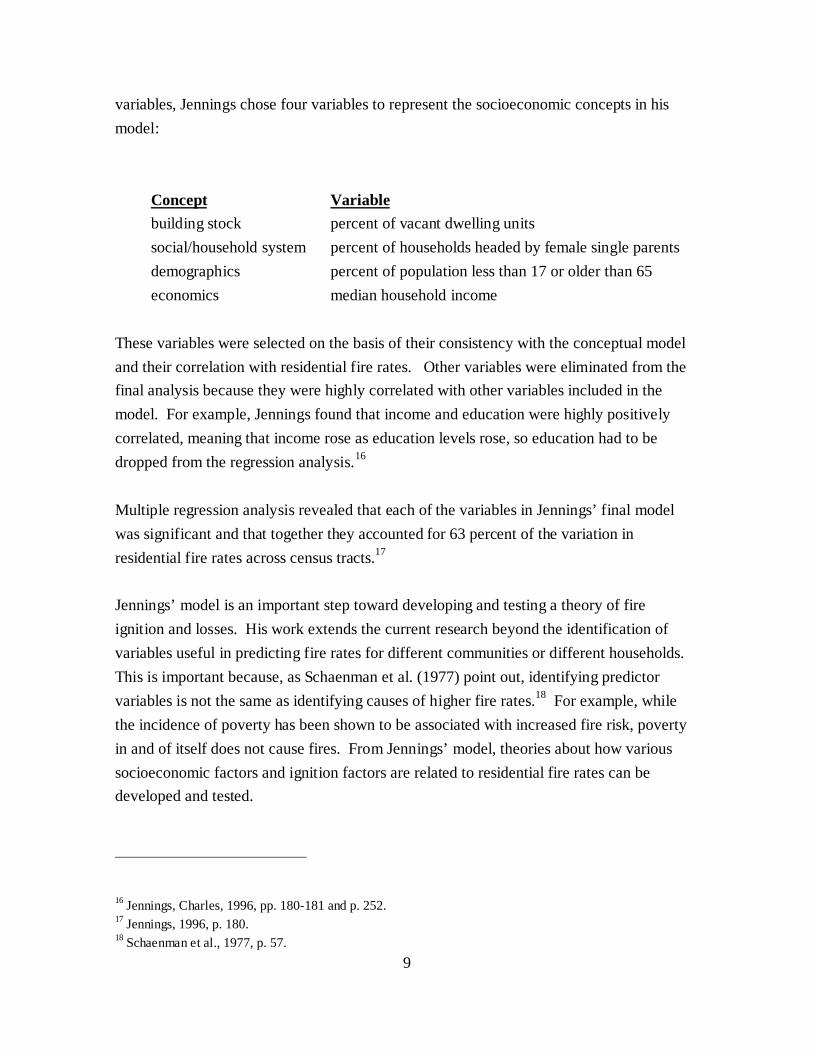
variables, Jennings chose four variables to represent the socioeconomic concepts in his
model:
Concept Variable
building stock percent of vacant dwelling units
social/household system percent of households headed by female single parents
demographics percent of population less than 17 or older than 65
economics median household income
These variables were selected on the basis of their consistency with the conceptual model
and their correlation with residential fire rates. Other variables were eliminated from the
final analysis because they were highly correlated with other variables included in the
model. For example, Jennings found that income and education were highly positively
correlated, meaning that income rose as education levels rose, so education had to be
dropped from the regression analysis.16
Multiple regression analysis revealed that each of the variables in Jennings’ final model
was significant and that together they accounted for 63 percent of the variation in
residential fire rates across census tracts.17
Jennings’ model is an important step toward developing and testing a theory of fire
ignition and losses. His work extends the current research beyond the identification of
variables useful in predicting fire rates for different communities or different households.
This is important because, as Schaenman et al. (1977) point out, identifying predictor
variables is not the same as identifying causes of higher fire rates.18 For example, while
the incidence of poverty has been shown to be associated with increased fire risk, poverty
in and of itself does not cause fires. From Jennings’ model, theories about how various
socioeconomic factors and ignition factors are related to residential fire rates can be
developed and tested.
16 Jennings, Charles, 1996, pp. 180-181 and p. 252.17 Jennings, 1996, p. 180.18 Schaenman et al., 1977, p. 57.
10
Part II. How Income Level Affects Fire Risk in Urban Areas
The previous section reviewed several studies that identified important socioeconomic
factors related to fire rates. This section will explore how those variables help explain
variations in fire rates among different neighborhoods. The discussion focuses on one
variable that was referenced directly or indirectly in each of the studies reviewed above--
income. Consistent with the literature, the emphasis here is on ways in which people with
lower incomes are exposed to greater fire risk than people with higher incomes. Also
discussed is how some of the same factors that increase the risk of fire also increase the
risk of fire-related injuries and deaths.
Income levels are an important measure because most of the socioeconomic risk factors
related to fire are related to income. This discussion will focus on low income residents of
urban areas and only briefly discuss fire risks of the rural poor. This emphasis is necessary
for two reasons. First, neighborhood, housing, and population characteristics are very
different in urban and rural areas, and their fire-incidence patterns and fire-cause patterns
differ as a consequence. Second, most of the research into socioeconomic factors related
to fire risk has focused on urban areas.
The presentation below uses a top-down approach to explore the socioeconomic factors
associated with increased fire rates at three different levels:
• the level of the neighborhood,
• the level of the household, including housing unit characteristics and
characteristics of the household members themselves, and
• the level of the individual
Socioeconomic Factors at the Level of the Neighborhood
To understand variations in fire rates across different neighborhoods, it is useful to
understand how neighborhood quality is tied to fire rates. Generally speaking, the well-
being of a residential neighborhood is tied to the quality of its housing stock. The quality
of this stock, however, can be diminished by the interrelated processes of fire and building
abandonment. The question is, what makes poor neighborhoods more vulnerable to the
threat of fire than other neighborhoods? Several explanations are offered below.

11
• 9DFDQW�DQG�$EDQGRQHG�%XLOGLQJV
Neighborhoods in U.S. cities tend to be segregated by income level. In the poorest
neighborhoods, building abandonment is more common than in other residential
neighborhoods.19 Vacant buildings represent a fire hazard for several reasons. First,
they are more likely to experience severe fires than other types of buildings. Sternlieb
and Burchell (1973) found that abandoned buildings were four times more likely than
other structures in Newark, New Jersey to have a severe fire, often as the result of
arson.20 Second, homeless persons or others seeking shelter from the elements or the
watchful eyes of neighbors may enter vacant buildings illegally. This situation can be
especially dangerous in the winter months, when those seeking shelter may light fires
indoors in an effort to keep warm. To the extent that persons seeking refuge in
abandoned buildings are under the influence of alcohol or drugs, there is an added risk
that careless use of smoking materials will ignite a fire.21
• 1HLJKERUKRRG�'HFOLQH
Building abandonment can become a self-fulfilling prophecy for a neighborhood. The
presence of vacant buildings may discourage apartment building owners, who often do
not live in the neighborhood, from investing in their buildings. The withdrawal of
routine maintenance services soon seriously erodes the quality of the housing units in
those buildings, increasing the risk of fire from inadequately maintained heating or
electrical systems, for example. In the worst case scenario, an owner may use arson as
a means to force tenants out of a building or to fraudulently collect on an insurance
policy, thereby “cashing in” his or her investment from the community. The end result
is usually another vacant building in the neighborhood.
Related to the phenomena of disinvestment from poor neighborhoods by private
citizens is disinvestment by large institutional actors, specifically banks, mortgage
companies, and insurance companies. Prior to legislation prohibiting redlining, many
of these private firms could legally refuse to underwrite mortgages or write fire
19 Massey, Douglas and Nancy Denton. 1993. American Apartheid: Segregation and the Making of theUnderclass. Cambridge, MA: Harvard University Press, p. 13220 Sternlieb, George and Robert Burchell. “Fires in Abandoned Buildings.” Fire Journal. Vol. 67, no. 2,1973, p. 28.21 Norton, Alison. 1989. “Fire Risks of the Homeless.” Fire Journal. Vol. 83, no. 6,
(November/December) p. 33.

12
insurance in poor, particularly minority, communities. The resulting credit crunch
meant that owners did not have access to capital to invest in the maintenance and
improvement of their properties. Also, owners were discouraged from investing in
their properties because, without a flow of mortgage money, they were unlikely to
recover their investment through sale of the property. Thus the lack of available credit
has played an important role in the process of building abandonment and neighborhood
decline in poor neighborhoods. Abandonment, in turn, increases the incidence of fires
caused by arson or human carelessness in those neighborhoods.
• $UVRQ
Arson is a significant cause of fires and fire casualties in many metropolitan areas.
Data from the National Fire Incident Reporting System (NFIRS) for 1994 reveal that
arson and cooking fires were tied as the leading cause of residential fires in
metropolitan areas, each accounting for 21 percent of fires. For residential fires in the
U.S. as a whole, arson fires ranked third among the leading causes, accounting for only
14 percent of fires. Arson was also the leading cause of fire deaths in metropolitan
areas in 1994, accounting for over one fourth of all residential fire deaths. In contrast,
among all residential fire deaths in the U.S., the leading cause was careless smoking,
which accounted for 24 percent of deaths. Arson was the second leading cause,
accounting for 15 percent of deaths. 22,23
Gunther (1981) specifically addressed the relevance of income for understanding how
different neighborhoods are affected by arson. In Toledo he found that among all the
fire-causes he studied, the relationship between income and incendiary or suspicious
fires was the most dramatic. Regression analysis suggested that the group of census
tracts with the lowest median income experienced about 100 to 120 incendiary or
suspicious fires per 100,000 population. In contrast, the group of census tracts with a
slightly higher median income experienced about 55 to 70 incendiary or suspicious
fires per 100,000 population, a dramatically lower rate. Even worse, when compared
22 United States Fire Administration, 1990, p. 355. In NFIRS, arson fires are those classified by firedepartments as having “incendiary” or “suspicious” origins.23 This information is intended to give readers a general idea of how metropolitan and national data compare,but it must be interpreted with care. Due to the way the data is collected and reported in the National Fire
Incident Reporting System (NFIRS), data from some areas that are largely rural in character are included
under metropolitan areas.

13
to the group of census tracts with the highest median income, the poorest group of
census tracts were predicted to have 14.4 times the number of incendiary or suspicious
fires.24
In addition to the problem of arson and other fires in abandoned buildings, the quality
of a neighborhood can also affect fire safety in another way. Since crime rates tend to
be higher in low income neighborhoods, households in these neighborhoods may seek
to make their homes safer by barring access through doors and windows. This may be
accomplished by installing iron grilles on windows and doors or by other means, such
as using furniture to block doors and passageways. The danger is that in the event of a
fire, barred windows and blocked doorways and passageways make it harder for those
inside a burning building to get out.25 As a result, fire-related injuries and deaths are
likely to be higher than they would normally be given the nature and severity of a
particular fire.
62&,2(&2120,&�)$&7256�$7�7+(�/(9(/�2)�7+(�+286(+2/'
The section above addressed socioeconomic factors relating neighborhood quality to the
incidence of fire. This section narrows the scope to focus on the level of the household.
Household-level factors relevant to fire rates include the quality of individual housing
units, their affordability to residents, and the social structure of the households that reside
in them. In the U.S., housing quality and housing affordability are closely related. The
cost of a housing unit, whether for sale or to rent, is priced according to the quality of the
unit given its location, amenities, etc., with the effect that higher income households can
generally afford to live in higher quality units than lower income households. While
recognizing the close connection between these concepts, housing quality and housing
affordability are discussed separately to explore the unique ways they are related to income
levels and relative fire risks.
• Housing Quality
Income is the primary determinant of the quality of housing for most households. In
many urban areas, households with low incomes live in the oldest and most run-down
24 Gunther, 1981, p. 56.25 Fahy, Rita and Alison Norton. 1989. “How Being Poor Affects Fire Risk…” Fire Journal. Vol. 83, no. 1
(January/February), p. 34.
14
portion of the city’s housing stock. There are over 2.4 million inadequate, occupied
rental housing units in center cities throughout the U.S., and over 62 percent of them
were built prior to 1950.26 Two trends suggest that the general condition of much
center city housing will continue to deteriorate and the number of households living in
inadequate units in these areas will increase. First is the increasing income gap
between the well-off and the poor in the U.S., and the other is cutbacks in income
support programs for low income households. Both of these trends, in different ways,
undermine the rent-paying ability of low income households and suggest that poor
quality housing will continue to be a reality for millions of low income households. 27
Living in an old, poorly maintained housing unit raises a household’s risk of
experiencing a fire for several reasons. First, older heating, plumbing, and electrical
systems need adequate maintenance over their useful lives to ensure their continued
safe operation. As discussed earlier, many apartment buildings in center city areas
have not been adequately maintained. This increases the risk of mechanical
malfunction and the possibility of a fire.
Second, the electrical wiring in many older houses and apartments poses a fire risk.
Older wiring was not designed to carry the electrical loads placed upon it by modern
appliances, such as microwave ovens, televisions, stereo equipment, etc., and excessive
loads may lead to electrical fires. Similarly, residents may try to compensate for an
older apartment’s inadequate electrical system by running extension cords and placing
excessive demands on limited electrical outlets, strategies which may also overload a
socket or circuit and ignite an electrical fire.28
Third, fire risk increases for households that try to compensate for a building’s
inadequate heating system using stop-gap measures such as space heaters.29 Space
heaters and other types of alternate heating devices can increase fire risk in many ways:
if they are older and have not been adequately maintained; if they are used incorrectly,
too close to combustibles, or with inadequate ventilation; or if they are used in a
26 Harvard University Joint Center for Housing Studies, 1996, p. 21. Units are considered inadequate if theylack any basic plumbing, heating, or other mechanical systems, or if other information regarding inadequate
upkeep is available.27 Harvard University Joint Center for Housing Studies, 1996, p. 23.28 Jennings, 1996, p. 123.29 Jennings, 1996, p. 123.
15
household with children, especially very young children, who may interfere with the
safe use of a space heater or other alternate heating device.
A notable exception to the relationship between low income status and increased fire
risk from old and under-maintained housing stocks is the case of households receiving
housing assistance. Public housing is available in most large cities in the U.S., and it is
reasonable to expect that heating and electrical systems in some of these buildings are
better maintained and pose less of a fire hazard than those commonly found in older,
private market apartment buildings affordable to low income households. Households
that receive rental subsidy certificates or vouchers should also be exposed to lower fire
risks than other low income households because, at least in the federal Section 8
program, apartment units are inspected on an annual basis, and units that fail
inspections are not eligible to participate.
Just as the quality of a household’s dwelling unit can effect its fire risk, so does the
quality of its furnishings. Considerable improvements have been made in the fire
safety of many types of consumer products, particularly home furnishings. Today
mattresses and upholstery are manufactured to be more resistant to ignition than ever
before. Unfortunately, lower income households are more likely to have older
furnishings which ignite more readily and which increase the risk of fire and fire-
related injuries and deaths.
Smoke Detectors
Smoke detectors have contributed significantly to reductions in fire deaths. Between
1980 and 1990, the U.S. experienced a decrease in residential fire deaths of about 25
percent.30 One reason that smoke detectors are so effective in saving lives is that a
high proportion of fatal fires occur at night, and smoke detectors alert residents early
enough that they have a better chance of escaping from burning buildings. 1994 NFIRS
30 Smith, Charles L. 1994. Smoke Detector Operability Survey Report on Findings (revised). Released by
the Consumer Product Safety Commission, October 1994, p. 1

16
data show that only 19.2 percent of fire deaths occurred in homes known to have
operational smoke detectors.31
It is also likely that smoke detectors have reduced the number of residential fires
requiring fire department suppression services. In 1994, over 65 percent of residential
fires occurred in households without operational smoke detectors. This raises two
possibilities: either households with operational smoke detectors are more safety
conscious, or smoke detectors allow residents to detect and extinguish small fires
which are not reported to the fire department.32
The relationship between low income status and the presence of operational smoke
detectors has not been firmly established. But it is likely that lower income households
are less likely to have operational smoke detectors to the extent that:
• they live in older structures: for households living in dwelling units constructed
between 1980 and 1992, 92 percent are estimated to have operational smoke
detectors. This percentage drops to 82 percent for households in units built
during the 1970s and 74 percent for units built prior to 1970.33
• they live in substandard units that are not maintained to building codes; or
• they are “shelter poor” (see below) or otherwise do not purchase or maintain
smoke detectors.
At this point, it is known that neighborhoods with high proportions of low income
households also have proportionately more fires than neighborhoods with more
middle- and high-income residents, and that households without operational smoke
detectors are almost two and a half times more likely to have reported fires than those
with operational smoke detectors.34 Taken together these facts suggest that low income
households may have fewer operational smoke detectors and thus face higher fire risk.
This is an important topic for future research, both to establish with greater certainty
31 United States Fire Administration, 1990, p. 78. Unless otherwise noted, all information on smokedetectors from NFIRS refers to cases where their presence and operability was reported only.32 United States Fire Administration, 1990, p. 78.33 Smith, Charles L., 1994, pp. 16-17.34 1990 census data on number of households is from Smith, Charles L., 1994, p. ii and p. 3, and data on
smoke detector status in households reporting fires is from 1994 NFIRS data.

17
the relationship between household income and the presence of operational smoke
detectors and then to specify the reasons. Are detectors missing completely or are they
installed but not operational because they have been disconnected, they are missing
batteries, or for other reasons?
• Housing Affordability
Housing affordability is another factor that affects a household’s fire risk. Households
are “shelter poor” if they are able to make their rent payments, but do not have enough
left over to cover other basic needs, such as adequate food, clothing, and other
household necessities.35 According to the 1996 State of the Nation’s Housing report,
20 percent of center city renters face “severe” rent payment burdens, meaning that 50
percent or more of their income goes toward housing costs. Among households in
center cities that are low income, or households whose incomes are 50 percent or less
of the area median, 45 percent have severe payment burdens.36 With half of their
monthly incomes going to pay rent, little is left over to provide for other necessities.
Shelter poverty can affect a household’s fire risk in several ways. Most importantly,
the lack of truly “disposable” income means that households are unlikely to invest in
fire protection devices, such as smoke detectors or batteries for existing smoke
detectors. Munson and Oates refer to this as the “positive income elasticity of demand
for fire safety”: the higher a household’s income, the more it is willing to spend money
on fire safety 37. Shelter poverty can also effect a household’s fire risk if it cannot
afford to make utility payments. If one or more of a household’s utilities are shut off,
the household is likely to compensate with other, less fire-safe devices. For example if
a household heats with gas and the gas is shut off, the household may turn to electrical
space heaters or other methods to keep warm. Compared to central heating, these
heating methods pose a much higher fire risk.
35 Stone, Michael. Shelter Poverty: New Ideas on Housing Affordability. Philadelphia, PA: TempleUniversity Press, 1993, p. 34.36 Joint Center for Housing Studies, 1996, p. 29.37 Munson, Michael J. and Wallace E. Oates. “Community Characteristics and the Incidence of Fire: An
Empirical Analysis.” In The Social and Economic Consequences of Residential Fires. Chester Rapkin, Ed.
Lexington, MA: D.C. Heath and Co., 1983, p. 62 and p. 73.

18
For some households, the lack of affordable housing becomes a crisis. Increasingly,
families are among those who find themselves homeless. A 1986 report by the U.S.
Conference of Mayors quantified this phenomenon, estimating that families constituted
28 percent of the homeless in states they surveyed.38 For families who seek shelter in
vehicles or abandoned buildings after becoming homeless, their risk of fire rises
precipitously as discussed earlier, particularly in cold weather.
• Household Structure
In addition to physical and economic conditions such as the quality and affordability of
a housing unit, social factors related to household structure can also affect fire risk.
The household characteristics most often included in studies of increased fire risk are
the presence of single parent households (usually headed by females), the presence of
children, the presence of elderly persons, and household crowding. The relevance of
single parent households for increased fire risk is tied to the presence of children in the
home, so these two topics are addressed together in the section below.
Single Parent Households and the Presence of Children
Single parent households are related to increased fire risk in two ways. First, single
parent households tend to be less affluent than two-parent households since there is
only one income if the parent is not receiving support from other sources. These
households are at greater risk of experiencing a fire for all the reasons associated with
low income households generally.
Second, a single parent household generally has less flexibility to deal with household
and child care contingencies. Kraizer et al. (1990) found that children in urban areas
were left unattended more often than rural or suburban children. Parents told
researchers that they left their children alone because they had no other choices. Under
these circumstances, they attempted to make arrangements with neighbors or relatives
who their children could turn to in the case of an emergency.39
38 Norton, Allison, 1989, p. 32.39 Kraizer et al. 1990. “Children in Self-Care: A New Perspective.” Child Welfare (November/December),
p. 575.

19
In another study, Fahy (1993) found that parents left children home alone for a variety
of reasons. Whether single-parent or two-parent families, Fahy found that these
reasons included:
• parents went out on a quick errand,
• parents were out socializing,
• parents were at work when their child care arrangements fell through,
• parents went out on an extended errand, and
• the babysitter left the home before the parents returned.40
The fire risks associated with leaving children home alone also extend to cases where
an adult is home, but children are unsupervised. In both of these cases, fire risk is
higher due to children’s curiosity about fire and their propensity to play with matches,
lighters, and other fire-related materials. The limited life experiences of children make
them unable to comprehend the enormity of careless actions involving fire. Data from
1989 through 1993 reveal that among all fires that resulted in the death of a small child,
over one-third (37 percent) were caused by children playing.41 Fires can also result
from children cooking without supervision.
The risk posed by children playing is even greater in households without operational
smoke detectors. In these cases, even if an adult is present in another part of the home,
smoke or fire may not alert them until it is too late to escape, particularly if the adult is
asleep when the fire breaks out.
Gunther (1981) shows that, relatively speaking, children playing fires are an even
greater problem in low income neighborhoods than other neighborhoods. In Toledo he
found that the poorest group of neighborhoods had a rate of children playing fires that
was 14.2 times as high as the wealthiest group of neighborhoods.42 This helps explain
the National Fire Protection Association’s finding that among black children, who are
40 Fahy, 1993, p. 56.41 National Fire Protection Association. 1996. Presentation at the 1996 Fire and Life Safety Symposium, July
11, 1996.42 Gunther, 1981, pp. 56-57.

20
disproportionately represented in low income households, “home fires are the leading
cause of injury-related deaths for children between ages 1 and 9.”43
To the extent that low income households are less able to afford or access quality and
reliable daycare and their children spend time at home by themselves, their fire risk
increases. Single parent households have an additional challenge in that only one adult
is available to respond to a child care crisis should one arise. Currently many programs
at the local, state, and federal levels are emphasizing “self-sufficiency” programming
for families receiving income support assistance. But given the serious fire risk
associated with leaving children at home alone, adequate attention must be paid to the
availability and affordability of quality day care and after school programs.
Without them many more parents may be tempted or forced to allow children to spend
time at home alone, especially children returning home from school.
While low income households, and single parent households in particular, may face
higher risks of fires caused by unattended or unsupervised children, no household with
children is immune to this threat. Fahy reports that a more important factor than
poverty in explaining the incidence of fires started by children playing is the reticence
of parents to recognize instances when they leave their children home alone or
unsupervised. 44 Kraizer et al. found that most parents, regardless of socioeconomic
background, did not consider running out to do a quick errand as leaving their children
“unattended”. They also found that most parents overestimated the ability of their
children to deal with mundane household occurrences, such as answering the telephone
or dealing with strangers who came to the door.45 Parents’ failures to recognize
instances when they leave their children alone or unsupervised also means that they are
not cognizant of the increased fire risks their children face during these times.
43 National Fire Protection Association, 1996.44 Rita Fahy. 1993. “Leaving Children Unsupervised is Playing with Fire.” Fire Journal. Vol. 87, no. 3
(May/June), p. 58.45 Kraizer et al., 1990, p. 575 and p. 578.

21
Fire Risks of Elderly Persons
Each year a disproportionately high number of elderly people are killed in residential
fires. In 1990, elderly people over the age of 70 represented 8 percent of the U.S.
population, yet they accounted for 18 percent of all those killed in residential fires.
While the elderly accounted for only 7 percent of all those who were injured in fires,
this is likely a consequence of the fact that elderly persons injured in a fire are more
likely to die of their injuries. Beginning at age 70, an individual’s risk of dying in a
fire rises dramatically. Those between the ages of 70 and 74 have a 50 percent greater
chance of being killed in a fire than the population at large. By age 85, the risk of
dying is more than 250 percent higher than for the overall population.
The nature of the risk that elderly persons face is two-fold: on the one hand, they may
be exposed to greater risk than the population at large, and on the other they may be
less able to escape a fire due to physical or mental limitations. Elderly persons are at
greater risk for experiencing fires because everyday activities, especially cooking, can
become more dangerous if a person’s physical or mental capabilities decline. This risk
of fire is compounded for persons who are on medications that make them less alert or
for those who smoke and drink alcohol alone. Studies are necessary to determine if
low income elderly persons are more at risk than other elderly persons of experiencing
or being injured or killed in a residential fire.
Overcrowded Households
Many studies of the relationship between socioeconomic variables and fire rates
include a variable for “overcrowding”. While overcrowding, which is usually defined
as more than one person per room in a dwelling unit, is more of a problem in low
income communities, it is not clear how it relates to increased fire rates. Jennings
suggests that the more people there are in a household the greater the wear and tear on
a dwelling unit’s mechanical systems, and this may increase the risk of fire.46 Another
possibility is that “overcrowding” as defined in some studies is another indicator of
poverty, one that taps a dimension of poverty not accounted for in other measures.
While its affects on fire incidence rates are not well established, the impact of
overcrowding on fire injury and death rates is more straightforward. One way low
46 Jennings, 1996, p. 124.

22
income families deal with the lack of affordable housing is by doubling up in homes
with extended family members or friends. By increasing the number of people in a
given household, the number of potential victims of a fire also rises. Also, the more
people there are in a household, the more difficult if can be to get everyone out of a
burning unit. This is especially true for households with very young or very old
household members who may be unable to escape flames or smoke on their own. In
addition, households without operational smoke detectors have less time to escape a
fire, and their ability to access all areas in the home to alert or retrieve other household
members is diminished.
SOCIOECONOMIC FACTORS AT THE INDIVIDUAL LEVEL
In the sections above, the socioeconomic factors associated with increased fire risk at the
neighborhood and household levels were examined. This section completes the top-down
presentation of fire risks by discussing individual-level socioeconomic factors related to
fire risk. Factors at the level of the individual include the incidence of careless smoking,
the incidence of alcohol and drug abuse, education levels, and type of housing tenure.
• Careless Smoking and Alcohol and Drug AbuseCareless smoking is a leading cause of fire deaths and injuries in the U.S. While
careless smoking accounted for only 7 percent of all residential fires in 1990, it was
responsible for 26 percent of all fire deaths and 15 percent of all fire injuries.47 Studies
have shown that cigarette smoking is inversely related to income, so low income
households are arguably at greater risk from fires caused by careless smoking.48 In
Toledo, Gunther (1982) found significant differences in the rates of careless smoking
fires among the five groups of neighborhoods he studied. The rate of careless smoking
fires for the group with the lowest median income was 8.5 times as high as the rate for
the group with the highest median income.49
Closely related to the topic of careless smoking is alcohol and drug abuse. Intoxicated
persons are at greater risk of falling asleep while smoking, and improperly discarded or
47 United States Fire Administration, 1990, pp. 70-71. The percentages given reflect data on fires with
known causes.48 Report by the Centers for Disease Control in Jennings, 1996, pp. 70-71 and p. 243.49 Gunther, 1981, p. 56.

23
dropped cigarettes are a dangerous ignition source. The proximity of the sleeping
person to the origin of the fire illustrates why these fires tend to be so deadly,
particularly if the victim is too inebriated to recognize the danger or successfully
escape.
• Low Levels of Education
Fahy (1989) identifies low levels of education as contributing to fire risk and suggests
that those with little education are less likely to “grasp the full import of public fire
safety education messages”.50 Low literacy levels may also inhibit the ability to read
instruction manuals and warning labels for cooking and heating devices, increasing the
chance that they will be used incorrectly and in a manner that increases the risk of fire.
There is an important connection between education levels and income levels,
especially in the U.S.’s increasingly high-tech workplaces, and people with low levels
of education are far more likely than others to have low incomes. Further research is
needed to ascertain how important low education levels are in increasing fire risk
relative to other factors such as income.
• Housing Tenure and Fire Risk
Another variable that has been studied in association with fire rates is housing tenure.
Several studies have found that lower rates of owner-occupation, which are more
typical in low income communities, are related to increased fire rates. The difficulty is
in specifying the nature of this relationship. Munson and Oates (1983) suggest that by
virtue of owning their own homes, owner-occupiers may have a tendency to better
maintain their homes, thereby reducing the likelihood of mechanically-caused fires,
and they may be more careful in their everyday routines, reducing the likelihood of
cooking, careless smoking, or other types of fires that result from human carelessness.
Owner-occupiers may also have more of a vested interest in purchasing and
maintaining fire protection devices such as smoke detectors as a means of protecting
their equity investments.51
50 Fahy, 1989, p. 36.51 Munson and Oates, 1983, p. 62.

24
• Social Pathology and Fire RiskAnother area that needs further study is ways in which arson fires are related to the
stresses associated with living in socially and economically depressed inner city
neighborhoods. Fahy (1989) suggests that higher rates of incendiary and suspicious
fires may be manifestations of the complex and often overwhelming problems people
are more likely to experience in these neighborhoods.52 Recent increases in the rate of
residential arsons may be evidence of this phenomena. The increase may indicate that
an increasing proportion of arson fires are targeted at individuals rather than motivated
by profit.53 Fahy also suggests that the stresses of living in disadvantaged communities
may lead to higher rates of child playing fires and fires set by juveniles. These areas
are all in need of further study.
3DUW�,,,�����+RZ�3RYHUW\�$IIHFWV�)LUH�5LVN�LQ�5XUDO�$UHDV
Though a full analysis of the unique fire risks of rural populations is not undertaken here, a
few of the risks unique to rural areas are presented briefly. First, a 1982 study by Gunther
tied high rates of rural fire deaths to variations in climate and income. He found that fire-
death rates were much higher in the South than in the North, and, contrary to what one
might imagine, the rate of fire deaths attributable to heating fires was higher in the South.54
Gunther explained these findings by noting the greater extent of rural poverty in the
southern states, but climate also played an important role.55
Since the climate is generally milder in the South, fewer households have warm air
furnaces than households in the North (43 percent compared to 56 percent in the North).
Instead, a higher proportion of households use less fire-safe heating methods, such as room
heaters, fireplaces, portable heaters, and wood stoves. If not properly vented, or if too
close to other combustible households items, these heating methods present a serious fire
risk. In 1976, 38 percent of all southern households heated primarily with either room
52 Fahy, 1989, p. 35.53 United States Fire Administration, 1990, p. 219.54 For the purposes of his analysis, Gunther classified the following states as “southern” : Delaware,Maryland, Virginia, West Virginia, North Carolina, South Carolina, Georgia, Florida, Kentucky, Tennessee,
Alabama, Mississippi, Arkansas, Louisiana, Oklahoma, and Texas.55 Gunther, 1982, p. 34
25
heaters (with and without flues), fireplaces, portable heaters, or wood stoves, and among
African Americans this figure rose to 68 percent. In contrast, only 14 percent of northern
households used one of these methods as their primary heating source.56
Fahy and Norton (1989) identify two additional factors that distinguish the fire risks of
poor rural households from their urban counterparts. First, the communities in which the
rural poor live are less likely to be able to afford the level of fire protection services widely
available in urban areas. Second, there is a greater likelihood that poor rural households
live in remote locations far from available fire suppression equipment or that their houses
are difficult to find. These factors slow the response time of the fire department and may
increase the extent of the loss caused by a fire.
Clark (1982) argues that fire safety in rural areas is compromised by other factors, as well.
He cites less strict adherence to building codes and greater use of low-cost building
designs and materials in rural housing as serious fire safety risks.57
Part IV. Why Study Socioeconomic Factors of Fire Risk?
Socioeconomic factors are among the best predictors of fire rates at the neighborhood
level. If the data were available, it would likely be found that the relationships between
socioeconomic status and fire rates are even stronger at the household level. While
structural factors of buildings affect fire rates, of greater importance are the myriad ways in
which human activity directly and indirectly impacts fire risk. This report has explored
how variations in the socioeconomic circumstances of human occupants of buildings and
neighborhoods can critically impact fire rates.
In 1994, cooking, incendiary or suspicious causes, careless smoking, and children playing
accounted for almost half of all fires in residential structures. If heating causes are added,
this proportion rises to two-thirds of all fires.58 Since fires resulting from human activities
56 Gunther, 1982, p. 39.57 Clark, Frederick E. 1982. “Firesafety in Rural America.” Fire Journal (July), p. 41.58 Heating fires are not necessarily caused by the direct or indirect actions of humans. Some heating fires
result from mechanical malfunctions rather than human use, misuse, or neglect.

26
account for a high proportion of residential fires, public education represents one of the
most important avenues for reducing the incidence and severity of home fires.
Analysis of differential fire risks for different socioeconomic groups is an important guide
to designing and targeting public education and fire-safety outreach campaigns. For
example, public education campaigns targeted to middle income groups should focus on
the importance of maintaining operational smoke detectors in homes. In contrast, fire
reduction efforts in center city areas need to recognize that low income households are less
likely to be willing to pay for smoke detectors and batteries on their limited budgets. Due
to the elevated level of stress in their lives generally, they are also less likely to prioritize
fire safety. These considerations should effect both the content and form of fire safety
campaigns.
Similarly, to attenuate the rate of child playing fires, middle income groups need to be
educated about the dangers inherent in leaving children unattended, even for brief periods
of time. But this strategy is not likely to be effective with low income households who
may leave their children alone due to a lack of child care options. These two brief
examples demonstrate that fire prevention efforts need to be sensitive to the needs and
concerns of different socioeconomic groups, as indicated by differences in fire rates,
different distributions of fire causes, and the presence of unique fire risk factors within
communities. These challenges are in addition to those of creating fire prevention
strategies that reach people who speak a variety of languages and have a wide variety of
literacy levels.
Part V. Future Research
At the present time, additional research into the socioeconomic factors associated with
increased fire rates is necessary because much of the current literature is over fifteen years
old. The relationships documented in the articles from that time period need to be
replicated, both to test for the durability of those relationships and to look for changes that
may have occurred over time.

27
An important resource for future studies is the National Fire Incident Reporting System
(NFIRS). This database contains a great deal of information on fires that have occurred in
the U.S. since the late 1970s.59 Researchers can match information on fires from NFIRS
with other information sources, such as data from the Census Bureau, to investigate
relationships between the incidence of fire and socioeconomic status. New computer
software and increases in the amount of data available in electronic formats have made this
type of research more manageable than in prior years.
Additional topics addressed in this report and deserving of attention include:
• Smoke Detectors: Do low income households have smoke detectors present in their
households in the same proportions as the general population? Are installed detectorsoperational to the same extent as in other households? If not, what issues are at workin addition to the expense of purchasing or maintaining detectors?
• Arson: Arson fires can be an act of vandalism, arson-for-profit, pyromania, spite, or
revenge. Is there evidence that the relative distribution of these motivations ischanging? For example are an increasing proportion of all arson fires motivated byspite or revenge? If so, how does this phenomena impact low income communitiesrelative to other communities?
• Household Composition: How does the size and composition of households impact
fire rates and fire injury and death rates? Some studies have found the variable“overcrowding” to be significant, but its relationship to increased fire rates needs to bespecified. Studies are also needed to determine the impact of household compositionrelative to absolute household size on increased fire rates. Do these variables havedifferent effects at different income levels?
• Child Playing Fires: Is there a relationship between the incidence of child playing
fires and the presence of adult smokers in the household? Studies reveal that a higher
proportion of low income persons are smokers, and other studies show that low incomehouseholds are more likely to have child playing fires. Does the presence of a smokerin a household increase the risk that young children will have greater access to lightersand matches and play with them?
59 Today NFIRS generally has information on between 45 percent and 50 percent of all fires that occur in the
U.S. in a given year.

28
• Child Playing Fires: What proportion of child playing fires occur while children are
home alone? What is the age distribution of those children who start fires?
• Regional Variations in Fire Death Rates: Are there still regional variations in fire
death rates? Demographic changes, particularly in the southern states, may haveaffected death rate patterns and differences between regions. Are any existingdifferences still related to relative poverty levels?

29
REFERENCES
Clark, Frederick E. 1982. “Firesafety in Rural America.” Fire Journal (July), pp. 40-41and pp. 105-106.
Fahy, Rita. 1993. “Leaving Children Unsupervised is Playing with Fire.” Fire Journal.Vol. 87, no. 3 (May/June), pp. 54-58.
Fahy, Rita and Alison Norton. 1989. “How Being Poor Affects Fire Risk…” FireJournal. Vol. 83, no. 1 (January/February), pp. 29-36.
Gunther, Paul. 1981. “Fire-Cause Patterns for Different Socioeconomic Neighborhoods inToledo, OH.” Fire Journal. Vol. 75 (May), pp. 52-58.
Harvard University Joint Center for Housing Studies. 1996. Into the 21st Century: TheState of the Nation’s Housing. Cambridge, MA: The Joint Center for Housing Studies.
Jennings, Charles R. 1996. Urban Residential Fires: An Empirical Analysis of BuildingStock and Socioeconomic Characteristics for Memphis, Tennessee. Unpublished doctoraldissertation.
Karter, Jr., Michael J. and Allan Donner. 1978. “The Effect of Demographics on Fire
Rates.” Fire Journal. Vol. 72, no. 1 (January), pp. 53-65.
Kraizer, Sherryll, Susan Witte, George E. Fryer, Jr., and Thomas Miyoshi. 1990.“Children in Self-Care: A New Perspective.” Child Welfare (November/December), pp.571-581.
Massey, Douglas and Nancy Denton. 1993. American Apartheid: Segregation and theMaking of the Underclass. Cambridge, MA: Harvard University Press.
Munson, Michael J. and Wallace E. Oates. 1983. “Community Characteristics and theIncidence of Fire: An Empirical Analysis.” In The Social and Economic Consequences ofResidential Fires. Chester Rapkin, Ed. Lexington, MA: D.C. Heath and Co.
National Fire Protection Association. 1996. Presentation at the 1996 Fire and Life SafetySymposium, July 11, 1996.
30
Norton, Alison. 1989 “Fire Risks of the Homeless.” Fire Journal. Vol. 83, no. 6(November/December) pp. 28-37.
Schaenman, Philip et al. 1977. Procedures for Improving the Measurement of Local FireProtection Effectiveness. Boston: National Fire Protection Association, pp. 53-71.Smith, Charles L. 1994. Smoke Detector Operability Survey Report on Findings (revised).Released by the Consumer Product Safety Commission, October 1994.
Sternlieb, George and Robert Burchell. 1973 “Fires in Abandoned Buildings.” FireJournal. Vol. 67, no. 2 (March), pp. 24-31.
Stone, Michael. 1993. Shelter Poverty: New Ideas on Housing Affordability.Philadelphia, PA: Temple University Press.
United States Fire Administration. 1993. Fire in the United States, 1983 - 1990.Washington, D.C.: Federal Emergency Management Agency, United States FireAdministration.

31
OTHER REFERENCES
Bertrand, Alvin L. and Lawrence S. McKenzie. 1976. The Human Factor in High FireRisk Urban Residential Areas: A Pilot Study in New Orleans, Louisiana. Washington,D.C.: U.S. Department of Commerce, National Fire Prevention and ControlAdministration.
Brotman, Billie Ann and Pauline Fox. “The Impact of Economic Conditions on theIncidence of Arson: Comment.” Journal of Fire Risk and Insurance. Vol. 55, no. 4, pp.751-754.
Chandler, S.E., A. Chapman, and S. J. Hallington. “Fire Incidence, Housing, and SocialConditions -- the Urban Situation in Britain.” Fire Prevention, no. 172, 1984, pp. 15-20.
Donnell, Robert P. Fire In the City: Spatial Perspectives on Urban Structural Fire
Problems. Unpublished Doctoral Dissertation. Syracuse University, 1980.
Fenner, Deborah Ballou. Austin Fire Service Demand: A Frequency and RegressionAnalysis. Unpublished Master’s Thesis, University of Texas at Austin, May 1990.
Gilliam, George A. An Analysis of Residential Fire Patterns in Highland Park, Michigan1970-1977 Using Individual Unit, Block, and Census Tract Data. Unpublished Master’sthesis. Detroit, MI: Wayne State University, 1985.
Goetz, Barry Joel. The American Fire Service and the State: Government Organizationand Social Inequality. Unpublished Doctoral Thesis, University of California, Berkeley,1991.
Karter, Michael Jr. and Allan Donner. Fire Rates and Census Characteristics -- AnDescriptive Approach. Boston: National Fire Protection Association, June 1977.
Karter, Michael Jr. and Allan Donner. Fire Rates and Census Characteristics -- An
Analytic Approach. Boston: National Fire Protection Association, July 1977.

32
Munson, Michael. Residential Fire and Urban Neighborhoods: An Empirical Analysis ofCharlotte, North Carolina. Unpublished Doctoral Thesis, Princeton University, September1977.
Munson, Michael. “Urban Neighborhoods and the Fear of Fire.” In Chester Rapkin, Ed.The Social and Economic Consequences of Residential Fires. Lexington, MA: D.C.Heath and Company, 1983, pp. 165-194.
Murrey, Joe H. Jr., Robert E. Pitts, Dani A. Smith, and Kenneth W. Hollman. “TheRelationship Between Selected Socioeconomic Variables and Measures of Arson: ACross-Sectional Study. Fire Technology, vol. 23 no. 1, February 1987, pp. 60-73.
Runyan, Carol W., Shrikant I. Bangdiwala, Mary A. Linzer, Jeffrey J. Sacks, and JohnButts. “Risk Factors for Fatal Residential Fires.” New England Journal of Medicine. Vol.327, September 17, 1992, pp. 859-863.
Schaenman, Philip, Barbara Lundquist, Hollis Stambaugh, Elyse Camozzo, and AnthonyGranito. Overcoming Barriers to Public Fire Education in the United States. Arlington,VA: TriData Corporation, 1987.


