16
SOFTWARE CHALLENGES AND SOLUTIONS June 2005 CCLRC
| Date post: | 28-Aug-2018 |
| Category: |
Documents |
| Upload: | dinhkhuong |
| View: | 214 times |
| Download: | 0 times |
SOFTWARE CHALLENGES AND SOLUTIONS
June 2005
CC
LRC

3
Software challenges and solutions It is hard to imagine the world before the Web. Initially inventedat CERN to help particle physicists analyse the data from theirexperiments, the Web has become part of the fabric of both sci-entific and everyday life. But the Web was only the beginning,and researchers are now busy building its successor – the Grid.Whereas the Web allows users to share information and data,the Grid will enable a new type of science called e-Science byallowing them to also share processing power (p8). Physicistsand astronomers are leading the way in the development of theGrid (p9), which is also opening up career opportunities forphysics graduates in many different areas (p12). Much of thiswork is being done in collaboration with leading IT companies,and once Grid technology becomes established it should haveapplications in many areas of business and industry. Of courseusers will still need applications on their desktop, and else-where in this supplement we describe packages for data acqui-sition and analysis (p11), optical design (p5) and visualization(p15), and also the open-source software movement (p6).
ContentsHelping astronomers to see the light 5Optical design software can greatly improve the performanceof telescopes and other instruments. Gary L Peterson reports
Service promotes an open approach 6Open-source software is often overlooked in IT strategies.Randy Metcalfe explains what it has to offer
Welcome to e-Science and the Grid 8The large volumes of data being produced in scientific researchmean that a new approach is needed, as Neil Geddes explains
The Grid in action 9Scientists and engineers are setting up Grid projects to tacklechallenges in many different areas. Judy Redfearn reports
Software simplifies surface analysis 11Good software is needed to get the most out of experiments,as Andrew Jardine of The Mathworks explains
Grid boosts job opportunities for physicists 12in software developmentThe rise of e-Science and Grid computing offers new careerpossibilities for physics graduates, as Robert Mann describes
Toolkit aids visualization techniques 15Visualization packages are getting ready for the Grid,as Jeremy Walton of NAG and colleagues outline
©2005 IOP Physics Publishing Ltd. All rights reserved. Dirac House, Temple Back, Bristol BS1 6BE, UK.
S O F T W A R E C H A L L E N G E S A N D S O L U T I O N S J U N E 2 0 0 5

5S O F T W A R E C H A L L E N G E S A N D S O L U T I O N S J U N E 2 0 0 5
Many astronomers and physicists have to examine dim objectssurrounded by bright companions. Coronagraphic telescopesuse stops or masks to suppress the light from these brighterneighbours, thus allowing the dimmer object to be studied. Inrecent years, we have used our Advanced Systems AnalysisProgram (ASAP) to analyse the stray light performance ofthese systems at Breault Research Organization.
ASAP is ideal because it does both ray-tracing and wave-optics propagation. It calculates the effects of scatter from opti-cal and mechanical components, ghost reflections from lenses,and diffraction from apertures and obscurations (structuresinside the telescope that block light that would otherwise becollected). This all happens within a single 3D computer modelthat includes both the optical and mechanical components.
For wave-optics calculations the program relies on a tech-nique called Gaussian decomposition, in which an arbitraryfield is represented as a coherent superposition of Gaussianbeams. There is a one-to-one mathematical relationshipbetween propagating these beams (which are the type of beamproduced by many lasers) and tracing rays. By reducing wave-optics propagation to ray-tracing, ASAP is able to do diffrac-tion calculations in almost any imaging system, and thereforefrees the user from complex mathematical manipulations.
Light is propagated in three dimensions, and the programcalculates, displays and manipulates the amplitude and phaseof the fields across any plane in a system, not just the object
and image planes. Moreover, the propagation is not limited bysmall angle (or paraxial) approximations.
We have used ASAP to perform wave-optics calculations ina coronagraphic telescope (see figure). The obscurations and“spiders” that hold the secondary mirror diffract light from abright object into unwanted areas. ASAP allows us to calculatehow light from the object we want to observe, as well as straylight, will travel through the telescope. We can then designmasks to block the stray light, while allowing the maximumamount of the light we want to capture to reach the image plane.Gary L Peterson is an optical engineer carrying out stray lightanalysis at Breault Research Organization (www.bro.com)
Helping astronomers to see the light
Base your critical EM designs on accurate, reliable data.Handle your toughest EM engineering challenges with
Integrated Engineering Software’s full line of simulation tools.
State-of-the-art solver architecture, parametric design analysisand advancements in speed, performance and functionalityallow you to quickly and accurately model:
Call (+001) 204.632.5636, email [email protected] or visitwww.integratedsoft.com/emsimulation for your full version, 30-day evaluation software.
This photomultiplier tube was modeled in Lorentz 6.1. The simulation illustrates Lorentz’s ability to model secondary emissions calculating:collection efficiency, current efficiency,timing properties and angular response. Image courtesy of ADIT
integratedElectromagnetic
Simulation SoftwareElectromagnetic
Simulation SoftwareElectromagnetic
Simulation Software
■ Electrostatics■ Magnetostatics■ Eddy Currents■ Particle Trajectory and
Beam Optics
■ Full-Wave High Frequency Fields
■ Power Electronics and Electrical Drives
■ And much more…
6 S O F T W A R E C H A L L E N G E S A N D S O L U T I O N S J U N E 2 0 0 5
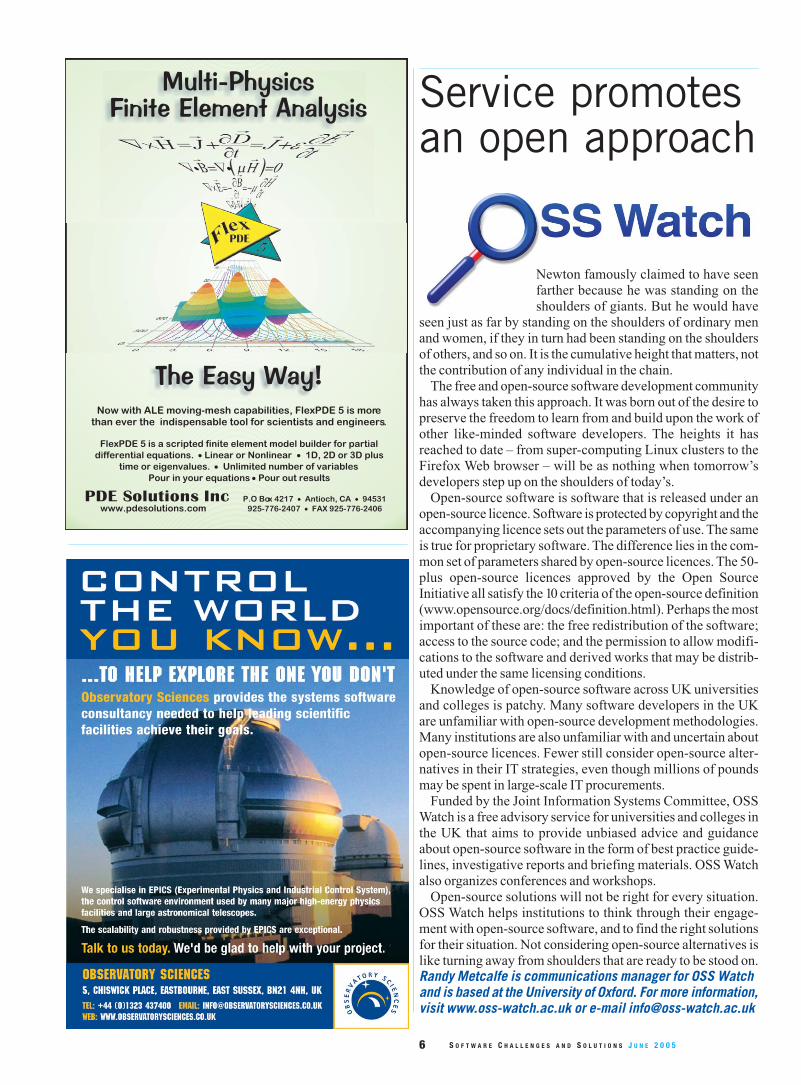
Newton famously claimed to have seenfarther because he was standing on theshoulders of giants. But he would have
seen just as far by standing on the shoulders of ordinary menand women, if they in turn had been standing on the shouldersof others, and so on. It is the cumulative height that matters, notthe contribution of any individual in the chain.
The free and open-source software development communityhas always taken this approach. It was born out of the desire topreserve the freedom to learn from and build upon the work ofother like-minded software developers. The heights it hasreached to date – from super-computing Linux clusters to theFirefox Web browser – will be as nothing when tomorrow’sdevelopers step up on the shoulders of today’s.
Open-source software is software that is released under anopen-source licence. Software is protected by copyright and theaccompanying licence sets out the parameters of use. The sameis true for proprietary software. The difference lies in the com-mon set of parameters shared by open-source licences. The 50-plus open-source licences approved by the Open SourceInitiative all satisfy the 10 criteria of the open-source definition(www.opensource.org/docs/definition.html). Perhaps the mostimportant of these are: the free redistribution of the software;access to the source code; and the permission to allow modifi-cations to the software and derived works that may be distrib-uted under the same licensing conditions.
Knowledge of open-source software across UK universitiesand colleges is patchy. Many software developers in the UKare unfamiliar with open-source development methodologies.Many institutions are also unfamiliar with and uncertain aboutopen-source licences. Fewer still consider open-source alter-natives in their IT strategies, even though millions of poundsmay be spent in large-scale IT procurements.
Funded by the Joint Information Systems Committee, OSSWatch is a free advisory service for universities and colleges inthe UK that aims to provide unbiased advice and guidanceabout open-source software in the form of best practice guide-lines, investigative reports and briefing materials. OSS Watchalso organizes conferences and workshops.
Open-source solutions will not be right for every situation.OSS Watch helps institutions to think through their engage-ment with open-source software, and to find the right solutionsfor their situation. Not considering open-source alternatives islike turning away from shoulders that are ready to be stood on.Randy Metcalfe is communications manager for OSS Watchand is based at the University of Oxford. For more information,visit www.oss-watch.ac.uk or e-mail [email protected]
Service promotesan open approach
P.O Box 4217 � Antioch, CA � 94531
925-776-2407 � FAX 925-776-2406www.pdesolutions.comPDE Solutions Inc
Multi-PhysicsFinite Element Analysis
The Easy Way!Now with ALE moving-mesh capabilities, FlexPDE 5 is more
than ever the indispensable tool for scientists and engineers.
FlexPDE 5 is a scripted finite element model builder for partial
differential equations. � Linear or Nonlinear � 1D, 2D or 3D plus
time or eigenvalues. � Unlimited number of variables
Pour in your equations � Pour out results

8 S O F T W A R E C H A L L E N G E S A N D S O L U T I O N S J U N E 2 0 0 5
What exactly is e-Science? The term was first used by JohnTaylor in 2000 when he was director-general of the researchcouncils in the UK. Taylor’s vision went far beyond simpleelectronic science, and what he said five years ago is still valid:“E-Science is about global collaboration in key areas of science,and the next generation of infrastructure that will enable it.”
E-Science is driven by large-scale scientific research that isincreasingly being carried out through distributed global col-laborations enabled by the Internet. Typically, a feature of suchcollaborative enterprises is the need for access to very largedata collections (which may be distributed across many sites),or very-large-scale computing resources, or both.
The classic example is the data-processing challenge facingparticle physicists at the Large Hadron Collider (LHC), whichis currently under construction at CERN in Geneva. To suc-cessfully analyse the huge volumes of data that the LHC willgenerate, particle physicists will need to coordinate computingacross hundreds of collaborating sites worldwide, and toensure smooth operation 24 hours a day, 365 days a year, for adecade or more (lcg.web.cern.ch/LCG).
Similar challenges are faced in other fields such as Earthobservation, genomics, astronomy and fusion research. In eachcase the emphasis may be slightly different. The challenge maybe to aggregate computing power, using the spare capacity onexisting systems within a single institution to, for instance, helpdetermine the structure of crystals (J. Appl. Cryst. 38 107), or tocombine resources in different institutions (see, for example,eminerals.org). In other cases the emphasis is on data aggrega-tion; perhaps combining data in real time from distributed radiotelescopes (www.evlbi.org), or combining existing data fromcompletely different astronomical archives (www.ivoa.net). Athird example could be scheduling and controlling remoteaccess to a powerful microscope of nuclear fusion experiment(www.ornl.gov/info/ornlreview/v30n3-4/remote.htm).
Despite the different emphasis, each of these challenges hasmuch in common at the technical level. Identifying this com-monality and developing general solutions help to make eachproblem tractable for a practical cost by reusing a commoninfrastructure and thereby enhancing science.
Commonality emerges in another context: reuse. How canwe reuse an expensive calculation already done by a colleague?How can we access and interpret data recorded in previousexperiments? How can we share existing data with collabora-tors? The key to successful reuse is the effective description ofthe data or processes involved. Metadata (data describing thedata or process) is essential to this understanding. The metadataitself covers a huge range, from detailed descriptions of binarydata formats through to carefully standardized definitions of
commonly used technical terms and processes (xml.cover-pages.org/physicsML.html).
The enabling infrastructure for e-Science is often simplycalled “The Grid”. This name reflects the idea that computingand data should be commodities that are relatively straightfor-ward to use – just like electricity from a national power grid –rather than something more specialized, as is the case at pre-sent. Grid computing is the collaborative use of computingresources in multiple administrative domains. Coordinationacross institutions may be required because some resources areunique, or because it is necessary to facilitate collaborationbetween different groups, or to aggregate resources to tackleproblems that are beyond the scope of individual institutions.
It is this sharing of resources across organizations workingtowards a common goal which gives rise to many of the tech-nical Grid challenges; common user authentication and autho-rization, data integrity and security, and efficient automatedresource sharing and scheduling. As the infrastructure to sup-port these endeavours becomes ubiquitous and straightforwardto use, like the Internet itself, then it will be possible to supportmuch more dynamic collaborations across a wider range ofscience. There will be no need to start from scratch and investheavily to design and build your own collaborative IT environ-ment. Standard solutions will already exist, ready for use bysmall and medium-sized groups.
We are not at this point yet, but the potential has been seen bymany people worldwide. Within the UK, the research councilsare supporting the development of a National Grid Service(www.ngs.ac.uk) to provide the core infrastructure, and simi-lar initiatives exist in many other countries. Within Europe theEGEE project is working to ensure interoperability and com-mon standards (public.eu-egee.org).
Moreover, collaboration is not unique to science. The busi-ness world collaborates for similar reasons and hence facessimilar technical problems. If the Grid vision is realized and ashared infrastructure emerges, it will be an expensive optionnot to embrace it. At that point the commercial decision to usethe Grid may be a simple “no-brainer”.Neil Geddes is head of e-Science at the CCLRC RutherfordAppleton Laboratory and director of the UK’s Grid OperationsSupport Centre
Welcome to e-Science and the GridThe large volumes of data beingproduced in scientific research call fora new approach to computation andinformation management
A node of the Grid service at the Rutherford Appleton Laboratory.
CC
LRC

9S O F T W A R E C H A L L E N G E S A N D S O L U T I O N S J U N E 2 0 0 5
AstroGrid aims to create a virtual obser-vatory (VO) for UK astronomers byusing Grid technologies to makeselected databases interoperable andavailable for searching and queryingfrom a single point of access. The projectis also the UK’s contribution to a world-wide effort to create a global VO. The
databases to be included will cover astronomy, solar physicsand solar terrestrial physics, as well as wavelengths from radioto X-ray. Special emphasis is being placed on astronomicaldata sets of importance to the UK community, including theEuropean Space Agency’s XMM, SOHO and Cluster mis-sions, and the UK Infrared Telescope in Hawaii.Relevance to physicists: The AstroGrid VO will be a tool forastronomers and space scientists to extract information andknowledge from astronomical data that would otherwisehave remained hidden. In this way new science will emerge.What happens next? AstroGrid has developed workflowsfor searching data for high-redshift galaxies and for visualiz-ing coronal mass ejections from multi-wavelength solar flaredata sets. A next step will offer improved access to data heldoutside the UK.Details: AstroGrid is funded by PPARC, and is a consortiumof 11 partners. The project leader is Andrew Lawrence at theInstitute for Astronomy in Edinburgh.
Geodise has been set up to harness Gridtechnologies to solve complex designproblems. An initial application hasbeen the use of computational fluiddynamics (CFD) to design aerodynamic
surfaces such as aircraft wings, racing car bodies and gas tur-bine fan blades. The project has developed tools to allow teamsof designers to work in virtual organizations and to seamlesslyaccess widely distributed software, computing power and data-bases. By engaging in a dialogue with the Geodise Web por-tal, the designer can optimize an initial design, produced on aconventional CAD workstation. The dialogue allows the rightmesh, CFD options and optimization models to be selected.Geodise also captures the CFD and design knowledge gainedso that it can be made available to less experienced designers.Relevance to physicists: The Geodise toolkit can be used formany tasks including the design of photonic devices usingfinite element or computational electromagnetics methods.What happens next? A Geodise toolkit has been developedto operate in the MATLAB environment. It is finding diverseapplications in areas such as climate modelling and thedesign of anti-vibration mountings for satellites.Details: Geodise is funded by the EPSRC. The project leaderis Simon Cox of Southampton University. Other collabora-tors and partners include the universities of Oxford andManchester, BAE Systems and Rolls-Royce.
RealityGrid uses Grid technologies tomodel and simulate complex condensed-matter structures and discover new mat-erials. By linking experimental facilitiesor simulations on high-performance
computers at one node with visualizations at another, users canview high-quality near-real-time simulations of systems on avariety of length scales from the nanoscale to the macroscopic.One of RealityGrid’s first successes was to visualize lattice-Boltzmann models of oil invading water-saturated rock.Relevance to physicists: RealityGrid has the potential to beapplied to any scientific simulation and visualization on thenano- or mesoscale.What happens next? RealityGrid participated in theTeraGyroid project, which linked the UK’s supercomputingfacilities with three US supercomputers to visualize a lattice-Boltzmann model containing more than 1 billion lattice sites.The RealityGrid system is now being applied to a variety ofproblems including drug design and the modelling ofprocesses in heart disease and cancer as part of the IntegrativeBiology e-Science project (www.integrativebiology.ox.ac.uk).Details: RealityGrid is funded by the EPSRC, and itsprincipal investigator is Peter Coveney of University CollegeLondon. Six universities and six companies – includingSilicon Graphics and Advanced Visual Systems of the US –are involved.
GridPP is the UK’s contributionto the international effort todevelop a Grid infrastructurecapable of handling the hugeamounts of data that areexpected when the LargeHadron Collider (LHC) goesonline at CERN in 2007. Theproject is working in three main
areas: developing applications to allow particle physicists tosubmit data to the Grid for analysis; writing middleware tomanage access security and the distribution of computingjobs around the Grid; and deploying computing infrastruc-ture at sites across the UK to build a prototype Grid.Relevance to physicists: GridPPwill be essential for particlephysicists who need to analyse more than 10 petabytes of dataa year from the four major experiments at the LHC.What happens next? A working Grid test bed, with morethan 1000 computers and equipment at 17 sites in the UK, hasengaged in a couple of “data challenges” as part of prepara-tions for the LHC. The next task is to extend this Grid to theequivalent of 10 000 PCs.Details: GridPP is funded by PPARC and the project leader isTony Doyle of Glasgow University. It is by far the largeste-Science project in the UK, and involves more than 100researchers at 19 universities, plus the CCLRC and CERN.
RealityGrid (www.realitygrid.org)Geodise (www.geodise.org)
GridPP (www.gridpp.ac.uk)AstroGrid (www.astrogrid.org)
Judy Redfearn ([email protected]) is communications officer for the Joint Information Systems Committee
CER
N
RO
LLS-R
OYC
E

11S O F T W A R E C H A L L E N G E S A N D S O L U T I O N S J U N E 2 0 0 5
A vast array of experimental data has tobe collected and analysed when explor-ing the properties of surfaces on thenanoscale. When working on heliumatom-scattering experiments in the sur-face physics group at CambridgeUniversity, for instance, we often had tofilter, Fourier transform and then scaleour data sets before plotting them. Otheroperations we had to perform routinelyincluded curve fitting and deconvolu-tion. In this work we were greatlyhelped by a numerical software packagecalled MATLAB.
MATLAB operates on matrices,which means that a whole data set can bemanipulated with one command. This iscomplemented by a wide range of math-ematical functions that are available atthe command line, along with powerfuldata visualization functions and a range of interactive “GUI”tools. The language is much quicker to learn and use than tra-ditional programming languages, and is more powerful thanalternatives like spreadsheets.
The surface physics group at Cambridge also uses intensive
numerical simulations, traditionallywritten in Fortran, to simulate its meas-urements within the controlled environ-ment of a computer. MATLAB providespowerful post-processing and visualiza-tion of the simulation output, whichfacilitates comparison with the experi-mental measurements. The groupincreasingly finds that it saves time tocombine these two stages and write newsimulations in MATLAB entirely.
Recently, the group has also used thesame approach to control its new helium“spin-echo” system (see figure andPhysics World September 2004 p22).Users are able to quickly write flexibledata-taking scripts, and also process andvisualize the data when the experimentis in progress, usually in just a few linesof script. The system has proved popular
with group members, particularly as it means a single system isused for both acquisition and analysis.Andrew Jardine worked in the surface physics group atCambridge (www-sp.phy.cam.ac.uk) for six years beforejoining The Mathworks (www.mathworks.co.uk) last month
Software simplifies surface analysis
ener
gy (m
eV)
0
16
4
6
8
10
12
14
10 20 30 40
Data on the helium-lithium fluoridepotential as revealed by helium atomscattering and plotted with MATLAB(A Jardine et al. 2004 Science 304 1790).
azimuthal angle (degrees)

12 S O F T W A R E C H A L L E N G E S A N D S O L U T I O N S J U N E 2 0 0 5
The numeracy and problem-solving skills of physicists havelong been attractive to employers in computing, and a varietyof career paths are open to physics graduates interested in soft-ware development. The first path starts with the complete shiftfrom physics to the commercial IT sector. Some software com-panies – especially the larger ones, with well-developed train-ing programmes – will hire new physics graduates, providedthat they demonstrate aptitude and enthusiasm for IT. Not sur-prisingly, however, these graduates are at a disadvantage com-pared with those from computer science programmes.
Computer programming comprises an increasingly impor-tant part of most physics degrees – and courses are now morelikely to be offered in languages that are relevant to commer-cial IT (for example, Java rather than Fortran) – but thereremain significant differences between what physics studentslearn and what industry needs.
For the physicist, the focus is on solving particular problems,and what matters is that the software the physicist writes givesthe correct answer. In the commercial sector, software mustsatisfy a number of other criteria, including ease of mainte-nance and use, flexibility for future development, and porta-bility to a variety of hardware platforms.
Another difference is the way that the programming itself isundertaken. Programming is typically a solitary activity withinphysics degrees, with each student working alone towards thesolution of a particular problem. Software development in thecommercial sector is, by contrast, a far more collaborativeprocess. Most commercial software is written by teams – oftengeographically distributed – with individual developers con-tributing efforts according to their particular expertise. Thischanges how the development process works: more time goesinto the design of the software, to ensure that the componentsdeveloped by different people will fit together well, and proce-dures must be put in place to prevent problems arising whenmultiple people can edit the same piece of code.
Physics graduates who want to develop commercial soft-ware must therefore learn about “software engineering”, andmany universities in the UK offer IT conversion courses at theMSc or diploma level to meet this demand. As well as teachingsoftware engineering and allowing students to develop theirprogramming skills, these courses cover topics that are rarelyaddressed in physics degrees, but are necessary for commer-cial software development. Examples of such topics includedatabase systems, networking, computer architectures andoperating systems.
Many physics graduates may not wish to leave science com-pletely, and a second possible career path is to develop soft-
ware that is needed to support scientific research. The compu-tational demands of cutting-edge research are increasingrapidly across a wide range of scientific areas, driven by thedevelopment of e-Science and Grid computing (see p8).
In some disciplines (including physics and astronomy) it isthe scientists themselves who work with the new technologies,but in others, notably the life sciences, this tends not to be thecase. This means that there is a need for software developerswho combine IT skills with an understanding of science that issufficient to enable them to work closely with researchers.Such opportunities are available in both the academic and thecommercial sectors – notably in the biomedical and pharma-ceutical industries – for graduates with the required expertisein the range of technologies used in e-Science. These sameskills are also needed for those pursuing a third career path, inacademic research in the physical sciences, where it isresearchers themselves who tend to develop expertise in the
Grid boosts job opportunities forphysicists in software developmentThe rise of e-Science and Gridcomputing offers new careerpossibilities for physics graduates
A selection of postgraduate IT courses in the UK
Glasgow www.dcs.gla.ac.uk/courses/MSc_ITHeriot Watt www.postgraduate.hw.ac.uk/course/151Keele www.keele.ac.uk/depts/cs/courses/msc/
content/itcoursecontent.htmlLeeds www.comp.leeds.ac.uk/MSc/compsci/
index.shtmlLiverpool www.liv.ac.uk/study/postgraduate/
taught_courses/laureate_information_technology_msc.htm
Manchester www.cs.manchester.ac.uk/Study_subweb/Postgrad/programmes.php
Nottingham www.cs.nott.ac.uk/Institute/courses_2004.htm
Queen Mary www.dcs.qmul.ac.uk/postgraduate/msc/mscit.html
Many physics graduates pursue careers in IT.
NAT
ION
ALE-
SC
IEN
CE
CEN
TRE

13S O F T W A R E C H A L L E N G E S A N D S O L U T I O N S J U N E 2 0 0 5
new e-Science and Grid technologies.It is graduates taking the second or third career paths – devel-
oping software in support of research in either the physical orlife sciences – for whom the new e-Science MSc/diploma pro-gramme at Edinburgh has been developed. This programmecombines coverage of the basic principles of distributed orGrid computing with hands-on experience in a range of currenttechnologies. Students taking the full MSc also undertake anindividual project on a real e-Science research problem. Sucha project might involve working with a biologist to build andpublish a new database on the Web, helping an astronomer tocollect and analyse data held in archives throughout the world,or running a series of particle physics data analysis or simula-tion jobs on distributed computational resources via the Grid.
Anumber of other universities in the UK currently offer sin-gle courses on e-Science or Grid computing – typically as partof a computer science MSc – but Edinburgh is the first to pro-vide a full MSc/Diploma dedicated to e-Science. The course isopen to science graduates as well as computer scientists, and isdesigned to prepare students equally well for careers in acade-mic research, industry and the commercial IT sector.
Whichever path you choose, there are postgraduate coursesavailable to help you (see table). These courses will build onthe IT skills you have developed during your physics degreeand will prepare you for a career in software development.Robert Mann is a lecturer at the School of Physics,University of Edinburgh, and programme director of its newMSc/Diploma programme in e-Science (www.ph.ed.ac.uk/postgraduate/degrees/msc_escience.html)
Improve your analysis and graphing capabilities with SigmaPlotSigmaPlot provides all the fundamental tools you need to analyze your data - frombasic statistics to advanced mathematical calculations.You get a full range of graphing options and over 80 2-D and 3-D graph types.With SigmaPlot, you can create clear,compelling graphs.
Fit your data easily and accuratelyUse the Regression Wizard to fit nearly any equation and get the results in seconds.Automatically determine initial parameters, writes a statistical report, saves the equation to the note book and adds your results to existing graphs or creates a new one.
Create stunning slides, high-quality graphics for reports or journal publication.Generate customized reports with SigmaPlot’s Report Editor or embed yourgraphs in any OLE container. Quickly send your high-resolution graphs to reportsor presentation documents, or share them online using the WebViewer.
Publish your work anywhere
Create professional, publication-quality graphs without leaving the Excel environment. SigmaPlot’s direct access from Excel eliminates tedious cut-and-paste data preparation steps.
Access SigmaPlot directly from Microsoft Excel and easilypresent your charts in Microsoft Word and PowerPoint
3.(3
456/#
) ! !))
7/##
!
!) ) ) !!) ) ) ! !) ) ) !!) ) ) !
== == = = == ==
()!7%()!7%; > >7 +7 +
%
* +," *-!
,".-/ *-
!
0
(!!
!0’
00’
1 2
2
’)0
0 )2
!
/2
! ! ’ !
’
!0)
!
’
(!!’
!0!0
!!
!
(!
! ’
!
! )
!
!!!!
!
!
!
!
"#"
$%#&!
’
(
(
(
(
"#"
$%#
&!
(
(!)
(!
()
)
!
!)
Isn’t it time you moved beyond
spreadsheets?
Download a Free trial copy today!
www.systat.com/downloads

Support your professionand advance your field…
The Premier Professional Society
for Applied Mathematicians and Computational Scientists
JOINTTOO DDAAYY
Society for Industrial and Applied Mathematics3600 University City Science Center,
Philadelphia, PA 19104-2688Phone: +1-215-382-9800 or
1-800-447-7426 (toll free in USA and Canada)Fax: +1-215-386-7999 · Email: [email protected]
www.siam.org
Networkwith your peers
to explore common interests
Enhance your visibility in the field
Gain accessto cutting-edge research
Support outreachto students
Support advocacyfor research funding
Guide the future of the organization and the profession
MATHEMATICS & TECHNOLOGY FOR OPTIMIZEDPERFORMANCE
NAG has the answer.Let’s face it. Results matter. Full stop. That’s why NAG’s numerical and statistical components underpin thousands of programsand applications spanning the globe in industries as diverse as financial analysis, science, engineering and research.
They are so widely used and trusted because of their outstanding and unrivalled quality, reliability and portability. Whether it is a single PC or a cluster of theworld’s largest supercomputers, NAG has the numericalsoftware capabilities to fit your model.
To see how NAG components can quickly andeasily enhance your applications and torequest a free trial, please visit:
www.nag.co.uk/info/pw1
Or contact our sales team at:The Numerical Algorithms Group Ltd, Wilkinson House, Jordan Hill Road, Oxford OX2 8DR, UKTel: +44 (0)1865 511 245 Fax: +44 (0)1865 310 139 Email: [email protected]
The globally renowned NAG Library now features over 1450 mathematicaland statistical routines making it the largest commercially available collection of algorithms available today.
RESULTS MATTER, TRUST NAG
How do you add mathematical and statistical functionality to your applications?

15S O F T W A R E C H A L L E N G E S A N D S O L U T I O N S J U N E 2 0 0 5
The use of visualization in the analysis of numerical datasets iswell established, and a large number of toolkits enabling usersto create visualization applications are currently available.IRIS Explorer is an example of such a toolkit. Its users con-struct applications by connecting software building blocks ormodules. Each module corresponds to a step in a dataflowpipeline – for example, there are modules to read data fromfiles in a variety of formats, to apply filters to the data, to trans-form it using various visualization techniques, and to renderand manipulate geometry.
The modules appear on screen as graphical blocks in a visualdevelopment interface (see figure). The application is thenbuilt by selecting or replacing modules and making or break-ing dataflow connections between them. Once constructed, theuser interface (i.e. the widgets that control the modules’behav-iour) can be interactively edited before the application is saved.
Because IRIS Explorer is extensible, users can add their ownmodules and share them with others. For example, a collectionof collaborative modules has been developed that allows visu-alization applications running at separate locations to commu-nicate by sharing data, modules and connection information.The collaborative extensions to IRIS Explorer have beenincorporated into the commercial release of the toolkit, makingit one of the first multi-user visualization systems in the world.
More recent work with IRIS Explorer has seen its extension
to support “tracking” and“steering”. Tracking is thedynamic display of resultsfrom a time-dependent simu-lation, while “steering”allows the user to exploremore interesting regions ofparameter space by adjustingthe simulation’s input para-meters while it is running.Steering fits well into modernGrid environments wherecomputing tasks are distrib-uted between the desktop andremote servers. Thus, the sim-ulation can be executed
remotely while the visualization runs locally, giving the usercontrol over the progress of the calculation from the desktop.Support for tracking and steering will be incorporated into thenext commercial release of the package, which will be avail-able from NAG Ltd later this year.Jeremy Walton ([email protected]) is a senior consultantat NAG Ltd (www.nag.uk); Jason Wood is a researchassociate and Ken Brodlie is professor of visualization atthe School of Computing, Leeds University
Image: Prototype display of a simulated event, courtesy of the ALICE collaboration.
FAST
Publish your work in Journal of Physics G. Find out more about the services offered by visiting www.iop.org/journals/jphysg
Journal of Physics G:
Nuclear and Particle Physics
publication and peer review (Referee reports in 46 days on average)
FREE papers online for 30 days from web publication
EASY online submission and article tracking
Toolkit aids visualization techniques
The visual programminginterface in IRIS Explorer.The modules are selectedfrom the palette (left) anddragged to the area at the top,where they are connected tocreate the application.