180
SOFTWARE MEASUREMENT EUROPEAN FORUM PROCEEDINGS 25 - 26 June 2012 Casa San Bernardo, ROME (ITALY) EDITOR Ton Dekkers Galorath International Ltd. COVER PHOTO Ton Dekkers

SOFTWARE MEASUREMENT EUROPEAN FORUM
PROCEEDINGS
25 - 26 June 2012
Casa San Bernardo, ROME (ITALY)
EDITOR Ton Dekkers
Galorath International Ltd.
COVER PHOTO Ton Dekkers

Proceedings 9th Software Measurement European Forum, Rome 2012

Proceedings 9th Software Measurement European Forum, Rome 2012
i
CONFERENCE OFFICERS Software Measurement European Forum 2012 Conference Manager Laura Ghisleri, Istituto Internazionale di Ricerca Srl, Italy Conference Chairperson Roberto Meli, DPO - Data Processing Organization, Italy Program Committee Chairperson Ton Dekkers, Galorath International Ltd., Netherlands

Proceedings 9th Software Measurement European Forum, Rome 2012
ii

Proceedings 9th Software Measurement European Forum, Rome 2012
iii
The Software Measurement European Forum 2012 is the 9th edition of a successful event
for the software measurement community. As for most of the years SMEF will be located in Rome, Italy. SMEF has become a leading worldwide event for experience interchange and knowledge improving on a subject that is critical for the ICT governance.
We are aiming to repeat and build on the past successes. The 2012 event offers, therefore,
a special program designed to illustrate the best practices, recommendations, tools, techniques and implementation processes of software measurement in order to optimise the processes of planning, negotiation, execution and control of software contracts.
Using software metrics in contracts is not only a subject for technicians: all the parts that are involved in the procurement process should be aware of the opportunity and risks of using it and on the more effective ways of adoption. This year’s event will focus on this area resulting as an in depth analysis of methods, models, experiences.
The event 2012 will have a very narrow and strong focus on: Software Contract Governance by metrics! Everything you need to manage customer-supplier formal and substantial relationships. Because of the specific focus, the conference is setup based on papers/presenters by a call
for paper and invitation. With that we achieved a balanced program that’s reflecting the focus. The aim is to provide a set of interesting topics:
• learn how to use software measures to better manage software contracts; • look at practical experiences of real market players; • explore the state of the art and the borders of the discipline; • compare your experience with other organisations in the software industry; • establish contacts and exchange knowledge with colleagues and professionals; • get inputs and advices on the development of methods, tools and knowledge from
opinion leaders in the field.

Proceedings 9th Software Measurement European Forum, Rome 2012
iv
Istituto Internazionale di Ricerca, part of Informa plc, and DPO srl (Data Processing
Organisation), leader company in software measurement, in cooperation with Simple Function Point Association (SiFPA) and Galorath International ltd, are delighted to announce the 9th Software Measurement European Forum.
Laura Ghisleri Roberto Meli Ton Dekkers June 2012

Proceedings 9th Software Measurement European Forum, Rome 2012
v
TABLE OF CONTENT
25 - 26 JUNE 2012
In alphabetic order presenters
1 When metrics mean business Mauricio Aguiar
13 A practical approach to validate actual functional size measures in a contract
Marco Arzilli, Franco Perna, Roberto Meli
35 Parametrics in contracts is also beneficial for suppliers Ton Dekkers
37 Measuring Software Development Processes with Six Sigma
Dr. Thomas Fehlmann
45 The meaning of software measurement in a contractual relationship Marco Gentili, Pierfranco Gennai
67 Successful software project outsourcing - How to limit the risk of failures
Harold van Heeringen
83 Software Contract Management by metrics: a methodological framework Roberto Meli
85 How to state a fair unitary price for FP in a tender context
Roberto Meli

Proceedings 9th Software Measurement European Forum, Rome 2012
vi
101 Software Comprehensive Count with Quality Indicators (SCCQI) A comprehensive approach to Software Size Measurement Jasveer Singh
111 Beyond perception: Peeking over the wall to get real control…
Eric van der Vliet, Paul Siemons
125 Through the Looking Glass: What does a Tender Document actually tell you? George Wilkie, Philip Morrow, Ian McChesney, Charlie Tuxworth
APPENDIX 143 Conference Program
155 Author’s affiliations

Proceedings 9th Software Measurement European Forum, Rome 2012
vii

Proceedings 9th Software Measurement European Forum, Rome 2012
viii

Proceedings 9th Software Measurement European Forum, Rome 2012
1
When metrics mean business
Mauricio Aguiar
Abstract Measurement specialists often wonder why so many Brazilian organisations use
functional sizing as a basis for software development contracts. As a matter of fact organisations from several industries such as banks, airlines, telecommunication companies, and government agencies use function points as a basis for software development contracts. The Brazilian government has issued a directive known as “IN04” instructing all government agencies to use metrics – usually function points – in software development contracts to define productivities, prices, and quality criteria. In those organisations most software development services are priced and billed based on the functional size. Even support activities such as measurement and testing have been known to be priced and billed based on function points. Function point analysis is now an indispensable part of the business cycle and a daily activity in many Brazilian organisations. This paper discusses the business drivers that have made Brazil the number one function point user in the world as well as the business processes involved.
1. Introduction Having been founded in 1986, The International Function Point Users Group (IFPUG) is
probably the oldest software measurement association in the world. As of April 2012, Brazil was the number one country in IFPUG memberships, with 34% of all IFPUG members, followed by the U.S. (22%) and Italy (13%). IFPUG certifies individuals that pass the IFPUG exam. As of March 2012, Brazil had 42% of all IFPUG certified individuals, followed by Italy (20%) and the U.S. (13%) [1]. These numbers make Brazil the number one country in function point utilisation. As a result several software measurement companies and independent consultants appeared in the Brazilian market in the last decade. Even though there is no publicly available data, a single Brazilian company claims to count 60,000 function points per month [2]. At the cost of US$ 1,000 per function point, that number could mean US$ 60,000,000 changing hands each month based on function point counts performed by just one Brazilian software measurement organisation [3].
There are several possible explanations for the growth of software measurement in Brazil
in the last several years. The following paragraphs intend to shed some light on this topic.

Proceedings 9th Software Measurement European Forum, Rome 2012
2
2. A Very Short History of Software Measurement in Brazil The first Brazilian book on software measurement was Aguinaldo Aragon’s “Gerência
Efetiva de Software Através de Métricas” (“Effective Software Management through Metrics”) published in 1995. Aragon’s book included sections on function point analysis, COCOMO, and linear regression as effort estimation techniques. It also presented several applications of metrics to software management [4].
Function point analysis has been in use in Brazil since the eighties. However, it became more popular in the nineties, when UNISYS Eletronica became its main local sponsor. This was the first Brazilian function point movement, or the “First Wave”. UNISYS Eletronica joined IFPUG in 1989 and started sending employees to IFPUG conferences in 1990. UNISYS Eletronica promoted function point user meetings in Brazil, called ENUPFs, from 1991 to 1994, featuring several international participants. UNISYS Eletronica sponsored a Certified Function Point Specialist (CFPS) exam in Brazil where a few of its employees became CFPS. Unfortunately, for internal reasons that company severely reduced its FPA sponsoring efforts around 1995 so there were no significant changes in the Brazilian measurement market until 1998. The first Brazilian function point analysis book was published in 1996 [5].
In 1998 a group of Brazilians became IFPUG members and founded the Brazilian Function Point Users Group (BFPUG) that had a significant role in promoting software measurement and function point analysis in Brazil. This was the second Brazilian function point movement, or the “Second Wave”. BFPUG received active support from IFPUG starting 1999. As a result, a Brazilian was elected to the IFPUG Board of Directors in 2000. After a couple of years another Brazilian joined the IFPUG Board of Directors. A Brazilian – this author – was IFPUG President from 2005 to 2007. Also as a part of the Second Wave, the second Brazilian function point analysis book was published in 2003 [6].
The CFPS exam was brought to Brazil for the second time in 2001 and became a regular event, being held twice a year in three or four major Brazilian cities until its automation in 2008. A total of 1098 exam candidates sat for the exam in Brazil from 2001 to 2007. Many received the CFPS designation.
A possible reason why The Second Wave was more successful than the first is that the former came as a result of Brazilian government initiatives. Some parts of the Brazilian government were concerned with the cost of software development and were looking for ways of managing and possibly reducing that cost. Caixa Econômica Federal (“CAIXA”), a Brazilian government bank, was the leader of that movement. CAIXA decided to transition its software development projects to a “price per function point” model and launched a large function point based RfP in 1999. Other government agencies such as the Brazilian Post Office (“Correios”) and the Brazilian IRS Data Processing Service (“SERPRO”) soon followed.
Proceedings 9th Software Measurement European Forum, Rome 2012
3
A government directive known as “IN04” was issued in 2008 (updated in 2010) and stated that IT services should not be billed based on effort (person-hours) or job positions (persons-month) [7, 8]. This confirmed function points as the measure of choice for Brazilian government software development contracts. Those facts got the attention of private organisations such as banks, telecom companies, airlines, and others that would also adopt variations of the method.
The success of function point analysis in Brazil led IFPUG to hold its 2010 annual conference in Sao Paulo, Brazil’s largest city. ISMA Cinco (ISMA is the International Software Measurement & Analysis Conference. “Cinco” is Portuguese for “Five”) was successful both in terms of international participation as well as local attendance. The conference featured international speakers such as Ricardo Valerdi (MIT), Carol Dekkers (Quality Plus Technologies), Joe Schofield (IFPUG Vice-President), Donald Beckett (Quantitative Software Management), Pam Morris (Total Metrics), Luigi Buglione (Engineering IT), Thomas Cagley (IFPUG Past President), Terry Vogt (Booz-Allen-Hamilton), Daniel Galorath (Galorath Corporation), and many others.
BFPUG has held an annual software measurement and analysis conference in Brazil since 2009, featuring international speakers from the software & systems measurement arena.
In November 2010 the Brazilian government, through its Ministry of Planning, published guidelines to the application of function point analysis to software development contracts [15]. In March 2012 Brazil had 42%, of all CFPS, making Brazil the number one country in number of IFPUG-certified specialists.
As more Brazilian organisations adopt the “price per function point” method, it is likely
that more measurement-related methods and techniques will become popular. For instance, the COCOMO II estimation model and the Practical Software & Systems Measurement framework are already used in Brazil; The Netherlands Software Metrics Users Association (NESMA) methods for early size estimation and enhancement counts are also used; the COSMIC measurement method is increasing its popularity, as well as the recently published IFPUG Software Non-functional Assessment Method (SNAP).
3. Why Brazilian Organisations Use Functional Sizing in Software
Development Contracts A typical software development project includes a request for proposal issued by the
acquirer. Following that request, one or more suppliers present their proposals. These are usually based on an estimated amount of effort – a number of person-hours or person-months that constitutes the main input to the pricing process. Because the estimated amount of effort is highly dependent on the supplier’s resources and development process bids may not be easily evaluated by the acquirer.

Proceedings 9th Software Measurement European Forum, Rome 2012
4
This pricing mechanism could be called “process-oriented pricing”, where the price is based on the inputs – the resources needed to complete the project. An alternate pricing mechanism could be designated “result-oriented pricing” where the price would be determined by the output, i.e., the amount of software delivered.
Process-oriented pricing, the more traditional way of pricing services, puts control in the hands of the supplier. This happens because the acquirer does not have the expertise or information to assess the supplier’s estimate. A simple analogy may illustrate this situation. Suppose you are on the road and your car breaks down. You manage to find a car repair shop nearby, where they agree to take a look at your car and tell you to come back after a couple of hours. When you come back the chief mechanic hands you a budget with several parts to be replaced and an estimated number of work hours. If you are not at least an amateur mechanic you will not be able to make a rational decision. In this situation the price is completely controlled by the supplier. Car repair shops will probably continue to control prices in their market, but there is a better way in the software development arena. Far from being new, these better methods have been in use for more than ten years.
The government of the State of Victoria, Australia, is the creator of southernSCOPE and
refers to it as the “$ per function point” method. According to the southernSCOPE Reference Manual, the method “results in the customer paying the software developer an agreed price for each ‘unit’ of functionality in the delivered software” [9]. The Finnish Software Metrics Association (FiSMA) built on the southernSCOPE concept and launched the northernSCOPE method, allegedly an improved version of southernSCOPE [10]. Other countries where the government has recommended or required the use of function points are Italy and Korea.
Because that kind of pricing mechanism is based on the outputs rather than the inputs, the
“$ per function point” or “price per function point” method is a result-oriented pricing mechanism. In this type of method the price is controlled by the client. That is probably the main reason why Brazilian organisations have been consistently transitioning to that software acquisition method in the last several years.
It is important to note that the “price per function point method” could also be called the “price per functional size unit” method, since any functional size unit may be used in the method, not necessarily function points.
Suppliers initially tend to oppose the change to the new method, possibly for fear their profits will decrease. That may actually happen in the beginning, but as they learn to work with the method they realise their risks tend to be much lower than with fixed-price contracts, so they tend to become supporters of the “price per function point’ way of doing business.

Proceedings 9th Software Measurement European Forum, Rome 2012
5
Functional size measures can serve as the basis for a result-oriented pricing method because they:
• are result-oriented by definition, as they measure the output (software) and not the input (work hours);
• can be understood and verified by both the acquirer and the supplier, bringing transparency to the business relationship;
• can be standardised (IFPUG, MkII, COSMIC, and NESMA function points have become ISO standards [11]);
• can be benchmarked (for example, see the ISBSG [12]); • can be used to manage the project scope [9, 10].
All those reasons have led Brazilian organisations to use functional size measures in
software development contracts for new developments as well as enhancements. Acquirers aim to get control of the pricing process and ultimately pay lower average prices. They also want to be able to manage project scope and schedule, make sure budgets are not exceeded, and pay only for software actually required and delivered. Suppliers want to make sure every change request is adequately measured so that they get correctly paid. They want to guarantee that if the system size increases so does their revenue. If wisely used, functional size measures will support all those contract objectives.
4. How Brazilian Organisations Use Functional Sizing in Software
Development Contracts Brazilian organisations use functional sizing in software development contracts according
to several business models. Before getting to those particular models, it will be useful to address the main types of models used.
4.1. Types of Models A few types of models are used with functional sizing. Each has specific characteristics
and serves a different purpose, so it is very important to distinguish them. Here we will consider explanatory, predictive, and prescriptive models.
Explanatory models seek to understand phenomena, discover associations, identify causes and effects, and acquire knowledge. In the social sciences they are often used to understand behaviour, as well as to support and guide decisions. These models need information not available early in the cycle and are typically used after all the facts are known. One general example would be an explanatory model to find the causes of a problem in order to prevent it from happening again. An example from the software measurement context would be to model productivity as a function of several variables in order to guide productivity improvement initiatives.
Proceedings 9th Software Measurement European Forum, Rome 2012
6
Predictive models seek to predict the future behaviour of a variable, or of a set of variables. They are usually based on the past behaviour either of the target variable, or of associated variables. These models are used by estimators. Predictive models ideally leverage existing data as well as estimator expertise. Several estimation models are known to the software measurement community, some being implemented by commercial software tools. One example would be to model effort as a function of size and past productivity in order to estimate the effort of a project.
Prescriptive models are used to regulate relationships. A prescriptive model can be seen as
a system of business rules designed to implement a business agreement. A predictive model may be used to calibrate a prescriptive model. Once the prescriptive model is calibrated it should be self-contained. Prescriptive models are not to be confused with predictive models. An example would be a model to set prices per function point for different project types according to a set of rules.
The main use of function points in Brazil is in prescriptive models. Those are not estimation models.
4.2. Function Point Based Business Models A simple definition of a business model is “a way of doing business”. The most common
function point-based business models used in the Brazilian community are estimation models and pricing models.
Estimation models are predictive models used to calibrate a prescriptive model. Before
using the “price per function point method” an organisation will typically perform a study to determine the ideal price per function point to be paid the supplier. That type of study includes the definition of project types, statistical analysis of historical and benchmark data, specific data collection, as well as the elicitation of business objectives. The outputs of such a study will be project types, productivity ranges, prices per function point, and/or possibly other measures of interest. Those numbers will be used in a prescriptive model that will ultimately be part of a contract. It should be noted that a contract for the development of a new software system will have different estimation requirements than an umbrella contract for an unknown number of enhancements to be performed over a period of years.
The most basic type of estimation model defines project effort as the product of size (in function points) and productivity (in hours per function point). Productivity is sometimes called delivery rate and usually varies with project type, being determined in a specific study as described above. Some more sophisticated estimation models – parametric models – define project effort as a function of size and several other factors.

Proceedings 9th Software Measurement European Forum, Rome 2012
7
All estimation models use statistical techniques in their calculations. Some models like COCOMO II use more specialised techniques such as Delphi and Bayesian Statistics. Several models are implemented by tools such as SEER, SLiM, COSTAR, PRICE-S, KnowledgePLAN, Capers Jones’s SRM, and others. In addition to contracts, estimation models are used in budgets, RfPs, make or buy studies, etc.
Pricing models are prescriptive models that establish the pricing and billing rules to be
used in a software development contract. Those models can become quite complicated in contracts that deal with several types of service. While there are several model variations, only a few basic pricing models are used in Brazil, typically the Productivity-based Model, the Price-per-FP Model, and the Baseline-based Model.
The Productivity-based Model is based on the simple estimation model that defines effort
as the product of size (FP) and productivity (Hours/FP). There will be a distinct productivity for each project type. Each new development or enhancement is sized in function points. The FP size is multiplied by the corresponding productivity giving the number of effort hours. The number of hours is multiplied by the contract price per hour giving the amount to be paid the developer.
The Price-per-FP Model simply assigns a different price per function point for each
project type. Each new development or enhancement is sized in function points. The FP size is multiplied by the corresponding price per FP giving the amount to be paid the developer.
The Baseline-based Model assigns a price per function point to an installed application baseline. A fixed monthly fee is charged for a service package, e.g. application maintenance and support. The price per function point is periodically updated as the application baseline grows. A service level agreement (SLA) handles all the details, including schedule, quality, incentives, penalties, etc.
Several other models are in use in Brazil, of which the following deserve to be mentioned: Defect-based Model – This is a quality control model. A penalty is associated with a
defect threshold, typically based on a defect density measure (defects per function point)... Negotiation-based Model – Even though this is a prescriptive model, it is negotiation-
intensive. The supplier receives a request for proposal and is required to respond with the functional size, the number of hours, and the price estimated to complete the project. The acquirer receives the proposal and enters the FP size into an estimation model not necessarily known by the supplier. If the number of hours or price returned by the estimation model is greater than the number provided by the supplier, the acquirer accepts the proposal.

Proceedings 9th Software Measurement European Forum, Rome 2012
8
Otherwise the acquirer rejects the proposal and starts a negotiation process to bring the number of hours or price to the level indicated by the estimation model.
Estimation models used in this type of business model are not always objective. Some Brazilian acquirers use a customised COCOMO-like model in this manner.
Phase-based Model – Some acquirers outsource different parts (phases) of a project to
different suppliers. For example, one supplier may develop the software product and other supplier may test it. In this business model each project phase is assigned a percentage of the total lifecycle, and the price per FP is divided accordingly. Each supplier is paid according to the defined project phase percentages and the project phases they are assigned to. Phase percentages are typically defined using historical data.
5. Technical Considerations Related to the Use of Functional Sizing in
Software Development Contracts Even though there are many benefits associated with the use of functional sizing in
software development contracts there are still many issues to be resolved. Those have been addressed by Brazilian acquirers and suppliers both from the government and private sectors.
5.1. Predictive versus Prescriptive Models One issue has to do with the difference between predictive and prescriptive models.
Because most of the software development market still uses conventional effort-based pricing specialists tend to focus on predictive models to estimate effort. However, in Brazil the most important use of functional sizing is in pricing and billing. Even though there are similarities between predictive and prescriptive models, there are also differences that must be considered before using an estimation technique as a basis for a pricing model. A few of them are listed on Table 1 below.
Table 1: Estimation vs. Pricing
Estimation (Predictive Model) Pricing (Prescriptive Model) 1. Estimated value should be close to actual 1. Prescribed value should be close to actual 2. Method is expected to give approximate
results 2. Method is expected to give exact results
3. Different estimators may produce different values (depending on their expertise and skill)
3. Different model operators must produce the same values
4. Input values do not need to be objective – may depend on estimator’s opinion/assessment
4. Input values must be objective – must not depend on estimator’s opinion/assessment

Proceedings 9th Software Measurement European Forum, Rome 2012
9
Both models share the goal of producing values that should be as close to the actual values as possible. Even though neither will be able to match the actual values exactly, both are expected to approximate them in the long run. Estimating models are expected to give approximate results. A slight change in the inputs may not be reflected in the outputs. On the other hand, pricing models are expected to give exact results. A small change in the inputs should create a (hopefully small) change in the outputs.
Different estimators are expected to produce different results. A more skilled and more
experienced estimator is expected to produce a better estimate than a novice, whereas an operator of a pricing model is expected to follow exact rules and produce exactly the same result as any other trained operator.
Estimating models often have subjective parameters. For example, the COCOMO II
estimating model has parameters such as ACAP (Analyst Capability) and PCAP (Programmer Capability) with ratings 15%, 35%, 55%, 75%, and 90% [13]. An analyst or programmer team that falls in the 15% level is rated very low – at the estimator’s discretion. Two distinct estimators could potentially disagree on those levels. Estimation models often have to be customised before they can be used for pricing purposes. Pricing models, on the other hand, have no room for ambiguity or subjectivity.
5.2. Items Not Covered by Functional Sizing By definition, functional sizing does not take non-functional items into account. This
leaves room for unaccounted effort variation in projects where effort is predicted or prescribed using functional measures only. A simple solution is to define several different project types and assign them different productivities, hoping they will account for all non-functional effects. However, there will always be variation even in a well specified and calibrated model. Another solution would be to use a parametric model such as COCOMO II, where all variation due to factors other than size would hopefully be accounted for by model parameters (there are 22 of them in COCOMO II).
This works well for estimation, but suppliers and acquirers are not happy when variation is not accounted for. In Brazil some suppliers built tables that transform certain non-functional characteristics into an equivalent number of function points. That type of solution was used in government bids [14]. Other ways of dealing with so-called “non-measurable items” for several types of activities including documentation and testing are defined in [15].
Many of those methods add equivalent function points to the functional size, or multiply
the functional size by a specified factor.

Proceedings 9th Software Measurement European Forum, Rome 2012
10
Even though adding “equivalent function points” to the functional size violates several measurement principles, the Brazilian industry has been using the workarounds above for lack of a better solution. The industry will typically adopt an imperfect solution as long as it is (or seems) better than the alternatives. The software measurement community still has a lot of work to do on non-functional assessment models such as IFPUG SNAP to fix this situation.
5.3. Sizing Enhancements A significant part of the Brazilian software measurement community believes that the
IFPUG method for sizing enhancement projects is not suitable for pricing models. They prefer to use the NESMA enhancement sizing method instead. That method assigns different weights for added, deleted, and changed function points [16]. According to Brazilian users the NESMA method provides more accurate results than the IFPUG method.
6. Benefits and Challenges of Using Functional Sizing in Software
Development Contracts The “price per function point” method potentially leads to better productivity and
represents an improvement over previous effort-based methods. It brings transparency and objectivity to the negotiation process, being good for any application domain, development process, and technology.
Special care must be taken when determining the initial productivities in order to establish
a balanced relationship between acquirer and supplier. While a good pricing model will reduce variation to an acceptable level, it is important to note that bad requirements do not favour accurate sizing. Poor requirements will increase the uncertainty in the sizing process. Most organisations will want to improve requirements before transitioning to the “price per function point” method. Any functional sizing method may be used, but it is highly recommended that measurement be performed or at least supervised by certified professionals. This will reduce differences in the interpretation of counting rules, especially between acquirer and supplier. Sizing may also be outsourced to a neutral third party organisation in order to improve transparency and minimise conflict.
Non-functional items will continue to be a challenge until a non-functional measurement
solution is found and accepted by the measurement community. Most of all, one should keep a win-win attitude and be aware that when using functional sizing in pricing models there will be gains and losses, but at the end of the day things will balance and everybody will win.

Proceedings 9th Software Measurement European Forum, Rome 2012
11
7. Conclusion This paper has presented a short description of the utilisation of software measurement in
Brazil. After providing a historical perspective, several relevant topics were addressed, such as the difference between predictive and prescriptive models, and why the latter is so important in Brazil; why and how Brazilian organisations in the government and private sectors use functional sizing for estimating and pricing; the main technical difficulties that have been encountered and how they have been addressed.
It is hoped that this report will contribute to raise interest in the use of functional sizing in pricing models, since so much work is still needed to improve those models.
8. References [1] IFPUG, unpublished internal reports, IFPUG, Princeton Junction, 2012.
[2] Aguiar, Mauricio, “Domain-Oriented Modeling, Estimation and Improvement for Commercial and IT
Systems Domains” (presentation), 26th International Forum on Systems, Software, and COCOMO
Cost-Modeling”, USC, Los Angeles, 2011,
http://csse.usc.edu/csse/event/2011/COCOMO/presentations/Panel_Aguiar_2011-11-03.ppt
[3] Jones, Capers, “Applied Software Measurement – Global Analysis of Productivity and Quality”, 3rd
Edition, McGraw-Hill, New York, 2008, pg. 310.
[4] Fernandes, Aguinaldo Aragon, “Gerência Efetiva de Software Através de Métricas”, Atlas, São
Paulo, 1995.
[5] Braga, Antônio, “Análise de Pontos de Função”, Infobook, Rio de Janeiro, 1996.
[6] Vazquez, Carlos E., Simões, Guilherme S. e Albert, Renato M., “Análise de Pontos de Função:
Medição, Estimativas e Gerenciamento de Projetos de Software”, Érica, São Paulo, 2003.
[7] Santos, Rogério S., “Instrução Normativa No 4”, SLTI, Brasília, 2008.
[8] Santos, Maria da Glória G., “Instrução Normativa No 04”, SLTI, Brasília, 2010,
http://www.governoeletronico.gov.br/biblioteca/arquivos/instrucao-normativa-no-04-de-12-de-
novembro-de-2010/download
[9] Government of Victoria, Australia, “southernSCOPE Reference Manual, Version 1”,: Government of
Victoria, Victoria, Australia, 2000, http://www.egov.vic.gov.au/pdfs/SSRefManual.PDF
[10] FiSMA, “northernSCOPE: customer-driven scope control for ICT projects” (brochure), FiSMA,
http://www.fisma.fi/wp-content/uploads/2008/09/northernscope-brochure-v152.pdf
[11] The International Organization for Standardization (ISO), website, http://www.iso.org
[12] The International Software Benchmarking Standards Group, website, http://www.isbsg.org
[13] [13] Boehm, Barry et al., “Software Cost Estimation with COCOMO II”, Prentice-Hall, New
York, 2000.
[14] Caixa Econômica Federal, “Concorrência No 001/2006, Anexo I: Projeto Básico – Item VIII”, Caixa
Econômica Federal, Brasília, 2006.

Proceedings 9th Software Measurement European Forum, Rome 2012
12
[15] Ramos, Carlos R. S. et al., “Roteiro de Métricas de Software do SISP – Versão 1.0”, Ministério do
Planejamento, Orçamento e Gestão, Brasília, 2010.
[16] Netherlands Software Metrics Users Association, “Function Point Analysis for Software
Enhancement – Guidelines, Version 1.0”, NESMA, 2001.
Proceedings 9th Software Measurement European Forum, Rome 2012
13
A practical approach to validate actual functional size measures in a contract
Marco Arzilli, Franco Perna, Roberto Meli
Abstract
Customer verification of functional size measures provided by the supplier in the acceptance phase is a critical activity for the correctness of contract execution. A lack of control, both in depth and in scope, can lead to relevant deviations compared to the unit price accepted in the bid assignment process, with potential consequences in terms of unfairness or, in some cases, illegality.
In the paper, we’ll show an efficient and rigorous approach to validate supplier’s functional size measurements. The approach is rigorous, since it defines clear and unambiguous game roles, and efficient, in order to spend the right effort to achieve the right confidence about supplier functional size measurement capabilities.
The approach consists in an incremental sampling technique that allows the customer to adjust the validation effort on the quality level of size measures provided by the supplier, detected by the gap among these measures and the ones checked and validated on a sampling base. The approach provides also a simple classification of main causes for this measure’s deviation, useful to improve both the measurement and the validation process.
1. Why a FP measures check is so important The right calculation of Function Point (FP) size for each project of a contract is very
important during the execution of software development or software enhancement contracts, in which the price is determined, directly or not, on a functional size base expressed in Function Point [9]. Often, in these cases, the entire Customer application portfolio is developed/maintained by several Suppliers, each of them is engaged on a specific contract with a lot of development and enhancement projects and tasks.
In this complex scenario we need a systematic and effective way to check actual FP size
for each contract. The Customer must be sure that the functional size measure proposed by the Supplier is right, because it represents the software quantity that he is going to accept, with a corresponding economic compensation.
The purpose of this check, indeed, is to assure congruency among the software size that the Customer receives and the price that he’s going to pay, with all the economical and legal consequences in case of any deviations.

Proceedings 9th Software Measurement European Forum, Rome 2012
14
This check is applicable for every contract, and within each contract, for any project/task, for all the Suppliers involved (when in a contract there are many Suppliers involved, like the Consortium case).
The check and validation process involves several organisations: • The Customer, that purchases the ICT supply, with an economic compensation
derived from FP measures; • The Supplier, that provides the ICT supply, and gives the FP measures to the
Customer; • The Auditor (also named Contract Monitor), that helps the Customer to check that the
FP measures provided by the Supplier are correct. The Auditor plays the role of independent verification & validation organisation in the
contract. When we refer to ICT contracts in a Public Administration domain, the Auditor role is regulated by a specific Italian law [1] that defines all the “contract monitoring” activities and responsibilities.
The purpose of “contract monitoring” activities is to support the Customer by performing
project management, software process assessment and software quality assurance, during the contract execution. This kind of activities (“contract monitoring”), mainly the FP measures verification, is strongly suggested not only on ICT contracts in the Public Administration domain. In fact, we can see the same need also in several industries (Finance, Utilities, Telecommunications, and so on): to have an Auditor that helps in verifying the correctness of software size measures provided by the Suppliers, especially in FP based ICT contracts.
Sometimes, this role is formally requested only when there is a legal dispute among Customer and Supplier, and in such case this role is named “arbitration”. In common experience it’s better to prevent dispute, instead of administrating it, and not only in terms of economical impacts; therefore the “contract monitor (Auditor)” plays a very useful and profitable role, both for the Customers and the Suppliers.
The verification and validation of FP measures provides by the Suppliers can be carried
out for all the projects/tasks purchased from the Customer within a contract scope. The current market trends, when we look at huge and complex Customer’s ICT portfolio,
is to commit to one outsourcer the development and maintenance of the whole software assets, often with multi-annual contracts.
Frequently these contracts have different applications and technological scope, with a huge portfolio (more than 20,000 FP), with a lot of projects/tasks, assigned to a set of Suppliers.

Proceedings 9th Software Measurement European Forum, Rome 2012
15
In this scenario, it’s important to establish if it’s practicable and profitable to carry out the check and validation on the entire set of projects/tasks. In the current market conditions, in fact, adequate resources (in terms of money, personnel, time) to perform a complete check for all the distinct measures, for all the projects of the whole application portfolio could not be available.
On the other hand, it’s impossible to derogate from the verification process. A lack in control could cause critical situation, in terms of right sizing and right compensation of the Suppliers for the development and enhancement projects in the contract.
The solution that we show in this article is based on a practical experience [8], carried out
in a contract monitoring project, in which we help a Customer (a Public Administration) to manage a very complex scenario, with lot of contracts, several Suppliers, hundreds of projects/tasks and more than 200,000 FP.
The suggested approach is based on a rigorous verification & validation process, with a
clear identification of activities, responsibilities and deliverable, combined with an efficient checking technique, able to derive acceptance indicators and measurement quality criteria from the results obtained in validating a sample of the whole Supplier’s measures.
2. Function Point measurements in a contract: when and how much
detailed To strictly define when and what to check, we must refer to the measurement milestones
(when to measure) and the corresponding measurement levels (with which details we have to document the measures) defined by the contract1.
2.1. Measurement milestones Since the IFPUG method [3] gives the possibility to repeat the measurements during
software development process, it should be established in which moments the Supplier will be required to produce a functional measure of software developed or maintained, depending on the type of task/project and on the software life cycle adopted by the Customer [4].
In the case study referred to in this article, the measurement milestones are defined by the contract at the end of these phases:
• Requirements Definition • Functional Analysis • Implementation and Testing
1 These details can be defined both within the contract or the request for proposal. Sometimes they are defined
in specific contractual appendixes and guidelines that formally regulates the use of FP for the tender.

Proceedings 9th Software Measurement European Forum, Rome 2012
16
The measurement milestones contractually identified are represented in the picture below.
Figure 1: Milestones and Levels of Measurement The measurement milestones may take an important contract value when they are linked to
the intermediate acceptance phases for the project/task, leading to payment approval of a corresponding billing tranche for the Supplier.
In our case study, for example, the total contract amount is splitted in three acceptance phases:
• 20% of the total price when the Customer accepts the deliverables at the end of Requirements definition phase (Measurement milestone 1 - Initial estimate)
• 30% of the total price when the Customer accepts the deliverables at the end of Functional Analysis (Measurement milestone 2 - Measure)
• 50% of the total price at the end of Final Acceptance of the whole system, at the end of Implementation and Test (Measurement milestone 3 – Final Measure)
In such cases, verification of the measure proposed by the Supplier may be relevant for
each of the measurement milestones, because of its economic consequences for the project. However the verification is a useful management indicator for the entire application
portfolio. In fact, as the verification of the final measurement, carried out during the final acceptance test, ensures the proper compensation of each project/task, so the check of initial estimate can help to perform the right funds allocation to many projects/tasks.
The initial allocation of economic resources on various projects has done, very often, on
the basis of initial estimates indeed. A verification of the FP estimates can provide information to confirm or reschedule this distribution because of the correctness of these estimates that means the estimate value against the one proposed.

Proceedings 9th Software Measurement European Forum, Rome 2012
17
2.2. Measurement Levels The measurement level actually means the detail of FP measures documentation. The
relationship between measurement levels and measurement milestones is depicted by the following table:
Table 1: FP Measurement Levels Measurement Level Method Measurement approach Measurement Milestone
A – Deep
B – Detailed
IFPUG 4.3.1 Standard 2 - Measure
3 – Final Measure
C – Unrefined
D - Rough
IFPUG 4.3.1
E&Q 3.12 1 – Initial Estimate
The measures required for acceptance of new developments and enhancements are
normally at the level B (Deep), but if the Customer needs more control he can ask for documentation level A (Detailed).
In early stages of the software life cycle, depending on the level of information available or the urgency in obtaining the measure, or the purpose of use of the measure itself, it can instead be obtained from the supplier measures of level C (Unrefined) or D (Rough). In these cases it is called "Estimation of FP."
In the “Practical Guidelines for Documenting the Function Point Count” [6] IFPUG
defines the minimum set of items that constitute the measurement documentation. They include:
1. the counting purpose and type; 2. the counting scope and the software boundary; 3. the counting date; 4. the CPM version used as a reference in the count; 5. the specific guideline version adopted; 6. any exceptions to the specific guideline; 7. any assumption and decision taken in the count; 8. the counting result; 9. a list of any BFC (data functions and transactional functions) including the classes
(ADD, CHG, …), type (EI, EO, EQ, EIF, ILF), complexity (high, average, low) and FP value (3, 4, 6, …).
2 Early & Quick Function Point Analysis is FP estimation technique very useful and reliable, available in the
publi domain. The method is clearly defined in a Reference Manual, and is suggested by DIGIT-PA (the Italian
Authority for Innovation in Public Administration) as a FP estimation technique to be used in ICT contracts
[11].
Proceedings 9th Software Measurement European Forum, Rome 2012
18
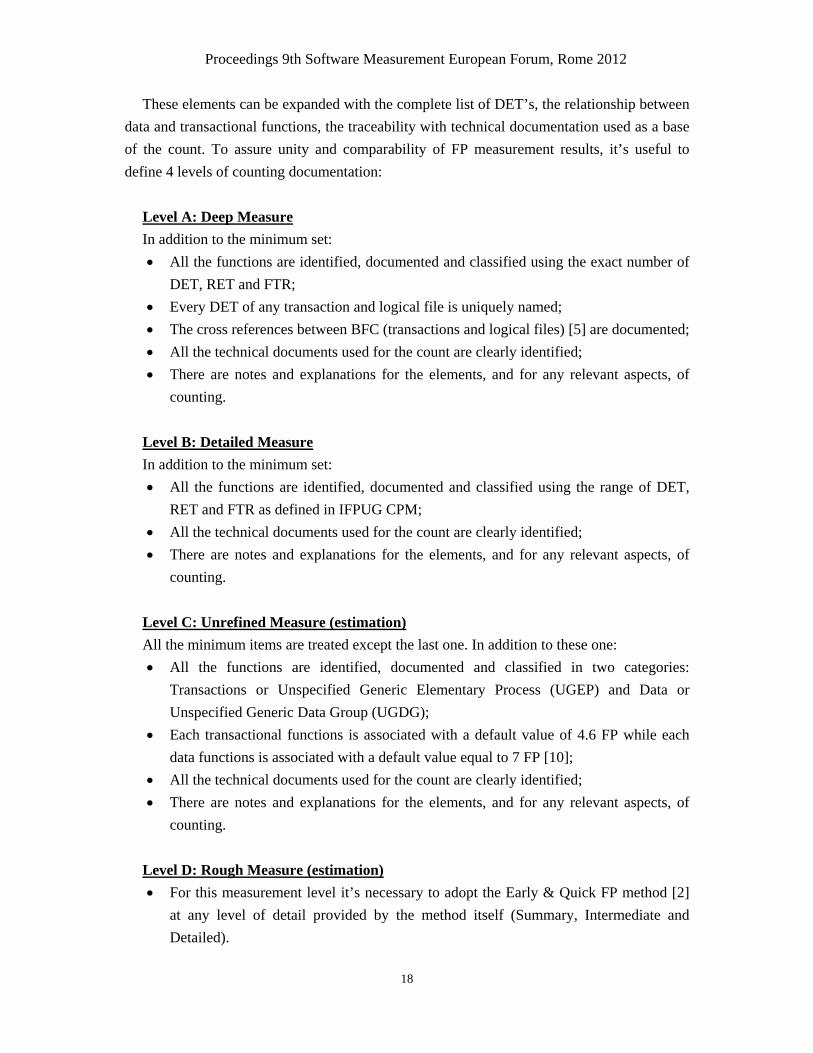
These elements can be expanded with the complete list of DET’s, the relationship between data and transactional functions, the traceability with technical documentation used as a base of the count. To assure unity and comparability of FP measurement results, it’s useful to define 4 levels of counting documentation:
Level A: Deep Measure In addition to the minimum set: • All the functions are identified, documented and classified using the exact number of
DET, RET and FTR; • Every DET of any transaction and logical file is uniquely named; • The cross references between BFC (transactions and logical files) [5] are documented; • All the technical documents used for the count are clearly identified; • There are notes and explanations for the elements, and for any relevant aspects, of
counting. Level B: Detailed Measure In addition to the minimum set: • All the functions are identified, documented and classified using the range of DET,
RET and FTR as defined in IFPUG CPM; • All the technical documents used for the count are clearly identified; • There are notes and explanations for the elements, and for any relevant aspects, of
counting. Level C: Unrefined Measure (estimation) All the minimum items are treated except the last one. In addition to these one: • All the functions are identified, documented and classified in two categories:
Transactions or Unspecified Generic Elementary Process (UGEP) and Data or Unspecified Generic Data Group (UGDG);
• Each transactional functions is associated with a default value of 4.6 FP while each data functions is associated with a default value equal to 7 FP [10];
• All the technical documents used for the count are clearly identified; • There are notes and explanations for the elements, and for any relevant aspects, of
counting. Level D: Rough Measure (estimation) • For this measurement level it’s necessary to adopt the Early & Quick FP method [2]
at any level of detail provided by the method itself (Summary, Intermediate and Detailed).
Proceedings 9th Software Measurement European Forum, Rome 2012
19
3. How to check the FP measures efficiently: the gradual sampling As mentioned previously, a complete and exhaustive check of FP measures produced by
the Supplier for each measurement milestone, each task of each project, for all the outsourcing contracts may be too expensive and no profitable for the Customer. In this kind of contracts, the billing authorisation depends on validation activities performed by the Customer, related to the corresponding reporting and approval checkpoint, that are usually scheduled at fixed periods (often monthly or quarterly).
During this checkpoint and validation activities, the FP verification on the whole set of
tasks and projects being checked in the period (month, quarter, etc.) is very important for the Customer, because of its contractual relevance too. In this context it’s suggested to adopt the gradual sampling technique.
The sampling is a process whereby the delivery of a set of products is analysed by
selecting and testing a sample of products, extracted in a manner defined by specific regulations [7]. The sampling plan is the set of rules that determine the size of the sample to be extracted and the criteria of acceptance and rejection.
All statistical methods allow to express an opinion on a set of products from the examination of a part of the whole, with a certain degree of probability, thus avoiding to control always the 100% of the products. Clearly, controlling only a sample of the entire set of products you accept the risk inherent in the error due to the application of any statistical method that, as known, does not provide certainty but only probability, more or less high.
In a contract for the supply of software with a lot of new development tasks or
enhancement projects, sampling of FP measures to be tested can be done on the entire set of tasks (by choosing a subset of all the tasks performed, according to the sampling criteria).
A gradual sampling is a technique whereby we extract a significant sample of FP measures to be tested, corresponding to approximately 30% of the total value of FP (the sum of FP for the entire number of tasks to be accepted in that period).
If the deviation between the total of Proposed FP (counted by the Supplier) and the total of
Checked FP (verified by the Auditor) in the sample is more than 10% the sample itself is expanded to an additional 20% of items.
Again, if the deviation between the total of Proposed FP (counted by the Supplier) and the total of Checked FP (verified by the Auditor), for the sample that is now about 50%, exceeds 10%, we expand the sample again until the entire population of the tasks is comprised.
In such this way, we can obtain a good chance of effectiveness in control, compared with a reduced engagement.
Proceedings 9th Software Measurement European Forum, Rome 2012
20
The deviation is expressed by two different combined indicators: • the absolute value of portfolio’s percentage deviation; • the absolute value of portfolio’s negative percentage deviation, calculated including
only negative differences. That allows to consider both the sum of all the deviations (positive and negative) and the
sum of the only negative deviations (that is when the value of FP Checked by the Auditor is less than the value of FP Proposed by the Supplier).
Indeed, the first indicator, alone, may not be representative of the acceptability of the measures, since in this indicator the deviations of opposite sign tend to offset (if in a task the deviation is +20 FP, and in another task of the same sample the deviation is -20 FP, the sum would provide a value equal to 0, but this value does not represent that the tasks, individually, had a significant deviation).
Using also the second indicator we can solve this potential inconsistency, because it is
calculated solely on the negative deviations. The two indicators together may detect situations where the cumulative value of deviation
is low and the estimation and measurement process of the supplier is “regular” and “systematic”.
The evaluation of the sample, therefore, will provide positive results only if the detected
absolute deviation is less than 10% for both indicators. The choice of which tasks to include within the sample to be tested depends on the
sampling criteria. Examples of criteria used to identify the sample can include, but are not limited to: • the size of the task in FP (small, medium, large); • the type of task (development or enhancement); • the measurement milestone (end of Requirement Definition phase, of Functional
Analysis phase, of Implementation and Test one); • the technical characteristics of the task (Web application, data warehouse, GIS, etc..); • the Supplier of the task; • etc.

Proceedings 9th Software Measurement European Forum, Rome 2012
21
The choice may be random, so tasks are selected in an unconditioned way, or partially random when we want to address the verification on some specific critical area (for example to investigate the correctness of measures following one or more of the sampling criteria listed above).
Once the sampling criteria have been decided, it’s possible to select the tasks to be tested.
For example, suppose we conduct a check on a population of 40 tasks, for a total of FP proposed by the Supplier equal to 18,600.
The sample will be identified by selecting a number of tasks such that the sum of resulting
FP is approximately equal to 30% of 18,600, i.e. 5,580 FP. To select which tasks to include in the sample we will use a completely random criterion, or a mix of the above criteria. To apply these sampling criteria, the tasks should be classified according to the criteria themselves, in order to make selections and filters useful to compose the sample.
In any case, whatever the sampling method chosen, the final result will be a list of tasks, each with its own size in FP calculated by the Supplier.
4. How to perform a rigorous process of FP measures verification: the
Periodic Assessment Therefore, for each period of contractual check (month, quarter, etc.), the sampling will be
the basis to select the tasks to be tested, to provide guidance on the acceptability or not of the entire population of tasks, cause the sample represents a significant subset of it.
Because this verification process is repeated over time, due to the frequency of reporting (contractual check), we can call it as “Periodic Assessment”, and it will provide results both on the specific sample, and the trend of inspections over time.
The purpose of the Periodic Assessment of FP measures provided by the Supplier is to define:
• the activities to be performed and their sequence; • the roles involved in carrying out activities; • the input data; • the deliverables; • the techniques and tools used.
Proceedings 9th Software Measurement European Forum, Rome 2012
22
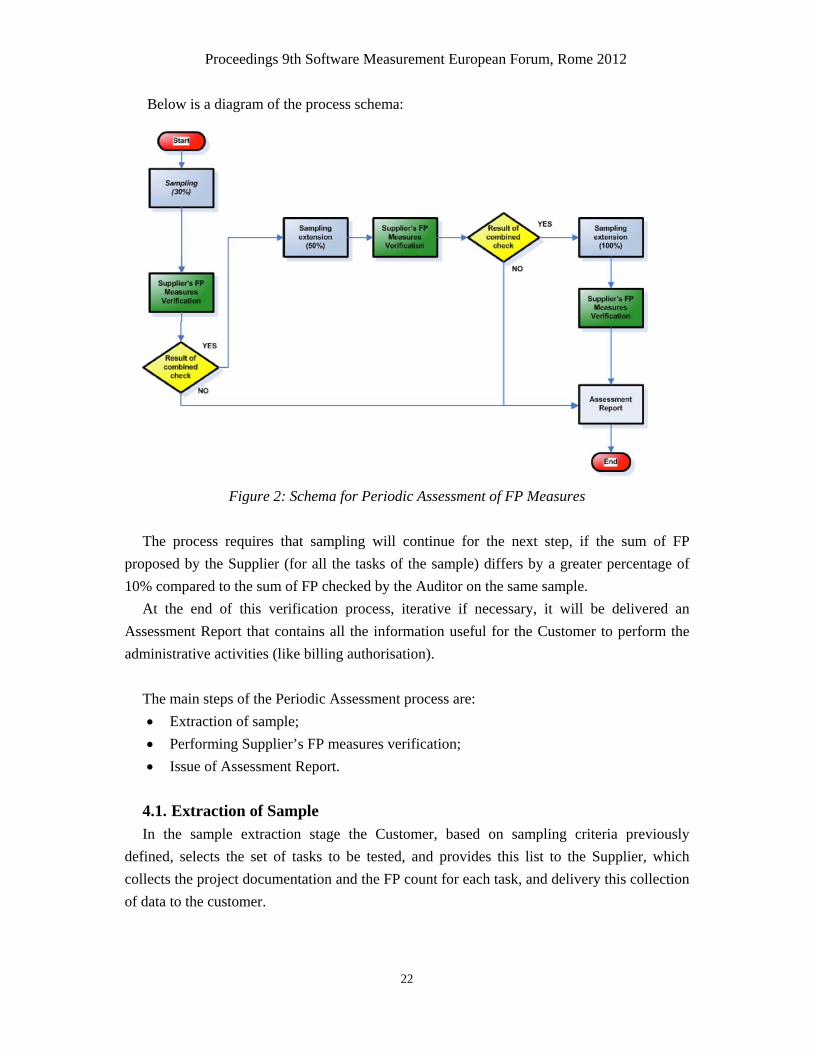
Below is a diagram of the process schema:
Figure 2: Schema for Periodic Assessment of FP Measures The process requires that sampling will continue for the next step, if the sum of FP
proposed by the Supplier (for all the tasks of the sample) differs by a greater percentage of 10% compared to the sum of FP checked by the Auditor on the same sample.
At the end of this verification process, iterative if necessary, it will be delivered an Assessment Report that contains all the information useful for the Customer to perform the administrative activities (like billing authorisation).
The main steps of the Periodic Assessment process are: • Extraction of sample; • Performing Supplier’s FP measures verification; • Issue of Assessment Report.
4.1. Extraction of Sample In the sample extraction stage the Customer, based on sampling criteria previously
defined, selects the set of tasks to be tested, and provides this list to the Supplier, which collects the project documentation and the FP count for each task, and delivery this collection of data to the customer.
Proceedings 9th Software Measurement European Forum, Rome 2012
23
Before proceeding with the check of FP measures proposed by the Supplier, it’s necessary to evaluate if the task documentation is adequate and good enough in order to perform the FP measure verification. The experience gained in the field shows that, often, the first obstacle for a good measure and for a good measure check too, lies in the inadequacy of the task documentation. It is not unusual to validate software tasks FP measures in which the documentation does not correctly identify the boundary of the application, or does not include a logical data model which allows to analyse and identify the logical files, the relationships between them, and their structure in terms of unique attributes.
Sometimes the documentation is mainly a technical/application one (DB tables, scripts, software modules, etc.) and is not suitable for the purpose of the measure in FP.
The adequacy of documentation is carried out using appropriate supporting tools (checklists) that aim to verify the existence and adequacy of the information required for the measure in the project (task) documents. The summary of such evaluation produces an index, called IMD (Index of Document Measurability) which represents the overall quality of the documentation with respect to FP measure requirements. This index is calculated by taking into consideration the relevance and availability, in the task documentation, of some elements essential for a proper FP measurement.
In common experience an acceptable value for the index IMD is IMD> = 80%. If the
evaluation result ends with an IMD value less than 80%, the Supplier will be required to integrate the documentation, providing specific guidance on the information to be integrated.
This evaluation process, which may be iterative, ends when the IMD for all tasks comprised in the sample exceeds the level of acceptability required (e.g.: IMD> = 80%).
4.2. Performing Supplier’s FP measures verification The Supplier’s FP measures verification begins when the selected sample has passed the
evaluation of documentation adequacy described before. Based on the documentations received (project/task documentation and FP measurement records of the Supplier) the Auditor verifies the FP counts issued by the Supplier, recording any error detected in the counting procedure and results. The errors are classified by type, in order to detect areas of potential improvement of the measurement.
An example of errors classification is depicted in the following table, which identifies 5 main types of errors, further subdivided into elements of detail:
• EC Errors in counting Process • ED Errors in counting Data functions • ET Errors in counting Transactions functions • EF Errors in Final calculation • EG Errors in General documentation

Proceedings 9th Software Measurement European Forum, Rome 2012
24
Table 2: An example of Error Classification Code Description
EC Errors in Counting process
E.C1 problems in the definition of the boundaries, scope, type of counting
E.C2 identification and classification of functionalities not consistent with the type of counting
ED Errors in counting Data functions
E.D1 Incorrect identification of Logical Files
E.D1.1 Identification of code data
E.D2 Incorrect classification of Logical Files
E.D3 Incorrect complexity assignment for Logical Files
ET Errors in counting Transactions functions
E.T1 Incorrect identification of Elementary Process
E.T1.1 Maintenance of code data
E.T2 Incorrect classification of Elementary Process
E.T3 Incorrect complexity assignment for Elementary Process
EF Errors in Final calculation
E.F1 Defects on final counting formulas
E.F2 Incorrect calculation of Value Adjustment Factor
EG Errors in General documentation
E.G1 Undocumented functionalities/inconsistency between project documents and FP count
To better understand the process of verification is useful to refer to the following
definitions:
FP Proposed (by the Supplier)
It is the number of Function Points counted by the Supplier for a particular software development/enhancement task, at any time of its life cycle. This number is proposed by the Supplier using the FP counter form.
FP Sampled (by the Auditor)
It is the number of Function Points (FP Proposed by the Supplier) for the software development/enhancement tasks included in the sample. The total FP sampled will be equal to 30% in the first sampling, 50% in the second, and is equal to the entire population of tasks assigned to the Supplier (100%) if there are deviations above 10% in the second sample too.
FP Checked (by the Auditor)
For each verification, it is the number of Function Points for which the Auditor has found documentary evidence, and therefore validates the numerical consistency.

Proceedings 9th Software Measurement European Forum, Rome 2012
25
FP Validated (by the Customer)
For each software development/enhancement task, it is the number of Function Point that the Customer considers acceptable on the basis of evidence gathered. For each checked task, there is a unique FP value recognised and validated by the Customer
The checks on FP proposed by the Supplier for all the tasks included in the selected
sample (FP sampled) produce a total value of FP checked, and a record of any error detected, for each task of the sample.
The verification process is based on the concept of gradual sampling already described
above, for which the examination continues, with a greater extension of the sample size (30%, 50%, 100%) if, for each sample, the acceptability combined indicators show a difference between FP Proposed by the Supplier and FP Checked by the Auditor that exceeds the threshold of acceptability of 10%.
The threshold of acceptability must be met for both acceptability combined indicators: • absolute value of portfolio’s percentage deviation; • absolute value of portfolio’s negative percentage deviation, calculated including only
negative differences. In case of success of sample verification, the FP measures proposed by the Supplier for
the entire population of the assigned tasks are automatically accepted. This means, for example, that if the verification of FP performed on a sample representing
30% of FP proposed by the Supplier provides a positive outcome (the absolute value of both indicators of deviation <10%) then the total amount of FP proposed by the Supplier (entire population) is validated by the Customer.
4.3. Issue of Periodic Assessment Report At the end of the FP verification process a Periodic Assessment Report is produced, with
the aim of documenting the results of checks carried out, including errors, classified by type, and the final outcome of the activity.
The results recorded in the Report will be used by the Customer both to have historical information on the inspections trend over time, and to get the summary information necessary to proceed with the economic compensation of FP validated.
In order to produce the Periodic Assessment Report, it can be used a tool that allows to record all significant data for each of the FP measure verifications performed.

Proceedings 9th Software Measurement European Forum, Rome 2012
26
Below is a screenshot of the tool.
Figure 3: Spreadsheet with FP verification data The spreadsheet is logically divided into sections; each line consists of the following
fields: a) Supplier section, including the main data about all the tasks tested: • Contract code; • Project code; • Task code; • Period (Quarter); • Measurement milestone (software life cycle phase when the FP measure has done); • Supplier Code; • Software Size expressed in FP proposed by the Supplier (Proposed FP).
b) Auditor section, containing the results of the assessment: • Sampled FP; • Checked FP; • FP Deviation (difference between Checked FP and Sampled FP); • Percentage deviation of Portfolio =
100*[sum(FP_Checked)-sum(FP_Sampled)]/sum(FP Sampled); • Number of errors by type. In particular, the main data are:
o Errors related only to IFPUG rules; o General (Document) Errors.
c) Customer section, that summarise the final result of Validation: • Validated FP; • Validated FP Deviation (difference between FP Validated by the Customer and FP
Proposed by the Supplier); • Validated FP Percentage Deviation.

Proceedings 9th Software Measurement European Forum, Rome 2012
27
In addition to this Spreadsheet it has been realised a simple dashboard of FP Assessment, shown in the figure below, that summarises trend and main results of the checks performed in the period (quarter) of interest.
Figure 4: Dashboard of FP Assessment The dashboard summarises the main data for the Customer, showing the trend of FP
checks and the acceptability indicators of the sample, in addition to the data of FP validation. In this way the Customer can obtain, in a concise and accurate way, all data necessary for
the future activities of acceptance and economic reward of FP validated. In the first row the Quarter (Period) of interest is shown, and then the other data are
grouped in five sections, as described below. Key Indicators about acceptability of the Sample: • absolute value of portfolio’s percentage deviation; • absolute value of portfolio’s negative percentage deviation, calculated including only
negative differences; • percentage of the sample (ratio between the sum of FP Sampled and the FP Proposed
one). Size of the Sample: • total number of tasks in the sample; • total number of tasks assigned to the Supplier (for that period); • coverage Percentage of the Sample.

Proceedings 9th Software Measurement European Forum, Rome 2012
28
Errors; • errors related only to IFPUG rules; • general (Document) Errors.
Verification Data: • FP Proposed; • FP Sampled; • FP Checked; • FP Deviation (difference between FP Checked and FP Sampled); • FP Checked Percentage Deviation.
Validation Data: • FP Validated; • FP Validated Deviation (difference between FP Validated by the Customer and FP
Proposed by the Supplier); • FP Validated Percentage Deviation.
4.3.1. Customer validation of FP Checked results Data on sample checks performed during the period allow the customer to properly
validate the FP size proposed by the Supplier, subject to the outcome of the assessment. In practice, depending on the outcome of the assessment performed by the Auditor on the
sample of selected tasks, the Customer will be able to accept the FP size proposed by the Supplier for the entire population of software tasks, or to recognise (and pay for) only the FP size checked by the Monitor, when the deviation detected is greater than 10%.
Below is a chart that summarises some scenarios that represent an example of the
deviation trend.
Figure 5: Comparison between FP Proposed by the Supplier and FP validated by the Customer in each period

Proceedings 9th Software Measurement European Forum, Rome 2012
29
In the example, the situation by period is the following: • 1st quarter: the progressive sampling has grown up to 100% of the population of the
assigned tasks. The assessment is very negative because the absolute value of portfolio’s percentage deviation is about 25%, while the absolute value of portfolio’s negative percentage deviation, calculated including only negative differences is equal to 27%. In this case, the amount of FP Checked by the Auditor becomes the amount of FP validated by the Customer. Therefore, for this period, the amount of FP accepted by the Customer (and payable to the Supplier, as well) is 3,959, compared with 5,293 proposed.
• 2nd quarter: the progressive sampling has grown up to 100% of the population of the assigned tasks. Both the portfolio’s percentage deviations are about 13%, with an improvement compared to the situation found in the 1st period. In any case, once again the amount of FP Checked by the Auditor becomes the amount of FP validated by the Customer. Therefore, the amount of FP accepted by the Customer (and payable to the Supplier, as well) is 13,199, compared with 15,138 proposed.
• 3rd quarter: the Supplier, aware of the negative trend of the first two periods, improves the quality of the count. A sampling of 30% is enough, because the calculated variance (for both indicators) is about 7% that is below the acceptability threshold of 10%. The total amount of FP proposed by the Supplier (not only the ones included in the sample) becomes the total amount of FP validated by the Customer.
• 4th quarter: the Supplier remains stable and acceptable in quality of the count. Even in this case a sampling of 30% is enough, because the calculated variance (for both indicators) is about 8%. Once again the total amount of FP proposed by the Supplier (not only the ones included in the sample) becomes the total amount of FP validated by the Customer.
• 5th quarter: this check is performed at the end of the Requirements Definition phase, which is associated with a tranche of anticipation of the total contractual price (for example equal to 30% of the entire reward of the provision). A sampling of 30% is enough, because the calculated variance (for both indicators) is about 8%. The total amount of FP proposed by the Supplier becomes the total amount of FP validated by the Customer. The check carried out at this stage thus provides an indicator of the quality of the estimate performed by the Supplier.
• 6th quarter: the check requires a progressive sampling up to 50% of the population of the assigned tasks. The absolute value of portfolio’s percentage deviation is about 4%, while the absolute value of portfolio’s negative percentage deviation, calculated including only negative differences is equal to 8%, so the total amount of FP proposed by the Supplier become the total amount of FP validated by the Customer, and the verification is accomplished at the second round of sampling.

Proceedings 9th Software Measurement European Forum, Rome 2012
30
• 7th quarter: the progressive sampling has grown up to 100% of the population of the assigned tasks. The assessment is negative because: o the absolute value of portfolio’s percentage deviation is about 8%, but o the absolute value of portfolio’s negative percentage deviation, calculated
including only negative differences is equal to 12%. • The indicators show an overall negative situation, in which the quality of the
measures is below the threshold of acceptability of 10%, even if the first indicator, taken alone, would provide acceptable results. This means that within the selected sample there are some specific tasks in which the deviation has a positive sign (the value of FP Checked by the Auditor is greater than the value of FP Proposed by the Supplier), and a consistent number of tasks in which the gap has a negative sign. In these cases, the first indicator provides a value which, being calculated as the sum of the deviations, suffers of a matter of "compensation" between deviations of opposite sign. Instead, the value expressed by the indicator of deviation which takes into account only the negative differences, is not altered by such compensation, and provides an absolute value of negative differences which is not acceptable. Therefore, the amount of FP Checked by the Auditor becomes the amount of FP validated by the Customer. So, for this period, the amount of FP accepted by the Customer (and payable to the Supplier, as well) is 7,526, compared to the 8,226 proposed by the Supplier.
With the data collected during the assessment several reports have been produced,
showing some of the main indicators useful for the Customer. 4.3.2. Quality evaluation of FP measurement and FP check process Based on data collected by the Auditor during the sample checks carried out in several
reporting periods, it is possible to extract and show summary information about the quality of measurement process, organised by contract, supplier, period, and so on.
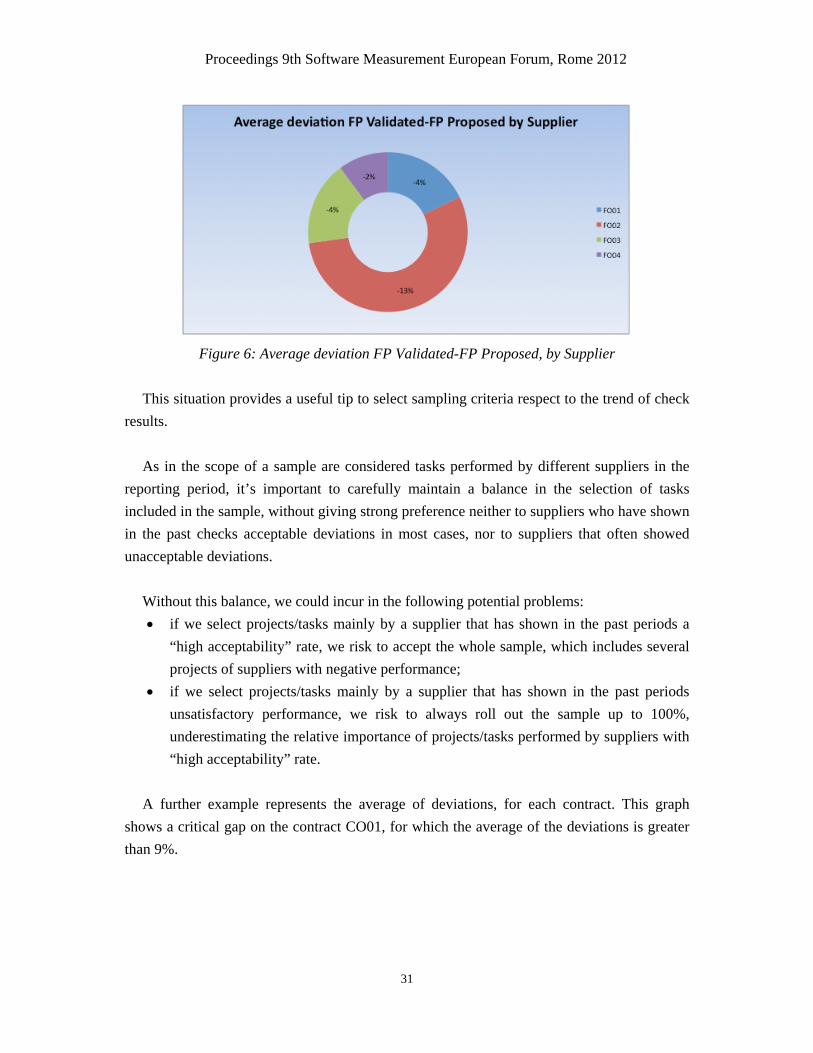
Below is an example of a graph that shows the trend of the average deviations between the
FP Proposed by the Supplier and FP validated by the Customer. The graph shows a critical item on the measures proposed by Supplier FO02, for which the deviation detected is about 13%.
Proceedings 9th Software Measurement European Forum, Rome 2012
31
Figure 6: Average deviation FP Validated-FP Proposed, by Supplier This situation provides a useful tip to select sampling criteria respect to the trend of check
results. As in the scope of a sample are considered tasks performed by different suppliers in the
reporting period, it’s important to carefully maintain a balance in the selection of tasks included in the sample, without giving strong preference neither to suppliers who have shown in the past checks acceptable deviations in most cases, nor to suppliers that often showed unacceptable deviations.
Without this balance, we could incur in the following potential problems: • if we select projects/tasks mainly by a supplier that has shown in the past periods a
“high acceptability” rate, we risk to accept the whole sample, which includes several projects of suppliers with negative performance;
• if we select projects/tasks mainly by a supplier that has shown in the past periods unsatisfactory performance, we risk to always roll out the sample up to 100%, underestimating the relative importance of projects/tasks performed by suppliers with “high acceptability” rate.
A further example represents the average of deviations, for each contract. This graph
shows a critical gap on the contract CO01, for which the average of the deviations is greater than 9%.

Proceedings 9th Software Measurement European Forum, Rome 2012
32
Figure 7: Average deviations FP Proposed-FP Validated by contract Because during the FP check process some information about errors encountered in FP
measures proposed by the Supplier is recorded, it can be useful to show the distribution of such these errors, to qualify Supplier’s expertise in FP measurement, and to provide useful information to improve this process.
This is represented in the figure below.
Figure 8: Trend of main errors by Supplier
Proceedings 9th Software Measurement European Forum, Rome 2012
33
5. Conclusions In the agreements for the provision of software development and maintenance in which the
reward is determined, directly or indirectly, on the basis of functional size expressed in Function Point, the correct FP quantification of each project has a great importance.
In contractual situations of particular complexity and size, such as large outsourcing
contracts, or major contracts for public administration, where the number of tasks to be sized in FP and the overall size of the application portfolio are significant, adopting a rigorous, flexible and efficient approach to check and validate FP measures can be decisive and very profitable.
The suggested approach, based on gradual sampling technique, may assure the Customer
to recognise the correct reward to the Supplier on the basis of a sampling check, performed in an incremental manner in case of unacceptable deviations between the amount of FP proposed by the Supplier and the amount of ones checked by the Auditor. This approach gives a reasonable confidence to pay the appropriate price to the Supplier for the entire set of tasks, based on information obtained from a sample of significant and representative measurements.
6. References [1] CR/38 Circular of 28th December 2001 Article 13, paragraph 2, of Legislative Decree 1993, n. 39.
“Monitoring of major contracts for the design, implementation, maintenance, management and
operational management of automated information systems”
[2] Early&Quick Function Point, version 3.1, www.dpo.it/eqfp
[3] IFPUG “Function Point Counting Practices Manual” version 4.3.1 www.ifpug.org
[4] ISO/IEC 12207:2008 Software and system engineering – Software Life Cycle Processes. Geneva,
2008
[5] ISO/IEC 14143-1:2007, Information Technology – Software Measurement – Functional Size
Measurement – Part 1: Definition of Concepts, February 2007
[6] IFPUG - “Practical Guidelines for Documenting the Function Point Count”
[7] UNI ISO 2859-1/2/3/4/5:2007 “Sampling procedures for inspecting attributes”
[8] Perna- Meli, “Practical experiences of Function Points estimation and measurement in a complex
outsourcing context of an Italian Public Administration.”, SMEF2008, Milano, Italy
[9] “Il Sistema Metrico come strumento di governo dei processi di produzione e di servizio ICT”,
GUFPI-ISMA, Le Metriche del Software. Esperienze e Ricerche", FrancoAngeli, 2006, ISBN 88-
464-7139-3, collana "Informatica & Organizzazioni", codice 724.36
[10] Meli, R. “Simple Function Point: a new Functional Size Measurement Method fully compliant with
IFPUG 4.x”, Software Measurement European Forum 2011 Proceedings

Proceedings 9th Software Measurement European Forum, Rome 2012
34
[11] DIGIT-PA (previously CNIPA) “Strategie di acquisizione delle forniture ICT” – v. 3.4 04/02/2009

Proceedings 9th Software Measurement European Forum, Rome 2012
35
Parametrics in contracts is also beneficial for suppliers
Ton Dekkers
Abstract Usually parametric estimation (cost engineering) in the software industry and the
required (functional) sizing and benchmarking are looked at from the perspective of the customer. In this presentation we will look at this from the perspective of the supplier. That applying these principles is relevant in decision making in proposals and can create opportunities for innovation. A real case is the basis for this presentation and paper.
The supplier wanted to react on a request for proposal from a governmental organisation. The RfP was referring to a base information system to be delivered in 2 years, additional incremental functionality over the following three years and maintenance and support over the full period of 5 years. The potential size in function points (an ISO standard for Functional Size of Software) was provided by the customer for both the base part and the releases. Based on these numbers, the customer wanted an all-in price per function point. The customer provided an automated template (Excel) that allowed only putting in the base data to support the proposal.
The functional requirements were referring to an existing program (multiple applications)
that needs to be (re)build to reflect the new political situation and the expected (simplified) legal requirements. The initial thoughts of the supplier were to use the experiences from the past (the referred to applications were build by the supplier) to produce an expert estimate and then use the given size to calculate the price per function point. The supplier had no experience with function points and had the idea the calculated price per function point was too high to offer. This was the reason to invest some time in function points and how this can be used in a proposal.
The presentation describes the steps that have been taken to explain the concepts in the
supplier organisation, to verify the size indicates by the customer as basis for the proposal, to validate the suppliers’ performance, to benchmark the performance (ISBSG and SEER), to convince experts and management on a new (much higher) pricing, to address risks and constraints and finally to produce the proposal.
The International Software Benchmarking Standards Group (ISBSG) is a not-for-profit organisation that collects data of software development projects and makes that available to the public domain at minimal costs. SEER is a commercial product that is used as a second opinion to validate the outcomes using a real parametric approach.

Proceedings 9th Software Measurement European Forum, Rome 2012
36
The proposal was accepted beginning of 2010 and now the supplier is close to full delivery of the base system. Applying Agile development, parts of the system are already available to the user. At the time of the conference, the full data / results of the first 3 out of 5 releases of the project will be available.

Proceedings 9th Software Measurement European Forum, Rome 2012
37
Measuring Software Development Processes with Six Sigma
Dr. Thomas Fehlmann
Abstract While there is a vivid discussion and a bunch of literature available on software metrics
and measurement programmes, surprisingly many authors still ignore the emerging business-process management methodology Design for Six Sigma (DfSS). DfSS is used whenever the production process to be measured first needs to be designed and thus cannot be executed for measurement and analysis purposes.
This is typically the case for software processes. They are executed once, and the results are the final output. Software is therefore not suitable to the statistical methods used for predicting manufacturing processes; each software development project is more or less unique. Nevertheless, we can measure software processes and predict the outcome of a software project using DfSS. It uses linear Transfer Functions that transform measurements done for process controls into metrics for process output.
This paper aims at explaining the measurement programme needed for DfSS in software development, and what kind of predictions are possible based on Six Sigma Transfer Functions.
1. Introduction Six Sigma is about reducing defect density in production processes to a predictable level.
Originally, Six Sigma had been devised for manufacturing processes, but meanwhile Six Sigma professionals have learned how to apply the Six Sigma principles, methods and tools to a much wider range of industry applications.
However, while Defining the scope, Measuring production processes, Analyse root causes for defects, Improve the process step by step, and thus better Controlling the production process (DMAIC) is well known and established in various industries, discussions persist how to apply Six Sigma in processes that cannot be run for measurement purposes only. While we can manufacture an extra batch of hardware with the aim of measuring the process, requiring only a small investment, we cannot develop new software products simply for measuring the process control parameters needed for doing it right.
Moreover, processes closely related to software development produce output which by itself is difficult to measure. Sales processes, market communication processes, proposal and contract evaluation in the software industry are among those. They create expectations that impact the creation of software.

Proceedings 9th Software Measurement European Forum, Rome 2012
38
We can measure functional size but not overall quality – only certain qualities such as ease-of-use, or ergonomic maturity.
Six Sigma uses the “Design for Six Sigma” (DfSS) approach for designing products and
processes that deliver within predictable tolerance limits. The method used in DfSS is Quality Function Deployment (QFD [2] QFD identifies the controls in a process that are critical for the quality of the response of the process [7], and constructs the Transfer Function that maps controls into the process response, the output. The relationship between controls and responses is described in a matrix. Such matrices correspond to linear mappings between different domain areas, the vector space of controls and the vector space of responses. Linear algebra is applicable [9].
Many adoptions of Six Sigma today use the Lean Six Sigma paradigm. Lean tolerates no waste and no defects. Identified defects are immediately addressed, following the Toyota “Stop the Line” principle, as explained for software in [. “Stop-the-line” means that if bugs occur, they must be fixed immediacy. Bugs are not tolerated; the bug list remains empty all over the development cycle. This paper explains how to use measurement to become lean.
2. Transfer Functions Transfer functions map process controls into process responses. Both controls and
responses are vectors in a multidimensional event space; usually the space of stated requirements for the process. Requirements have a value; they are more or less important. Requirements should be orthogonal to each other, that is, one requirements value should not depend from other requirements’ values. However, requirements can compensate each other: if one requirement cannot be fulfilled, it might be replaced by another requirement that has similar effect on the process response. Moreover, requirements can contradict each other, in which case solutions must balance them out in an optimal way. Requirements are categorised into Domain Areas, thus separating business driver requirements from technical solutions presented as use cases, or in turn from feature requirements or quality requirements.
2.1. Calculating Transfer Functions The profile of the process response requirements usually is known; either customers, users
of the process output – or product management – have specific requirements. Some of these requirements are “must” requirements: they are uncritical for success of the project, because they simply have to be fulfilled, at minimum cost. For instance, if the customer wants a car for driving, the car needs an engine that works; this is a “must” requirement. Whether the car is driven by gas, horse, or electrical power might be up to customer’s preferences and his or her particular needs. The cost and the quality aspects of the driving system depend from the choice of engine, not from the functional fact that the engine drives the car.

Proceedings 9th Software Measurement European Forum, Rome 2012
39
Uncritical control requirements have an indiscriminate impact on the response. When looking at the transfer function, they can be left away; they would not impact the process response in the sense that they would not change the relative value of other requirements.
Critical control requirements – such as the choice of engine – have specific impact on cost but also on other process responses, such as velocity or maximum reach of the car. Transfer Functions need only to look for critical requirements, both for the response and the controls, see [7]. Commonly in Six Sigma, the control vector is called the x, and the response vector the y. If T denotes the transfer function, T (x) = y describes the transfer function of the process, mapping critical requirements for the controls into requirements for the response.
2.2. Predicting Controls Transfer functions map controls into responses – not the other way round. Since responses
are typically known first, before the relevant critical controls, predicting the critical controls is a relevant issue for understanding transfer functions for processes.
In a QFD workshop, experts try to predict the impact of controls for each response. A QFD moderator leads the workshop and accommodates different viewpoints of the stake-holder groups. Some stakeholders in the workshop represent the expected response and the relevant controls for each domain area.
Unfortunately, what QFD delivers is not the transfer function T but its transpose T T. The QFD method calculates the control profile by multiplying y with the columns of T , thus effectively calculating x = T T(y), whereas the transfer function from the x into the y requires matrix multiplication with the rows of T. Thus T (x) = y’, or T (T T(y)) = y’, but y ≠ y’.
The question is, how far away is y’ from y? Since both y’ and y are vectors in the same
vector space – the requirements for the responses – its distance can be calculated as the usual distance between vectors: || y – y’ || is called the Convergence Gap for the controls x and the planned response y. If this gap is small enough, x is a valid solution for the controls; if not, valid controls must be found by innovation. The convergence gap is the metrics needed for measuring whether the result of software development meets customer’s expectation.
3. A Structured Approach to Software Measurement Software development is knowledge acquisition about the topics in the domain field, up to
a level of details such that an electronic computing machine understands the process in full. 3.1. The Deming Value Chain for Software Development The Deming Value Chain has been proposed by Prof. Deming in the Thirties of the 20th
century, and promoted by Prof. Akao, the co-founder of QFD, under the name of “Compre-hensive QFD” [2].
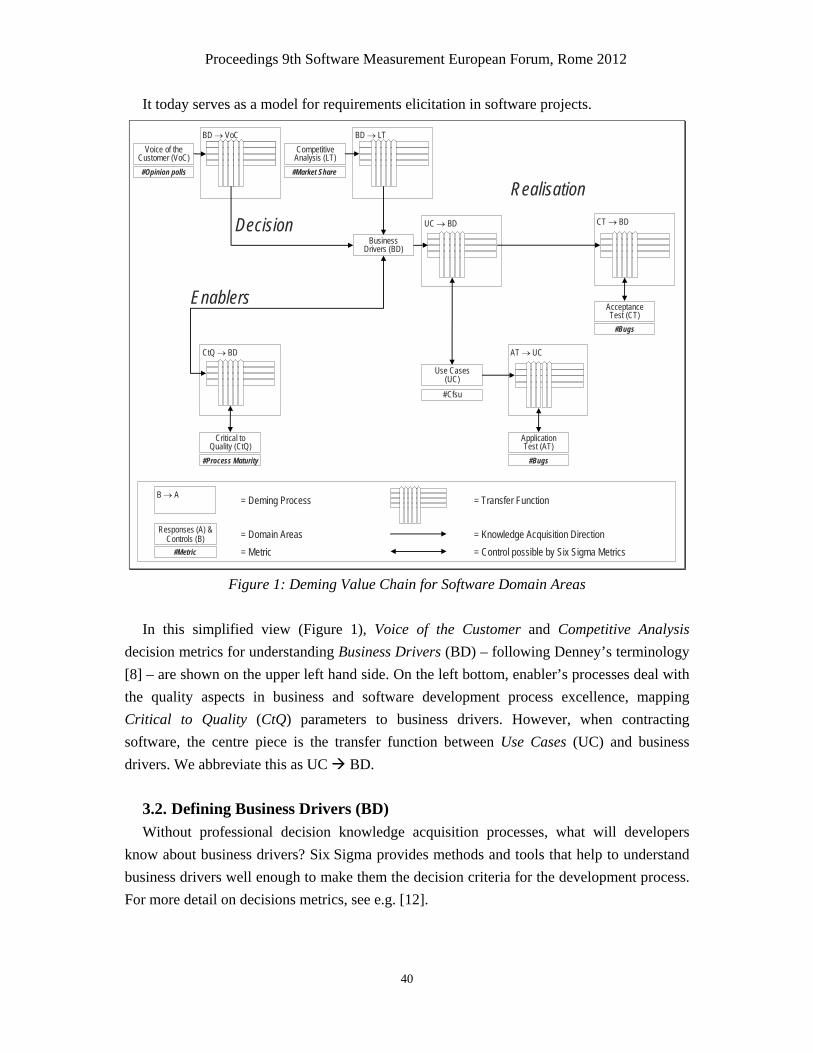
Proceedings 9th Software Measurement European Forum, Rome 2012
40
It today serves as a model for requirements elicitation in software projects.
BD → LTBD → VoCVoice of the
Customer (VoC)Competitive
Analysis (LT)
Decision
Enablers
Use Cases (UC)
AT → UC
Application Test (AT)
#Bugs
Acceptance Test (CT)
Realisation
BusinessDrivers (BD)
UC → BD CT → BD
#Bugs
#Cfsu
#Market Share #Opinion polls
Critical toQuality (CtQ)
CtQ → BD
#Process Maturity
Responses (A) & Controls (B)
#Metric
B → A = Deming Process
= Domain Areas= Metric
= Transfer Function
= Knowledge Acquisition Direction = Control possible by Six Sigma Metrics
Figure 1: Deming Value Chain for Software Domain Areas
In this simplified view (Figure 1), Voice of the Customer and Competitive Analysis
decision metrics for understanding Business Drivers (BD) – following Denney’s terminology [8] – are shown on the upper left hand side. On the left bottom, enabler’s processes deal with the quality aspects in business and software development process excellence, mapping Critical to Quality (CtQ) parameters to business drivers. However, when contracting software, the centre piece is the transfer function between Use Cases (UC) and business drivers. We abbreviate this as UC BD.
3.2. Defining Business Drivers (BD) Without professional decision knowledge acquisition processes, what will developers
know about business drivers? Six Sigma provides methods and tools that help to understand business drivers well enough to make them the decision criteria for the development process. For more detail on decisions metrics, see e.g. [12].

Proceedings 9th Software Measurement European Forum, Rome 2012
41
3.3. Defining Knowledge Acquisition for Realisation The rightmost matrices reflect Verification and Validation: Transfer functions that map
Test Cases into Use Cases and business drivers, abbreviated as AT UC, and acceptance testing to business drivers CT BD. Error! Reference source not found. is the blueprint for knowledge acquisition in software development. Measuring software development process controls allows predicting the process’ output
In the view given in Error! Reference source not found., the following transfer functions are shown:
• UC BD, explaining which use cases impact business drivers; • AT UC, the application test showing test coverage for the use cases; • CT BD, the acceptance test showing test coverage for business drivers.
The rightmost matrices, AT UC and CT BD, reflect verification and validation: transfer functions that map test cases into use cases and business drivers.
4. Collecting Data while Developing Software For the following, we assume the software development use the Rational Unified Process
(RUP) [15]. However, the approach works as well for agile software development, see e.g. [6], [13], [16], where it originates. Adepts of agile replace use case by User Story, and the framework works as well for agile project planning and time-box iterations.
4.1. The Buglione-Trudel Working Items Matrix for Software Development The Buglione-Trudel Working Items Matrix – the name originates from highly valuable
discussions at the IWSM/MetriKon/Mensura conference in Stuttgart 2010 [3] – combines the QFD Matrix UC BD with Work Items in the software development plan.
All work items identified in the project plan need being completed for finishing the
product, except some work items with low priority that sometimes can be postponed.

Proceedings 9th Software Measurement European Forum, Rome 2012
42
FunctionalWork Items
BusinessDrivers
Planned Response /Achieved Response
y1
y2
y3
y4
Use Cases
6
13
= Work Item with strong impact on business driver= Work Item with medium impact on business driver= Work Item with weak impact on business driver
Work Items
x1 x2 x3 x4 x5
Use CasePriorities
= Work Item with no impact on any particular business driver
Functional Size:23 Cfsu
Convergence Gap0.04
Figure 2: The Buglione-Trudel Matrix for Software Project Planning & Tracking
The two parts of the matrix are: • First, the cells in the upper part of the matrix – the original QFD matrix UC BD –
contain critical quality or non-functional requirements that impact the business drivers. Their functional size according ISO/IEC 19761 COSMIC typically is zero but can be higher. The value of the matrix cells is calculated according a simple scheme: o High impact on a business driver gives six points o Medium impact yields three points, and o Low impact yields one point.
• Second, the cells in the lower part of the Buglione-Trudel matrix contain the functional work items for the developers. All these are contained in a single row of the matrix. These work items have a functional size assigned to them but are uncritical requirements for the transfer function – functionality simply must work as expected. Each work item represents one or more data movement, thus it has a functional size, one Cfsu or more.
Each work item carries effort, and also change and refactoring information, as shown in
Figure 3.

Proceedings 9th Software Measurement European Forum, Rome 2012
43
Work items may have no specific impact on business drivers; also, one work item can have impact at different strengths on different business drivers and thus it might appear in more than one cell in the matrix. Regarding effort, it counts once.
The priorities of the work items are calculated by summing up the weighted impact per
column. This is the multiplication of expected response profile by the transposed matrix. The convergence gap indicates whether the development effort will meet customer expectations.
4.2. Work Items Each cell of the Buglione-Trudel matrix contains zero to many work items; a zoom into a
sample work item object is visualised in Figure 3. Each work item has a progress status according the “Six Step to Completion” method.
Work Item for User Story x1
Create input form for entering • Book Title• Author• Publisher• ISDN• Media type• Maximum number of matches
The results are the retrieved input strings.
Test isReady
Draft isReady
ReviewDone
Final-ized
Appro-ved
Ready for Use
Actual: 10 Change: 3Description
f1,1: Enter Book Title BusinessFunctional 1Size:
Impact: Hours
Planned: 6
1 x refactored
Figure 3: Sample Work Item
According this progress measurement method, each work item runs through six stages: • Test is Ready stage: Is problem understood and has a unit test been written? • Draft is Ready stage: does a full draft solution exist? i.e., is code completed? • Review Done stage: has code been checked whether it meets expectations? • Finalised stage: usually, something is left for improvement. • Approved stage: the team and management agree that the work is done. • Ready for Use stage: other programmers or users rely on the Work Item.
Status flags can be blank, red, yellow, or green. Green indicates the stage as completed;
work in progress is yellow; blocked steps are marked red, and blank steps are not yet started. Defining Six Steps to Completion standards enables measuring the software process. The
method to determine when a work item is finished is effort-independent, and defects can be distinguished from mistakes. A defect is identified when the work item needs refactoring after being set into the status “Ready for Use”. In this case, all progress statuses will be reset to yellow.

Proceedings 9th Software Measurement European Forum, Rome 2012
44
Even if a second round is done faster than the initial, it is a measurable defect in the sense of Lean Six Sigma. If we are not adopting Lean and just skip over identified defects, we might not be able to predict defect density at the end.
Furthermore, the work item object contains planned, actual and change effort. Planned
effort results from the project planning process; in Agile the Planning Poker [6], more reliable is the ISBSG database [5] or estimation tools based on parametrical models.
Usually, actual effort will be different from planned effort. Change effort is needed for
understanding missing requirements and fixing bugs. We are interested in how much time the development team spends with acquiring additional knowledge and learn about the true requirements and system constraints. If change effort remains small, this is an indication that the problem hasn’t yet been understood in full, in most cases. The learning curve is likely to grow later in the development project [10].
4.3. Testing Work Items
Work Item for Test Story t1t1,1: Enter Title String
Actual: Change:Test DaysPlanned: 3Description
Test Story Expected Result per Test Case User wants to enter text string; avoiding control characters and buffer overflow, for security concerns
1. Accepted: characters a-z; A-Z; digits 0-9, hyphen, comma, semicolon, colon, exclamation and question mark
2. All variants thereof in UTF-8, i.e., all diacritical characters, ¿, ¡, all Unicode Hex 0020 – FB02, except * (002A)
3. The star * (002A) is the wildcard, i.e., it matches strings of any length
4. All other characters are ignored except carriage return / line feed (000A, 000C) that end all input
5. The maximum input length is 128 characters; end of line is assumed if exceeded; subsequent chars are read but ignored
Developer’s Comments Observed Result per Test Case add 1) … add 2) … add 3) … add 4) … add 5) …
1. … 2. … 3. … 4. … 5. …
Importance: Critical Essential High Rating: OK P5 P4 P3 P2 P1
Tester: <Enter your name here> Date: <Enter last test date here>
Tests: x1,6; x3,1
0 x refactored Test
ReadyScriptReady
DataReady
Testexec’d
Testvalid
Ready for Rel.
Figure 4: Sample Testing Work Item
Proceedings 9th Software Measurement European Forum, Rome 2012
45
Similar to work items, we also define Test Items. They don’t belong to the Buglione-Trudel matrix but to the respective cells of the AT UC or the CT BD test coverage matrices. They too record planned and actual effort, assigned to the test item, as well as an indicator of the change effort needed when adapting the test case to new insights that had been gained during the software development and testing process.
Test items also have a completion status, need effort, and undergo changes, caused by bug
fixes or new insights, just as any other work item. Sample Six Steps to Completion criteria for test items read as follows: • Test is Ready – Test Idea is ready and specified; • Test Script is Ready – either for manual or automated execution; • Test Data are Ready – either dummy stubs or data from other processes; • Test has been Executed – no failure when executing the test; • Test has been Validated – the test results are valid, whether bugs found or not; • Ready for Release – Test executed without findings.
Tests can also be defective and therefore might have a refactoring count as well. Failed
tests, in the sense of tests that produce a finding for one or more work item, may cause refactoring counts increased on those work items. However, if findings are below priority 2, we may decide not to put the corresponding work item on refactoring.
4.4. The Testing Matrices The test items belong to the AT UC matrix. This is the next matrix in the Deming
Chain. The expected response of the transfer function is the test intensity for each use case. The transfer function maps the test stories – as controls – on user stories, thus the test stories are the controls for use case coverage through tests. The elements in the matrix cells are work items within that test story, as shown in Figure 4 above.
As before, a test story can have multiple work items with impact on one or more user stories, and the impact itself may vary as well.

Proceedings 9th Software Measurement European Forum, Rome 2012
46
Priorities Expected /Achieved Response
6
13
= Test Item with strong impact on User Story= Test Item with medium impact on User Story= Test Item with weak impact on User Story= Test Item with no impact on any particular User Story
Test Items
t1 t2 t3 t4 t5
Convergence Gap!
FunctionalSize
5 Csfu
3 Csfu
7 Csfu
4 Csfu
UserStories
x1
x2
x3
x5
TestStories
Test StoryEffectiveness
x4 4 Csfu
Refactoring Count 5 2 6 3 8
0.14
Figure 5: Test Coverage Matrix with Test Metrics
Again, we use a similar display for the AT UC matrix, with the test items placed into the matrix cells. We can evaluate this matrix and calculate the test effectiveness for each test story, identify whether test stories are missing for full test coverage, and compare the response of our actual testing approach with the expected response.
For the expected response of the test coverage process, two profiles are relevant: • Expected test coverage according priorities, from the Buglione-Trudel matrix; • Expected test coverage according Functional Size, from structure diagrams.
Multiplying these two for getting the expected response reinforces the importance for
testing user stories if both their size and priority is high, and lowers it if not much functional-ity is involved. Whether this is appropriate might depend from their cost impact.
An additional option is to combine quality (non-functional) work items for the expected test coverage response; however, it is difficult to argue how quality aspects relate to defect density, as most defects are related to functionality alone.
The controls’ profile indicates how much each test story contributes to finding defects.
This is called Test Story Effectiveness and calculated per column as before, when predicting use case priorities:
• Impact of test items on user stories, times functional size times priorities

Proceedings 9th Software Measurement European Forum, Rome 2012
47
Testing Effectiveness is the amount of priority-weighted functional size, times the usage intensity of this functionality when executed. The application test coverage results from multiplying the test item impact with the test story effectiveness row by row. The related transfer function can be predicted based on functional size and use case priority. This notion of test coverage is independent from code; it serves both model-driven approaches and cloud computing, unlike traditional definitions.
The convergence gap indicates as before, whether the selected test stories are capable of
finding the mistakes in the use case implementations. 4.5. Predicting Refactoring Count In Six Sigma, we don’t count bugs, but we are interested in the number of work and test
items that needed refactoring. This count is readily available and provides interesting insights into test effectiveness. If the need for refactoring was distributed equally, then we can expect that the profile for refactoring resembles the profile for test story effectiveness.
If not, then the following questions can be asked: • Are bugs unequally distributed? • Are tests not good enough? • Are impacts not correct?
It is like any measure indicating an unexpected measurement: it does not necessarily predict catastrophic situations. However, it hints at special situations. It is up to the process responsible to decide whether, and what corrective actions must be taken.
4.6. Data Collection Placing the work item objects into matrices visualises measurements for all stakeholders.
Adding or removing work items is immediately evident for each member of the development team; thus the measurements are closely related to people’s work. The Buglione-Trudel Matrix provides the level of measurement detail and precision needed for accurate cost and defect density estimates.
5. Predictions 5.1. Predicting Cost – Parametric View Cost depends not from functional work items alone – efforts needed for meeting business
drivers’ requirements by quality work items contribute as well to cost, quite often equally or even more than the functional work items. This cannot be predicted from the functional size alone. Parametric approaches to project cost estimations dealt with these quality requirements by adding an industry factor, or some sort of domain complexity index. Such indices were found using benchmark data and statistical analysis.

Proceedings 9th Software Measurement European Forum, Rome 2012
48
Recently, a Software Benchmarking committee of the GUFPI-ISMA has undertaken new work for understanding the taxonomy of productivity factors [17]. These factors can be used to predict what Boehm [4] called Cost Drivers; i.e., the generalised form of business drivers in specific projects. Thus, if the total impact of quality work items is predictable, total effort and thus cost of software project can be predicted in reasonable well accuracy – we can even expect that the precision level of the forecast will continually improve with the duration of the project since forecast and actual measurement uses the same concepts: What is needed to meet specific business drivers? Thus, the predicted cost of a software project depends from the customer’s business. Cost prediction based on cost drivers has been proposed in [11].
5.2. Predicting Cost – Work Item Prediction View The Buglione-Trudel Matrix allows predicting total cost quite accurately. It corresponds to
predictions based on the work breakdown structure in traditional project management. Once all work items are known, effort can be predicted by summing up all estimates per column in the Buglione-Trudel Matrix. It works for agile and traditional approaches alike.
Note that the QFD technique allows predicting the Buglione-Trudel matrix before all work items are known, using standard QFD workshop techniques. Experts assign each cell in the matrix an impact prediction value: High (9), medium (3), or low (1), depending how much impact the use case has on the respective business driver, indicating for high, medium, or low amount of work. This is also a prediction for how many work items are needed, because the impact work has in a knowledge acquisition undertaking is closely related to effort.
Thus, the QFD matrix in the planning phase complements cost prediction. Since the
functional size per use case is known, weighting the functional size with the use case priority profile reflects the distribution of cost per use case throughout the development project. As a result, each use case has different costs per function point assigned.
5.3. Predicting Defect Density Defect density predictions based on transfer functions has also be proposed already some
time ago [10]. There the sequence of transfer functions needed for the prediction was given, but it was left open with which data to start. Now, based on the measurement programme the defects encountered during the development process is counted and plotted against time.
The initial usage intensity is measured by the amount of functional size times the number of times this functionality is executed. This is the testing effectiveness.

Proceedings 9th Software Measurement European Forum, Rome 2012
49
5.4. Predicting Customer Satisfaction The most difficult challenge when developing software is resolved with the Buglione-
Trudel matrix: predicting customer satisfaction after software delivery. Under condition that change in market environment, or economic factors like economic expansion or recession, are excluded, the transfer function that maps business drivers into market share (BD LT) or business drivers into Voice of the Customer (BD VoC) ensures market success as well as customer satisfaction.
5.5. Contracting for IT Projects The framework is strict enough to allow for contracts not only specifying cost per
Function Point, but also the admissible Convergence Gap against stated customer require-ments for business drivers. It allows project sponsors to validate that work was spent towards the stated goals of the project, not to something else that’s not in the project focus.
Any such contractual obligation obviously would require transparency of the detail planning process and involvement of the sponsor, or project owner. This is highly beneficial for all parties involved, and could be used to avoid wasting time and money when developing software, true Lean Six Sigma for Software, in the sense as proposed by Poppendieck [16]. Based on measurements, software development can adopt the “Stop-the-Line” policy against wasting time and effort in useless sizing exercises, carrying over long bug lists, and work not adding value to the agreed business drivers. Moreover, the Convergence Gap, applied to finished work items only, indicates when a project is ready to go into production.
6. Conclusion The concept of transfer functions is very powerful, and easily adaptable to software
development, and in particular to measuring software processes. We have shown how to structure a software development process measurements programme that implements the Deming Value Chain, and this measurement programme has worked in practice very well, even if the theory behind transfer functions is still under development and probably not yet fully understood in IT project management practice.
7. References [1] Abran, A. et. al.: The COSMIC Functional Size Measurement Method – Version 3.0.1 –
Measurement Manual (2009), http://www.cosmicon.com/ [2] Akao, Y. et. al.: Quality Function Deployment, Productivity Press, University Park, IL (1990) [3] Buglione, L., Trudel, S. (2010), Guideline for sizing Agile projects with COSMIC. In: Proceedings of
the IWSM / MetriKon / Mensura 2010, Stuttgart, Germany [4] Boehm, b.: COCOMO II, Addison-Wesley, New York, NY (2002) [5] Hill, P. ed., Practical Software Project Estimation 3rd Edition, McGraw-Hill, New York, NY (2010) [6] Cohn, M.: Agile estimating and planning, Prentice Hall, New Jersey (2005) [7] Creveling, C.M., Slutsky, J.L., Antis, D.: Design for Six Sigma, Prentice Hall, NJ (2003) [8] Denney, R.: Working Smart to Deliver Quality, Booch–Jacobson–Rumbaugh – Series, Addison-
Wesley, New York, NY (2005)

Proceedings 9th Software Measurement European Forum, Rome 2012
50
[9] Fehlmann, Th.: The Impact of Linear Algebra on QFD, in: International Journal of Quality & Reliability Management, Vol. 21 No. 9, pp. 83-96, Emerald Group Publishing Ltd., Bradford, UK (2005)
[10] Fehlmann, Th.: Defect Density Prediction with Six Sigma, in: Proceedings of the 6th Software Measurement European Forum, Rome, Italy (2009)
[11] Fehlmann, Th.: Using Six Sigma for Project Estimations – An Application of Statistical Methods for Software Metrics, in: MetriKon 2009 – Praxis der Software–Messung, Kaiserslautern, Germany (2009)
[12] Fehlmann, Th.: Six Sigma for Analyzing Market Preferences, in: Proceedings of GI Fachtagung Software-Management 2010, LNCS, Springer-Verlag, Hamburg, Germany (2010)
[13] Fehlmann, Th.: Agile Software Projects with Six Sigma. 3rd European Research Conference on Continuous Improvement and Lean Six Sigma, Glasgow (2011)
[14] Fenton, N.E., Neil, M., and Marquez, D., Using Bayesian Networks to Predict Software Defects and Reliability. Proceedings of the Institution of Mechanical Engineers, Part O, Journal of Risk and Reliability: p. 701-712 (2008).
[15] OMG Unified Modeling Language™ (2009) – OMG UML, Superstructure V2.2, pp. 506--524, http://www.omg.org/spec/ UML/2.2/Superstructure/PDF/ [seen 26-Feb-11]
[16] Poppendieck, M.& T.: Implementing Lean Software Development, Addison-Wesley, New York, NY (2007)
[17] Santillo, L., Moretto, G., on behalf of SBC (GUFPI-ISMA): A general Taxonomy of Productivity Impact Factors, Software Benchmarking Committee, Gruppo Utenti Function Point Italia – Italian Software Metrics Association, IWSM-MENSURA, Stuttgart (2010)
Proceedings 9th Software Measurement European Forum, Rome 2012
51
The meaning of software measurement in a contractual relationship
Marco Gentili, Pierfranco Gennai
Abstract
Functional Measurement was developed aseptically in the research field of Software Engineering. When it is used in a contractual context, in order to manage the customer/supplier relationship, it is associated with a number of degenerative non-academic interpretations that can produce real diseases, both during the procurement process of software development services, and in the execution phase of the corresponding contracts. For this reason DigitPA3 (formerly CNIPA) decided to treat the functional measure issue in its “Guidelines on the quality of ICT assets and services for the establishment and governance of ICT contracts in Public Administration”, without forgetting the need for non-functional measurements too.
This paper describes some challenges to optimise the processes of planning, negotiation, execution and control of software contracts.
1. Introduction The constant evolution of national and local laws in Italy makes it necessary to continually
adapt the Public Administration’s information systems both through the implementation of new applications, both by reviewing those already in use.
This necessitates an increasing flexibility in contracts for the supply of software’s development and maintenance services, contracts that are in fact evolving in this way, moving from a “static” setting, where the characteristics of quantity, quality and technical arrangements for the supply and delivery are defined and described in advance, to a setting more and more dynamic in which only the general characteristics of the supply are initially known.
3 DigitPA is a not economic public body, with competence in the sector of the information and communication
technologies, within the Italian public administration; it operates under the supervision of the Prime
Minister (or of the delegate Minister).
DigitPA unwinds functions of project, technical and operative nature, with the mission of contributing to the
value creation for citizens and enterprises from the public administration, through the carrying out of the
digital administration.

Proceedings 9th Software Measurement European Forum, Rome 2012
52
This is the context of the Framework Contract and the subsequent implementation agreements, which usually adopt a Cost Reimbursement delivery model.
In this paper we’ll address both the new issues arising from this evolution of forms of
contract, both the existing ones, all linked, however, to the correct measurement or estimation of the functional size of the SW supply and to the determination of its costs.
As part of the life cycle of these contractual issues, the following activities should be addressed:
• the initial determination of the bid starting price, which is necessary to estimate; • the assessment of variations during the work; • the evaluation of the anticipated interruptions; • the final determination of fees.
In the following, the IFPUG functional size measurement method (Function Point
Analysis), established and recognised as the standard de-jure and de-facto at international and national level, is proposed for adoption.
Regarding the determination of fees, methods for the calculation of fees in cost reimbursement contracts, as well as for the valorisation of variations during the work and of eventual anticipated interruptions, are proposed. These methods take into account both the size of the SW, related to functional requirements, both productivity factors, related to the technical and quality requirements and to the time constraints on the implementation phase.
The overall methodological approach takes into account the results published in June 2006
in “Guidelines for the use of Function Point in Contracts” from the Italian association of Function Point User Group and Software metrics (GUFPI-ISMA) that in recent years has analysed the different methodological approaches and the experiments at national and international level.
2. Use of Function Points Interest in Function Points (FP) in the U.S. began in the '80s. In Italian public
administrations, until the early '90s, lines of code (LOC), based on the count of executable and data declarations statements, were used, in the software field, both for software development and maintenance.
Since 1993, AIPA (today DigitPA) has promoted the adoption of quantitative software metrics, based on the IFPUG method, and qualitative software metrics, mainly related to the characteristics of quality in the ISO 9126, publishing documents for guidance and support.
Proceedings 9th Software Measurement European Forum, Rome 2012
53
The function point method has gradually replaced LOC. LOC vary, with the same functions performed, according to the type of language used and according to programming styles and their measurement has never been standardised at international level.
Today they are even more difficult to quantify due to the diffusion of more advanced
visual languages for graphical user interfaces and WEB sites that, among other things, provide the capability, unlike the COBOL, of not homogeneous coding with respect to the physical length of the line itself.
The introduction of the function points has the purpose to overcome the limitations of
LOC for analysis of productivity and estimation of the size of software. These limitations stem mainly from the fact that lines of code really only measure the "length" of the software in terms of instructions issued. Lines of code, therefore, depend on the programming language used. Each language has its own expressiveness that allows obtaining a given result with a number of LOC inversely proportional to the level of maturity of the language itself. In addition, LOC can be calculated only in very advanced stages of the software life cycle, resulting in estimates with a high degree of subjectivity and uncertainty. Currently, function point metrics has been gradually adopted by almost all central government bodies.
To effectively manage the supply of services for development and application
maintenance entrusted to outside companies, public administrations have always felt the need for metrics to be recognised and shared with suppliers, with which to quantify the services to supply and properly define the economical limits in case of turn-key projects.
The use of appropriate metrics makes it possible to further objectify the content of such contracts to minimise ambiguities, misunderstandings, and maintaining the differences between initial and final values within reasonable limits. It also allows the precise costs and project schedule, to check the progress of the project, and specify procedures for verifying the quality of software produced.
The absence of appropriate metrics is a significant problem; buying, with a Fixed-Price
Contract, a product or service that ICT can not quantify properly means, in fact, purchase availability or production capacity with a transfer of risk on the weakest part of the relationship.
DigitPA takes as references, for productivity and costs of development and / or maintenance projects, the main international sources.

Proceedings 9th Software Measurement European Forum, Rome 2012
54
Among these are: • the studies of Capers Jones, that classify the programming languages in several
"levels ", corresponding to different values of development productivity; • the Gartner Group analysis on productivity and cost of software development and
maintenance, which makes benchmarking activities with equal or "best in class" features;
• the benchmark of International Software Benchmarking Standards Group (ISBSG), a non-profit organisation, based in Australia, which conducts research projects and research on issues of development and maintenance of software, metrics and productivity in IT projects. The ISBSG periodically releases, upon payment, the results of measurements of productivity in software development carried out on a global scale; a recent edition of the survey comprises data from over 3000 projects, with many project characteristics and production parameters including the work hours per function point and the function points released per month.
While recognising the great importance and significance to the sources mentioned above,
DigitPA has also felt the need of an "internal" reference, to focus on the characteristics, dimensions and structure of the ICT projects carried out by Italian public administration.
This “internal” reference consists of the development and / or maintenance projects of the public administration of which DigitPA expresses technical and economic advice.
Typical project data extracted from the advices’ archive are: • number of function points to be developed or maintained; • programming language, development platform; • type of supply (tender or private treaty); • software development life cycle phases and percentage weight; • function point’ cost; • quality requirements.
The time series of these data are used by DigitPA for evaluations of appropriateness,
analysis of variance, studies on the weight of the individual parameters and temporal trend of some indicators.
Another advantage of this source is the extreme homogeneity of the samples, allowing
comparisons and aggregations of such data impossible in the ISBSG archive. The use of this source, of course, doesn’t exclude the other ones.

Proceedings 9th Software Measurement European Forum, Rome 2012
55
Conversely, it is considered necessary a plurality of sources, because the exclusive use of internal references would inevitably lead to a "self" analysis: in other words, considering as unique reference the DigitPA advices, the economic fairness analysis could only flatten out over time on the average of the previous evaluations.
The functional measures, in addition to being used for the highlighted purposes, are
employed for controlling the supply of application software on the entire development cycle, by means of measuring systems which also include indicators based on function points.
Here are, as an example, indicators that use this size. Productivity • during development: development hours / developed FP; • during maintenance: number of FTE/ operational FP; • release rate: developed FP / development elapsed time.
Quality • defects: number of defects during first year / FP; • test coverage: number of test cases/FP; • documentation: number of pages/FP.
Cost • cost per developed FP: total cost /developed FP; • maintenance cost: total maintenance cost /operational FP; • SW portfolio's value: total FP x unit cost.
Use An interesting indicator can be obtained by multiplying the number of function points for
the users by creating a "use factor" that reflects the potential use of the functions implemented by software.
• Used FP = Online FP x # of Users • FP actually used = online FP x User x Frequency
These indicators, with any weightings and adjustments, can be applied to the study of
various phenomena, suggest clues and lead to different analysis whose conclusions are to be checked case by case, also considering the users knowledge of the service.
3. Applicability of Function Points DigitPA, whether in response to requests from public administrations both in its
institutional tasks, examined the issue of metrics for application development and maintenance in new technological environments: the creation of websites, the data warehouses, the ERP systems and the reporting applications.
Proceedings 9th Software Measurement European Forum, Rome 2012
56
DigitPA chose not to focus on counting technique or on possible extensions of the metric to the new environments: these issues are being studied by other organisations, such as the already mentioned GUFPI-ISMA. DigitPA focused on the relationship between the functional size of the applications in new environments and the effort needed to develop them.
It is argued that the metric of function points is applicable to new development
environments, because it measures the functional content of a software application, from the user point of view, regardless of the technology with which that application is made. However, assuming that the count will lead to a correct result from the theoretical point of view, then seems to not be a direct relationship between this size and the development effort, ( in person-days), and therefore the final cost of the project.
The functional dimension is measured in the theory for each type of application,
traditional and innovative, and partly also for other environments. Reasons of efficiency in the count, applicability for economic purposes, attributable to increased use of software support or lack of reference values of productivity, may suggest a greater or lesser use of functional dimension.
It is increasingly important, in the most advanced techniques of production environments,
the use of innovative production tools, parameterised and generative, reducing the correlation between the final size of the overall application and the effort (costs) and introducing the impact of the cost of licenses for the use of configurable software. For these reasons the research for other metrics is underway in several areas (ISO, IFPUG, ISBSG, COSMIC), also broadening the scope of examination, from internal functional and dimensional characteristics to other interest for the end user and reflected in the quality of the software in use.
As software becomes increasingly symbolic and usable, also the metrics will rise in
abstraction, as has been the shift from lines of code to function points. This trend will increasingly aware of what the user perceive, value always enhanced by the technique of function points. Even introducing other metrics will be essential to continue to have, over time, a benchmark set, a unit of measurement method and a comparable standard internationally recognised. The trend is to improve the ability to distinguish between the different problems of traditional and innovative environment, with specific use of new production tools, to keep separate the processes of development and maintenance, to improve the quantitative measures (dimensional) and qualitative, for a better prediction and summarising of the perceived quality and production costs.

Proceedings 9th Software Measurement European Forum, Rome 2012
57
The following table summarises the applicability of the function points for different possible uses, to various environments, (traditional, innovative and commercial), resulting from the GUFPI-ISMA experiences.
Table 1 - Applicability of Function Points
Environment description
FP’s possible uses
Functional Size Unit Cost Performance
indicators
Traditional Environments: Web interactive, Data warehouse on line, Legacy System
Development/ Enhancement
Widespread Differentiated Productivity
Production support Widespread Average Defects
Innovative environments: Web publishing / multimedia , Data warehouse ETL
Development/ Enhancement
Conditioned spread Differentiated ---
Production support Conditioned spread Average (rarely) Defects (possible)
Commercial Off The Shelf (COTS) software: Enterprise Resource Planning (ERP), Customer Relationship Management (CRM)
Development/ Enhancement
Yes (customisation) Differentiated ---
No (parameterisation) ad hoc models ad hoc models
Production support Yes (customisation) Average (rarely) ---
No (parameterisation) ad hoc models ad hoc models
Note: ad hoc models are cost estimates in studies that combine efforts, products and licenses costs.
4. Bid starting price estimation The tender documentation, in addition to describing constraints and technical,
organisational and environmental requirements must indicate the bid starting price, (the maximum not be exceeded by the offers). This amount must be determined by the contracting authority, evaluating the elements that contribute to its formation.
Proceedings 9th Software Measurement European Forum, Rome 2012
58
Said elements are: • the functional size (FP) of SW applications; • any adjustments to the size due to the reuse of items already made or to be made and
the replication of the functionality already implemented or to be made across multiple operating environments;
• the price for FP, depending on the size and / or technical quality requirements for applications;
• the costs that are not proportional to the size of software such as fixed costs (e.g. installations across multiple locations), the costs related to the security requirements for access to functions and data, etc.
These factors, when determining the bid staring price, must be estimated, measured or
detected within the constraints of implementation expressed in the contract documents and must be weighed to obtain a total economic value that approximates the market value of the supply.
4.1. Function Points estimation At the time of determination of the bid starting price, in most cases do not have elements
that describe the software product to the level of detail as to be able to allow the count of its functional size according to the IFPUG counting standard method and should be, therefore, used an estimate, with an approach that ensures an accuracy compatible with the requirements of the tender.
Please note that the IFPUG counting standard, because is a functional metric independent
of the technology used, is not based on the identification of "physical components" of the application SW (LOC, forms, tables, etc...), but on "base functional components" (logic data and functions).
Published estimate’s methods, also, may be based both on an extrapolation of the FP from non-functional elements (cost, LOC, number of tables, number of screens, etc ...), and on estimate of the base functional components of FP methodology.
Within the first category, (extrapolation methods), are all so-called techniques of
"Backfiring", which derive the number of FP in a mechanistic manner using predetermined correspondence relationship between the amount of non-functional elements and the number of FP. The Backfiring technique is based on different methodological assumptions respect to the standard methodology of Function Point, which has been developed in order to give a result independent of the technology and of the number of non-functional components of the application SW.

Proceedings 9th Software Measurement European Forum, Rome 2012
59
The correspondences that underpin Backfiring practices are based on statistical data and their significance, then, is closely tied to the significance of the statistical sample used and to the identification of the correct parameters for matching.
There is currently no published evidence to demonstrate the validity of these matches
outside of the technological experimentation environment (language used, operating system, application type, etc ...) and, for this reason, this estimation technique is not recommended.
The second category, (estimation methods), is based on the functional components and is, therefore, compatible with the standard method of FP. These methods have varying degrees of reliability and different estimation cost and differ substantially for the mode of detection of the functional components.
Below are listed the different methods with a short examination of their characteristics,
constraints, advantages and disadvantages. 4.2. Extrapolated measurements The method is based on the assumption that software applications have the same
percentage distribution among the five functional components defined in the Function Point method. The percentage distribution among the functional components can be determined by processing the public data benchmark, as ISBSG or benchmarking data internal to the administration. Of course, this method can be used only in cases in which it is possible to determine the number of FP of at least one of the basic functional components according to the standard method IFPUG.
The limit of this method lies in the fact that the degree of accuracy varies greatly
depending on the statistical sample used and on the functional characteristics of the applications in the sample. From this point of view the data of internal benchmarks are more important from the statistical point of view as taken from applications realised in the same technology environment. In any case, these reports percentages were found stable only in the case of software applications that do not interact with other systems. For these reasons it is advisable to use this method of estimation in the case of enhancement projects that typically carry additional features. This method has the advantage of being very simple and fast to use and can be used only if you have the detail information making it possible to count the functional elements mentioned.
Proceedings 9th Software Measurement European Forum, Rome 2012
60
4.3. Sampled measures This method involves the measurement of only one part of the system and from this it
derives the overall measurement of the entire system. Unlike the previous method, which provides to investigate the whole system with respect only to some of its functional components of the FP method, in the method of sampled measurement only a portion of the system is investigated by measuring, however, all of its functional components. The quality of the estimate will be proportional to the representativeness of the sample chosen. Like the previous, even this method is simple to use but can only be used if you have the information to count the functional elements of a sample of the system and if you are familiar with the analogue characteristics of the residual components of the system (those outside the sample) to make meaningful extrapolations.
4.4. Method of average complexity This method consists of identifying, for a particular application; all the functional
components defined by the IFPUG method and adopt an average complexity for each of them, to be determined through the analysis of benchmark data on similar applications. The quality of the estimate will be greater as the actual distribution of the complexity of the application components to be estimated is around the average value.
This method has the advantage of providing an estimated value in the FP very precise and with all the functionality tracked, but has the disadvantage that it is very close to a standard counting, in terms of effort and required application knowledge.
4.5. Early&Quick Function Point The method of the Early & Quick Function Point (E & Q) is a consistent set of concepts
and procedures using information that may have a different level of detail between them and adopts the general structure and basic concepts of standard methods for measuring the functional size. The E & Q method combines different approaches in estimating the functional size of an application or project:
• the estimate is based on the analogy between features to be implemented with other similar already implemented for which the size is known;
• the estimate is based on the identification of functional components and relative complexity that can be performed at different levels of abstraction based on the detail of the requirements available.
This method provides a tern of estimate’s FP value, minimum, maximum and most likely,
which also express the uncertainty associated with estimate. The uncertainty of the estimate, expressed from the range of values between the minimum and maximum, is obviously greater for combinations of features at a higher level, reflecting a greater lack of details.
Proceedings 9th Software Measurement European Forum, Rome 2012
61
The method is based on a table of reference values statistically and analytically validated. 4.6. Criteria for the choice of the estimation method A method of estimating the size of a system / application software to be implemented
according to a contractual relationship, shall met the following requirements: • must express the estimate using the function points unit, for the reasons already
mentioned; • must ensure a degree of accuracy consistent with the needs of the parties; • must be transparent, reproducible and verifiable by the parties, and benchmark data
must be known and accessible. Moreover, if the contract states how to manage the measure life cycle, for example by
reusing the estimates made in the initial stages during the later stages of counting, it becomes essential to use a method which allows to operate the stepwise refinement, rising to levels far away increasingly detailed and precise during development activities, without having to repeat all the activity measurement and avoiding moving from one technique to another with the problems of compatibility and comparability of different measures that would lead to an increase of over costs and time, both for the customer that the supplier.
A method that meets these requirements, including scalability of detail, until totally coincide to the standard IFPUG method, is the "Early & Quick Function Point" method.
5. Determination of fees During the execution of software development contracts, there is a need to determine the
fee to be paid to the supplier in the basis of what actually made or to re-determine the amount stated in the contract as a result of variations in supply agreed during implementation.
In cost reimbursement contracts, used when it can not be defined in detail the supply, the
fees are typically calculated at the end of the project, or at the end of a part of it. In fixed price contracts, in which the fees are established at the beginning, you may need a
fees recalculation if an early termination is requested by the client. The fees calculation method must be stated in the agreement and must be clear and, as far as possible, simple to apply as they may be a source of conflicts between the parties.
In the following sections are shown the methods based on software functional size and
productivity parameters for its implementation that provide a relatively simple use and at the same time also ensure fairness between policyholders' interests in the various situations that may arise during the implementation. The table below shows for each contract type the possible cases of determining fees during implementation.

Proceedings 9th Software Measurement European Forum, Rome 2012
62
Table 2 - Determination of fees Type of contract Fees according to what is
actually delivered
Changing requirements
during implementation
Early interruption of
implementation
Fixed price contracts X
Cost reimbursement
contracts X X X
5.1. Cost reimbursement contracts The cost reimbursement contracts, (CRC), are those which, for reasons of flexibility of
supply, define the mechanisms for the determination of fees that are calculated at the completion of supplies or parts thereof. Unlike the fixed price contracts, the fees, in this case, are tied to what is actually delivered and in particular, in the case of SW development, are tied to the functional size of the product delivered at the unit price of the unit of size, to the reuse and to the cross-platform replication of software components.
The unit price, and any associated adjustment coefficients for the reuse and replication,
must be already established in the contract documents and are the values proposed by the supplier.
This type if contract can be found commonly in Public Administration, in particular in a
frame contract, where most of the time, having regard to the time elapsing between the formation of the contract and its implementation, can be clearly defined only the spending limits and the unit prices. Even if detailed documentation of functional requirements is always useful, this approach allows tolerate uncertainty of requirements that can only be specified when the project started. This type of contract is very flexible because it allows you to establish commercial agreements in situations where it is possible to precisely define only the maximum amount of expenditure.
Let’s analyse what are the critical issues that may occur in the determination of the fees in
this model, before presenting the elements for an appropriate management of this type of contract. In a CRC, that provides for only one fixed unit price for Function Point delivered, the client initially takes into account the aspects that characterise the various projects that will be delivered, describes them in the tender documentation to enable competitors to determine the unit price based on the average productivity of all the planned projects.

Proceedings 9th Software Measurement European Forum, Rome 2012
63
During the term of the contract, however, each project or work package is perceived by the supplier as autonomous and the average price could determine critical issues regarding the costs. These issues do not depend on the poor management of project itself but by the presence of cost elements resulting from design features: in a situation of this type, the manager is psychologically driven to cut costs with the result of bringing the project in a high risk failure area. This phenomenon can also degenerate the relationship between customer and supplier, often causing negative impacts in the management of the entire contract.
Finally, given the uncertain nature of the objects of a CRC, there is no guarantee that at the end of the contract the percentage distribution of projects or work packages types corresponds to that originally planned, from which has descended the average price initially agreed upon.
Consequently, the initial assessments of fairness, built on a hypothetical profile of the
project portfolio is not maintained in reality, may be wrong, with the result that one party pays an unjustified cost or suffer a reduction in revenues.
In order to overcome this type of issues it should be defined a price modulation mechanism appropriate for the context of the supply, which takes account of two requirements that can not both be completely satisfied: defining in the contract a system for fees determination that ensure fair prices in every situation and maintaining the set of rules to be applied as simple as possible
The compromise solution proposed is characterised on quantifying the fees based on
categories of projects. It is a relatively simple rule, ensuring equity in the case of heterogeneous projects. The mechanism is based on the identification of a number of project categories, each characterised by a set of performance factors; a single unit price for Function Point, a coefficient of reuse, a coefficient of replication, are associated to each category; their values are those indicated in contractor’s tender offer.
The number of categories should be low, because each category requires an additional
effort both in the drafting bid documents and in managing the contract. It seems appropriate; therefore, reduce the number of defined categories, unifying some of the categories having similar unit price. In addition, the categories which provide a reduced number of development’s FP should be enclosed in the categories with similar unit price.
This mechanism can lead to categories with insufficient capacity (maximum number of FP to deliver) and / or to other categories with excess capacity. To overcome this, the contract should allow for compensation within a predetermined tolerance and without exceeding the maximum contract amount.

Proceedings 9th Software Measurement European Forum, Rome 2012
64
Each project category should be described in detail • in the tender documentation, so that competitors can properly assess their effort in
order to quantify the unit price and any coefficients for each category of project; • in the contract to allow, during development, an easy assignment of any software
developed for a specific project category. 5.2. Fees in the event of early termination of the work During the implementation of a project, the client may have the need to terminate the
project at any stage. This need typically arises as a result of unforeseen situations, such as issuing a new rule of
law, the reorganisation of most administrative structures, etc... In all cases where the administration believes that these events can have consequences on
the projects to be undertaken, the contracts should establish a method of determining the fees in event of early termination of projects, which allows to remunerate the supplier in relation to what is actually delivered.
The methods for the determination of fees in these cases are used to determine the percentage of the total amount contractually required to be paid to the provider
It can be calculated on the base of the value of the objects actually made with regard to the overall value of the project.
In this case it may be useful to employ the "Earned Value" method, used to analytically
evaluate the progress of projects and the possible delay. This method allows to manage the project with an appropriate level of detail, determined
at the beginning of the work and based on characteristics such as duration of the project, the resources committed, etc., the level of detail is a compromise between the degree of precision required and the cost of detecting and calculate the necessary data.
This method has the advantage that the fees are calculated based on the value of goods actually delivered, but it is complex to apply and the contract shall describe analytically all rules for implementing Earned Value method.
Another method of determining the fees in the event of early termination of the project can be based on the number of phases of the project actually completed. In this case, it must agree to a percentage weight to assign to each phase and describe what the criteria for considering the stages completed are.
With regard to the weight percentage to be assigned to the phases, it may be referred to as proposed in the literature, or to data derived from the experiences of administrations or suppliers.

Proceedings 9th Software Measurement European Forum, Rome 2012
65
The following tables, indicative only, show the distribution of weights for two life cycles of a project to develop software applications: the “Waterfall” life cycle and the "Rational Unified Process".
Table 3 - Waterfall Lifecycle
Phase Project Size (KLOC)
2 8 32 128
Planning and Requirements Analysis 7% 7% 7% 7%
Design 16% 16% 18% 18%
Development 66% 58 % 55% 52%
Integration and Test 11% 19% 20% 23%
100% 100% 100% 100%
Table 4 - Rational Unified Process Lifecycle
Phase Effort %
Inception 5%
Elaboration 20%
Construction 65%
Transition 10%
100%
As mentioned, in addition to the percentages of effort for each phase, the contract must
also specify the criteria for considering a phase “completed”: transmission of a document, delivery and approval of a product, presence of objective evidence proving the completion of activities planned for that phase.

Proceedings 9th Software Measurement European Forum, Rome 2012
66
5.3. Fees in the case of changing requirements Changes in application software requirements are typical of CRC, used to develop
products for which the requirements are defined during the project and not before. Such contracts must be flexible and product requirements are initially set in a generic way
and subsequently developed during the analysis and design activities. The fees for these contracts, as described in the preceding paragraphs, shall be calculated
based on the size of the released software product. The requirements change during implementation results in an additional effort by the provider, which should be recognised by the client, but that is not considered in the determination of fees, because the functional size of the released product do not provide the extent of the changes.
To avoid the critical issues that may be related to the achievement of agreements between
the parties, it is recommended that the contract establishes the methods for the determination of fees and delivery timeline based on the amount of changes required. For the redefinition of the contract deadline, a procedure should be defined for re-planning the activities to be carried out taking into account some constraints already established, such as productivity.
With regard to the economic considerations, it is appropriate that these take into account
the required change of requirements, based on the size of the variations. The method that is proposed is based on measurement of these functional changes through the Function Point. The fees determination procedure, to be described in the contract, should indicate also the limit of changing requirements, under which the variations are considered as physiological demands of the project and therefore not paid separately, as the effort to implement them is already included in the initial fees.
This will encourage small, but often important evolutions of the initial characteristics of
the product, to make it closer to the needs of business through the tuning of product during the implementation phases. During the execution of the contract, requests for changes should be documented and managed in a formal manner and the procedures for their management must be shared between the customer and the supplier.
Changes to requirements must still be submitted for approval by the client. 6. References [1] GUFPI-ISMA, “Linee Guida per l’uso Contrattuale dei Function Point” ("Guidelines for the use of
Function Point in Contracts"), Rome, 2006 [2] DigitPA, ” Linee guida sulla qualità dei beni e dei servizi ICT per la definizione ed il governo dei
contratti della Pubblica Amministrazione “ (“Guidelines on the quality of ICT assets and services for the establishment and governance of ICT contracts in Public Administration”), Rome, 2010.
Proceedings 9th Software Measurement European Forum, Rome 2012
67
Successful software project outsourcing - How to limit the risk of failures
Harold van Heeringen
Abstract Worldwide, many Requests for proposals (RfP’s) are send out every day to even more
potential suppliers. In modern RfP’s, clients are trying to gather objective criteria, with which they can analyse and evaluate bids from different suppliers. However, the questions asked in these RfP’s are often hard to answer for immature organisations, but sometimes even harder to answer by more mature organisations.
Sogeti Nederland B.V., a large IT software supplier in the Netherlands, is often struggling
to answer RfP questions like: • What is your productivity rate for .Net projects? • What is your standard duration for a project of 1.000 function points? • What is your price per function point for a Java project?
Of course, these questions seem like good questions, but in fact these questions are ‘un-
answerable’. We believe that there is no such thing as a standard productivity rate, but that there are a number of factors, like duration, size and complexity, that together lead to a realistic productivity rate. We could answer a question like: ‘What is your productivity rate for a moderately complex java project of 500 function points and a duration (low-level design – acceptance test) of 20 weeks?”. However, these are not the questions that are asked in RfP’s, so we have to improvise.
This also means that in the software industry, quotations of suppliers are often not
realistic. Client organisations should become aware of the questions they should ask in RfP’s and they should learn how to evaluate the quotations from the suppliers. In this paper, both topics will be discussed. Participants on the demand side will learn which questions they should ask in RfP’s and how to identify the quotations from suppliers that are not realistic. Participants on the supply side will learn about the future in RfP management and the questions that they should be able to respond to in the (hopefully) near future.
This paper is an update of the paper Request for Proposal Management - Ask the right
questions and choose wisely [1].
Proceedings 9th Software Measurement European Forum, Rome 2012
68
1. Introduction In today’s world, most medium and large companies in the world are involved in some
kind of outsourcing. Many organisations believe that outsourcing is the perfect solution for managing a part of the (usually ‘non primary’) functions in the organisation in an efficient and effective way. This may be true for certain tasks that are relatively easy to understand, like for instance catering or security of an organisation. In these cases, knowledge transfer from the outsourcing company to the service supplier is relatively easy and the characteristics of the service to be delivered and its price are easy to agree on. IT development projects however are usually very complex. Knowledge transfer from the outsourcer to the supplier is often a difficult task. Outsourcing companies try to select the right outsourcing partners by trying to compare the different suppliers based on quantitative data. Although this idea is very good, the way it’s done in practice is unfortunately quite the opposite. The purpose of this paper is to show the fact that modern RfP management should take into account laws and best practices from software metrics literature. Selecting the best supplier, based on the comparison of objective comparable data, can be the start of a successful relationship between the two organisations.
2. Request for Proposals (RfPs) The Wikipedia definition of Request for Proposal is: An invitation for suppliers, through a bidding process, to submit a proposal on a specific
product or service [2]. In many cases, RfP’s are also submitted to select outsourcing partners (or ‘preferred
suppliers’) for a period of time. During this period of time, the supplier may or may not do any work agreed upon in the contract. In this paper we will investigate the RfP management for a single software development project, not for a period of time.
In general, the company that sends out the RfP has to provide all the necessary information to the potential suppliers for them to be able to draw up a sound proposal. In general, the following information has to be submitted for an fFP on a specific project:
• Client corporate information; • The bidding process – like deadline for the definitive proposal, but also possible
scheduled sessions for asking and answering questions; • The functional requirements that have to be delivered in the system to be delivered; • The non-functional requirements that have to be satisfied, like for instance security
requirements and development language to be used; • Decision criteria that the client organisation is going to apply to select the most
appropriate proposal.
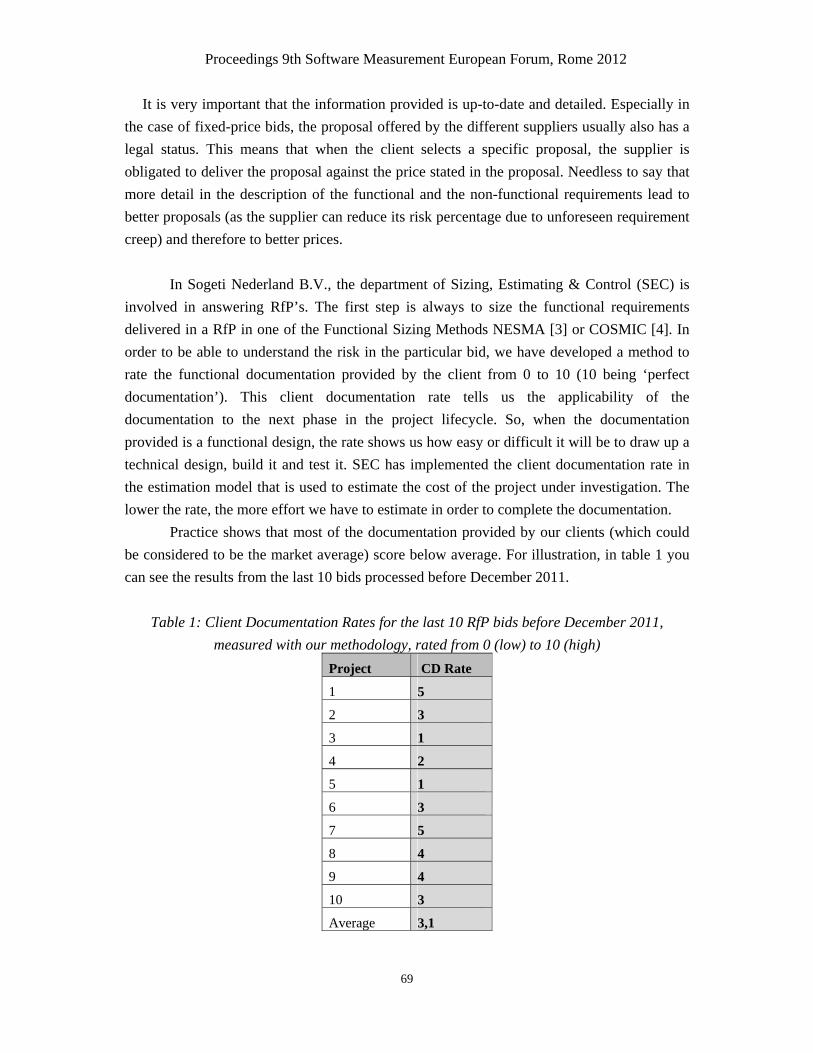
Proceedings 9th Software Measurement European Forum, Rome 2012
69
It is very important that the information provided is up-to-date and detailed. Especially in the case of fixed-price bids, the proposal offered by the different suppliers usually also has a legal status. This means that when the client selects a specific proposal, the supplier is obligated to deliver the proposal against the price stated in the proposal. Needless to say that more detail in the description of the functional and the non-functional requirements lead to better proposals (as the supplier can reduce its risk percentage due to unforeseen requirement creep) and therefore to better prices. In Sogeti Nederland B.V., the department of Sizing, Estimating & Control (SEC) is involved in answering RfP’s. The first step is always to size the functional requirements delivered in a RfP in one of the Functional Sizing Methods NESMA [3] or COSMIC [4]. In order to be able to understand the risk in the particular bid, we have developed a method to rate the functional documentation provided by the client from 0 to 10 (10 being ‘perfect documentation’). This client documentation rate tells us the applicability of the documentation to the next phase in the project lifecycle. So, when the documentation provided is a functional design, the rate shows us how easy or difficult it will be to draw up a technical design, build it and test it. SEC has implemented the client documentation rate in the estimation model that is used to estimate the cost of the project under investigation. The lower the rate, the more effort we have to estimate in order to complete the documentation. Practice shows that most of the documentation provided by our clients (which could be considered to be the market average) score below average. For illustration, in table 1 you can see the results from the last 10 bids processed before December 2011.
Table 1: Client Documentation Rates for the last 10 RfP bids before December 2011, measured with our methodology, rated from 0 (low) to 10 (high)
Project CD Rate
1 5
2 3
3 1
4 2
5 1
6 3
7 5
8 4
9 4
10 3
Average 3,1

Proceedings 9th Software Measurement European Forum, Rome 2012
70
So, although it’s absolutely crucial in outsourcing contracts to provide the potential suppliers with a complete and detailed set of requirements, the average Client Documentation Rate is only 3,1 ! Needless to say that the different suppliers to these bids are already difficult to compare, as the assumptions made by the different suppliers about the requirements that are missing or not complete are likely to differ enormously.
3. Client Issues For the party that submits the RfP it’s crucial to select the right outsourcing party, and to
do so in a legal acceptable way. Of course, the client organisation should provide general information like:
• Schedule of the bid process. Are there going to be any information sessions for suppliers to ask questions? What date is the submission deadline for the quotation? When will the decision be communicated? What date should the project start?
• Organisational information. Who are the responsible persons in the client organisation and how is the organisation organised?
• General requirements that a supplier has to meet in order to be allowed to be in the bid process. An example could be a requirement that the organisation must hold a CMMi level 3 certification.
• Solution details. Are there any limitations to the solutions that the suppliers have to take into account, like architecture or programming language?
• Decision criteria. Which are the criteria that will select the winning bid in an objective way?
When preparing an RfP, the client organisation also has to think of the criteria on which it
will judge and select the most appropriate outsourcing party. This usually means that they will have to think of the most important characteristics of the project itself and of the party that will realise it. Characteristics that are usually considered are (not limitative):
• Price; • Quality; • Productivity; • Duration; • Supplier creditability; • Supplier references; • Solution details.

Proceedings 9th Software Measurement European Forum, Rome 2012
71
To be able to compare the different supplier quotations in an objective way, the questions are usually as quantitative as possible. Typical metrics based questions that we encounter in RfP’s are:
Price • What is the price per function point that you offer for the realisation (technical design,
functional design, coding, unit testing, system testing) of this system in Java? • What is the price per function point that you offer for the realisation of change
requests during the projects? • What is the price per function point that you offer for the maintenance of the system
after implementation? Quality • What is the number of defects per function point that is expected to be detected during
systems testing? • What is the number of defects per function point that is expected to be detected during
user acceptance testing? • What is the number of defects per function point that is expected to be detected during
the first three months in production? • What is the number of defects per function point that is expected to be detected per
year after the first three months in production? Productivity • What is your productivity in the realisation (technical design, functional design,
coding, unit testing, system testing) of Java projects? These questions are impossible to answer if one is familiar with certain models from
software metrics literature models. The remainder of this paper will explain why. 4. Supplier Issues Supplier organisations compete against each other to score the highest on the client’s
decision criteria, in order to win the contract. As most of the typical questions asked in RfP’s are related to metrics expressed in function points, it’s important for supplier organisations to have an experience database with historical project data sized in NESMA or COSMIC function points. Without this database, it’s quite difficult to answer the questions above, and it’s even impossible to defend the answers given objectively.
Depending on the decision criteria that are submitted in the RfP submitted, the commercial
people of the supplier will try to ‘bend’ the bid in a way that they think suits the decision criteria best. It’s important however to understand that according to McConnell [5] there is a distinction between target, estimation and commitment.
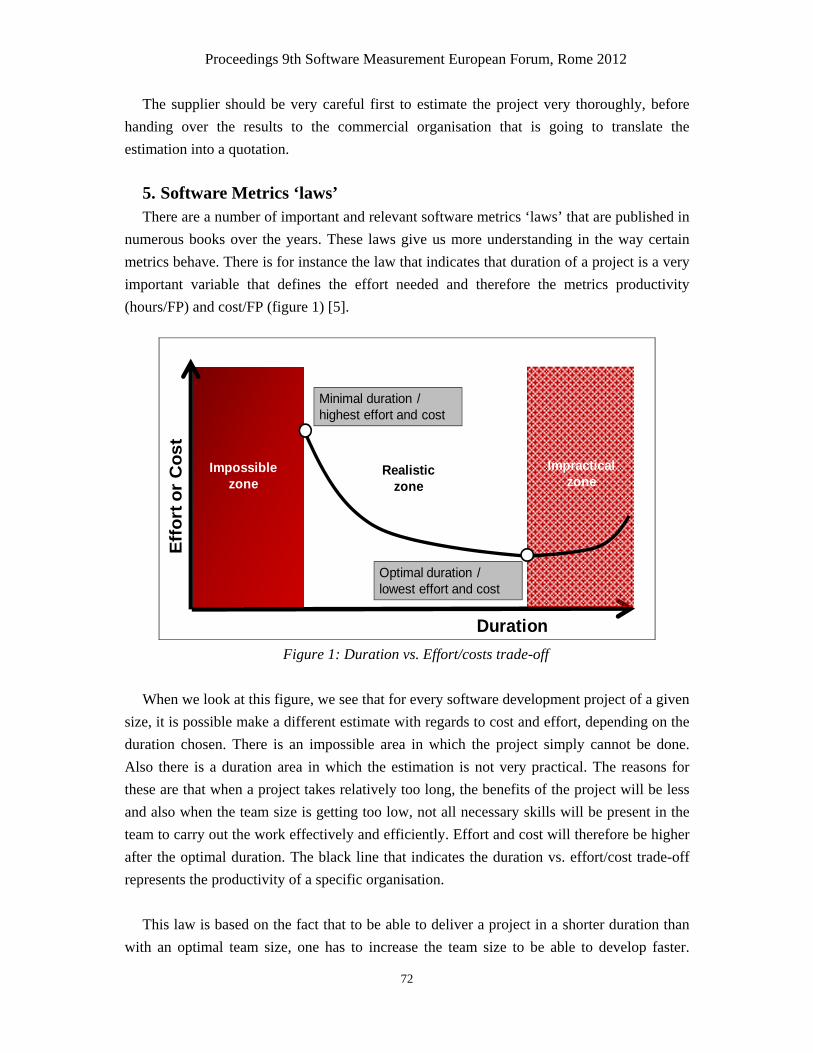
Proceedings 9th Software Measurement European Forum, Rome 2012
72
The supplier should be very careful first to estimate the project very thoroughly, before handing over the results to the commercial organisation that is going to translate the estimation into a quotation.
5. Software Metrics ‘laws’ There are a number of important and relevant software metrics ‘laws’ that are published in
numerous books over the years. These laws give us more understanding in the way certain metrics behave. There is for instance the law that indicates that duration of a project is a very important variable that defines the effort needed and therefore the metrics productivity (hours/FP) and cost/FP (figure 1) [5].
Effo
rt o
r C
ost
Duration
Impossiblezone
Impracticalzone
Minimal duration / highest effort and cost
Optimal duration / lowest effort and cost
Realisticzone
Figure 1: Duration vs. Effort/costs trade-off
When we look at this figure, we see that for every software development project of a given
size, it is possible make a different estimate with regards to cost and effort, depending on the duration chosen. There is an impossible area in which the project simply cannot be done. Also there is a duration area in which the estimation is not very practical. The reasons for these are that when a project takes relatively too long, the benefits of the project will be less and also when the team size is getting too low, not all necessary skills will be present in the team to carry out the work effectively and efficiently. Effort and cost will therefore be higher after the optimal duration. The black line that indicates the duration vs. effort/cost trade-off represents the productivity of a specific organisation.
This law is based on the fact that to be able to deliver a project in a shorter duration than
with an optimal team size, one has to increase the team size to be able to develop faster.
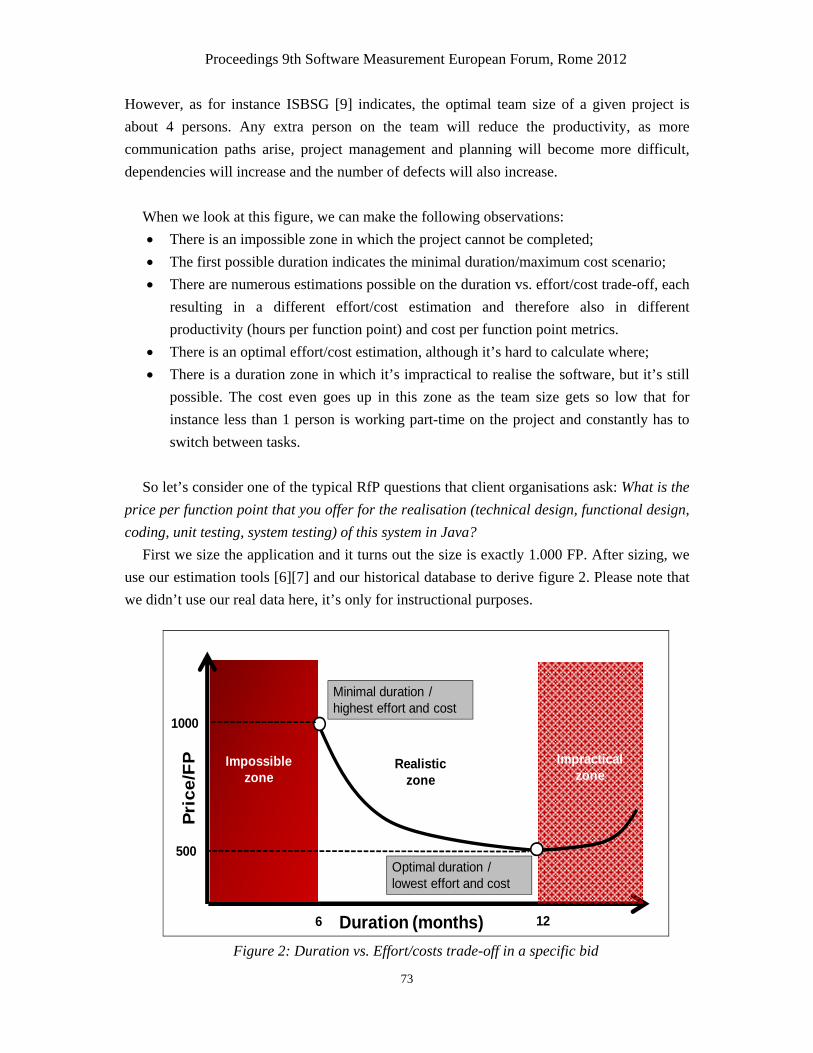
Proceedings 9th Software Measurement European Forum, Rome 2012
73
However, as for instance ISBSG [9] indicates, the optimal team size of a given project is about 4 persons. Any extra person on the team will reduce the productivity, as more communication paths arise, project management and planning will become more difficult, dependencies will increase and the number of defects will also increase.
When we look at this figure, we can make the following observations: • There is an impossible zone in which the project cannot be completed; • The first possible duration indicates the minimal duration/maximum cost scenario; • There are numerous estimations possible on the duration vs. effort/cost trade-off, each
resulting in a different effort/cost estimation and therefore also in different productivity (hours per function point) and cost per function point metrics.
• There is an optimal effort/cost estimation, although it’s hard to calculate where; • There is a duration zone in which it’s impractical to realise the software, but it’s still
possible. The cost even goes up in this zone as the team size gets so low that for instance less than 1 person is working part-time on the project and constantly has to switch between tasks.
So let’s consider one of the typical RfP questions that client organisations ask: What is the
price per function point that you offer for the realisation (technical design, functional design, coding, unit testing, system testing) of this system in Java?
First we size the application and it turns out the size is exactly 1.000 FP. After sizing, we use our estimation tools [6][7] and our historical database to derive figure 2. Please note that we didn’t use our real data here, it’s only for instructional purposes.
Pric
e/FP
Duration (months)
Impossiblezone
Impracticalzone
Minimal duration / highest effort and cost
Optimal duration / lowest effort and cost
Realisticzone
1000
500
6 12
Figure 2: Duration vs. Effort/costs trade-off in a specific bid
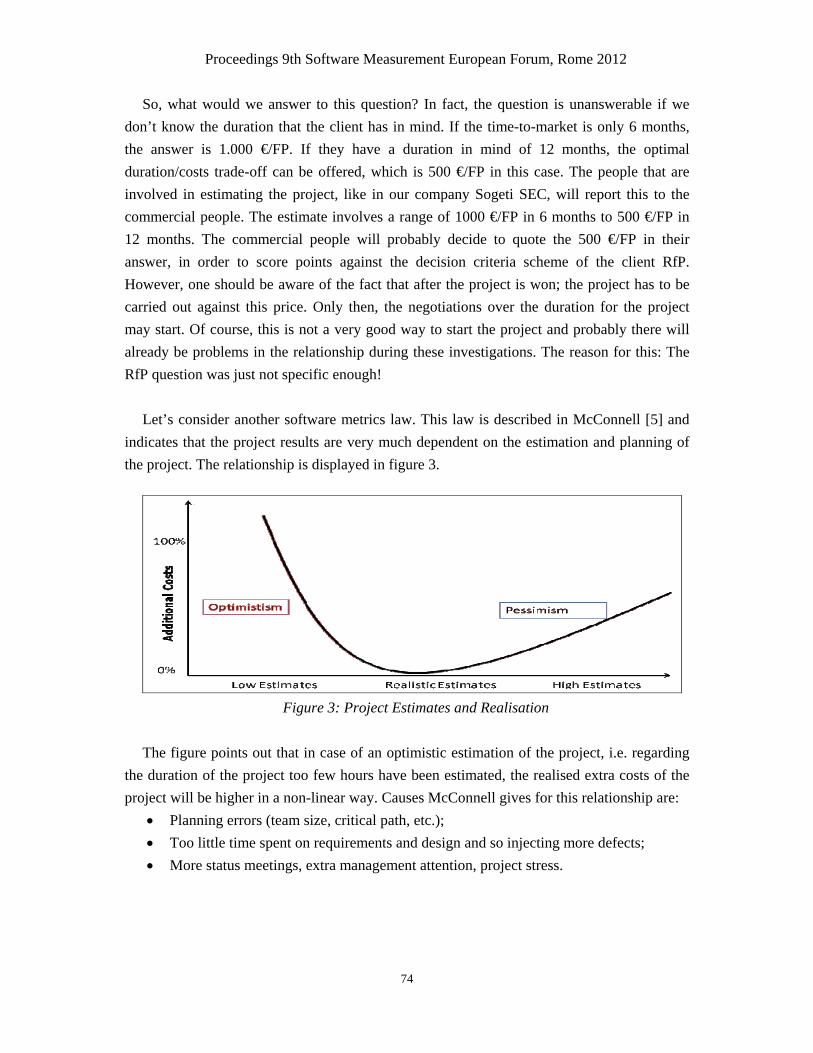
Proceedings 9th Software Measurement European Forum, Rome 2012
74
So, what would we answer to this question? In fact, the question is unanswerable if we don’t know the duration that the client has in mind. If the time-to-market is only 6 months, the answer is 1.000 €/FP. If they have a duration in mind of 12 months, the optimal duration/costs trade-off can be offered, which is 500 €/FP in this case. The people that are involved in estimating the project, like in our company Sogeti SEC, will report this to the commercial people. The estimate involves a range of 1000 €/FP in 6 months to 500 €/FP in 12 months. The commercial people will probably decide to quote the 500 €/FP in their answer, in order to score points against the decision criteria scheme of the client RfP. However, one should be aware of the fact that after the project is won; the project has to be carried out against this price. Only then, the negotiations over the duration for the project may start. Of course, this is not a very good way to start the project and probably there will already be problems in the relationship during these investigations. The reason for this: The RfP question was just not specific enough!
Let’s consider another software metrics law. This law is described in McConnell [5] and
indicates that the project results are very much dependent on the estimation and planning of the project. The relationship is displayed in figure 3.
Figure 3: Project Estimates and Realisation
The figure points out that in case of an optimistic estimation of the project, i.e. regarding
the duration of the project too few hours have been estimated, the realised extra costs of the project will be higher in a non-linear way. Causes McConnell gives for this relationship are:
• Planning errors (team size, critical path, etc.); • Too little time spent on requirements and design and so injecting more defects; • More status meetings, extra management attention, project stress.
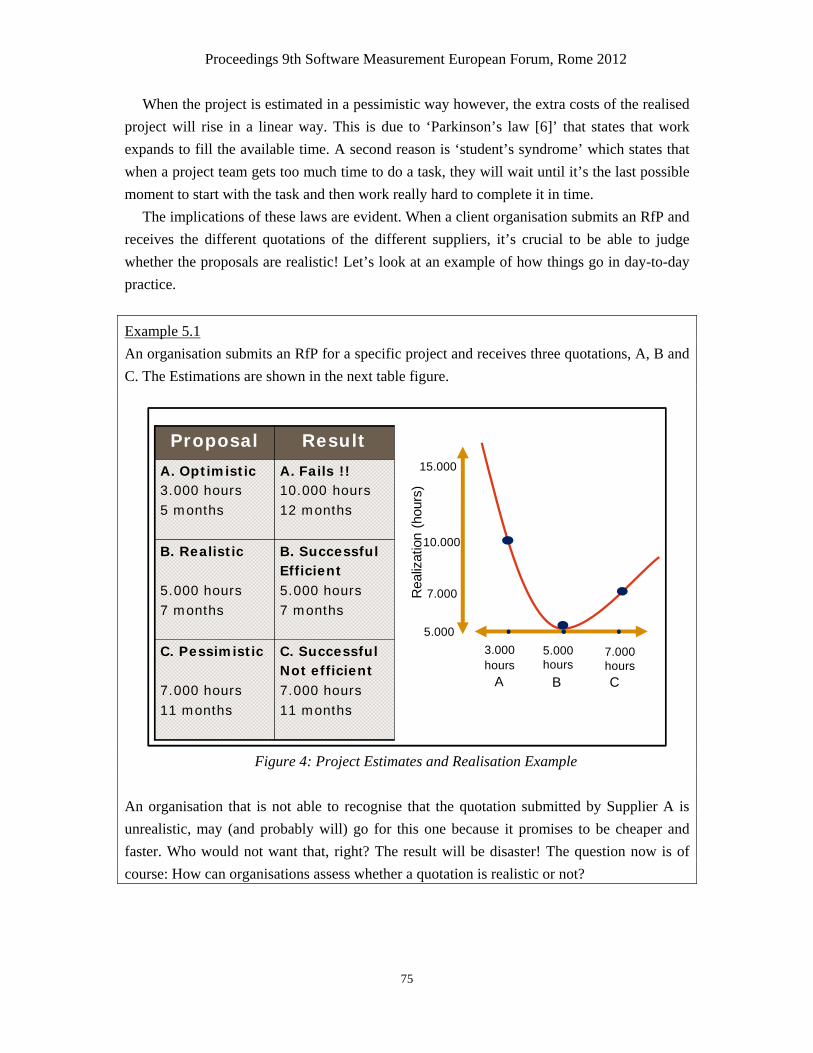
Proceedings 9th Software Measurement European Forum, Rome 2012
75
When the project is estimated in a pessimistic way however, the extra costs of the realised project will rise in a linear way. This is due to ‘Parkinson’s law [6]’ that states that work expands to fill the available time. A second reason is ‘student’s syndrome’ which states that when a project team gets too much time to do a task, they will wait until it’s the last possible moment to start with the task and then work really hard to complete it in time.
The implications of these laws are evident. When a client organisation submits an RfP and receives the different quotations of the different suppliers, it’s crucial to be able to judge whether the proposals are realistic! Let’s look at an example of how things go in day-to-day practice.
Example 5.1 An organisation submits an RfP for a specific project and receives three quotations, A, B and C. The Estimations are shown in the next table figure.
A
Rea
lizat
ion
(hou
rs)
5.000
15.000
CB
10.000
5.000 hours
3.000hours
7.000 hours
7.000
EstimationProposal Result
A. Optimistic3.000 hours5 months
A. Fails !!10.000 hours12 months
B. Realistic
5.000 hours7 months
B. SuccessfulEfficient5.000 hours7 months
C. Pessimistic
7.000 hours11 months
C. SuccessfulNot efficient7.000 hours11 months
Figure 4: Project Estimates and Realisation Example
An organisation that is not able to recognise that the quotation submitted by Supplier A is unrealistic, may (and probably will) go for this one because it promises to be cheaper and faster. Who would not want that, right? The result will be disaster! The question now is of course: How can organisations assess whether a quotation is realistic or not?

Proceedings 9th Software Measurement European Forum, Rome 2012
76
6. Assessing Proposals There are multiple ways to assess the reality of a proposal. In this chapter we focus on
three possible ways: using the QSM SLIM tool suite [8], the ISBSG data portal [9] and Galorath SEER-SEM tooling [12].
When an organisation possesses the QSM SLIM tool suite, it’s possible to simulate the
estimations in SLIM Estimate. This results in a Productivity Index (PI) that is implied in the quotation. The productivity index in QSM shows the productivity which is corrected with the duration. The black line in figure 2 could for instance indicate the PI=18,0 line. Although the number of hours per function point is different on every point on this line, the PI could easily be the same. When the PI that is implied in the Estimate is known, it’s possible to assess the reality of the quotation. In QSM it’s possible to compare the PI of an Estimate with the average PI for similar projects that are present in the QSM database (over 8.000 projects) or with the PI of the projects that are stored in the organisation history project history base. When an implied PI is much higher than the average PI for similar projects in the QSM database, the estimate is probably not very realistic and too optimistic. In that case, the organisation should ask the supplier to present proof that they are able to produce software with a productivity that is that high.
A second way to assess the proposal is to use the ISBSG data portal [9]. This assessment
works basically the same, but the main metric that can be compared here is hours per function point. When this metric is used standalone, we have already seen in paragraph 5 that the usefulness is very low. However, when also the actual duration and size (and quality) of the project are taken into account when selecting the projects against which the supplier quotations are compared, the usefulness will be much higher. ISBSG also offers a specific tool called the ISBSG Reality Checker [11]. Although input options are at the moment quite restricted (size, platform, language type), ISBSG is in the process of updating the tool to accept more input criteria. The reality check will find the ranges of effort spent and project duration elapsed in which the project estimations much fall to be assessed realistic.
A third way is to use the Galorath SEER-SEM [12] tool to estimate the project. The good
thing about this tool is that it allows you to use predefined knowledge bases from history data collected by Galorath. Also it’s possible to easy divide the system to be built in components, for instance a client and a server part. The Galorath SEER-SEM tool allows you to calculate an optimal effort scenario and a minimum time scenario. Especially the minimum time scenario is useful for assessing the reality value of a proposal.

Proceedings 9th Software Measurement European Forum, Rome 2012
77
7. Proposals for more effective RfP Management Now that we have seen some problems that supplier organisations face when trying to
answer an RfP, and the implications this has on the ability of client organisations to choose the right partner, let’s see which recommendations we can draw up. First let’s repeat the type of questions that are often asked:
“What is your productivity rate for Java projects?” The main recommendation is very evident. Make the question as specific as possible. A
better question would already be: ‘What is your productivity rate (hours/FP) for a moderately complex Java project of 500
function points and a duration of 20 weeks? However, this question still lacks a lot of context. It’s not clear which activities should be
included for instance. Will the supplier be in charge of the full lifecycle, or perhaps only technical design, coding and testing? It’s crucial to supply this information!
A much better question would therefore be: ‘What is your productivity rate (hours/FP) for a moderately complex Java project of 500
function points and a duration of 20 weeks? Phases to include are technical design, coding, unit testing, systems testing and support of the user organisation during the user acceptance test.’
This last question is easily answerable for suppliers that have a history base with
experience project data. For the client it’s then quite easy to compare the different supplier quotations and also to assess their reality to market averages or history data.
To conclude, good RfP questions contain the following information: • Metric to compare between competitors, for instance:
o Productivity (hours/FP, Function points/hour, PI); o Costs (Cost/FP).
• Quality (defects per function point, Mean-time-to-defect (MTTD)); • Technology (for instance Java, Oracle or MS.NET); • Size (in Function Points or COSMIC function points); • Technical/ Functional Complexity (for instance high/mediate/low); • Phases/Activities to include (for instance Technical Design, Coding, Unit testing,
systems testing); • Duration requested (days, weeks, months, years).

Proceedings 9th Software Measurement European Forum, Rome 2012
78
It may therefore be recommendable to ask the questions in the format of (small) case studies.
8. Assessment Example Let’s consider an RfP that is send out by Organisation X, containing the following RfP
question: ‘What is your productivity rate (hours/FP) for a moderately complex Java project of 500
function points and a duration of 30 weeks? Phases to include are technical design, coding, unit testing, systems testing and support of the user organisation during the user acceptance test.’
Organisation X receives three different proposals, displayed in table 2.
Table 2: RfP Proposals Proposal Size
(FP) Effort (hours)
Duration (months)
Productivity (hour/FP)
1 500 2.275 6,8 4,5
2 500 3.550 6,8 7,1
3 500 8.600 6,8 17,2
8.1. Assessment using QSM tooling Now, let’s see what happens if we simulate the three proposals in QSM SLIM (figure 5).
Figure 5: Simulation in QSM SLIM – PI calculation
QSM calculates the Productivity Index (PI) enclosed in the estimations. Now we can
compare the PI with for instance the PI that is reported by QSM based on their 2008 Dataset of Business Projects measured in function points. This analysis can be made in QSM SLIM Metrics.
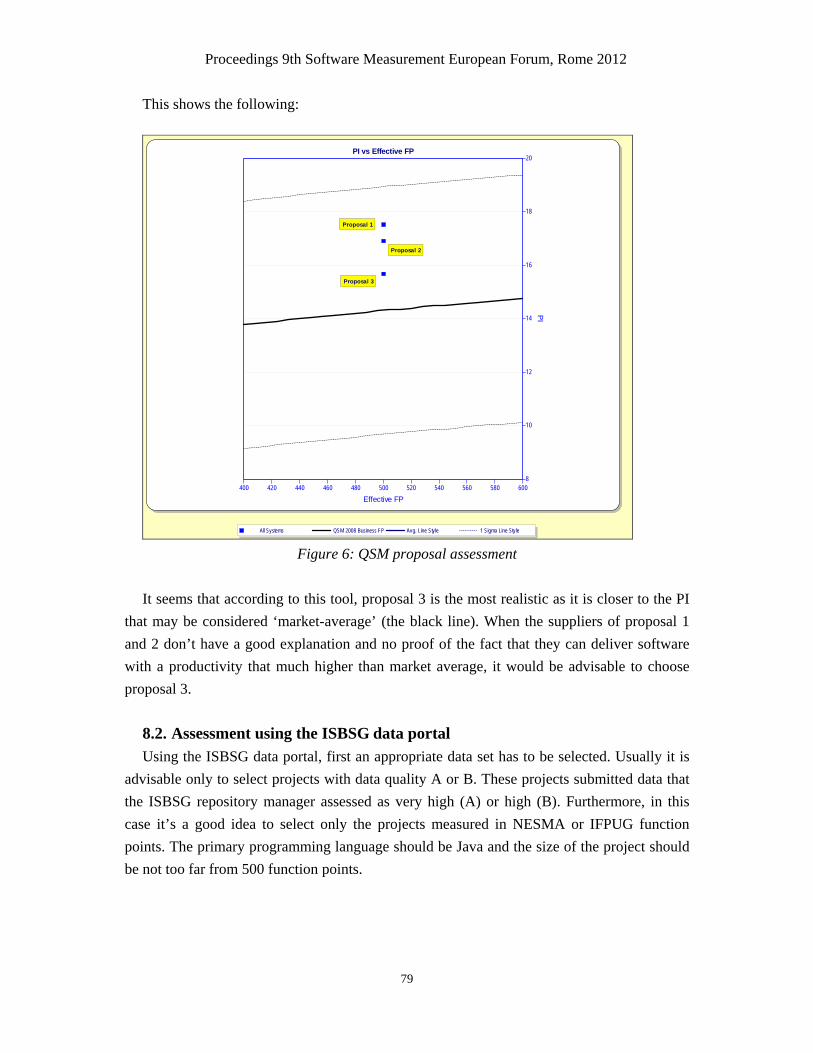
Proceedings 9th Software Measurement European Forum, Rome 2012
79
This shows the following:
PI vs Effective FP
400 420 440 460 480 500 520 540 560 580 600Effective FP
8
10
12
14
16
18
20
PI
Proposal 1
Proposal 2
Proposal 3
Proposal 1
Proposal 2
Proposal 3
All Systems QSM 2008 Business FP Avg. Line Style 1 Sigma Line Style Figure 6: QSM proposal assessment
It seems that according to this tool, proposal 3 is the most realistic as it is closer to the PI
that may be considered ‘market-average’ (the black line). When the suppliers of proposal 1 and 2 don’t have a good explanation and no proof of the fact that they can deliver software with a productivity that much higher than market average, it would be advisable to choose proposal 3.
8.2. Assessment using the ISBSG data portal Using the ISBSG data portal, first an appropriate data set has to be selected. Usually it is
advisable only to select projects with data quality A or B. These projects submitted data that the ISBSG repository manager assessed as very high (A) or high (B). Furthermore, in this case it’s a good idea to select only the projects measured in NESMA or IFPUG function points. The primary programming language should be Java and the size of the project should be not too far from 500 function points.

Proceedings 9th Software Measurement European Forum, Rome 2012
80
The result of this search gives the following information:
Table 3: ISBSG assessment Metric Average Standard
Deviation Median Average -
2 St.Dev. Average - 1 St.Dev.
PDR (hours/FP) 12,2 2,3 9,1 7,6 9,9
Duration (months) 8,1 1,3 7,3 6,8 5,5
The assessment of the PDR (hours/FP) is made visual in the next figure:
Figure 7: ISBSG proposal assessment
According to this data, proposals 1 and 2 seem to be too optimistic as well, as they both are under the different lines. They are both even under the average minus two standard deviation lines. They both promise to deliver the functionality faster and cheaper than the selected projects in the ISBSG dataset, even though the ISBSG data is considered to be best-in-class data and probably represent the best performed projects in the industry.
8.3. Assessment using SEER-SEM tooling There are many parameters that can be set in the SEER-SEM tooling. The good thing is
that many of these parameters are preset when the appropriate knowledge bases are selected. The knowledge bases contain the parameter settings that have been found to be consistent in particular type of projects. After selecting the knowledge bases, only the size has to be entered to come up with a rough estimate. After that, the parameter settings can be altered by even more accurate settings and scenario analysis can start. The more is known about a project, the better the parameters can be set.
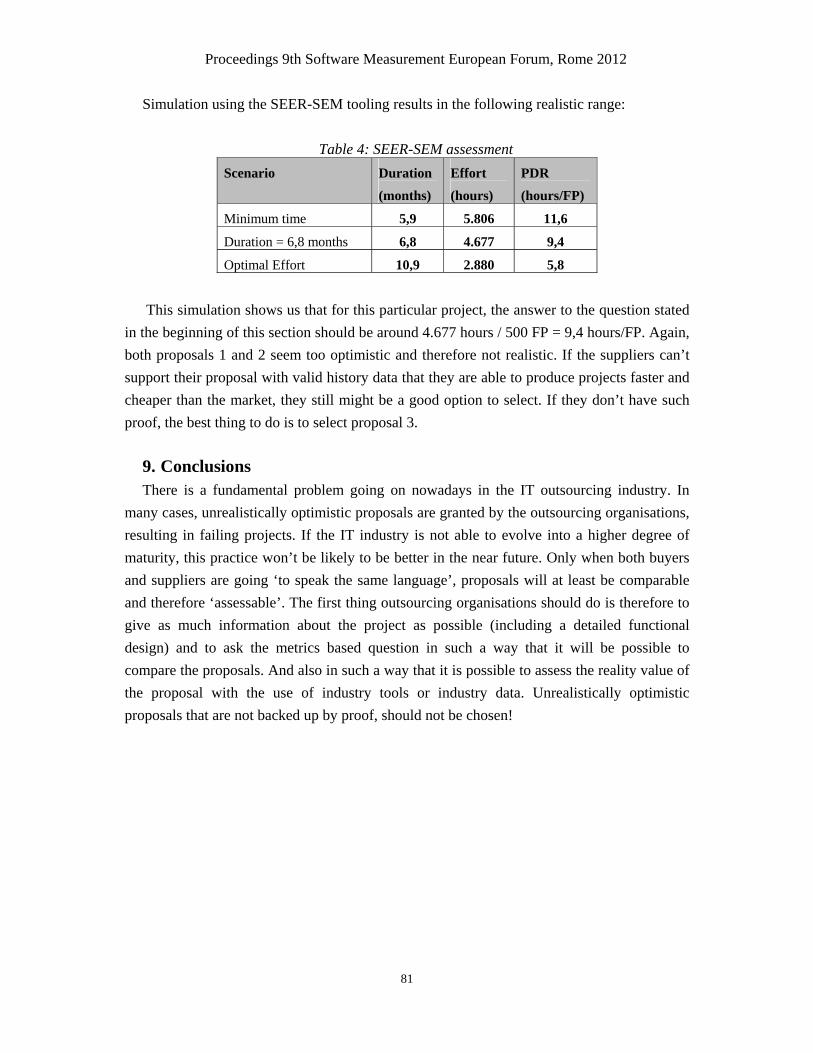
Proceedings 9th Software Measurement European Forum, Rome 2012
81
Simulation using the SEER-SEM tooling results in the following realistic range:
Table 4: SEER-SEM assessment Scenario Duration
(months) Effort (hours)
PDR (hours/FP)
Minimum time 5,9 5.806 11,6
Duration = 6,8 months 6,8 4.677 9,4
Optimal Effort 10,9 2.880 5,8
This simulation shows us that for this particular project, the answer to the question stated
in the beginning of this section should be around 4.677 hours / 500 FP = 9,4 hours/FP. Again, both proposals 1 and 2 seem too optimistic and therefore not realistic. If the suppliers can’t support their proposal with valid history data that they are able to produce projects faster and cheaper than the market, they still might be a good option to select. If they don’t have such proof, the best thing to do is to select proposal 3.
9. Conclusions There is a fundamental problem going on nowadays in the IT outsourcing industry. In
many cases, unrealistically optimistic proposals are granted by the outsourcing organisations, resulting in failing projects. If the IT industry is not able to evolve into a higher degree of maturity, this practice won’t be likely to be better in the near future. Only when both buyers and suppliers are going ‘to speak the same language’, proposals will at least be comparable and therefore ‘assessable’. The first thing outsourcing organisations should do is therefore to give as much information about the project as possible (including a detailed functional design) and to ask the metrics based question in such a way that it will be possible to compare the proposals. And also in such a way that it is possible to assess the reality value of the proposal with the use of industry tools or industry data. Unrealistically optimistic proposals that are not backed up by proof, should not be chosen!

Proceedings 9th Software Measurement European Forum, Rome 2012
82
10. References [1] Van Heeringen, H.S., “Request For Proposal Management - Ask the right questions and choose
wisely!” Proceedings of the Software Measurement European Forum (SMEF), June 2010, Rome (Italy)
[2] Wikipedia, http://en.wikipedia.org/wiki/Request_for_proposal [3] NESMA, “Definitions and counting guidelines for the application of function point analysis A
practical manual, version 2.2”, Netherlands Software Measurement user Association, 2004 (in Dutch), http://www.nesma.org.
[4] Abran, A., Symons, C. e.a., “The COSMIC Functional Size Measurement Method Version 3.0, Measurement Manual - (The COSMIC Implementation Guide for ISO/IEC 19761: 2003)”, September 2007, http://www.cosmicon.com
[5] McConnell, S., “Software Estimation – Demystifying the black art”, Microsoft, 2006 [6] Parkinson’s Law: http://en.wikipedia.org/wiki/Parkinson's_law [7] Putnam, L.H., Myers, W. “Five core metrics: Intelligence behind successful software management”,
Dorset Publishing house, 2003 [8] Van Heeringen, H.S., “Speeding up the Estimation process with the Estimation Wizard”, Proceedings
of the International Workshop on Software Measurement (IWSM) – MENSURA conference, November 5-8 2007, Palma de Mallorca (Spain), http://mensura2007.uib.es/.
[9] Quantitative Software Management (QSM) Software Lifecycle Management Toolsuite (SLIM), http://www.qsm.com.
[10] International Software Benchmarking Standards Group (ISBSG) Data portal: http://portal.isbsg.org [11] International Software Benchmarking Standards Group (ISBSG) Reality Checker,
http://www.isbsg.org [12] Galorath SEER-SEM, http://www.galorath.com

Proceedings 9th Software Measurement European Forum, Rome 2012
83
Software Contract Management by metrics: a methodological framework
Roberto Meli
This presentation has been based on the following reference [1] R.Meli et al, IFPUG, The IFPUG Guide to IT and Software Measurement, 2012, Auerbach
Publications, Chapter 29

Proceedings 9th Software Measurement European Forum, Rome 2012
84
Intentional Left blank
Proceedings 9th Software Measurement European Forum, Rome 2012
85
How to state a fair unitary price for FP in a tender context
Roberto Meli
Abstract There are two main paths to state the base unitary price per FP in a Request for Proposal
or a Public Tender. The first one is to rely on previous similar assigned contracts and their unitary prices adopting averages or min-max values (market approach). The second one is to build a specific unitary price considering expected average productivity, adjustment factors, resources mix, unitary human resource costs, life cycle phases and distribution of effort and roles and gross profit needed (constructive approach). The same approaches may be used by the supplier in the offering phase. The second approach is generally more adequate since it allows to purify the process from the usual bias due to the attitude of being “conformist” by vocation. Unfortunately both methods may fail when the offering phase is affected by the expectation of absence of control in contract execution. In this case the market prices continuously go down without any apparent lower limit because of the “price to win” strategy. This paper will present these aspects giving a detailed proposal for the constructive approach but also an overview of the market approach with unitary prices in different countries.
1. Context description 1.1. Software as a market good For some time now, software has taken on the appearance of a market good, and has been
the subject of important economic transactions on par with other, more traditional products (i.e. hardware). The age of software developed entirely in house has certainly passed, and all organisations are making more or less extensive use of the software suppliers market. This means that the mechanism for forming the price of software is influenced by the empirical laws of supply and demand.
The software supply has two main scenarios: one of the off-the-shelf packages, and one of development to order. Only to the first case the aforementioned economic laws of offer and demand can be appropriately applied, in line with the features of a competitive market. For an individual supply of software to be developed to order, instead of referring to quantities of a good in demand and offered, we may speak of willingness to purchase or sell that particular unique good under given conditions.
Throughout the rest of the paper, we will focus the attention on the supply of ad-hoc software, i.e. software built “on demand”. Other and well known practices support the supply of packages as “off the shelf” products.

Proceedings 9th Software Measurement European Forum, Rome 2012
86
One of the main reasons why organisations are interested in software measurements is the need of estimating and controlling the effort, duration, staff and cost of a software new development or maintenance project. Measurements are also indispensable for any successful process improvement program but the typical actual organisation (public or private) is still less sensible to methodological or internal issues than to contractual and external ones. In the following figure, we may see a simplified model of a market transaction regarding a software supply.
In this customer-supplier relationship model some requirements and constraints are
“transferred” from the customer to the supplier who tries to transform them in a preliminary logical/technical design. The supplier, then, tries to estimate the production costs and produces a requested selling price (Cost to the customer), a deadline (Time) together with a Quantification and Qualification of the offered solution. A formal/informal negotiation, then, takes place, on the main contractual aspects, usually time, cost, quantity & quality (TCQ2), till the final agreement is (eventually) reached and a contract is drawn. After that, the supply will enter its operational life and a control process will continuously verify that the initial assumptions are fulfilled. In the meanwhile, a Change Request process is put in place to deal with the unavoidable requirements turbulence found in modern environments. A new formal or informal transaction cycle will then be eventually started to lead to a new negotiated agreement. This scheme, apparently tailored on a “waterfall” process model, can be applied, with some variances, to an incremental or evolutionary process model as well.
In the negotiation phase the customer is not particularly interested in the development process characterisation on which s/he has not a complete access (even if in an ISO 9001:2008 certificated quality framework this is not completely true).
Customer Supplier
Requirements
Solution (TCQ2)
Negotiation
Contract
Market Transactions
Market Transactions
External Productivity
InternalProductivity
InternalProductivity
Constraints
RequirementsConstraints
QuantityQualityEffortTimeStaff
Unitary staff costDiscountTotal cost
Proceedings 9th Software Measurement European Forum, Rome 2012
87
Therefore s/he will tend to compare the economical indicators of the supplier proposal(s) to the market and internal averages ratios regarding productivity and unitary prices for a given TQ2. We should keep in mind that the customer is not really interested in receiving a specific quantity of software (whatever it is defined) but in the resolution of his/her business problems and, eventually, in the acquisition of the logical software features that are promised to be resolutive of those problems. For this reasons s/he will be interested in the measurement of the logical features more than of the technical aspects of the system. Logical features are much more related to user needs and so to user value than technical features. The customer will tend to compare suppliers in term of capability in releasing logical functionalities irrespective of technical issues (unless they represent constraints). In the same negotiation phase the supplier will be influenced by two indicators, instead: the external average productivity ratio and unitary prices – for competitive reasons – and the internal specific production unitary cost in realising the system required. The knowledge of both them is important to be a successful supplier on the market. The first measure of productivity is (should be) the same used by its customer, in order to converge rapidly, the second one is totally internal and is related to the supplier specific production environment.
Both the customer and the supplier are then interested into external benchmarking data to
conduct a successful negotiation. These are usually supplied by independent consultants, associations like ISBSG (International Software Benchmarking Standards Group) or public authorities.
1.2. The development of the “equity” perception in a market transaction A commercial negotiation regarding a software supply will end up when the two parties
(and eventually the external regulators) will have developed a satisfactory perception of equity. Not an objective, absolute situation of equity but a perceived one. This means that subjectivity is unavoidable (what is extremely valuable here and now for someone could be of no value there, later and for someone else). The consequent economical consistency validation must not be absolute, related to immutable standards but situational, related to the specific circumstances.
Equity demonstration is important in any commercial transaction. Unfortunately, experiences of the last years show that if the consistency validation of software supplies is not conducted on a sufficiently articulated basis (i.e. only looking at the market average Function Points unitary cost), there is the strong risk to face situations where “the formal papers are OK” but actually the expense is much higher than it could be or much less than it should be (an insufficient budget is often a good way to abandon a project before the end). An adequate economical consistency model should take into account many other variables in addition to functional size!

Proceedings 9th Software Measurement European Forum, Rome 2012
88
It is worthwhile to highlight another problem, in the negotiation process, which is quite frequent when the organisational stakeholders legitimated to represent their interests in the project are numerous either in the customer side and in the supplier side. It happens when any two of the stakeholders negotiate on a different table different agreement on the variables they are allowed to deal with but nobody is in charge of integrating all the separate negotiations in a feasibility model. It is not possible, for example, to agree on a duration reduction for a project, without impacting with the cost, the quality, the priority of requirements or the risk of the project itself. If you do it you are probably bringing the project in an unfeasibility zone. A typical separation between the “commercial” stakeholder component and the “technical” component is, practically, a rule in the ICT market in many countries.
1.3. A market transaction driven by a tender A tender process changes a little bit the framework presented till now. In a tender the
customer has to prepare administrative and technical documents in order to describe as much accurately as possible the requirements of the supply and then it sets up a total and/or unitary starting price for the supply and asks competitors to offer a “discount” over the proposed price. The only difference from the previous framework is that there is a starting price which represents a “roof” for the competitors: no one can offer a higher price to bid. If the roof is tall enough the competitors may express their discounts in a “feasibility” zone. If the roof is too low than all the competitors are forced to offer discounts in an unfeasible zone or to abandon the tender.
It is quite often said that the tender process is capable of giving the “automatic situational equity” needed to manage the public affairs. Unfortunately this is often an illusion for some reasons:
1. when the number of different suppliers capable (or allowed) to answer to a tender is low (i.e. less than 5-6), it is difficult to consider the transaction as a real “competitive” one; “hidden agreements”, “compensation agreements” and the like are common issues; in this case the price will surely be overestimated (supplier’s predominance);
2. when the market is dominated, on the other side, by an offer exceeding the demand, then the price will be underestimated and it will be difficult, for a supplier (engaged in a surviving battle) to respect the agreement (demand’s predominance).
3. when the requirements specifications are too ambiguous or synthetic, then different suppliers might understand different things and their proposals will be barely comparable in the substance although formally equivalent. The risk here is to assign the contract to the supplier that has the minimum understanding of the requirements and hence the minimum proposed cost.
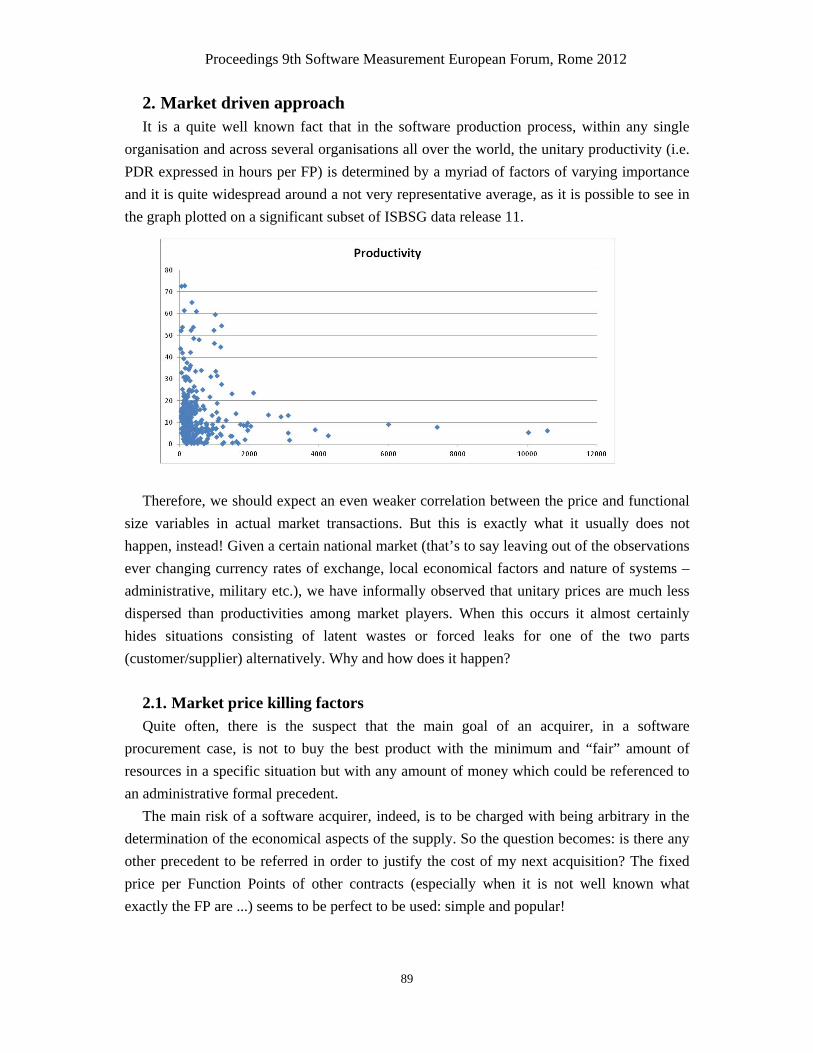
Proceedings 9th Software Measurement European Forum, Rome 2012
89
2. Market driven approach It is a quite well known fact that in the software production process, within any single
organisation and across several organisations all over the world, the unitary productivity (i.e. PDR expressed in hours per FP) is determined by a myriad of factors of varying importance and it is quite widespread around a not very representative average, as it is possible to see in the graph plotted on a significant subset of ISBSG data release 11.
Therefore, we should expect an even weaker correlation between the price and functional
size variables in actual market transactions. But this is exactly what it usually does not happen, instead! Given a certain national market (that’s to say leaving out of the observations ever changing currency rates of exchange, local economical factors and nature of systems – administrative, military etc.), we have informally observed that unitary prices are much less dispersed than productivities among market players. When this occurs it almost certainly hides situations consisting of latent wastes or forced leaks for one of the two parts (customer/supplier) alternatively. Why and how does it happen?
2.1. Market price killing factors Quite often, there is the suspect that the main goal of an acquirer, in a software
procurement case, is not to buy the best product with the minimum and “fair” amount of resources in a specific situation but with any amount of money which could be referenced to an administrative formal precedent.
The main risk of a software acquirer, indeed, is to be charged with being arbitrary in the determination of the economical aspects of the supply. So the question becomes: is there any other precedent to be referred in order to justify the cost of my next acquisition? The fixed price per Function Points of other contracts (especially when it is not well known what exactly the FP are ...) seems to be perfect to be used: simple and popular!

Proceedings 9th Software Measurement European Forum, Rome 2012
90
Unfortunately the situation is like acquiring a real estate using an average fixed price per square meters without any consideration about where it is located, how easy it has been to build it up, what finishing touches it has and so on.
An analogous problem arises for the supplier that asks himself/herself: “at which price did we or our competitors win the last contract? OK we must use it in the next one!”
It is well known that a software project is like a gas: it takes the whole space that you give
to it. If you “over budget” a project it will be very difficult to recognise that some resources should be given back. This is why a project that has been overpaid will never show the exceeding part, giving the estimated supply for the agreed price and over-biasing the benchmarking database for future uses. On the other side, an under budgeted project will save resources in realising less quality or quantity of product, if possible, still concluding the contract using the agreed resources.
The “market driven approach”, then, is exposed to the risk of being “conformist” by
vocation: it tends to align the future to the past. If even the next contract is assigned at the same price conditions of those that have been used to assess the economical consistency of the price than the benchmarking database is increased by another “actual point” completely aligned to the average and the average will confirm itself more and more without any regard to the “right” costs that should have to be paid in the new specific situation! This is particularly true when an external market authority is called to assess the equity of a transaction. This phenomenon is sometimes called a self fulfilling prophecy. Unitary market prices should be determined contextually and situation ally but very often they are considered absolute and independent values. Therefore, it does not appear to be a good idea to adopt an average market unitary price in order to estimate or evaluate any specific project. The average market unitary price may be useful in a broad agreement where many different types of projects will be activated and the specific price could be determined adjusting the average unitary price with some situational factors.
The solution for all these problems is then to substitute a formal, abstract, economical
validation process based on a single constant (the average market price) with a specific, situational, articulated and flexible process based on a sufficiently large number of variables even if this might add some more “subjectivity” of judgment. This requires time and competencies by the parties involved in the negotiation but, unfortunately there are no valid shortcuts if we want to operate according to legality and business constraints.
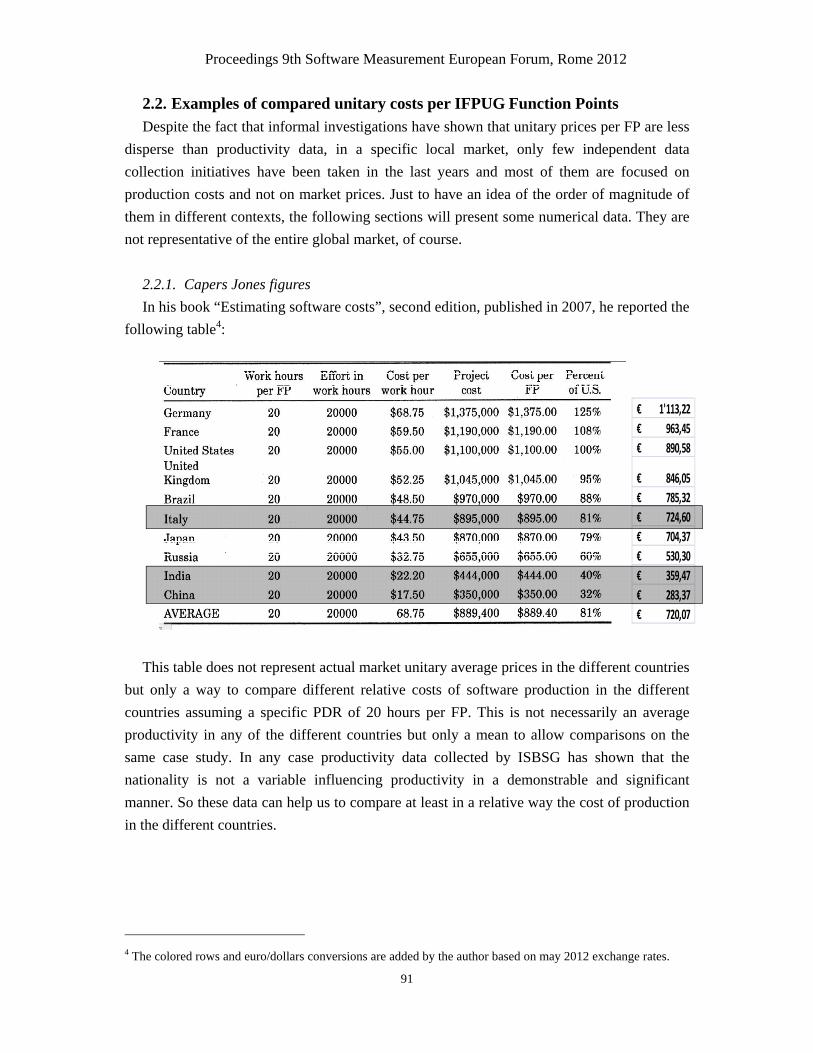
Proceedings 9th Software Measurement European Forum, Rome 2012
91
2.2. Examples of compared unitary costs per IFPUG Function Points Despite the fact that informal investigations have shown that unitary prices per FP are less
disperse than productivity data, in a specific local market, only few independent data collection initiatives have been taken in the last years and most of them are focused on production costs and not on market prices. Just to have an idea of the order of magnitude of them in different contexts, the following sections will present some numerical data. They are not representative of the entire global market, of course.
2.2.1. Capers Jones figures In his book “Estimating software costs”, second edition, published in 2007, he reported the
following table4:
1'113,22€ 963,45€ 890,58€
846,05€ 785,32€ 724,60€ 704,37€ 530,30€ 359,47€ 283,37€ 720,07€
This table does not represent actual market unitary average prices in the different countries
but only a way to compare different relative costs of software production in the different countries assuming a specific PDR of 20 hours per FP. This is not necessarily an average productivity in any of the different countries but only a mean to allow comparisons on the same case study. In any case productivity data collected by ISBSG has shown that the nationality is not a variable influencing productivity in a demonstrable and significant manner. So these data can help us to compare at least in a relative way the cost of production in the different countries.
4 The colored rows and euro/dollars conversions are added by the author based on may 2012 exchange rates.

Proceedings 9th Software Measurement European Forum, Rome 2012
92
2.2.2. ISBSG figures In a special report called “Software Project Costs” ISBSG published some data extracted
from its benchmarking data base release 8 (issued in 2003) focusing on 56 projects developed in USA in the years before 2003. The sample was quite representative of the different variables collected. The results are shown in the following figure.
In this report it is not explicitly stated if the values represent production costs or market
exchange prices but from the information around them it is definitely clear that the first option is true. Curiously these data (coming from a different source than the previous one) show an average PDR of around 9 hours/FP which is more than double of the 20 hours/FP previously used and so also the production unitary cost is less than the half of the previous one if we consider the USA market. So to derive a USA market unitary price we should add a commercial gross profit that we may consider around 25% in such a way that we achieve a median selling price of 772,00€/FP.
Joining the two tables we may derivate a market “theoretical” unitary price for every other
country based on the relative positioning with respect to USA. For example the Italian market “theoretical” unitary price should be 81% of 772,00€/FP which means 625,32€/FP.

Proceedings 9th Software Measurement European Forum, Rome 2012
93
2.2.3. Informally collected data In an informal survey conducted over 30 public tenders executed in Italy from 2004 to
2011 an average starting price of 224,36€ was calculated. Considering a typical discount around 30% to win the competition this means a transaction unitary price of 157,05€/FP. This rough datum is definitely very far from the market “theoretical” unitary price calculated before (around ¼ of it).
This may be due to the reasons explained before but also, to a certain extent, to the
productivity improvements of the software processes in the last 10 years. 3. Constructive approach As we have written before the second approach to calculate a fair starting price for a
tender or an offer is to build, case by case, a specific unitary price considering expected average productivity, adjustment factors, resources mix, unitary human resource costs, life cycle phases and distribution of effort and roles (constructive approach). We will now describe this option.
3.1. Proposed method of valorisation The figure below illustrates the proposed method for the valorisation of Unitary FP prices.

Proceedings 9th Software Measurement European Forum, Rome 2012
94
3.2. Applicable Software Life Cycle 3.2.1. Process Phases
3.2.2. Process Phases and effort distribution over different Roles
6% 85% 9% 0% 100%6% 4% 70% 20% 100%6% 50% 30% 14% 100%6% 0% 29% 65% 100%6% 19% 25% 50% 100%
Functional Analysis
Test
Test planningRealization
Design
Macro attività
Pro
ject
Man
ager
An
aly
st
Desi
gn
er
Pro
gra
mm
er
Tota
l
Phases and Roles
3.2.3. Role Unitary Prices
1,4 35% 216
Gross Company cost Mark-up €/pdProject Manager 34'755,00€ 48'657,00€ 65'686,95€ 304,11€ € 304,11 100% € 304,11
Analyst 30'781,00€ 43'093,40€ 58'176,09€ 269,33€ € 269,33 100% € 269,33
Designer 25'000,00€ 35'000,00€ 47'250,00€ 218,75€ € 218,75 100% € 218,75
Programmer 23'174,00€ 32'443,60€ 43'798,86€ 202,77€ € 202,77 100% € 202,77
Altro € 0,00 100% € 0,00
Roles unitary costs and prices
Interni
The analysis on the left of the prospectus is relative to gross salaries data published by Assintel (www.assintel.it) in 2010 relating a survey of 19,000 employees belonging to 240 IT Italian companies surveyed in the period from September to October 2009. To pass from the gross salary to the cost company we have used a coefficient of +40% and to derive the annual selling price a 35% mark-up.

Proceedings 9th Software Measurement European Forum, Rome 2012
95
The annual price was then divided by 216 working days average (excluding, then vacation, public holidays and other non-productive time).
3.2.4. Productivity model determination
For the calculation of the benchmark value of the PDR for the realisation of software, the ISBSG Release 11 data base was used. The coefficients applied to the equation are the result of the analysis done by filtering the data with the following parameters:
• Sizing method = IFPUG from 4.1 to 4.2 OR NESMA • Project data quality = A or B (maximum quality) • Project Type = New Development or Enhancement Maintenance
The adopted filters brought the number of sample points used for the construction of the productivity model respectively to 297 observations for the ex-novo development and 699 for the functional enhancement maintenance.
3.2.4.1. New development model The following figure shows the scatter diagram of the data in logarithmic form with the
relative regression line. (impegno=effort)
y = 0,8061x + 3,3821R² = 0,4145
0
2
4
6
8
10
12
0 2 4 6 8 10
ln(Impegno)
ln(Impegno)
Lineare (ln(Impegno))
PDR = = (exp (0,8061 · ln(Size) + 3,3821))/Size
In the case of development projects of average size around 500 FP this value corresponds to 8.8 hours / FP.
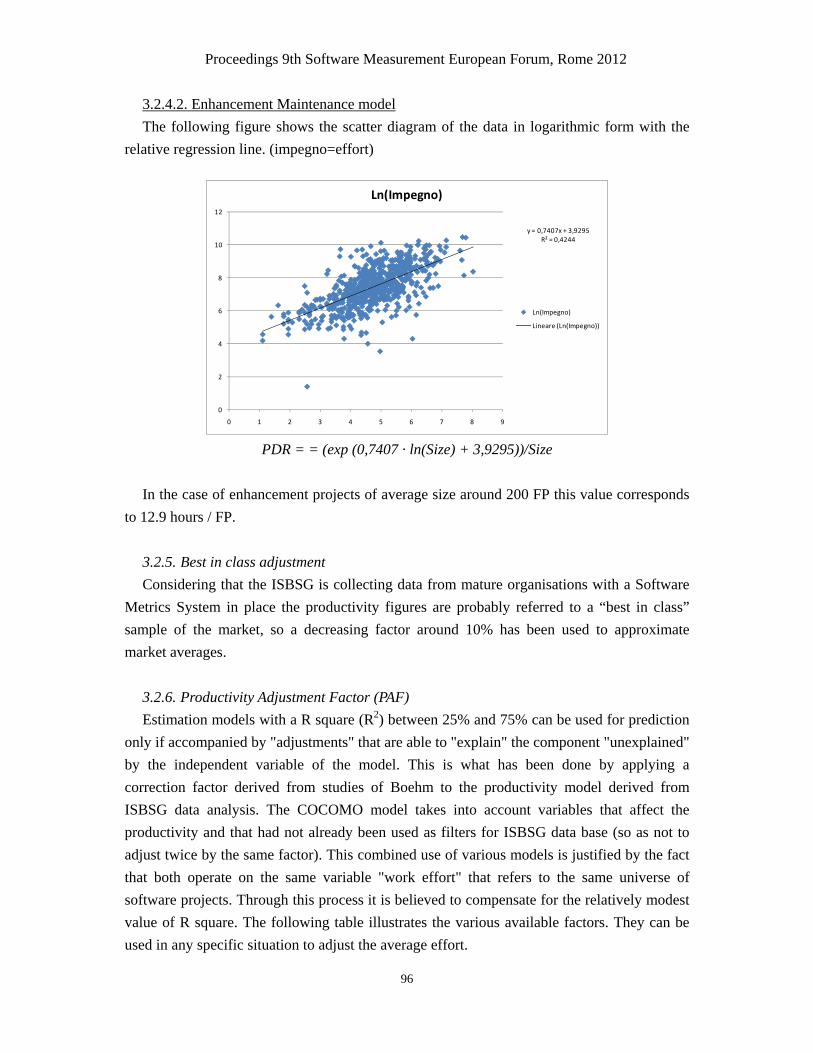
Proceedings 9th Software Measurement European Forum, Rome 2012
96
3.2.4.2. Enhancement Maintenance model The following figure shows the scatter diagram of the data in logarithmic form with the
relative regression line. (impegno=effort)
y = 0,7407x + 3,9295R² = 0,4244
0
2
4
6
8
10
12
0 1 2 3 4 5 6 7 8 9
Ln(Impegno)
Ln(Impegno)
Lineare (Ln(Impegno))
PDR = = (exp (0,7407 · ln(Size) + 3,9295))/Size
In the case of enhancement projects of average size around 200 FP this value corresponds
to 12.9 hours / FP. 3.2.5. Best in class adjustment Considering that the ISBSG is collecting data from mature organisations with a Software
Metrics System in place the productivity figures are probably referred to a “best in class” sample of the market, so a decreasing factor around 10% has been used to approximate market averages.
3.2.6. Productivity Adjustment Factor (PAF) Estimation models with a R square (R2) between 25% and 75% can be used for prediction
only if accompanied by "adjustments" that are able to "explain" the component "unexplained" by the independent variable of the model. This is what has been done by applying a correction factor derived from studies of Boehm to the productivity model derived from ISBSG data analysis. The COCOMO model takes into account variables that affect the productivity and that had not already been used as filters for ISBSG data base (so as not to adjust twice by the same factor). This combined use of various models is justified by the fact that both operate on the same variable "work effort" that refers to the same universe of software projects. Through this process it is believed to compensate for the relatively modest value of R square. The following table illustrates the various available factors. They can be used in any specific situation to adjust the average effort.

Proceedings 9th Software Measurement European Forum, Rome 2012
97
Another parameter considers the influence of unassigned time over productive time in a staff project allocation. Saving due to reuse may be a relevant factor in many cases.
RELY: Required Software Reliability 1,00 0,82 0,92 x 1,00 1,10 1,26
CPLX: Product Complexity 1,00 0,73 0,87 x 1,00 1,17 1,34 1,74
RUSE: Developed for Reusability 1,00 0,95 x 1,00 1,07 1,15 1,24
DOCU: Documentation Match to Life-Cycle Needs 1,00 0,81 0,91 x 1,00 1,11 1,23
PVOL: Platform Volatility 1,00 0,87 x 1,00 1,15 1,30
ACAP: Analyst Capability 1,00 1,42 1,19 x 1,00 0,85 0,71
PCAP: Programmer Capability 1,00 1,34 1,15 x 1,00 0,88 0,76
PCON: Personnel Continuity 1,00 1,29 1,12 x 1,00 0,90 0,81
APEX: Applications Experience 1,00 1,22 1,10 x 1,00 0,88 0,81
PLEX: Platform Experience 1,00 1,19 1,09 x 1,00 0,91 0,85
LTEX: Language and Tool Experience 1,00 1,20 1,09 x 1,00 0,91 0,84
TOOL: Use of Software Tools 1,00 1,17 1,09 x 1,00 0,90 0,78
SITE: Multisite Development 1,00 1,22 1,09 x 1,00 0,93 0,86 0,80
SCED: Required Development Schedule 1,00 1,43 1,14 x 1,00 1,00 1,00
Saving due to reuse 0% TOTAL PAF 1,10% of unassigned time 10%
Productivity Adjustment Factor
Productivity Adjustment FactorsImpact level
Very Low
Low Nominal High Very High
Extra High
3.2.7. Adjusted Productivity calculation 2.3.7.1. New Development
Modeled equation Effort = exp (a · ln(Size) + b)
Size (Funzion Point): 500
Coefficients a 0,8061 b 3,3821
hours/pd 7 pd/pm 19Impegno calcolato: hours 4410 pd 630 pm 33,2
Total PAF 1,10
Best in class adjustment 10%
Adjusted effort hours 5336 pd 762,4 pm 40,1
Adjusted unitary effort (PDR) hours/FP 10,7 FP/pd 0,7 FP/pm 12
Development productivity calculation

Proceedings 9th Software Measurement European Forum, Rome 2012
98
2.3.7.2. Enhancement Maintenance
Modeled equation Effort = exp (a · ln(Size) + b)
Size (Funzion Point): 200
Coefficients a 0,7407 b 3,9295
hours/pd 7 pd/pm 19Impegno calcolato: hours 2576 pd 368 pm 19,4
Total PAF 1,10
Best in class adjustment 10%
Adjusted effort hours 3117 pd 445,3 pm 23,4
Adjusted unitary effort (PDR) hours/FP 15,6 FP/pd 0,4 FP/pm 9
Enhancement Maintenance productivity calculation
3.2.8. Using role prices over the filled role/phase matrix. Having defined role assignment over the process phases and role unitary selling prices we
are able to calculate the Adjusted Unitary Prices for new development and enhancement maintenance and the weighted value for a global contract.
3.2.9. Adjusted Unitary Prices The following tables illustrate the final calculation of the Adjusted Unitary Prices based
on average assumptions related to PAF and reuse. The values are not to be considered absolute laws since they are shown only for methodological goals.
hours/FP 10,7 FP/pd 0,7 FP/pm 12,5
Adjusted Unitary Price (€/FP) 356,02€
hours/FP 15,6 FP/pd 0,4 FP/pm 8,5
Adjusted Unitary Price (€/FP) 415,29€
hours/FP 13,1 FP/pd 0,6 FP/pm 10,5
Adjusted Unitary Price (€/FP) 385,65€
Productivity (PDR)
Weighted benchmark
Productivity (PDR)
New Development benchmark
Productivity (PDR)
Enhancement Maintenance benchmark
A 50%-50% weighting choice has been made.

Proceedings 9th Software Measurement European Forum, Rome 2012
99
4. Unitary price distortion factor Regardless of the chosen approach (market or constructive oriented) sometimes the market
prices progressively go down without apparent lower limits and not because of productivity progresses but simply because there is a lack of control by the customers in running the contracts.
Increasingly, organisations that buy custom (i.e. non-standard) software choose to evaluate its transfer price based on the characteristics of quantity, quality of product rather than on labour-time necessary to build it. The idea seems great because paying the person time (effort) without sizing the correspondent product may mean paying inefficient suppliers more than efficient ones. The software market it’s at an historical transition that we could summarise as "from the Person-Day to Function Points". The Function Point Analysis, in fact, is a way to measure the functional size of software that is a little bit like 'to quantify the many different "things" that a user can do with it’. The more functional processes are there, the higher is the Function Point (FP) count.
Unfortunately, in Italy, market practices in this area have degenerated over time by
looking at the FP as a substitute of the person day metrics causing the loose of its connection with the objective "product" dimension. In these cases it happens that in a contract where the software should be measured and paid using FP, person days required to end up the project are estimated and then converted to FP based on more or less standard exchange rates. The key success factor of this practice that we may call “backfiring from the costs” is the lack of control by the customer of actual delivered measures. The proof of this is that the Italian average trading prices over a decade has risen in from about 800,00€/ FP to about 120,00€/ FP. This incredible performance is unparalleled in any country with an advanced economy. Unitary prices for trading ad hoc software in today's Italy are even smaller than in India, China, Brazil and Eastern European countries that are known to be more convenient in terms of production costs. Are we so particularly productive or are Italian specialists so cheap to hire? If it was so every foreign corporate should prefer to off-shore software development to our country instead towards emerging countries. In fact it is not. The explanation is simple: the Italian market unitary prices are often fictitious. Conventional prices are used to win tenders and competitions, but they are not the prices at which well organised companies can build and conclude a business with a fair profit. Producing software in Italy costs the same as producing it in France, Germany, and Spain, where the average selling price per unit is detectable by 3 to 5 times the Italian one.
So what? How do we make ends meet? This is simple: customers do not often check, in an
adequate way, the amount of software delivered and invoiced.

Proceedings 9th Software Measurement European Forum, Rome 2012
100
This allows the contractual parts to have a formally respected unitary price and a “real, actual” price that can be substantially different from that offered and which allowed the supplier to win the competition. In addition, once awarded the contract, it becomes a common interest (customer / supplier) to save the operational capability (delivering software for the business) and therefore everybody tries to be blind about the delivered FP. The way out is to restore the functions of control in the customers environment and manage a price "moratorium" which brings the price offered to the true meaning of its competitive nature but, at the same time in a feasibility area. Using a mixed form of acquisition (part measured using FP and part using person-days) may allow to have some compensations without influencing the size measurement of products. This is particularly important if you consider that expanding improperly the size measurement of assets will surely inflate also the costs of ordinary maintenance and support (when related to size).
5. Conclusions Defining Unitary Prices for tenders, requests for proposal or offers is a very hard task. At
the end “price determination” is always a commercial process and sometimes significant profits or losses are determined by market strategies. Nevertheless it is definitely important to have a way to assess the risk of any choice made by the management of organisations acquiring or selling software. The risk is surely proportional to the distance between a concluded agreement on unitary prices and a “feasible” figure of them. In this paper we have described two different common methods to do that and some problems and hints to overcome them.
6. References [1] Capers Jones, Estimating Software Costs 2nd Edition, McGraw-Hill, 2007. ISBN 978-0-07-148300-1 [2] Peter Hill, ISBSG, Practical Software Project Estimation 3rd Edition, McGraw-Hill. [3] R.Meli et al, IFPUG, The IFPUG Guide to IT and Software Measurement, 2012, Auerbach
Publications [4] R. Meli, Software reuse as a potential factor of database contamination for benchmarking in Function
Points - ISBSG workshop -12 febbraio 1998 - Roma [5] Charles Symons, Controlling Software Contracts, European SEPG Conference, Amsterdam, June
1997 (http://www.software-measurement.com/ [6] Peter Raysz, Damir Lisak, Method for Well-Defined Terms of Agreement in Software Contracts
Using Function Points, ESCOM-SCOPE 99, Herstmonceux Castle, East Sussex, England, April 27-29, 1999
[7] Software Cost Estimation with COCOMO II, B. W. Boehm et others, Prentice Hall, 2000 [8] T. Iorio- R. Meli - Software Measurement and Function Point metrics in a broad software contractual
agreement - SMEF ROMA 2005 [9] R.Meli-F.Perna, “Practical experiences of Function Points estimation and measurement in a complex
outsourcing context of an Italian Public Administration.”, SMEF2008, Milano, Italy

Proceedings 9th Software Measurement European Forum, Rome 2012
101
Software Comprehensive Count with Quality Indicators (SCCQI) A comprehensive approach to Software Size Measurement
Jasveer Singh
Abstract
As software size measurement is one of the most important activities in the software development lifecycle, the methodology used for estimating the size should be able to measure the size comprehensively. That means that all the software constituents should be considered for measuring the size and a proper translation of the measured size to the effort estimate should be possible. The current available methodologies do not consider all the aspects of the software, hence the size assessment may not be accurate. Software Comprehensive Count with Quality Indicators (SCCQI) is a new powerful methodology which not only offers an elaborate and comprehensive measurement and effort estimate (as a result of using 26 extensive measures of counting when compared to 4 of COSMIC) but also offers important and valuable Key Software Indicators (KSI's). These KSI's are very useful in assessing the quality aspects of the software regarding Quality Management. By using SCCQI, the most realistic effort estimates are obtained which are utilised for a precise project planning for Project Management.
1. Introduction For software projects, it is very important to determine the size of the software based on
the functional specifications which contain mainly the description of the functionality, errors, messages and user interfaces, and logical data model providing high-level information about the data.
From the available software size measurement methodologies at present, COSMIC FFP is widely used. It gives a good estimation of the software size by its full function point counts and it is ISO approved.
Although COSMIC FFP is extensively used, it has several shortcomings in determining the size of software comprehensively because it uses very limited software measurability criteria (only about 20% of the complete criteria). It counts only 4 types of operations for the data groups:
• memory read; • memory write; • entry from input devices and external programs; • exit to output devices and external programs.

Proceedings 9th Software Measurement European Forum, Rome 2012
102
It does not consider all of the following aspects: • size and complexity of data; • size, type and complexity of all the functionality; • error handling; • number, size and complexity of user interfaces; • quantity, size and complexity of message exchanges; • others.
Because of these limitations, it is difficult to assess the complete size of the software from the COSMIC FFP count accurately because the information about the above-mentioned items is not completely available in the count.
In SCCQI, not only the limitations of the COSMIC FFP are overcome but there are also innovative essential features included which are very useful for software size measurement. These features make it a strongly desired method for software size measurement.
SCCQI uses a comprehensive function point counting method to assess the complete size
of the software. The complete software count obtained from SCCQI includes the information about the size and complexity of data, functionality, user interfaces, messages and errors which are shown as the main software constituents in Figure 1 below. The counting is done considering the size and complexity of data; size, type and complexity of functionality; error handling; number, size and complexity of user interfaces; quantity, size and complexity of message exchanges; and apparent deficiencies in the functional specifications of data model, functionalities, user interfaces and messages.
Figure 1: Software size determination model - main software constituents

Proceedings 9th Software Measurement European Forum, Rome 2012
103
In SCCQI, 26 expansive measuring criteria are considered for counting the function points from the main constituents of software functional description - data, functionality, user interfaces, error handling and message exchange. These are called raw counts. The different raw counts are used to calculate the approximate total software logical size and effort needed for software design (preparing the technical specifications documents, and coding) and testing (preparing the test specifications documents, and testing). Also, requirements deficiency count regarding the apparent deficiencies in the functional specifications, and major important KSI’s regarding the software operational and structural characteristics are provided based on which realistic judgments about the software can be made.
The 26 raw counts are used to calculate • 6 software size counts; • 4 software estimations about the software size and effort; • 21 Key Software Indicators of which
o 12 Software Structural Indicators; o 9 Software Operational Indicators.
The following three paragraphs will specify the list of software size counts, software
estimations and key software indicators which are determined with a high degree of confidence by using SCCQI. All the information needed for these counts, estimations and indicators is extracted from the functional specifications document which describes the logical data model, functionalities, user interfaces and messages.
2. SCCQI Software Size Counts The elaborate and comprehensive SCCQI method uses a detailed function point count
procedure to determine the complete size of the software. For this, 26 relevant and essential measuring criteria for function point counting are used giving 26 counts. These counts are called the raw counts and they consider
• the size and complexity of data; • size, type and complexity of all the functionality; • error handling; • number, size and complexity of user interfaces; • quantity, size and complexity of message exchanges; • apparent deficiencies in the functional specifications of:
o data model; o functionalities; o user interfaces; o messages.
Proceedings 9th Software Measurement European Forum, Rome 2012
104
The raw counts are used to calculate 6 software size counts. 2.1. Data Count The Data Count indicates the data size and complexity, based on 3 raw counts. 2.2. Functionality Count The Functionality Count indicates the functionality size and complexity, taking into
account all the operations of the software - processing operations, memory transactions, input/output device interactions, communications with external programs and error handling - involved in the functionality, based on 13 raw counts.
2.3. User Interface Count The User Interface Count indicates the user interface size and complexity, based on 4 raw
counts. 2.4. Message Count The Message Count indicates the message size and complexity, based on 2 raw counts. 2.5. Total Software Count The Total Software Count indicates the total software size and complexity which is the
sum of the Data Count, Functionality Count, User Interface Count and Message Count. 2.6. Requirements Deficiency Count The Requirements Deficiency Count indicates apparently missing items, taking into
account apparent deficient items for the counts of data, functionality, user interface and message, based on 4 raw counts.
3. SCCQI Software Estimations The raw counts are also used to calculate 4 software estimations about the software size
and effort. First, the software logical size is calculated taking into account the raw software counts for data, functionality, user interface and messages. The software logical size thus calculated is used to estimate the design and testing efforts, which are used in turn to calculate the total effort required for the software project.
3.1. Software Logical Size The Software Logical Size is a complex function of the data, functionality, user interface
and message counts.

Proceedings 9th Software Measurement European Forum, Rome 2012
105
3.2. Design Effort The Design Effort, which is needed for preparing the technical specifications document as
well as for coding, is a function of the Software Logical Size. 3.3. Testing Effort The Testing Effort, required for preparing the test specifications document and for testing,
is a function of the Design Effort. 3.4. Total Effort The Total Effort is the sum of the Design Effort and Testing Effort. 4. SCCQI Key Software Indicators Consequent to the in-depth analysis of the functional specifications by using the 26 raw
counts of SCCQI, a number of specific KSI's are generated based on the raw counts. The KSI's give a conspicuous overview of the most important software characteristics - structural and operational. The KSI's are thus divided into two groups: Software Structural Indicators and Software Operational Indicators.
The raw counts are used to calculate • 21 KSI's of which
o 12 Software Structural Indicators; o 9 Software Operational Indicators.
The KSI's are categorised in levels of Low, Medium, High or Very High so that the areas
which are below the desired level can accordingly be targeted for improvement. 4.1. Software Structural Indicators (SSI) There are 12 SSI's which are helpful in assessing the structure of the software from the
point of view of its static content. They give the indication of the size and complexity of the data and functionality, and further the proportion of various areas of functionality, error handling and deficiencies in the requirements. The following Software Structural Indicators are obtained:
1. Data Complexity and Size: This is decided based on the total data count, the bigger the data count, the more complex and the bigger the size of data is in the software. 2. Functionality Complexity and Size: This is decided based on the total functionality count, the bigger the functionality count, the more complex and the bigger the size of functionality is in the software.
Proceedings 9th Software Measurement European Forum, Rome 2012
106
3. Memory Transaction Proportion: It indicates the static proportion of the memory transaction functionality in the total software. 4. Computational Content Proportion: It indicates the static proportion of the computational part in the total software. 5. Logical Operation Content Proportion: It indicates the static proportion of the logical operation part in the total software. 6. Decision Content Proportion: It indicates the static proportion of the decisional operations part in the total software. 7. Repeat Content Proportion: It indicates the static proportion of the repeat operations part in the total software. 8. Action Content Proportion: It indicates the static proportion of the different actions performance in the total software. 9. User Interface Proportion: It indicates the static proportion of the user interface related part in the total software. 10. External Communication Proportion: It indicates the static proportion of the message communication part in the total software. 11. Error Handling Proportion: It indicates the static proportion of the error handling capability in the total software. 12. Requirements Deficiency Grade: It indicates the static proportion of the apparent deficient part in data, functionality, user interfaces and messages. 4.2. Software Operational Indicators (SOI) There are 9 SOI which indicate the dynamic properties of the software at run-time. They
are helpful in assessing the intensity of data flows to/from memory, external devices/programs, as well as the intensity of computations, logical operations and other software operations. The following Software Operational Indicators are obtained:
1. Memory Traffic Level: It indicates how much level of memory traffic will be at run-time in the entire functionality. 2. Computational Level: It indicates the computational level in the entire functionality at run-time. 3. Logical Operations Level: It indicates the logical operations level in the entire functionality at run-time. 4. Decision Execution Level: It indicates the level of decisions execution in the entire functionality at run-time. 5. Repeat Execution Level: It indicates the level of repeat execution in the entire functionality at run-time. 6. Action Execution Level: It indicates the level of actions performed in the entire functionality at run-time. 7. User Interaction Level: It indicates the level of user interaction in the entire functionality at run-time. 8. External Communication Level: It indicates the level of message exchange with external environment in the entire functionality at run-time.

Proceedings 9th Software Measurement European Forum, Rome 2012
107
9. Error Handling Capability: It indicates the level of error handling execution in the entire functionality at run-time. 5. Example Following is an example of the use of SCCQI versus COSMIC FFP, based on our
experience of real projects. Due to the expansive counting method of SCCQI, the Software Size Count obtained by SCCQI is 771 while the COSMIC FFP count on the same example is 255 only.
Table 1: SCCQI: Software Size Counts and Software Estimations - Software Size and Effort
SCCQI: Software Size Counts and Software Estimations about the Software Size and Effort
Software Size
Count:
Software Estimations -
Software Size and Effort:
COSMIC count
Data Count 130
Functionality
Count
456 Cosmic FFP 255
User Interface
Count
145 Software Logical Size 2797
Message Count 40 Design Effort (tech spec+coding)
person days
38
Total Software
Count
771 Testing Effort (test spec+testing)
person days
46
Requirements
Deficiency Count 80
Total Effort (design+testing)
person days
84 Total COSMIC
Count
255
Figure 2: Graph of Software Size Counts - SCCQI vs. COSMIC
Table 2: SCCQI KSI's
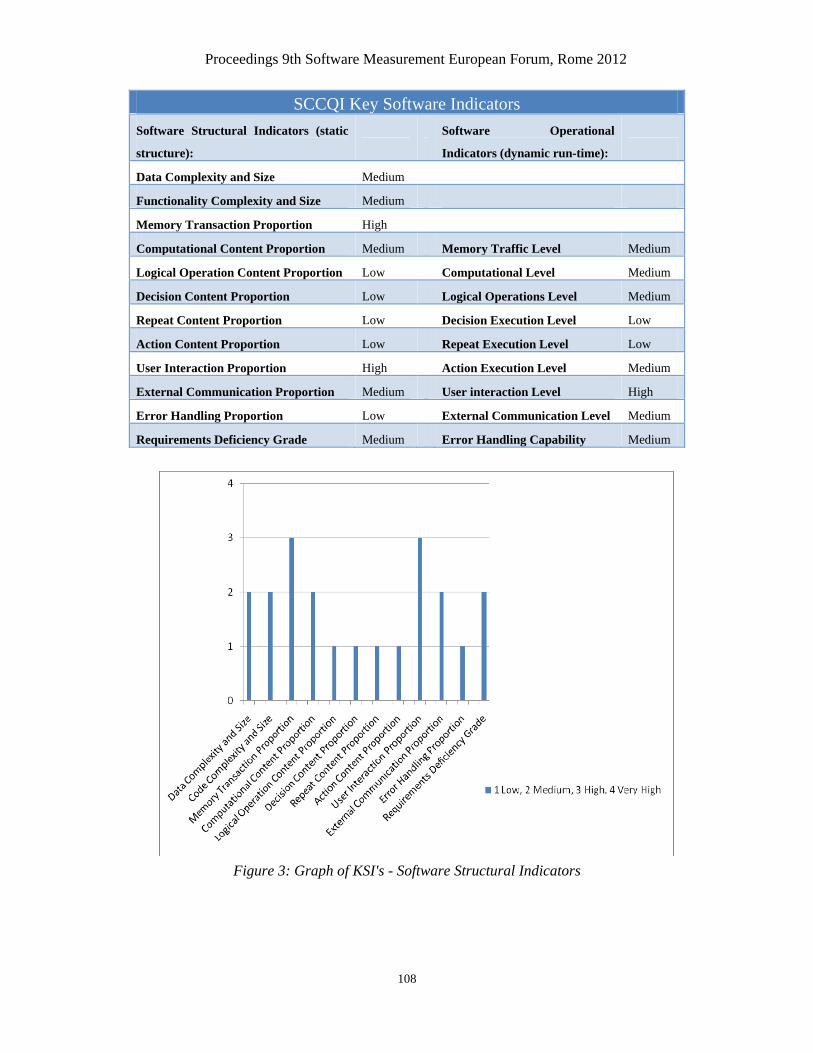
Proceedings 9th Software Measurement European Forum, Rome 2012
108
SCCQI Key Software Indicators Software Structural Indicators (static
structure):
Software Operational
Indicators (dynamic run-time):
Data Complexity and Size Medium
Functionality Complexity and Size Medium
Memory Transaction Proportion High
Computational Content Proportion Medium Memory Traffic Level Medium
Logical Operation Content Proportion Low Computational Level Medium
Decision Content Proportion Low Logical Operations Level Medium
Repeat Content Proportion Low Decision Execution Level Low
Action Content Proportion Low Repeat Execution Level Low
User Interaction Proportion High Action Execution Level Medium
External Communication Proportion Medium User interaction Level High
Error Handling Proportion Low External Communication Level Medium
Requirements Deficiency Grade Medium Error Handling Capability Medium
Figure 3: Graph of KSI's - Software Structural Indicators
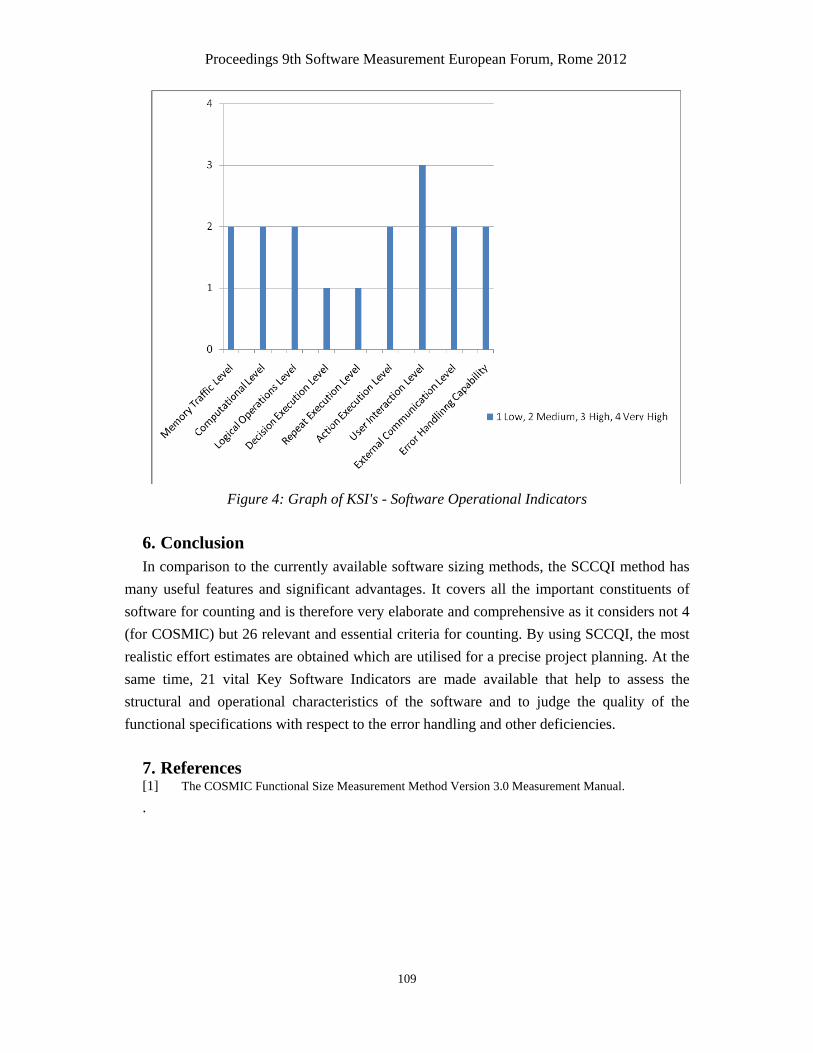
Proceedings 9th Software Measurement European Forum, Rome 2012
109
Figure 4: Graph of KSI's - Software Operational Indicators
6. Conclusion In comparison to the currently available software sizing methods, the SCCQI method has
many useful features and significant advantages. It covers all the important constituents of software for counting and is therefore very elaborate and comprehensive as it considers not 4 (for COSMIC) but 26 relevant and essential criteria for counting. By using SCCQI, the most realistic effort estimates are obtained which are utilised for a precise project planning. At the same time, 21 vital Key Software Indicators are made available that help to assess the structural and operational characteristics of the software and to judge the quality of the functional specifications with respect to the error handling and other deficiencies.
7. References [1] The COSMIC Functional Size Measurement Method Version 3.0 Measurement Manual.
.

Proceedings 9th Software Measurement European Forum, Rome 2012
110
Intentional Left Blank

Proceedings 9th Software Measurement European Forum, Rome 2012
111
Beyond perception: Peeking over the wall to get real control…
Eric van der Vliet, Paul Siemons
Abstract Management in an organisation have the role to control their environment with the
intention to achieve their objectives. Objectives for managers are derived from organisation level objectives and often defined by means of KPI’s. The focus of KPI’s is mainly on financial, productivity, quality or elapsed time aspects. To achieve the defined objectives management makes day to day decisions based on the current circumstances. Decisions will be made based on information that is provided. But is this information a reliable representation of the reality or just a perception? For example if in a production environment a dashboard shows that employee one is able to produce 5 products and number two is able to produce 8 products the managers opinion is that number 2 is more productive than number one and will use this information while making decisions. The reality is that number one is producing higher quality products and is working 36 hours instead of 40 hours. Because of the limited information the perception of the manager is not according to the reality. In reality they have the same productivity if they deliver the same quality and work the same amount of hours. The point is that not all required information is reported to the manager so the manager is not able to make the right decisions. To reduce the gap between perception and reality the IMD-Model has been defined. The IMD-Model explains the relation between reality and perception and supports the implementation of a management decision making and control model based on information provided by a measurement system. The model and a practical example of a maintenance environment will be further explained in this paper.
1. Introduction To be able to control an organisation managers require information. To determine what
metrics are required, models like GQM (Goal Question Metrics) are available to determine these metrics based on goals. The benefit of such models is that it’s quite easy to determine the metrics, the disadvantage is that such a model is useful for people that understand how to deal with metrics but quite difficult to use for people with less experience.
Metrics will be used to provide information to managers. But often metrics do not directly provide the required information that managers need so the metrics are not used. For example if a manager is interested in the productivity of a software development environment, a metric can be the productivity of projects.

Proceedings 9th Software Measurement European Forum, Rome 2012
112
If the manager receives continuously metrics from all projects during the whole project lifecycle the manager will react on each variation of these metrics instead of reacting on a trend and on deviations.
For a manager it will be difficult to make the right interpretation because the metrics are provided to him as information while an intermediate step is required to translate these metrics to information that can be used to make decisions. For example if the productivity has a structural deviation from the trend, corrective action is required so the manager should be informed. If no action is required by the manager this should also be reported.
In general, metrics are calculated from individual measurements. This means that metrics cannot be directly measured but require an intermediate steps. If we take the productivity of projects as an example, data is required about the product size (e.g. Function Points) and the amount of effort spent on the realisation of this product (e.g. hours) and probably information about the quality of the delivered product (e.g. defects found during system testing). The productivity can be for example hours / Function Points in combination with the amount of defects found. That more measurements are required for determining metrics and how to derive these metrics is known by the experienced people, but what are the steps to come from measurements to information required by managers?
The intention is to provide managers information that is a correct representation of the
‘real world’ to be able to make the right decision. If we refer to the example of the software development environment, the ‘real world’ is the projects and the development process used by these projects.
Because the information that is provided to a manager is derived from measurements in this ‘real world’ it will be a representation of the reality what we call a perception. Then the question is how close the perception and the ‘real world’ are related? How close should these two relate to each other? What will be the impact of a close relation of the perception and the ‘real world’ with respect to costs of the measurement system?
To support the derivation of information from measurements the IMD-Model has been
defined. This model explains the steps how to come from reality to perception and how to determine what to measure based on the information needs. The model explains how a measurement system looks likes and what the impact will be of an accurate measurement system.
The IMD-Model will be explained based on a theoretical description and a practical
example. The practical example describes an implementation of the model in a maintenance environment.
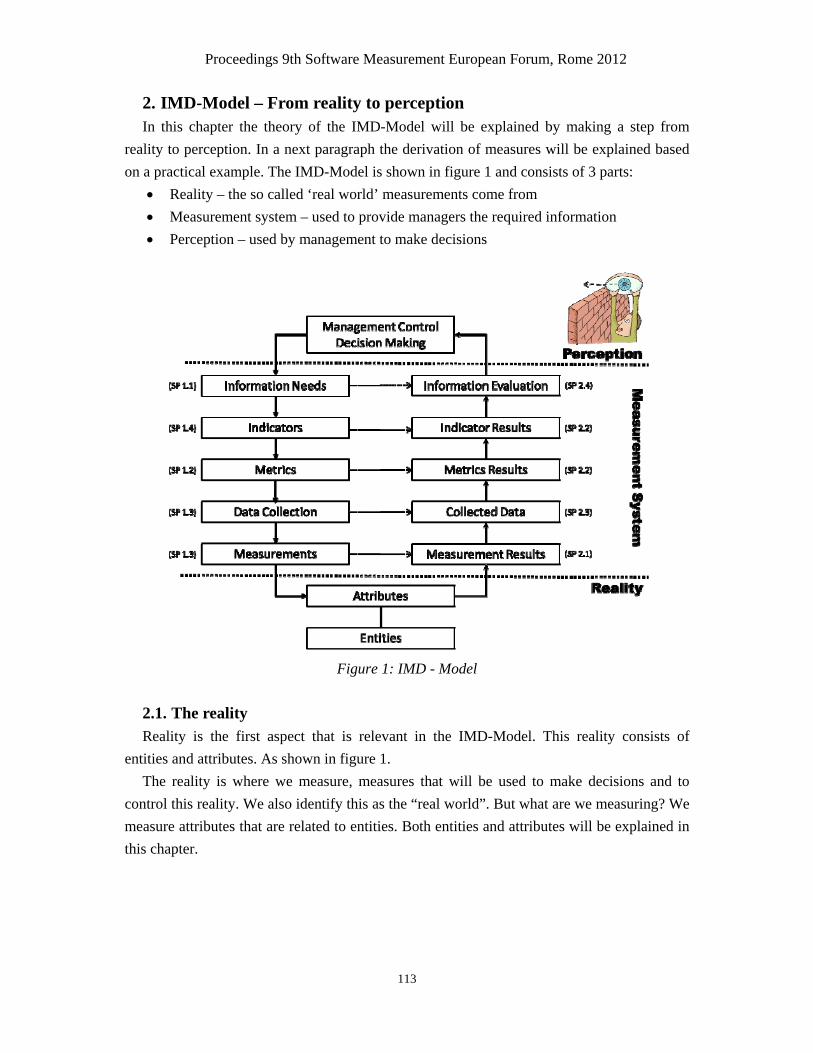
Proceedings 9th Software Measurement European Forum, Rome 2012
113
2. IMD-Model – From reality to perception In this chapter the theory of the IMD-Model will be explained by making a step from
reality to perception. In a next paragraph the derivation of measures will be explained based on a practical example. The IMD-Model is shown in figure 1 and consists of 3 parts:
• Reality – the so called ‘real world’ measurements come from • Measurement system – used to provide managers the required information • Perception – used by management to make decisions
Figure 1: IMD - Model
2.1. The reality Reality is the first aspect that is relevant in the IMD-Model. This reality consists of
entities and attributes. As shown in figure 1. The reality is where we measure, measures that will be used to make decisions and to
control this reality. We also identify this as the “real world”. But what are we measuring? We measure attributes that are related to entities. Both entities and attributes will be explained in this chapter.

Proceedings 9th Software Measurement European Forum, Rome 2012
114
2.2.1. Entities The world around us is a humongous stream of endlessly varying phenomena. To make
sense of the world around us, we need to break down this stream into manageable bits. The generic term for every conceivable bit is an entity. Indeed, in philosophical terms, anything you can think of in the broadest possible sense is an entity. Entities may be very concrete physical objects, such as a table or a person. Entities can be things as small as a quark or an atom. Or -on the other end of the size scale- the universe and even such a thing as a multiverse, and everything in between. But the relations and interactions between quarks, atoms, stars, galaxies and even between different universes in a multiverse are all entities in their own right as well.
In addition, entities can be much more abstract notions such as ideas or emotions: think of freedom, love and beauty, or chaos, suffering and loss. To summarise, the collection of entities is the collection of everything that has a virtual or physical existence in any thinkable way.
With so many entities in existence, how is it possible to work with them? That is possible
because entities can be distinguished from each other by their attributes. What attributes are will be discussed in the next section.
2.2.2. Attributes
Examples of attributes are roundness for a bowling ball, horsepower for a car, price of a commodity, age for a person, taste for wine, weight for a luggage on an air plane and so on.
Please note that all attributes are -by definition- entities themselves. In fact a distinguishing feature of an attribute as opposed to non-attributes is that an attribute tells us something about a given entity. When entities are distinguished from each other, this is because they do have at least one different attribute. From this follows that when two entities share all their attributes, they must be considered identical because it is impossible to make any distinction between them.
When grouping together entities, a collection is established based on all entities sharing one or more attributes. In other words, for an entity to belong to a collection it essential that it has all the required common attributes. These special attributes are commonly known as properties or characteristics. So a property is a distinguishing attribute of a group: all members of that group have the property while all non-members do not have the property.
Being at a certain location at a given time is not essential for being a ball and neither are its colour, weight and elasticity, but having roundness is essential. Without roundness an entity is not a ball. Attributes that are non- essential for a certain group are sometimes called accidental attributes.
Proceedings 9th Software Measurement European Forum, Rome 2012
115
The list of non-essential attributes for a ball mentioned above (location, ...,weight, ...) are typical examples of accidental attributes for balls. This can be understood as: the entities in the group do have these attributes by chance or by accident.
In short: Attributes are the entities that make other entities different from each other. And properties are a special case of attribute that make groups of entities different from each other. Attributes that are non-essential for a group are called accidental.
2.2. Measurement system Why are entities and attributes relevant for a measurement system? A measurement
system will provide information about entities to management by means of indicators. These indicators will be determined based on measurements of the reality. These measurements are measurements of entities. Examples of entities of interest are a software product, a development environment or a helpdesk. Examples of attributes of interest are the size of a software product or the cost of a development environment. In this paragraph will be explained how to derive indicators from measurements according to the IMD-Model.
2.2.1. Measurements Following this definition, the objective of a measurement is to obtain a value for a given
attribute. For a measurement to be useful, it is necessary that the outcomes of repeated measurements on the same attribute result in the same value (repeatability) and that exchanging measurers also results in the same value (reproducibility). Using a clear and defined standard for performing the measurement is therefore necessary. Such a standard is called a norm or a scale.
What good measurements are depends on the use but general rules to determine correct
measurements are: • Correctness
Correctness in this context has two aspects. First, the measurement to obtain the data must be well defined. Second, the measurement must be performed as defined and the result must be stored without error. To determine a child’s temperature we must use a thermometer according to its instructions and carefully determine the reading.
• Completeness Measurements must be complete. Not only the actual data must be stored. With it, the relevant context must be determined and stored. By itself the figure 39 means nothing. Adding that it is the temperature of the air at ground level at noon in ‘Celsius on a certain date at a given location gives it a meaning.

Proceedings 9th Software Measurement European Forum, Rome 2012
116
• Granularity Defining the granularity of measurements is very important. Measurements with a high granularity can take quite some effort while it's not required. For example if we measure the duration of a project this is often only possible based on the total start and end data of the project. But if effort information is required for estimating purposes we need to measure on activity level. The total effort for the project is the sum of these activities. The second measurement has a more detailed granularity but it will be more difficult to collect the data on this level. When defining the level of detail, it is wise to consider the use of the data. When we want to control the time to market, knowing the duration of projects does tell us which projects take longer than others but this does not give any indication what might be the cause. Measuring at a more detailed level, e.g. of project phases or individual tasks might help us pinpoint the cause by enabling comparison of projects at the deeper level. So selecting the right level of granularity is important to the usefulness of the data. Note that going for a finer granularity comes with a price. It takes more measurements, there are more results to handle and more data to store. A careful consideration should identify the right balance here. Experience learns that it is nearly always necessary to measure entities at least one level deeper/under the original lowest level entity of interest. What do we get from measuring? Consider performing a measurement for which you already know - to a considerable extent- the outcome. Such a measurement does not add much value because it does not yield new information. Why is new information more valuable than old information? That is because new information reduces our lack of knowledge about the world around us. So the added value of any measurement is related to how much it decreases our un-knowledge or rather how it reduces our inability to predict the future. In essence, that is what we get: we measure to get a better grip on our future. Note that for a measurement to be useful it is not only necessary to have a repeatable and reproducible measurement method that yields sufficiently precise and accurate values, but also to identify exactly what the entity is of which the attribute was measured.
2.2.2. Data Data are a collection of the raw unprocessed results of related measurements. That means
measurements of the same entity at different times and/or measurements across a group of related entities. Data are the starting point for the calculation of metrics.

Proceedings 9th Software Measurement European Forum, Rome 2012
117
For example, for the entity “race of person X in the 400m freestyle swimming in the London Olympics of 2012” the attributes starting time and finishing time can be measured to derive the time for X.
Timeliness is an important aspect for data. Data must be available on time otherwise it will have outlived its useful life at the time it is provided. This can mean a certain frequency, for example every week, on which data must be available or a certain date, for example at the end of a project or phase. Knowing that your child had a fever three weeks ago is of no use to a concerned parent.
2.2.3. Metrics Examples of metrics are the median and the range of a variable; or the distribution of the
different possible values of a variable; or the difference between two variables; or a correlation formula between two or more variables.
Statistics, as a branch of Mathematics, offers a number of standardised solutions to derive metrics in various situations.
It is important to define and describe the exact way a metric is derived or calculated from
the data. If the derivation is not sufficiently clear, differences of interpretation will lead to different outcomes for the same set of data.
If the derivation is too complex, the metric may be useless because interpretation requires an understanding of the metric in terms of expected results.
2.2.4. Indicators An indicator is used to trigger some identified action and is therefore in essence a decision
support mechanism. A typical example is the traffic light or RAG indicator that is used to classify metrics results in three categories, from desirable (Green) to less desirable but still acceptable (Amber) to unacceptable (Red). Indicators can be simpler (binary with two categories such as Yes/No) or more complex (having more categories such as --, - , 0 +, ++).
A key element of the definition of an indicator is the norm. The norm must provide
sufficiently detailed guidance to classify the metric results reliably enough for the decision the indicator is used for.
2.2.5. Information evaluation The indicators will provide information to managers that will be used to make decisions
and control the environment the measurements come from the ‘real world’.

Proceedings 9th Software Measurement European Forum, Rome 2012
118
Relevant for this information are the accuracy5 and the precision6 of this information. The following examples explain both accuracy and precision:
• Stating that the next train will arrive within 60 minutes from now is probably accurate [close to the truth] but not very precise [relatively unspecific].
• Stating that the next train will arrive within 60 seconds from now is probably not accurate [not close to the truth] but very precise [overly specific].
Information must be accurate in relation to the precision required to differentiate between
alternatives. A scale to weigh trucks probably is not capable of telling me whether I have gained half a kilo or not, but it will be accurate in telling me that I weigh less than a tonne (1000kg). To find out whether I am loosing or gaining weight I probably need a scale that can accurately determine my weight to a precision of 100g. This is what typical household scales do.
Please note that precision is different from granularity but is related. To measure the load of a truck, we could measure it with and without payload. A measurement with a precision of 100kg probably would do to find out that the payload weighs about 8 tonnes. Maybe the payload consists of 1000 boxes of different sizes. We could alternatively decide to measure each individual box and add up the results. For this we probably would need to measure to individual boxes with a precision of less than 1 kg.
2.3. Perception How can we use the measurement system for decision making? For example if we relate
this to estimating & metrication in a software development environment? For improving estimates actual measurements from finalised projects will be used. But what precision and what accuracy are required for these measurements? First need to be determined what decisions management will make based on these estimates. This will defines what information precision and accuracy is required.
For example a manager will use the estimates to determine what solution to use and what solution not for the implementation of a new system. The level of decision making also determines on what granularity level the measurements are required. This can be for example on system level or on parts of the system depending on the level of decision making.
5 Accuracy = closeness to the true real world value 6 Precision = the expected maximum deviation between the true real world value and our measurement

Proceedings 9th Software Measurement European Forum, Rome 2012
119
In this case measurements on system level will be sufficient. If we know what information is required by management we can determine what precision is required and what accuracy. If a project is in a definition stage the accuracy of the estimates will be probably +/- 40%. With this accuracy a high level precision (e.g. 2 decimal places) doesn’t make sense.
In a later stage a more accurate and precise estimate will be required as shown in figure 2.
Still need to be determined what precision and what accuracy is required, the more accurate estimate are required the higher the costs due to more refined measurements that need to be gathered. A maximum accuracy probably requires extremely high costs that are not reasonable. Reasonable in that sense is that costs and benefits must be in balance.
The more accurate the estimates the lower the risks of a project overrun. But if the costs for these accurate estimates are higher than the risks it’s not worth the investment.
Figure 2: Improved precision / Improved accuracy
3. IMD-Model – From information needs to measures In chapter 2 the IMD-model has been explained from a theoretical point of view. In this
chapter the model will be explained based on a practical example of a maintenance environment. In chapter 2 the right side of the model is explained from reality to perception. In this chapter will be shown how to determine measurements based on the information required, the left side of the model.
3.1. Measurement system for a maintenance organisation The maintenance organisation used in the example is an organisation that is handling
changes and requires information to be able to control this organisation.

Proceedings 9th Software Measurement European Forum, Rome 2012
120
Maintenance can consist of helpdesk functionality, solving incidents but also the implementation of changes on existing systems. In this paragraph the main focus is on the management of changes. There can be quite some difference in the size of changes and sometimes it’s difficult to make a distinction between an incident and a change. A definition that is often used is that the difference between a change and an incident is that a change will result in changed functionality of the system. Still this can be a change of a few days up to a change of 200 days. Management of such an organisation requires information to be able to control the operation. A hugh difference with a regular project organisation is that the elapsed time of the changes is must shorter, multiple contracts can be supported by a single team and what amount of changes can be expected is often difficult to predict. Changed functionality can be required due to regularity, efficiency improvements or just end user needs. Whether a change request will be submitted will depend on the available budget in the organisation and the business case. The maintenance organisation must be prepared on different types of changes but also on a fluctuation in the request for changes. To be able to control such an organisation management requires information, to provide this information a measurement program can help.
3.1.1. Information needs Management will require quite some information to be able to control the maintenance
organisation. To prevent an overdose of information it’s important to determine what primary information is required and what secondary information is required to be able to analyse the results. This can be compared with a dashboard in a car. If too much information is provided it would be difficult to control a car. Important information is the speed, the level of the gas tank and the RPM. The primary information should consist of 3-4 items. Of course there can be more information that is shown if required or can be used to analyse issues. For example in a car information will be provided if lights are not working any more. This is important information but only if this situation occurs and not to be able to control the car.
A maintenance organisation requires primary information for management control and
secondary information to analyse issues that occur. Examples of primary information are: • Portfolio / resource forecast
For a maintenance organisation it’s important to find a balance between the portfolio forecast with the amount of change effort that is required and the availability of resources to handle these changes. Management requires information about the predictability of this forecast.

Proceedings 9th Software Measurement European Forum, Rome 2012
121
• Productivity (efficiency) The productivity of a maintenance organisation is used to determine the efficiency of the organisation and if improvement is required. Especially if a maintenance organisation consist of several locations it will be relevant to compare the productivity of different locations. If the productivity is not according to defined targets there will be a root cause that requires more detailed information. This can be for example the complexity of the software, amount of changes, or the maturity of the team.
• Estimating accuracy To be able to control changes it’s important to give a reliable estimate of the effort required for the change. Because changes are often small (5-50 day’s) an accurate estimation is important to be able to finalise the change within a certain margin. Otherwise this will have direct impact on the revenue of the maintenance organisation.
• Post release defect density Delivery of changes in time and within margin is important but if the quality is not acceptable than extra effort need to be spent after delivery to solve these issues. Information about the post release quality is therewith very important.
3.1.2. Indicators For the information that is provided to management different indicators can be used. It’s
also possible to make combination of examples graphs and traffic light. For all 4 types of information mentioned in paragraph 3.1.1 traffic lights can be used. To be able to do this it’s important to determine when the traffic light will be Red, Amber or Green. This depends on the value of the metric. For each type of information a more detailed description of the indicator will be provided:
• Portfolio / resource forecast For the forecast a traffic light could be used that indicates if the predictability of the forecast is within defined margins. Because a forecast requires a certain period of 3-6 months it can be useful to provide a graph with the forecast per month. This provides information about the forecast for the next 6 month. As mentioned earlier too much information makes it more difficult to control the situation. A practical solution is to use a traffic light as the primary indicator and a graph to provide information for more detailed analysis.

Proceedings 9th Software Measurement European Forum, Rome 2012
122
• Productivity (efficiency) Productivity is the average productivity of a maintenance organisation. For this average productivity a traffic light will be sufficient for management. The traffic light will show Red, Amber, or Green depending on the productivity. Of course it will be relevant for productivity to make a more detailed analysis if the traffic light becomes Red. But this detailed information is often not relevant for management.
• Estimating accuracy For estimating accuracy the same traffic light could be used. Of course it’s important to define clearly what the different lights of the traffic light mean and who is intended to take action. For example if the traffic light reacts on a single enhancement that this will not work. If should be related to a set of enhancements over a certain period of time. This period will be defined as part of the metric.
• Post release defect density Like the other information also this information could be provided as a traffic light. Another option could be for example a graph that shows the total amount of post release defects. The risk of a graph is that a manager reacts on each small change in the graph while they should react if the graph exceeds pre-defined borders.
It’s important to verify with the responsible managers what indicator to use. A traffic light provides an indication if the situation is ok (Green), if attention is required (Amber) or direct action must be taken (Red). Important is the update frequency of the traffic light because this will influence the reaction time of the manager. If for example the traffic light is updated daily the reaction time will have a maximum of 1 day. If the traffic light is updated monthly the reaction time will be 1 month. It needs to be discussed what reaction time is required.
3.1.3. Metrics In this paragraph metrics related to the information in paragraph 3.1.1 are defined. The
metrics will be input for the indicators. • Portfolio / resource forecast
The metrics for the forecast is defined as: o Resources actual for last 3 months / Expected resources for last 3 months o Actual work for the last 3 months / Work forecast for the last 3 moths
• Productivity (efficiency) The metrics for the productivity are defined as: o Hours / Size (over the last 3 months)
Proceedings 9th Software Measurement European Forum, Rome 2012
123
• Estimating accuracy The metric for estimating accuracy will be defined as: o (Actual effort enh. - Estimates enh.) / Estimates enh. * 100% o Because of the small size of the enhancements this will be measured over a
period of 3-6 months. • Post release defect density
The metric for post release defect density is defined as: o Defects found 3 months after release / Size of the release.
3.1.4. Data collection and measurements Data is the collection of measurements from different entities over a period of time.
Different entities can be different enhancements. The period of time is determined by the data required for the metrics.
Measurements are required as input for the metrics. For measurements it’s important to determine what exactly will be measured. For example if we want to measure the size of an enhancement we need to define:
• What type of sizing will be used? FPA, Cosmic FP, LOCs • When is the size determined? Based on the change request or based on the
realisation? • Is the size of a release determined as a whole or based on the size of individual
changes? • How is the size in LOCs determined?
For data and measurements it’s important to take the theory as defined in chapter 2 into
account to make the measurement system efficient and effective. 4. Conclusion To provide to managers the information required to control their organisation a
measurement system is required. Models like GQM (Goal Question Metrics) are available but for people with less experience the steps in this model are not detailed enough to determine the data and the measurements that are required to generate the metrics. To support the definition of measurements based on the required information the IMD-Model has been defined. The IMD-Model shows how the information for managers is derived from measurements from the ‘real world’ and supports in the set-up of a measurement system. Because the information is derived this information is a perception of this ‘real world’. It’s possible to bring this perception closer to what’s happening in the ‘real world’ but the questions is if this is necessary and if it’s worth the costs? Most important is that is understood what’s happening and managers are peeking over the wall to get real control.

Proceedings 9th Software Measurement European Forum, Rome 2012
124
5. References [1] Douglas W Hubbard, “How to Measure Anything”,2010 [2] Robert S. Kaplan, David P. Norton, “Balanced Scorecard, insight, experience & ideas for strategy-
focused organisations”, Harvard Business School Publishing, Volume 6, Number 1, January – February 2004
[3] Eric van der Vliet, “What aspects predict the costs of maintenance projects? Often not the size”, Proceedings SMEF 2011
[4] van Solingen, Berghout, “What aspects predict the costs of maintenance projects? Often not the size”, The MacGraw-Hill Companies, ISBSN 0077095537
[5] CMMI Product Team, “CMMI® for Development, Version 1.3”, Software Engineering Institute, CMU/SEI-2010-TR-033
[6] George Eckes, “Six Sigma Revolution”, John Wiley & Sons, ISBN 0-471-38822-X

Proceedings 9th Software Measurement European Forum, Rome 2012
125
Through the Looking Glass: What does a Tender Document actually tell you?
George Wilkie, Philip Morrow, Ian McChesney, Charlie Tuxworth
Abstract
For fixed-price contracts, the most important decision to make in a software development project is whether or not to proceed in the first place. Consequently, in a project tender situation the tender (or bid) estimate is crucial in informing this decision. The ability to successfully manage a project is dependent on developing a reliable appreciation of the required project functionality. The goal of this study is to determine what can be discerned from what the bid document does tell you, in order to identify what it does not tell you. A detailed assessment is made of how well specific types of functionality are represented in the bid documentation, and possible indicators of future growth in size are identified and evaluated. The results indicate that a detailed assessment of the required system data available at the tender stage may be used to predict the relative change in project size determined later from the complete functional specification.
1. Introduction The paradox of Software Estimation is that it is of most value when it is least accurate, i.e.
the decision to proceed with a project is often made at the point when the least information is available about the proposed system, and by the time the estimation accuracy can be assured it is no longer of any value. In a commercial tender situation an estimation of the expected development cost of a system is fundamental in deciding whether a bid should be made for the project. The accuracy of such initial estimates is limited by uncertainty surrounding the proposed system at its inception. This estimation uncertainty has been referred to as the 'Cone of Uncertainty' [1], and it has been observed that it decreases as a project progresses through its lifecycle. The estimation accuracy achievable therefore improves at later stages in the project lifecycle.
In our previous study [2], we investigated the value of software sizing at both the initial
bid stage of a project lifecycle and the later detailed functional specification, in terms of supporting the development process. This paper addresses the bid estimation problem by comparing the required functionality identifiable at the initial bid stage with the completed Functional Specification, in order to determine if 'missing' functionality could be discerned before a bid is submitted.
Proceedings 9th Software Measurement European Forum, Rome 2012
126
Section 2 outlines related work in the problems faced by bid estimation, and how more accurate software sizing is achievable as a project progresses through its lifecycle. In Section 3 the research question is posed, and Section 4 describes the main steps involved in the research study. Section 5 presents the results of the study, with our conclusions and future work discussed in the remaining sections.
2. Related Work Estimates made at the initial bid stage of a project are commonly developed from Request
for Tender (Bid) documentation written by the customer. The structure and relative detail of these documents will be subject to more variation from one customer to another than is found within internal project documentation, and consequently the estimation uncertainty will be greater at this early stage. More detailed specifications of required functionality have been shown to lead to larger estimated values being produced. In a study of a real life bidding process Jorgensen and Carelius [3] instructed one group of 17 development companies to produce a bid based firstly on a brief one page description of the proposed system, and secondly based on a more detailed 11-page requirements specification. On average, the bids developed from the detailed specification were 73% higher. A second group of development companies in the same study, who only received the detailed specification, produced lower bids, on average, than the first group. The authors proposed the explanation that the greater uncertainty present with the brief description of required functionality leads to an overcompensation effect of building the associated risk into the bid. The subsequent reduction in estimation uncertainty was then considered to be insufficient to overcome this initial overcompensation.
The bidding process itself leads to the phenomenon of the 'Winner's curse' [4], wherein
realistic bids are less likely to be successful when there are numerous competitors. For fixed price contract projects, in particular, the selection of an overly optimistic bid is unlikely to result in either a profit for the winning development company, or an entirely satisfactory system for the customer. Assessing the accuracy of estimates simply by comparing the overall actual magnitude against the overall estimated magnitude may provide an unrealistic indication of the relative success of a project estimate. This study assesses the differences between the initial identification of the requested functionality, as outlined in the bid documentation, and the later detailed specification of the functionality.
Agile development practices have become more prevalent in industry, but the bidding
process typically requires an estimate based on the overall project. Jamiesen et al. [5] propose that the tender procurement process must also adopt agile principles in order to minimise the extent of estimation uncertainty at the bidding stage.

Proceedings 9th Software Measurement European Forum, Rome 2012
127
Applying a bidding process to each iteration of the project effectively ensures small projects, and may enable the estimation accuracy of each phase to improve as actual data from previously completed phases becomes available. This approach would, however, require a fundamental change in the customer-supplier tender relationship from what commonly exists in industry.
Estimates are often used at different stages in the project lifecycle, and may differ in
magnitude in part due to the required functionality evolving as the project progresses. In some development companies as many as six estimates; made at different lifecycle stages; have been observed for a software project [6].
Agresti et al. [7] demonstrated how system detail developed during the various stages of
design could be utilised to facilitate more accurate size estimates as the project progresses through the lifecycle. Zivkovic et al. [8] found that early size estimates had, on average, a relative error of 40% compared to those estimates developed from subsequent more detailed documentation. Demirors and Gencel [9] developed Function Point estimates at five separate stages of requirements analysis for a project module. The size obtained increased at each stage, rising from an initial 940 Function Points (FP) to 2089 FP. This highlights the inadequacy of the size estimates developed from the initial high level documentation, and introduces the prospect of learning from subsequent estimates later in the lifecycle. Can the reasons for these variations be identified and used to inform bid estimation in future projects?
In our previous research we developed software size estimates at both the bid stage and
the detailed functional specification of the project lifecycle for six commercial projects. In each case the functional size was found to be larger when determined at the detailed stage, with the relative increase in size ranging from 1.96% to 87.56%. The study in this paper aims to understand the reasons for this pattern and determine if the lessons learnt can be used to inform future size estimates made at the bid stage of the project.
The reasons for less accurate initial estimates may include imprecise descriptions of the
required functionality effectively hiding the complete requirements; an incomplete consideration or understanding of the required functionality; the customer changing the requirements as the project develops; the inability of the estimation approach to adequately assess the required functionality based on the available detail. Compared to expert-based estimation approaches, model based estimation approaches are more reliant upon detailed input data and may therefore be more affected by imprecision in bid documentation. Expert based approaches may therefore be able to more effectively 'fill in the gaps' and compensate for the lack of detail.
Proceedings 9th Software Measurement European Forum, Rome 2012
128
However, as these approaches are more subjective they may be more prone to be influenced by other factors. Expert judgement has been shown to be affected by the presence of irrelevant information, such as the expectations of the customer, even when the estimators were explicitly instructed to disregard this information [10]. Managerial pressures may also affect the estimate, such as the desire to win the contract by providing a lower bid than the competitors. Model based approaches provide a more objective approach, and therefore are less likely to be affected by other factors. The degree of objectivity may be affected by the lack of detail limiting the ability of the estimator to identify the required input detail, and there may also be a greater reliance on making assumptions on what functionality is required. During the initial stages of a project it may only be feasible to utilise a simplified version of model based estimation which requires less input detail. Regardless of this, the greater rigour involved even in simplified model based approaches may enable functionality to be more accurately identified, or it may indicate where functionality would be expected but has not been specified.
In the event that the size of the system is found to differ significantly from the size
determined at the initial bid stage, the damage has effectively already been done. It is therefore of interest to determine if reasons for this variance in size may be assessed at the initial bid stage of a project. After the full functional specification is available there is limited scope for improving the accuracy of the size estimate because the uncertainty surrounding the system functionality has been minimised. The extent to which the software size is one of the factors affecting the uncertainty regarding effort required to develop the system is therefore less pronounced. This paper, therefore, is focused on comparing the software size estimate based on the initial bid documentation and the later functional specification.
3. Research Questions This study is concerned with assessing the effect of having a more detailed specification of
required functionality, by comparing the functional size estimates developed from the bid and full functional specification documents. Evaluating the evolving profile of specific types of functionality enables us to establish an appreciation of the nature of expected functionality missing from bid-level documentation that needs to be considered in any estimates produced. Consequently, the extent to which a tender document at the bid stages conforms to this expectation may facilitate an assessment of the risk that a project may change in size as a more detailed specification of the requirements is developed. The identification of potential indicators of future growth in functional size would provide further value to both the tendering and project planning processes.

Proceedings 9th Software Measurement European Forum, Rome 2012
129
The research questions of this study are: RQ1 - Can a detailed assessment of the profile of required functionality at two distinct stages in the project lifecycle provide a validation of the adequacy of requirements documentation at the bid stage of a project. RQ2 - Do overall indicators of potential future growth exist in bid documentation?
4. Research Approach In order to relate this research to the practical bid situation, the study was completed with
the assistance of a local software development company, Equiniti-ICS. The company, formerly known as ICS Computing Ltd, has been in operation since 1966. The software development work of Equiniti-ICS has primarily been focused on providing Enterprise solutions for the public sector, health trusts, payroll, accounting and financial domains. This has involved the development of both bespoke and framework products, utilising approximately 95 staff directly for this purpose. This study involves commercial projects provided by the company, and incorporates a consideration of their current bid estimation approach. The projects in this study were completed on a fixed-price contract basis, which places greater emphasis on developing accurate estimates at the initial bid stage.
Software sizing using the NESMA functional sizing approach [11] was completed on six
commercial projects, using requirements documentation from two distinct stages of the project lifecycle. Each of the projects involved data driven applications, and generally took the form of Case Management Systems. A relational database was developed in each case, with a Graphical User Interface. The development languages used were .NET/C# and Visual Basic 6. Five of the projects were developed using a Waterfall Methodology, while the remaining project utilised an agile approach, elements of which are incorporated into the company’s standard development approach. However, in each case the requirements documentation took the same format and covered the complete system. The use of an agile development approach in the last project would therefore not have impacted on the size estimates developed in our research. The requirements documentation at the bid stage generally took the form of Request for Tender documents produced by the customer. The later Functional Specifications (referred to in the results as the Detailed Stage) were produced by the development teams (ranging between 3 and 9 members in each project), and were comprised of Use Case Descriptions, Report Descriptions and a detailed Data Model.

Proceedings 9th Software Measurement European Forum, Rome 2012
130
When estimating using NESMA, the estimation output detail included the listing of each identified Base Functional Component (BFC). The five types of BFC specified by the NESMA approach are:
• Internal Logical File (ILF), External Interface File (EIF) • External Input (EI), External Inquiry (EQ) and External Output (EO)
The IFPUG functional sizing method [12] uses these same components, so the research approach adopted in this study is compatible with the IFPUG method. Each instance of a BFC was categorised according to the type of functionality it represented in order to develop a more detailed profile of each project. An overall functional size for each functionality type was produced by adding the function point values, determined during the NESMA functional sizing, for each BFC assigned to that specific type. An assessment was made of the relative change in functional size, from the original bid estimate to the subsequent detailed functional specification estimate, according to these types of functionality.
The types of functionality utilised in this study were: • Internal Logical Files:
Covers any file maintained by the system to be developed. This type is identical to the ILF component.
• External Interface Files: Covers any file accessed by this system, but which is maintained by an external application. This type is identical to the EIF component.
• Add Functionality: Covers any function concerned with adding a new record to a file within the system. This type is a subset of the EI component.
• Link Functionality: Covers any function concerned with linking records from different files together, by creating a new record in a 'link' file e.g. a Case Document record for linking a Document record to a Case record. This type is a subset of the EI component.
• Amend Functionality: Covers any function concerned with the general modification of a record within a file. This type is a subset of the EI component.
• Process Functionality: Covers any function concerned with amending existing details of a record through the completion of a specific business process e.g. Approve Recommendation. This type is a subset of the EI component.
• Delete Functionality: Covers any function concerned with removing a record from the system, or marking the record as deleted in the system. This type is a subset of the EI component.

Proceedings 9th Software Measurement European Forum, Rome 2012
131
• Search Functionality: Covers any function concerned with searching for records within the system, in particular the provision of the search results where more than one record matches the search criteria. This type is a subset of the EO component.
• Output Functionality: Covers any function concerned with providing output detail, typically for an individual case, for a specific business process e.g. Create Document Bundle. This type is a subset of the EO component.
• Report Functionality: Covers any function concerned with producing reports, typically involving many records, e.g. Total Number of Open Cases report. This type is a subset of the EO component.
• List Functionality: Covers any function concerned with listing numerous records within a particular file e.g. listing all the System users, or listing all the records corresponding to associations between files e.g. listing all the Events associated with a Case. This type is a subset of the EO component.
• Query Functionality: Covers any function concerned with displaying the details from a specific record e.g. a record selected from a list of search results, and where no additional processing was required in producing the output. This type is identical to the EQ component.
The selection of these types of functionality is a reflection of the nature of the systems
developed in the sample projects. The development of the software size estimates facilitated a detailed understanding of the main types of functionality required in these Case Management Systems. In order to assess the significance of any changes in functional size within these types, a comparison was made of the percentage contribution that each type made to the overall functional size of the project at both the bid and detailed stages.
The next stage of the study was to consider an assessment of the relative completeness of
the bid documentation available for each project, and therefore the potential inaccuracy of the developed estimates at that stage. In developing estimates, Equiniti-ICS assesses its confidence in the level of description provided in the bid documentation, in addition to analysing the content of the bid document. This would include perceived expertise of the customer's personnel involved in the production of the bid documentation, the number and nature of queries made on the bid document and responses received. This provides an indication of the customer's understanding of the proposed system, and in turn of the completeness of the required functionality.

Proceedings 9th Software Measurement European Forum, Rome 2012
132
This approach relies on the expertise of the estimator in making subjective assessments and it can therefore be difficult to transparently justify such judgements. This study seeks to develop a more objective basis to assist with such deliberations, by evaluating the correlation of overall metrics with relative changes in project size.
5. Results The results of the functional sizing, according to specific types of functionality, are used
to assess the overall functional profile of the sample projects at both the bid and the detailed stage of the lifecycle. The correlation between specific overall metrics and the relative change in project functional size is then used to determine their suitability as indicators of future change in the size of a project. A simple metric for establishing the relative change in functional size from the functional specification, without the need for developing a software size estimate, is also evaluated.
5.1. Overall Functional Profile Table 1 shows the overall average for each type of functionality in terms of the percentage
change in size (from bid to functional specification), measured in FP. In order to assess the significance of each change, the overall average percentage contribution to the overall functional size is also shown at each stage.
Table 1: Overall Averages Factor Average Percentage
Change in FPAverage % of Overall
Bid SizeAverage % of Overall
Detailed Size
Internal Logical Files 21.64% 20.32% 17.61%
External Interface Files 62.50% 0.58% 1.03%
Add Functionality 10.86% 12.05% 8.88%
Link Functionality 8.23% 4.20% 2.33%
Amend Functionality 117.41% 6.18% 8.82%
Process Functionality -21.46% 11.79% 6.19%
Delete Functionality 324.00% 1.66% 4.19%
Search Functionality 309.09% 8.61% 13.59%
Output Functionality -12.31% 10.56% 5.17%
Report Functionality 54.37% 8.51% 7.09%
List Functionality 486.00% 6.66% 17.01%
Query Functionality 191.07% 5.09% 6.99%
The overall pattern for Internal Logical files shows a moderate increase, so while individual projects may exhibit significant increases in this area, no consistent pattern is evident.
Proceedings 9th Software Measurement European Forum, Rome 2012
133
External Interface Files were insignificant in the context of the examined projects – contributing only 0.58% and 1.03% of the complete system as measured from bid and functional specifications respectively.
For the External Input related functionality there were increases in 'Delete' functionality
found in each project, with relatively large increases in some cases. However, the relative impact of these increases is limited by the modest proportion of the overall functional size this category represents. This type of functionality was rarely explicitly mentioned in the bid documentation, but as it subsequently became evident in the Functional Specification for only some projects, it cannot be assumed to be required from general 'maintenance' requirement statements in the bid documentation. The 'Amend' functionality also provided increases in each project and represents a more significant category of functionality. The impact of such increases varied across projects and demonstrated a high degree of correlation with the overall size increases for each project. 'Process' functionality demonstrated a moderate overall decrease, with most projects experiencing a decrease in this area. This may be a reflection of the extent to which Bid documentation, written by the customer, describes functionality in business process terms when, in practice, it is more generic 'Add' and 'Amend' functionality that is ultimately specified. The Director at Equiniti-ICS indicated that business processes were prevalent in the background of more generic functionality and were significant factors affecting the effort required to develop each system. The true extent to which this type of functionality contributes to the overall project may not therefore be explicitly determined in this study.
For the External Output related functionality the most consistent factor across the sample
projects that leads to an increase in functional size is the 'List' functionality. Only one project did not exhibit a significant increase in this category, but in this case it became apparent in the functional specification that, unlike the other projects, viewing lists of related records was to be predominantly catered for by firstly eliciting search criteria from the user. Consequently, this functional size growth occurred in the 'Search' rather than the 'List' category. The prominence of the 'List' category increased significantly at the detailed stage, and now represents the most significant type of transaction function. The 'Search' functionality also provided increases in each project and at the detailed stage now represents the next most significant type of transaction function. However, as indicated above, there were possible reasons why these increases may appear to be more significant than is actually the case in practice. There were some significant increases and decreases in 'Report' functionality, so no overall pattern was evident.
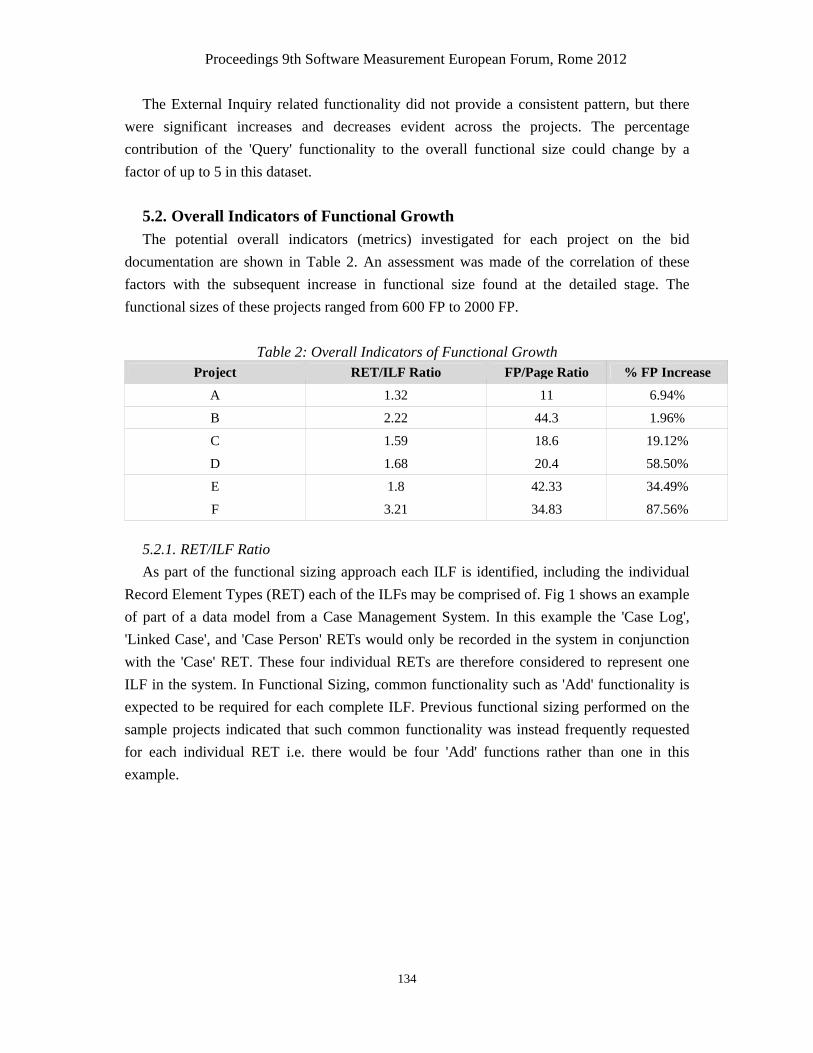
Proceedings 9th Software Measurement European Forum, Rome 2012
134
The External Inquiry related functionality did not provide a consistent pattern, but there were significant increases and decreases evident across the projects. The percentage contribution of the 'Query' functionality to the overall functional size could change by a factor of up to 5 in this dataset.
5.2. Overall Indicators of Functional Growth The potential overall indicators (metrics) investigated for each project on the bid
documentation are shown in Table 2. An assessment was made of the correlation of these factors with the subsequent increase in functional size found at the detailed stage. The functional sizes of these projects ranged from 600 FP to 2000 FP.
Table 2: Overall Indicators of Functional Growth
Project RET/ILF Ratio FP/Page Ratio % FP Increase
A 1.32 11 6.94%
B 2.22 44.3 1.96%
C 1.59 18.6 19.12%
D 1.68 20.4 58.50%
E 1.8 42.33 34.49%
F 3.21 34.83 87.56%
5.2.1. RET/ILF Ratio As part of the functional sizing approach each ILF is identified, including the individual
Record Element Types (RET) each of the ILFs may be comprised of. Fig 1 shows an example of part of a data model from a Case Management System. In this example the 'Case Log', 'Linked Case', and 'Case Person' RETs would only be recorded in the system in conjunction with the 'Case' RET. These four individual RETs are therefore considered to represent one ILF in the system. In Functional Sizing, common functionality such as 'Add' functionality is expected to be required for each complete ILF. Previous functional sizing performed on the sample projects indicated that such common functionality was instead frequently requested for each individual RET i.e. there would be four 'Add' functions rather than one in this example.

Proceedings 9th Software Measurement European Forum, Rome 2012
135
Figure 1: Sample Data Model
The bid documentation provides a less detailed description of the system requirements, so while individual RETs may be identifiable the specific associated functionality may not be requested. The ratio of RETs to ILFs, for each project, may therefore provide an indication of hidden functionality at the bid stage.
Figure 2 (a – left, b – right)
Figure 2a shows that there is a moderately strong correlation of 0.67, but the point for Project B (2.22, 1.96) seems to be an outlier in this case. Discussions with the management at Equiniti-ICS revealed that this project was the second stage of an ongoing development. Consequently, there was a lower level of uncertainty regarding the required functionality for this project, supporting its characterisation as an outlier in this study.

Proceedings 9th Software Measurement European Forum, Rome 2012
136
By removing this point from the calculation a statistically significant correlation of 0.88 is found, indicating that this factor may provide a good indication of the potential future change in functional size.
For each of the projects examined, the bid documentation did not provide a data model for
the proposed system. The current estimation method employed by Equiniti-ICS involves the identification of the main system entities, analogous to the ILFs. In Project F, which experienced the most significant growth in functional size, the company's estimate identified 29 entities, while our functional sizing identified 27 ILF. However, our size estimate identified 90 RETs, resulting in the highest RET to ILF ratio of 3.21. In the absence of a data model in the bid documentation, this indicates the value of developing a more detailed derivation of the required data model for the system.
5.2.2. FP/Page Ratio
Figure 3 (a – left, b – right) The average amount of functionality identified on each page of the bid documentation (i.e.
the FP/Page Ratio) provides a more considered appreciation of the size of this documentation. Figure 3a shows that there is only a very weak correlation of 0.12 between this ratio and the increase in functional size. However, Project B (44.3, 1.96) again seems to provide an outlying value. Removing this value produces Figure 3b, which shows a moderate correlation of 0.53. This suggests there may be some relationship between these variables, but for this dataset it would not be sufficient to provide any more than a rough indication of potential growth in functional size.

Proceedings 9th Software Measurement European Forum, Rome 2012
137
5.3. Functional Specification Page Size The value of determining the software size at a later detailed stage of the project lifecycle
diminishes, relative to the value obtained at the beginning of a project, so there may be perceived to be less justification for developing detailed size estimates at this stage. Consequently, it would also be useful to identify at the detailed stage whether the functional size has increased without having to perform software sizing at this later stage. An examination was therefore made of the correlation of any growth with the relative increase in size of the requirements documentation from the bid documents to the functional specification.
Table 3: Comparison with Function Specification Page Size
Project % Page Increase % FP Increase
A 100.00% 6.94%
B 433.33% 1.96%
C 133.33% 19.12%
D 383.33% 58.50%
E 700.00% 34.49%
F 1133.33% 87.56%
Figure 4a indicates a statistically significant correlation of 0.78, with Project B (433.33, 1.96) again seemingly providing an outlying value. Figure 4b shows an even stronger correlation of 0.86 when the value for Project B is removed. These results suggest that the relatively simple consideration of the relative change in page size may provide a useful indication of an increase in functional size.
Figure 4 (a – left, b – right)

Proceedings 9th Software Measurement European Forum, Rome 2012
138
6. Conclusions This study has considered the extent to which the profile of functionality required for a
system may be discerned from an appreciation of the bid documentation and consideration of overall indicators of prospective functional growth.
• RQ1 - The assessment of specific types of functionality indicated that in some cases
e.g. 'List' functionality, the initial bid documentation generally omitted an explicit statement of required functionality. However, the business oriented requirements focus of this bid documentation presents a challenge for recognising standard types of functionality.
• RQ2 - In terms of identifying the potential for significant growth in the functional size, as determined from more detailed specifications, the RET/ILF ratio provided promising results from this sample dataset.
The type of the Case Management Systems examined in this study can be considered to be
standard to this sector of the development industry. This lends a degree of general applicability to the results presented in this study. However, the nature of the assessment of these projects is specific to this type of system, so the applicability beyond this industry sector may be limited.
7. Future Work Our previous research has involved the adaptation of the simplified versions of NESMA
functional sizing in order to better approximate the full NESMA method. The next stage is focused on applying the lessons learned from the results presented in this study to enabling the risk associated with the bid stage of a project to be incorporated into the development of functional size estimates at that stage. Our simplified adaptations provide an overall profile of the required functionality, so they support the application of an 'expected' profile based upon previous experience.
8. Acknowledgements The research team gratefully acknowledges the access to staff and documentation, and
participation of Equiniti-ICS in this project. In particular, thanks is due to Charlie Tuxworth, Director at Equiniti-ICS, for his ongoing commitment to this work.

Proceedings 9th Software Measurement European Forum, Rome 2012
139
9. References [1] McConnell, S., “Software Estimation: Demystifying the Black Art”, Microsoft Press, Redmond, VA,
2006. [2] Wilkie, F.G, McChesney, I.R, Morrow, P,, Tuxworth, C., and Lester, N.G., “The Value of Software
Sizing, Information and Software Technology”, 53(11), (2006), pp 1236-1249 [3] Jørgensen, M., and Carelius, G.J., “An Empirical Study of Software Project Bidding”, IEEE
Transactions On Software Engineering, 30 (12), (2004), pp 953-969. [4] Jørgensen, M., and Grimstad, S., “Over-optimism in Software Development Projects: ‘The Winner's
Curse’”, Proceedings IEEE Conference in Electronics, Communications, and Computers (CONIELECOMP), IEEE CS Press, pp 280–285, (2005).
[5] Jamieson, D., Vinsen, K., Callender, G., “Agile Procurement: New Acquisition Approach to Agile Software Development”, EUROMICRO Conference on Software Engineering and Advanced Applications (EUROMICRO-SEAA '05), pp 266-273, (2005).
[6] Molokken-Ostvold, K., Jorgensen, M., Tanilkan, S. S., Gallis, H., Lien, A. C., & Hove, S. E., “A survey on software estimation in the Norwegian industry”, 10th International Symposium on Software Metrics, Proceedings, 14-16 September, pp 208-219, (2004).
[7] Agresti, W.W., Evanco, W.M., Thomas, W.M., “Models for improving software system size estimates during development”, Journal of Software Engineering and Applications, 3, (2010), pp 1–10.
[8] Zivkovic, I. Rozman, M. Hericko, “Automated software size estimation based on function points using UML models”, Information & Software Technology, 47 (13), (2005), pp 881–890.
[9] Demirors, O. and Gencel, C., “A Comparison of Size Estimation Techniques Applied Early in the Life Cycle”, European Software Process Improvement Conference (EurSPI 2004), Springer Verlag Springer Lecture Notes in Computer Science (LNCS), Vol.3281, pp 184-194, (2004).
[10] Jørgensen, M., and Grimstad, S., “Avoiding Irrelevant and Misleading Information when Estimating Development Effort”, IEEE Software, 25 (3), (2008), pp 78-83.
[11] NESMA., “Definitions and counting guidelines for the application of function point analysis NESMA Functional Size Measurement method compliant to ISO/IEC 24570 version 2.1”. Published by the Netherlands Software Metrics Association, November 2004, ISBN: 978-90-76258-19-5.
[12] IFPUG., “The Function Point Counting Practices Manual version 4.3.1”, published by the International Function Point Users Group (IFPUG), January 2010, www.ifpug.org

Proceedings 9th Software Measurement European Forum, Rome 2012
140

Proceedings 9th Software Measurement European Forum, Rome 2012
141

Proceedings 9th Software Measurement European Forum, Rome 2012
142

Proceedings 9th Software Measurement European Forum, Rome 2012
143
CONFERENCE PROGRAM

Proceedings 9th Software Measurement European Forum, Rome 2012
144

Proceedings 9th Software Measurement European Forum, Rome 2012
145

Proceedings 9th Software Measurement European Forum, Rome 2012
146

Proceedings 9th Software Measurement European Forum, Rome 2012
147
Software Contract Management by metrics: a methodological framework P: Roberto Meli (DPO Italy)
This presentation will introduce a conceptual and operational framework for the
application of the software measurement discipline within the context of a contractual relationship between customer and supplier. Any given contractual agreement regarding software acquisition requires a specific implementation of a measurement model. A Contractual Measurement Model is a set of answers to the following questions:
• Why to measure? (business goals) • What to measure? (nature of an ad-hoc software supply, scope of work, on going
change request, cancelled activities, reuse and replication) • How to measure? (contractual scheme, measurement method, process and tools) • When to measure? (during the contract life cycle) • Who will measure? (role and responsibilities)
Parametrics in contracts is also beneficial for suppliers P: Ton Dekkers (Galorath International Netherlands / UK)
In a tender the supplier has to commit to the rules defined by the customer. In this case the
customer wanted an all-inclusive price per function point for a given project size. The supplier’s experience with this type of tender was very limited. This case describes the approach and the challenges to get in the end to a successful project tender.
• Validating project size with (NESMA) Function Point Analysis • Validation and Verification performance based on ISBSG data and SEER for
Software • Convince supplier management on a competitive bid based on parametric model
When Metrics Mean Business A: Maurizio Aguiar (TI Metricas Brasil) P: Maurizio Aguiar (TI Metricas Brasil)
Measurement specialists often wonder why so many Brazilian organisations use functional size as a basis for software development contracts. Brazilian organisations from several industries such as banks, airlines, telecommunication companies, and government agencies use function points as a basis for software development contracts.

Proceedings 9th Software Measurement European Forum, Rome 2012
148
The Brazilian government has issued a directive known as “IN04” instructing all government agencies to use metrics - usually function points - in software development contracts to define productivities, prices, and quality criteria. In those organisations most software development services are billed based on the functional size.
Even support activities such as measurement and testing have been known to be billed
based on function points. Function point analysis is now an indispensable part of the business cycle and a daily activity in many organisations. This presentation discusses the business drivers that have made Brazil the number one user of function points in the world, as well as the business processes involved.
• Why and how Brazilian organisations use functional sizing in software development contracts
• How the functional size supports contract objectives for both the acquirer and supplier • Technical considerations related to the use of function points in contracts • Benefits and challenges to be aware of when using function points in contracts
Beyond perception: Peeking over the wall to get real control... A: Paul Siemons (Metrific Solutions, Netherlands), Eric van der Vliet (Logica, Netherlands) P: Eric van der Vliet (Logica Netherlands)
Management in an organisation have the role to control their environment with the
intention to achieve their objectives. Objectives for managers are derived from organisation level objectives and often defined by means of KPI’s. The focus of KPI’s is mainly on financial, productivity, quality or elapsed time aspects. By all means will these aspects influence the contracts, therefore it’s relevant whether the information the decisions are based on is perception or reality. To reduce the gap between perception and reality the IMD-Model has been defined.
The IMD-Model offers: • Validating information: perception or reality • Support of management decisions: to tender or not to tender • Model based control on information provided by a measurement system

Proceedings 9th Software Measurement European Forum, Rome 2012
149
Through the Looking Glass: What does a Tender Document actually tell you? A: Paul Morrow, F.G. Wilkie, Ian McChesney (School of Computing & Mathematics, University of Ulster Northern Ireland - UK), Charlie Tuxworth (Equiniti-ICS Ltd., Northern Ireland, UK) P: George Wilkie (School of Computing & Mathematics, University of Ulster Northern Ireland - UK)
For fixed-price contracts, the most important decision to make in a software development
project is whether or not to proceed in the first place. Consequently, in a project tender situation the tender (or bid) estimate is crucial in informing this decision.
The goal of this study is to determine what can be discerned from what the bid document does tell you, in order to identify what it does not tell you
• Q1 - Can a detailed assessment of the profile of required functionality at two distinct stages in the project lifecycle provide a validation of the adequacy of requirements documentation at the bid stage of a project.
• Q2 - Do overall indicators of potential future growth exist in bid documentation? The (Functional) Size Metric used is (NESMA) Function Points
Successful software projects - how to limit the risk of failures! A: Harold van Heeringen (Sogeti Netherlands) P: Harold van Heeringen (Sogeti Netherlands)
This paper focuses on selecting a single supplier for the development of a custom made software realisation project, while keeping in mind that the project should be successful! Half of the project success is already determined before the start of the project, agreeing on the right contract in the sourcing phase.
Following items will be addressed: • The questions you should ask the supplier to answer in their proposal • Why it is important to select a realistic proposal, not just the cheapest one • How to assess the reality value of the proposals of the different suppliers • Which KPI’s should be defined to make the contract work

Proceedings 9th Software Measurement European Forum, Rome 2012
150
How to state a fair unitary cost for FP in a tender context A: Roberto Meli (DPO Italy) P: Roberto Meli (DPO Italy)
There are two main paths to state the base or a Public Tender. The first one is to rely on previous similar assigned contracts and their unitary prices adopting averages or min-max values (market approach). The second one is to build a specific unitary price considering expected average productivity, adjustment factors, resources mix, unitary human resource costs, life cycle phases and distribution of effort and roles (constructive approach).
The same approaches may be used by the supplier in the offering phase. The second approach is generally more adequate since it allows to purify the process from the usual distortions due to the “offer to win” approach associated to the expectation of absence of control in contract execution.
This presentation will discuss these aspects giving a detailed proposal for the constructive approach but also an overview of the market approach with unitary prices in different countries.
• Unitary price construction; • Avoid “offer to win” distortions; • Keep contract in control after assigning it.
The meaning of software measurement in a contractual relationship A: Marco Gentili (Formit Servizi, Italy), Pierfranco Gennai (Italy) P: Pierfranco Gennai (Italy)
Functional Measurement was developed aseptically in the research field of Software Engineering. When it is used in a contractual context, in order to manage the customer/supplier relationship, it is associated with a number of degenerative non-academic interpretations that can produce real diseases, both during the procurement process of software development services, and in the execution phase of the corresponding contracts.
For this reason DigitPA (formerly CNIPA) decided to treat the functional measure issue in
its “Guidelines on the quality of ICT assets and services for the establishment and governance of ICT contracts in Public Administration”, without forgetting the need for non-functional measurements too.

Proceedings 9th Software Measurement European Forum, Rome 2012
151
• The easy way to escape: I am not able to make a “turn key” tender, I do not make Feasibility Study, I do purchase “by metrics”, will I be able to use the balance?
• The myth of FP unitary cost: FP is not a currency; • Pseudo estimation: backfiring from costs; • Why considering only Software Functionalities? • A missing opportunity (until now): measuring to manage, knowing to control, where
is the Public Administration Projects Repository?
A practical approach to validate actual functional size measures in a contract A: Marco Arzilli, Franco Perna (DPO Italy) P: Marco Arzilli (DPO Italy)
The customer verification of functional size measures provided by the supplier in the acceptance phase is a critical activity for the correctness of contract execution. A lack of control, both in depth and in scope, can lead to relevant deviations of the unitary price accepted in the bid assignment process, with potential consequences in terms of unfairness or, in some cases, illegality.
In the presentation we’ll show an efficient and rigorous approach to validate supplier’s functional size measures. The approach is rigorous, since it defines clear and unambiguous game roles and efficient, in order to spend the right effort to achieve the right confidence about suppliers functional size measurement capabilities.
The approach consists in an incremental sampling technique that allows the customer to adjust the validation effort on the quality level of size measures provided by the supplier, detected by the gap among these measures and the ones checked and validated on a sampling base.
The approach provides also a simple classification of main causes for this measure’s deviation, useful to improve both the measurement and the validation process.
• How to satisfy compliance with contractual prices; • Validating supplier functional size measures: why, when and how; • Adopting an efficient validation process is possible: a practical guide to do this.

Proceedings 9th Software Measurement European Forum, Rome 2012
152
Software Comprehensive Count with Quality Indicators (SCCQI) A; Jasveer Singh (EUSFP Belgium) P; Jasveer Singh (EUSFP Belgium)
As software size measurement is one of the most important activities in the software development lifecycle, the methodology used for estimating the size should be able to measure the size comprehensively. That means that all the software constituents should be considered for measuring the size and a proper translation of the measured size to the effort estimate should be possible.
Software Comprehensive Count with Quality Indicators (SCCQI) is a methodology that offers an elaborate and comprehensive measurement of size, a more realistic effort estimate (as a result of using 26 extensive measures of counting) and important and valuable Key Software Indicators (KSI’s).
The realistic estimate and the KSI’s are very useful in: • the bid process (supplier) • the validation process (customer) • defining controllable delivery criteria in contracts
Key Performance Indicators for ICT Services A: Thomas Fehlmann (Euro Project Office AG, Zurich, Switzerland) P: Thomas Fehlmann (Euro Project Office AG, Zurich, Switzerland)
Services related to Information and Communication Technology (ICT) play a major role for an organisation's commercial success and are highly predictive for its prestige with employees, customers and in public opinion, and thus for future business.
Despite their strategic importance, ICT services are often outsourced and contracted to service providers. Organisations need early indicators for trends affecting ICT services, since loss of employees and of customers invariably ends with loss of market share and profit.
Such indicators can be used to determine on variable compensation and incentives for quality service. Functional size and defect density play a major role; however, the worst kind of defects in ICT services is missing market expectations or not understanding new market requirements when doing business over the internet and supported by ICT. How should such defects be handled in contracts?
This paper gives an overview about state of the art in social media times and proposes a comprehensive set of Key Performance Indicators that should help organisations contracting reliable ICT services.

Proceedings 9th Software Measurement European Forum, Rome 2012
153

Proceedings 9th Software Measurement European Forum, Rome 2012
154

Proceedings 9th Software Measurement European Forum, Rome 2012
155
Author’s Affiliations

Proceedings 9th Software Measurement European Forum, Rome 2012
156

Proceedings 9th Software Measurement European Forum, Rome 2012
157
Mauricio Aguiar TI Metricas, Brazil [email protected] 1 When metrics mean business
A software measurement specialist with a background in Statistics, Mauricio has held
several positions in software management over the last two decades. He has taught courses in Brazilian universities and was one of the founders of the Project Management Institute Rio Chapter in 1998. He holds a bachelor’s degree in Engineering from the Federal University of Rio de Janeiro.
Mauricio was elected President of the International Function Point Users Group (IFPUG) for 2005-2007 after serving on the IFPUG Board since 2000. He was certified as a Function Point Specialist (CFPS) by IFPUG in 2000. Mauricio currently serves as IFPUG Director of International & Organizational Affairs, and is also a member of the COSMIC International Advisory Council.
Mauricio is also a Qualified PSM Instructor certified by the PSM Support Center of the
US Army in 2002, having received the “PSM Contribution Award” in 2010 for his accomplishments in the development and transition of the method.
A member of IFPUG, PMI, IEEE, INCOSE, and a senior member of ASQ, Mauricio has published articles on Developers' Magazine (Brazil), Cutter IT Journal (USA), and Crosstalk (USA). He has served as a reviewer for the IEEE Software magazine and is currently a reviewer for the Journal of Systems and Software.
Mauricio has presented at several conferences in the USA, Brazil, Argentina, and Korea.
For years he has been involved with the implementation of function point analysis and metrics programs in many Brazilian and multinational organisations.

Proceedings 9th Software Measurement European Forum, Rome 2012
158
Marco Arzilli DPO srl, Italy [email protected] 13 A practical approach to validate actual functional size measures in a contract
Marco Arzilli has more than 20 years of experience in ICT, mainly in the area of project management, software measurement and IT governance. In the last years he held management positions in consulting companies both in selling activities and in program management for several ICT contracts.
As a certified professional in project management (PMP®), software measurement (CFPS)
and service management (ITIL®) he currently works as senior consultant and accredited trainer on such these disciplines for many major Italian companies and public organisations.
Previously he has worked on ICT program & portfolio management, ICT contract
monitoring, feasibility studies, software quality assurance and software testing for many organisations, both in public and in private sectors. At the moment, he is senior consultant and business development executive in DPO srl.
Ton Dekkers Galorath International Ltd, United Kingdom / Netherlands [email protected] 35 Parametrics in contracts is also beneficial for suppliers
Ton Dekkers is working as a practitioner, consultant, manager and trainer within the area
of project support, software measurement and quality assurance for over 20 years. Within these areas he specialises in estimating, performance measurement (Sizing, Goal-Question-Metric, Benchmarking), risk analysis and scope management.
He holds a position as Director of Consulting for Galorath International. In addition to his
regular job he is board member of International Software Benchmarking Standards Group (ISBSG) as Past President, President of the Netherlands Software Measurement Association (NESMA), member of the International Advisory Committee of COSMIC and member of the SIG parametric analysis of the Dutch Association of Cost Engineers.

Proceedings 9th Software Measurement European Forum, Rome 2012
159
Dr. Thomas Fehlmann Euro Project Office AG, Zurich, Switzerland [email protected] 37 Measuring Software Development Processes with Six Sigma
Dr. Thomas M. Fehlmann wears the Six Sigma Black Belt for more than 20 years, and
gained the Akao price for excellence in Quality Function Deployment in 2001. He is Voting Member of the QFD Institute, Board Member of the German QFD Institute, SwissICT Expert for Software and Services Metrics, and Representative in the International Software Benchmarking Standard Group (ISBSG) for SwissICT.
He counsels leading companies for analysing market and customer's needs, and is text book author, a frequent speaker and teacher at international conferences.
Pierfranco Gennai freelance consultant, Italy [email protected] 45 The meaning of software measurement in a contractual relationship
Pierfranco Gennai began his activity in ICT sector in 1980 as system programmer in an
Italian government agency. He joined Arthur Andersen (now Accenture) in 1986, where he developed strong competences in the areas of project management and of software's measurement, working for several clients (mainly in Banking and Telco companies), both in Italy and abroad (Europe, South America). Many times he has been faculty at the Andersen Business School in the U.S.
He has begun to use the Function Point technique during the mid 90s in several projects at
Italian Central Bank. Since 2004 he has been working as a freelance consultant for various companies, like DPO Srl, engaged in monitoring and consultancy projects in the Italian Public Administration.
Pierfranco holds various professional certifications: Certified FP Specialist, (CFPS),
Certified Early and Quick FP Specialist, (CEQ-FPS), ITIL V3, Prince2, ISO20000 Auditor.

Proceedings 9th Software Measurement European Forum, Rome 2012
160
Marco Gentile Formit Servizi, Italy [email protected] 45 The meaning of software measurement in a contractual relationship
Marco Gentile is Executive Head of the "monitoring and training activities" in Formit
Servizi. He manages consultancy and training activities, regarding ICT Governance, Project & Program Management, Business Process Management offered to Central and Local government bodies.
Before that he was Executive Head of the "Methods for quality and organizational innovation" in CNIPA: (DigitPA today, previously AIPA). He defined the methods of ICT Governance and Project & Program Management codified in the "Guidelines on the quality of ICT goods and services for contracts definition and government in Public Administration".
He promoted the adoption of these guidelines by managing the monitoring ICT contracts
(Decree 39/93) of the central administrations; to define the amendments to the information systems year 2000 and Euro; to define e-government projects in local administrations; to define the contract monitoring connectivity of the Public Connectivity System (SPC).
Marco has a degree in Physics (University La Sapienza), and various diploma’s and
certifications e.g.; SDA Bocconi “R&D Manager” (Bocconi University), EOQ “Quality Manager” (European Organization for Quality), Project Manager" and accredited teacher (ISIPM) and EUCIP Champion “Enterprise Solutions Architect” (AICA).

Proceedings 9th Software Measurement European Forum, Rome 2012
161
Drs. Harold van Heeringen Sogeti, Netherlands [email protected] 67 Successful software project outsourcing - How to limit the risk of failures
Drs. Harold van Heeringen CFPA, works for Sogeti Nederland as a senior metrics
consultant. Harold is graduated from the university of Groningen in business economics in 1997 and he has worked in the information technology ever since.
Harold is an expert in the functional sizing methods FPA and COSMIC and he is a certified practitioner in both methods. Furthermore he is an expert on different software estimation models and benchmarking practices. In his role as metrics consultant, he advises clients on how to implement Estimating & Performance Measurement processes into their organisations and he trains people in functional size measurement, project estimation and benchmarking. Next to his consulting work, he is also heavily involved in the Sogeti estimation process for fixed-price / fixed date projects. Harold is an advanced expert in using estimation tools like QSM SLIM, SEER-SEM and the ISBSG tooling.
Next to his job, Harold is also involved in a number of metrics related communities: • Netherlands Software Metrics Association (NESMA) – board member and chairman
of the working groups COSMIC and Benchmarking • Common Software Measurement International Consortium (COSMIC) - Dutch
representative in the International Advisory Council (IAC) • International Software Benchmarking Standards Group (ISBSG) – President • Dutch Association for Cost Engineers (DACE) – SIG parametric analysis
Ian McChesney The University of Ulster, School of Computing & Mathematics, Northern Ireland, UK [email protected] 125 Through the Looking Glass: What does a Tender Document actually tell you?
Ian McChesney is a Senior Lecturer in Computing Science at the University of Ulster. His
first degree is in computer science and he has a PhD in software engineering. He is also a Member of The British Computer Society and is a Chartered Engineer. His
research interests have been concerned with software engineering teamwork and issues in the practical application of software development techniques in complex systems.

Proceedings 9th Software Measurement European Forum, Rome 2012
162
Roberto Meli DPO srl, Italy [email protected] 13 A practical approach to validate actual functional size measures in a contract 83 Software Contract Management by metrics: a methodological framework 85 How to state a fair unitary price for FP in a tender context
Roberto Meli graduated in Computer Science in 1984. In 1996 he became CEO of DPO Srl. During the past 20 years he has developed focused competences in project management and software measurement areas and has written papers for technical magazines and international conferences. Certified Function Points Specialist (CFPS) from 1996 to 2004.
He is a consultant and lecturer in training courses on project management and software measurement for many major Italian companies and public organisations. He developed the Simple Function Point method, the Early & Quick Function Point Analysis method, managing the implementation of the Sfera product. In the last 20 years he had the following roles: chairperson of the board of Directors of GUFPI-ISMA (Gruppo Utenti Function Points Italia - Italian Software Measurement Association), coordinator of the GUFPI - ISMA Counting Practices Committee; Italian delegate to the MAIN (Metrics Association’s International Network), Chairperson of the COSMIC Measurement Practices Committee and Conference Chairperson of SMEF event (Software Measurement European Forum), one of the leading European events in this area.
He has managed the GUFPI-ISMA working group which released the Italian Guide Lines
for the Contractual Usage of Function Points. This document has been then used to feed the Italian Government ICT Authority Guide Lines to be used by all Italian Public Administrations. Currently, he is President of the Simple Function Point Association (SiFPA – www.SiFPA.org).
Philip Morrow The University of Ulster, School of Computing & Mathematics, Northern Ireland, UK [email protected] 125 Through the Looking Glass: What does a Tender Document actually tell you?
Philip Morrow is a PhD student in Computing Science at the University of Ulster. His
research interests are concerned with project management, focusing on software size estimation.

Proceedings 9th Software Measurement European Forum, Rome 2012
163
Franco Perna DPO srl, Italy [email protected] 13 A practical approach to validate actual functional size measures in a contract
Franco Perna is in DPO srl Project Office Director and senior consultant in Software Measurement and ICT Project Management. He has managed the development of Sfera (the leading Italian software tool for function point analysis and estimation) and Requestimate (an add in for IBM Requisite Pro).
He was involved, as an expert member, in the activities of the Italian Software Metrics
Association (GUFPI-ISMA) and has achieved ITIL and IFPUG CFPS certifications. He has managed, as an external consultant, the measurement system in a complex contractual context of a Public Administration.
He has been involved in the evolution of the Early & Quick Function Point method.
Currently, he is chairperson of the Measurement Practices Committee (MPC) of the Simple Function Point Association (SiFPA – www.SiFPA.org).
Jasveer Singh EUSFP, Belgium [email protected] 101 Software Comprehensive Count with Quality Indicators (SCCQI)
A comprehensive approach to Software Size Measurement Mr. Jasveer Singh has about 30 years of valuable international experience in the ICT
domain having worked at top telecom manufacturer, operator, consultancy and vendor companies in different managerial roles.
His in-depth experience in the area of software development and testing led him to realise the deficiencies of the current available methodologies for software size measurements and to develop SCCQI which is a great help for software projects.
Mr. Singh holds a Master in Technology (Computer Technology) from IIT-Delhi, India as well as an Executive Master in Management from Solvay Business School, Brussels, Belgium.

Proceedings 9th Software Measurement European Forum, Rome 2012
164
Paul Siemons Metrific Solutions (Draugronth BV), Netherlands [email protected] 111 Beyond perception: Peeking over the wall to get real control…
Paul Siemons is recognised for his broad knowledge of estimation and measurement.
Working as independent consultant and building on his personal experience in many IT roles, Paul provides both guidance and hands on support for organisations willing to improve.
He typically succeeds in quickly obtaining metrics that support decision making and growth.
Paul has co-authored various publications on metrics and improving organisations,
working with Dutch universities.
Charlie Tuxworth Equiniti-ICS Ltd., Northern Ireland, UK [email protected] 125 Through the Looking Glass: What does a Tender Document actually tell you?
After graduating from Bournemouth University with a Masters’ in Computer Animation,
Charlie worked for a short time as an animator for a video production company before joining an accounting software company where he worked as an analyst and developer for four years, and gained the Certified Diploma in Accounting and Finance from the ACCA.
Charlie joined ICS Computing (now Equiniti ICS) in 1995 as a Software Engineer; was
appointed as a Divisional Manager in the Innovative Software Division in 2000; and was promoted to General Manager in 2004 taking on responsibility for process improvement and the company’s delivery of large scale, enterprise software solutions. In June 2011 Charlie was appointed as a Director within the Commercial Solutions Division of Equiniti, where he oversees a one hundred strong delivery team located between Belfast & Chennai, designing and delivering software solutions.
From his experiences with a near-shore/off-shore delivery model Charlie provides
consultancy on Application Lifecycle Management; provides industrial input to the School of Computing and Mathematics at the University of Ulster, Jordonstown; is involved in the University of Ulster’s AppCamp in Coleraine; and is also a STEMnet Ambassador promoting the uptake of science and technology in schools.

Proceedings 9th Software Measurement European Forum, Rome 2012
165
Eric van der Vliet Logica, Netherlands [email protected] 111 Beyond perception: Peeking over the wall to get real control…
Eric van der Vliet is working for Logica for 13 years in the role of improvement manager,
lead technical architect and currently in the role of manager of the Estimating & Metrics Desk. The Estimating & Metrics Desk is part of Logica’s global application maintenance organisation. The desk is responsible for the standardisation of estimating, metrication and benchmarking and for operational support of projects and proposals.
Eric has published various papers and gave presentations on national and international
conferences. He is a member of the board of the Netherlands Software Metrics Association (NESMA) and several NESMA working groups.
George Wilkie The University of Ulster, School of Computing & Mathematics, Northern Ireland, UK [email protected] 125 Through the Looking Glass: What does a Tender Document actually tell you?
George Wilkie (BSc, PhD, FBCS, CITP) started his career in the software industry as a
Software Engineer. After many years in a variety of industrial roles he accepted a Lectureship in Computer Science at the University of Ulster. His research interests are in software metrics and software process improvement.
He studied at the Software Engineering Institute in Carnegie Mellon University,
Pittsburgh (SEI) and became an SEI qualified CMMI Instructor and a SCAMPI Class A, B and C Lead Appraiser and has provided software process appraisal services to more than a dozen commercial companies ranging in size from 10 to 1000+ engineers over the past decade.
George also sits on the Editorial Board of the Journal of Software: Evolution and Process
(Wiley).

Proceedings 9th Software Measurement European Forum, Rome 2012
166

Proceedings 9th Software Measurement European Forum, Rome 2012
167

Proceedings 9th Software Measurement European Forum, Rome 2012

Proceedings 9th Software Measurement European Forum, Rome 2012

Proceedings 9th Software Measurement European Forum, Rome 2012


