44
2IS55 Software Evolution Software metrics (3) Alexander Serebrenik

2IS55 Software Evolution
Software metrics (3)
Alexander Serebrenik

Administration
/ SET / W&I PAGE 1 28-5-2012
• Assignment 5:
• Deadline: May 22
• 1-2 students
Sources
/ SET / W&I PAGE 2 28-5-2012
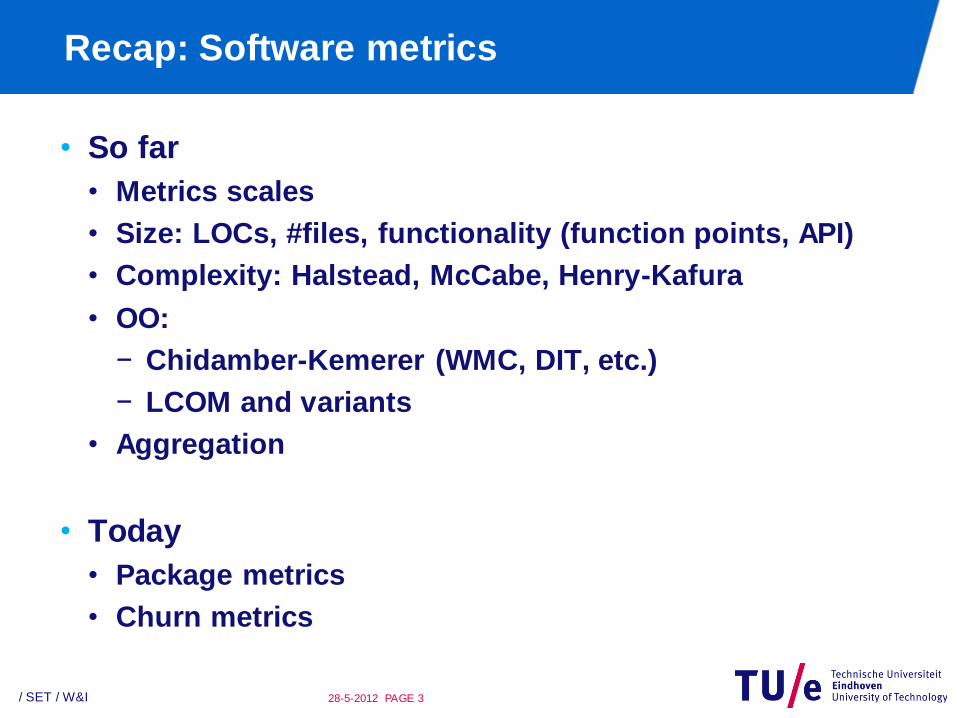
Recap: Software metrics
• So far
• Metrics scales
• Size: LOCs, #files, functionality (function points, API)
• Complexity: Halstead, McCabe, Henry-Kafura
• OO:
− Chidamber-Kemerer (WMC, DIT, etc.)
− LCOM and variants
• Aggregation
• Today
• Package metrics
• Churn metrics
/ SET / W&I PAGE 3 28-5-2012
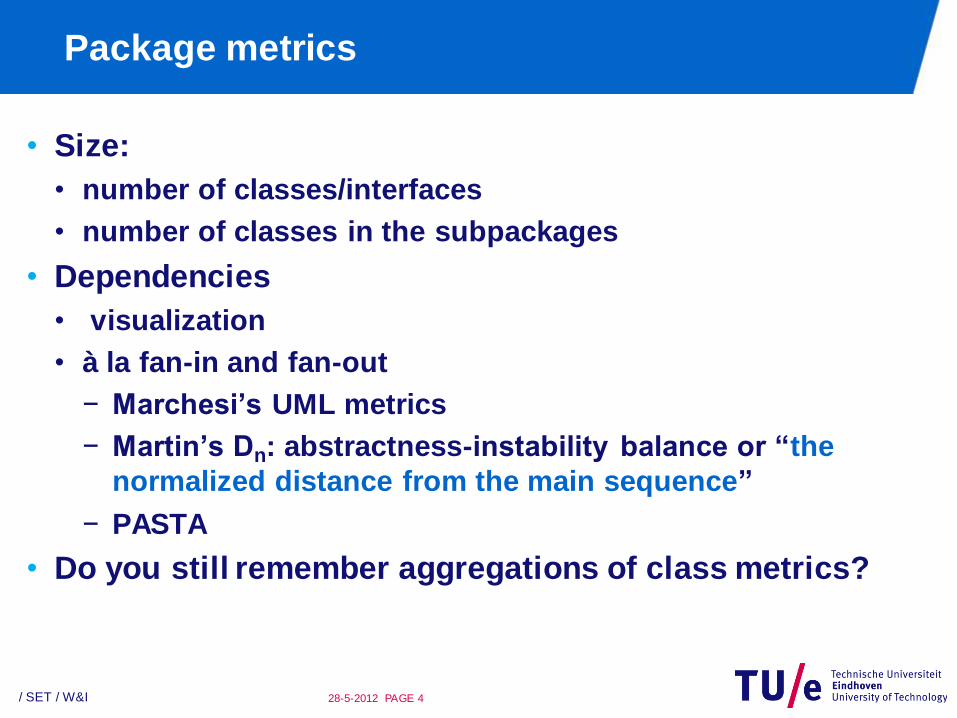
Package metrics
• Size:
• number of classes/interfaces
• number of classes in the subpackages
• Dependencies
• visualization
• à la fan-in and fan-out
− Marchesi’s UML metrics
− Martin’s Dn: abstractness-instability balance or “the
normalized distance from the main sequence”
− PASTA
• Do you still remember aggregations of class metrics?
/ SET / W&I PAGE 4 28-5-2012

How can we visualize dependencies between
packages?
In the same way as with classes
/ SET / W&I PAGE 5 28-5-2012
Can we focus on one
package?
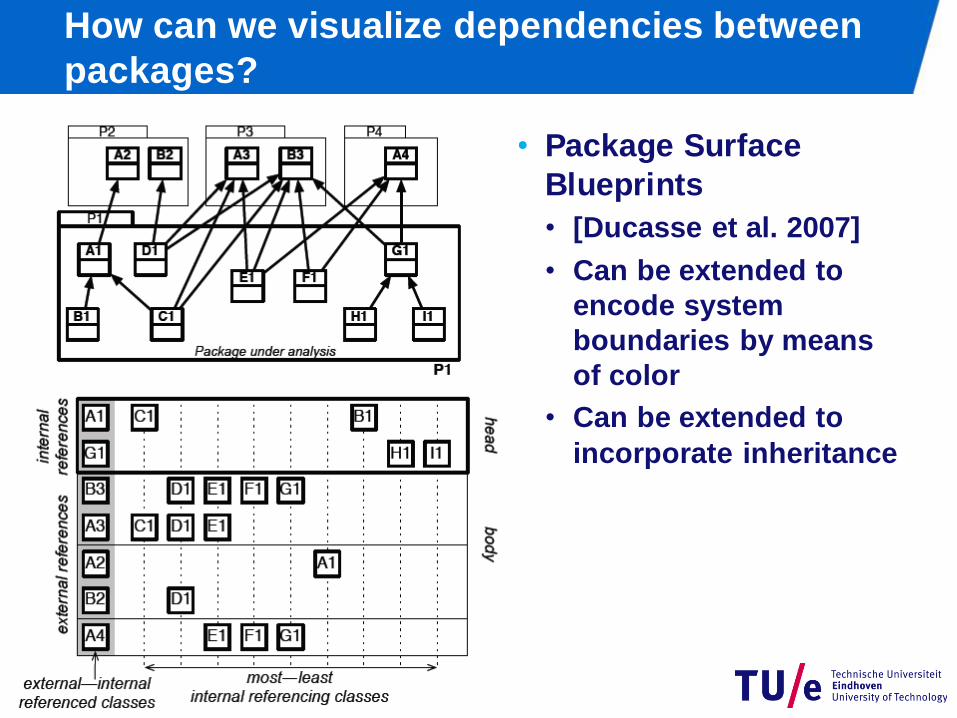
How can we visualize dependencies between
packages?
/ SET / W&I PAGE 6 28-5-2012
• Package Surface
Blueprints
• [Ducasse et al. 2007]
• Can be extended to
encode system
boundaries by means
of color
• Can be extended to
incorporate inheritance

PAGE 7
“Fan-out”
[Martin 1994] [Martin 2000] [JDepend]
Ce:
[Marchesi 1998]
PK1 or R: [Martin 2000]

Fan-in
• “Fan-in” similarly to the “Fan-out”
• Afferent coupling (Martin)
• PK2 (Marchesi)
/ SET / W&I PAGE 8 28-5-2012
• Dark: TDD, light: no-TDD
• Test-driven development
positively affects Ca
• The lower Ca - the better.
• Exception: JUnit vs.
Jerico
• But Jericho is extremely
small (2 packages)
[Hilton 2009]
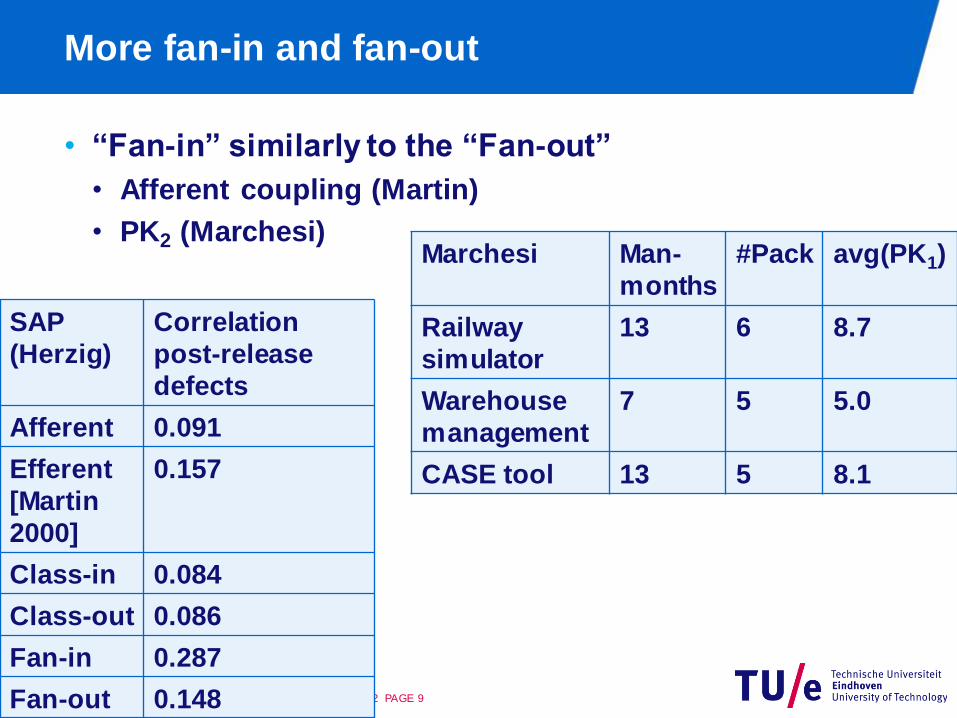
More fan-in and fan-out
• “Fan-in” similarly to the “Fan-out”
• Afferent coupling (Martin)
• PK2 (Marchesi)
• Validation
/ SET / W&I PAGE 9 28-5-2012
Marchesi Man-
months
#Pack avg(PK1)
Railway
simulator
13 6 8.7
Warehouse
management
7 5 5.0
CASE tool 13 5 8.1
SAP
(Herzig)
Correlation
post-release
defects
Afferent 0.091
Efferent
[Martin
2000]
0.157
Class-in 0.084
Class-out 0.086
Fan-in 0.287
Fan-out 0.148
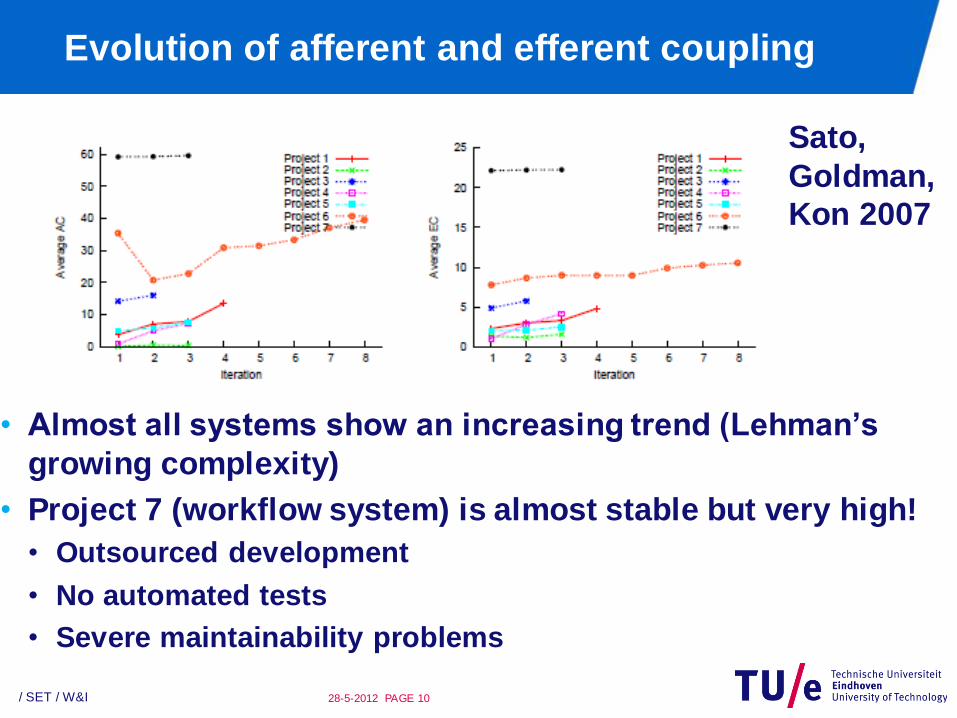
Evolution of afferent and efferent coupling
• Almost all systems show an increasing trend (Lehman’s
growing complexity)
• Project 7 (workflow system) is almost stable but very high!
• Outsourced development
• No automated tests
• Severe maintainability problems
/ SET / W&I PAGE 10 28-5-2012
Sato,
Goldman,
Kon 2007
PAGE 11
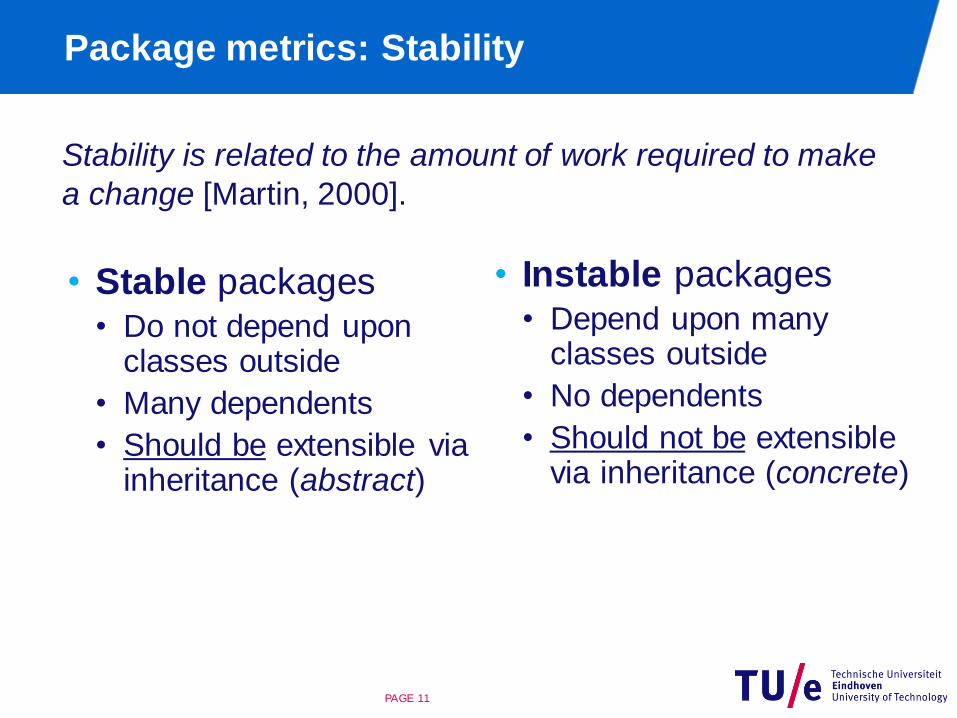
Package metrics: Stability
• Stable packages • Do not depend upon
classes outside
• Many dependents
• Should be extensible via inheritance (abstract)
• Instable packages • Depend upon many
classes outside
• No dependents
• Should not be extensible via inheritance (concrete)
Stability is related to the amount of work required to make
a change [Martin, 2000].

What does balance mean?
PAGE 12
A good real-life package must be instable
enough in order to be easily modified
It must be generic enough to be adaptable to
evolving requirements, either without or with only
minimal modifications
Hence: contradictory criteria

PAGE 13
Dn – Distance from the main sequence
Abstractness =
#AbstrClasses/#Classes
Instability = Ce/(Ce+Ca)
1
1 0
Dn =
| Abstractness +
Instability – 1 |
main sequence zone of pain
zone of
uselessness
[R.Martin 1994]

Normalized distance from the main sequence
/ SET / W&I PAGE 14 28-5-2012
• Dark: TDD, light: no-TDD
• Test-driven development
positively affects Dn
• The lower Dn - the better.
• The same exception
(Jericho vs. JUnit)
[Hilton 2009]
PAGE 15
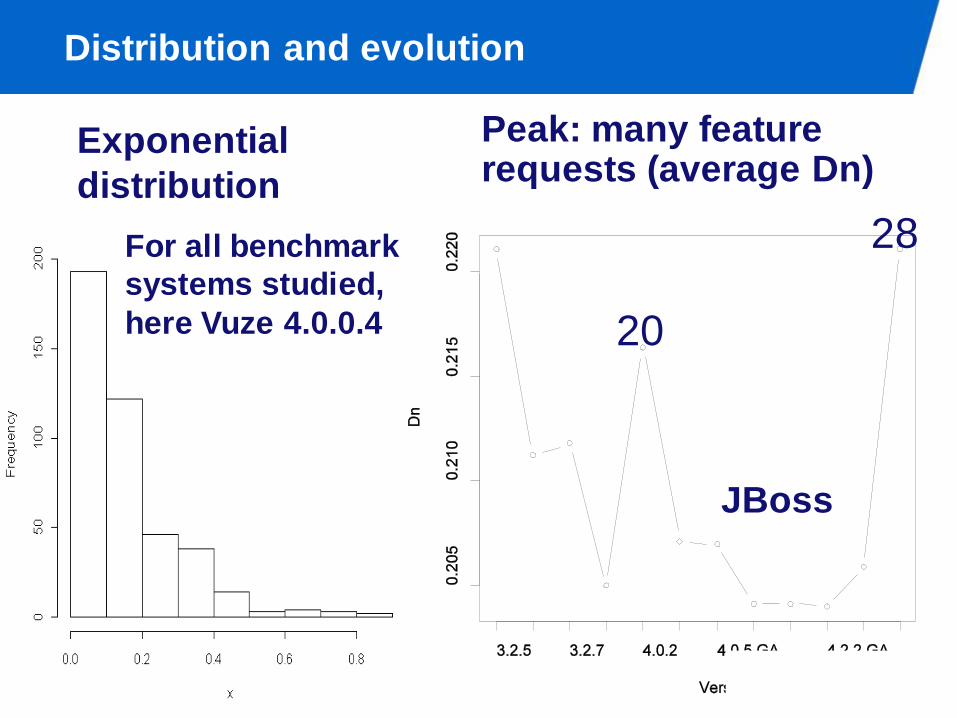
Distribution and evolution
Exponential
distribution
For all benchmark
systems studied,
here Vuze 4.0.0.4 20
28
Peak: many feature requests (average Dn)
JBoss
PASTA [Hautus 2002]
• PASTA – Package structure analysis tool
• Metrics
• Similarly “fan-in/fan-out”: based on dependencies
between packages
• Go beyond calculating numbers of dependencies
• Focus on dependencies between the subpackages
• Some dependencies are worse than others
• What are the “bad dependencies”?
• Cyclic dependencies, layering violations
/ SET / W&I PAGE 16 28-5-2012

PASTA [Hautus]
• Idea: remove bad (cycle-
causing) dependencies
• Weight – number of
references from one
subpackage to another
one.
• Dependencies to be
removed are such that
− The result is acyclic
− The total weight of the
dependencies removed
is minimal
• Minimal effort required to
resolve all the cycles
/ SET / W&I PAGE 17 28-5-2012
Upwards dependencies should
be removed

From dependencies to metrics
• PASTA(P) = Total weight
of the dependencies to
be removed / total weight
of the dependencies
• No empirical validation of
the metrics
• No studies of the metrics
evolution
/ SET / W&I PAGE 18 28-5-2012

One metric is good, more metrics are better (?)
• [Kaur, Singh 2011] propose an adaptation…
/ SET / W&I PAGE 19 28-5-2012
)ln(2.16)(23.0)ln(2.51711 LOCgVVMI Halstead McCabe LOC
• Recall…
)ln(2.16)ln(23.02.5171 NCSCCMIP Related to
PK1 and
instability
Related to
NOC and NOM
Related to
nesting,
strongly
connected
components,
abstractness
and PK2

Summary: package metrics
• Size: number of classes
• Dependencies à la fan-in and fan-out
• Marchesi’s UML metrics
• Martin’s Dn: abstractness-instability balance or “the
normalized distance from the main sequence”
• PASTA
• Aggregations of class metrics: reminder
• Metrics independent: average, sum, Gini/Theil
coefficients from Assignment 6
• Metrics dependent: Distribution fitting
/ SET / W&I PAGE 20 28-5-2012
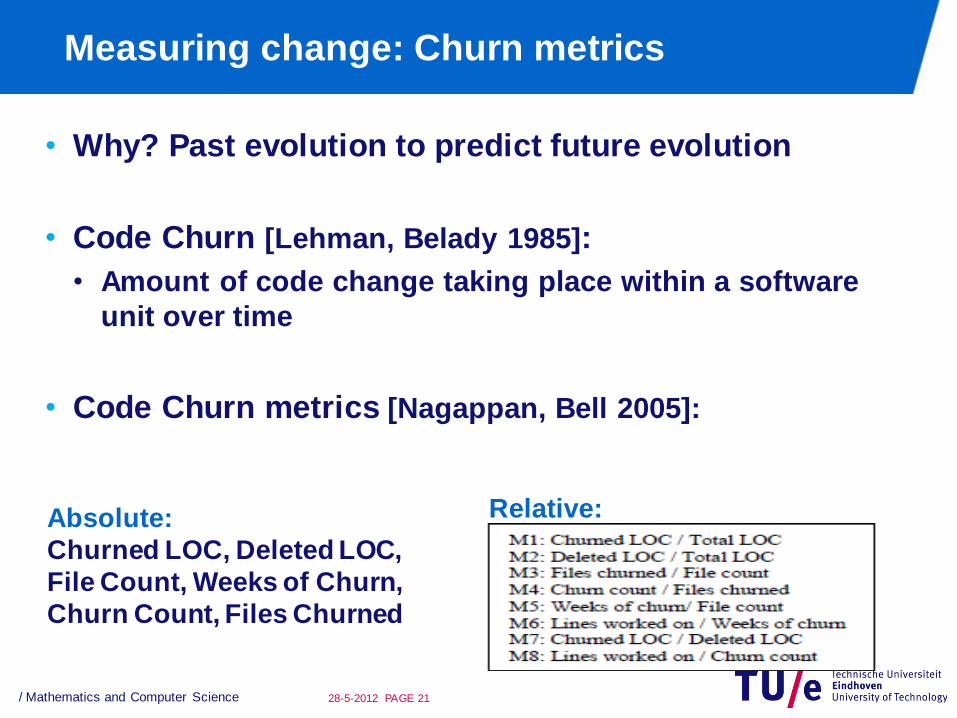
Measuring change: Churn metrics
• Why? Past evolution to predict future evolution
• Code Churn [Lehman, Belady 1985]:
• Amount of code change taking place within a software
unit over time
• Code Churn metrics [Nagappan, Bell 2005]:
/ Mathematics and Computer Science PAGE 21 28-5-2012
Absolute:
Churned LOC, Deleted LOC,
File Count, Weeks of Churn,
Churn Count, Files Churned
Relative:

Case Study: Windows Server 2003
• Analyze Code Churn between WS2003 and WS2003-
SP1 to predict defect density in WS2003-SP1
• 40 million LOC, 2000 binaries
• Use absolute and relative churn measures
• Conclusion 1: Absolute measures are no good
• R2 < 0.05
• Conclusion 2: Relative measures are good!
• An increase in relative code churn measures is
accompanied by an increase in system defect density
• R2 0.8
/ Mathematics and Computer Science PAGE 22 28-5-2012

Case Study: Windows Server 2003
/ Mathematics and Computer Science PAGE 23 28-5-2012
• Construct a statistical
model
• Training set: 2/3 of the
Windows Set binaries
• Check the quality of the
prediction
• Test set: remaining
binaries
• Three models
• Right: all relative churn
metrics are taken into
account
Open issues
• To predict bugs from history, but we need a history
filled with bugs to do so
• Ideally, we don’t have such a history
• We would like to learn from previous projects:
• Can we make predictions without history?
• How can we leverage knowledge between projects?
• Are there universal properties?
• Not just code properties but also properties of the
entire software process
/ Mathematics and Computer Science PAGE 24 28-5-2012
Metrics of software process
• How much will it cost us to build the system?
• How much effort has been spent on building the
system?
Effort estimation techniques
• Size-based
• Complexity-based
• Functionality-based
• More advanced techniques are known but go beyond
the topics of this class
/ SET / W&I PAGE 25 28-5-2012
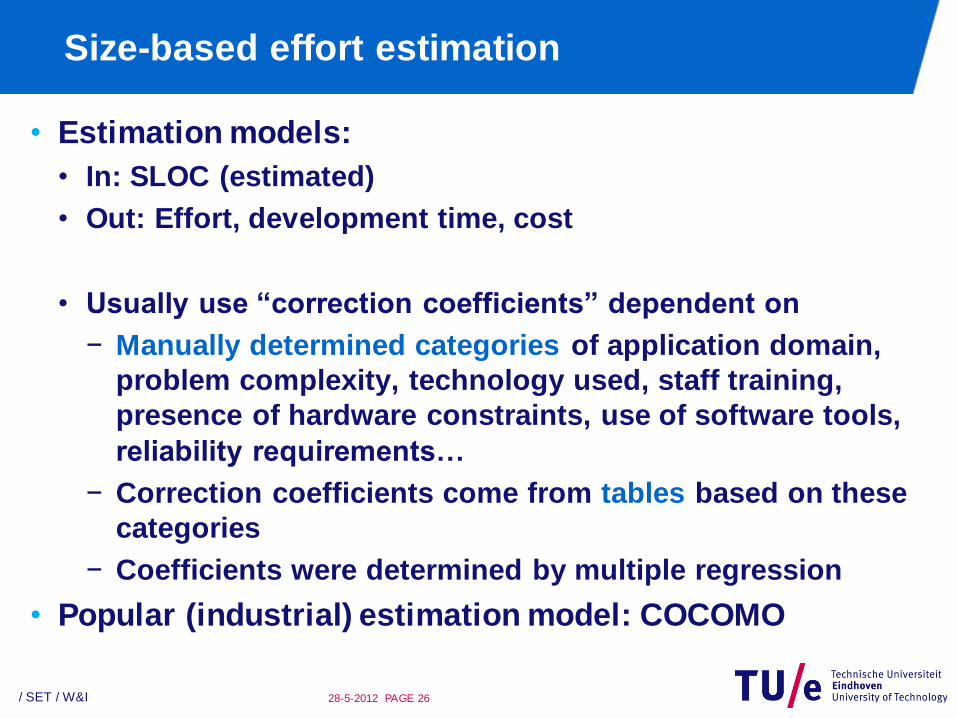
Size-based effort estimation
• Estimation models:
• In: SLOC (estimated)
• Out: Effort, development time, cost
• Usually use “correction coefficients” dependent on
− Manually determined categories of application domain,
problem complexity, technology used, staff training,
presence of hardware constraints, use of software tools,
reliability requirements…
− Correction coefficients come from tables based on these
categories
− Coefficients were determined by multiple regression
• Popular (industrial) estimation model: COCOMO
/ SET / W&I PAGE 26 28-5-2012
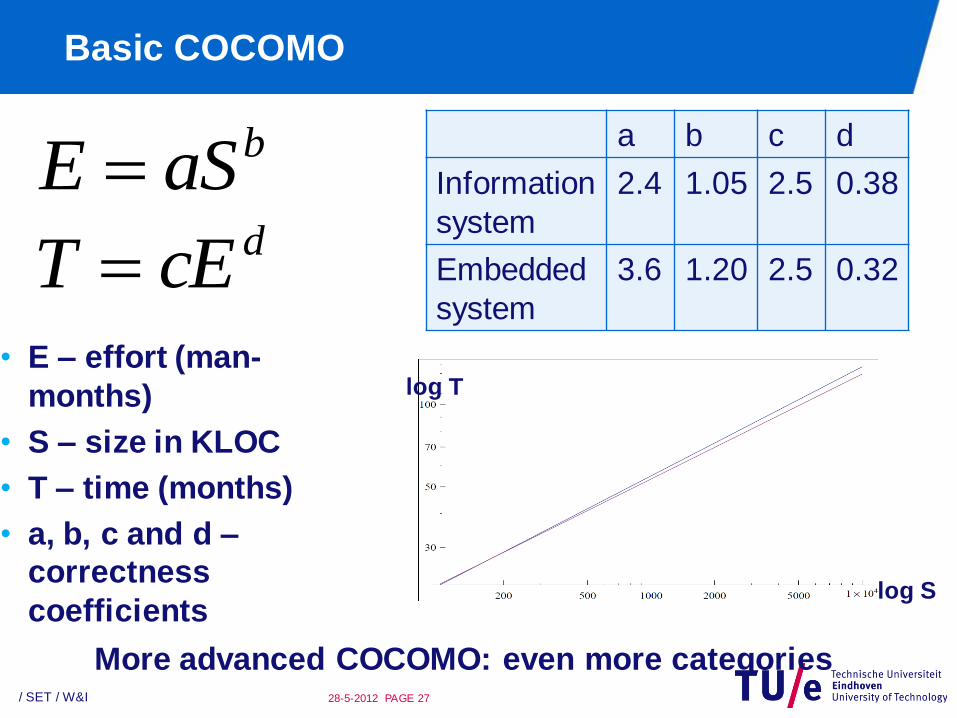
Basic COCOMO
• E – effort (man-
months)
• S – size in KLOC
• T – time (months)
• a, b, c and d –
correctness
coefficients
/ SET / W&I PAGE 27 28-5-2012
baSE dcET
a b c d
Information
system
2.4 1.05 2.5 0.38
Embedded
system
3.6 1.20 2.5 0.32
More advanced COCOMO: even more categories
log T
log S
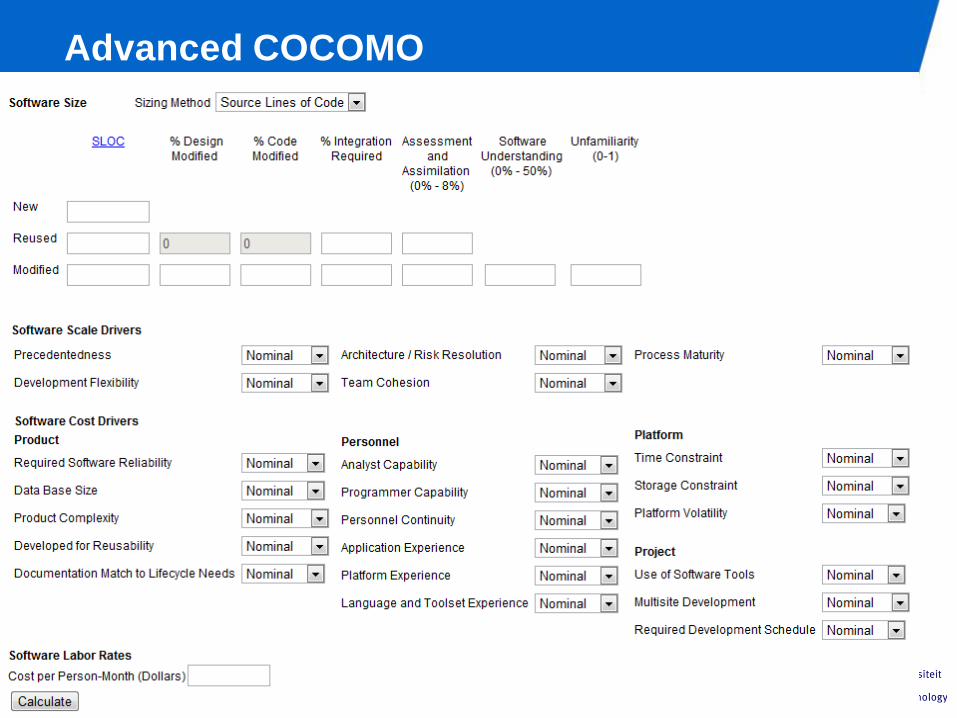
Advanced COCOMO
/ SET / W&I PAGE 28 28-5-2012

Complexity-based effort estimation
• Do you recall Halstead?
• Effort: E = V * D
• V – volume, D – difficulty
• Potentially problematic: questioned by Fenton and
Pfleger in 1997
• Time to understand/implement (sec): T = E/18
/ SET / W&I PAGE 29 28-5-2012
2
212121 *
2*)ln()(
n
NnnnNNE

Code is not everything
• Lehman 6:
• The functional capability <…> must be continually
enhanced to maintain user satisfaction over system
lifetime.
• How can we measure amount of functionality in the
system?
• [Albrecht 1979] “Function points”
− Anno 2012: Different variants: IFPUG, NESMA, …
• Determined based on system description
• Amount of functionality can be used to assess the
development effort and time before the system is built
• Originally designed for information systems
/ SET / W&I PAGE 30 28-5-2012

Functionality and effort
/ SET / W&I PAGE 31 28-5-2012
No data
No data
What kinds of problems
could have influenced
validity of this data?
< 10% US
comp.
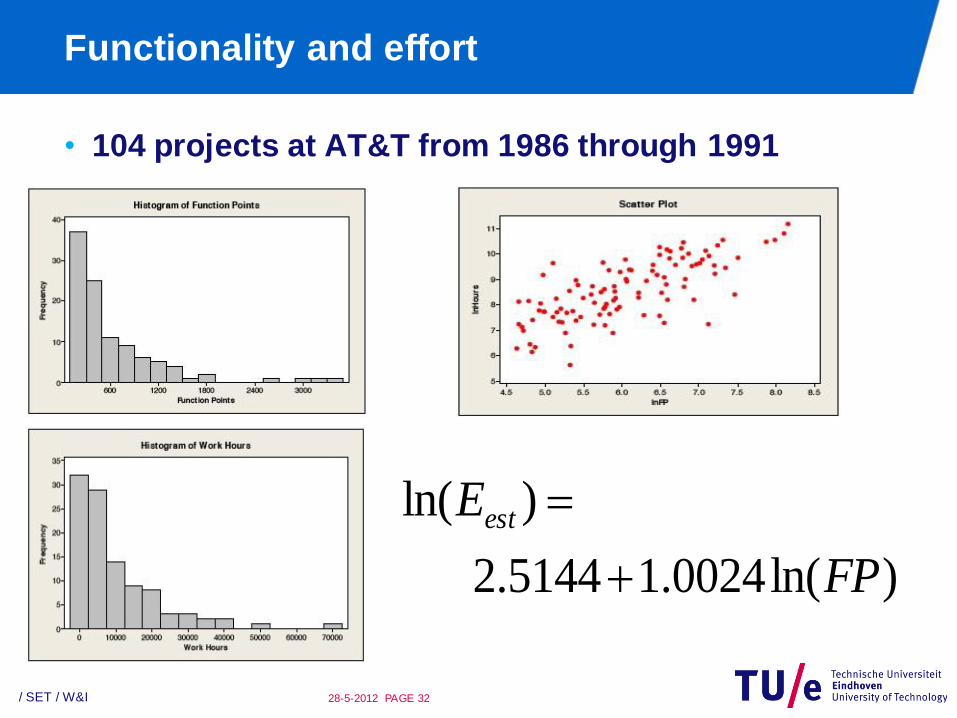
Functionality and effort
• 104 projects at AT&T from 1986 through 1991
/ SET / W&I PAGE 32 28-5-2012
)ln(0024.15144.2
)ln(
FP
Eest

What about the
costs? Function
points
Cost per fp
1
---
10
---
100
$795.36
1000
$1136.36
10000
$2144.12
100000
$3639.74
/ SET / W&I PAGE 33 28-5-2012

How to determine the number of function
points? [IFPUG original version]
• Identify primitive constructs:
• inputs: web-forms, sensor inputs, mouse-based, …
• outputs: data screens, printed reports and invoices, …
• logical files: table in a relational database
• interfaces: a shared (with a different application) database
• inquiries: user inquiry without updating a file, help
messages, and selection messages
/ SET / W&I PAGE 34 28-5-2012

Software is not only functionality!
• Non-functional
requirement necessitate
extra effort
• Every factor on [0;5]
• Sum * 0.01 + 0.65
• Result * Unadjusted FP
• 1994: Windows-based
spreadsheets or word
processors: 1000 – 2000
/ SET / W&I PAGE 35 28-5-2012

Function points, effort and development time
• Function points can be used to determine the
development time, effort and ultimately costs
• Productivity tables for different SE activities,
development technologies, etc.
• Compared to COCOMO
• FP is applicable for systems to be built
− COCOMO is not
• COCOMO is easier to automate
• Popularity:
− FP: information systems, COCOMO: embedded
/ SET / W&I PAGE 36 28-5-2012

But what if the system already exists?
• We need it, e.g., to estimate maintenance or
reengineering costs
• Approaches:
• Derive requirements (“reverse engineering”) and
calculate FP based on the requirements derived
• Jones: Backfiring
− Calculate LLOC (logical LOC, source statements)
− Divide LLOC by a language-dependent coefficient
− What is the major theoretical problem with backfiring?
/ SET / W&I PAGE 37 28-5-2012
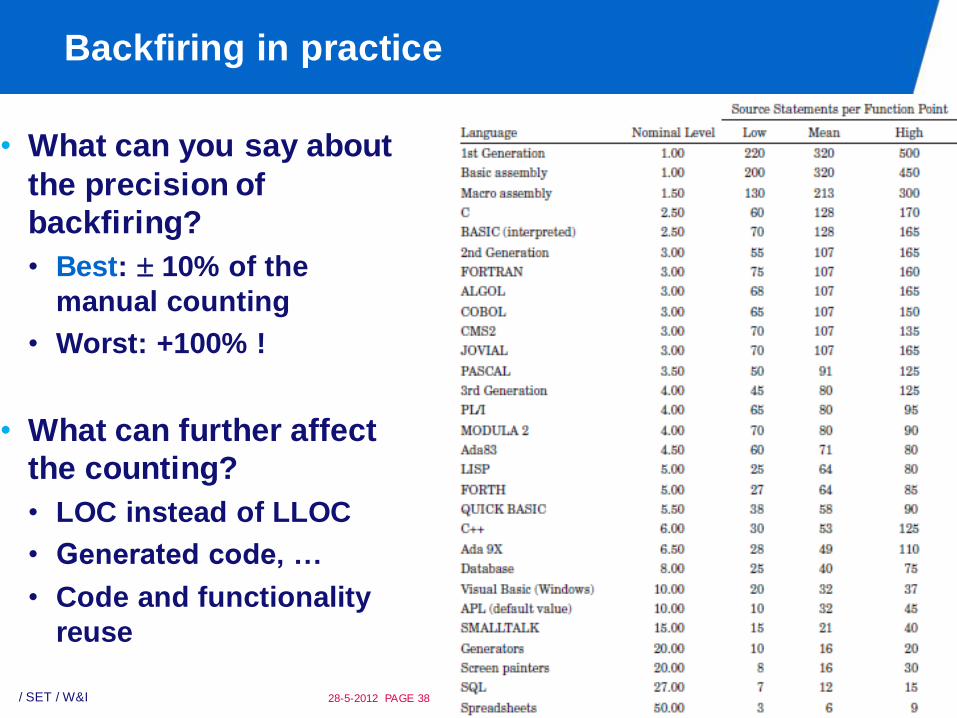
Backfiring in practice
• What can you say about
the precision of
backfiring?
• Best: 10% of the
manual counting
• Worst: +100% !
• What can further affect
the counting?
• LOC instead of LLOC
• Generated code, …
• Code and functionality
reuse
/ SET / W&I PAGE 38 28-5-2012

Function points: Further results and open
questions
• Further results
• OO-languages
• Open questions
• Formal study of correlation between backfiring FP and
“true” FP
• AOP
• Evolution of functional size using FP
/ SET / W&I PAGE 39 28-5-2012
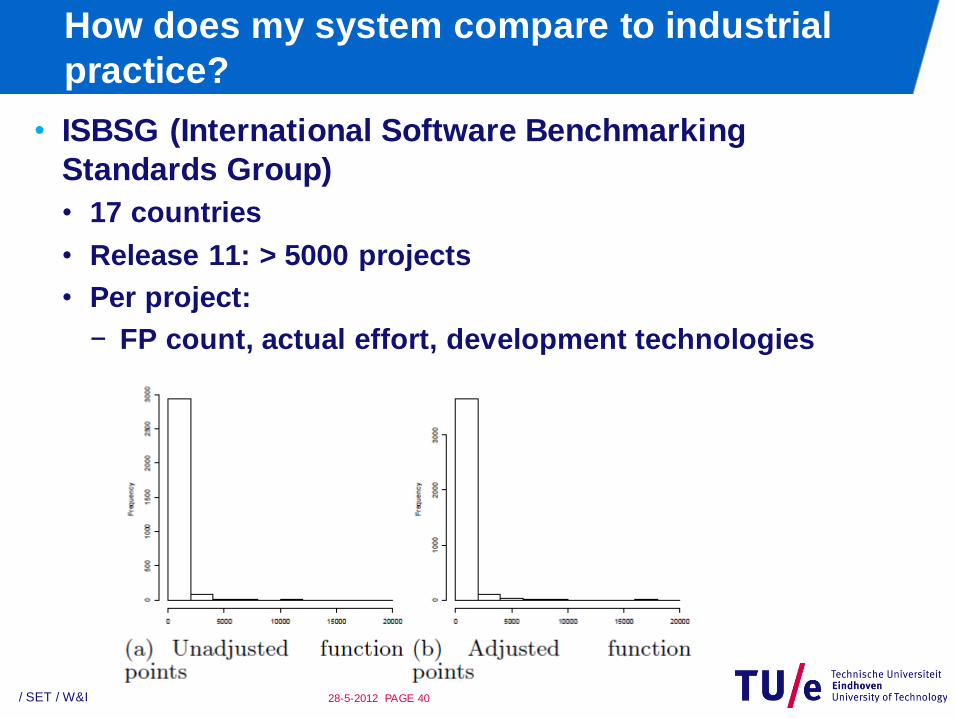
How does my system compare to industrial
practice?
• ISBSG (International Software Benchmarking
Standards Group)
• 17 countries
• Release 11: > 5000 projects
• Per project:
− FP count, actual effort, development technologies
− …
/ SET / W&I PAGE 40 28-5-2012

Alternative ways of measuring the amount of
functionality
• FP: input, output, inquiry, external files, internal files
• Amount of functionality = size of the API
• Linux kernel = number of system calls + number of
configuration options that can modify their behaviour
− E.g., open with O_APPEND
/ SET / W&I PAGE 41 28-5-2012
Interface

Amount of functionality in the Linux kernel
• Multiple versions and
variants
• Production (blue dashed)
• Development (red)
• Current 2.6 (green)
• System calls: mostly
added at the development
versions
• Rate is slowing down from
2003 – maturity?
• Configuration options:
superlinear growth
• 2.5.45 – change in option
format/organization
/ SET / W&I PAGE 42 28-5-2012 Israeli, Feitelson

Conclusions
• Package metrics
• Directly defined: Dn, Marchesi metrics, PASTA
• Aggregation based
− Metrics-independent: average, sum, Gini coefficient
− Metrics-dependent: fitted distributions
• Churn metrics
• Effort estimation metrics
/ SET / W&I PAGE 43 28-5-2012


