0 Attia- Solar in the Americas Benjamin Attia Analyst, Global Solar Markets [email protected]@solarbenattia Solar in the Americas Market Conditions, Policy and Finance Outlook Intersolar Europe 2017
North America: Resumption of Growth in 2019 as US utility-scale pipeline stalls
2020: US returns to 2016 installation levels
2019: Resumption of total market growth
US: 95% YoY GrowthCanada: National carbon tax, coal retirement timeline, federal 100% RE target, state-level tenders, and a MircoFITreboot in Ontario created uncertainty and limited 2016 installs.
3Attia- Solar in the Americas
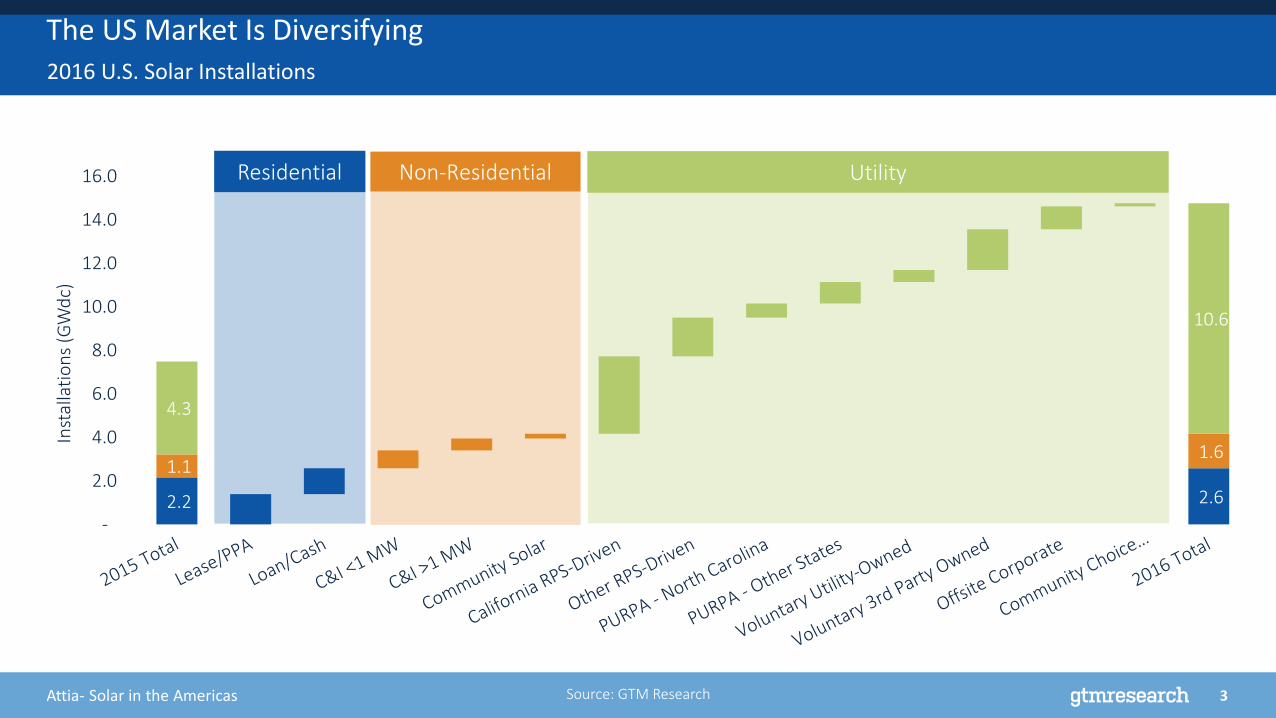
The US Market Is Diversifying2016 U.S. Solar Installations
2.2 2.6
1.1 1.6
4.3
10.6
-
2.0
4.0
6.0
8.0
10.0
12.0
14.0
16.0
Inst
alla
tio
ns
(GW
dc)
Residential Non-Residential Utility
Source: GTM Research
4Attia- Solar in the Americas
There are a number of key non-RPS drivers in US Utility-scale Solar
Non RPS Drivers
Voluntary
Procurement
PURPA
Wholesale
Retail
Procurement
CCAs
MT
WY
ID
WA
OR
NV
UTCA
AZ
ND
SD
NE
CO
NM
TX
OK
KS
AR
LA
MO
IA
MN
WI
IL IN
KY
TN
MS AL GA
FL
SC
NC
VAWV
OH
MI
NY
PA
MDDE
NJ
CTRI
MA
ME
VT
NH
MD
37%
63%
4908
3549
1903543
RPS Driven Non RPS Driven
PURPA Voluntary Procurement
Retail Procurement CCA
% Share of Utility PV Pipeline
US States with 50 MW+ Contracted, Non-RPS Utility PV Pipeline as of March 2017
5Attia- Solar in the Americas
Emergence of Community Solar: Legislative and Voluntary Segments Both Set to Scale
126 9 6
2952
223
410
0
100
200
300
400
500
600
700
20
10
20
11
20
12
20
13
20
14
20
15
20
16
20
17
E
20
18
E
20
19
E
20
20
E
20
21
E
An
nu
al In
stal
lati
on
s (M
Wd
c)
Third Party Led Utility Led
3744
62
26
227
113
0
50
100
150
200
250
Coop IOU Muni
Uti
lity
Led
Co
mm
un
ity
Sola
r (M
Wd
c)
Operating In Development
Source: <Insert source>
Community Solar Installation Outlook:Third Party Led vs Utility Led Community Solar
Source: <Insert source>
Within Utility Led Community Solar:Emergence of IOUs Procuring Large Scale Community Solar
6Attia- Solar in the Americas
Source: GTM Research
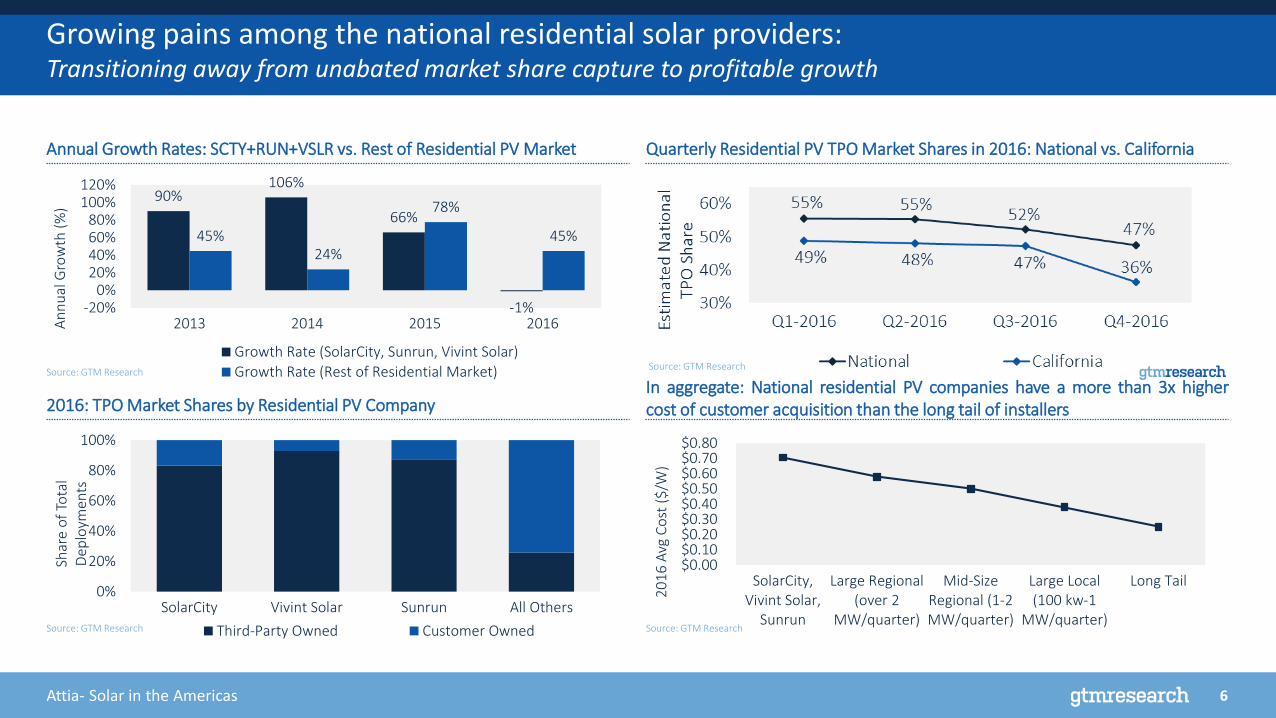
Growing pains among the national residential solar providers:Transitioning away from unabated market share capture to profitable growth
90%106%
66%
-1%
45%24%
78%
45%
-20%0%
20%40%60%80%
100%120%
2013 2014 2015 2016An
nu
al G
row
th (
%)
Growth Rate (SolarCity, Sunrun, Vivint Solar)
Growth Rate (Rest of Residential Market)
$0.00$0.10$0.20$0.30$0.40$0.50$0.60$0.70$0.80
SolarCity,Vivint Solar,
Sunrun
Large Regional(over 2
MW/quarter)
Mid-SizeRegional (1-2MW/quarter)
Large Local(100 kw-1
MW/quarter)
Long Tail
20
16
Avg
Co
st (
$/W
)
0%
20%
40%
60%
80%
100%
SolarCity Vivint Solar Sunrun All Others
Shar
e o
f To
tal
Dep
loym
ents
Third-Party Owned Customer Owned
Source: GTM Research
Annual Growth Rates: SCTY+RUN+VSLR vs. Rest of Residential PV Market Quarterly Residential PV TPO Market Shares in 2016: National vs. California
Source: GTM Research
2016: TPO Market Shares by Residential PV Company
Source: GTM Research
In aggregate: National residential PV companies have a more than 3x highercost of customer acquisition than the long tail of installers
7Attia- Solar in the Americas
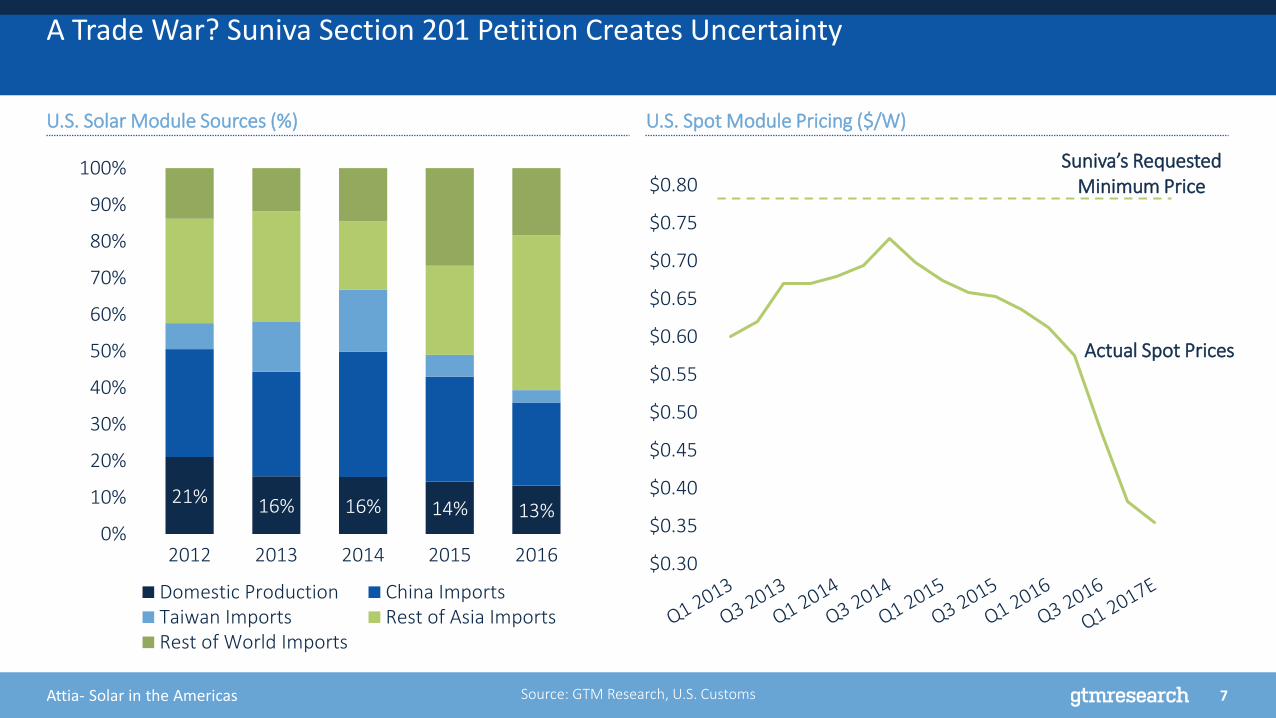
A Trade War? Suniva Section 201 Petition Creates Uncertainty
Source: GTM Research, U.S. Customs
21% 16% 16% 14% 13%0%
10%
20%
30%
40%
50%
60%
70%
80%
90%
100%
2012 2013 2014 2015 2016
Domestic Production China ImportsTaiwan Imports Rest of Asia ImportsRest of World Imports
$0.30
$0.35
$0.40
$0.45
$0.50
$0.55
$0.60
$0.65
$0.70
$0.75
$0.80
Actual Spot Prices
Suniva’s Requested Minimum Price
U.S. Solar Module Sources (%) U.S. Spot Module Pricing ($/W)
8Attia- Solar in the Americas
-60%-40%-20%
0%20%40%60%
HI
MA AZ
CA VT
NY
NM DE NJ
SC DC
MD
NH
MN CT
UT RI
PA FL ME KY TX MI
WI
CO
WY
GA
OH
NC
AR IL LA VA
MO KS IA
MT IN NE
OR
MS
NV ID AK AL
WV
WA
TN OK
SD NDYe
ar 1
Bill
Imp
act
fro
m
Sola
r (%
)
-60%
-40%
-20%
0%
20%
40%
HI
MA VT
CA
DE
AZ
NM N
J
NY
DC SC MD
MN
NH CT
UT RI
PA KY ME FL TX MI
WI
CO
WY
OH
GA IL
NC
AR LA
MO
MT
VA IA KS IN NE
OR ID MS
NV
AK
WV AL
WA
TN OK
ND SD
Year
1 B
ill Im
pac
t fr
om
So
lar
(%)
If Suniva’s minimum module price proposal is approved in H2 2017: The number of states at residential PV grid parity in 2018 will drop from 36 to 27
Source: GTM Research
U.S. States At Residential Grid Parity, 2018: Base Case System Pricing
Source: GTM Research
U.S. States At Residential Grid Parity, 2018: Including Suniva’s Proposed Minimum $0.72/W Price for Imported Modules (Year 2)
Note: Grid parity metrics account for all NEM and rate reforms currently in effect for modeled utilities.
9Attia- Solar in the Americas
1. Macro level uncertainty: Solar trade dispute, corporate tax reform, NEM and rate reform risk
2. Residential: Sub 15% annual growth in a more fragmented installer landscape, paired with the emergence of loans and cash sales collectively outpacing third party owned leases and PPAs
3. Non-Residential: Continued growth hinges on community solar (near term) and solar-plus-storage (long term) amidst state incentive reductions and TOU rate reforms across major markets
What comes next for U.S. solar?
4. Utility-Scale: On track for another boom in procurement heading into 2019 in response to the scheduled stepdown of the 30% federal ITC, supporting growth in the 2019-2021 timeframe
10Attia- Solar in the Americas
Latin America
11Attia- Solar in the Americas
0.2 0.7
2.4 2.8 3.14.2 4.8
0.00.4
1.01.3 1.1
1.4
1.9
0.80.5
0.7
0.9 1.1
1.2
1.3
0.9
1.11.3
1.5
1.7
0.9
1.1
1.1
1.21.3
1.3
1.4
1.5 1.62.4
5.8
7.17.8
9.7
11.5174%
9%
49%
147%
22%
10%24% 18%
0%
20%
40%
60%
80%
100%
120%
140%
160%
180%
200%
0
2
4
6
8
10
12
14
2015 2016 2017E 2018E 2019E 2020E 2021E 2022E
GW
dc
Mexico Brazil Chile Argentina Rest of Latin America Annual Growth
Latin American Markets, led by Mexico and Brazil, will take off in 2018
Close to 3GW of projects in Brazil and Mexico are
under construction and set to come online next year
12Attia- Solar in the Americas
Source: GTM Research Latin America PV Project Tracker
Regional Project Pipelines (MWdc)
Chile approaches 2GW; Mexico Begins Construction for a Huge 2018 as Investment Booms
Operational6%, 60 MW
Contracted94%, 916 MW
Argentina
Operational50%, 761 MW
Under Construction27%, 401 MW
Contracted23%, 350 MW
Central America & Caribbean
Operational24%, 1941
MW
Under Construction
40%, 3142 MW
Contracted36%, 2886 MW
Chile
Operational7%, 390 MW
Under Construction
33%, 1948 MWContracted
60%, 3456 MW
Mexico
Operational2%, 62 MW
Under Construction
32%, 1031 MW
Contracted66%, 2092 MW
Brazil
Operational27%, 230 MW
Under Construction
39%, 328 MW
Contracted34%, 284 MW
Rest of South America
13Attia- Solar in the Americas
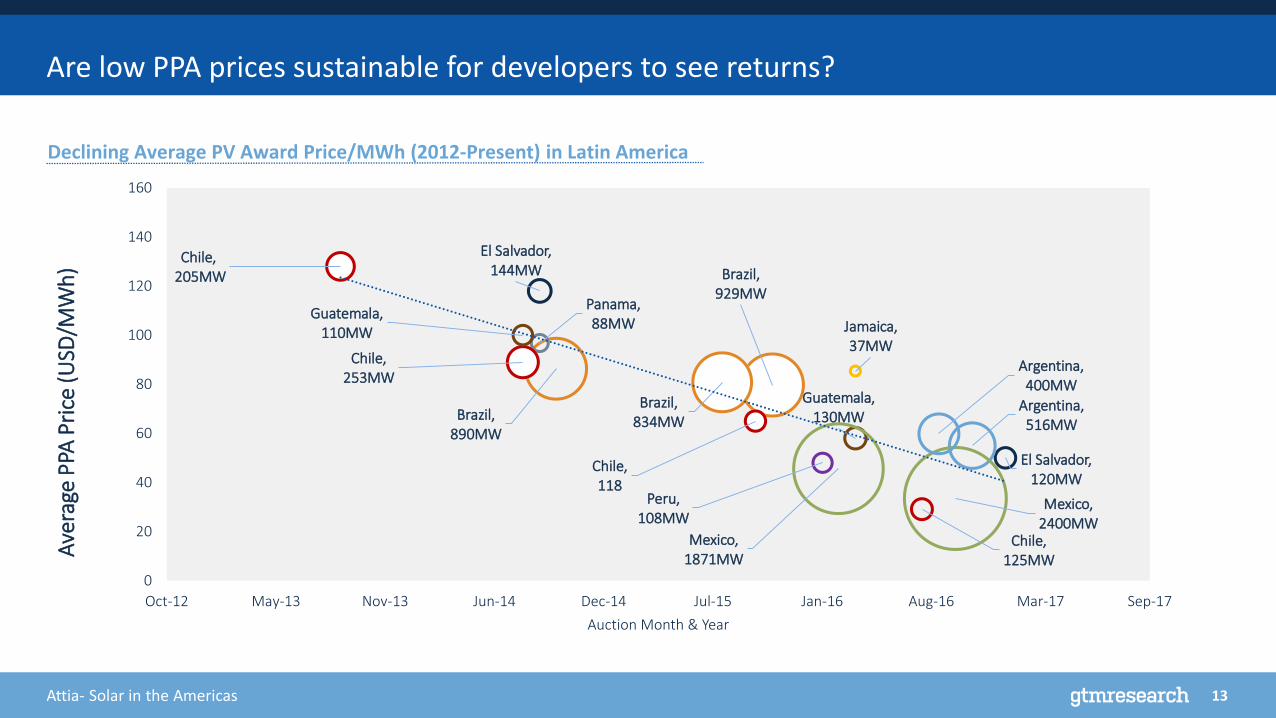
Are low PPA prices sustainable for developers to see returns?
Declining Average PV Award Price/MWh (2012-Present) in Latin America
14Attia- Solar in the Americas
Third Mexican Auction likely to include Export Zone Preferences as in A1
Average Export Zone Preference Adjustment in A1 was -$10.90/MWh. Highest was in Yucatan at -$21.98/MWh.
30% reduction in average pre-adjusted solar bid from A1 to A2, with a leading bid of $26.99/MWh in San Luis Potosi by FRV.
15Attia- Solar in the Americas
Chile: Despite Large Developer Pipelines, SIC-SING IC Delays Limit 2017 Installations
56
55
81
163
145
41
122
72
334
255
490
11
58
131
188
23
309
185
300
235
265
123
71
432
60
75
47
74
146
232
129
229
34
225
234
65
343
134
0 200 400 600 800 1000 1200
AES
Grenergy
X-Elio
SunPower
Etrion
First Solar
Colbun
Solairedirect/Engie
Solarpack
EDF
Ingenostrum
Pattern Energy
Rijn Capital
Austrian Solar
Mainstream Renewable…
Actis
Acciona
Enel Green Power
MWdcOperational Under Construction Contracted
16Attia- Solar in the Americas
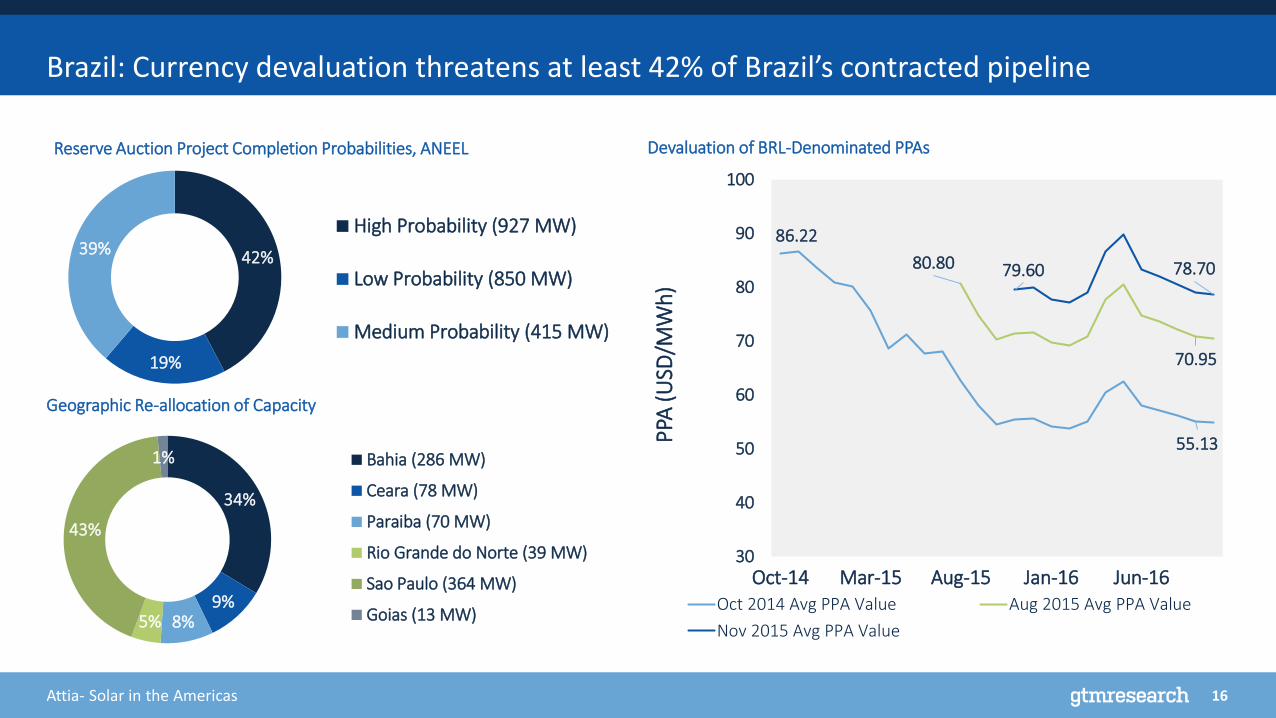
Brazil: Currency devaluation threatens at least 42% of Brazil’s contracted pipeline
86.22
55.13
80.80
70.95
79.60 78.70
30
40
50
60
70
80
90
100
Oct-14 Mar-15 Aug-15 Jan-16 Jun-16
PPA
(USD
/MW
h)
Oct 2014 Avg PPA Value Aug 2015 Avg PPA Value
Nov 2015 Avg PPA Value
42%
19%
39%High Probability (927 MW)
Low Probability (850 MW)
Medium Probability (415 MW)
34%
9%8%5%
43%
1% Bahia (286 MW)
Ceara (78 MW)
Paraiba (70 MW)
Rio Grande do Norte (39 MW)
Sao Paulo (364 MW)
Goias (13 MW)
Geographic Re-allocation of Capacity
Reserve Auction Project Completion Probabilities, ANEEL Devaluation of BRL-Denominated PPAs
17Attia- Solar in the Americas
1. Macro-level Risks: Traditionalist AMLO in Mexican presidential election, currency devaluation, bankability of low-bid projects, materialization of pipelines in Chile and Brazil
2. Residential: Mexico’s residential market will double in 2017, recent NEM cap increase to 500 kW and shortened interconnection times with CFE, high rates in T2, T3, OM/HM Tariff classes
3. Non-Residential: Similarly, Colombia’s C&I market has easy interconnection processes, high C&I retail tariffs, and a 500 kW NEM cap under review. Backup contract requirement removed.
What comes next for Latin American solar?
4. Utility-Scale: Argentina’s RenovAR program will add to existing 1 GW pipeline, bring sub-$50/MWh prices later this year. Bankability & cost overrun concerns, transmission constraints
18Attia- Solar in the Americas
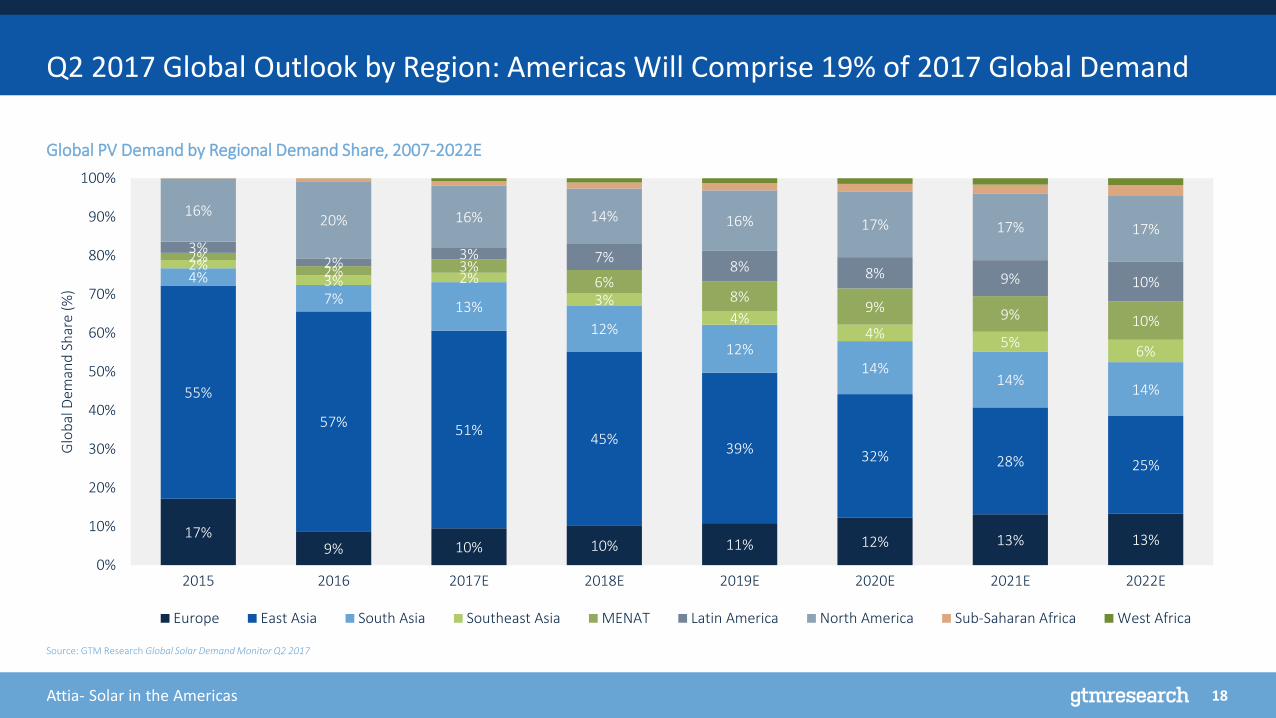
Q2 2017 Global Outlook by Region: Americas Will Comprise 19% of 2017 Global Demand
Global PV Demand by Regional Demand Share, 2007-2022E
Source: GTM Research Global Solar DemandMonitor Q2 2017
17%9% 10% 10% 11% 12% 13% 13%
55%
57%51%
45%39% 32% 28% 25%
4%
7%13%
12%
12%14%
14%14%
2%3% 2%
3%4%
4%5%
6%
2%2% 3%
6%8%
9% 9% 10%
3%2%
3% 7%8% 8% 9% 10%
16%20% 16% 14% 16% 17% 17% 17%
0%
10%
20%
30%
40%
50%
60%
70%
80%
90%
100%
2015 2016 2017E 2018E 2019E 2020E 2021E 2022E
Glo
bal
Dem
and
Sh
are
(%)
Europe East Asia South Asia Southeast Asia MENAT Latin America North America Sub-Saharan Africa West Africa