1 Solar Irrigation with Electric Vehicle Public-Private Approach to Energy, Water and Food Nexus September 2014 Public Disclosure Authorized Public Disclosure Authorized Public Disclosure Authorized Public Disclosure Authorized
Transcript
1
Solar Irrigation with Electric Vehicle Public-Private Approach to Energy, Water and Food Nexus
Annexure 5 : Solar Powered Irrigation in India ....................................................................................... 55
Annexure 6 : Discussion Notes on the SIEV Workshop ......................................................................... 57
3
Introduction
The World Bank’s Innovation Challenge, with its goals to surface, incubate and scale “game-changing” ideas to end poverty and share prosperity, selected a proposal on Solar Irrigation with Electric Vehicle (SIEV) to fund feasibility studies and prototype implementation. The proposal tackles two challenges – poorer countries’ irrigation energy and richer countries’ transport energy – through private sector to facilitate second-hand market for Lithium-ion Battery (LIB) after its useful life for electric vehicles.
For irrigation in poorer countries, the proposal hypothesizes three economic rationales of low weight, high
energy density battery to turn solar irrigation to a viable and attractive solution for off-grid farmers:
Energy efficiency: reduce investment in solar panels and “hybridize” battery-powered and diesel-powered pumping to optimally address varying seasonal water requirements and daily solar radiation;
Scalability and compatibility: add mobility to solar pumping to accommodate fragmented land ownership, save investments in additional rural infrastructure and leverage private water market;
Income generation: accelerate repayment for the investment through productive use of surplus electricity, and in longer term, lift energy constraints to intensity and/or diversify cropping.
For transport in richer countries, the proposal also aims to promote transition from fossil fuel to electricity
by cultivating re-sell markets for second-hand LIB at scale, thus improving financial sustainability of
automakers’ cost structure for production of electric vehicles, driven largely by the cost of batteries.
Analytical and practical roadblocks had been foreseen in turning the concept to innovations on the ground
(e.g. information asymmetry among stakeholders, geographical heterogeneity of agricultural practices,
and uncertainties around electric vehicles, to name a few). Accordingly, a study was designed as an initial
step to build a robust evidence base to assess viability of the proposal and assess policy implications
while also following “learning by doing” approach to stimulate discoveries across boundaries.
The first pilot was planned in Bangladesh in 2011 with Nissan, the private sector partner and automaker.
The tsunami which hit Japan affected Nissan’s factories and derailed this arrangement, while alternative
arrangements had to be made in coordination with a battery manufacturer and local partner, Rahimafrooz
Renewable Energy (REE). Nissan meanwhile recovered from the force majeure events with renewed
interest in collaboration given the progress made in the electric vehicle market over the last years.
The objective of this study, after the second selection of the proposal by the Innovation Challenge in 2014,
is to further field based technical validation of the battery-powered solar irrigation in Bangladesh and
assess financial and economic viability of the proposed concept in contexts of both Bangladesh and India.
The study was led by Naoto Kanehira and was joined by the World Bank energy team, Zubair Sadeque
and Amol Gupta. Nissan’s team coordinated by Seiji Shima provided technical support. The engineering
team of Rahimafrooz Renewable Energy, led by Ariful Islam, implemented prototype demonstration and
technical validation in Bangladesh, supported by Dr.Mohammad Ghani and Joe Fujioka, the World Bank
consultants, and Bangladesh Agricultural Research Institute. Deloitte team, led by Shubhranshu Patnaik,
conducted data analysis including financial and economic evaluation.
4
Agricultural context & Role of SIEV
Groundwater Irrigation and dependence on diesel
Groundwater irrigation has rapidly emerged to become the mainstay of irrigated agriculture in India and
Bangladesh and has contributed significantly to the growth in agricultural output and food security of both
countries over the years (see Annex 3). Over the years, it has improved and stabilized crop yield and led
to an increase in cropping intensity in both countries.
Minor irrigation has begun to play an increasingly important role in the agricultural practices in both India
and Bangladesh. While major and medium surface irrigation schemes have a negligible share in the
irrigation (only about 5% of the 5,373,105 hectares of irrigated area) in Bangladesh, it continues to play a
significant role in India with 37% of the 91,124,000 hectares of irrigated area in India covered by such
schemes / projects.
Groundwater based irrigation has seen an exponential rise in both counties, accounting for almost 80% of
the irrigated area in Bangladesh and approximately 55% of the irrigated area in India, with an increasing
share in total irrigated area over the last three decades, as shown in the figure below.
Figure 1: Trend in Irrigated Area (000'ha) through Ground and Surface water in Bangladesh & India
Source: (a) Minor Irrigation Survey Report 2012-13, Ministry of Agriculture, Government of Bangladesh
(b) Water & Related Statistics, December 2010, Central Water Commission, Government of India
South Asia (particularly India, Pakistan, Bangladesh and Nepal), is the largest groundwater using region
in the world. In India, for instance, pump irrigation has emerged as the backbone of its agriculture and
accounts for 70–80% of the value of irrigated farm output. Rapid groundwater development is at the heart
of the agrarian dynamism found in some areas in eastern India that remained stagnant for a long time.
The greatest social value of groundwater irrigation is that it has helped make famines a matter of history:
during 1963–1966, a small deficit in rainfall left reservoirs empty and sent food production plummeting by
19%, whereas in the 1987/1988 drought, when rainfall deficit was 19%, food production fell by only 2%,
thanks to widespread groundwater irrigation1.
1 Sharma, S.K. and Mehta, M. (2002) Groundwater Development Scenario: Management Issues and Options in India, paper for the IWMI-
ICARColombo Plan Sponsored Policy Dialogue on ‘Forward-Thinking Policies for Groundwater Management: Energy, Water Resources, and Economic Approaches’ organized at India International Centre, New Delhi, India
0
1000
2000
3000
4000
5000Bangladesh
Minor Ground Water Irrigation Minor Surface Water Irrigation
0
10000
20000
30000
40000
50000
60000
1980-85 1985-90 1990-92 1992-97 1997-02 2002-07
India
Major & Medium Surface Water Irrigation
Minor Surface water Irrigation
Minor Ground Water Irrigation
0
1000
2000
3000
4000
5000Bangladesh
Minor Ground Water Irrigation Minor Surface Water Irrigation
0
10000
20000
30000
40000
50000
60000
1980-85 1985-90 1990-92 1992-97 1997-02 2002-07
India
Major & Medium Surface Water Irrigation
Minor Surface water Irrigation
Minor Ground Water Irrigation
5
This proliferation in groundwater usage has resulted in a corresponding rise in the number of pump sets
employed by farmers in the region with an estimated 25 million2 pump sets in India and 1.7 million pump
sets in Bangladesh used for groundwater irrigation.
Bangladesh’s minor irrigation is largely dependent on Shallow Tube Wells (STW) (see Figure 1), which
account for over 60% of the irrigated area. A further 20% of the irrigated area is served by Deep Tube
Wells (DTW), owned and rented out mostly by public authorities such as Bangladesh Agriculture
Development Corporation (BADC) and Barind Multipurpose Development Authority (BMDA), etc.
STWs number about 1.5 million and are mostly dependent on diesel as a power source. The larger-sized
DTWs number about 35 thousand and are predominantly operated on grid-based electricity. Village
electrification is estimated currently to be about 60% in Bangladesh3, indicating a continuing dependence
on diesel-based irrigation into the foreseeable future.
Figure 2: Bangladesh: Break-up of STWs and DTWs by power source
Source: Minor Irrigation Survey Report 2012-13, Ministry of Agriculture, Government of Bangladesh
In India, the Green Revolution in the 1950s provided the first concrete push towards village electrification,
primarily aimed at providing grid electricity for agricultural uses. Over the last decade, a more intensive
village electrification drive has been taken up under the RGGVY4 program but the progress has varied
significantly across the states. Grid-based electricity to agriculture continues to be heavily subsidized
under political considerations in most states and over time, has been a neglected segment for the
distribution utilities serving such agricultural consumers. Electricity supply to agriculture therefore is
unreliable or heavily curtailed in several parts of the country to limit the extent of subsidy. There is thus a
growing dependence on diesel pump sets even in electrified areas of the country, albeit as a back-up to
electricity pump sets.
The plot below indicates the spread of Indian states with regards to extent of rural electrified households
and the proportion of diesel to total agricultural pump set as on 2008-09 for India and as on date for
Bangladesh. It shows that the eastern states of Bihar, Jharkhand, Orissa and West Bengal along with
Uttar Pradesh, have high proportions of diesel pump sets in operation, corresponding to low levels of
electrification, quite similar to Bangladesh. In fact, Uttar Pradesh, according to the 4th Minor Irrigation
census of India, accounts for half of India’s diesel-based agricultural pump sets. Most diesel pump sets in
these states are likely to be owned by farmers without access to the electricity grid.
2 The last minor irrigation census (4th Census) of 2006-07 in India estimated approximately 15 million electric pump sets and 6 million diesel pump sets.
Although different Government of India census have provided widely varying numbers, the more widely accepted estimate currently is 18 million electric pump sets and 7 million diesel pump sets. 3 50,564 out of 84,320 villages electrified as per Rural Electrification Board of Bangladesh (http://www.reb.gov.bd/index.php/abreb/stat)
4 The Rajiv Gandhi Grameen Vidyutikaran Yojana, is a Central Government programme in India, which provides 90% grant funding for undertaking
capital works for creating the backbone electricity infrastructure in a village.
83%
17%
STW in Nos. (Total = 1.52 million)
Diesel
Electric
8%
92%
DTW in Nos. (Total = 35.3 thousand)
Diesel
Electric83%
17%
STW in Nos. (Total = 1.52 million)
Diesel
Electric
8%
92%
DTW in Nos. (Total = 35.3 thousand)
Diesel
Electric
6
Figure 3: Electrification & dependence on diesel pump sets in Bangladesh & across Indian States
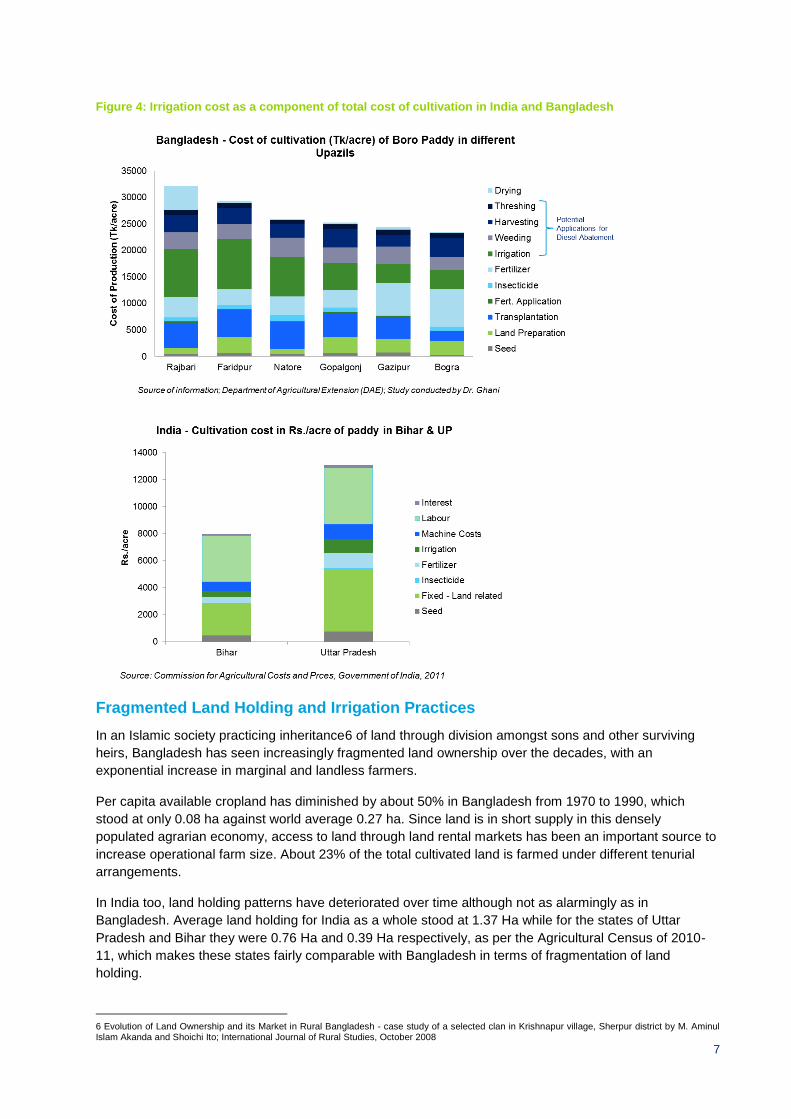
Both in Bangladesh and India therefore, there is large-scale dependence on diesel-based agricultural
pumping. Operating cost of diesel based irrigation equipment is high. With increasing energy intensity of
irrigation combined with an increasing cost of diesel, irrigation cost, for example, has started to assume on
an average about 25% of the variable cost of rice production5 in Bangladesh. The same in India is
between 4%-12% depending on the state in which rice is cultivated. Uttar Pradesh and Bihar, which lag
behind in electrification and have high dependence on diesel based pump sets have 12% and 8% of their
total operational cost of rice cultivation accounted for as cost of irrigation (see Figure 4).
Both the countries are dependent on imports to meet their oil needs. Agriculture accounts for bulk of the
diesel consumption in Bangladesh and is the second highest consuming sector following transport in
India. Abating diesel use in irrigation can contribute significantly towards reduction in GHG emissions and
in-situ pollution, reduce import dependence and lower the cost of irrigation. In India, the states of Uttar
Pradesh and Bihar have been analysed in this report as candidate states for diesel abatement through
SIEV, keeping in mind the low levels of electrification and the high incidence of diesel pump sets in these
states.
5 Irrigation Institutions of Bangladesh: Some Lessons, Nasima Tanveer Chowdhury, 2012. Irrigation Institutions of Bangladesh: Some Lessons, Problems, Perspectives and Challenges of Agricultural Water Management, Dr. Manish Kumar (Ed.), ISBN: 978-953-51-0117-8
Haryana
HP
Kerala
Punjab
Rajasthan
Uttar Pradesh Uttarakhand
C'garh
Delhi
Gujarat
Madhya Pradesh
Maharashtra
APJ&K
Karnataka
Chattisgarh
Bihar
Jharkhand
Orissa
West Bengal
Bangladesh
0%
15%
30%
45%
60%
75%
90%
- 200 400 600 800 1,000
Pro
po
rtio
n o
f D
iese
l to
To
tal (
Die
sel+
Ele
ctri
c) P
um
p S
ets
Proportion of Households Electrified (per 1000)
Note: Size of bubble indicates number of diesel pumpsets (e.g., 3.75 Mn inUttar Pradesh, 0.67 Mn in Bihar, 1.27 Mn in Bangladesh,etc.)
Source: (a) NSS Report No. 535: Housing Condition and Amenities in India: July, 2008-June 2009 for Households Electrified.
(b) Water & Related Statistics, December 2010, Central Water Commission, Government of India
7
Figure 4: Irrigation cost as a component of total cost of cultivation in India and Bangladesh
Fragmented Land Holding and Irrigation Practices
In an Islamic society practicing inheritance6 of land through division amongst sons and other surviving
heirs, Bangladesh has seen increasingly fragmented land ownership over the decades, with an
exponential increase in marginal and landless farmers.
Per capita available cropland has diminished by about 50% in Bangladesh from 1970 to 1990, which
stood at only 0.08 ha against world average 0.27 ha. Since land is in short supply in this densely
populated agrarian economy, access to land through land rental markets has been an important source to
increase operational farm size. About 23% of the total cultivated land is farmed under different tenurial
arrangements.
In India too, land holding patterns have deteriorated over time although not as alarmingly as in
Bangladesh. Average land holding for India as a whole stood at 1.37 Ha while for the states of Uttar
Pradesh and Bihar they were 0.76 Ha and 0.39 Ha respectively, as per the Agricultural Census of 2010-
11, which makes these states fairly comparable with Bangladesh in terms of fragmentation of land
holding.
6 Evolution of Land Ownership and its Market in Rural Bangladesh - case study of a selected clan in Krishnapur village, Sherpur district by M. Aminul Islam Akanda and Shoichi Ito; International Journal of Rural Studies, October 2008
8
Figure 5: Land holding pattern in Bangladesh and India
In Bangladesh, ownership and management of diesel pump sets is rarely by individual farmers. Most
commonly, a pump operator is engaged for the whole irrigation season, who collects a seasonal fee in
cash or kind for operating the pump at site for the user. Larger water sellers who may also be rich farmers
selling irrigation water to adjoining users is also practiced in parts and such water sellers could own
multiple large sized pumps and tube wells.
Such informal equipment / water markets for irrigation have developed quickly in Bangladesh over the last
two decades. In case of shallow and deep tube wells, the owners of the irrigation equipment enter into
deals for irrigation services with neighboring farmers in addition to using the equipment for irrigating their
own land, where applicable. With the expansion of water markets in the private sector, the pricing system
has also undergone changes to suit varying circumstances. There is no single rate or uniform method for
payment of irrigation water. Per hectare water rates vary not only from one area to another but also
depend on the type of well within a particular area. In the initial stage, the most common practice was
sharing one-fourth of the harvest with the owner of the equipment in exchange for water. That gave way to
a flat seasonal fee, the rate depending on the availability of electricity and the price of diesel. In recent
years, the market has moved toward fees per hour of tube well operation.
In Uttar Pradesh, Bihar and parts of Eastern India, the benefits of groundwater irrigation have come
through three routes: in large part through purchased pumped water and to lesser extent through
improved manual irrigation technologies as well as through the Free Boring Scheme7, which provided
subsidy for individual ownership of tube well and irrigation pump set. This is under a setting where the flat
power tariff environment introduced in Uttar Pradesh and Bihar in the 1980s and the consequent financial
losses to the distribution utilities, contributed to a rapidly deteriorating power supply environment in these
states leading to large-scale dieselization of agricultural pump sets.
Role of SIEV – Target Business Segments
The Solar Irrigation with Electric Vehicle (SIEV) approach is aimed at employing an irrigation system of a
pump and a motor capable of being operated interchangeably through electricity from solar PV, stored
electrical energy in the lithium-ion battery (LIB) or through diesel power to meet peaking requirements.
Enabling diesel-solar-LIB hybrid by using second hand LIB after its useful life in electric vehicles, can
reduce initial investment in solar panels, better suit the fragmented ownership observed in Bangladesh
and parts of India and accelerate repayment of the investment through productive use of the stored
surplus solar energy.
7 Under the Free Boring Scheme introduced in the 1980s, the minor irrigation department was to undertake the preparation of borewells (shallow
tubewell) free of cost for small and marginal farmers; additionally, varying levels of subsidy were offered on diesel pumps to small and marginal farmers matching the degree of their social and economic backwardness.
0%
20%
40%
60%
80%
100%
1970-71 1980-81 1990-91 2000-01
India - Land holding pattern
Large - > 10 Ha
Medium - 4 to 10 Ha
Semi-Medium - 2 to 4 Ha
Small - 1 to 2 Ha
Marginal - < 1 Ha
71 Mn Ha 88 Mn Ha 106 Mn Ha 119 Mn Ha
0%
20%
40%
60%
80%
100%
1977 1984 1996 2013
Bangladesh - Land holding pattern
Large - > 3 Ha
Medium - 1 to 3 Ha
Marginal & Small - < 1 Ha
Landless
6.3 Mn Ha 10 Mn Ha 11.8 Mn Ha 13.07 Mn Ha
9
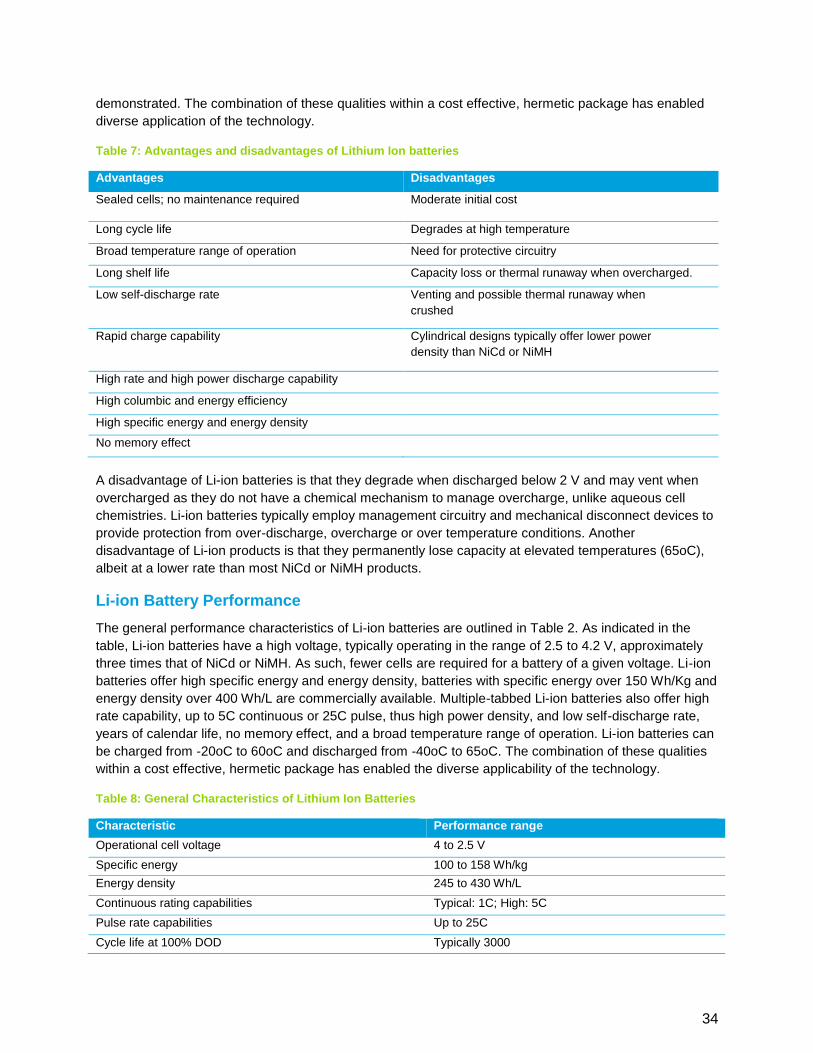
A lithium-ion battery has several advantages over a conventional lead-acid battery. Primary amongst
these is its high capacity, which makes it substantially more compact than a lead-acid battery of the same
kWh rating. The performance of LIB is also superior with a flatter discharge curve enabling the usage of
LIB for a range of applications. A comparative assessment of LIB and lead acid batteries is provided at
Annexure 2 : Lithium Ion Battery. A lighter and more compact storage device is more beneficial as it
offers mobility to the entire system and can thus potentially open up usage not only for multiple farmers
but also for non-agricultural usage. Since the target areas under discussion are un-electrified in nature,
the economic value of a compact, high capacity and mobile electrical source can be very high.
The commercial launch of electric vehicles is of recent vintage. It is thus important to carefully assess the
volume and possible cost involved in making second-hand batteries available for use in solar irrigation.
This shall remain an evolving factor in the study and Annexure 1 summarize the considerations
determining volume and price of second-hand LIB.
The large number of diesel based pump sets operated on STWs in both Bangladesh and parts of India
(particularly in the un-electrified regions of Uttar Pradesh and Bihar) and its cost implications in cultivation,
makes them potentially attractive for substitution with solar based irrigation being considered under the
SIEV approach.
Given the diversity in land ownership patterns and the variations in economic and the sociological factors,
varying models of irrigation through STWs have emerged in both Bangladesh and India. Following is a
brief description of various operating models with a discussion on what could possibly be the target
segments for SIEV in the two countries.
Self-ownership & usage of Irrigation Equipment: This is where apart from owning the STW, the farmer owns and operates its own water extraction device (WED), i.e., diesel pump set. It requires ability to invest upfront in the capital cost of the tube well as well as the pump set infrastructure, either from own funds or through subsidized schemes such as the Free Boring Scheme in India, discussed earlier. With increasing fragmentation of land holdings and increase in marginal farmers, this is not an economical option for most farmers and is therefore restricted only to the medium and large farmers. Although the minor irrigation census in India indicates a very high level of ownership of minor irrigation equipment in both Uttar Pradesh and Bihar, various studies have indicated that no more than one-third of the farmers
8 own and operate their own WED and a majority of them are also water sellers.
Organized Pump Operators: This is the most common mode of irrigation through STWs in Bangladesh, with formal and informal associations, often supported by NGOs, owning and operating WEDs on a seasonal arrangement where they extract and supply water to the farmers as and when needed through the season and the farmer compensates the operator after harvesting the crops. Mobility of WEDs is an important consideration in this form of operation and modal unit sizes of pump therefore are in the range of 2 to 5 hp. Bulk of the diesel pump sets in Bangladesh fall currently in this segment.
Water Seller Market: This is common in Uttar Pradesh and Bihar and also in parts of Bangladesh, where the larger farmers have invested in tube wells and larger WEDs to provide irrigation water to a group of farmers in the adjoining areas through an established water distribution infrastructure. For example, in parts of Uttar Pradesh, over three-fourths of farmers are dependent on purchased water from large sellers for cultivation of paddy (Shah & Saxena, 2001). Modal unit sizes of such pumps are larger and in the range of 15 to 20 hp.
While the attractiveness of solar based irrigation in general and SIEV in particular is premised on high avoided operational cost of diesel based irrigation, the SIEV approach captures a powerful additionality in the form of offering a potentially mobile source of surplus energy, which can align with existing mobile WED based irrigation services as well as power non-irrigation agricultural energy applications and / or home and community based energy applications.
8 Pant Niranjan, 2004, Trends in Groundwater Irrigation in Eastern and Western UP, Economic and Political Weekly;
Shah & Saxena, 2001, Wells and Welfare in the Ganga Basin: Essay on Public Policy and Private Initiative
10
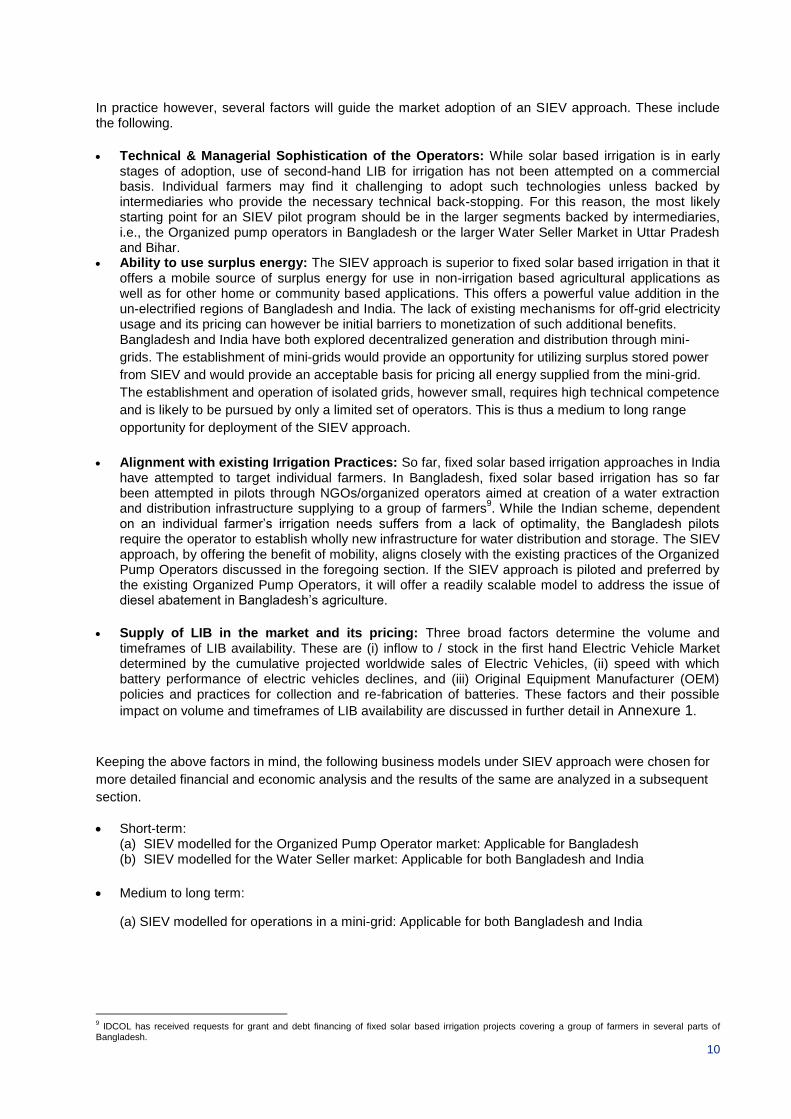
In practice however, several factors will guide the market adoption of an SIEV approach. These include the following.
Technical & Managerial Sophistication of the Operators: While solar based irrigation is in early stages of adoption, use of second-hand LIB for irrigation has not been attempted on a commercial basis. Individual farmers may find it challenging to adopt such technologies unless backed by intermediaries who provide the necessary technical back-stopping. For this reason, the most likely starting point for an SIEV pilot program should be in the larger segments backed by intermediaries, i.e., the Organized pump operators in Bangladesh or the larger Water Seller Market in Uttar Pradesh and Bihar.
Ability to use surplus energy: The SIEV approach is superior to fixed solar based irrigation in that it offers a mobile source of surplus energy for use in non-irrigation based agricultural applications as well as for other home or community based applications. This offers a powerful value addition in the un-electrified regions of Bangladesh and India. The lack of existing mechanisms for off-grid electricity usage and its pricing can however be initial barriers to monetization of such additional benefits. Bangladesh and India have both explored decentralized generation and distribution through mini-
grids. The establishment of mini-grids would provide an opportunity for utilizing surplus stored power
from SIEV and would provide an acceptable basis for pricing all energy supplied from the mini-grid.
The establishment and operation of isolated grids, however small, requires high technical competence
and is likely to be pursued by only a limited set of operators. This is thus a medium to long range
opportunity for deployment of the SIEV approach.
Alignment with existing Irrigation Practices: So far, fixed solar based irrigation approaches in India have attempted to target individual farmers. In Bangladesh, fixed solar based irrigation has so far been attempted in pilots through NGOs/organized operators aimed at creation of a water extraction and distribution infrastructure supplying to a group of farmers
9. While the Indian scheme, dependent
on an individual farmer’s irrigation needs suffers from a lack of optimality, the Bangladesh pilots require the operator to establish wholly new infrastructure for water distribution and storage. The SIEV approach, by offering the benefit of mobility, aligns closely with the existing practices of the Organized Pump Operators discussed in the foregoing section. If the SIEV approach is piloted and preferred by the existing Organized Pump Operators, it will offer a readily scalable model to address the issue of diesel abatement in Bangladesh’s agriculture.
Supply of LIB in the market and its pricing: Three broad factors determine the volume and timeframes of LIB availability. These are (i) inflow to / stock in the first hand Electric Vehicle Market determined by the cumulative projected worldwide sales of Electric Vehicles, (ii) speed with which battery performance of electric vehicles declines, and (iii) Original Equipment Manufacturer (OEM) policies and practices for collection and re-fabrication of batteries. These factors and their possible
impact on volume and timeframes of LIB availability are discussed in further detail in Annexure 1.
Keeping the above factors in mind, the following business models under SIEV approach were chosen for
more detailed financial and economic analysis and the results of the same are analyzed in a subsequent
section.
Short-term: (a) SIEV modelled for the Organized Pump Operator market: Applicable for Bangladesh (b) SIEV modelled for the Water Seller market: Applicable for both Bangladesh and India
Medium to long term:
(a) SIEV modelled for operations in a mini-grid: Applicable for both Bangladesh and India
9 IDCOL has received requests for grant and debt financing of fixed solar based irrigation projects covering a group of farmers in several parts of
Bangladesh.
11
Prototype Implementation
Field Test in Bangladesh
Li ion battery procured under the program was tested in field conditions without any additional cooling but
operated with the battery management system (BMS) primarily to protect the battery from over discharge
and regulate the charging to prevent from any operational damage. The battery was charged from an
array of PV panels of 900 Wp located at the Bari Site using an MPPT..
Set-up of the Test Facility
The Figures 7 and 8 shows the Li ion battery with the BMS and the DC electric motor coupled to a
centrifugal pump connected to the Li ion battery through the BMS.
Figure 6: Overview of Battery Case
Figure 7: Experimental set-up for Technical Validation at BARI
12
The centrifugal pump used for validation was locally manufactured and is suitable only for surface water
lifting with a maximum suction head of 6.50 m. The DC motor was also of local make with a name plate
rate of 746 W and a maximum operating voltage of 60 V and an RPM of 3000. The pipe diameter used
was 38 mm.
The Li ion battery - Lithium polymer type comprises of 14 cells. The cell rated voltage is 3.7 V and the
battery rated voltage is 51.8 V. The maximum cell voltage is 4.2 V and the battery voltage is 58.8 V. The
expected life is 5 years and can provide an output of 5.2 kWh at 80% depth of discharge (DOD) and is
expected last about 1800 cycles.
During the experiment voltage of the Li ion battery, the discharge current and the water flow rate were
recorded. The results of one such experiment is shown in the Figures below.
Figure 8: Variation of voltage and current during the experiment
The experiment was run from 10.40 AM to 2.00 PM (total duration 3 hours 10 minutes). The current
discharge rate fell from 10 amperes to 8 amperes steadily during the entire experiment indicating a drop
of 20% and the voltage dropped from 53 V to 48.2 V a drop of 9%. The power output from the battery
dropped from 530 W to 385.6 W during the same period. The water flow rate dropped from 177 liters per
minute to 160 liters per minute over the same period. During the period the water discharged was 32,063
liters. Indicating that a drop in total volume of water pumped by about 4.66%. The approximate kWh
consumed during this period was about 1.37 kWh. These parameters demonstrate very stable range of
operations and are substantially superior to what can be expected from a lead-acid battery, even though
the battery and BMS used in the experiment are not optimally designed for the experiment.
13
Financial and Economic Evaluation
Description of Analytical Framework
Establishing the financial and economic viability of the SIEV scenarios will first require the understanding
of operating cost implications related to the Existing Baseline cases (say DG based pumps, PV + DG or
standalone PV) and then quantifying the additional benefits offered by SIEV scenarios (e.g., in terms of
savings in diesel, additional revenue potential by using batteries for non-irrigation applications, etc.). The
overall analytical framework for establishing the financial and economic viability of the SIEV scenarios is
shown below:
Figure 9 : Overall Analytical Framework
The key elements of the analytical framework are the following.
1. System Sizing: The focus of the system sizing is to ascertain an optimal combination of pump-motor capacity, the solar PV capacity and the LIB capacity to meet the energy requirements for irrigation. The irrigation requirement is based on the assumptions related to crop pattern across seasons in a year, irrigation days and total dynamic head in the region. Different options for meeting the energy requirement have been analyzed, with Existing Baseline cases considering DG based pumps, PV + DG or standalone PV compared with the SIEV scenario. For the purpose of modelling, representative irrigation requirements have been considered for Gazipur in Bangladesh and for Bihar (equally applicable for Eastern Uttar Pradesh) in India.
2. Financial cost: Comparison has been made through a life-cycle cost-benefit assessment undertaken separately for SIEV scenario with each Baseline Case. The life cycle cost-benefit analysis analyzes the capital cost and operational expenditure savings between SIEV and a Baseline Case. An important aspect of analyzing life-cycle costs is the horizon over which these are computed. As the prime focus of the analysis is to understand the viability of using second hand electric vehicles (in
14
combination with solar) with conventional pumps used for irrigation pumping, we have aligned the life cycle of system for analysis with the life of pumps (assumed as 10 years). A salvage value of 30% is considered for Solar PV system at the end of 10 years. Replacement of batteries has been duly considered during the life cycle of the system where required.
3. Additional LIB benefits: LIB offers additional benefit of utilizing the surplus energy generated by Solar PV during non-irrigation hours. Additional revenue by means of using LIB for diesel-based non-irrigation applications (like Groundnut Sheller, Power Weeder, Compost Separator etc.) can be considered as an additional benefit stream.
4. Economic consideration: For the economic analysis, economic benefits available to the countries
have been factored in, particularly with respect to savings in diesel subsidy, which is accounted as a
benefit stream.
It is to be noted that the financial and economic analysis ignores the consideration of capital subsidy for
deployment of solar systems both in the baseline and SIEV scenarios, although substantial subsidies are
currently provided by the Governments in Bangladesh as well as India for deployment of solar systems.
Outline of SIEV Cases considered (key assumptions in Annexure 4)
The economic and financial analysis considers business models in line with discussions in Section 2 of
this report. The business cases analyzed are based on the representative agricultural and irrigation
scenario in Bangladesh and India (see Annex 4. The key business cases analyzed are outlined below.
Case 1: Organized Operator Model
Under the organized operator model, a group of farmers would avail irrigation services from an operator
(e.g., an NGO), who in turn invests in the new system either directly or through a financial intermediary.
The investment decisions is to be based on the life-cycle cost savings achieved through the new system
compared with a baseline case of diesel powered pump set. Two other baseline cases are also
considered for comparison with SIEV. These are in the form of standalone solar powered pump set and a
diesel-solar hybridized pump set system with 80% of peak requirements met from solar and the balance
from diesel.
The financial analysis assumes one fixed Solar PV panel and compatible LIB-DG hybrid, with an existing
pump set, to address irrigation needs of 3-4 farmers, with a combined irrigable land area of say 4
hectares. This case has been considered only for Bangladesh, in line with the current irrigation practices
in the countries.
Case 2: Water Seller Model
A Water Seller covering a land area of say 5/6 hectares for irrigation in the un-electrified regions has been
considered for this business case. In this model, the water seller installs solar pump set for irrigation and
the stored surplus energy is used to run household applications with user charges based on per kWh
basis.
In Bangladesh, for shallow and deep tube wells, the owners of the irrigation equipment enter into deals for
irrigation services with neighboring farmers in addition to using the equipment for irrigating their own land.
This model could potentially integrate with solar based micro and mini grid programs that are being
conceived in some parts of Bangladesh as well as India.
The analysis is undertaken in the context of both India (Bihar) and Gazipur in the Bangladesh context.
The investment decisions is based on the life-cycle cost savings achieved through the new PV system,
utilizing existing pump set, compared with a baseline scenario of diesel powered pump set. Two other
baseline cases are also considered for comparison with SIEV. These are in the form of standalone solar
15
powered pump set and a diesel-solar hybridized pump set system with 80% of peak requirements met
from solar and the balance from diesel.
Case 3: Self owned irrigation Model
The self-owned irrigation infrastructure is applicable to farmers who own the STW and the WED and are
not reliant on external parties for irrigation services. This has potential applications for medium and large
farmers in India, and has been evaluated for a representative scenario in India.
For financial analysis, irrigation coverage of 1 ha of landholding is considered in Bihar (India). The system
consists of 1 fixed Solar PV panel and compatible LIB-DG hybrid to address irrigation needs. Surplus
energy shall be utilized for non-irrigation agriculture use as well as for home applications.
The investment decisions is based on the life-cycle cost savings achieved through the new system
compared with a baseline scenario of diesel powered pump set.
Results of key scenarios
The financial and economic analysis of key scenarios are based on a comparison of cost of irrigation
between Baseline cases and the SIEV scenarios. The results of the financial analysis indicate that the
financial viability of the SIEV is dependent upon ability of the business model to effectively utilize the LIB
both during irrigation as well as non-irrigation days for generating additional revenues (see Figure 10).
For this reason, the self-owned irrigation model does not appear financially attractive, as it offers limited
opportunities for earning a commercial value from the usage of surplus, stored energy in the LIB.
Under both the Organized Operator and Water Seller models, SIEV scores better than all the baseline
cases on a comparison of life-cycle costs after considering additional revenues from sale of surplus
energy stored in the LIB.
Figure 10 : Lifecycle Cost Analysis (NPV in USD)
*Net cost – SIEV comprises total cost in NPV terms, whereas Effective Cost – SIEV considers the additional revenue from non-irrigation applications
16
** Additional revenue considers revenue earned only by utilizing surplus stored energy in LIB (assuming only 75% of the surplus power generated is
utilized). Diesel subsidy avoided has been considered only towards LIB utilization for irrigation and non-irrigation applications and hence is an
additionality over the 100% solar case.
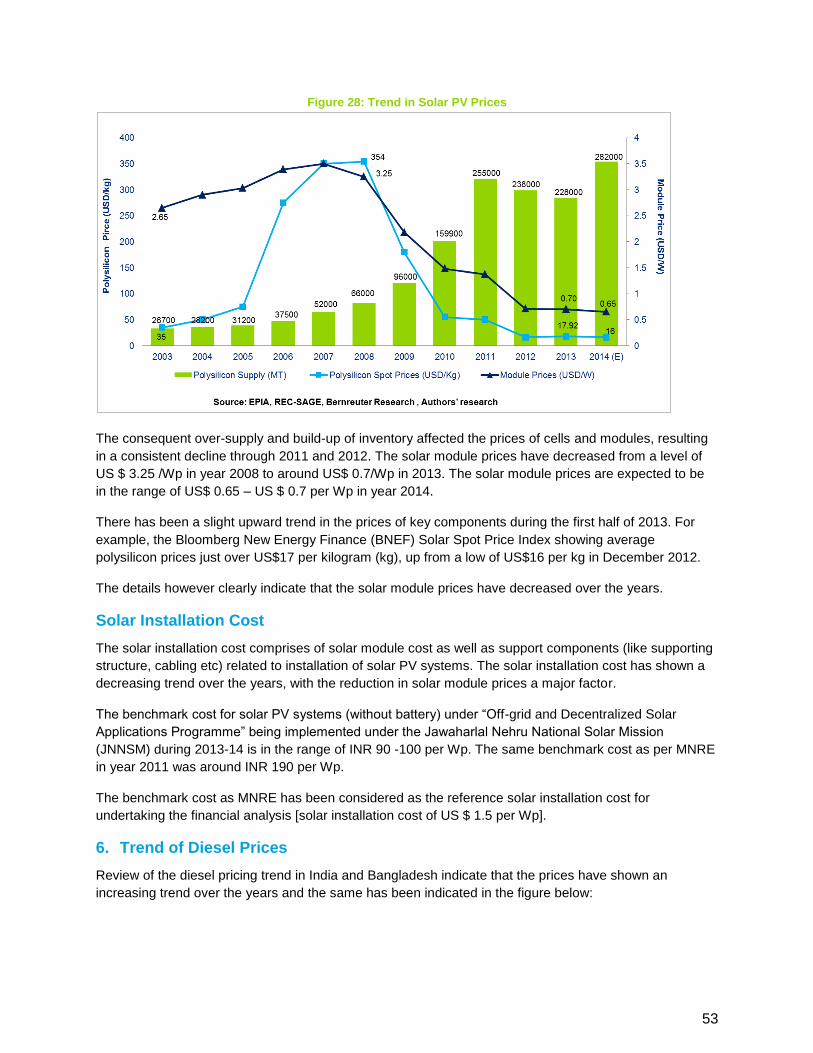
If the number of crops in a year is increased from 2 to 3 in the case of Bangladesh, the scenario changes
considerably with lifecycle cost of SIEV being nearly equal to stand alone diesel operations, even without
the need for considering any additional revenues from surplus energy in the LIB.
Figure 11: Life Cycle Cost comparison (Gross basis in USD) for 3 crops/Yr under Organized Operator Model
The above scenario has been analyzed in the context of Bangladesh (Gazipur for 2 crops and Muradpur (Dokkhin Para),
Nandigram, Bogra for 3 crops) with enhanced pump size from 5 HP (for 2 crops per year) to 7.5 HP (for 3 crops per year) to
meet the increased irrigation requirements. The corresponding irrigation requirements are detailed in Annexure 4 : Key
Assumptions of Financial & Economic Analysis.
The analysis demonstrates the inherent incentives of adopting a SIEV approach, where marginal cost of
irrigation starts decreasing with increased cropping intensity, as opposed to predominantly diesel-based
operations.
Other key parameters impacting viability of SIEV
The viability of the SIEV scenario is sensitive to a couple of other factors, namely the LIB price and
additional revenue earnings (from sale/use of surplus energy in non-agricultural applications). The
following paragraphs outline the sensitivities to these parameters.
A. Additional revenue considerations
The proposed SIEV scenario aims at utilizing LIB for irrigation applications. During non-irrigation days, the
LIB (charged through solar energy) can be utilized for non-irrigation applications, thereby providing option
of additional revenues (or alternatively, savings in the cost of energy incurred currently). A number of
initiatives are already aimed at propagating use of solar energy for undertaking various agricultural
activities. For example, the Bangladesh Agricultural Research Institute (BARI) has identified different
agriculture based applications which can be operated using solar energy (see Annex 4).
A number of cost elements in agricultural production utilize diesel based applications such as in weeding,
harvesting, threshing. These collectively account for a further 10-15% of the overall cost of cultivation (see
Figure 4).
The table below shows the effect of the sensitivity of considering additional revenues from surplus energy
under the discussed business cases.
17
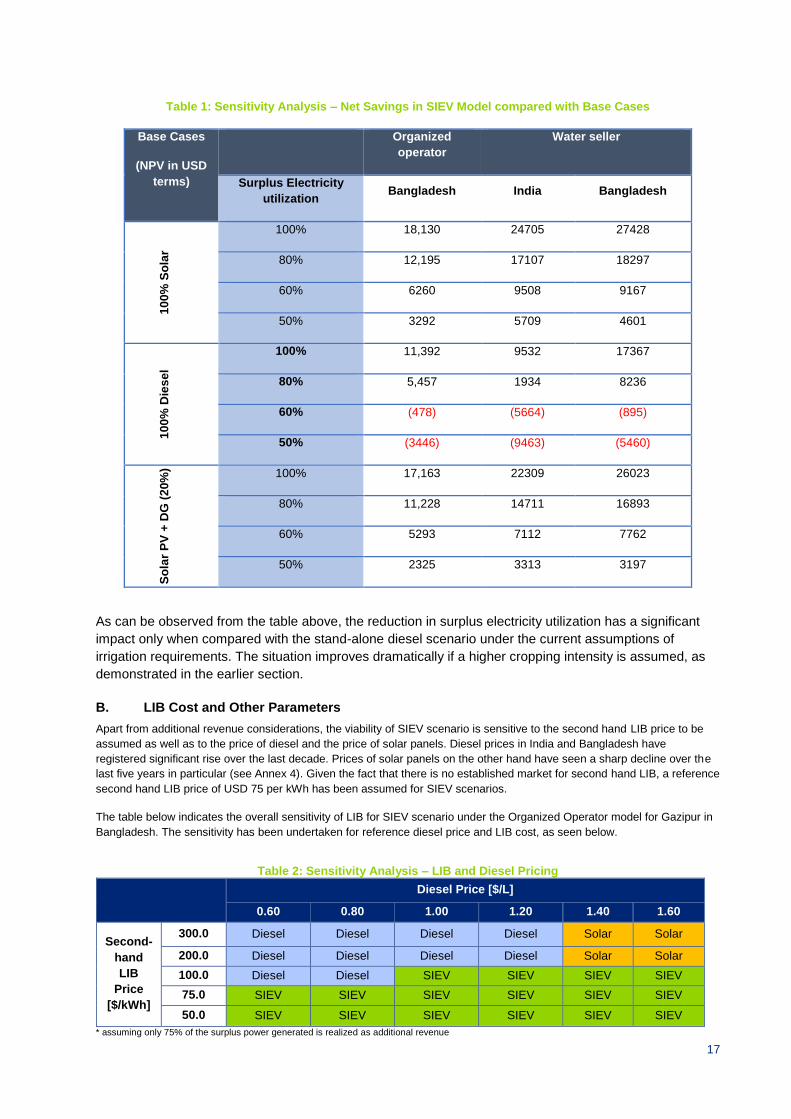
Table 1: Sensitivity Analysis – Net Savings in SIEV Model compared with Base Cases
As can be observed from the table above, the reduction in surplus electricity utilization has a significant
impact only when compared with the stand-alone diesel scenario under the current assumptions of
irrigation requirements. The situation improves dramatically if a higher cropping intensity is assumed, as
demonstrated in the earlier section.
B. LIB Cost and Other Parameters
Apart from additional revenue considerations, the viability of SIEV scenario is sensitive to the second hand LIB price to be
assumed as well as to the price of diesel and the price of solar panels. Diesel prices in India and Bangladesh have
registered significant rise over the last decade. Prices of solar panels on the other hand have seen a sharp decline over the
last five years in particular (see Annex 4). Given the fact that there is no established market for second hand LIB, a reference
second hand LIB price of USD 75 per kWh has been assumed for SIEV scenarios.
The table below indicates the overall sensitivity of LIB for SIEV scenario under the Organized Operator model for Gazipur in
Bangladesh. The sensitivity has been undertaken for reference diesel price and LIB cost, as seen below.
Table 2: Sensitivity Analysis – LIB and Diesel Pricing
Diesel Price [$/L]
0.60 0.80 1.00 1.20 1.40 1.60
Second-
hand
LIB
Price
[$/kWh]
300.0 Diesel Diesel Diesel Diesel Solar Solar
200.0 Diesel Diesel Diesel Diesel Solar Solar
100.0 Diesel Diesel SIEV SIEV SIEV SIEV
75.0 SIEV SIEV SIEV SIEV SIEV SIEV
50.0 SIEV SIEV SIEV SIEV SIEV SIEV
* assuming only 75% of the surplus power generated is realized as additional revenue
Base Cases
(NPV in USD
terms)
Organized
operator
Water seller
Surplus Electricity
utilization Bangladesh India Bangladesh
10
0%
So
lar
100% 18,130 24705 27428
80% 12,195 17107 18297
60% 6260 9508 9167
50% 3292 5709 4601
10
0%
Die
se
l
100% 11,392 9532 17367
80% 5,457 1934 8236
60% (478) (5664) (895)
50% (3446) (9463) (5460)
So
lar
PV
+ D
G (
20%
) 100% 17,163 22309 26023
80% 11,228 14711 16893
60% 5293 7112 7762
50% 2325 3313 3197
18
The green shaded cells indicate viability for SIEV scenario at different price levels, whereas other shades indicate the
viability of stand-alone diesel and stand-alone fixed solar based installations.
The table below shows the viability of SIEV scenario at different combinations of LIB cost and solar installation costs.
Table 3: Sensitivity Analysis – LIB and Solar installation cost
Solar installation cost $/kWh
0.60 0.80 1.00 1.20 1.50
LIB Cost
[$/kWh]
300.0 Solar Solar Solar Solar Diesel
200.0 Solar Solar Solar Solar Diesel
100.0 SIEV SIEV SIEV SIEV Diesel
75.0 SIEV SIEV SIEV SIEV SIEV
50.0 SIEV SIEV SIEV SIEV SIEV
As can be seen from the table above, the SIEV scenario, represented in green color is viable at lower LIB cost and solar
installation cost, whereas 100% solar and 100% diesel scenarios become viable at higher LIB and solar installation cost.
The impact of a combination of LIB cost and change in additional revenues is presented in the table below for the example of
Organised Operator in Gazipur.
Table 4: Sensitivity Analysis – LIB cost and Additional Revenue
Additional revenue [$/kWh)
0.00 0.20 0.40 0.60 1.00 1.50
LIB Cost
[$/kWh]
300.0 Diesel Diesel Diesel Diesel Diesel SIEV
200.0 Diesel Diesel Diesel Diesel SIEV SIEV
100.0 Diesel Diesel Diesel SIEV SIEV SIEV
75.0 Diesel Diesel SIEV SIEV SIEV SIEV
50.0 Diesel Diesel SIEV SIEV SIEV SIEV
* assuming only 75% of the surplus power generated is realized as additional revenue
The viability of SIEV scenario (shaded in green), at various levels of LIB cost depends largely upon the
potential for generating additional revenues, whereas at lower revenue per kWh, 100% diesel becomes
more attractive irrespective of LIB cost.
Conclusion on financial & economic viability
SIEV in Bangladesh was approached with the hypothesis that mobility offered by the hybrid of diesel,
solar and LIB, made it a practical and more attractive alternative to currently mobile diesel powered pump
sets. It offers the potential of a practical solution for private automakers too and holds the promise of
increased and improved availability and a rapid reduction in system costs, both on account of LIB and
solar PV costs predicted to decrease in real terms over time.
Financial and economic analysis indicates that the life-cycle cost of the PV-LIB-DG system is likely to be
lower than that of diesel powered pump sets, if deployed in areas with higher cropping intensities. If the
surplus energy stored in the LIB is utilized suitably for non-irrigation purposes, the SIEV scenarios
become substantially more attractive than all evaluate baseline scenarios.
As pointed out earlier, the above analysis does not consider any subsidy for direct solar or solar hybrid
systems, including for SIEV. The provision of subsidy, which is invariably considered for solar based
irrigation schemes, will make it even more attractive in financial terms to the farmers.
The SIEV approach thus holds promise for deployment in Bangladesh and India, once the supply chain,
post-life disposal and pricing aspects develop with increased market penetration of electric vehicles.
19
Recommendations
Through this study, prototype implementation demonstrated adequacy of Li-ion battery’s performance for
solar-powered small scale irrigation. Financial and economic analysis indicated strong rationale of using
2nd
-hand Li-ion battery for irrigation, while advantage of the proposed use of battery over diesel and fixed
solar scenarios varies across geographies and communities, and heavily depends on factors such as
current irrigation energy cost, crop intensity, 2nd
-hand battery price and additional income generation
through surplus electricity.
On demand side, the findings from the study can further inform policy dialogues in context of multiple
policy goals and relevant World Bank and its development partners’ programs. In Bangladesh,
stakeholders10
agreed that solarization of diesel pump-sets is a priority for the country, and the proposed
approach is worth further examination as a possible measure to improve return on investment in solar
pumping, in particular in combination with the ongoing solar pumping projects (financed by the Bank’s
RERED program) and through utilization of excess electricity through battery.
On supply side, the findings contribute to the threads of research on cost and benefit of post-EV battery
applications11
to improve EVs’ prospects to replace fossil-fuel based transportation energy. Given that
supply volume of 2nd
-hand battery is likely to ramp up in 2018-2020, policymakers and industry actors may
consider next few years as a period for further validation. Donors (e.g. Japan) have expressed interests in
participating and possibly supporting such efforts.
Upon further dissemination of the findings and consultations, it is recommended that the SIEV initiative
move from a technical validation stage to multi-site, multi-year social validation through local and
international partnerships. Scope of the next phase of validation may include the following 5 components:
1. Selection of suitable project sites, through assessment of agricultural conditions (cropping pattern, irrigation requirement, energy cost) as well as local sponsor’s implementation capacity.
2. Engineering exercise on both application demand (solar and pump-set system sizing, agricultural mechanization and electrification) and systems supply (battery repurposing, control modules) to minimize cost and satisfy performance requirements, with due consideration to material safety and environmental safeguards including on end-of-life collection and recycling chains.
3. Experimentation over 1 to 3 years to apply 2nd
-hand Li-ion battery through full irrigation seasons and for non-irrigation applications, through local financial intermediary and partial financial contribution from participating communities where appropriate.
4. Data collection from the project sites; monitoring and evaluation of cost and benefit of battery-powered solar pumping; course correction and incremental adjustments in site-level implementation; and analysis for relevant policy considerations (e.g. diesel and solar subsidy, agricultural extension, battery tariff).
5. Synthesis of findings and lessons toward the end of multi-year validation stage; identification of risks and mitigation measures; feasibility assessment of sustainable large-scale adoption and policy barriers if any; and recommendations of action plans for a range of stakeholders.
The proposed approach is innovative in integrating solutions to challenges and opportunities across
energy, water and food in poorer countries as well as transport and industry in richer countries. Success
in delivering transformational impact will take mobilizing technical and financial resources, catalyzing
actions and facilitating learning, through partnerships across private and public.
10
Including Ministry of Power, Energy and Mineral Resources, IDCOL (Infrastructure Development Corporation), BARI (Bangladesh Agricultural Research Institute), and BUET (Bangladesh University of Engineering and Technology). Discussion note in Annex. 11
In developed economies, both from public (e.g. US Department of Energy) and private (automakers and battery suppliers) as summarized in Annex.
20
Annexure 1 : Utility scale storage markets
and volume/price of second-hand LIB
The purpose of this Annex section is to formulate an informed view on possible volume and price for post-
EV second-hand lithium ion batteries by examining supply and demand factors of mid-to-large scale
storage12.
Volume and price, while highly uncertain given the current state of the market development, is
critical as it guides the financial/economic viability and scalability of the proposed SIEV approach.
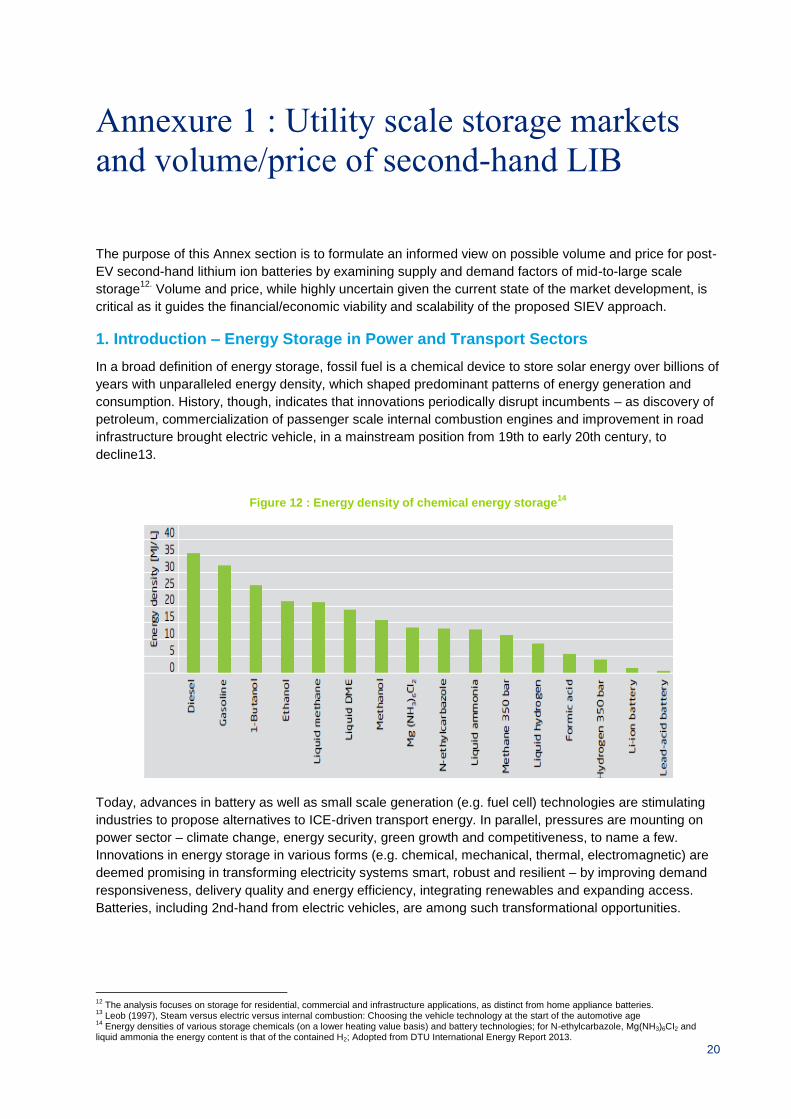
1. Introduction – Energy Storage in Power and Transport Sectors
In a broad definition of energy storage, fossil fuel is a chemical device to store solar energy over billions of
years with unparalleled energy density, which shaped predominant patterns of energy generation and
consumption. History, though, indicates that innovations periodically disrupt incumbents – as discovery of
petroleum, commercialization of passenger scale internal combustion engines and improvement in road
infrastructure brought electric vehicle, in a mainstream position from 19th to early 20th century, to
decline13.
Figure 12 : Energy density of chemical energy storage14
Today, advances in battery as well as small scale generation (e.g. fuel cell) technologies are stimulating
industries to propose alternatives to ICE-driven transport energy. In parallel, pressures are mounting on
power sector – climate change, energy security, green growth and competitiveness, to name a few.
Innovations in energy storage in various forms (e.g. chemical, mechanical, thermal, electromagnetic) are
deemed promising in transforming electricity systems smart, robust and resilient – by improving demand
responsiveness, delivery quality and energy efficiency, integrating renewables and expanding access.
Batteries, including 2nd-hand from electric vehicles, are among such transformational opportunities.
12
The analysis focuses on storage for residential, commercial and infrastructure applications, as distinct from home appliance batteries. 13
Leob (1997), Steam versus electric versus internal combustion: Choosing the vehicle technology at the start of the automotive age 14
Energy densities of various storage chemicals (on a lower heating value basis) and battery technologies; for N-ethylcarbazole, Mg(NH3)6CI2 and liquid ammonia the energy content is that of the contained H2; Adopted from DTU International Energy Report 2013.
21
Figure 13 : SIEV implications to storage market
Figure describes storage market and incremental effects of supply of second-hand LIB (S1 to S2 shift)
and demand for newly identified SIEV application (D1 to D2 shift). Economic principles dictate that price of
second-hand LIB must be below price of new LIB (with superior performance), and above disposal
charges of used LIB. Limited information of future innovations and the breadth of relevant policy
goals/measures make it difficult to develop full-fledged economic model of the equilibrium in the global
storage market. Alternatively, below sections supplement the main report (on D2: SIEV demand) and
characterize i) demand and supply in evolving storage market (S1 and D1); ii) supply volume of 2nd-hand
LIB (S2); iii) new battery price; and iv) possible equilibrium price for 2nd-hand LIB.
2. Evolving Mid-to-Large Scale Storage Market
Over the last years, requirements for robust, efficient and resilient electricity have generated new
demands for storage (e.g. “time shift” or energy arbitrage between low-tariff night time and demand-peak
daytime). Table below lists example storage applications that shape a demand curve (US only), with
economic benefit of introducing storage (justifiable price), and potential installation capacity (volume).
Area Regulation 15-30 min 1 - 40 MW 785 - 2,010 1,012
Electric Service Reliability 5 min - 1 hr 0.2 kW - 10 MW 359 - 978 9,209
Wind Grid Integration, Short Duration 10 sec - 15 min 0.2 kW - 500 MW 500 - 1,000 2,302
*1 Li fecycle, 10 years , 2.5% esca lation, 10.0% discount rate.
*2 MW, 10 years
*3 Benefi t for one year; s torage could be used at more than one location at di fferent times for s imi lar benefi ts .
22
discharging. Traditional large-scale storage technologies such as pumped hydro or CAES (compressed
air energy storage) can only satisfy day-long or hourly discharge duration, while new demands, such as
wind/solar integration to grids, require discharges in minutes or even seconds. Batteries and other
technologies (figure below) have shorter discharge duration, and importantly, upward scalability (e.g. large
scale battery arrays may substitute small CAES as long as lifecycle cost is competitive).
Figure 14 : Storage technologies and characteristics16
While choice of alternative storage technologies in electricity system is path-dependent17 and may well
vary across countries (therefore making estimation of demand curve difficult), rough market segments are
known based on fit between technologies (supply) and applications (demand). For post-EV LIB,
competition is anticipated across substitute technologies and alternative applications as in Figure below.
16
Data Adopted from IRENA Electricity Storage Technology Brief 17
According to current utility systems and choice of configurations, e.g. storage for time shift either at household, distribution, transmission or generation, with varying cost and scalability implications.
Discharge timeEfficiency (%)
Life (years)
Capital cost($/kW)
Power (MW) *2
Pumped hydro
250-1,000
10h
70-80
>30
2,000-4,000
CAES
100-300
3-10h
45-60
30
800-1,000
Batteries *1
3-20
10s-4h
75-90
4-15
1,500-3,000
Flywheel
0.1-10
15s-15m
<85
20
1,000-5,000
Super capacitor
10
<30s
90
5-10 *3
1,500-2,500
*1 Range including lead acid battery and lithium ion battery*2 Size when stacked to be applied to grid systems; unit size can be much smaller for capacitor and battery*3 Assuming 15 to 30 charge-discharge cycles per day and all days per year; greatly vary per applications
Small scaleFast discharge
Large scaleSlow discharge
23
Figure 15 : Mapping storage technologies and applications for electricity systems18
* Blue dotted lines for areas where post-EV LIB is likely to compete with substitute technologies and alternative applications.
18
Adopted from DTU International Energy Report 2013
3. Supply Volume of 2nd-hand LIB from Electric Vehicles
3.1 Background – electric vehicle hype and reality
Governments and industries observed enthusiasms and disappointment around scale, speed and scope
of electric vehicle adoption over the last few years. In 2011, President Obama called for the US becoming
“the first country to have a million electric vehicles on the road by 2015” and breaking oil dependency.
Automakers and suppliers’ production capacities and plans added up to an official estimate of 1.2 million
cumulative EV supply in US market by 201519. China, envisioning to “leap-frog” auto sector’s ICE-based
competition, targeted in its 12th Five-Year Plan to produce 500,000 EVs by 2015, and 5 million by 2020.
Stimulus packages across countries have not delivered on such ambitions, facing a range of obstacles
from battery cost to charging infrastructure, consumer perception and behaviour. After a lag of a few
years, the market environments appear turning favourable, driven by progressive policies such as in
California. Cumulative EV sales worldwide are projected to reach 1 million in 201420.
Three parameters determine how many used LIB will be available and when: i) inflow to/stock in the first
hand EV markets; ii) speed with which vehicle batteries performance decline; and iii) OEM policies and
practices for collection and re-fabrication of batteries. Following sections describe each of the three.
3.2 Inflow to and stock in the first hand market – source of second hand supply
The figure below summarizes actual cumulative EV sales by major automakers and brands, and
projection by countries21. So far Renault-Nissan Alliance has been a clear market leader, with Nissan
Leaf reaching 100,000 units, followed by GM Chevrolet Volt with 74,000 units, around end of 2013. A few
OEMs in addition have demonstrated emerging growth in EV shipment, such as Tesla Motors from the
US and BYD from China, both deploying EVs globally.
It should be noted that the number of vehicles in itself is not a strong enough predictor of the capacity of
second hand battery supply; battery size per vehicle vary according to technical design, ranging from
4.4kWh (Toyota Plug-in Prius) to 85kWh for Tesla Model S (detailed in Table below).
Figure 16 : Global cumulative EV sales, actual and projection (thousand units)22
19
US DoE 2011, One Million Electric Vehicles By 2015 (http://www1.eere.energy.gov/vehiclesandfuels/pdfs/1_million_electric_vehicles_rpt.pdf) 20
IEA 2013, Global EV Outlook Understanding the Electric Vehicle Landscape to 2020 21
Including Battery Electric Vehicle (BEV), Plug-in Hybrid Vehicle (PHEV) and not including Hybrid Vehicle (HEV); actual calculated based on the bottom-up sales figures, and projection adopted from IEA. 22
Actual based on a bottom up sales figures (Table x3); projection by IEA 2003
Secondary data compiled from multiple sources, building on an aggregate industry statistics published by insideevs.com and Wikipedia, and supplemented with information disclosed in company websites.
3.3 Driving behaviors – pace of battery end-of-life for vehicles
As elaborated in Annex 2, charge and discharge cycle is the key determinant of battery degradation,
affecting cell performance in terms of capacity and power. While various surrounding factors (e.g.
temperature, depth of discharge) can accelerate or moderate degradation, driving distance is the primary
driver of degradation (through charge/discharge cycles) as EVs’ driving range between battery charging is
rather limited according to the battery capacity.
Number of years for battery duration for vehicles therefore varies as driving behaviours significantly vary,
across countries and types of drivers. For all passenger vehicles, average kilometres travelled per
car/year range from 18,000 in US, 13,000-14,000 in UK, France and Germany, and 9,000 in Japan24. In
most markets, commercial vehicles (e.g. taxi) travel several times more; urban habitants drive much less
than suburban commuters. Studies have confirmed that drivers of standard sedan EVs25 tend not to self-
limit the driving distance and do not significantly diverge from non-EV driving patterns26.
Large scale battery collection from EVs have not yet started, as majority drivers’ driving patterns indicate
that most batteries have some more years of remaining life. As of 2013, around 100 cases of Nissan Leaf
early adopters had been reported to have lost 15% or more of the battery capacity, concentrated in US
hot climate States such as Arizona and Texas, and with more than double the average kilometres than
neighboring drivers27. These represent earliest cases of end of battery life for EVs used under extreme
conditions (say, batteries of 0.3% of Leaf sold in 2010-2011 to be replaced within 3 years). Collection of
batteries over the next years will take place at various touch-points OEMs embedded in service chains.
3.4 OEM policy and practice – efficiency in conversion to second-hand markets
Touch points known to date, where OEM can collect batteries from EVs, include through warranty, battery
leasing options and battery replacement program.
OEMs have guaranteed EV batteries for 4 years or 80,000 km (Tesla Model S) to 8 years or 160,000 km
(Nissan Leaf, GM Chevrolet Volt) mostly covering defects in materials and workmanship, but not covering
gradual losses of battery capacity. Specifically for battery capacity loss, Nissan in 2013 introduced
additional warranty for 5 years or 100,000 km. In several European markets Nissan also introduced
battery leasing option28 in 2013, with a range of trims from 3 years lease with no more than 12,000 km a
year, to 1 year lease with no more than 24,000 km.
Either before or after end of warranty periods, drivers may choose to pay to replace the original battery
with new one through battery replacement program. Such program was first introduced by Nissan in the
US market in 2014, with which replacement batteries for Leaf were made available for $6,500, conditional
to buy-back of the original battery for $1,000 (therefore net cost to consumers $5,500; and effectively
pushing new battery cost down to $270/kWh). No other OEMs have announced equivalent programs
given the market launch and sales at scale for other EVs have had a few years’ time lag.
What happens to the collected batteries depends on the business models OEMs pursue to capture
residual values from the used batteries, and state of second-hand market development at the time of
collection in the future. Nissan has established a dedicated subsidiary, 4R Energy, with a mandate to
24
Economist, September 2012, The Future of Driving, compiled from national statistics 25
All of the top-3 selling EVs (Nissan Leaf, GM Chevrolet Volt, Tesla Model S) are standard sedan. Some EVs with smaller sales specifically target shorter-range urban drivers with smaller battery (e.g. by European OEMs such as Volkswagen and BMW). 26
For example, Nissan found that the surveyed 7,500 Leaf drivers typically drive 60 km per day (16,000 km per year if driving 5 days per week). (http://edmu.in/1kKWZRK) 27
Electric Vehicle Wiki (http://www.electricvehiclewiki.com/?title=Battery_Capacity_Loss) 28
Leasing option makes purchase price for EVs more competitive; in Germany for example, from roughly €37,000 (with battery) in April 2012 to roughly €24,000 in July 2013 (excluding battery lease of €79 per month), for Nissan Leaf.
“Reuse, Resell, Refabricate, and Recycle” batteries after EVs. GM has envisioned an option to restore
functions of degraded battery cells by replacing electrolyte, treatment much less expensive than
manufacturing new battery cells29.
3.5 Simulating battery availability
Given the three considerations above, accurate estimation of supply volume of second-hand batteries
would involve sophisticated modelling approach to factor in various uncertainties and unknowns. For the
current purpose of assessing “order of magnitude” of supply of used batteries, simplified assumptions
were adopted as listed below:
All EV models in first hand market as of 2013 will be subject to similar collection patterns, irrespective of manufacturing OEMs and differences in battery chemistries and capacities.
70% of EV battery packs to be eventually collected (10% year 4, 20% year 5, 30% year 6, 10% year 7); some batteries are likely not to be covered by collection chains, especially in markets other than the US, EU and Japan.
75% of capacity of collected batteries to be re-fabricated, given the expected capacity loss before the collection and inspection/removal of malfunctional cells.
New EV sales in the future will follow IEA’s estimate (800 thousand, 1 million, 1.7 million, 2.2 million, 3 million, 4 million, 5 million from 2014 to 2020); average LIB capacity per new vehicle 20kWh (with PHEV market share increasing).
Figure below summarizes simulation results based on these assumptions. Coloured parts of the graph
correspond to the EVs already in market as of 2013 (timing according to respective EVs market launch,
and volume determined by the number of EVs and battery capacity per vehicle); the grey part is based on
EV sales projection and subject to significant uncertainties.
Figure 17 : Second hand LIB supply (MWh)
It would be safe to conclude that, under reasonable assumptions for existing EVs, around 1,000MWh
capacity of used batteries will be available from 2017 to 2019; and depending on the future EV sales,
29
Described in Method and Apparatus for Rejuvenation of Degraded Pouch-Type Lithium Ion Battery Cells, US Patent Application 20100124691.
-
1,000
2,000
3,000
4,000
5,000
6,000
7,000
8,000
9,000
10,000
2014 2015 2016 2017 2018 2019 2020
(yet to come)
All others
Ford
Toyota
Tesla
Mitsubishi
GM
Renault-Nissan
28
supply volume can ramp up to 10,000MWh per year around 2020. For 2017-2019, substantial share of
the supply is likely to be from Nissan Leaf.
In theory, if we assume that i) 12kWh demand per solar irrigation pumping application to cover 3 shallow
tube-wells (subject to revision based on analysis) and ii) all second-hand batteries can be channelled
to solar pumping, 250,000 STWs can be covered per year over 2017-2019 by batteries currently in the
first hand market, and 2.5 million STWs in and beyond 2020. This represents 2.5% to 25% of currently
diesel-powered STWs in South Asia (i.e. 1.4 million in Bangladesh and 7 million in India) to be
incrementally covered per year, possibly attractive enough for sellers and substantial enough for buyers /
policymakers.
In practice, future market development for irrigation and other second hand battery applications will
determine the market price, above which certain agricultural and irrigation conditions can justify cost of
batteries (and below which buyers for other applications will be willing to pay more, therefore batteries will
not be supplied for irrigation application). Given limited knowledge in economic case for various
applications and premature state of market development, knowledge generation over next 2 to 3 years
will have significant effects on ways with which second hand batteries can be deployed to address
possible relevant development impact as well as satisfy OEMs commercial interests.
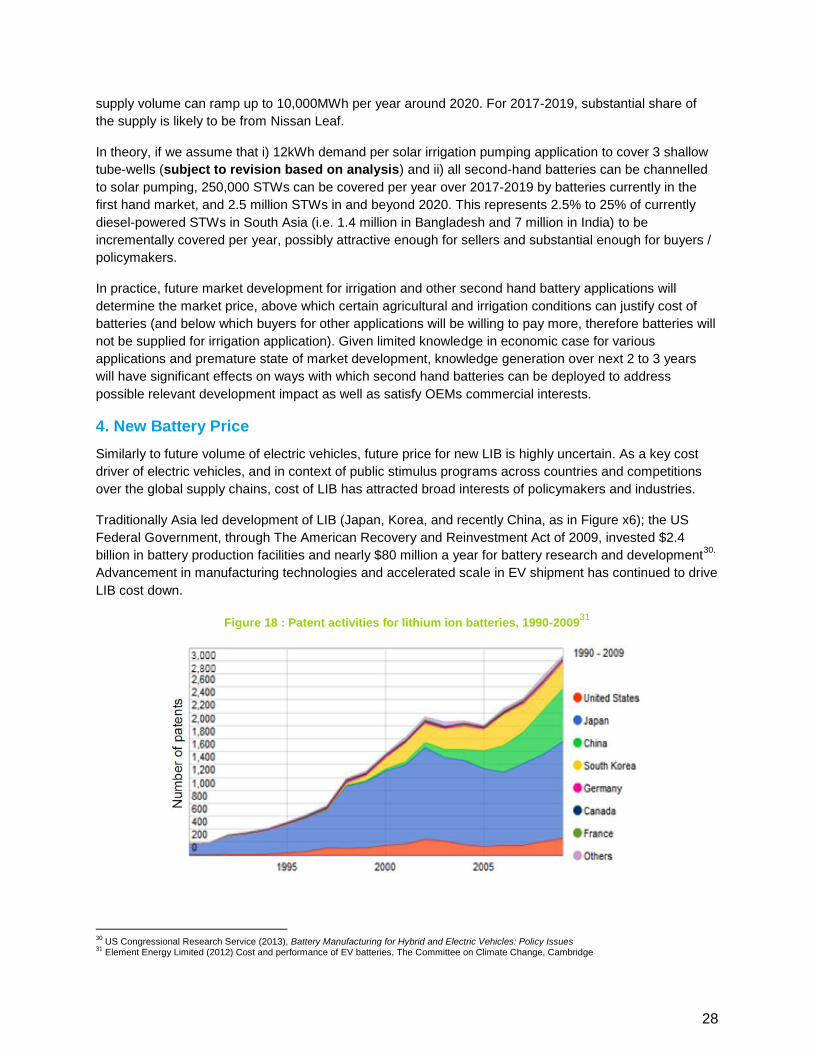
4. New Battery Price
Similarly to future volume of electric vehicles, future price for new LIB is highly uncertain. As a key cost
driver of electric vehicles, and in context of public stimulus programs across countries and competitions
over the global supply chains, cost of LIB has attracted broad interests of policymakers and industries.
Traditionally Asia led development of LIB (Japan, Korea, and recently China, as in Figure x6); the US
Federal Government, through The American Recovery and Reinvestment Act of 2009, invested $2.4
billion in battery production facilities and nearly $80 million a year for battery research and development30.
Advancement in manufacturing technologies and accelerated scale in EV shipment has continued to drive
LIB cost down.
Figure 18 : Patent activities for lithium ion batteries, 1990-200931
30
US Congressional Research Service (2013), Battery Manufacturing for Hybrid and Electric Vehicles: Policy Issues 31
Element Energy Limited (2012) Cost and performance of EV batteries, The Committee on Climate Change, Cambridge
29
Since 2009, a broad range of forecasts have been published on the cost of LIB for electric vehicles
(Figure), while specific deals between battery suppliers and automakers are confidential. Remarkably, as
more information became available in market, newly published forecasts over last 5 years have continued
to predict lower cost in future than estimated earlier; and the leading industry player (Nissan LEAF) has
stayed below the most aggressive prospect (or US production cost “target” by DOE).
Figure 19 : Projected EV battery cost over time, pack level ($/kWh)32
It should be noted that the price of LIB for energy storage applications tend to be lower than the price of
LIB for electric vehicles, due to higher performance requirements for electric vehicles (e.g. safety, thermal
management). Consequently, post-EV LIB is likely to compete below the price point of $200/kWh in 2017-
18, and $100/kWh in 2020.
5. Possible 2nd-hand LIB Price
5.1 Previous studies
Economic viability of using second-hand batteries after vehicles was first systematically assessed in the
US 10 years ago, following the success of Toyota Prius (HEV: hybrid electric vehicle), by Sandia National
Laboratory (SNL), DOE’s major R&D arm, for NiHM (nickel-metal hydride) batteries33
. As lithium-ion
emerged as a mainstream vehicle battery technology (for PHEV: plug-in hybrid electric vehicles and BEV:
battery electric vehicle), SNL as well as DOE Electricity Advisory Committee (EAC), Electric Power
Research Institute (EPRI) and National Renewable Energy Laboratory (NREL) have published a series of
studies analysing cost and benefit of second hand batteries34
. Direct use of these analytical results to
predict 2nd
-hand LIB price for SIEV application is limited for the following two reasons.
Firstly, assumptions on price of new batteries rapidly become obsolete. Figure x7 is a notional demand
curve (for the US), quantifying economic benefit of batteries (in $/kWh) and volume of demands (in GW)
32
McKinsey & Company (June 2009) Electrifying Cars: How three industries will evolve; Boston Consulting Group (Jan 2010) Batteries for Electric Cars: Challenges, Opportunities, and the Outlook to 2020; Deutsche Bank (Mar 2010) Vehicle Electrification: More rapid growth, steeper price declines for batteries; Roland Berger (Oct 2012) Technology & Market Drivers for Stationary and Automotive Battery Systems; Navigant Research (Nov 2013); US DoE (June 2010) Annual Merit Review Energy Storage R&D and ARRA Overview. Graph shows lower end where projections were made with ranges. 33
Cready, et al (2003), Technical and Economic Feasibility of Applying Used EV Batteries in Stationary Applications, SAND2002-4084 34
EAC (2008), Bottling Electricity: Storage as a Strategic Tool for Managing Variability and Capacity Concerns in the Modern Grid; Eyer and Corey (2010), Energy Storage for the Electricity Grid: Benefits and Market Potential Assessment Guide; Rastler (2010), Electricity Energy Storage Technology Options, a White Paper on Applications, Costs, and Benefits; Neubauer and Pesaran (2010), NREL’s PHEV/EV Li-ion Battery Secondary-Use Project
0
100
200
300
400
500
600
700
800
900
1000
2006 07 08 09 10 11 12 13 14 15 16 17 18 19 2020
McKinsey(2009)
BCG(2010)
Deutsche Bank(2010)
Roland Berger(2012)
Navigant(2013)
DOE Target(2010)
Nissan LEAF 2010; estimate at launch
Nissan LEAF 2014; battery replacement program
30
per applications. Latest price of new LIB for electric vehicles, as described in the previous section, is
about 2/3 of the $400/kWh “long term” Li-ion battery cost as estimated several years ago.
Secondly, all of the previous studies have focused on stationary applications of second hand batteries in
utility grid systems in developed economies, therefore assuming direct competition with lower-cost
stationary technologies such as NaS battery35
. Economic rational considered in SIEV approach builds on
LIB’s mobility (high power and energy density per weight), which may differentiate LIB from many of
substitute technologies, as possible source of price premium if benefits overweight costs.
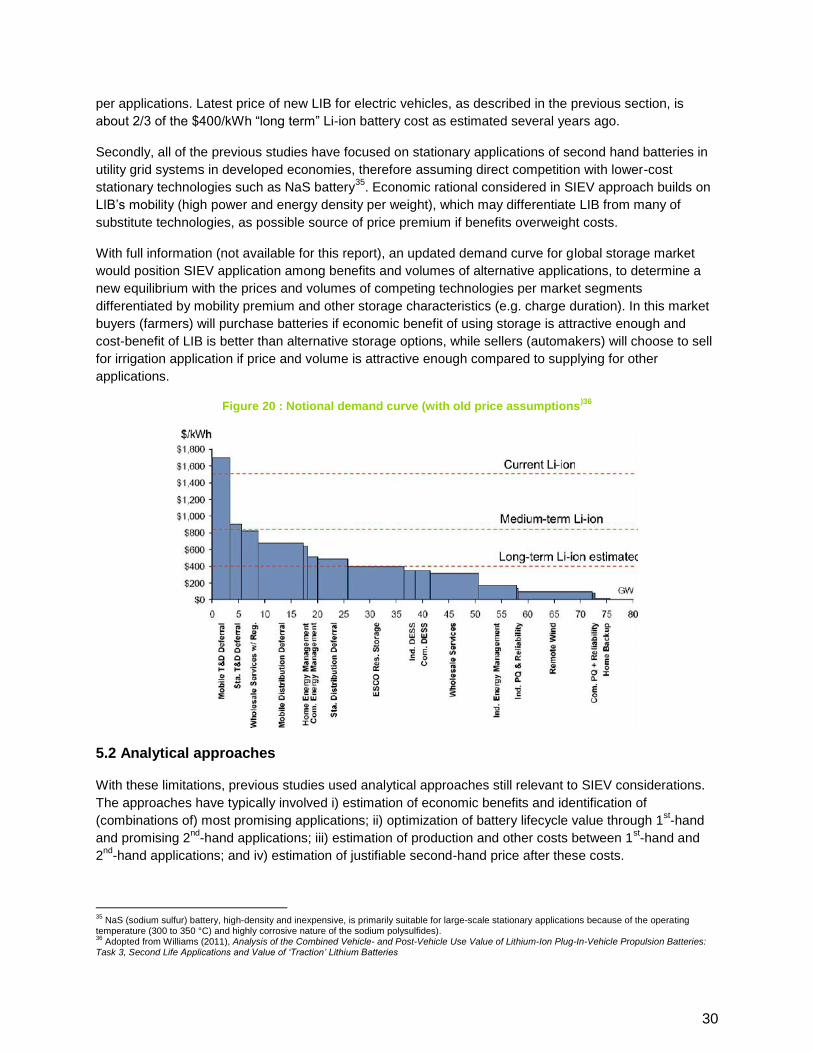
With full information (not available for this report), an updated demand curve for global storage market
would position SIEV application among benefits and volumes of alternative applications, to determine a
new equilibrium with the prices and volumes of competing technologies per market segments
differentiated by mobility premium and other storage characteristics (e.g. charge duration). In this market
buyers (farmers) will purchase batteries if economic benefit of using storage is attractive enough and
cost-benefit of LIB is better than alternative storage options, while sellers (automakers) will choose to sell
for irrigation application if price and volume is attractive enough compared to supplying for other
applications.
Figure 20 : Notional demand curve (with old price assumptions)36
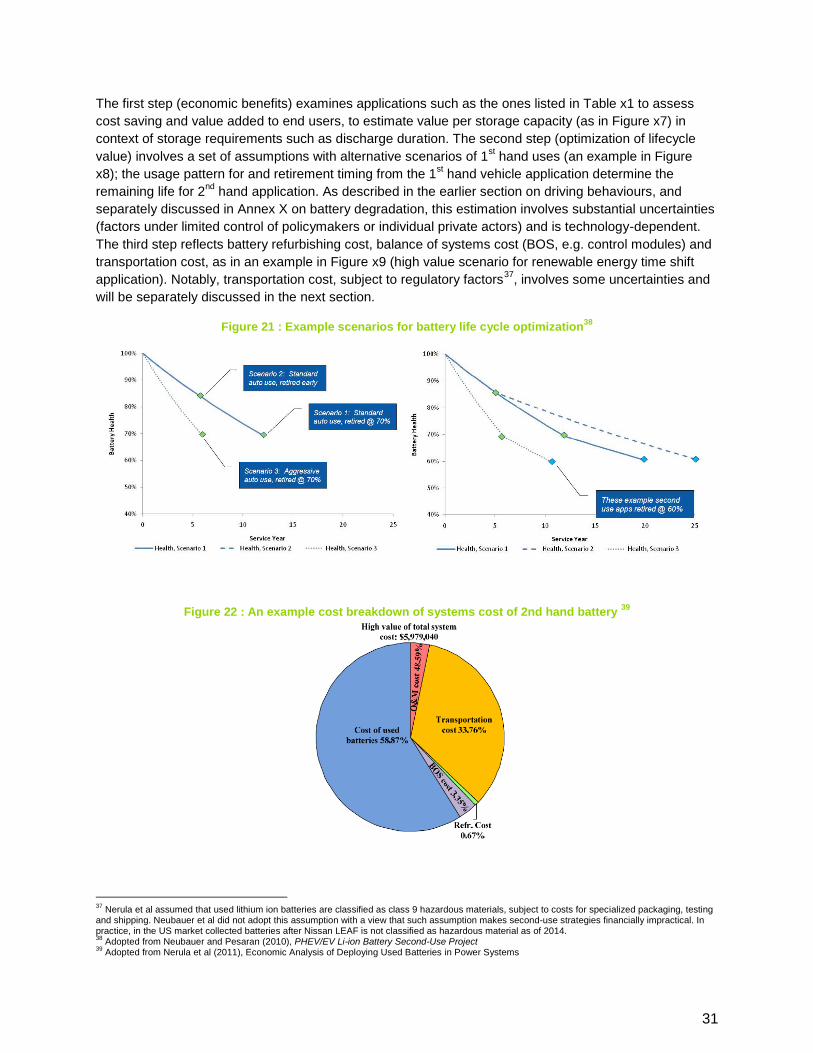
5.2 Analytical approaches
With these limitations, previous studies used analytical approaches still relevant to SIEV considerations.
The approaches have typically involved i) estimation of economic benefits and identification of
(combinations of) most promising applications; ii) optimization of battery lifecycle value through 1st-hand
and promising 2nd
-hand applications; iii) estimation of production and other costs between 1st-hand and
2nd
-hand applications; and iv) estimation of justifiable second-hand price after these costs.
35
NaS (sodium sulfur) battery, high-density and inexpensive, is primarily suitable for large-scale stationary applications because of the operating temperature (300 to 350 °C) and highly corrosive nature of the sodium polysulfides). 36
Adopted from Williams (2011), Analysis of the Combined Vehicle- and Post-Vehicle Use Value of Lithium-Ion Plug-In-Vehicle Propulsion Batteries: Task 3, Second Life Applications and Value of ‘Traction’ Lithium Batteries
31
The first step (economic benefits) examines applications such as the ones listed in Table x1 to assess
cost saving and value added to end users, to estimate value per storage capacity (as in Figure x7) in
context of storage requirements such as discharge duration. The second step (optimization of lifecycle
value) involves a set of assumptions with alternative scenarios of 1st hand uses (an example in Figure
x8); the usage pattern for and retirement timing from the 1st hand vehicle application determine the
remaining life for 2nd
hand application. As described in the earlier section on driving behaviours, and
separately discussed in Annex X on battery degradation, this estimation involves substantial uncertainties
(factors under limited control of policymakers or individual private actors) and is technology-dependent.
The third step reflects battery refurbishing cost, balance of systems cost (BOS, e.g. control modules) and
transportation cost, as in an example in Figure x9 (high value scenario for renewable energy time shift
application). Notably, transportation cost, subject to regulatory factors37
, involves some uncertainties and
will be separately discussed in the next section.
Figure 21 : Example scenarios for battery life cycle optimization38
Figure 22 : An example cost breakdown of systems cost of 2nd hand battery 39
37
Nerula et al assumed that used lithium ion batteries are classified as class 9 hazardous materials, subject to costs for specialized packaging, testing and shipping. Neubauer et al did not adopt this assumption with a view that such assumption makes second-use strategies financially impractical. In practice, in the US market collected batteries after Nissan LEAF is not classified as hazardous material as of 2014. 38
Adopted from Neubauer and Pesaran (2010), PHEV/EV Li-ion Battery Second-Use Project 39
Adopted from Nerula et al (2011), Economic Analysis of Deploying Used Batteries in Power Systems
32
5.3 Estimated price
Through these considerations, a recent study40
forecasted repurposed battery price to range from
$38/kWh to $132/kWh, of which value to the automotive battery owner is $20/kWh to $100/kWh.
Considering the two limitations mentioned above41
, current report adopted $75/kWh, slightly lower than
the mid-point of the forecasted range, for financial and economic analysis for SIEV application.
40
Neubauer et al (2012), A Techno-economic Analysis of PEV Battery Second Use: Repurposed-Battery Selling Price and Commercial and Industrial End-User Value 41
The study adopted an assumption of price of new battery as Boston Consulting Group forecasted in 2010 (highest across recent estimates and distant from the reality, as shown in Figure x6). Note that the lack of considerations of mobility premium may indicate possible price for SIEV application higher than the forecasted range.
33
Annexure 2 : Lithium Ion Battery
1. Comparative Performance
Lithium-ion (Li-ion) batteries are comprised of cells that employ lithium intercalation compounds as the
positive and negative materials. As a battery is cycled, lithium ions (Li+) exchange between the positive
and negative electrodes. They are also referred to as rocking chair batteries as the lithium ions ‘‘rock’’
back and forth between the positive and negative electrodes as the cell is charged and discharged. The
positive electrode material is typically a metal oxide with a layered structure, such as lithium cobalt oxide
(LiCoO2), or a material with a tunneled structure, such as lithium manganese oxide (LiMn2O4), on a
current collector of aluminum foil. The negative electrode material is typically a graphitic carbon, also a
layered material, on a copper current collector. In the charge/ discharge process, lithium ions are inserted
or extracted from interstitial space between atomic layers within the active materials.
The first batteries to be marketed, and the majority of those currently available, utilize LiCoO2 as the
positive electrode material. Lithium cobalt oxide offers good electrical performance, is easily prepared,
has good safety properties, and is relatively insensitive to process variation and moisture. More recently
lower cost or higher performance materials, such as LiMn2O4 or lithium nickel cobalt oxide
(LiNi1_xCoxO2), have been introduced, permitting development of cells and batteries with improved
performance. The batteries that were first commercialized employed cells with coke negative electrode
materials. As improved graphite became available, the industry shifted to graphitic carbons as negative
electrode materials as they offer higher specific capacity with improved cycle life and rate capability.
The Li-ion battery market has grown in a decade from an R&D interest to sales of over 400 million units in
1999. Market value at the OEM level was estimated to be $1.86 billion in 2000. By 2005, the market grew
to over 1.1 billion units with value of over $4 billion (¥455 billion), while the average unit price fell by 46%
from 1999 to 2005. Market interest in this cost-effective, high performance and safe technology has
driven spectacular growth. This technology has rapidly become the standard power source in a broad
array of markets, and battery performance continues to improve as Li-ion batteries are applied to an
increasingly diverse range of applications. To meet market demand, an array of designs has been
developed, including spiral wound cylindrical, wound prismatic and flat plate prismatic designs in small
(0.1 Ah) to large (160Ah) sizes. Applications now addressed with Li-ion batteries include consumer
electronics, such as cell phones, laptop computers, and personal data assistants, as well as military
electronics, including radios, mine detectors and thermal weapons sights. Anticipated applications include
aircraft, space craft, satellites, and electric or hybrid electric vehicles.
The major advantages and disadvantages of Li-ion batteries, relative to other types of batteries, are
summarized in Table 1. The high specific energy (150 Wh/kg) and energy density (400 Wh/L) of
commercial products makes them attractive for weight or volume sensitive applications. Li-ion batteries
offer a low self-discharge rate (2% to 8% per month), long cycle life (greater than 1000 cycles) and a
broad temperature range of operation (charge at-20oC to 60oC, discharge at -40oC to 65_C), enabling
their use in a wide variety of applications. A wide array of sizes and shapes is now available from a
variety of manufacturers. Single cells typically operate in the range of 2.5 to 4.2 V, approximately three
times that of NiCd or NiMH cells, and thus require fewer cells for a battery of a given voltage. Li-ion
batteries can offer high rate capability. Discharge at 5C continuous, or 25C pulse, has been
34
demonstrated. The combination of these qualities within a cost effective, hermetic package has enabled
diverse application of the technology.
Table 7: Advantages and disadvantages of Lithium Ion batteries
Advantages Disadvantages
Sealed cells; no maintenance required Moderate initial cost
Long cycle life Degrades at high temperature
Broad temperature range of operation Need for protective circuitry
Long shelf life Capacity loss or thermal runaway when overcharged.
Low self-discharge rate Venting and possible thermal runaway when
crushed
Rapid charge capability Cylindrical designs typically offer lower power
density than NiCd or NiMH
High rate and high power discharge capability
High columbic and energy efficiency
High specific energy and energy density
No memory effect
A disadvantage of Li-ion batteries is that they degrade when discharged below 2 V and may vent when
overcharged as they do not have a chemical mechanism to manage overcharge, unlike aqueous cell
chemistries. Li-ion batteries typically employ management circuitry and mechanical disconnect devices to
provide protection from over-discharge, overcharge or over temperature conditions. Another
disadvantage of Li-ion products is that they permanently lose capacity at elevated temperatures (65oC),
albeit at a lower rate than most NiCd or NiMH products.
Li-ion Battery Performance
The general performance characteristics of Li-ion batteries are outlined in Table 2. As indicated in the
table, Li-ion batteries have a high voltage, typically operating in the range of 2.5 to 4.2 V, approximately
three times that of NiCd or NiMH. As such, fewer cells are required for a battery of a given voltage. Li-ion
batteries offer high specific energy and energy density, batteries with specific energy over 150 Wh/Kg and
energy density over 400 Wh/L are commercially available. Multiple-tabbed Li-ion batteries also offer high
rate capability, up to 5C continuous or 25C pulse, thus high power density, and low self-discharge rate,
years of calendar life, no memory effect, and a broad temperature range of operation. Li-ion batteries can
be charged from -20oC to 60oC and discharged from -40oC to 65oC. The combination of these qualities
within a cost effective, hermetic package has enabled the diverse applicability of the technology.
Table 8: General Characteristics of Lithium Ion Batteries
tested by many Nissan Leaf users for over 3 years and has provided significant insights with high
accuracy on battery life and performance.
Factors Affecting Battery Capacity Loss
Each Lithium ion battery chemistry has unique properties that affect the rate of capacity loss. However,
the Volt’s43
and Leaf’s44
respective battery packs have nearly identical chemistry, both using a lithium-
manganese cathode. Of all the various lithium cathodic chemistries, lithium-manganese is the most heat
sensitive and has the highest and fastest rate of capacity decay and degradation at higher temperatures.
There are two sources of battery capacity loss, calendar losses and cycling losses. Calendar capacity
loss is the loss from the passage of time while the battery is left at a set SOC, typically 60% in lab testing.
Cycling loss is due to charging and discharging (cycling) the battery. It depends on both the maximum
state of charge (SOC) and the depth of discharge (DOD), which is the percentage of the total capacity
range that is used during a cycle.
Technically, lithium battery calendar life is a function of 4 variables:
• Mean temperature
• Standard deviation of temperature
• Mean state of charge (SOC)
• Standard deviation of SOC
F [µ (T), σ (T), µ (SOC), σ (ΔSOC)] that varies negatively (inversely) with all 4 of those variables.
Here is a typical battery calendar capacity loss curve for Lithium Manganese batteries plotting Years to
End of Life (typically 70% remaining capacity) vs. temperature:
Figure 25: Temperature Vs Calendar life
43
The Volt’s battery cell is manufactured by LG Chem, is a pouch type cell with stacked elements, a LiMn2O4 cathode from Nikki Catalysis, a hard carbon anode (which is more robust and has better/longer calendar life properties than the graphite anode in the Leaf’s battery cell) from Kureha, a Celgard PP dry/SRS separator, and a PC type LiPF6 electrolyte produced in-house by LG Chem. 44
The Leaf’s battery cell is manufactured by NEC, is a pouch type cell with stacked elements, a LiMn2O4 cathode from Nippon Denko, a graphite anode from Hitachi Chemicals, a Celgard PP dry separator, and an EC type LiPF6 electrolyte from Tomiyama.
40
The results given in the calendar life graph are for a steady-state, constant temperature T (thus where σ
(T) = 0) and a steady-state, constant SOC equal to 60% SOC (thus where σ (ΔSOC) = 0). If the average
SOC over time is greater than 60% SOC, calendar life will be less than that given in the graph. As the
variability of both temperature [σ (T)] and the SOC cycling band [σ (ΔSOC)] increase, calendar life will
decrease. At 60% SOC, lithium-manganese batteries have a little over 8 year life at 21oC (70
oF) but only
a 5 year life at 32oC (90
oF). At higher states of charge, the heat sensitivity and degradation rate is even
greater.
Temperature has a much greater effect on battery life than SOC. State of Charge (SOC) does have an
effect, which is unique for lithium ion batteries: a lower average SOC (to a point, down to 30% SOC) over
time will result in a longer battery life, and a higher average SOC over time will result in a shorter battery
life. The LiMn2O4 chemistry that GM and Nissan are using in the first generation of the Volt and Leaf is
very sensitive to heat and has a high rate of degradation once the temperature is above 95oF.
LiMn2O4 has two major problems at elevated temperatures: capacity fade over charge-discharge cycling,
and dissolution of Mn into the electrolyte. Capacity retention is almost constant below 50% SOC, but
decreases with the SOC in the range of 50% to 80%. Batteries should be stored at the optimum storage
state of charge which is between 30% and 40%, which is the optimal SOC for storage.
An unknown report, which does not specify the specific battery chemistry, shows a graph of remaining
battery capacity vs number of cycles. The results (with cycles normalized to full cycle in parentheses):
• 100% to 0% - 1200 cycles (1200 cycles)
• 100% to 80% - 12000 cycles (2400 cycles)
• 80% to 0% - 5000 cycles (4000 cycles)
A DOD of 80% had made the battery last 3.3 times longer than a DOD of 100% (Figure 2). The Leaf limits
battery use to some extent, allowing limits of SOC of 95% on the high end and 2% on low end.
Figure 26: Discharge-curve-KEMA Lithium ion Batteries
41
Figure 27: Arrhenius Factor Sandia National Lab
Figure above is from paper published in 2003 that studied lithium-ion battery loss as a function of both
temperature and SOC: "Correlation of Arrhenius behaviors in power and capacity fades with cell
impedance and heat generation in cylindrical lithium-ion cells" from Sandia National Laboratories. Since
this was published in 2003 is not referring to the LEAF's Lithium ion chemistry (LixNi0.8Co0.15Al0.05O2
cathode is used in the testing), but its behaviors is typical of a Lithium ion battery. This shows that
capacity fade slows for all temperatures as the SOC is reduced from 100% to 80% to 60% SOC. At high
state of charge the Li-ions are concentrated on the graphite electrode. The primary loss process takes
place at the electrode, which is slow as the SOC lowers.
End of Life Capacity after use in EV
Stoaty Mort degradation model version 0.99 b was used to analyze the remaining life of the Li ion
batteries used in Nissan Leaf vehicles in 16 vehicles and 15 owners from 4 cities in USA were analyzed
to predict the remaining life of the batteries. The average age of the vehicles was about 1.16 years, the
maximum age was 2.33 years. The average miles driven by these vehicles was 21556 at the time of
analysis. The model predicted the remaining life of Li ion batteries ranged from 79% to 94%. Other
models were also used to predict the remaining like Nissan test, Arizona Range Test, and other predictive
models, these results very closely matched the Stoaty Mort’s degradation model.
These models predicted that the remaining battery capacity was about 65% after 77800 miles driving.
This indicates that the life of the Li ion batteries used in the Leaf Nissan vehicles is definitely fit for long
use in agriculture and other less mechanically intensive applications. It can therefore be concluded that
the extended use of these batteries for innovative applications like use of solar energy to charge and use
them in rural and other commercial applications will definitely lead to a greener economy.
42
Annexure 3 : Agricultural context in
Eastern India and Bangladesh
This note provides a broad overview of inter-linkage between ground water irrigation and agricultural
productivity in regions across eastern India and Bangladesh.
Ground water development and agriculture production in Eastern India
Agricultural growth rates in much of eastern India in the 1990s were much higher than all-India growth
rates (Saha and Swaminathan 1994)45. However, while eastern Uttar Pradesh and to a large extent West
Bengal started realizing fruits of groundwater-led agrarian transformation in the late 1980s to the early
1990s, the state of Bihar was still grappling with problems of huge gap between actual and potential
yields of major foodgrains and vast fallow land even during the rabi season.
Development in the groundwater utilisation for
irrigation and agricultural productivity has a
clear linkage. In the early 1960s, states of
eastern India had almost the same levels of
agricultural productivity as the north Indian
states of Punjab and Haryana. In the late 1960s
came the green revolution and the whole of
eastern India failed to capitalize on it. The gap
in terms of agricultural productivity (in terms of
Rs/ha) between the east and the north
increased as shown in the figure46.
Lack of development of groundwater has been
thought to be the most important reason for
stagnating agriculture in eastern India. Dhawan
(1982)47 reiterated that pump revolution had preceded the green revolution in much of north-western
India. While the 1970s were characterized by low to medium productivity and very low pump capital, the
1990s saw a rapid expansion in pump density in eastern India followed by higher agricultural
productivities.
High productivity, coupled with good market prices for crops, sustains a groundwater irrigated agrarian
economy. In most of eastern India, groundwater is used to grow rabi crop of either wheat (in eastern Uttar
Pradesh and Bihar) or paddy (in West Bengal). Both are food crops and come within the food
procurement basket of the Government of India which announces a yearly minimum support price (MSP)
for both. But, as it is widely known, the public procurement system is very lax in all eastern states. In
much of eastern India, farmers are still forced to sell off their produce in distress right after harvest when
the going prices are low. This seems especially inequitable when seen from the perspective of water
45
Saha, Anamitra and Madhura Swaminathan (1994). 'Agricultural Growth in West Bengal in the 1980s: A Disaggregation by Districts and Crops'.Economic and Political Weekly, 29(13): A2-A11. 46
Aditi Mukherji - Groundwater Development and Agrarian Change in Eastern India 47
Dhawan, B.D. (1982). 'Development of Tubewell Irrigation in India'. Agricole Publishing Academy, New Delhi.
Agricultural Productivity (Rs/ha) in Eastern and Northern
India,1962-65 to 1990-93
43
productivity. Wheat production in Bihar is highly water efficient as compared to groundwater scarce
Punjab and Haryana. Given the overall concern about long term sustainability of groundwater irrigated
agriculture, it makes a lot of sense to encourage irrigated production in areas where water productivity is
higher as in eastern India48.
One of the key reasons impacting the limited development of groundwater irrigation in eastern India can
be linked to the lack of energy access in most of the states (like Bihar). Much of eastern India has
remained un-electrified or having unreliable electricity supply, due to the huge losses incurred by the state
electricity boards (SEBs)/electricity distribution utilities. As a result, more and more farmers rely on
expensive diesel operated pumps, which seriously limits their ability to increase area under irrigation. The
table below details the number of agricultural diesel pump sets for different time periods starting from the
mid-80s, as reported by the Minor Irrigation Census (MIC), Agricultural Census (AgC), Input Survey (InS):
Table 10 : Number of agricultural diesel pumps (in lakhs)
Ag C
(1985-
86)
InS
(1986-
87)
MIC
(1986-
87)
AgC
(1995-
96)
InS
((1991-
92
MIC
(1993-
94)
AgC
(2000-
01)
InS
(2001-
02)
MIC
(2000-
01)
AgC
(2005-
06)
InS
(2006-
07)
Bihar 4.34 3.65 4.92 5.06 6.91 6.96 NA NA 6.76 NA NA
* 1 Lakh =0.1 million Source : Water Policy Research (Stuti Rawat and Aditi Mukherji, 2012) Poor State of Irrigation Statistics in India - The Case of Wells and Tube Wells
Given the dependence on agriculture diesel pumps, the requirement is to provide alternate solutions of
energy to these regions and solar powered irrigation has emerged as a preferred option.
Ground water development and agriculture production in Bangladesh
Bangladesh has gained a significant success in the development of groundwater for its irrigated
agriculture and rural water supply. The country started emphasizing groundwater irrigation in the mid-
seventies with deep tube wells (DTW), but soon shifted its priority to shallow tube wells (STW). DTW and
STW irrigation was extended rapidly during the late 1970’s and the 1980’s. As a result the target for self-
sufficiency in food has almost been achieved. Minor irrigation using groundwater has, in fact, been the
single most important driving force behind the steady expansion of agricultural output in recent years.49
The cultivation of rice in Bangladesh varies according to seasonal changes in the water supply. With the
increasing use of irrigation, there has been a growing focus on another rice-growing season extending
during the dry season from October to March. Enhancing the cropping intensity is one of the means for
increasing the overall agricultural productivity.
The cropping intensity is determined as the ratio of total cropped area of multiple crops within a year to
net cultivated area, which is expressed in terms of percent-age. Farmers typically grow one or two crops
per year and leave their lands fallow for rest of the time. The cropping intensity for Bangladesh increased
48
Aditi Mukherji - Groundwater Development and Agrarian Change in Eastern India 49 Anwar Zahid and Syed Reaz Uddin Ahmed - Groundwater Resources Development in Bangladesh: Contribution to Irrigation for Food Security and Constraints to Sustainability
44
by 154 to 176 percent within the period of 1981-82 to 2006-07; while in some regions it was about 200
percent (Bogra and Comilla district). The rapid boost of cropping intensity was possible due to expansion
of irrigated area and development of irrigation technologies in Bangladesh. Boro rice, an irrigated crop,
consumed majority (around 73 percent) of the total crop irrigation and contributed to a greater extent in
total rice production in Bangladesh50.
For Bangladesh the cost of production is higher for the boro rice than for the aman variety of rice. A major
factor behind the high unit cost of boro rice cultivation in Bangladesh is the high cost of irrigation
compared to the other countries in the region. Bangladeshi farmers have to spend about USD 51 in
irrigating one-hectare land whereas the irrigation costs are about USD 32 in Punjab, India (Hossain and
Deb, 2003). The cost of MV boro irrigation is even higher in Bangladesh; it is USD 117.6 per ha (Hossain
and Deb, 2003). In Bangladesh, irrigation costs account for 28 percent of the variable costs of rice
cultivation51.
For groundwater irrigation, the prime source of power energy for lifting water is fossil fuel (diesel) and
electricity. Both sources of power/energy are costly for the rural people. However, irrigation has direct
impact on food and livelihood security. Hence, in the context of energy sector instruments (reform/
restructuring of energy sector, pricing of power, reliability of supply) the linkage between the energy and
irrigation economics is very important.
Cropping intensity levels (Bangladesh)
The table below presents the cropping intensity pattern in different upzilas in Bangladesh. As can be seen
the practice of two crops per year is most prevalent in these upzilas, followed by 3 crops per year.
Table 11 : Cropping intensity in Bangladesh
Upazila Single Double Triple Four crops Cropping
Intensity (%)
Sherpur 4th High Highest 2nd High 3rd High 251
Dhunat 3rd High Highest 2nd High No 253
Mithapukur 3rd High 2nd High Highest 4th High 253
Chougacha 3rd High Highest 2nd High 4th High 249
Cropping intensity denotes number of crops sown in a year.
Irrigation requirement for 3 crops per year (Bangladesh)
The analysis in section 4 of this report indicates that adopting the practice of 3 crops per year requires
higher energy from the energy supply systems (DG / solar PV etc.). The table below details the increased
irrigation requirement considered in the analysis of SIEV scenario under 3 crops per year for the
Muradpur (Dokkhin Para), Nandigram, Bogra location in Bangladesh.
50 M. Wakilur RAHMAN1, Lovely PARVIN (2009) - Impact of Irrigation on Food Security in Bangladesh for the Past Three Decades 51 Nasima Tanveer Chowdhury : Irrigation Institutions of Bangladesh: Some Lessons
45
Table 12 : Irrigation requirement for 3 crops
Month Type of crop based on season Irrigation requirement - per Ha (considering 50% loss)
Crop m3/day/ha
Jan Potato 12.33
Feb Boro 28.62
Mar Boro 33.14
Apr Boro 34.15
May Boro 31.11
Jun Boro -
Jul Amman 13.58
Aug Amman -
Sep Amman 12.47
Oct Amman 13.90
Nov Amman/Potato 13.29
Dec Potato 11.85
Source: BARC 2005
46
Annexure 4 : Key Assumptions of
Financial & Economic Analysis
This note aims at detailing the key assumptions considered for undertaking the financial & economic
analysis. The table below details the common assumptions underlying the analysis of different scenarios
discussed in the above sections.
Table 13: Key Assumptions (System Sizing & Cost)
Particulars Units Details
Pump Assumptions
Capex (above 1 HP/upto 1 HP size) $/kW 89.37/134
Operating expenditure %age of Capex 10.00%
Opex Escalation %age 5.00%
Debt %age 80%
Debt Tenor Years 5.00
Interest Rate %age 6.0%
Equity %age 20.0%
Equity return %age 15.0%
Solar PV Assumptions
Capex $/kW 1,500
Operating expenditure %age of Capex 0.50%
Opex Escalation %age 1.00%
Debt %age 80%
Debt Tenor Years 8.00
Interest Rate %age 6.0%
Equity %age 20.0%
Equity return %age 15.0%
Total life of Panel years 25
47
Particulars Units Details
Salvage value after 10 years %age 30%
DG Set Assumptions
Capex $/kW 83.33
Operating expenditure %age of Capex 5%
Opex Escalation %age 1%
Fuel Cost $/L 0.90
Fuel Cost escalation %age 5%
Diesel requirement L/kWh 0.28
Debt %age 80%
Debt Tenor Years 5.00
Interest Rate %age 6%
Equity %age 20%
Equity return %age 15.0%
Diesel subsidy $/L
0.144(Bangladesh)
0.05 (India)
LIB Assumptions
Battery Size kWh 6
Capex $/kWh 75.00
Operating expenditure %age of Capex 0.50%
Opex Escalation %age 1.00%
Debt Tenor Years 5.00
Interest Rate %age 6.0%
Equity %age 20.0%
Equity return %age
15.0%
Loss %age 5.0%
Income from surplus power $/kWh 0.40
48
Particulars Units Details
Escalation in Income per annum %age 5.00%
Surplus Power Utilization Factor % 75.0%
Invertors Assumptions
Capex $/kW 83.33
Life years 5.00
A detailed discussion around select key assumptions is provided below:
1. Pump-set installation cost & sizing
The pump-set cost varies based on the size of pump, performance parameters and manufacturer. The
pump-set cost in per HP terms decrease with the increase in the pump size. Based on the review of
different pumps available, it is observed that the small size pumps (say upto 1 HP) will have a cost of INR
6000 per HP whereas for large size pumps (say 5 HP) it will be in the range of INR 4000 per HP. The
pump-set installation cost assumed for the financial analysis has been categorised into two types: USD
89 per kW for above 1 HP pump size and USD 134 per kW for upto 1 HP pump size.
Based on the land irrigated land, total dynamic head and irrigation requirement, pump size selection
varies across different models. The table below provides the details of the pump size and related details
assumed for different models:
Table 14: Key Assumptions - Sizing
Land irrigated
(in Hect.)
Total dynamic head (m)
Pump Size (HP)
Pump
Discharge (Litre/sec)
Solar PV system size for
irrigation purpose &
utilizing excess energy (kWp)
1 Organized operator
(Bangladesh) 4.00 16.80 5.00 18.00 10.82
2 Water Seller (Bangladesh)
6.00 16.80 7.50 24.00 16.27
3 Organized operator
(India) 5.00 11.60 7.50 27.00 13.82
*irrigation requirement varies in India and Bangladesh – detailed in point 3 of Annexure 4
2. Income from surplus power
During non-irrigation days, the surplus power generated by the solar PV system can be utilised for
realising additional revenue by using LIB to operate non-irrigation applications. For the financial analysis,
it is assumed that only 75% of the surplus power generated can be used for realising additional revenue.
For an appropriate assumption for the revenue (USD per KWh) to be considered from agricultural
applications using LIB, a number of consideration and earlier reports have been reviewed:
Report on Energy options for horticulture, USAID (2009) assumed a cost of USD 0.35 per kWh for
meeting energy requirement for agricultural applications.
49
Earning of 350 BDT/hour from a 5.59 kW capacity of Husking/Grinding Machine (resulting in earning of
USD 0.80 per kWh assuming 1 USD =77.63 BDT) [Source : GHEL solar irrigation model]
Tariff of 30 BDT per kWh charged from consumer (with 10% escalation after every 2 years) assumed
under Solar PV based mini-grid system for Bangladesh (resulting tariff of USD 0.39 per kWh assuming 1
USD =77.63 BDT) [Source : Solar PV Mini-grid model for Bangladesh, SBL Solar mini-grid model]
Given the fact that the revenue consideration from providing energy services varies across locations, a
conservative assumption of USD 0.4 per kWh (with an annual escalation of 5%) has been considered as
a revenue for providing the surplus power (using LIB) during non-irrigation days for different agricultural
applications.
3. Irrigation Requirement Assumptions
The cropping season and irrigation pattern (irrigation requirement) impacts the operation hours of running
the pump-set and eventually the amount of energy required for irrigation. The table below presents the
irrigation data per hectare assumed for Ghazipur (Bangladesh) and Bihar (India), underlying the analysis
presented in Chapter 4 of this report.
Table 15: Irrigation Pattern (Bangladesh & India)
Bangladesh (Gazipur)
India (Bihar)
Months Cropping
Season
Gross irrigation
Requirement
(m3/month)
Number of
irrigation days
per month (Days)
Cropping
Season
Gross irrigation
Requirement
(m3/month)
Number of
irrigation
days per
month (Days)
January Boro 1,837 22 Wheat 2,766 12
February Boro 5,094 28 Wheat 1,067 12
March Boro 7,014 31 Maize 1,389 12
April Boro 3,841 24 Maize 3,848 14
May - - - Maize 4,060 15
June - - - Maize 273 4
July - - - Rice - -
August - - - Rice - -
September Amman 919 7 Rice 448 4
October Amman 2,004 11 Rice 3,022 12
November Amman 1,300 7 Wheat 1,046 4
December Amman - - Wheat 1,829 8
4. Agricultural applications
50
This note aims at providing an overview of potential areas for use of solar PV and energy storage options
(batteries) for operating agricultural applications, detailing the key areas where solar PV/energy storage
options can be utilised for meeting the power requirement.
Background
Solar PV is increasingly emerging as one of the preferred technology options for meeting energy needs in
remote/rural set up. In Bangladesh, besides solar home lighting systems, schemes have been initiated to
utilise solar PV for meeting energy requirement for irrigation, mini-grid etc. based applications. In India
also, solar PV (along with energy storage options) have emerged as one of the prominent technology
options of electrification of remote off-grid areas. State level as well as central level government is
promoting use of solar PV for irrigation purposes.
Solar energy can supply and/or supplement many other agricultural activities having energy requirement.
In the area of agriculture, solar PV and energy storage options are found to be useful for applications
such as water pumping for irrigation and cattle drinking, aeration for aquacultures, refrigeration of
agricultural products, electric fencing, poultry lighting, and pest control52.
Potential application areas
One of the important considerations for most of the agricultural applications (having energy requirement)
is mobility in usage; hence energy storage options (batteries) provide an added advantage of providing
mobility while meeting the energy requirement of these applications. Apart from this, a number of these
applications are driven through diesel based systems, utilizing energy storage options (through batteries)
along with solar PV can assist in reducing the reliance of diesel based systems having adverse impact
(economic in terms of subsidy and environmental). Increasing diesel prices and declining solar module
prices have enhanced the viability of using solar PV for running different agricultural applications, which
are currently dependent upon diesel based systems.
The focus of policy across countries like India and Bangladesh has been towards promoting the use of
solar PV systems for agricultural applications (including irrigation applications). A review of different
studies indicate substantial potential areas of non-irrigation applications (including applications developed
by Bangladesh Agricultural Research Institute (BARI)) and the same has been summarised in the tables
below :
Table 16: Non-irrigation application operated through solar (as per BARI)
No. Name of Machine Power Requirement
1 BARI Solar Pump 746 W
2 BARI Winnower 373 W
3 BARI Turmeric Polisher 373 W
4 BARI Compost Separator 373 W
5 BARI Groundnut Sheller 373 W
6 BARI Potato Grader 373 W
7 BARI Coffee Pulpier 373 W
52
Source : Productive Uses of Photovoltaic Technology in Rural Bangladesh - Potentials, Barriers, Recommendations (World Bank 2008)
51
8 BRRI Power Weeder 373 W
9 BRRI Winnower 373 W
10 BRRI Open Drum Thresher 3.0 KW
Table 17: Non-irrigation applications & typical system design
Type of PV applications in
agriculture sector Typical system design Examples
1
Lighting and cooling for poultry
factory for extended lighting and
increased production
50-150 Wp, electronics, battery,
several TL-lights, fan
Egypt, India, Indonesia,
Vietnam, Honduras
2 Electric fencing for grazing
management
2 - 50 Wp panel, battery, fence
charger
USA, Australia, New
Zealand, Mexico, Cuba
3 Pest control (moth) Solar Lanterns used to attract