Solid State Storage Performance Test Specification – Enterprise – V1.0
19-Nov-2010 Page 1
Solid State Storage (SSS) Performance Test Specification (PTS)
Enterprise
Version 1.0
Working Draft Publication of this Working Draft for review and comment has been approved by the SSS TWG. This draft represents a “best effort” attempt by the SSS TWG to reach preliminary consensus, and it may be updated, replaced, or made obsolete at any time. This document should not be used as reference material or cited as other than a “work in progress.” Suggestion for revision should be directed to http://www.snia.org/feedback/.
Solid State Storage Performance Test Specification – Enterprise – V1.0
19-Nov-2010 Page 2
Revision History
Revision Release Date Originator Comments
May-2009 Jonathan Thatcher
Initial proposal in SSS TWG Initial Draft Outline
Jun-2009 Eden Kim
Added material re: Definitions, Reference Platform, Test Definitions/Procedures, etc.
Content contributions from Eden Kim, Phil Mills, Easen Ho, Dave Landsman, Steven Johnson
0.0.0 Jul-7-2009 Dave Landsman
Major restructure to get overall document sections/styles in place for serious editing and 1
st full committee review.
Incorporated Calypso material. Added section on Performance Index Re-wrote Scope & Introduction
0.0.1 Jul-15-2009 Dave Landsman
Merged Jonathan Thatcher draft. Merged Chuck Paridon definitions Merged Chuck Paridon test flow (Annex) Further general restructuring/editing.
0.0.2 Aug-4-2009 Dave Landsman Updated Preconditioning and Test sections per Jul 20-22 F2F. Integrated Logical/Physical Address conventions into Definitions. Other general stylistic and editorial changes.
0.1 Sep-23-2009 Dave Landsman
Changed versioning to x.y, from x.y.z Miscellaneous edits in Sections 3 & 4 Revised Section 5 (Preconditioning) for clarity Flipped “for loop” in IOPS test (Sec. 6.2) Added QD=1for IOPS test (Sec. 6) Edited “Alternative Extended IOPS Test” (Section 6.6) Added graphic for RPT spec (Annex A) Added rough latency example to sample report (Annex B)
0.3 Dec-2-2009 Dave Landsman
Based on slide version of spec (2009-10-23). No revision marks due to major restructure; this is clean version.
Removed previous Preconditioning sections. Restructured tests with suite of Client (Sections 6-8) and Enterprise
(Sections 9-11) tests. Removed “Idle Test”. Revised general flow of tests, plus types of reports. Added new section (Section 5) to provide informative overview of
test flow, and other key concepts/definitions.
0.4 Dec-12-2009 Dave Landsman
Clean version; no change bars Changed “Active Use State” to “Steady State” Completely revised Section 5 for better flow. Added new 6 & 7 as prefaces to actual test sections. Changed basic test flow to incorporate methodology where
convergence to Steady State must be detected AND maintained for duration of test.
Updated Latency test loop parameters and report proposal per discussions w/ Gary Kotzur.
0.5 Feb-27-2010 Dave Landsman
Incorporated TWG changes from V0.4 Updated section 1.2 for better background Updated 1.4 with notes on App Testing and Reference Platform Updated 2.1 with new/modified definitions (steady state, OIO, etc.) Updated 4, in particular 4.2 with test tools requirements. Completely rewrote/restructured Informative Section 5, including
notes on Data Patterns and IO demand (QD/TC). More complete explanations of Steady State, Detecting Steady State, etc.
Rewrote Section 6 to provide better intro to detailed test flow. Edited all tests per comments in TWG. Deleted sample test report in appendix because need to remove
company identification from the sample and a Word bug made it impossible to remove just the name/logo. Will add back later.
Solid State Storage Performance Test Specification – Enterprise – V1.0
19-Nov-2010 Page 3
0.6 Mar-20-2010 Dave Landsman
Integrated all changes from Mar-8-2010 TWG F2F Rewrote material on IO Demand Updated/Deleted/Checked definitions, and validated per SNIA
Dictionary Added “Test Parameters” to required reporting (Sec 3) Revised Section 4 to better address platform requirements Created new IOPS and Throughput Plots
0.7 Apr-23-2010 Dave Landsman
Made all changes per comment resolution of V.06e (commentable) Tried to make “shall”, “may”, etc. more explicit throughout spec Re-ordered Reporting and Platform requirements sections for flow Revised “Reporting Requirements” to be more clear. Added Informative Annex B – PTS Platform Example Added Informative Annex C – Synthetic Application Workloads Restructured sections for flow.
0.7a May-19-2010 Dave Landsman Integrated changes from V0.7 comment resolution, up through, and
including Section 8, Client IOPS test.
0.8 June-07-2010 Dave Landsman
Major update to get to final test structure, report formats, etc. Integrated changes from V0.7a comment resolution. Updated all test sections to new uniform structure. ALL new graphs/charts/tables. Inserted draft Annex A
0.9 June-22-2010 Dave Landsman Continued cleanup. First real edits of Annex A and B, mostly for formatting.
0.98 Nov-11-2010 Dave Landsman
Removed Client sections and updated to make it “Enterprise” only. Added Write Saturation Test Changed block size to be the outer loop for Throughput test. Added explanation of pseudo code in “Conventions” Deleted “Test Overview”, no longer needed since Enterprise only. Added Client and Enterprise to “Definitions” Modified reporting requirement for when Steady State not reached. Updated references.
0.99 Nov-17-2010 Dave Landsman
Added cache requirements (Sec 3.7 and definitions) Revised definition of Latency (definitions) Updated all tables to go from low-to-high block sizes and 100%
Writes (R/W Mix % = 0/100) to 100% Reads (R/W Mix = 100/0) Removed “Workload Independent Preconditioning” step from the
Throughput test.
1.0 Nov-19-2010 Dave Landsman Updated Annex A
Solid State Storage Performance Test Specification – Enterprise – V1.0
19-Nov-2010 Page 4
Contributors The SNIA SSS Technical Work Group, which developed and reviewed this standard, would like to recognize the contributions made by the following members:
Company Contributor
AmerNet, Inc. Khaled Amer
Calypso Eden Kim
Calypso Easen Ho
Calypso Mike Peeler
Coughlin Assoc Tom Coughlin
Dell Gary Kotzur
EMC Don Deel
Fusion-IO Jonathon Thatcher
Hitachi Data Systems Mel Boksenbaum
Hitachi Global Storage Technologies Dan Colegrove
Hewlett-Packard Chuck Paridon
hyperI/O Tom West
IBM Phil Mills
Intel Brady Foster
Intel Terry Yoshii
Intel Harry Pon
LSI Harry Mason
Marvell Semiconductor Paul Wassenberg
Micron Technology Doug Rollins
Objective Analysis Jim Handy
Pliant Mike Chenery
PMC-Sierra Martin Harris
Samsung Steven Peng
SandForce Jeremy Werner
SanDisk Dave Landsman
SanDisk Spencer Ng
Seagate Marty Czekalski
Seagate Alvin Cox
Smart Modular Esther Spanjer
SNIA Arnold Jones
Toshiba TAIS Sumit Puri
Western Digital Gary Drossel
Solid State Storage Performance Test Specification – Enterprise – V1.0
19-Nov-2010 Page 5
Usage The SNIA hereby grants permission for individuals to use this document for personal use only, and for corporations and other business entities to use this document for internal use only (including internal copying, distribution, and display) provided that:
1. Any text, diagram, chart, table or definition reproduced shall be reproduced in its entirety with no alteration.
2. Any document, printed or electronic, in which material from this document (or any
portion hereof) is reproduced shall acknowledge the SNIA copyright on that material, and shall credit the SNIA for granting permission for its reuse.
Other than as explicitly provided above, you may not make any commercial use of this document, sell any or this entire document, or distribute this document to third parties. All rights not explicitly granted are expressly reserved to SNIA. Permission to use this document for purposes other than those enumerated above may be requested by e-mailing [email protected]. Please include the identity of the requesting individual and/or company and a brief description of the purpose, nature, and scope of the requested use.
Disclaimer
The information contained in this publication is subject to change without notice. The SNIA makes no warranty of any kind with regard to this specification, including, but not limited to, the implied warranties of merchantability and fitness for a particular purpose. The SNIA shall not be liable for errors contained herein or for incidental or consequential damages in connection with the furnishing, performance, or use of this specification.
Contacting SNIA
SNIA Web Site Current SNIA practice is to make updates and other information available through their web site at http://www.snia.org SNIA Address Requests for interpretation, suggestions for improvement and addenda, or defect reports are welcome. They should be sent via the SNIA Feedback Portal at http://www.snia.org/feedback/ or by mail to the Storage Networking Industry Association, 500 Sansome Street, Suite #504, San Francisco, CA 94111, U.S.A.
Suggestions for revisions should be directed to http://www.snia.org/feedback/.
Intended Audience
This document is intended for use by individuals and companies engaged in the development of this Specification and in validating the tests and procedures incorporated herein. After approvals and release to the public, this Specification is intended for use by individuals and companies engaged in the design, development, qualification, manufacture, test, acceptance and failure analysis of SSS devices and systems and sub systems incorporating SSS devices.
Changes to the Specification
Each publication of this Specification is uniquely identified by a two-level identifier, comprised of a version number and a release number. Future publications of this specification are subject to specific constraints on the scope of change that is permissible from one publication to the next and the degree of interoperability and backward compatibility that should be assumed between products designed to different publications of this standard. The SNIA has defined three levels of change to a specification:
• Major Revision: A major revision of the specification represents a substantial change to the underlying scope or architecture of the specification. A major revision results in an increase in the version number of the version identifier (e.g., from version 1.x to version
Solid State Storage Performance Test Specification – Enterprise – V1.0
19-Nov-2010 Page 6
2.x). There is no assurance of interoperability or backward compatibility between releases with different version numbers.
• Minor Revision: A minor revision of the specification represents a technical change to
existing content or an adjustment to the scope of the specification. A minor revision results in an increase in the release number of the specification’s identifier (e.g., from x.1 to x.2). Minor revisions with the same version number preserve interoperability and backward compatibility.
Solid State Storage Performance Test Specification – Enterprise – V1.0
19-Nov-2010 Page 7
Table of Contents Revision History ............................................................................................................................ 2
3 Key Test Process Concepts ................................................................................................ 15 3.1 Steady State .............................................................................................................................................. 15 3.2 Purge .......................................................................................................................................................... 15 3.3 Preconditioning ........................................................................................................................................ 15 3.4 ActiveRange .............................................................................................................................................. 16 3.5 Data Patterns ........................................................................................................................................... 16 3.6 Multiple Thread Guideline .................................................................................................................... 16 3.7 Caching ...................................................................................................................................................... 16
4 Overview of Common Test Flow ...................................................................................... 17
5 Common Reporting Requirements ................................................................................... 18 5.1 General ...................................................................................................................................................... 18 5.2 Test System Hardware .......................................................................................................................... 18 5.3 Test System Software ............................................................................................................................ 18 5.4 Device Under Test ................................................................................................................................. 18
6 Test Tool Guidelines ........................................................................................................... 19
7 IOPS Test ............................................................................................................................. 20 7.1 Test Specific Reporting for IOPS Test ............................................................................................... 21 7.1.1 Purge ...................................................................................................................................................... 21 7.1.2 Workload Independent Preconditioning ....................................................................................... 21 7.1.3 Steady State Convergence ................................................................................................................ 21
Solid State Storage Performance Test Specification – Enterprise – V1.0
19-Nov-2010 Page 8
7.1.4 Steady State Verification ................................................................................................................... 22 7.1.5 Measurement ....................................................................................................................................... 23
11 Informative Annex A – Sample Test Report ................................................................. 34
12 Informative Annex B – Performance Test Platform Example .................................... 41 12.1 RTP Configurations ............................................................................................................................ 41 12.2 RTP Components ............................................................................................................................... 41
Solid State Storage Performance Test Specification – Enterprise – V1.0
19-Nov-2010 Page 9
List of Tables <List generated by MS Word>
List of Figures Figure 1-1 – NAND-based SSS Performance States for 8 Devices ........................................... 10 Figure 8-1 - Steady State Verification Example Plot ................................................................... 22
Solid State Storage Performance Test Specification – Enterprise – V1.0
19-Nov-2010 Page 10
1 Introduction
1.1 Purpose
Manufacturers need to set, and customers need to compare, the performance of Solid State Storage (SSS) devices. This Specification defines a set of device level tests and methodologies intended to enable comparative testing of SSS devices in Enterprise (see 2.1.4) systems.
Note: While the tests defined in this specification could be applied to SSS devices based on any technology (RAM, NAND, etc.), the emphasis in this specification, in particular regarding Preconditioning and Steady State, is oriented towards NAND.
1.2 Background
A successful device level performance test isolates the device being tested from the underlying test platform (HW, OS, Tools, Applications) so the only limiting variable in the test environment is the device being tested. To achieve this goal with NAND-based SSS devices, in addition to typical system/device isolation issues, the test, and test methodologies, must address attributes unique to NAND-based flash media.
NAND-based SSS device controllers map Logical to Physical blocks on the NAND media, in order to achieve the best NAND performance and endurance. The SSS device manages this LBA-to-PBA mapping with internal processes that operate independently of the host. The sum of this activity is referred to as “flash management”.
The performance of the flash management during a test, and hence the overall performance of the SSS device during the test, depends critically on:
1) Write History and Preconditioning: The state of the device prior to the test 2) Workload Pattern: Pattern of the I/O (r/w mix, block size, etc.) written to device during test 3) Data Pattern: The actual bits in the data payload written to the device
The methodologies defined in the SSS Performance Test Specification (SSS PTS) attempt to create consistent conditions for items 1-3 so that the only variable is the device under test.
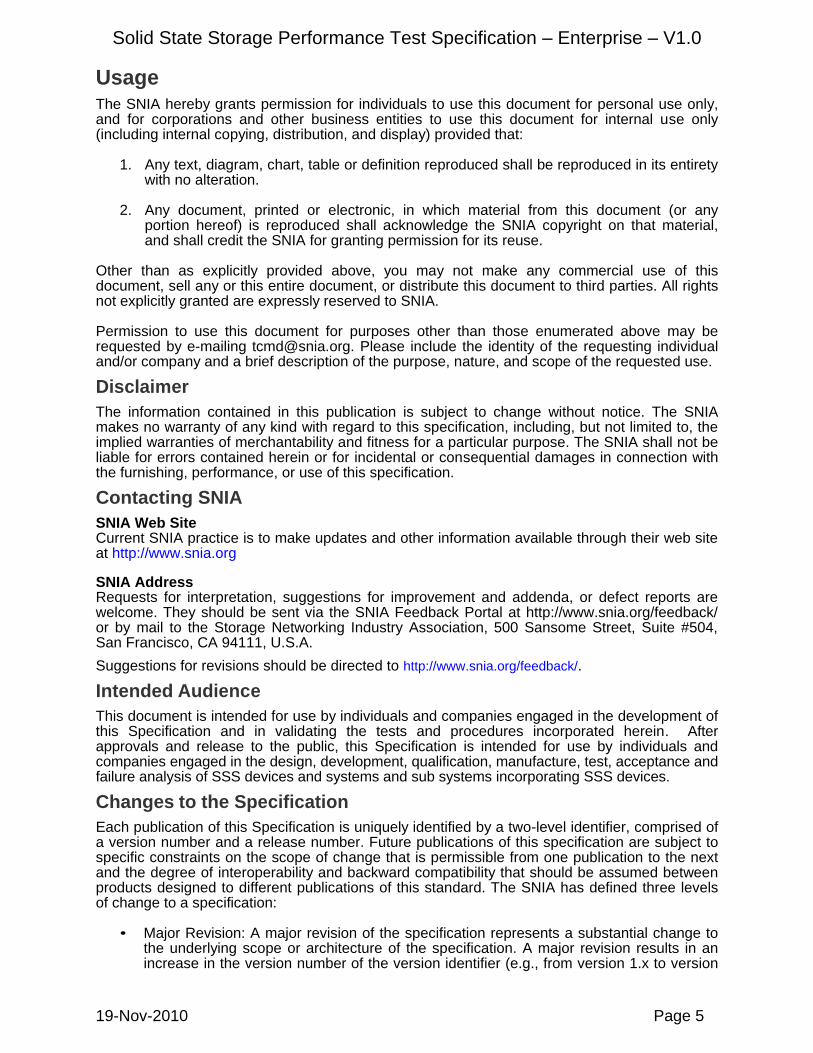
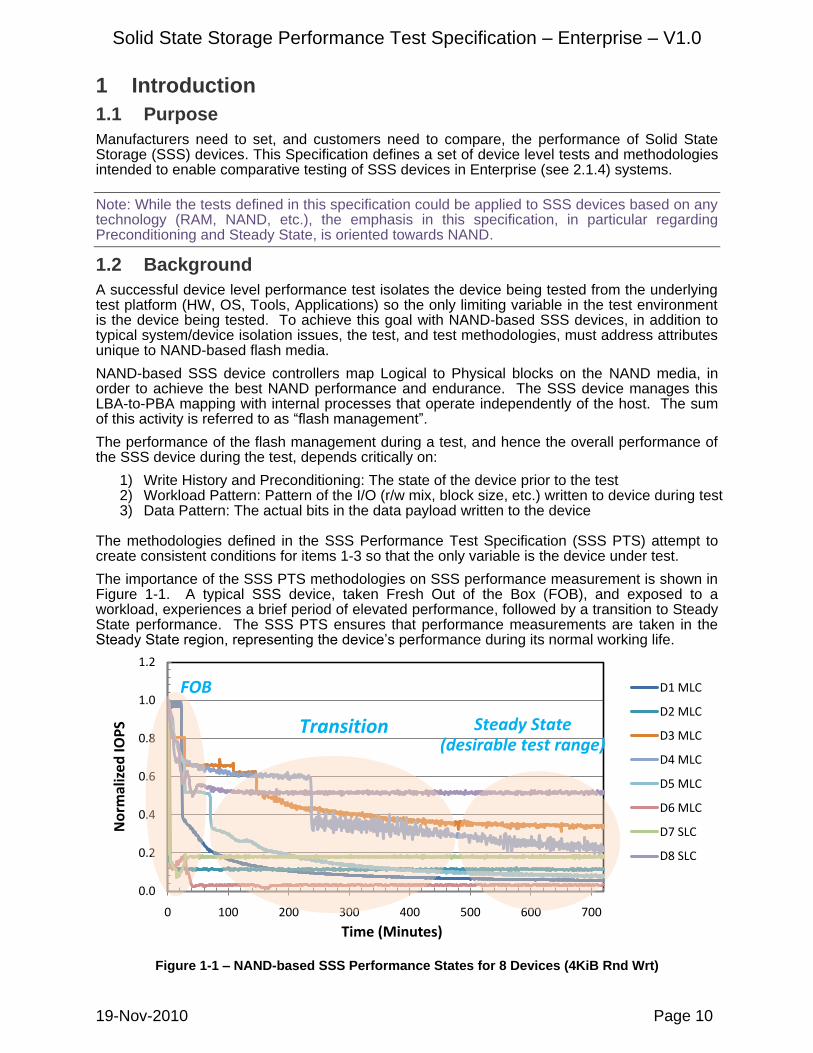
The importance of the SSS PTS methodologies on SSS performance measurement is shown in Figure 1-1. A typical SSS device, taken Fresh Out of the Box (FOB), and exposed to a workload, experiences a brief period of elevated performance, followed by a transition to Steady State performance. The SSS PTS ensures that performance measurements are taken in the Steady State region, representing the device’s performance during its normal working life.
Figure 1-1 – NAND-based SSS Performance States for 8 Devices (4KiB Rnd Wrt)
0.0
0.2
0.4
0.6
0.8
1.0
1.2
0 100 200 300 400 500 600 700
No
rmal
ize
d IO
PS
Time (Minutes)
D1 MLC
D2 MLC
D3 MLC
D4 MLC
D5 MLC
D6 MLC
D7 SLC
D8 SLC
FOB
Transition Steady State(desirable test range)
Solid State Storage Performance Test Specification – Enterprise – V1.0
19-Nov-2010 Page 11
1.3 Scope
1) Preconditioning methods 2) Performance tests 3) Test reporting requirements
1.4 Not in Scope
1) Application Workload Tests 2) Test Platform (HW/OS/Tools) 3) Certification/Validation procedures for this specification 4) Device reliability, availability, or data integrity
1.5 Disclaimer
Use or recommended use of any public domain, third party or proprietary software does not imply nor infer SNIA or SSS TWG endorsement of the same. Reference to any such test or measurement software, stimulus tools, or software programs is strictly limited to the specific use and purpose as set forth in this Specification and does not imply any further endorsement or verification on the part of SNIA or the SSS TWG.
1.6 Normative References
1.6.1 Approved references
These are the standards, specifications and other documents that have been finalized and are referenced in this specification.
IDEMA Document LBA1-02 -- LBA Count for IDE Hard Disk Drives Standard JEDEC JESD218 – Solid-State Drive (SSD) Requirements and Endurance Test Method JEDEC JESD219 – Solid-State Drive (SSD) Endurance Workloads
1.6.2 References under development
ATA/ATAPI Command Set - 2 (ACS-2) – INCITS/T13 2015-D
1.6.3 Other references
TBD
Solid State Storage Performance Test Specification – Enterprise – V1.0
19-Nov-2010 Page 12
2 Definitions, symbols, abbreviations, and conventions
2.1 Definitions
2.1.1 ActiveRange: Specified as ActiveRange(start:end), where “start” and “end” are percentages. ActiveRange is the range of LBA’s that may be accessed by the preconditioning and/or test code, where the starting LBA# = start%*MaxUserLBA and the ending LBA# = end%*MaxUserLBA.
2.1.2 Cache: A volatile or non-volatile data storage area outside the User Capacity that may contain a subset of the data stored within the User Capacity.
2.1.3 Client: Single user desktop or laptop system used in home or office.
2.1.4 Enterprise: Servers in data centers, storage arrays, and enterprise wide / multiple user environments that employ direct attached storage, storage attached networks and tiered storage architectures.
2.1.5 Fresh Out of the Box (FOB): State of SSS prior to being put into service.
2.1.6 IO Demand: Measured # of OIOs executing in the host.
2.1.7 Logical Block Address (LBA): The address of a logical block, i.e., the offset of the block from the beginning of the logical device that contains it.
2.1.8 Latency: The time between when the workload generator makes an IO request and when it receives notification of the request’s completion.
2.1.9 MaxUserLBA: The maximum LBA # addressable in the User Capacity.
2.1.10 Measurement Window: The interval, measured in Rounds, during which test data is collected, bounded by the Round in which the device has been observed to have maintained Steady State for the specified number of Rounds (Round x), and five Rounds previous (Round x-4).
2.1.11 Nonvolatile Cache: A cache that retains data through power cycles.
2.1.12 Outstanding IO (OIO): The number of IO operations issued by a host, or hosts, awaiting completion.
2.1.13 OIO/Thread: The number of OIO allowed per Thread (Worker, Process)
2.1.14 Over-Provisioned Capacity: LBA range provided by the manufacturer for performance and endurance considerations, but not accessible by the host file system, operating system, applications, or user.
2.1.15 Preconditioning: The process of writing data to the device to prepare it for Steady State measurement. .
2.1.16 Purge: The process of returning an SSS device to a state in which subsequent writes execute, as closely as possible, as if the device had never been used and does not contain any valid data.
2.1.17 Round: A complete pass through all the prescribed test points for any given test.
2.1.18 Steady State: A device is said to be in Steady State when, for the dependent variable (y) being tracked:
a) Range(y) is less than 20% of Ave(y): Max(y)-Min(y) within the Measurement Window is no more than 20% of the Ave(y) within the Measurement Window; and
b) Slope(y) is less than 10%: Max(y)-Min(y), where Max(y) and Min(y) are the maximum and minimum values on the best linear curve fit of the y-values within the Measurement Window, is within 10% of Ave(y) value within the Measurement Window.
2.1.19 Thread: Execution context defined by host OS/CPU (also: Process, Worker)
2.1.20 Thread Count (TC): Number of Threads (or Workers or Processes) specified by a test.
2.1.21 Total OIO: Total outstanding IO Operations specified by a test = (OIO/Thread) * (TC)
Solid State Storage Performance Test Specification – Enterprise – V1.0
19-Nov-2010 Page 13
2.1.22 User Capacity: LBA range directly accessible by the file system, operating system and applications, not including Over-Provisioned Capacity.
2.1.23 Workload Based Preconditioning: The technique of running the test workload itself, typically after Workload Independent Preconditioning, as a means to put the device in a Steady State relative to the dependent variable being tested.
2.1.24 Workload Independent Preconditioning: The technique of running a prescribed workload, unrelated, except by possible coincidence, to the test workload, as a means to facilitate convergence to Steady State.
2.1.25 Volatile Cache: A cache that does not retain data through power cycles.
2.2 Acronyms and Abbreviations
2.2.1 IOPS: I/O Operations per Second
2.2.2 DUT: Device Under Test
2.2.3 FOB: Fresh Out of Box
2.2.4 OIO: Outstanding IO
2.2.5 R/W: Read/Write
2.2.6 SSSI: Solid State Storage Initiative
2.2.7 SSS TWG: Solid State Storage Technical Working Group
2.2.8 TC: Thread Count
2.3 Keywords
The key words “shall”, “required”, “shall not”, “should”, “recommended”, “should not”, “may”, and “optional” in this document are to be interpreted as:
2.3.1 Shall: This word, or the term "required", means that the definition is an absolute requirement of the specification.
2.3.2 Shall Not: This phrase means that the definition is an absolute prohibition of the specification.
2.3.3 Should: This word, or the adjective "recommended", means that there may be valid reasons in particular circumstances to ignore a particular item, but the full implications must be understood and weighed before choosing a different course.
2.3.4 Should Not: This phrase, or the phrase "not recommended", means that there may exist valid reasons in particular circumstances when the particular behavior is acceptable or even useful, but the full implications should be understood and the case carefully weighed before implementing any behavior described with this label.
2.3.5 May: This word, or term “optional”, indicates flexibility, with no implied preference.
2.4 Conventions
2.4.1 Number Conventions
Numbers that are not immediately followed by lower-case b or h are decimal values.
Numbers immediately followed by lower-case b (xxb) are binary values.
Numbers immediately followed by lower-case h (xxh) are hexadecimal values.
Hexadecimal digits that are alphabetic characters are upper case (i.e., ABCDEF, not abcdef).
Hexadecimal numbers may be separated into groups of four digits by spaces. If the number is not a multiple of four digits, the first group may have fewer than four digits (e.g., AB CDEF 1234 5678h).
Storage capacities shall be reported in Base-10. IO transfer sizes and offsets shall be reported in Base-2. The associated units and abbreviations used in this specification are:
• A kilobyte (KB) is equal to 1,000 (103) bytes.
Solid State Storage Performance Test Specification – Enterprise – V1.0
19-Nov-2010 Page 14
• A megabyte (MB) is equal to 1,000,000 (106) bytes. • A gigabyte (GB) is equal to 1,000,000,000 (109) bytes. • A terabyte (TB) is equal to 1,000,000,000,000 (1012) bytes. • A petabyte (PB) is equal to 1,000,000,000,000,000 (1015) bytes • A kibibyte (KiB) is equal to 210 bytes. • A mebibyte (MiB) is equal to 220 bytes. • A gibibyte (GiB) is equal to 230 bytes. • A tebibyte (TiB) is equal to 240 bytes. • A pebibyte (PiB) is equal to 250 bytes
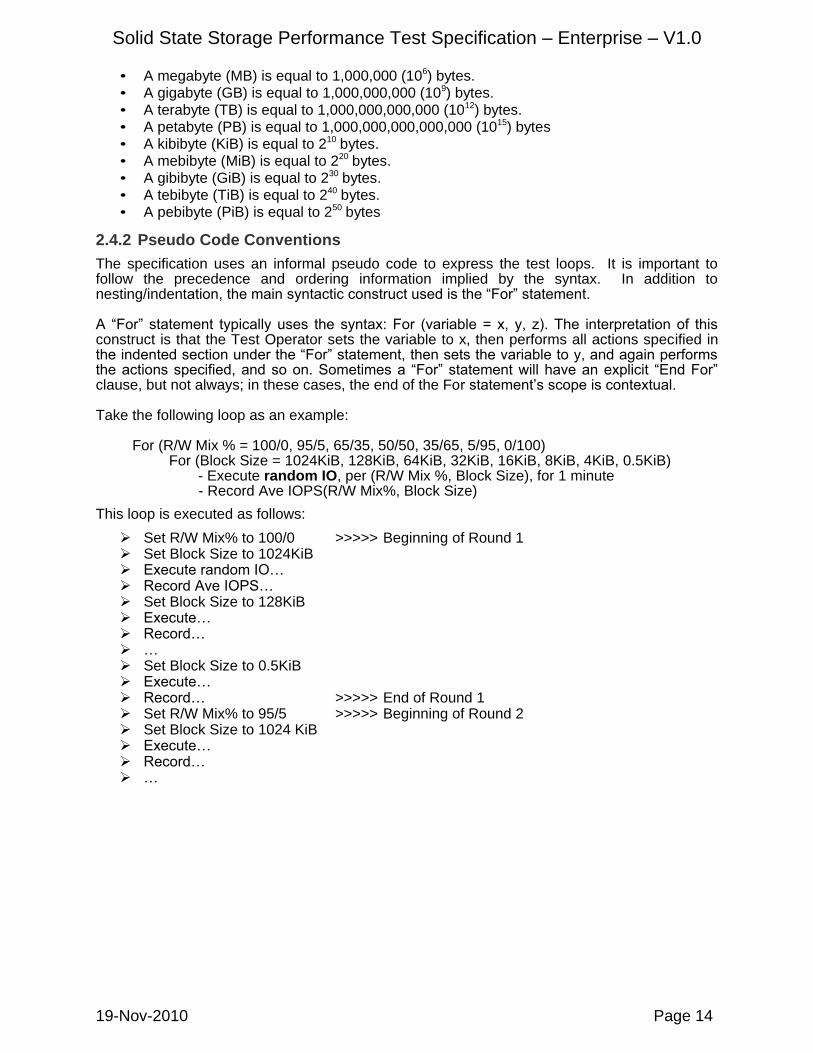
2.4.2 Pseudo Code Conventions
The specification uses an informal pseudo code to express the test loops. It is important to follow the precedence and ordering information implied by the syntax. In addition to nesting/indentation, the main syntactic construct used is the “For” statement. A “For” statement typically uses the syntax: For (variable = x, y, z). The interpretation of this construct is that the Test Operator sets the variable to x, then performs all actions specified in the indented section under the “For” statement, then sets the variable to y, and again performs the actions specified, and so on. Sometimes a “For” statement will have an explicit “End For” clause, but not always; in these cases, the end of the For statement’s scope is contextual. Take the following loop as an example:
- Execute random IO, per (R/W Mix %, Block Size), for 1 minute - Record Ave IOPS(R/W Mix%, Block Size)
This loop is executed as follows:
Set R/W Mix% to 100/0 >>>>> Beginning of Round 1 Set Block Size to 1024KiB Execute random IO… Record Ave IOPS… Set Block Size to 128KiB Execute… Record… … Set Block Size to 0.5KiB Execute… Record… >>>>> End of Round 1 Set R/W Mix% to 95/5 >>>>> Beginning of Round 2 Set Block Size to 1024 KiB Execute… Record… …
Solid State Storage Performance Test Specification – Enterprise – V1.0
19-Nov-2010 Page 15
3 Key Test Process Concepts The performance of an SSS device is highly dependent on its prior usage, the pre-test state of the device and test parameters. This section describes key SSS test methodology concepts.
3.1 Steady State
SSS devices that are Fresh Out of the Box, or in an equivalent state, typically exhibit a transient period of elevated performance, which evolves to a stable performance state relative to the workload being applied. This state is referred to as a Steady State (Section 2.1.18). It is important that the test data be gathered during a time window when the device is in Steady State, for two primary reasons:
1) To ensure that a device’s initial performance (FOB or Purged) will not be reported as “typical”, since this is transient behavior and not a meaningful indicator of the drive’s performance during the bulk of its operating life.
2) To enable Test Operators and reviewers to observe and understand trends. For
example, oscillations around an average are “steady” in a sense, but might be a cause for concern.
Steady State may be verified:
by inspection, after running a number of Rounds and examining the data; programmatically, during execution; or by any other method, as long as the attainment of Steady State, per Definition 2.1.18, is
demonstrated and documented.
Steady State reporting requirements are covered in the respective test sections.
3.2 Purge
The purpose of the Purge process (Definition 2.1.16) is to put the device in a consistent state prior to preconditioning and testing, and to facilitate a clear demonstration of Steady State convergence behavior. Purge shall be run prior to each preconditioning and testing cycle. If the device under test does not support any kind of Purge method, and the Test Operator chooses to run the PTS, the fact that Purge was not supported/run must be documented in the test report. The Test Operator may select any valid method of implementing the Purge process, including, but not limited to, the following:
a) ATA: SECURITY ERASE, SANITIZE DEVICE (BLOCK ERASE EXT) b) SCSI: FORMAT UNIT c) Vendor specific methods
The Test Operator shall report what method of Purge was used.
3.3 Preconditioning
The goal of preconditioning is to facilitate convergence to Steady State during the test itself. The SSS PTS defines two types of preconditioning:
Workload Independent Preconditioning (Definition 2.1.23); and Workload Based Preconditioning (Definition 2.1.24)
Note: While Workload Based Preconditioning is not a distinct step in the test scripts (it occurs as part of running the core test loop in each test), it is critically important to achieving valid Steady State results.
Solid State Storage Performance Test Specification – Enterprise – V1.0
19-Nov-2010 Page 16
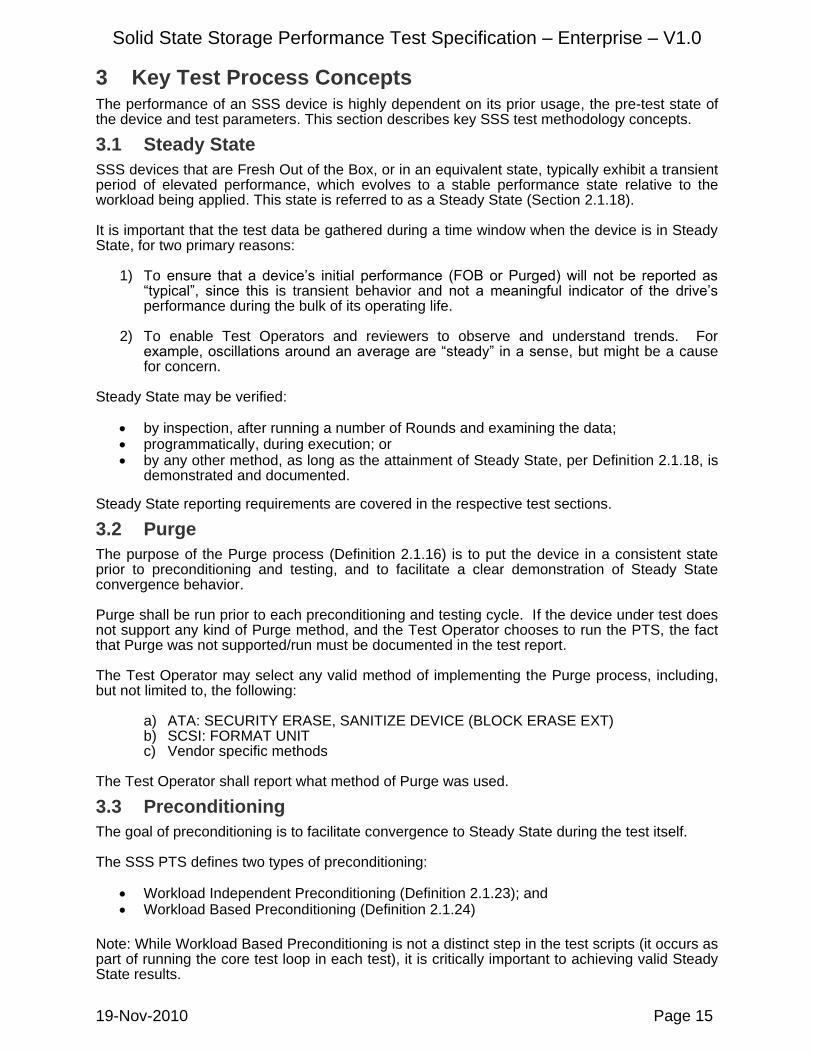
3.4 ActiveRange
It is desirable to be able to test the performance characteristics of workloads which issue IO across a wide range of the LBA space vs. those which issue IO across only a narrow range. To enable this, the SSS Performance Specification defines ActiveRange. (Definition 2.1.1) The test scripts define required and optional settings for ActiveRange. The figures below show two examples of ActiveRange.
ActiveRange (0:100) ActiveRange (40:50)
3.5 Data Patterns
All tests shall be run with a random data pattern. The Test Operator may execute additional runs with non-random data patterns. If non-random data patterns are used, the Test Operator must report the data pattern.
Note: Some SSS devices look for and optimize certain data patterns in the data payloads written to the device. It is not feasible to test for all possible kinds of optimizations, which are vendor specific and often market segment specific. The SSS TWG is still trying to characterize “how random is random enough” with respect to data patterns.
3.6 Multiple Thread Guideline
If the Test Operator wishes to run a test using multiple Threads, it is recommended that OIO/Thread for all Threads be equal, so Total OIO is equal to (OIO/Thread) * (Thread Count). This will enable more direct comparisons.
3.7 Caching
All tests should be run with all volatile write caches disabled. The cache state shall be reported.
Solid State Storage Performance Test Specification – Enterprise – V1.0
19-Nov-2010 Page 17
4 Overview of Common Test Flow The tests in the SSS PTS use the same general steps and flow, described below. Test-specific parameter settings, reports, and other requirements are documented in the test sections themselves.
Basic Test Flow:
For (ActiveRange = the specified values)
1) Purge the device
Note: Test Operator may use any values for ActiveRange and Test Parameters for this step; no parameter reporting is required.
2) Run Workload Independent Preconditioning
Note: Test Operator shall use specified ActiveRange (“For ActiveRange =”), but may choose other Test Parameter values to optimize this step, and shall report them.
3) Run Test (includes Workload Based Preconditioning):
a) Set Test Parameters (OIO/Thread, Thread Count, Data Pattern, etc.) as specified in the test script.
b) Run test loop until Steady State reached, or a maximum of 25 Rounds. Accumulate/Record intermediate data, as specified in test, for each Round.
4) Post process & plot the Rounds data:
a) If Steady State is reached by Round x<=25, where the Measurement Window is Round x-4:x, the Test Operator shall: i) Plot rounds 1:x per “Steady State Convergence Plot”; ii) Plot Rounds x-4:x per “Steady State Verification Plot”; and iii) Plot Rounds x-4:x per “Measurement Plot”.
b) If Steady State is not reached by Round x<=25, the Test Operator shall either: i) Continue at 3b until Steady State reached (x>25), and then report per 4a(i-iii); or ii) Stop at Round x and report per 4a(i-iii).
End “For ActiveRange”
The Test Operator may re-run the entire “For ActiveRange” loop with alternate test parameters, which may be optional or required, depending on the test.
End “Basic Test Flow” Note: Steps (2) and (3) must each be run with no interruptions, and there must be no delay between Step (2) and Step (3), to maintain consistent test conditions for all devices.
Note: With respect to the reports in Step (4):
The Steady State Convergence Plot shows general visual convergence to Steady State by plotting the dependent variable (IOPS, Throughput, etc.) for each Round.
The Steady State Verification Plot shows, via either graph or table, that the device has reached Steady State per definition 2.1.18, by examining dependent variable behavior within the Measurement Window.
The Measurement Plot is not one, but a set of, plots/reports, which summarize the test data in the Measurement Window, for the metric being measured.
The content of these plots, and other test-specific reporting, is specified in each test.
Solid State Storage Performance Test Specification – Enterprise – V1.0
19-Nov-2010 Page 18
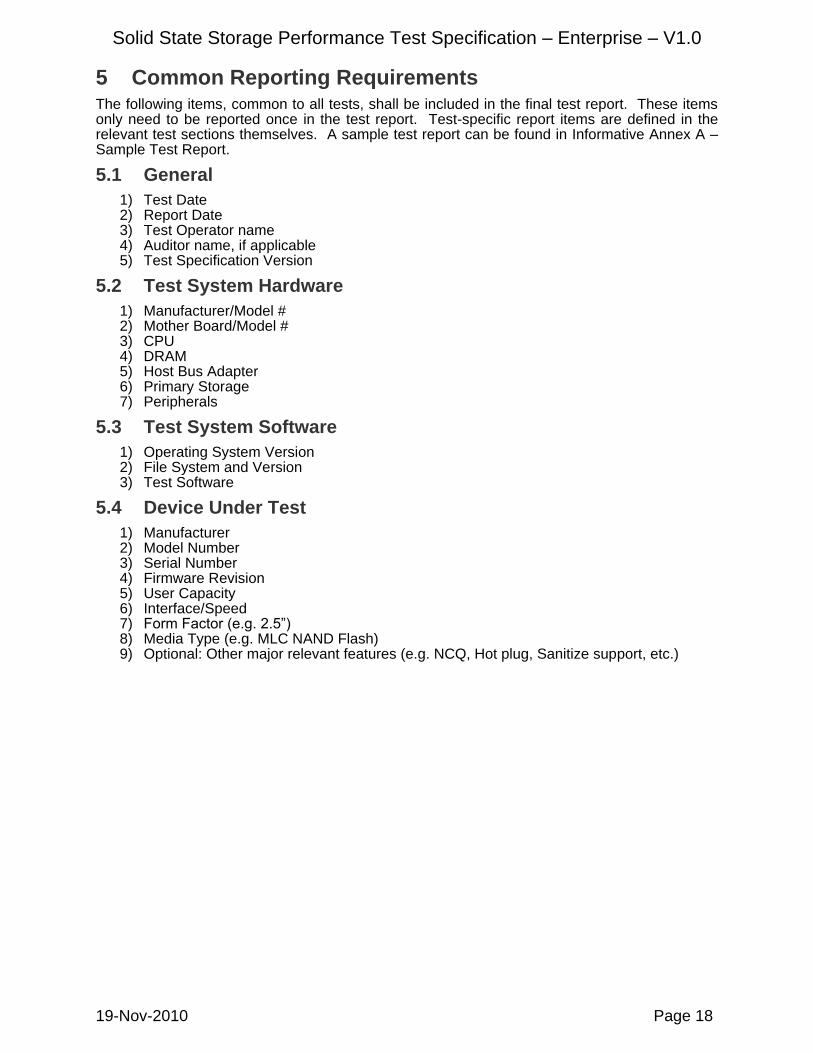
5 Common Reporting Requirements The following items, common to all tests, shall be included in the final test report. These items only need to be reported once in the test report. Test-specific report items are defined in the relevant test sections themselves. A sample test report can be found in Informative Annex A – Sample Test Report.
5.1 General
1) Test Date 2) Report Date 3) Test Operator name 4) Auditor name, if applicable 5) Test Specification Version
5.2 Test System Hardware
1) Manufacturer/Model # 2) Mother Board/Model # 3) CPU 4) DRAM 5) Host Bus Adapter 6) Primary Storage 7) Peripherals
5.3 Test System Software
1) Operating System Version 2) File System and Version 3) Test Software
5.4 Device Under Test
1) Manufacturer 2) Model Number 3) Serial Number 4) Firmware Revision 5) User Capacity 6) Interface/Speed 7) Form Factor (e.g. 2.5”) 8) Media Type (e.g. MLC NAND Flash) 9) Optional: Other major relevant features (e.g. NCQ, Hot plug, Sanitize support, etc.)
Solid State Storage Performance Test Specification – Enterprise – V1.0
19-Nov-2010 Page 19
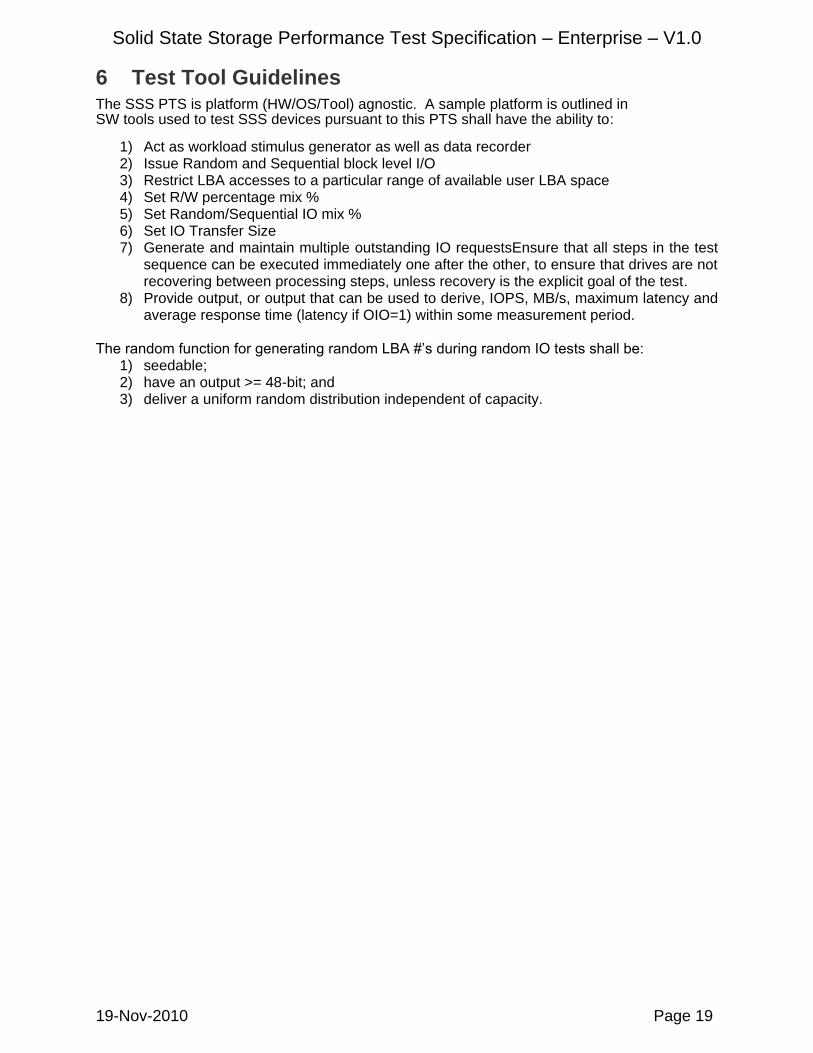
6 Test Tool Guidelines The SSS PTS is platform (HW/OS/Tool) agnostic. A sample platform is outlined in SW tools used to test SSS devices pursuant to this PTS shall have the ability to:
1) Act as workload stimulus generator as well as data recorder 2) Issue Random and Sequential block level I/O 3) Restrict LBA accesses to a particular range of available user LBA space 4) Set R/W percentage mix % 5) Set Random/Sequential IO mix % 6) Set IO Transfer Size 7) Generate and maintain multiple outstanding IO requestsEnsure that all steps in the test
sequence can be executed immediately one after the other, to ensure that drives are not recovering between processing steps, unless recovery is the explicit goal of the test.
8) Provide output, or output that can be used to derive, IOPS, MB/s, maximum latency and average response time (latency if OIO=1) within some measurement period.
The random function for generating random LBA #’s during random IO tests shall be:
1) seedable; 2) have an output >= 48-bit; and 3) deliver a uniform random distribution independent of capacity.
Solid State Storage Performance Test Specification – Enterprise – V1.0
19-Nov-2010 Page 20
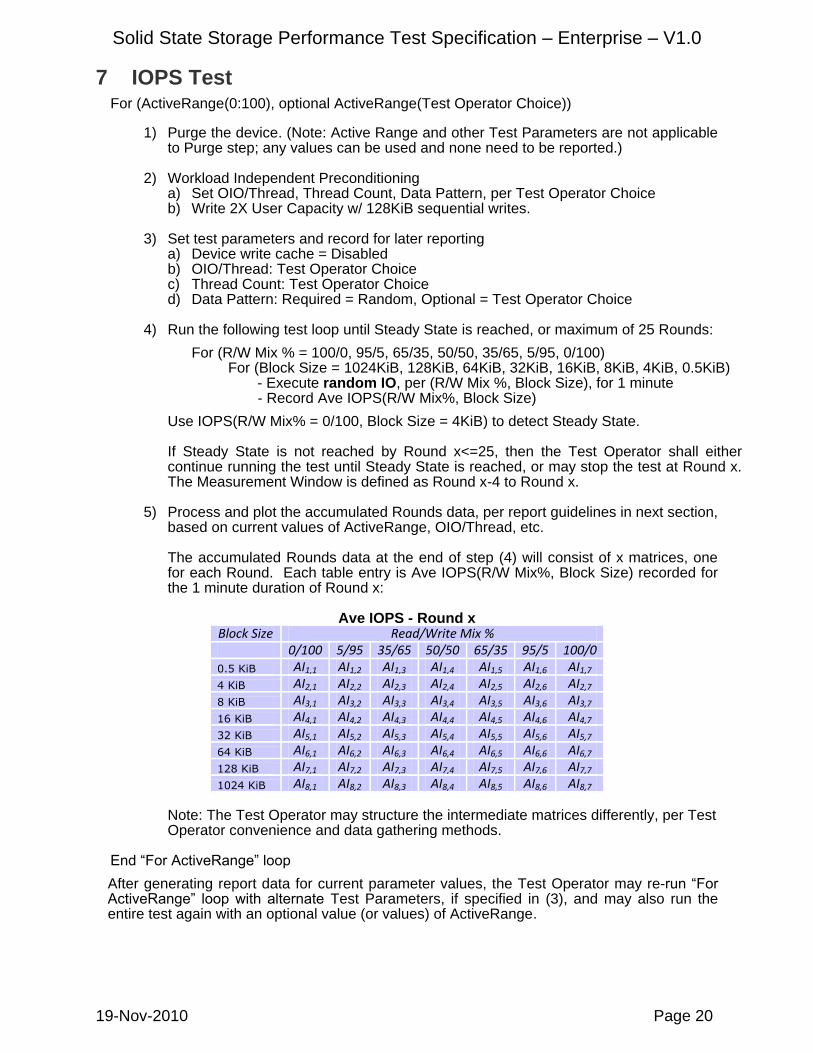
7 IOPS Test For (ActiveRange(0:100), optional ActiveRange(Test Operator Choice))
1) Purge the device. (Note: Active Range and other Test Parameters are not applicable
to Purge step; any values can be used and none need to be reported.) 2) Workload Independent Preconditioning
a) Set OIO/Thread, Thread Count, Data Pattern, per Test Operator Choice b) Write 2X User Capacity w/ 128KiB sequential writes.
3) Set test parameters and record for later reporting
a) Device write cache = Disabled b) OIO/Thread: Test Operator Choice c) Thread Count: Test Operator Choice d) Data Pattern: Required = Random, Optional = Test Operator Choice
4) Run the following test loop until Steady State is reached, or maximum of 25 Rounds:
- Execute random IO, per (R/W Mix %, Block Size), for 1 minute - Record Ave IOPS(R/W Mix%, Block Size)
Use IOPS(R/W Mix% = 0/100, Block Size = 4KiB) to detect Steady State. If Steady State is not reached by Round x<=25, then the Test Operator shall either continue running the test until Steady State is reached, or may stop the test at Round x. The Measurement Window is defined as Round x-4 to Round x.
5) Process and plot the accumulated Rounds data, per report guidelines in next section, based on current values of ActiveRange, OIO/Thread, etc.
The accumulated Rounds data at the end of step (4) will consist of x matrices, one for each Round. Each table entry is Ave IOPS(R/W Mix%, Block Size) recorded for the 1 minute duration of Round x:
Note: The Test Operator may structure the intermediate matrices differently, per Test Operator convenience and data gathering methods.
End “For ActiveRange” loop
After generating report data for current parameter values, the Test Operator may re-run “For ActiveRange” loop with alternate Test Parameters, if specified in (3), and may also run the entire test again with an optional value (or values) of ActiveRange.
Solid State Storage Performance Test Specification – Enterprise – V1.0
19-Nov-2010 Page 21
7.1 Test Specific Reporting for IOPS Test
The following sub-sections list the reporting requirements specific to the IOPS test. Reporting requirements common to all tests are documented in Section 5, Common Reporting Requirements. See also Informative Annex A – Sample Test Report. If Steady State was reached at Round x, the Test Operator shall:
Plot rounds 1:x per “Throughput Steady State Convergence Plot”; Plot Rounds x-4:x per “Throughput Steady State Verification Plot”; and Plot Rounds x-4:x per “Throughput Measurement Plot.”
If Steady State was not reached then the Test Operator may report results per above, picking the last Round run as Round x. In the case where Steady State was not reached, the Test Operator must state this fact in the final report.
7.1.1 Purge
The Test Operator shall report the method used to run the Purge operation.
7.1.2 Workload Independent Preconditioning
The Test Operator shall report the following regarding the Workload Independent Preconditioning step: 1) ActiveRange; 2) OIO/Thread; 3) Thread Count; and 4: Data Pattern
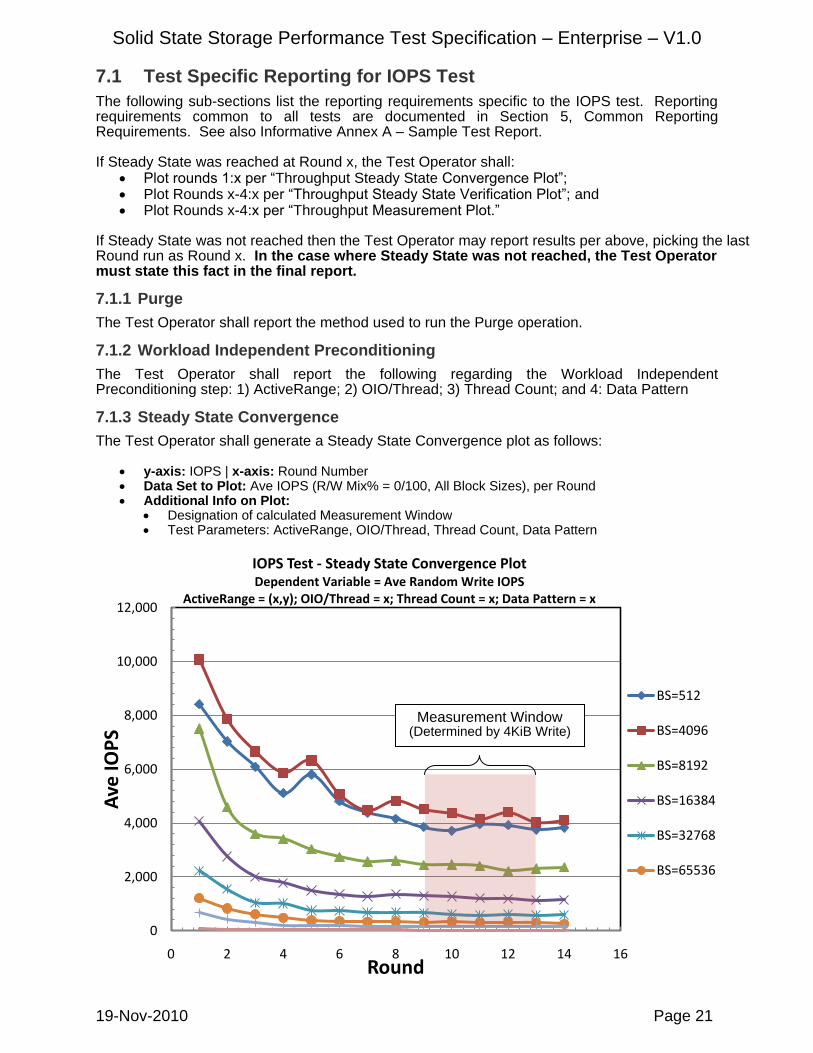
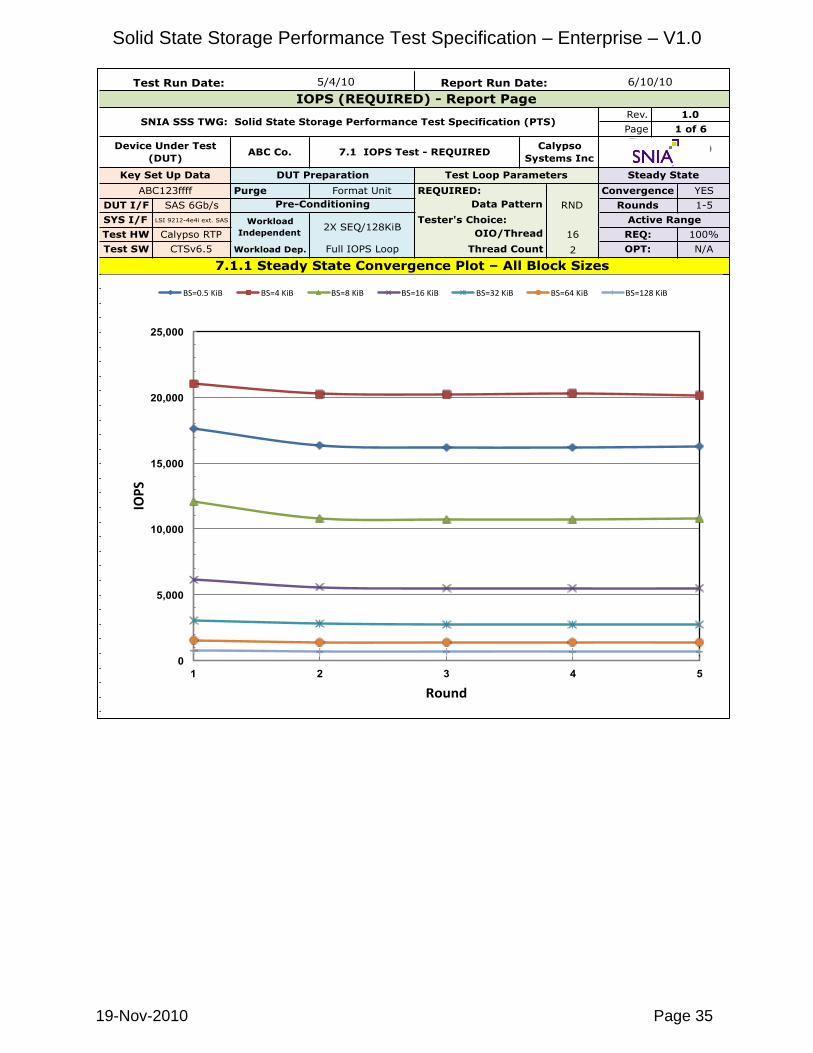
7.1.3 Steady State Convergence
The Test Operator shall generate a Steady State Convergence plot as follows:
y-axis: IOPS | x-axis: Round Number Data Set to Plot: Ave IOPS (R/W Mix% = 0/100, All Block Sizes), per Round Additional Info on Plot:
Designation of calculated Measurement Window Test Parameters: ActiveRange, OIO/Thread, Thread Count, Data Pattern
0
2,000
4,000
6,000
8,000
10,000
12,000
0 2 4 6 8 10 12 14 16
Ave
IOP
S
Round
IOPS Test - Steady State Convergence PlotDependent Variable = Ave Random Write IOPS
ActiveRange = (x,y); OIO/Thread = x; Thread Count = x; Data Pattern = x
BS=512
BS=4096
BS=8192
BS=16384
BS=32768
BS=65536
Measurement Window (Determined by 4KiB Write)
Solid State Storage Performance Test Specification – Enterprise – V1.0
19-Nov-2010 Page 22
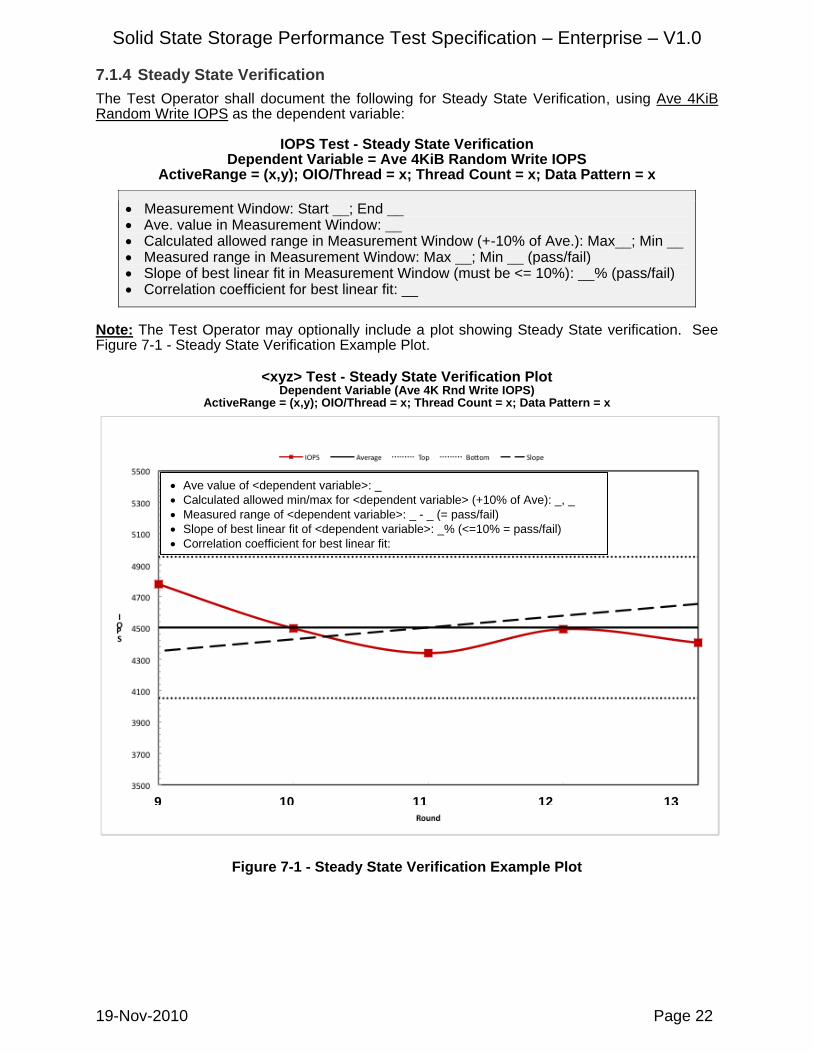
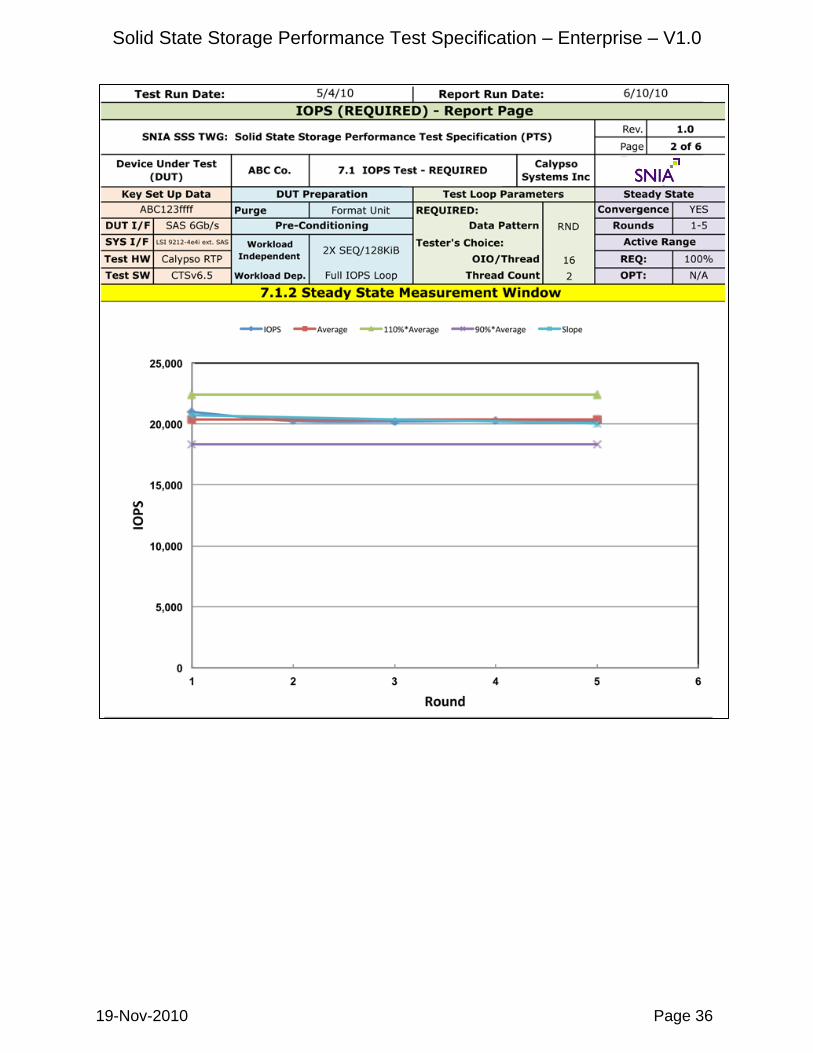
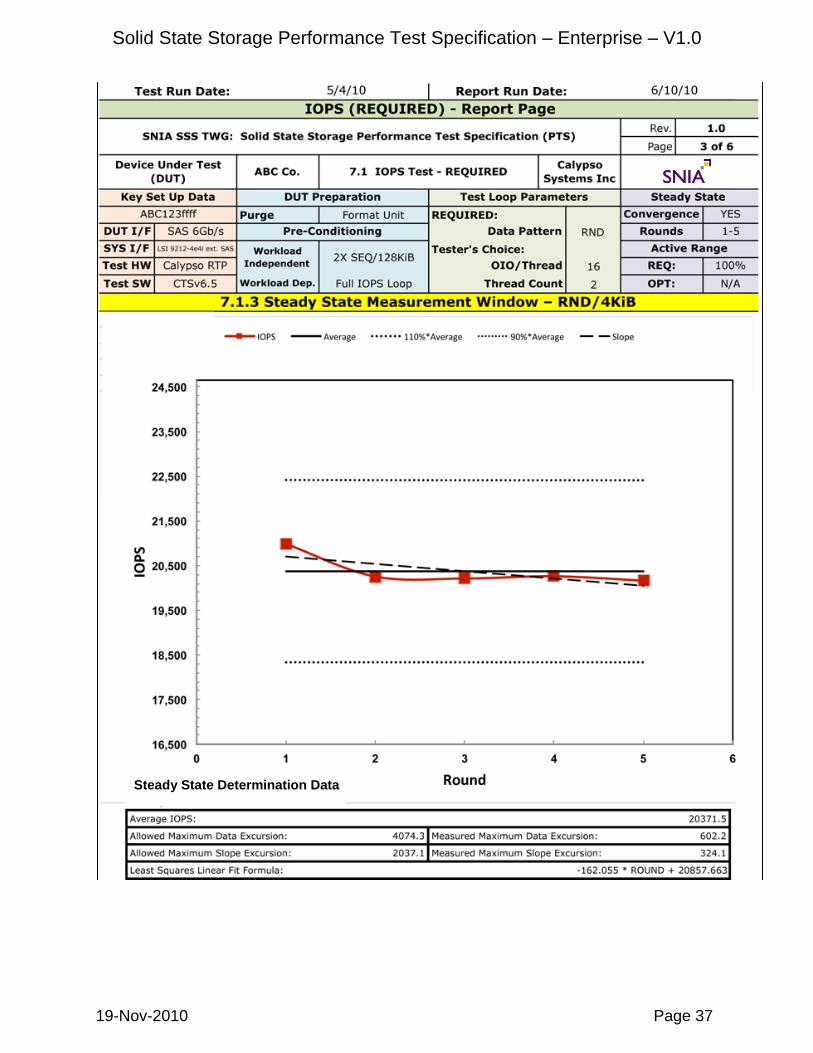
7.1.4 Steady State Verification
The Test Operator shall document the following for Steady State Verification, using Ave 4KiB Random Write IOPS as the dependent variable:
IOPS Test - Steady State Verification Dependent Variable = Ave 4KiB Random Write IOPS
ActiveRange = (x,y); OIO/Thread = x; Thread Count = x; Data Pattern = x
Measurement Window: Start __; End __ Ave. value in Measurement Window: __ Calculated allowed range in Measurement Window (+-10% of Ave.): Max__; Min __ Measured range in Measurement Window: Max __; Min __ (pass/fail) Slope of best linear fit in Measurement Window (must be <= 10%): __% (pass/fail) Correlation coefficient for best linear fit: __
Note: The Test Operator may optionally include a plot showing Steady State verification. See Figure 7-1 - Steady State Verification Example Plot.
<xyz> Test - Steady State Verification Plot Dependent Variable (Ave 4K Rnd Write IOPS)
ActiveRange = (x,y); OIO/Thread = x; Thread Count = x; Data Pattern = x
Figure 7-1 - Steady State Verification Example Plot
9 10 11 12 13
Ave value of <dependent variable>: _
Calculated allowed min/max for <dependent variable> (+10% of Ave): _, _
Measured range of <dependent variable>: _ - _ (= pass/fail)
Slope of best linear fit of <dependent variable>: _% (<=10% = pass/fail)
Correlation coefficient for best linear fit: _
Solid State Storage Performance Test Specification – Enterprise – V1.0
19-Nov-2010 Page 23
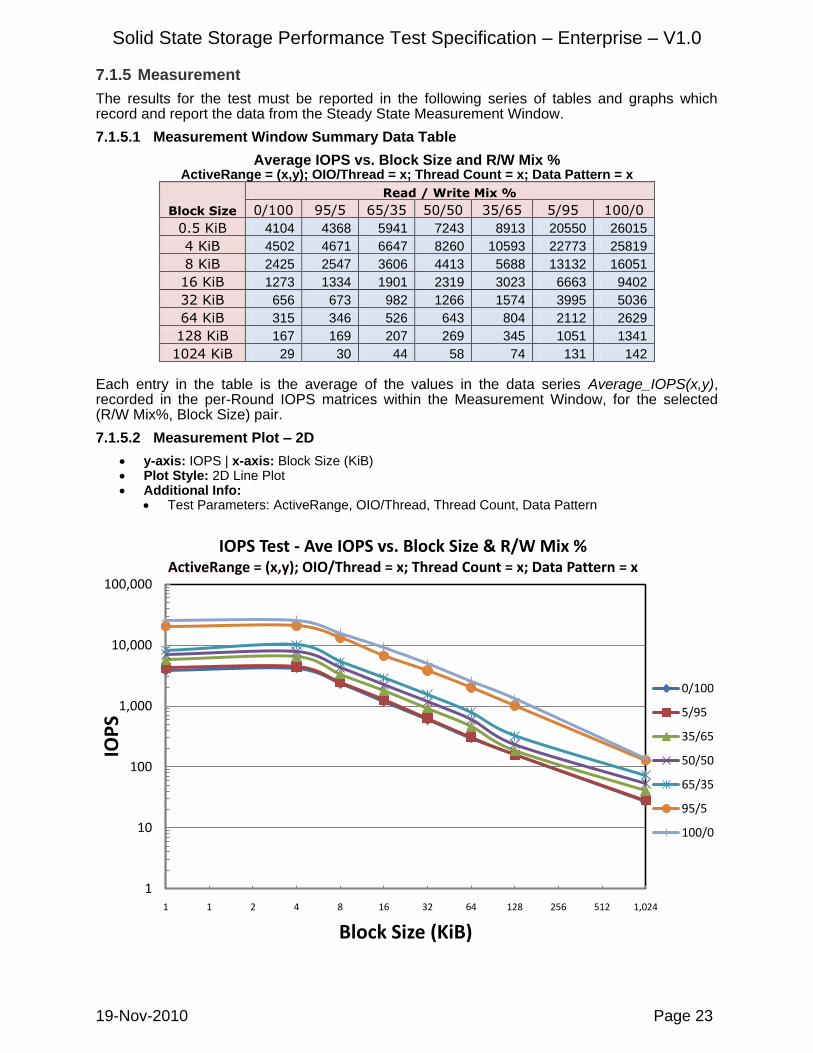
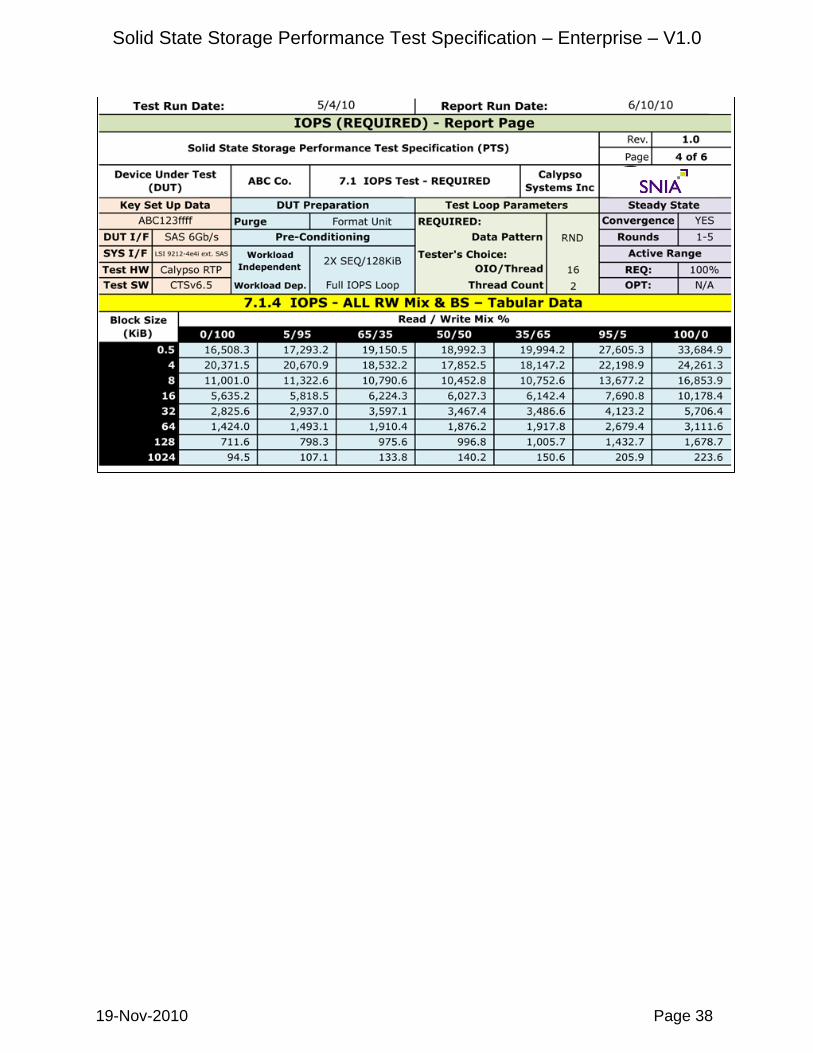
7.1.5 Measurement
The results for the test must be reported in the following series of tables and graphs which record and report the data from the Steady State Measurement Window.
7.1.5.1 Measurement Window Summary Data Table
Average IOPS vs. Block Size and R/W Mix % ActiveRange = (x,y); OIO/Thread = x; Thread Count = x; Data Pattern = x
Block Size
Read / Write Mix %
0/100 95/5 65/35 50/50 35/65 5/95 100/0
0.5 KiB 4104 4368 5941 7243 8913 20550 26015
4 KiB 4502 4671 6647 8260 10593 22773 25819
8 KiB 2425 2547 3606 4413 5688 13132 16051
16 KiB 1273 1334 1901 2319 3023 6663 9402
32 KiB 656 673 982 1266 1574 3995 5036
64 KiB 315 346 526 643 804 2112 2629
128 KiB 167 169 207 269 345 1051 1341
1024 KiB 29 30 44 58 74 131 142 Each entry in the table is the average of the values in the data series Average_IOPS(x,y), recorded in the per-Round IOPS matrices within the Measurement Window, for the selected (R/W Mix%, Block Size) pair.
Test Parameters: ActiveRange, OIO/Thread, Thread Count, Data Pattern
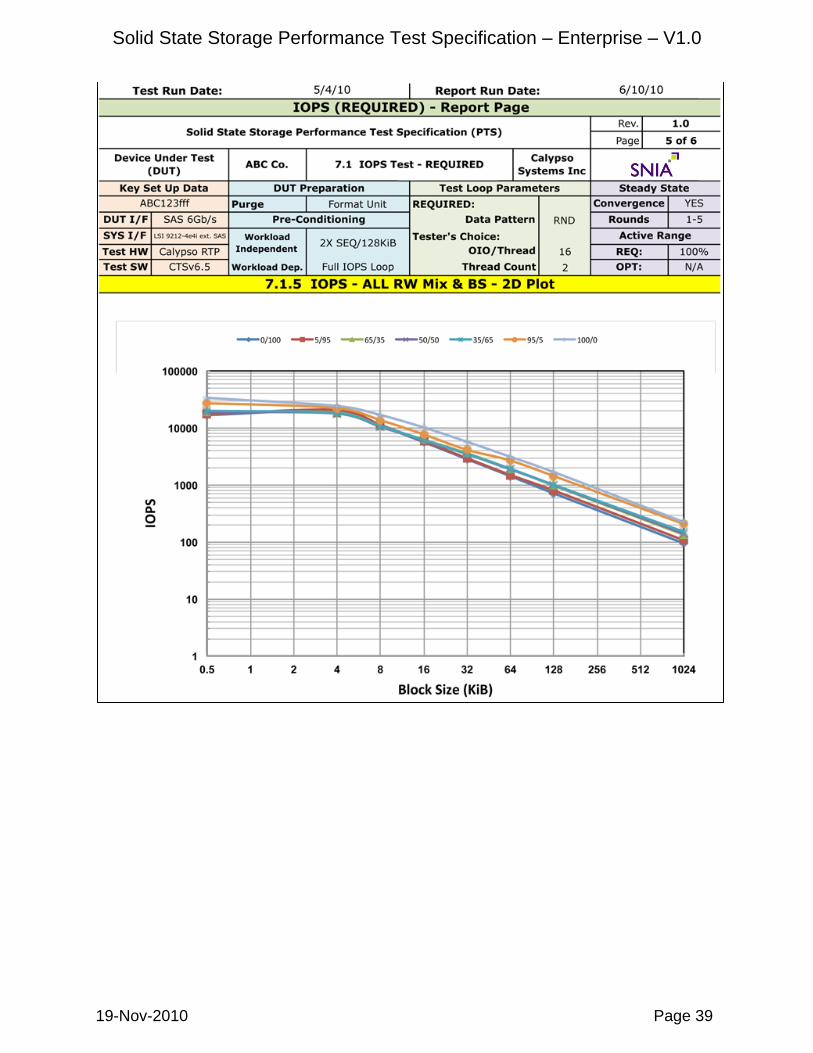
1
10
100
1,000
10,000
100,000
1 1 2 4 8 16 32 64 128 256 512 1,024
IOP
S
Block Size (KiB)
IOPS Test - Ave IOPS vs. Block Size & R/W Mix %ActiveRange = (x,y); OIO/Thread = x; Thread Count = x; Data Pattern = x
0/100
5/95
35/65
50/50
65/35
95/5
100/0
Solid State Storage Performance Test Specification – Enterprise – V1.0
19-Nov-2010 Page 24
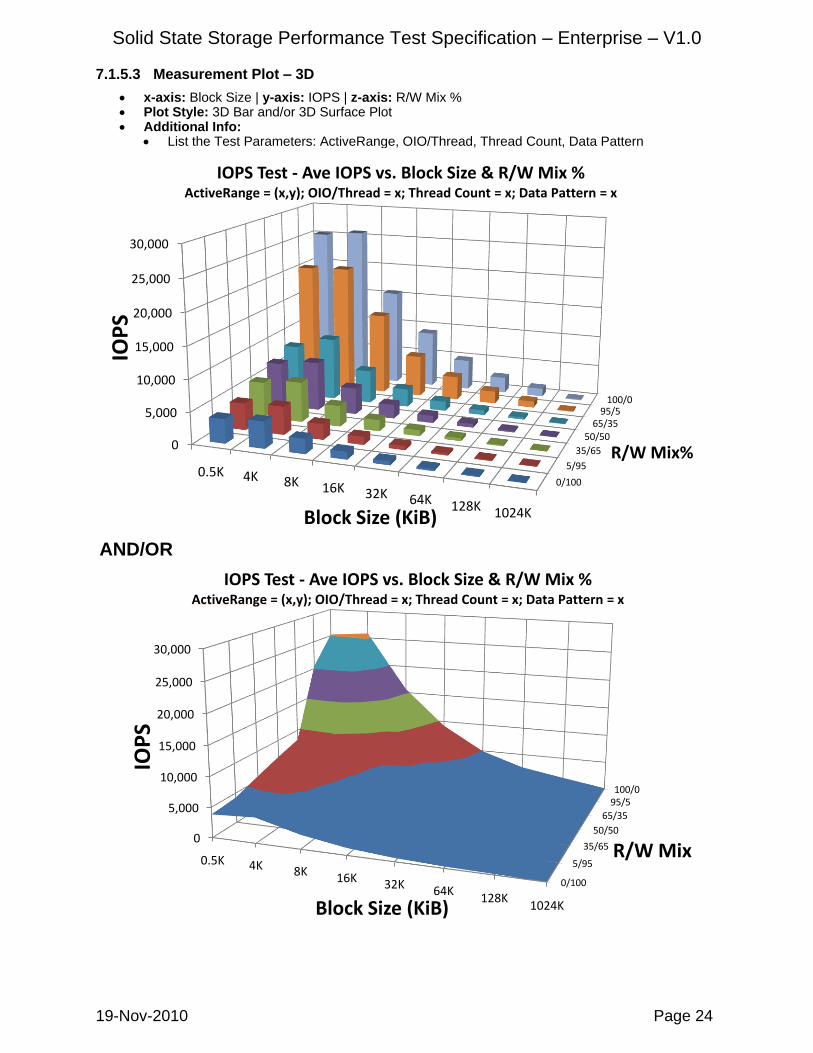
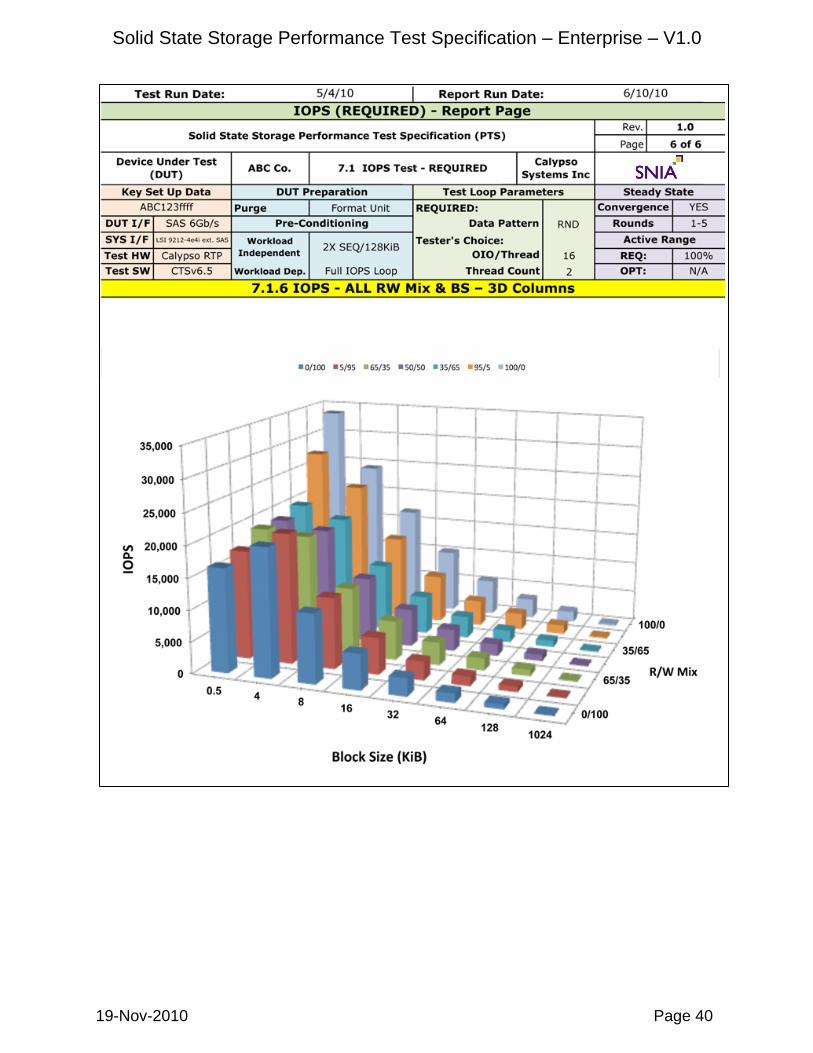
7.1.5.3 Measurement Plot – 3D
x-axis: Block Size | y-axis: IOPS | z-axis: R/W Mix % Plot Style: 3D Bar and/or 3D Surface Plot Additional Info:
List the Test Parameters: ActiveRange, OIO/Thread, Thread Count, Data Pattern
AND/OR
0/100
5/95
35/65
50/5065/35
95/5100/0
0
5,000
10,000
15,000
20,000
25,000
30,000
0.5K 4K 8K 16K 32K 64K 128K 1024K
R/W Mix%
IOP
S
Block Size (KiB)
IOPS Test - Ave IOPS vs. Block Size & R/W Mix %ActiveRange = (x,y); OIO/Thread = x; Thread Count = x; Data Pattern = x
0/100
5/95
35/65
50/50
65/35
95/5100/0
0
5,000
10,000
15,000
20,000
25,000
30,000
0.5K 4K 8K 16K 32K 64K128K
1024K
R/W Mix
IOP
S
Block Size (KiB)
IOPS Test - Ave IOPS vs. Block Size & R/W Mix %ActiveRange = (x,y); OIO/Thread = x; Thread Count = x; Data Pattern = x
Solid State Storage Performance Test Specification – Enterprise – V1.0
19-Nov-2010 Page 25
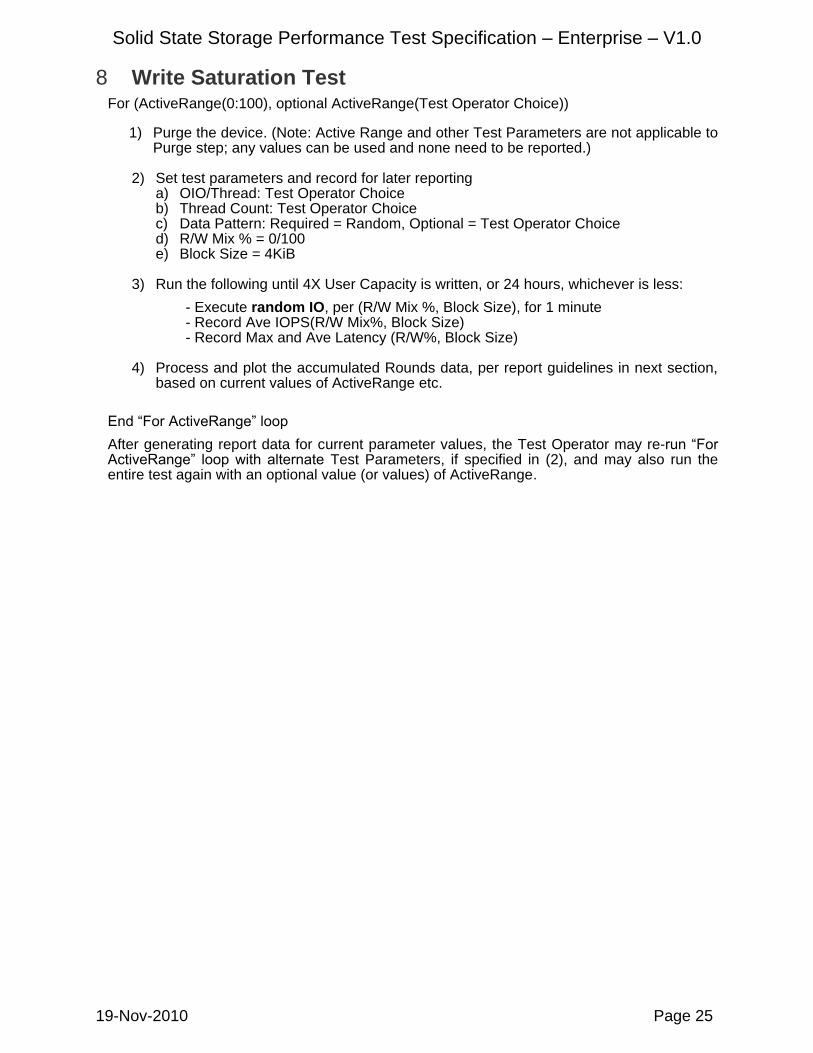
8 Write Saturation Test For (ActiveRange(0:100), optional ActiveRange(Test Operator Choice))
1) Purge the device. (Note: Active Range and other Test Parameters are not applicable to
Purge step; any values can be used and none need to be reported.)
2) Set test parameters and record for later reporting a) OIO/Thread: Test Operator Choice b) Thread Count: Test Operator Choice c) Data Pattern: Required = Random, Optional = Test Operator Choice d) R/W Mix % = 0/100 e) Block Size = 4KiB
3) Run the following until 4X User Capacity is written, or 24 hours, whichever is less:
- Execute random IO, per (R/W Mix %, Block Size), for 1 minute - Record Ave IOPS(R/W Mix%, Block Size) - Record Max and Ave Latency (R/W%, Block Size)
4) Process and plot the accumulated Rounds data, per report guidelines in next section,
based on current values of ActiveRange etc.
End “For ActiveRange” loop
After generating report data for current parameter values, the Test Operator may re-run “For ActiveRange” loop with alternate Test Parameters, if specified in (2), and may also run the entire test again with an optional value (or values) of ActiveRange.
Solid State Storage Performance Test Specification – Enterprise – V1.0
19-Nov-2010 Page 26
8.1 Test Specific Reporting for Write Saturation Test
The following sub-sections list the reporting requirements specific to the Write Saturation test. Reporting requirements common to all tests are documented in Section 5, Common Reporting Requirements. See also Informative Annex A – Sample Test Report.
8.1.1 Purge Report
The Test Operator shall report the method used to run the Purge operation.
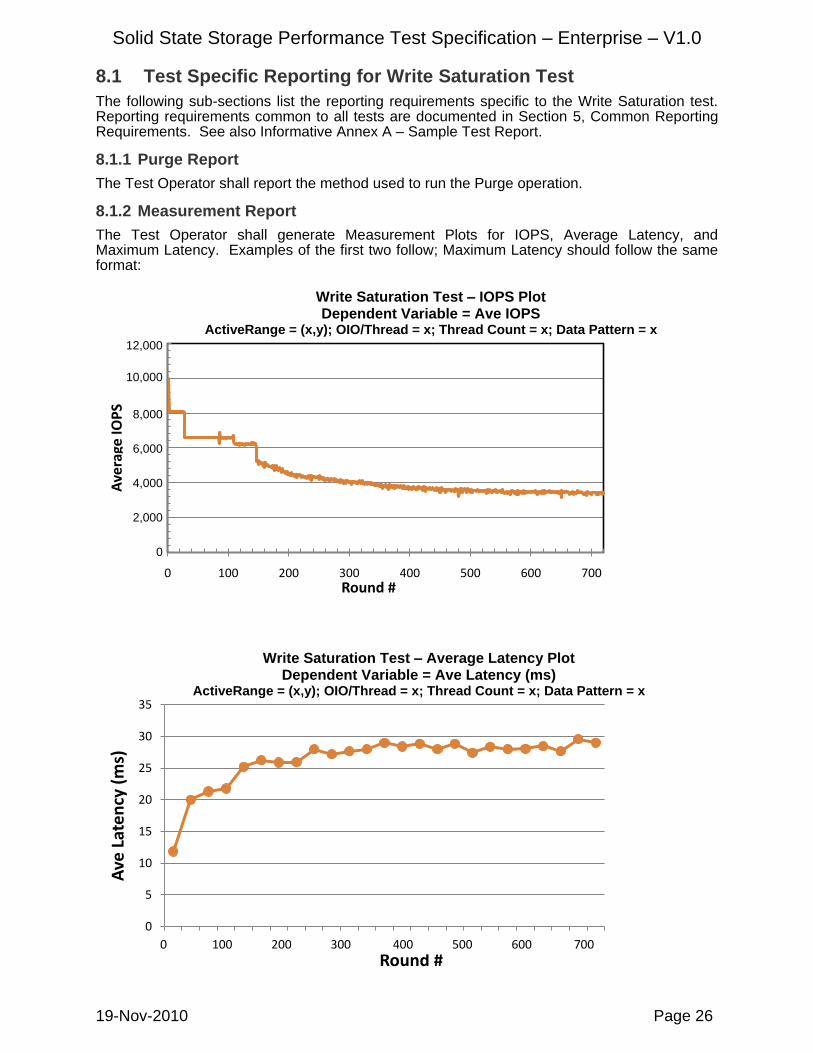
8.1.2 Measurement Report
The Test Operator shall generate Measurement Plots for IOPS, Average Latency, and Maximum Latency. Examples of the first two follow; Maximum Latency should follow the same format:
Solid State Storage Performance Test Specification – Enterprise – V1.0
19-Nov-2010 Page 27
9 Throughput Test
For (ActiveRange(0:100), optional ActiveRange(Test Operator Choice))
For (Block Size = 1024KiB, 64KiB, 8KiB, 4KiB, 0.5KiB)
1) Purge the device. (Note: Active Range and other Test Parameters are not applicable to Purge step; any values can be used and none need to be reported.)
2) Set test parameters and record for later reporting
a) OIO/Thread: Test Operator Choice b) Thread Count: Test Operator Choice c) Data Pattern: Required = Random, Optional = Test Operator Choice
3) Run the following until Steady State is reached, or maximum of 25 Rounds:
For (R/W Mix % = 100/0, 0/100) - Execute sequential IO, per (R/W Mix%, Block Size), for 1 minute - Record Ave MB/s (R/W Mix%, Block Size)
Use Ave MB/s(RW Mix%, Block Size) to detect Steady State. If Steady State is not reached by Round x<=25, then the Test Operator shall either continue running the test until Steady State is reached, or may stop the test at Round x. The Measurement Window is defined as Round x-4 to Round x.
End (For Block Size) loop
Process and plot the accumulated Rounds data, per report guidelines in next section, based on current values of ActiveRange etc. The accumulated Rounds data at the end of the (For Block Size) loop will consist of x matrices, one for each Block Size. Each table entry is Ave MB/s(R/W Mix%, Block Size) recorded for the 1 minute duration of Round x:
Note: The Test Operator may structure the intermediate matrices differently, per Test Operator convenience and data gathering methods.
End (For ActiveRange) loop
After generating report data for current parameter values, the Test Operator may re-run “For ActiveRange” loop with alternate Test Parameters, if specified in (2), and may also run the entire test again with an optional value (or values) of ActiveRange.
Note: It is important to adhere to the nesting of the loops. For each Block Size, the entire [purge | precondition | set parameters | run test] loop is executed. This was done to avoid creating unwanted performance interactions by interspersing block sizes, which would not happen during an actual Sequential IO sequence.
Solid State Storage Performance Test Specification – Enterprise – V1.0
19-Nov-2010 Page 28
9.1 Test Specific Reporting for Throughput Test
The following sub-sections list the reporting requirements specific to the Throughput test. Reporting requirements common to all tests are documented in Section 5, Common Reporting Requirements. See also Informative Annex A – Sample Test Report.
If Steady State was reached at Round x, the Test Operator shall: Plot rounds 1:x per “Throughput Steady State Convergence Plot”; Plot Rounds x-4:x per “Throughput Steady State Verification Plot”; and Plot Rounds x-4:x per “Throughput Measurement Plot.”
If Steady State was not reached then the Test Operator may report results per above, picking the last Round run as Round x. In the case where Steady State was not reached, the Test Operator must state this fact in the final report.
9.1.1 Purge Report
The Test Operator shall report the method used to run the Purge operation.
9.1.2 Workload Independent Preconditioning Report
The Test Operator shall report the following regarding the Workload Independent Preconditioning step: 1) ActiveRange; 2) OIO/Thread; 3) Thread Count; and 4: Data Pattern
9.1.3 Steady State Convergence Report
The Test Operator shall generate Write and Read Steady State Convergence plots, as follows:
Data Set to Plot: Ave MB/s (R/W Mix% = 0/100 AND 100/0, All Block Sizes), per Round Additional Info on Plot:
Designation of calculated Measurement Window Test Parameters: ActiveRange, OIO/Thread, Thread Count, Data Pattern
Solid State Storage Performance Test Specification – Enterprise – V1.0
19-Nov-2010 Page 29
9.1.4 Steady State Verification Report
The Test Operator shall document the following for Steady State Verification, using Ave 1024KiB Sequential Write MB/s as the dependent variable:
Throughput Test - Steady State Verification Dependent Variable = Ave 1024KiB Sequential Write MB/s
ActiveRange = (x,y); OIO/Thread = x; Thread Count = x; Data Pattern = x
Measurement Window: Start __; End __
Ave. value in Measurement Window: __
Calculated allowed range in Measurement Window (+-10% of Ave.): Max__; Min __
Measured range in Measurement Window: Max __; Min __ (pass/fail)
Slope of best linear fit in Measurement Window (must be <= 10%): __% (pass/fail)
Correlation coefficient for best linear fit: __
Note: The Test Operator may optionally include a plot showing Steady State verification. See Figure 7-1 - Steady State Verification Example Plot.
9.1.5 Measurement Window Report
The results for the test must be reported in the following series of tables and graphs which record and report the data from the Steady State Measurement Window.
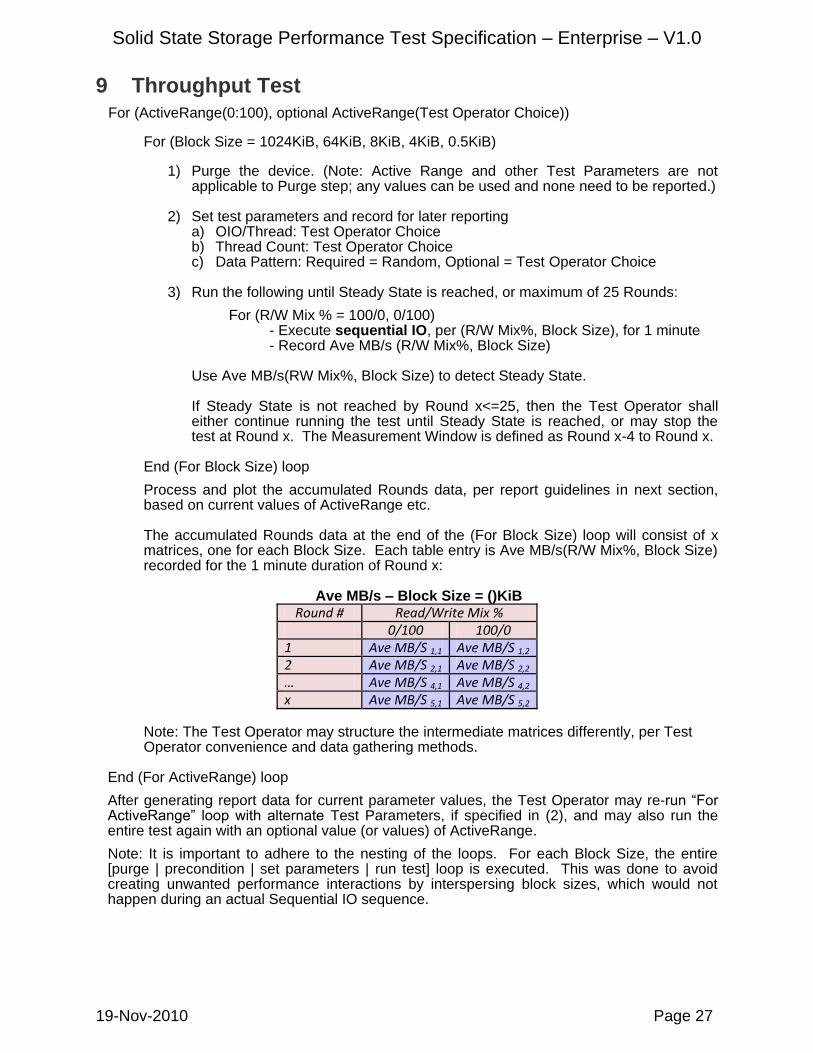
9.1.5.1 Measurement Window Summary Data Table
Average MB/s vs. Block Size and R/W Mix % ActiveRange = (x,y); OIO/Thread = x; Thread Count = x; Data Pattern = x
Each entry in the table is the average of the values in the data series Average_MB/s(x,y), recorded in the per-Round MB/s matrices within the Measurement Window, for the selected (R/W Mix%, Block Size) pair. There are no required Measurement Plots for the Throughput test.
Solid State Storage Performance Test Specification – Enterprise – V1.0
19-Nov-2010 Page 30
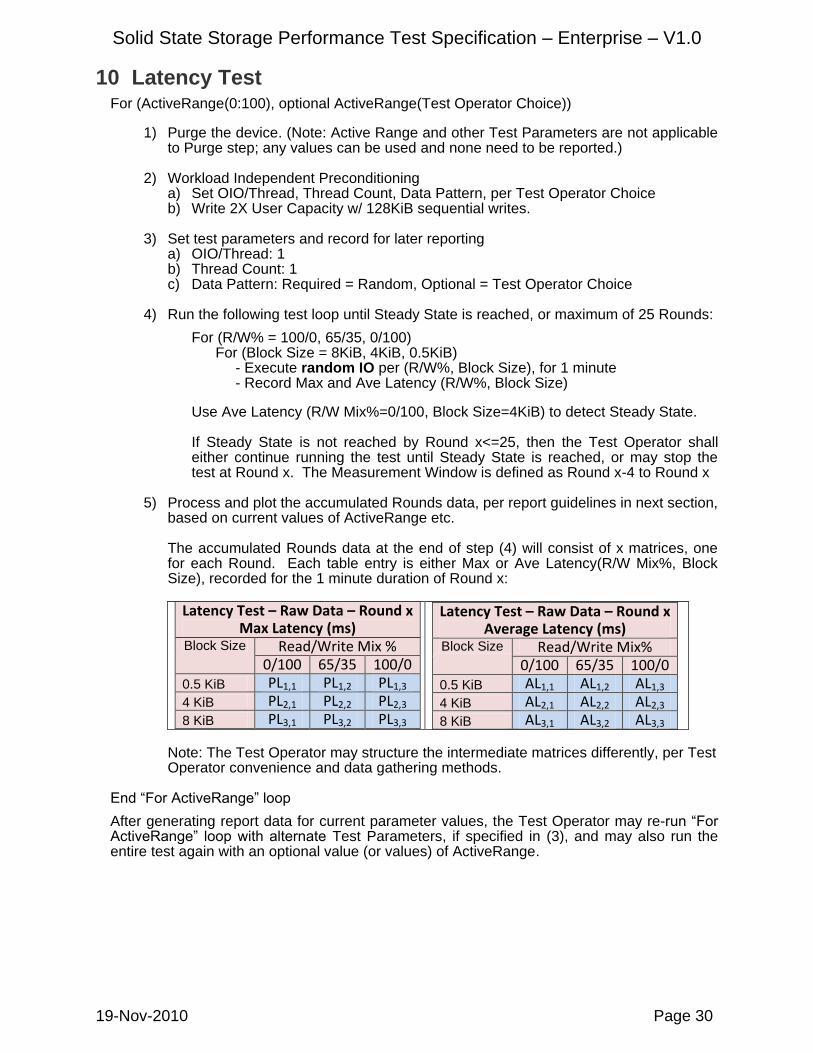
10 Latency Test For (ActiveRange(0:100), optional ActiveRange(Test Operator Choice))
1) Purge the device. (Note: Active Range and other Test Parameters are not applicable
to Purge step; any values can be used and none need to be reported.) 2) Workload Independent Preconditioning
a) Set OIO/Thread, Thread Count, Data Pattern, per Test Operator Choice b) Write 2X User Capacity w/ 128KiB sequential writes.
3) Set test parameters and record for later reporting
a) OIO/Thread: 1 b) Thread Count: 1 c) Data Pattern: Required = Random, Optional = Test Operator Choice
4) Run the following test loop until Steady State is reached, or maximum of 25 Rounds:
For (R/W% = 100/0, 65/35, 0/100) For (Block Size = 8KiB, 4KiB, 0.5KiB)
- Execute random IO per (R/W%, Block Size), for 1 minute - Record Max and Ave Latency (R/W%, Block Size)
Use Ave Latency (R/W Mix%=0/100, Block Size=4KiB) to detect Steady State. If Steady State is not reached by Round x<=25, then the Test Operator shall either continue running the test until Steady State is reached, or may stop the test at Round x. The Measurement Window is defined as Round x-4 to Round x
5) Process and plot the accumulated Rounds data, per report guidelines in next section, based on current values of ActiveRange etc. The accumulated Rounds data at the end of step (4) will consist of x matrices, one for each Round. Each table entry is either Max or Ave Latency(R/W Mix%, Block Size), recorded for the 1 minute duration of Round x:
Latency Test – Raw Data – Round x Max Latency (ms)
Note: The Test Operator may structure the intermediate matrices differently, per Test Operator convenience and data gathering methods.
End “For ActiveRange” loop
After generating report data for current parameter values, the Test Operator may re-run “For ActiveRange” loop with alternate Test Parameters, if specified in (3), and may also run the entire test again with an optional value (or values) of ActiveRange.
Solid State Storage Performance Test Specification – Enterprise – V1.0
19-Nov-2010 Page 31
10.1 Test Specific Reporting for Latency Test
The following sub-sections list the reporting requirements specific to the Latency test. Reporting requirements common to all tests are documented in Section 5, Common Reporting Requirements. See also Informative Annex A – Sample Test Report. If Steady State was reached at Round x, the Test Operator shall:
Plot rounds 1:x per “Latency Test Steady State Convergence Plot”; Plot Rounds x-4:x per “Latency Test Throughput Steady State Verification Plot”; and Plot Rounds x-4:x per “Latency Test Measurement Plot.”
If Steady State was not reached then the Test Operator may report results per above, picking the last Round run as Round x. In the case where Steady State was not reached, the Test Operator must state this fact in the final report.
10.1.1 Purge
The Test Operator shall report the method used to run the Purge operation.
10.1.2 Workload Independent Preconditioning
The Test Operator shall report the following regarding the Workload Independent Preconditioning step: 1) ActiveRange; 2) OIO/Thread; 3) Thread Count; and 4: Data Pattern
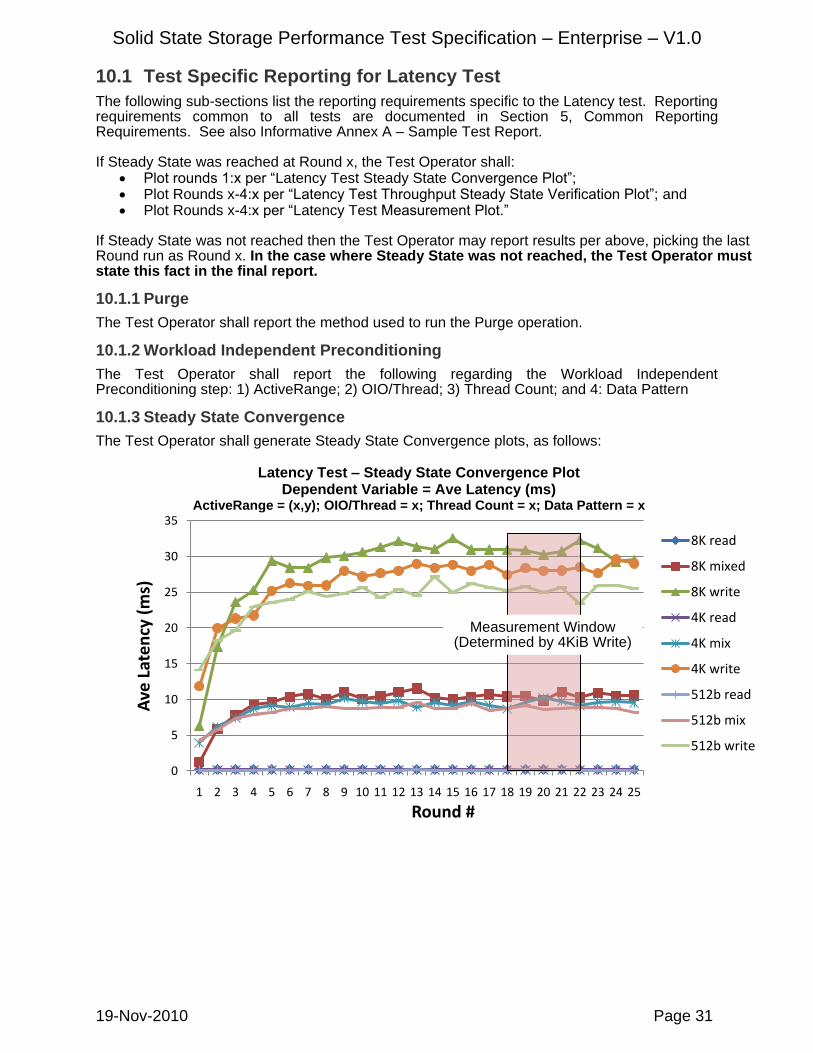
10.1.3 Steady State Convergence
The Test Operator shall generate Steady State Convergence plots, as follows:
Latency Test – Steady State Convergence Plot Dependent Variable = Ave Latency (ms)
ActiveRange = (x,y); OIO/Thread = x; Thread Count = x; Data Pattern = x
Solid State Storage Performance Test Specification – Enterprise – V1.0
19-Nov-2010 Page 32
10.1.4 Steady State Verification Report
The Test Operator shall document the following for Steady State Verification, using Ave 4KiB Random Write Latency (ms) as the dependent variable:
Latency Test - Steady State Verification Dependent Variable = Ave 4KiB Random Write Latency (ms)
ActiveRange = (x,y); OIO/Thread = x; Thread Count = x; Data Pattern = x
Measurement Window: Start __; End __ Ave. value in Measurement Window: __ Calculated allowed range in Measurement Window (+-10% of Ave.): Max__; Min __ Measured range in Measurement Window: Max __; Min __ (pass/fail) Slope of best linear fit in Measurement Window (must be <= 10%): __% (pass/fail) Correlation coefficient for best linear fit: __
Note: The Test Operator may optionally include a plot showing Steady State verification. See Figure 7-1 - Steady State Verification Example Plot.
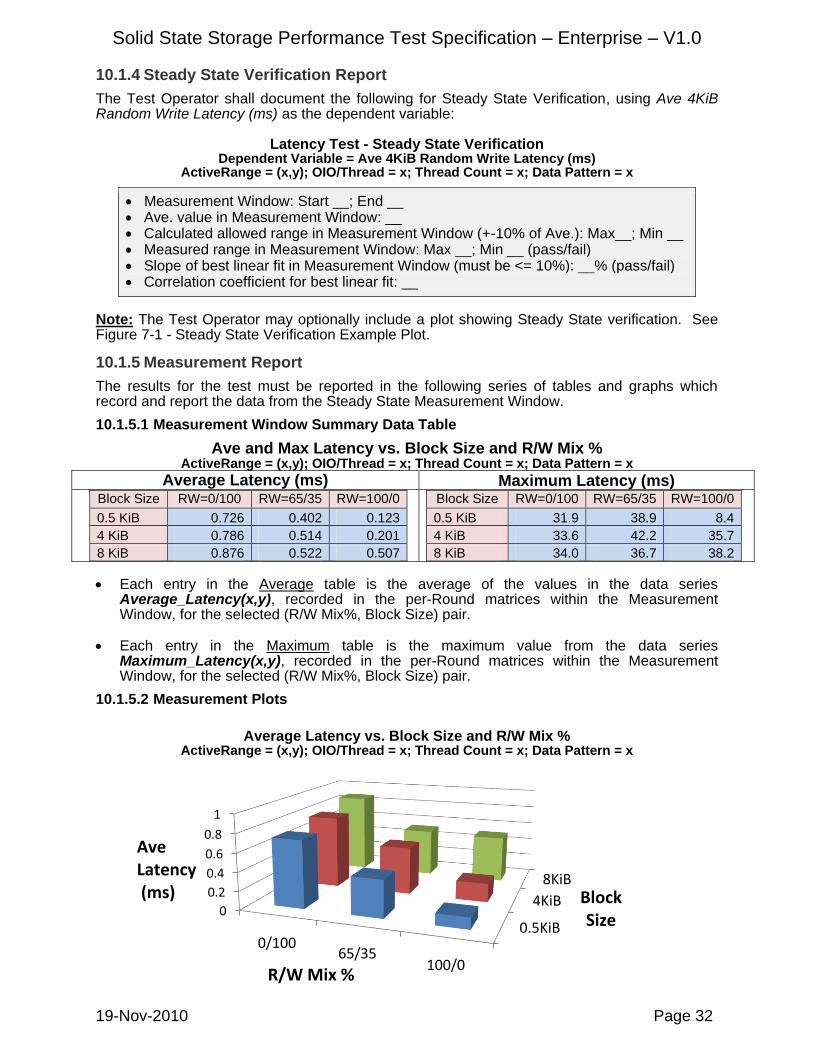
10.1.5 Measurement Report
The results for the test must be reported in the following series of tables and graphs which record and report the data from the Steady State Measurement Window.
10.1.5.1 Measurement Window Summary Data Table
Ave and Max Latency vs. Block Size and R/W Mix % ActiveRange = (x,y); OIO/Thread = x; Thread Count = x; Data Pattern = x
Average Latency (ms) Maximum Latency (ms) Block Size RW=0/100 RW=65/35 RW=100/0
0.5 KiB 0.726 0.402 0.123
4 KiB 0.786 0.514 0.201
8 KiB 0.876 0.522 0.507
Block Size RW=0/100 RW=65/35 RW=100/0
0.5 KiB 31.9 38.9 8.4
4 KiB 33.6 42.2 35.7
8 KiB 34.0 36.7 38.2
Each entry in the Average table is the average of the values in the data series Average_Latency(x,y), recorded in the per-Round matrices within the Measurement Window, for the selected (R/W Mix%, Block Size) pair.
Each entry in the Maximum table is the maximum value from the data series Maximum_Latency(x,y), recorded in the per-Round matrices within the Measurement Window, for the selected (R/W Mix%, Block Size) pair.
10.1.5.2 Measurement Plots
Average Latency vs. Block Size and R/W Mix %
ActiveRange = (x,y); OIO/Thread = x; Thread Count = x; Data Pattern = x
0.5KiB
4KiB
8KiB
0
0.2
0.4
0.6
0.8
1
0/10065/35
100/0
BlockSize
R/W Mix %
Ave Latency(ms)
Solid State Storage Performance Test Specification – Enterprise – V1.0
19-Nov-2010 Page 33
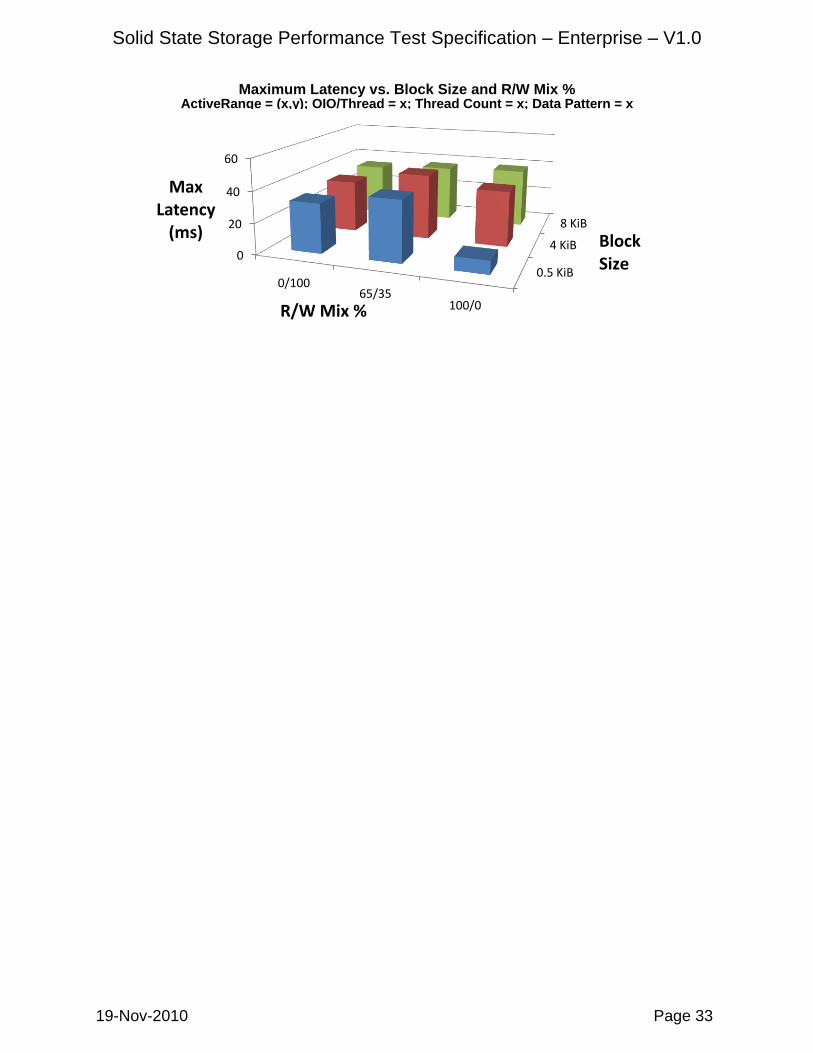
Maximum Latency vs. Block Size and R/W Mix %
ActiveRange = (x,y); OIO/Thread = x; Thread Count = x; Data Pattern = x
0.5 KiB
4 KiB
8 KiB
0
20
40
60
0/10065/35
100/0
MaxLatency
(ms)
R/W Mix %
BlockSize
Solid State Storage Performance Test Specification – Enterprise – V1.0
19-Nov-2010 Page 34
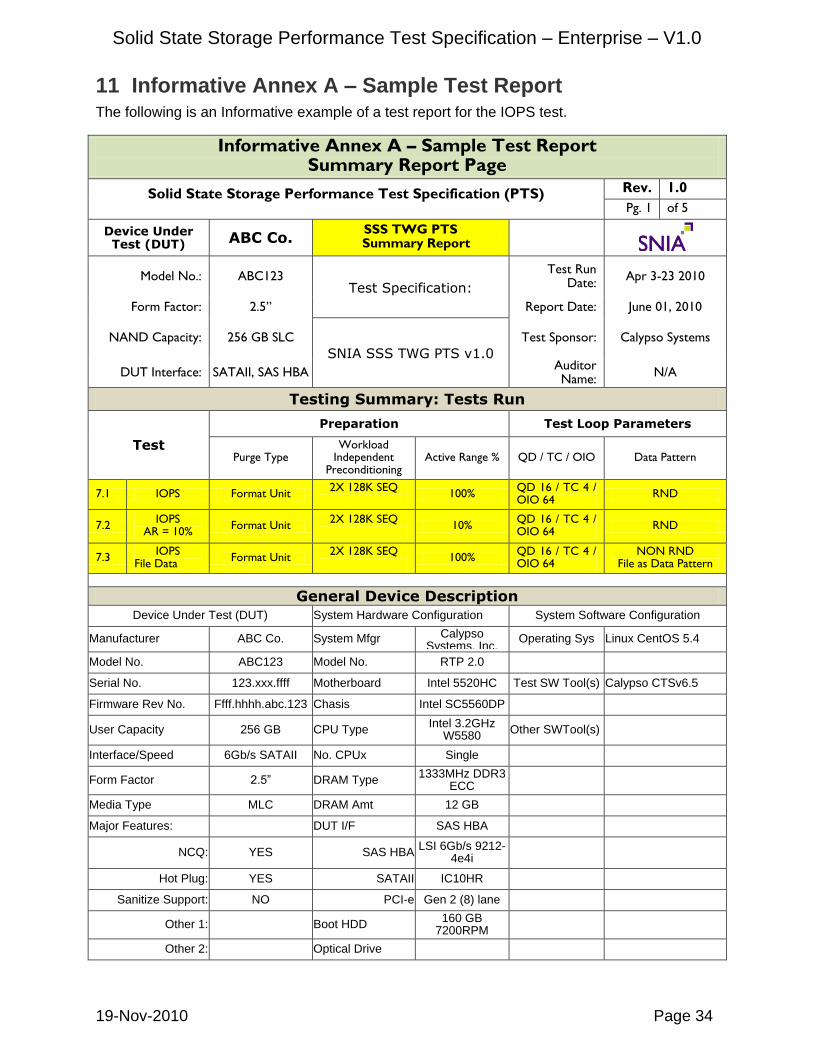
11 Informative Annex A – Sample Test Report The following is an Informative example of a test report for the IOPS test.
Informative Annex A – Sample Test Report Summary Report Page
Solid State Storage Performance Test Specification (PTS) Rev. 1.0
Pg. 1 of 5
Device Under Test (DUT)
ABC Co. SSS TWG PTS
Summary Report
Model No.: ABC123 Test Specification:
Test Run Date:
Apr 3-23 2010
Form Factor: 2.5” Report Date: June 01, 2010
NAND Capacity: 256 GB SLC
SNIA SSS TWG PTS v1.0
Test Sponsor: Calypso Systems
DUT Interface: SATAII, SAS HBA Auditor Name:
N/A
Testing Summary: Tests Run
Test
Preparation Test Loop Parameters
Purge Type Workload
Independent Preconditioning
Active Range % QD / TC / OIO Data Pattern
7.1 IOPS Format Unit 2X 128K SEQ
100%
QD 16 / TC 4 / OIO 64
RND
7.2 IOPS
AR = 10% Format Unit
2X 128K SEQ
10% QD 16 / TC 4 / OIO 64
RND
7.3 IOPS
File Data Format Unit
2X 128K SEQ
100% QD 16 / TC 4 / OIO 64
NON RND File as Data Pattern
General Device Description
Device Under Test (DUT) System Hardware Configuration System Software Configuration
Manufacturer ABC Co. System Mfgr Calypso Systems, Inc.
Operating Sys Linux CentOS 5.4
Model No. ABC123 Model No. RTP 2.0
Serial No. 123.xxx.ffff Motherboard Intel 5520HC Test SW Tool(s) Calypso CTSv6.5
Solid State Storage Performance Test Specification – Enterprise – V1.0
19-Nov-2010 Page 36
Solid State Storage Performance Test Specification – Enterprise – V1.0
19-Nov-2010 Page 37
Steady State Determination Data
Solid State Storage Performance Test Specification – Enterprise – V1.0
19-Nov-2010 Page 38
Solid State Storage Performance Test Specification – Enterprise – V1.0
19-Nov-2010 Page 39
Solid State Storage Performance Test Specification – Enterprise – V1.0
19-Nov-2010 Page 40
Solid State Storage Performance Test Specification – Enterprise – V1.0
19-Nov-2010 Page 41
12 Informative Annex B – Performance Test Platform Example
This annex describes the hardware/software Reference Test Platform (RTP) that was used by the SSS TWG to do the bulk of the research and validation of the SSS PTS.
The RTP is not required to run the SSS PTS tests; it is an example of a platform that was used to run the PTS.
In addition to the RTP, several other hardware/software platforms and software tools were used in the development and refinement of the PTS, such as IOmeter, Vdbench and several in-house stimulus generators running on several versions of the Windows and Linux O/S.
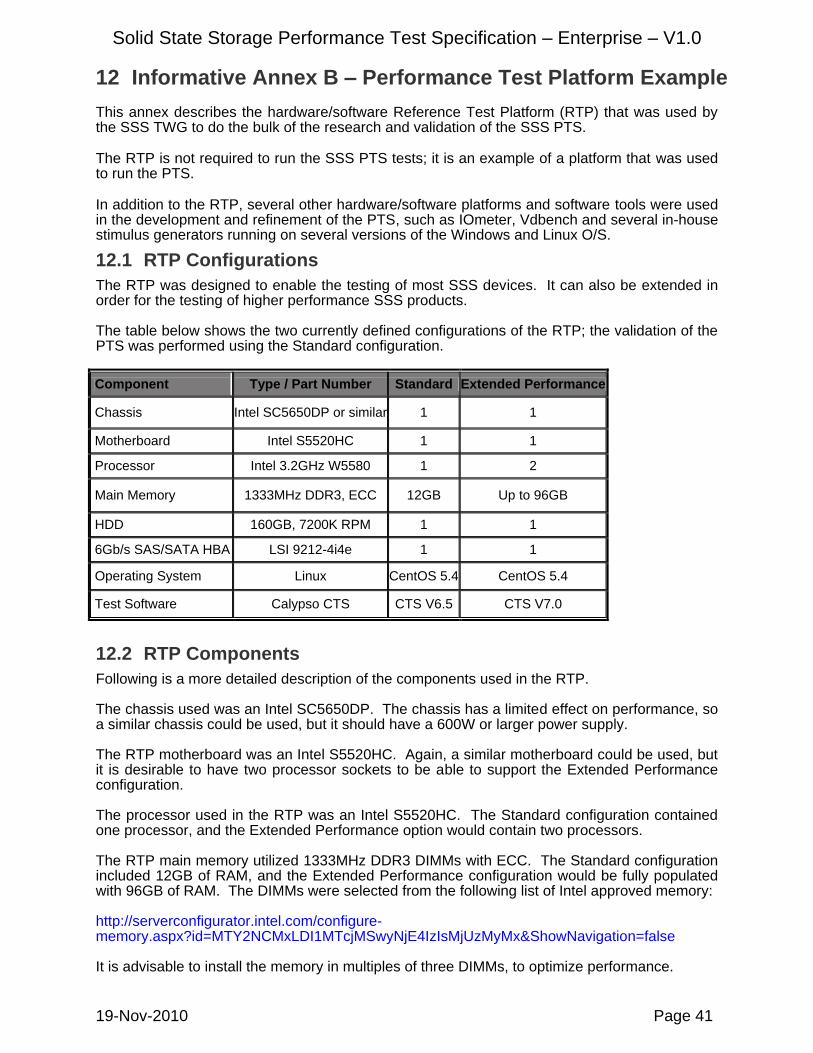
12.1 RTP Configurations
The RTP was designed to enable the testing of most SSS devices. It can also be extended in order for the testing of higher performance SSS products. The table below shows the two currently defined configurations of the RTP; the validation of the PTS was performed using the Standard configuration.
Component Type / Part Number Standard Extended Performance
Chassis Intel SC5650DP or similar 1 1
Motherboard Intel S5520HC 1 1
Processor Intel 3.2GHz W5580 1 2
Main Memory 1333MHz DDR3, ECC 12GB Up to 96GB
HDD 160GB, 7200K RPM 1 1
6Gb/s SAS/SATA HBA LSI 9212-4i4e 1 1
Operating System Linux CentOS 5.4 CentOS 5.4
Test Software Calypso CTS CTS V6.5 CTS V7.0
12.2 RTP Components
Following is a more detailed description of the components used in the RTP. The chassis used was an Intel SC5650DP. The chassis has a limited effect on performance, so a similar chassis could be used, but it should have a 600W or larger power supply. The RTP motherboard was an Intel S5520HC. Again, a similar motherboard could be used, but it is desirable to have two processor sockets to be able to support the Extended Performance configuration. The processor used in the RTP was an Intel S5520HC. The Standard configuration contained one processor, and the Extended Performance option would contain two processors. The RTP main memory utilized 1333MHz DDR3 DIMMs with ECC. The Standard configuration included 12GB of RAM, and the Extended Performance configuration would be fully populated with 96GB of RAM. The DIMMs were selected from the following list of Intel approved memory: http://serverconfigurator.intel.com/configure-memory.aspx?id=MTY2NCMxLDI1MTcjMSwyNjE4IzIsMjUzMyMx&ShowNavigation=false It is advisable to install the memory in multiples of three DIMMs, to optimize performance.
Solid State Storage Performance Test Specification – Enterprise – V1.0
19-Nov-2010 Page 42
The HDD used in the RTP was 160 GB, 7200K RPM, with a SATA interface. It is not clear what impact the HDD has on performance testing, so the highest performance SATA drive that is widely available was selected. The RTP used a LSI 9212-4i4e Host Bus Adaptor containing the IT firmware set. Other sufficiently high performance HBAs are available, but were not tested. The RTP hardware platform had a dedicated power supply for all test DUT bays separate from the main power supply. RTP utilized CTS test software made by Calypso Systems, Inc. www.calypsotesters.com
CTSv6.5 is the Standard version.
CTSv7.0 is the Extended version.
The Calypso software requires the CentOS 5.4 Linux OS.


![TEE Sockets API Specification v1.0 - GlobalPlatform · TEE Sockets API Specification Annex A: TCP/IP Specification of TEE Sockets API Specification [Sockets TCP/IP] GPD_SPE_102 :](https://static.documents.pub/doc/80x56/60421070f2b21560856dea9a/tee-sockets-api-specification-v10-globalplatform-tee-sockets-api-specification.jpg)

![TECHNICAL SPECIFICATION FINAL DRAFT ...[EN ISO 9000:2000] [9] 3.9 specification of solid recovered fuels specification for the properties characterising a solid recovered fuel NOTE](https://static.documents.pub/doc/80x56/61258c39a5b1664f46600aa0/technical-specification-final-draft-en-iso-90002000-9-39-specification.jpg)


