Solutions to Worksheet on Hypothesis Tests 1. A production line produces rulers that are supposed to be 12 inches long. A sample of 49 of the rulers had a mean of 12.1 and a standard deviation of .5 inches. The quality control specialist responsible for the production line decides to do a hypothesis test at the 90 percent significance level to determine whether the production line is really producing rulers that are 12 inches long or not. a. What is the null hypothesis? Solution: H 0 : 12 b. What is the alternative hypothesis? Solution: H 1 : 12 c. What is the value of the test statistic? Solution: z x 0 s n 12.1 12 .5 49 1.4 d. What is the rejection region (with its numerical value)? Solution: z z 2 z .05 1.645 e. What conclusion do you draw? Solution: Do not reject H 0 since | 1.4| is not greater than 1.645. f. What does this mean in terms of the problem situation? Solution: We cannot conclude that the mean length of the population of rulers from the production line is not equal to 12. We should continue with our working assumption that it is equal to 12. 2. A sample of 20 OU freshmen had a mean GPA of 2.8 over all their courses taken in their first semester at OU. This had a variance of .25. Perform a hypothesis test at the 95 percent level to determine if the first semester GPA of all OU freshmen is less than a B (3.0). a. What is the null hypothesis? Solution: H 0 : 3.0 b. What is the alternative hypothesis? Solution: H 1 : 3.0 (one-sided test, "less than" c. What is the value of the test statistic? Solution: t x 0 s n 2.8 3.0 .5 20 1.79 (small sample) d. What is the rejection region (with its numerical value)? Solution: t t n 1, t 19,.05 1.729
Transcript
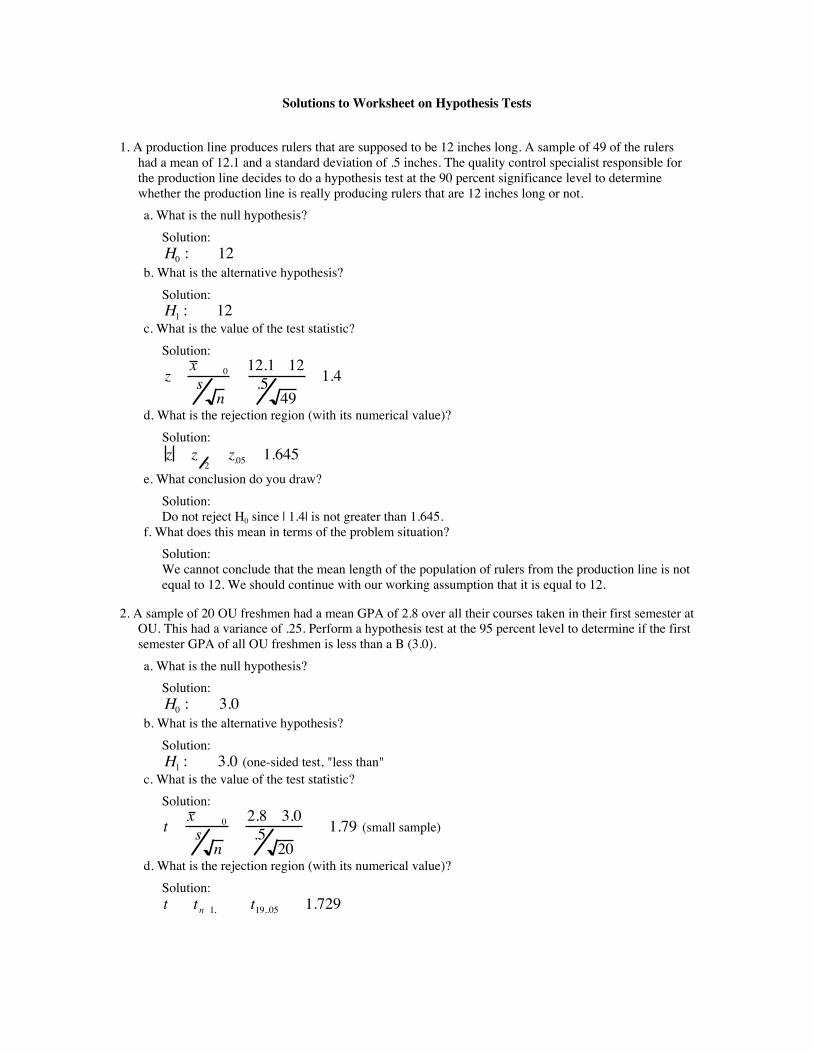
Solutions to Worksheet on Hypothesis Tests
1. A production line produces rulers that are supposed to be 12 inches long. A sample of 49 of the rulershad a mean of 12.1 and a standard deviation of .5 inches. The quality control specialist responsible forthe production line decides to do a hypothesis test at the 90 percent significance level to determinewhether the production line is really producing rulers that are 12 inches long or not.a. What is the null hypothesis?
Solution:H0 : µ = 12
b. What is the alternative hypothesis?Solution:H1 : µ ≠ 12
c. What is the value of the test statistic?Solution:
z =x − µ0s
n=
12.1 − 12.5
49= 1.4
d. What is the rejection region (with its numerical value)?Solution:z > zα 2
= z.05 = 1.645e. What conclusion do you draw?
Solution:Do not reject H0 since | 1.4| is not greater than 1.645.
f. What does this mean in terms of the problem situation?Solution:We cannot conclude that the mean length of the population of rulers from the production line is notequal to 12. We should continue with our working assumption that it is equal to 12.
2. A sample of 20 OU freshmen had a mean GPA of 2.8 over all their courses taken in their first semester atOU. This had a variance of .25. Perform a hypothesis test at the 95 percent level to determine if the firstsemester GPA of all OU freshmen is less than a B (3.0).a. What is the null hypothesis?
Solution:H0 : µ = 3.0
b. What is the alternative hypothesis?Solution:H1 : µ < 3.0 (one-sided test, "less than"
c. What is the value of the test statistic?Solution:
t =x − µ 0s
n=
2.8 − 3.0.5
20≈ −1.79 (small sample)
d. What is the rejection region (with its numerical value)?Solution:t < −t n−1,α = −t19,.05 = −1.729
e. What conclusion do you draw?Solution:Reject H0 since -1.79 < -1.729.
f. What does this mean in terms of the problem situation?Solution:We must reject our working hypothesis that the mean GPA is 3.0 or more and conclude that it isless than 3.0.
3. A researcher decides to look at the variance of the production line in Problem 1 She decides to do ahypothesis test at the 90 percent significance level to determine if the variance is actually less than .25.a. What is the null hypothesis?
Solution:H0 : σ 2 = .25
b. What is the alternative hypothesis?Solution:H1 : σ 2 < .25
c. What is the value of the test statistic?Solution:
χ 2 =n − 1( )s2
σ02 =
49 − 1( ) .5( )2
.25= 48
d. What is the rejection region (with its numerical value)?Solution:χ 2 < χ n−1,1 −α
2 = χ 48,.902 ≈ 29.050
e. What conclusion do you draw?Solution:We cannot reject H0 since 48 is not less than 29.05
f. What does this mean in terms of the problem situation?Solution:We must continue with our working assumption that the true variance is .25 or more and cannotassume that it is less than .25.
4. A math teacher for Math 4753 wants to determine if a new book proposed for the course is better thanthe old book that was used before. The math teacher decides that the two classes might have differentmath ability coming into the course. He gives a test at the beginning of the semester to measure themath ability the students have when they come into the course. He uses this test to create a matched pairdesign for 30 students from each class. The scores he gets are as follows:
Perform a hypothesis test at the 95 percent level for the matched pairs design in Problem 8 to see if thescores for the new book are higher than those for the old book.a. What is the null hypothesis?
Solution:H0 : µ D = µ1 −µ 2 = 0 ( µ1 is the mean for the new book)
b. What is the alternative hypothesis?Solution:H1 : µ D = µ1 −µ 2> 0
c. What is the value of the test statistic?Solution:First we need to find the differences, their mean and their variance:
Student Pair New Book Class Old Book Class Differences1 96 97 -12 95 94 13 94 94 04 92 95 -35 92 90 26 90 91 -17 90 90 08 89 85 49 88 87 1
The value of the test statistic is then t =d − δ 0sd
n=
−.2 − 016.1724
30≈
−.2.7342
≈ −0.273
d. What is the rejection region (with its numerical value)?Solution:t > tn −1,α = t29,.05 = 1.699
e. What conclusion do you draw?Solution:We cannot reject H0 since -0.273 is not greater than 1.699.
f. What does this mean in terms of the problem situation?Solution:We must continue to use the working assumption that the means are not different and cannotconclude that the means for the new book are higher than for the old book.
5. Five engineering students and 5 computer science students are arranged in a matched pair design on thebasis of their GPA prior to the last semester of their senior year. Their GPAs for their last semester areas follows:
Pair Number Engineering Major CS Major1 3.89 3752 3.61 3.873 2.80 3.024 2.75 2.925 3.41 1.28
Perform a 90 percent hypothesis test to determine whether the means for CS majors are less than themeans for Engineering majors.a. What is the null hypothesis?
Solution:H0 : µ D = µ1 −µ 2 = 0 (This is Engineers minus CS majors)
b. What is the alternative hypothesis?Solution:H1 : µ D = µ1 −µ 2> 0 (Since this is Engineering majors minus CS majors and we are interestedin whether the means for CS majors are less, we can answer the question by seeing if theEngineering majors are more and that's what we are doing since we have already found thedifferences as Engineering majors minus CS majors and not the other way around.)
c. What is the value of the test statistic?Solution:First we need to find the differences, their mean and their variance:
d. What is the rejection region (with its numerical value)?Solution:t > tn −1,α = t4, .1 = 1.533
e. What conclusion do you draw?Solution:We cannot reject H0 since .709 is not greater than 1.533.
f. What does this mean in terms of the problem situation?Solution:We must continue to assume that there is no difference between the grades for the two majors andcannot conclude that CS majors have lower grades.
6. The teacher in Problem 5 is still not sure about the differences in Problem 5 between CS and Engineeringmajors. He takes independent samples of size 10 from each major at random. He does not use theirprevious GPA to make matched pairs. The 10 Engineering majors have a mean last-semester GPA of2.89 with a variance of .5. The 10 CS majors have a mean last semester GPA of 2.66 with a variance of.3. He decides to do a hypothesis test to see if the GPAs are different for the two populations. He doesthe test at the 90 percent level.a. What is the null hypothesis?
Solution:H0 : µ1 − µ 2= 0
b. What is the alternative hypothesis?Solution:H1 : µ1 − µ 2≠ 0
c. What is the value of the test statistic?Solution:
t =x − y − δ 0
s 1n1
+1n2
=2.89 − 2.66 − 0
.17( ) 110
+110
≈0.23
0.1844≈ 1.247
where s 2 =n1 − 1( )s1
2 + n2 − 1( )s22
n1 + n2 − 2=
10 − 1( ) .5( )2 + 10 − 1( ) .3( )2
10 + 10 − 2=
3.0618
= 0.17
d. What is the rejection region (with its numerical value)?Solution:t > tn1 +n2−2 ,α 2
= t18,.05 = 1.734e. What conclusion do you draw?
Solution:We cannot reject H0 because 1.247 is not greater than 1.734.
f. What does this mean in terms of the problem situation?Solution:We cannot conclude that the two means are different since we cannot reject the null hypothesis.
7. Suppose in the situation in Problem 6, the teacher had the GPAs for a sample of 10 Engineering majorsbut only 8 CS majors but otherwise the data were the same. Suppose he decided to do a 90 percenthypothesis test for the difference in GPAs for the two populations of majors.a. What is the null hypothesis?
SolutionH0 : µ1 − µ 2= 0
b. What is the alternative hypothesis?SolutionH1 : µ1 − µ 2≠ 0
c. What is the value of the test statistic?Solution
t =x − y − δ0
s12
n1+
s12
n2
=2.89 − 2.66 − 0
.5( )2
10+
.3( )2
8
≈0.23
0.1904≈ 1.208
d. What is the rejection region (with its numerical value)?Solutiont > tν,α 2
= t15,.05 = 1.753
where ν =
s12
n1+
s22
n2
2
s12
n1
2
n1 − 1+
s22
n2
2
n2 − 1
=
.5( )2
10+
.3( )2
8
2
.5( )2
10
2
10 − 1+
.3( )2
8
2
8 − 1
=.03625( )2
8.7525 × 10 −5 ≈ 15.01 ≈ 15
e. What conclusion do you draw?SolutionWe cannot reject H0 because 1.208 is not greater than 1.753.
f. What does this mean in terms of the problem situation?SolutionWe cannot conclude that the means are different and must continue to assume they are equal.
8. The math teacher for Math 4753 wants to determine if the new book proposed for the course is betterthan the old book that was used before. He teaches two classes that are each a random sample of 42people. The class using the new book got an average of 88 on the final exam given by the math teacherand had a standard deviation of 3 points. The class using the old book had an average of 90 with astandard deviation of 2 points. Suppose the teacher decides to do a hypothesis test at the 98 percentlevel to see if the variances for Engineering majors is lower than the variances for CS majors.a. What is the null hypothesis?
Solution:H0 : σ1
2 ≤ σ22
b. What is the alternative hypothesis?Solution:H1 : σ1
1 > σ 22
c. What is the value of the test statistic?Solution:
F =s1
2
s22 =
3( ) 2
2( )2 = 2.25
d. What is the rejection region (with its numerical value)?Solution:F > fn1 −1, n2 −1,α = f41,41,.01 ≈ 2.11 using the values for 40,40 rather than for 41,41.
e. What conclusion do you draw?Solution:We can reject H0 since 2.25 is greater than 2.11.
f. What does this mean in terms of the problem situation?Solution:We conclude that the variance for the new books is higher than the variance for the old books.
9. A survey of 4000 people in the US finds that 2856 of them believe that daily weather reports are totallyuseless because meteorology is not really a science. Given this data perform a 95 percent hypothesis testto see if more than half of the people in the US believe that weather reports are useless.a. What is the null hypothesis?
Solution:H0 : p ≤ .5
b. What is the alternative hypothesis?Solution:H1 : p > .5
c. What is the value of the test statistic?Solution:
z =ˆ p − p0
p0q0
n
=.714 − .5
.5 × .54000
≈.214.0079
≈ 27.09
d. What is the rejection region (with its numerical value)?Solution:z > zα = z.05 ≈ 1.645
e. What conclusion do you draw?Solution:We can reject H0 since 27.09 > 1.645.
f. What does this mean in terms of the problem situation?Solution:We can conclude that it is likely (at the 95% confidence level) that more than half of the people inthe US believe that weather reports are useless.
10. A survey of 200 regular viewers of Channel 5 in Oklahoma City show that 68 believe that GaryEngland is God. A survey of 100 regular viewers of Channel 9 in Oklahoma City show that 68 of themalso believe that Gary England is God. Given these data perform a 90 percent hypothesis to determine ifthe proportion of Channel 9 viewers who believe that Gary England is God is greater than theproportion of Channel 5 viewers who believe it.a. What is the null hypothesis?
Solution:H0 : p2 − p1 ≤ δ 0 = 0 (Population 2 are the regular Channel 9 viewers)
b. What is the alternative hypothesis?Solution:H1 : p2 − p1 > δ 0 = 0
c. What is the value of the test statistic?Solution:
z =ˆ p 2 − ˆ p 1
ˆ p ̂ q 1n1
+1n2
=.68 − .34
.4533 × .5467 1200
+1
100
≈.34
.06097≈ 5.58
where ˆ p =x + y
n1 + n2=
68 + 68200 + 100
≈ 0.4533 and we use this form of the test statistic because
δ0 = 0 (see Equation 9.12).d. What is the rejection region (with its numerical value)?
Solution:z > zα = z.1 ≈ 1.285
e. What conclusion do you draw?Solution:Reject H0 because 5.58 > 1.285.
f. What does this mean in terms of the problem situation?Solution:This means that we can conclude that H1 is true and that p2 − p1 > 0 or, in other words, p2 > p1(a greater proportion of regular Channel 9 viewers believe that Gary England is God than theproportion of regular Channel 5 viewers that believe that Gary England is God. [Oh, please, Gary,forgive the Channel 5 viewers for they know not what they do]).