29
Solvency Capital Requirement under Standard Approach UNIPOLSAI Case Study Alma Mater Studiorum- Universita di Bologna Balutel Daniela Błachut Marek Wanek Roman Oliver Arturo De Martino

Solvency Capital Requirement under Standard Approach
UNIPOLSAI Case Study
Alma Mater Studiorum- Universita di Bologna
Balutel Daniela Błachut Marek Wanek Roman Oliver Arturo De Martino

Where do we operate within art 138 of Solvency II Directive?
Introduction

PILAR I
Quantitative Capital Requirements:
Technical Provisions
Minimal Capital Requirements
(MCR)
Solvency Capital Requirement (SCR)
SCR Basic Solvency Capital Requirement
Interest rate
Equity
Property
Spread
Currency
Concentration
Counter cyclical
premium
SCR
M
A
R
K
E
T
R I
S
K
Adj Op
Account for taxes and loss absorbing capacity of Life Insurance business
Operational Risk margin, full correlation
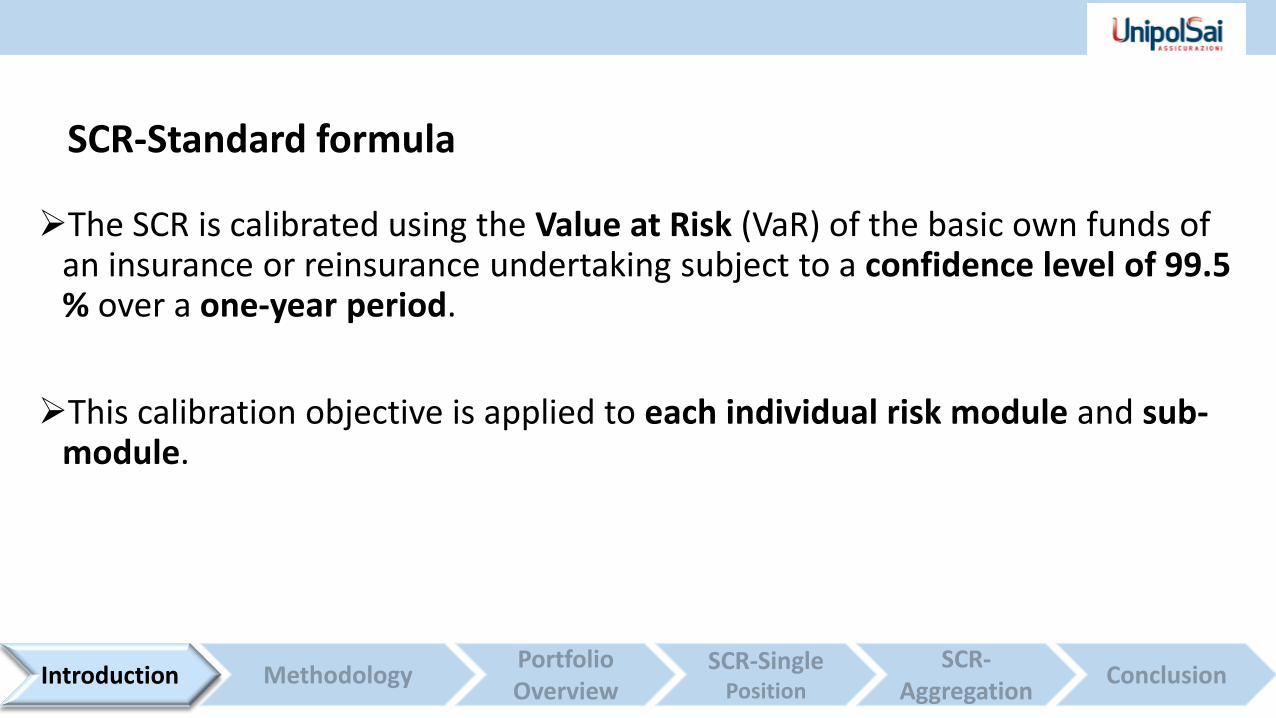
The SCR is calibrated using the Value at Risk (VaR) of the basic own funds of an insurance or reinsurance undertaking subject to a confidence level of 99.5 % over a one-year period.
This calibration objective is applied to each individual risk module and sub-module.
Introduction
SCR-Standard formula
Methodology

In appliance to art 103 of Solvency II Directive we are going to present the estimation of the SCR for the Market risk module solely.
Market risk in the Solvency II standard model is calculated through a scenario based and risk factor approach.
(Linear) Aggregation of sub-modules is done through a standardized correlation matrix.
NAV = difference between assets A and liabilities L, excluding subordinated liabilities.
Methodology
Methodology

Portfolio Overview
Bonds 76%
Convertible 15%
CLN 4%
ELN 5%
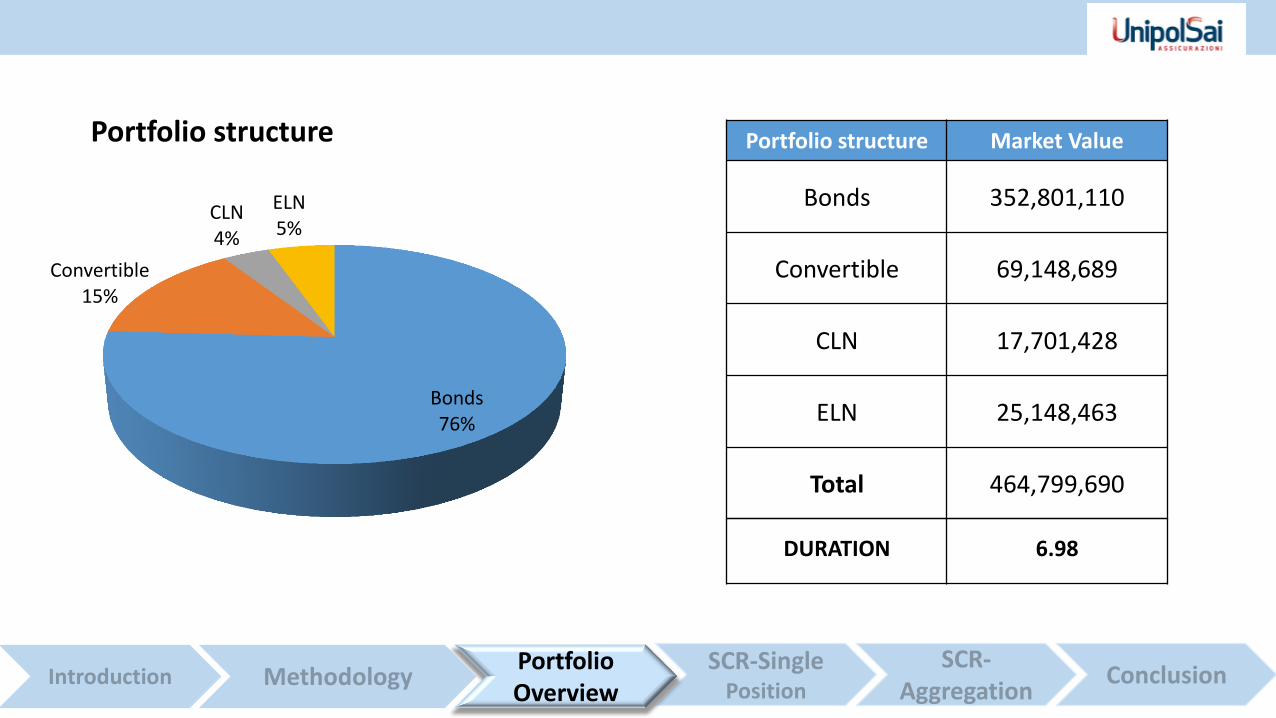
Portfolio structure Market Value
Bonds 352,801,110
Convertible 69,148,689
CLN 17,701,428
ELN 25,148,463
Total 464,799,690
Portfolio structure
Portfolio Overview
DURATION 6.98

Bond Issuer Nominal Dirty Price Market Value Mod. Duration
XS1169707087 UNICREDIT SPA 20,000,000 106.233 21,246,535 2.98
XS0357578722 INTESA SANPAOLO SPA 30,000,000 122.983 36,894,840 14.30
FR0012432904 DANONE SA 30,000,000 102.051 30,615,366 2.89
XS1403015156 UNILEVER NV 40,000,000 101.427 40,570,704 10.34
ES0413900392 BANCO SANTANDER SA 10,000,000 99.219 9,921,881 8.26
XS0420558248 BNP PARIBAS 35,000,000 125.917 44,070,778 4.40
IT0000366721 BUONI POLIENNALI DEL TES 80,000,000 140.871 112,696,985 5.38
IT0003934657 BUONI POLIENNALI DEL TES 50,000,000 113.568 56,784,021 13.85
Subtotal 352,801,110
Portfolio structure - Bonds
Portfolio Overview

Convertible
XS1327914062 TOTAL SA 15,000,000 102.869 15,430,312 5.69
XS1394957309 ENI SPA 15,000,000 103.043 15,456,380 5.16
DE000A1ML0D9 ADIDAS AG 20,000,000 191.310 38,261,996 3.03
Subtotal 69,148,689
CLN
UBS 01/12/2021 CNL Italy UBS 5,000,000 107.700 5,385,007 4.29 SOC GEN 01/03/2019 CNL
Intesa San PaoloSOCIETE GENERALE 12,000,000 102.637 12,316,421 6.20
Subtotal 17,701,428
ELN
Highlands Deutsche Bank AG 20,000,000 125.742 25,148,463 3.71
Subtotal 25,148,463
Portfolio structure - Convertibles, CLNs and ELNs
Portfolio Overview
Bond Issuer Nominal Dirty Price Market Value Mod. Duration
XS1169707087 UNICREDIT SPA 20,000,000 106.233 21,246,535 2.98
XS0357578722 INTESA SANPAOLO SPA 30,000,000 122.983 36,894,840 14.30
FR0012432904 DANONE SA 30,000,000 102.051 30,615,366 2.89
XS1403015156 UNILEVER NV 40,000,000 101.427 40,570,704 10.34
ES0413900392 BANCO SANTANDER SA 10,000,000 99.219 9,921,881 8.26
XS0420558248 BNP PARIBAS 35,000,000 125.917 44,070,778 4.40
IT0000366721 BUONI POLIENNALI DEL TES 80,000,000 140.871 112,696,985 5.38
IT0003934657 BUONI POLIENNALI DEL TES 50,000,000 113.568 56,784,021 13.85
Subtotal 352,801,110
SCR - Single Positions
-0,01
-0,005
0
0,005
0,01
0,015
0,02
0,025
0,03
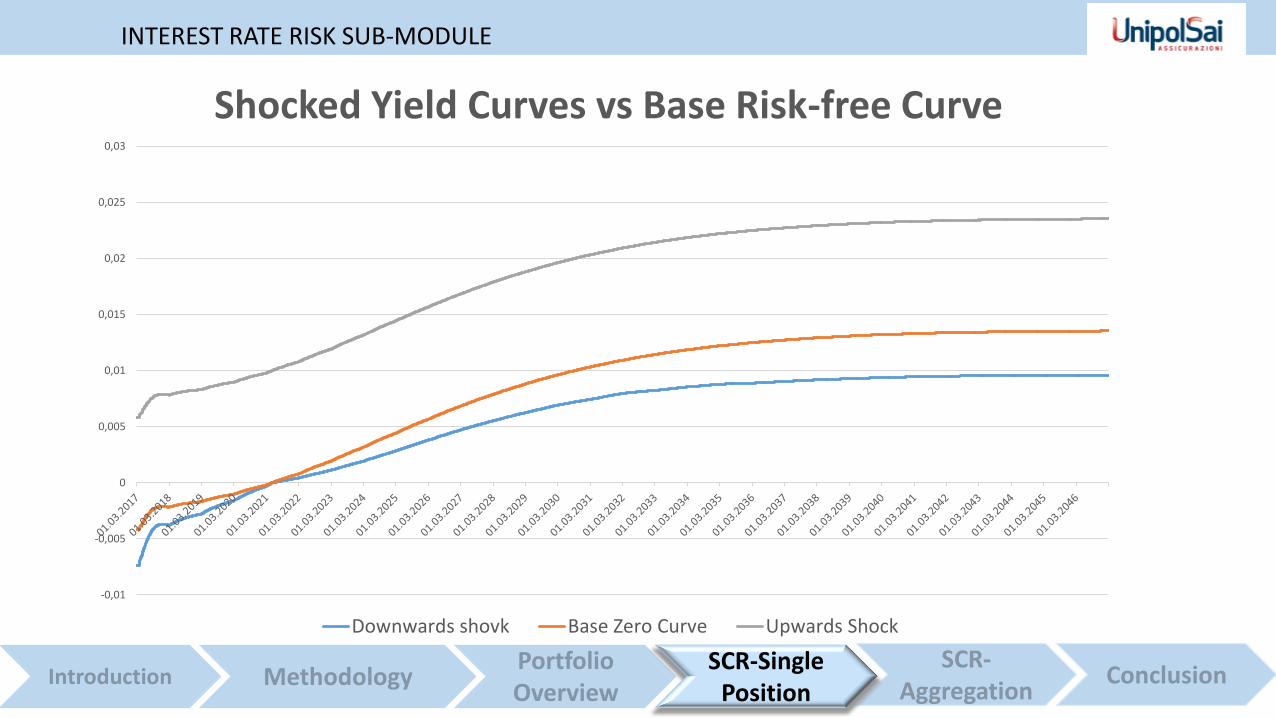
Shocked Yield Curves vs Base Risk-free Curve
Downwards shovk Base Zero Curve Upwards Shock
SCR-Single Position
INTEREST RATE RISK SUB-MODULE

Scenario IntUp IntDown
Market Value Market Value Market Value
Bonds 352,801,110 333,068,221 357,172,796
Convertibles 69,148,689 67,842,140 69,230,365
CLNs 17,701,428 16,734,011 17,796,739
ELNs 25,148,463 25,148,463 25,148,463
Total 464,799,690 442,792,835 469,348,362
Unshocked
Interest rate risk sub-module summary
SCR-Single Position
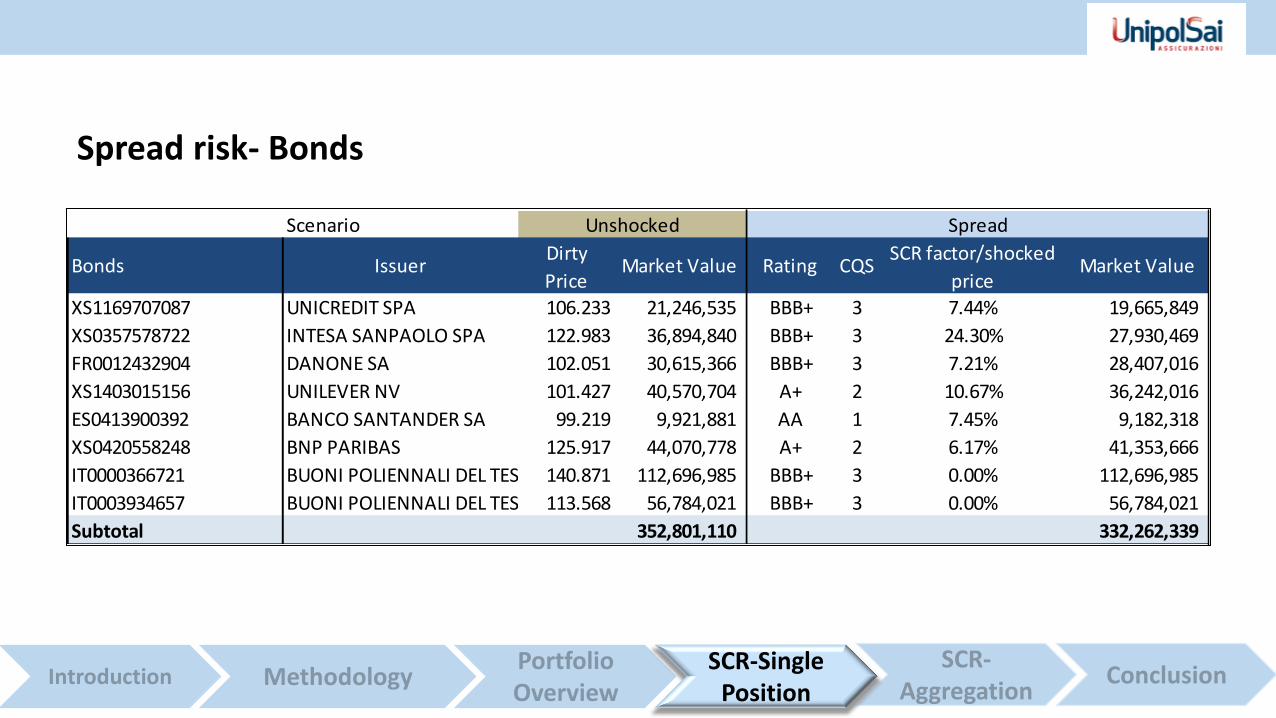
Scenario
Bonds IssuerDirty
PriceMarket Value Rating CQS
SCR factor/shocked
priceMarket Value
XS1169707087 UNICREDIT SPA 106.233 21,246,535 BBB+ 3 7.44% 19,665,849
XS0357578722 INTESA SANPAOLO SPA 122.983 36,894,840 BBB+ 3 24.30% 27,930,469
FR0012432904 DANONE SA 102.051 30,615,366 BBB+ 3 7.21% 28,407,016
XS1403015156 UNILEVER NV 101.427 40,570,704 A+ 2 10.67% 36,242,016
ES0413900392 BANCO SANTANDER SA 99.219 9,921,881 AA 1 7.45% 9,182,318
XS0420558248 BNP PARIBAS 125.917 44,070,778 A+ 2 6.17% 41,353,666
IT0000366721 BUONI POLIENNALI DEL TES 140.871 112,696,985 BBB+ 3 0.00% 112,696,985
IT0003934657 BUONI POLIENNALI DEL TES 113.568 56,784,021 BBB+ 3 0.00% 56,784,021
Subtotal 352,801,110 332,262,339
Unshocked Spread
Spread risk- Bonds
SCR-Single Position
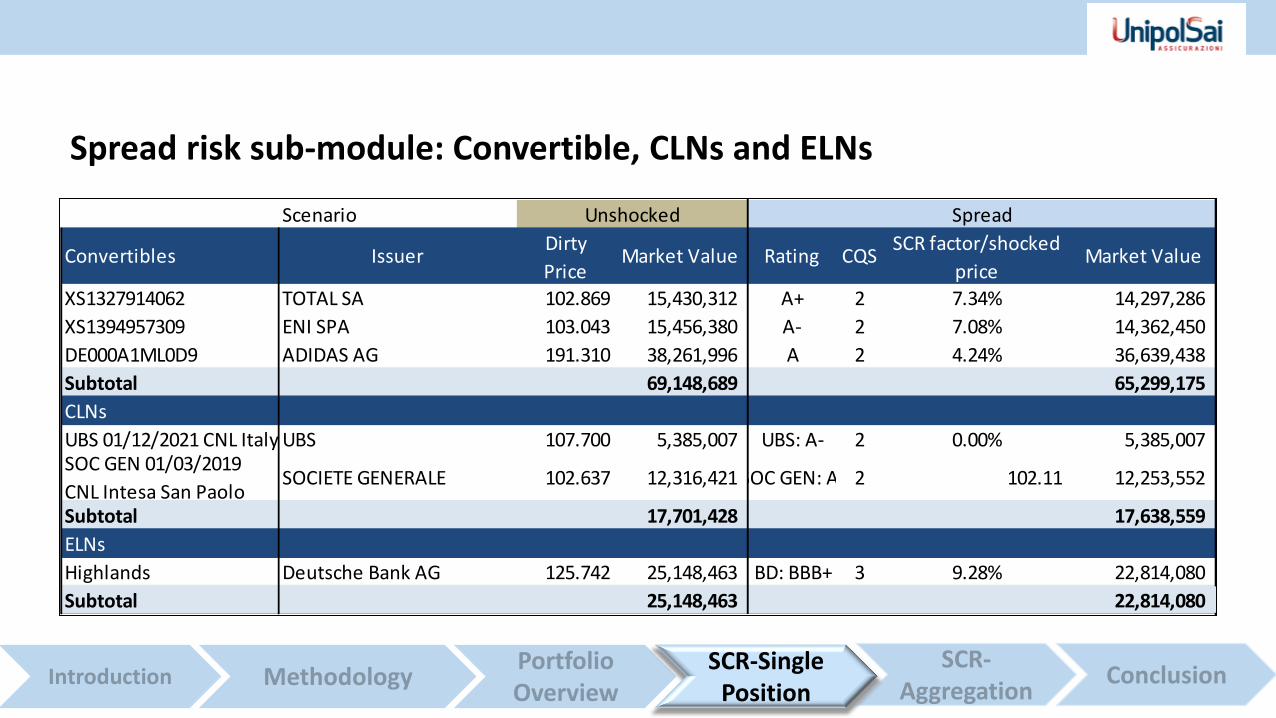
Scenario
Convertibles IssuerDirty
PriceMarket Value Rating CQS
SCR factor/shocked
priceMarket Value
XS1327914062 TOTAL SA 102.869 15,430,312 A+ 2 7.34% 14,297,286
XS1394957309 ENI SPA 103.043 15,456,380 A- 2 7.08% 14,362,450
DE000A1ML0D9 ADIDAS AG 191.310 38,261,996 A 2 4.24% 36,639,438
Subtotal 69,148,689 65,299,175
CLNs
UBS 01/12/2021 CNL Italy UBS 107.700 5,385,007 UBS: A- 2 0.00% 5,385,007 SOC GEN 01/03/2019
CNL Intesa San PaoloSOCIETE GENERALE 102.637 12,316,421 SOC GEN: A- 2 102.11 12,253,552
Subtotal 17,701,428 17,638,559
ELNs
Highlands Deutsche Bank AG 125.742 25,148,463 BD: BBB+ 3 9.28% 22,814,080
Subtotal 25,148,463 22,814,080
Unshocked Spread
Spread risk sub-module: Convertible, CLNs and ELNs
SCR-Single Position

Scenario Unshocked Spread
Assets Market Value Market Value
Bonds 352,801,110 332,262,339
Convertibles 69,148,689 65,299,175
CLNs 17,701,428 17,638,559
ELNs 25,148,463 22,814,080
Total 464,799,690 438,014,154
Spread risk sub-module summary
SCR-Single Position

Scenario
Convertibles Issuer Market Value Dirty Price Market Value
XS1327914062 TOTAL SA 15,430,312 99.056 14,858,345
XS1394957309 ENI SPA 15,456,380 96.032 14,404,764
DE000A1ML0D9 ADIDAS AG 38,261,996 115.752 23,150,385
Subtotal 69,148,689 52,413,493
CLNs
UBS 01/12/2021 CNL Italy UBS 5,385,007 107.700 5,385,007 SOC GEN 01/03/2019
CNL Intesa San PaoloSOCIETE GENERALE 12,316,421 102.637 12,316,421
Subtotal 17,701,428 17,701,428
ELNs
Highlands Deutsche Bank AG 25,148,463 94.829 18,965,750
Subtotal 25,148,463 18,965,750
Unshocked Equity
Equity risk sub-module: Convertibles, CLNs and ELNs
SCR-Single Position
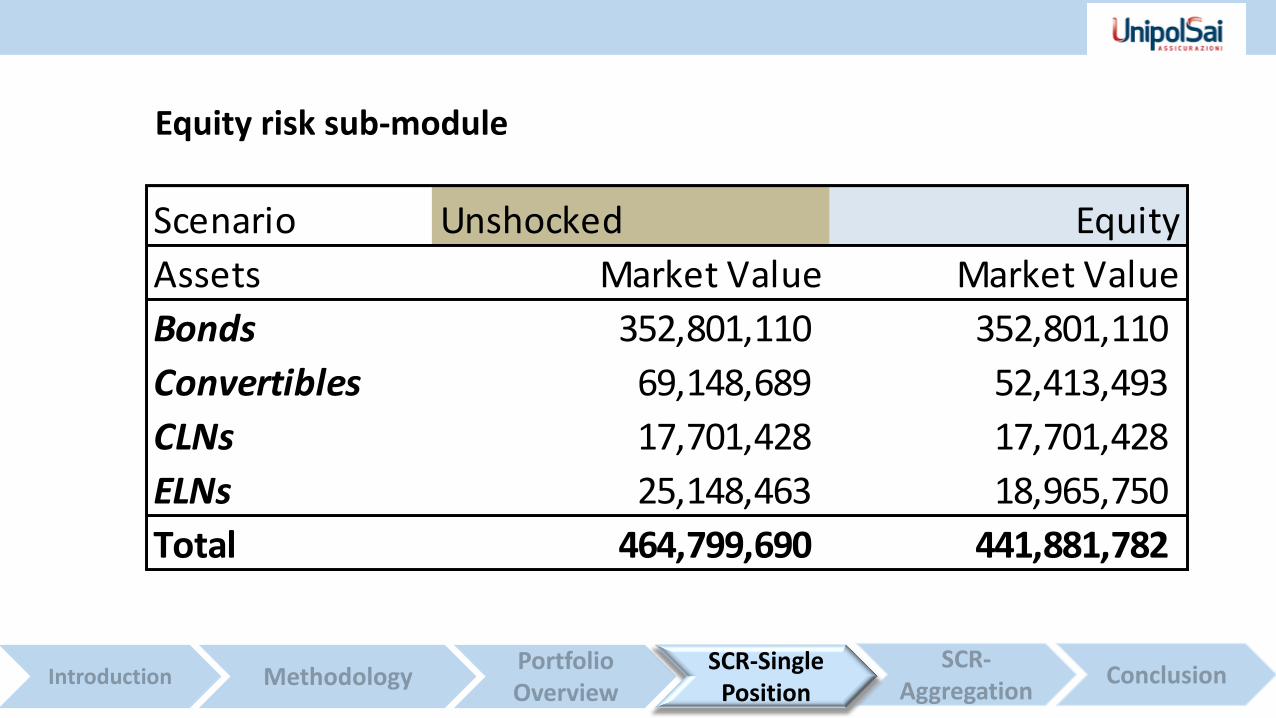
Scenario Unshocked Equity
Assets Market Value Market Value
Bonds 352,801,110 352,801,110
Convertibles 69,148,689 52,413,493
CLNs 17,701,428 17,701,428
ELNs 25,148,463 18,965,750
Total 464,799,690 441,881,782
Equity risk sub-module
SCR-Single Position
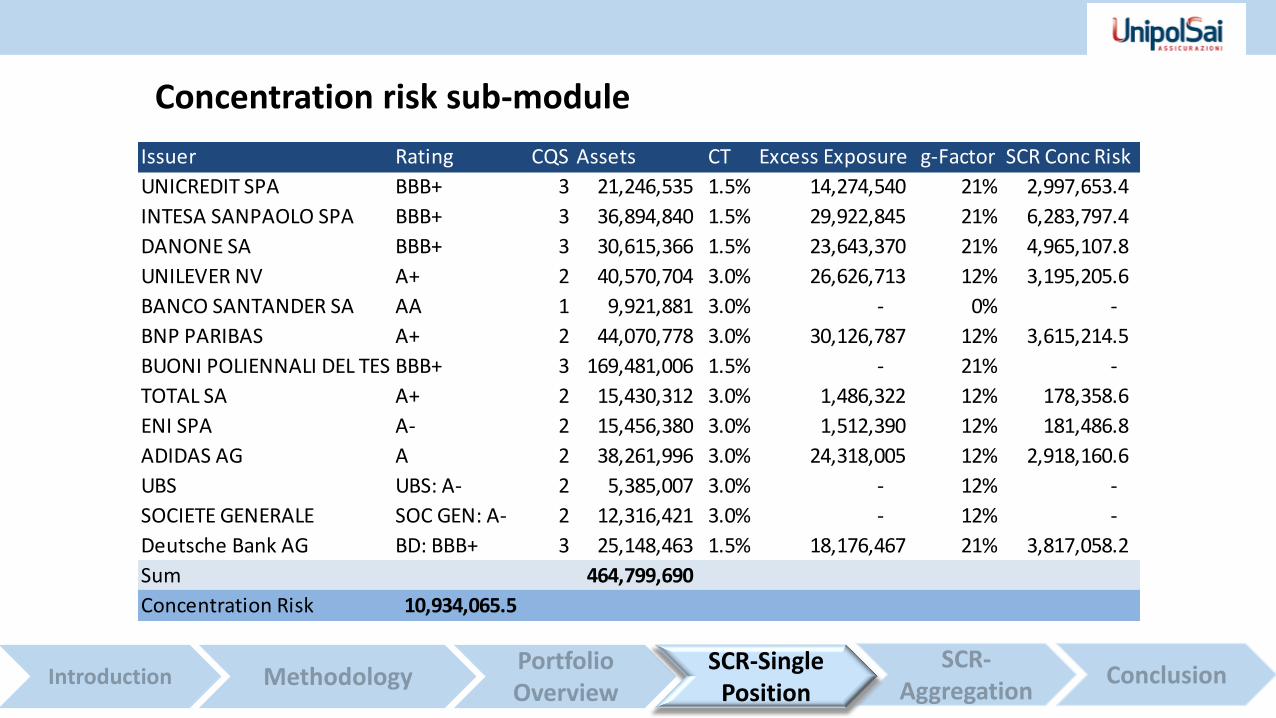
Issuer Rating CQS Assets CT Excess Exposure g-Factor SCR Conc Risk
UNICREDIT SPA BBB+ 3 21,246,535 1.5% 14,274,540 21% 2,997,653.4
INTESA SANPAOLO SPA BBB+ 3 36,894,840 1.5% 29,922,845 21% 6,283,797.4
DANONE SA BBB+ 3 30,615,366 1.5% 23,643,370 21% 4,965,107.8
UNILEVER NV A+ 2 40,570,704 3.0% 26,626,713 12% 3,195,205.6
BANCO SANTANDER SA AA 1 9,921,881 3.0% - 0% -
BNP PARIBAS A+ 2 44,070,778 3.0% 30,126,787 12% 3,615,214.5
BUONI POLIENNALI DEL TES BBB+ 3 169,481,006 1.5% - 21% -
TOTAL SA A+ 2 15,430,312 3.0% 1,486,322 12% 178,358.6
ENI SPA A- 2 15,456,380 3.0% 1,512,390 12% 181,486.8
ADIDAS AG A 2 38,261,996 3.0% 24,318,005 12% 2,918,160.6
UBS UBS: A- 2 5,385,007 3.0% - 12% -
SOCIETE GENERALE SOC GEN: A- 2 12,316,421 3.0% - 12% -
Deutsche Bank AG BD: BBB+ 3 25,148,463 1.5% 18,176,467 21% 3,817,058.2
Sum 464,799,690
Concentration Risk 10,934,065.5
Concentration risk sub-module
SCR-Single Position

SCR -Aggregation
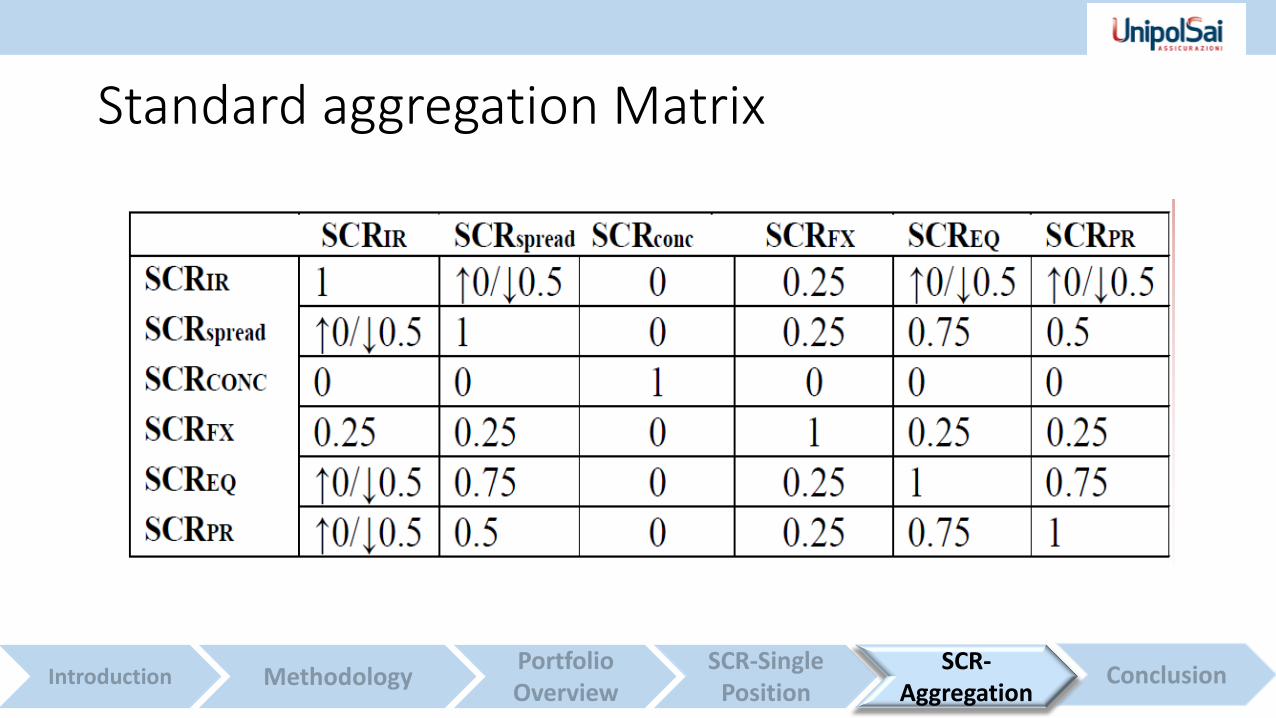
Standard aggregation Matrix
SCR-Aggregation

Market Risk 48,596,716
Interest rate risk 1,533,823
Equity risk 22,917,908
Property risk -
Spread risk 26,785,536
Currency risk -
Concentration risk 10,934,066
Sum 62,171,333
Diversification absolut 13,574,616
Diversification in % 21.83%
Market risk module:
SCR- Aggregation

• Assets and liabilities are well matched
Low interest rate risk
• Equity risk mainly driven by Adidas convertible Equity risk
Conclusion

THANK YOU!
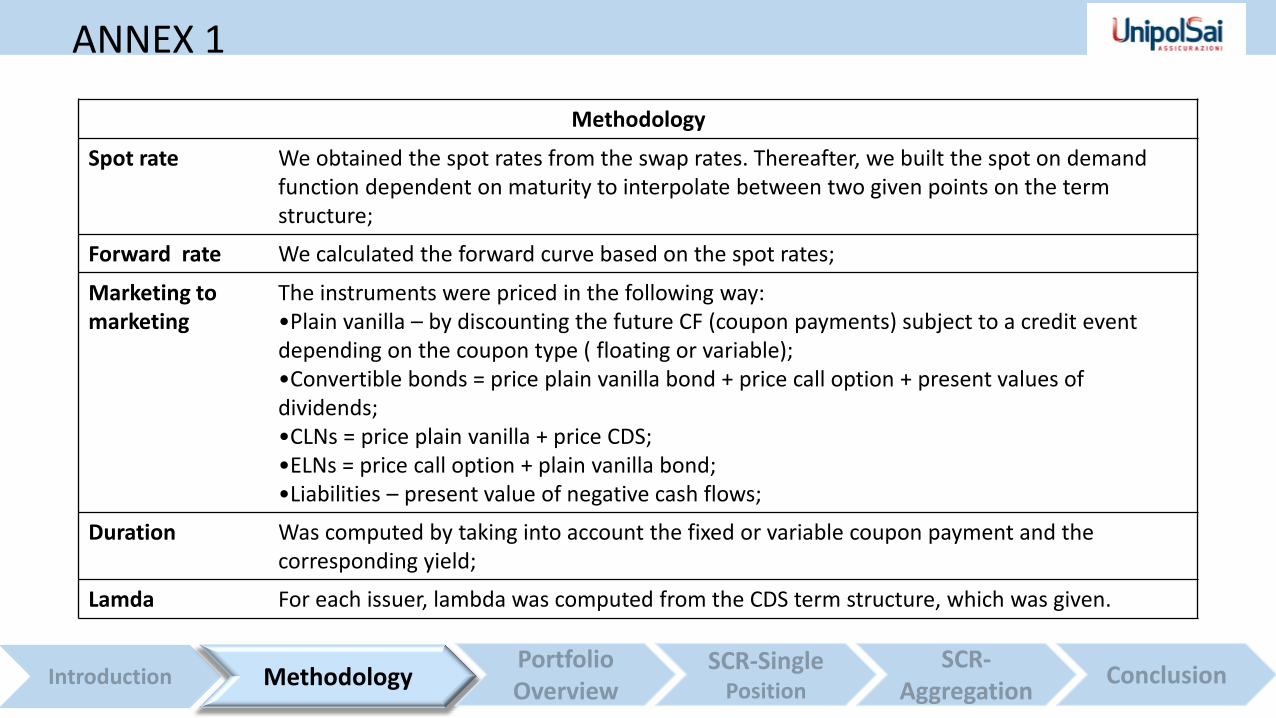
Methodology
Spot rate We obtained the spot rates from the swap rates. Thereafter, we built the spot on demand function dependent on maturity to interpolate between two given points on the term structure;
Forward rate We calculated the forward curve based on the spot rates;
Marketing to marketing
The instruments were priced in the following way: •Plain vanilla – by discounting the future CF (coupon payments) subject to a credit event depending on the coupon type ( floating or variable); •Convertible bonds = price plain vanilla bond + price call option + present values of dividends; •CLNs = price plain vanilla + price CDS; •ELNs = price call option + plain vanilla bond; •Liabilities – present value of negative cash flows;
Duration Was computed by taking into account the fixed or variable coupon payment and the corresponding yield;
Lamda For each issuer, lambda was computed from the CDS term structure, which was given.
Methodology
ANNEX 1
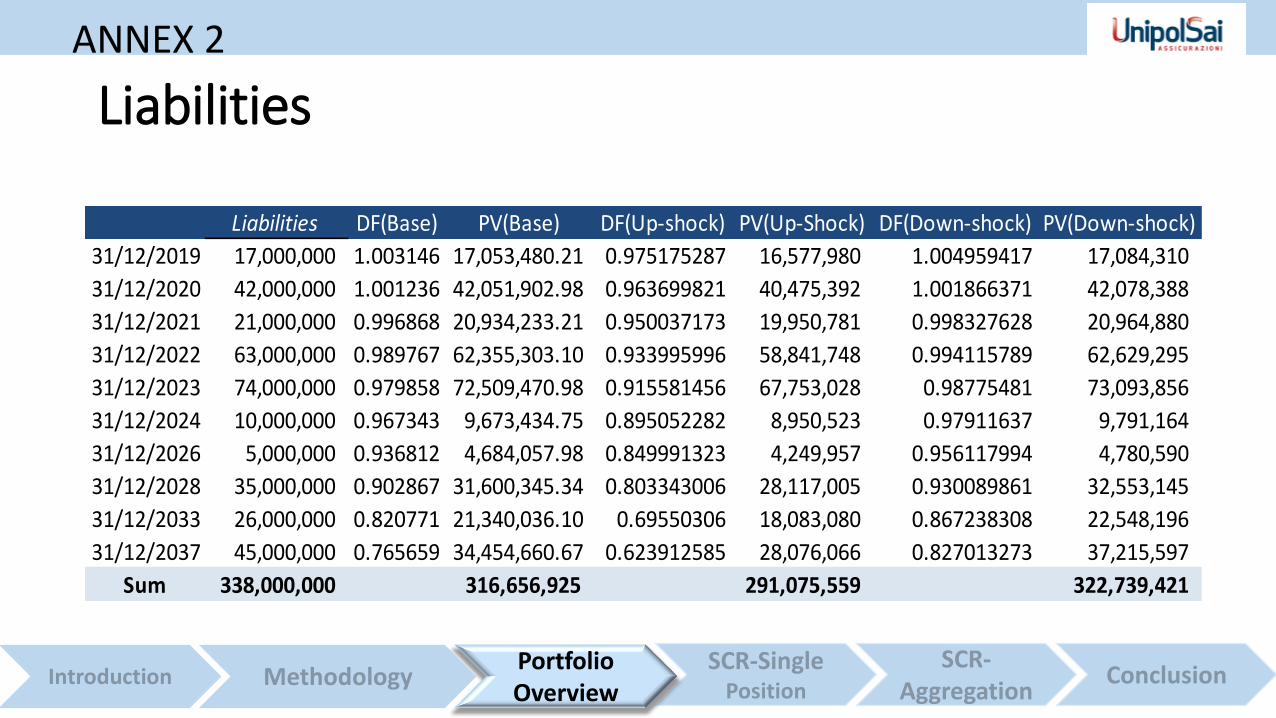
Liabilities
Liabilities DF(Base) PV(Base) DF(Up-shock) PV(Up-Shock) DF(Down-shock) PV(Down-shock)
31/12/2019 17,000,000 1.003146 17,053,480.21 0.975175287 16,577,980 1.004959417 17,084,310
31/12/2020 42,000,000 1.001236 42,051,902.98 0.963699821 40,475,392 1.001866371 42,078,388
31/12/2021 21,000,000 0.996868 20,934,233.21 0.950037173 19,950,781 0.998327628 20,964,880
31/12/2022 63,000,000 0.989767 62,355,303.10 0.933995996 58,841,748 0.994115789 62,629,295
31/12/2023 74,000,000 0.979858 72,509,470.98 0.915581456 67,753,028 0.98775481 73,093,856
31/12/2024 10,000,000 0.967343 9,673,434.75 0.895052282 8,950,523 0.97911637 9,791,164
31/12/2026 5,000,000 0.936812 4,684,057.98 0.849991323 4,249,957 0.956117994 4,780,590
31/12/2028 35,000,000 0.902867 31,600,345.34 0.803343006 28,117,005 0.930089861 32,553,145
31/12/2033 26,000,000 0.820771 21,340,036.10 0.69550306 18,083,080 0.867238308 22,548,196
31/12/2037 45,000,000 0.765659 34,454,660.67 0.623912585 28,076,066 0.827013273 37,215,597
Sum 338,000,000 316,656,925 291,075,559 322,739,421
ANNEX 2
Portfolio Overview
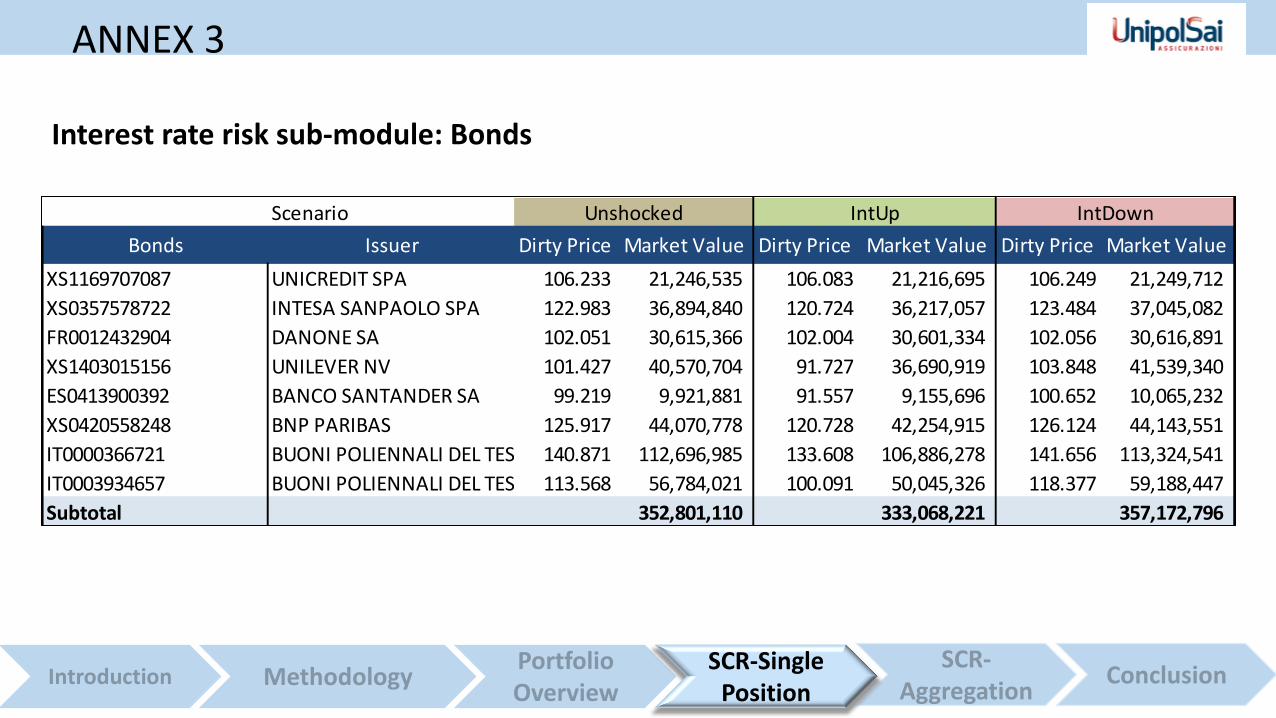
Scenario
Bonds Issuer Dirty Price Market Value Dirty Price Market Value Dirty Price Market Value
XS1169707087 UNICREDIT SPA 106.233 21,246,535 106.083 21,216,695 106.249 21,249,712
XS0357578722 INTESA SANPAOLO SPA 122.983 36,894,840 120.724 36,217,057 123.484 37,045,082
FR0012432904 DANONE SA 102.051 30,615,366 102.004 30,601,334 102.056 30,616,891
XS1403015156 UNILEVER NV 101.427 40,570,704 91.727 36,690,919 103.848 41,539,340
ES0413900392 BANCO SANTANDER SA 99.219 9,921,881 91.557 9,155,696 100.652 10,065,232
XS0420558248 BNP PARIBAS 125.917 44,070,778 120.728 42,254,915 126.124 44,143,551
IT0000366721 BUONI POLIENNALI DEL TES 140.871 112,696,985 133.608 106,886,278 141.656 113,324,541
IT0003934657 BUONI POLIENNALI DEL TES 113.568 56,784,021 100.091 50,045,326 118.377 59,188,447
Subtotal 352,801,110 333,068,221 357,172,796
Convertibles
Unshocked IntUp IntDown
Interest rate risk sub-module: Bonds
SCR-Single Position
ANNEX 3
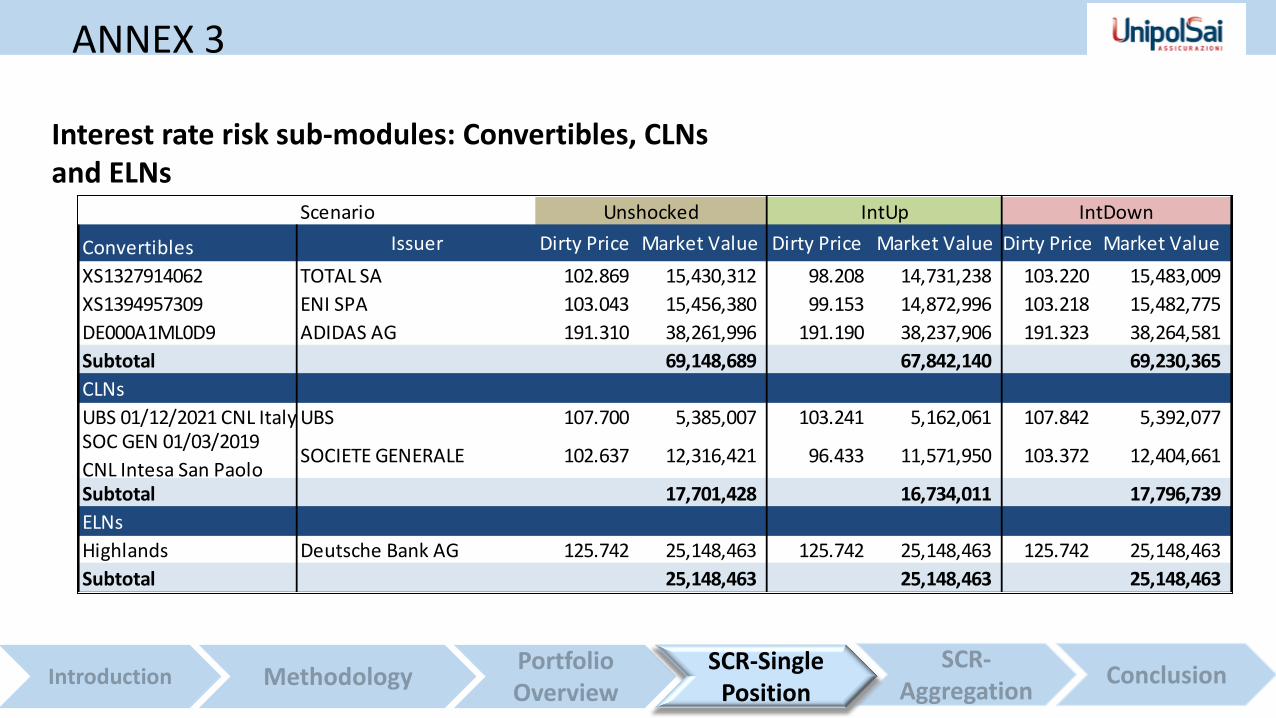
Scenario
Convertibles Issuer Dirty Price Market Value Dirty Price Market Value Dirty Price Market Value
XS1327914062 TOTAL SA 102.869 15,430,312 98.208 14,731,238 103.220 15,483,009
XS1394957309 ENI SPA 103.043 15,456,380 99.153 14,872,996 103.218 15,482,775
DE000A1ML0D9 ADIDAS AG 191.310 38,261,996 191.190 38,237,906 191.323 38,264,581
Subtotal 69,148,689 67,842,140 69,230,365
CLNs
UBS 01/12/2021 CNL Italy UBS 107.700 5,385,007 103.241 5,162,061 107.842 5,392,077 SOC GEN 01/03/2019
CNL Intesa San PaoloSOCIETE GENERALE 102.637 12,316,421 96.433 11,571,950 103.372 12,404,661
Subtotal 17,701,428 16,734,011 17,796,739
ELNs
Highlands Deutsche Bank AG 125.742 25,148,463 125.742 25,148,463 125.742 25,148,463
Subtotal 25,148,463 25,148,463 25,148,463
Unshocked IntUp IntDown
Interest rate risk sub-modules: Convertibles, CLNs and ELNs
SCR-Single Position
ANNEX 3

Interest rate risk 1,533,823Applicable interest rate shock downward
Assets
Market value before shock 464,799,690
Market value after interest up shock 442,792,835
Market value after interest down shock 469,348,362
SCR due to interest up shock 22,006,855
SCR due to interest down shock -4,548,672
Liabilities
Market value before shock 316,656,925
Market value after interest up shock 291,075,559
Market value after interest down shock 322,739,421
SCR due to interest up shock -25,581,366
SCR due to interest down shock 6,082,495
Interest rate risk
SCR-Aggregation
ANNEX 3


