Sonic waveform attenuation in gas hydrate-bearing sediments from the Mallik 2L-38 research well, Mackenzie Delta, Canada Gilles Guerin and David Goldberg Borehole Research Group, Lamont-Doherty Earth Observatory, Palisades, New York, USA Received 30 March 2001; revised 23 October 2001; accepted 28 October 2001; published 7 may 2002. [1] The Japan Petroleum Exploration Co. Ltd./Japan National Oil Corporation/Geological Survey of Canada (JAPEX/JNOC/GSC) Mallik 2L-38 research well was drilled to 1150 m under the Mackenzie Delta, Canada, and penetrated a subpermafrost interval where methane hydrate occupies up to 80% of the pore space. A suite of high-quality downhole logs was acquired to measure in situ the physical properties of these hydrate-bearing sediments. Similar to other hydrate deposits, resistivity and compressional and shear sonic velocity data increase with higher hydrate saturation owing to electrical insulation of the pore space and stiffening of the sediment framework. In addition, sonic waveforms show strong amplitude losses of both compressional and shear waves in intervals where methane hydrate is observed. We use monopole and dipole waveforms to estimate compressional and shear attenuation. Comparing with hydrate saturation values derived from the resistivity log, we observe a linear increase in both attenuation measurements with increasing hydrate saturation, which is not intuitive for stiffening sediments. Numerical modeling of the waveforms allows us to reproduce the recorded waveforms and illustrate these results. We also use a model for wave propagation in frozen porous media to explain qualitatively the loss of sonic waveform amplitude in hydrate-bearing sediments. We suggest that this model can be improved and extended, allowing hydrate saturation to be quantified from attenuation measurements in similar environments and providing new insight into how hydrate and its sediment host interact. INDEX:TERMS: 0915 Exploration Geophysics: Downhole methods; 5144 Physical Properties of Rocks: Wave attenuation; 3210 Mathematical Geophysics: Modeling; 3025 Marine Geology and Geophysics: Marine seismics (0935); KEYWORDS: gas hydrate, sonic logging, attenuation, waveform modeling, frozen porous media 1. Introduction [2] Gas hydrate is a crystalline compound made of water molecules arranged into ice cages that accommodate molecules of free gas. Its formation and stability in the subsurface are constrained by a relatively narrow range of high pressure and low temperature and depend on the influx of free gas [Sloan, 1990; Kvenvolden, 1994] and on the amount of gas dissolved in the pore fluid [Buffett and Zatsepina, 2000; Xu and Ruppel, 1999]. The ice- like structure causes strong changes in the physical properties of the host sediment, particularly mechanical properties, which makes it possible to infer their presence over wide areas in seismic surveys of various continental margins. In addition to deepwater sediments, conditions favorable for hydrate formation are also encountered in high-latitude sediments under deep permafrost. The Japan Petroleum Exploration Co. Ltd. (JAPEX)/Japan National Oil Corporation (JNOC)/Geological Survey of Canada (GSC) Mallik 2L-38 well was drilled in this type of environment (Figure 1), penetrating 1150 m of sands and sandstones interbed- ded with silt/clay layers, through a 640 meter thick permafrost [Dallimore and Collett, 1999]. [3] Downhole measurements, or logs, are used to measure continuously and in situ the physical properties of the formation surrounding a borehole. Because of the instability of hydrate at surface conditions, logs are critical to the evaluation of the in situ conditions conducive to hydrate formation. The measurements most sensitive to hydrate are resistivity, reacting to the insulating properties of ice and to the drilling-induced freshening of pore water, and the sonic log, which responds to the solidifying effect of solid ice in the pore space [Collett, 1998]. The logs collected in about 20 wells in the Mackenzie delta indicate that the local hydrate formation extends at least over 3600 km 2 , with a thickness varying between 50 and 250 m [Dallimore and Collett, 1999]. [4] In this paper we summarize the main logs recorded in Mallik 2L-38 that identify clearly the hydrate-bearing intervals [Collett et al., 1999a; Lee and Collett, 1999]. The analysis of the sonic waveforms recorded by the sonic probe shows that wave- form amplitude is very low in the intervals were hydrate have been identified. We use the monopole and dipole waveforms to calcu- late the intrinsic sonic attenuation of the formation and use the hydrate saturation values derived from the resistivity log to establish a first empirical relationship between sonic attenuation and hydrate concentration. Numerical modeling of the sonic waveforms shows that sonic propagation in hydrates can be fully described with standard acoustic propagation models by changes in velocity and attenuation. As a preliminary qualitative explan- ation of our observations, we use a model for wave propagation in frozen porous media [Leclaire et al., 1994] showing that sonic attenuation and velocity increase with hydrate saturation in hydrate-bearing sediments. 2. Logging Data [5] Figure 2 shows some of the most significant logs recorded in the Mallik 2L-38 well. These logs were presented and described in detail by Collett et al. [1999a]. The caliper log in Figure 2a shows very little variation, which is an indicator of the high quality and reliability of most of the logs. The gamma ray and porosity logs (Figure 2b) show the limited variations in lithology and JOURNAL OF GEOPHYSICAL RESEARCH, VOL. 107, NO. B5, 10.1029/2001JB000556, 2002 Copyright 2002 by the American Geophysical Union. 0148-0227/02/2001JB000556$09.00 EPM 1 - 1
Transcript
Sonic waveform attenuation in gas hydrate-bearing sediments
from the Mallik 2L-38 research well, Mackenzie Delta, Canada
Gilles Guerin and David GoldbergBorehole Research Group, Lamont-Doherty Earth Observatory, Palisades, New York, USA
Received 30 March 2001; revised 23 October 2001; accepted 28 October 2001; published 7 may 2002.
[1] The Japan Petroleum Exploration Co. Ltd./Japan National Oil Corporation/Geological Surveyof Canada (JAPEX/JNOC/GSC) Mallik 2L-38 research well was drilled to 1150 m under theMackenzie Delta, Canada, and penetrated a subpermafrost interval where methane hydrate occupiesup to 80% of the pore space. A suite of high-quality downhole logs was acquired to measure in situthe physical properties of these hydrate-bearing sediments. Similar to other hydrate deposits,resistivity and compressional and shear sonic velocity data increase with higher hydrate saturationowing to electrical insulation of the pore space and stiffening of the sediment framework. Inaddition, sonic waveforms show strong amplitude losses of both compressional and shear waves inintervals where methane hydrate is observed. We use monopole and dipole waveforms to estimatecompressional and shear attenuation. Comparing with hydrate saturation values derived from theresistivity log, we observe a linear increase in both attenuation measurements with increasinghydrate saturation, which is not intuitive for stiffening sediments. Numerical modeling of thewaveforms allows us to reproduce the recorded waveforms and illustrate these results. We also usea model for wave propagation in frozen porous media to explain qualitatively the loss of sonicwaveform amplitude in hydrate-bearing sediments. We suggest that this model can be improved andextended, allowing hydrate saturation to be quantified from attenuation measurements in similarenvir onmen ts and p roviding new insight into how h ydrate and its sedim ent host interact. I NDEX: TERMS: 0915 Exp loration Geophysi cs: Downhol e met hods; 5144 Physic alProperties of Rocks: Wave attenuation; 3210 Mathematical Geophysics: Modeling; 3025 MarineGeology and Geophysics: Marine seismics (0935); KEYWORDS: gas hydrate, sonic logging,attenuation, waveform modeling, frozen porous media
1. Introduction
[2] Gas hydrate is a crystalline compound made of watermolecules arranged into ice cages that accommodate moleculesof free gas. Its formation and stability in the subsurface areconstrained by a relatively narrow range of high pressure andlow temperature and depend on the influx of free gas [Sloan, 1990;Kvenvolden, 1994] and on the amount of gas dissolved in the porefluid [Buffett and Zatsepina, 2000; Xu and Ruppel, 1999]. The ice-like structure causes strong changes in the physical properties ofthe host sediment, particularly mechanical properties, which makesit possible to infer their presence over wide areas in seismicsurveys of various continental margins. In addition to deepwatersediments, conditions favorable for hydrate formation are alsoencountered in high-latitude sediments under deep permafrost.The Japan Petroleum Exploration Co. Ltd. (JAPEX)/JapanNational Oil Corporation (JNOC)/Geological Survey of Canada(GSC) Mallik 2L-38 well was drilled in this type of environment(Figure 1), penetrating 1150 m of sands and sandstones interbed-ded with silt/clay layers, through a 640 meter thick permafrost[Dallimore and Collett, 1999].[3] Downhole measurements, or logs, are used to measure
continuously and in situ the physical properties of the formationsurrounding a borehole. Because of the instability of hydrate atsurface conditions, logs are critical to the evaluation of the in situconditions conducive to hydrate formation. The measurementsmost sensitive to hydrate are resistivity, reacting to the insulatingproperties of ice and to the drilling-induced freshening of pore
water, and the sonic log, which responds to the solidifying effect ofsolid ice in the pore space [Collett, 1998]. The logs collected inabout 20 wells in the Mackenzie delta indicate that the localhydrate formation extends at least over 3600 km2, with a thicknessvarying between 50 and 250 m [Dallimore and Collett, 1999].[4] In this paper we summarize the main logs recorded in
Mallik 2L-38 that identify clearly the hydrate-bearing intervals[Collett et al., 1999a; Lee and Collett, 1999]. The analysis of thesonic waveforms recorded by the sonic probe shows that wave-form amplitude is very low in the intervals were hydrate have beenidentified. We use the monopole and dipole waveforms to calcu-late the intrinsic sonic attenuation of the formation and use thehydrate saturation values derived from the resistivity log toestablish a first empirical relationship between sonic attenuationand hydrate concentration. Numerical modeling of the sonicwaveforms shows that sonic propagation in hydrates can be fullydescribed with standard acoustic propagation models by changesin velocity and attenuation. As a preliminary qualitative explan-ation of our observations, we use a model for wave propagation infrozen porous media [Leclaire et al., 1994] showing that sonicattenuation and velocity increase with hydrate saturation inhydrate-bearing sediments.
2. Logging Data
[5] Figure 2 shows some of the most significant logs recordedin the Mallik 2L-38 well. These logs were presented and describedin detail by Collett et al. [1999a]. The caliper log in Figure 2ashows very little variation, which is an indicator of the high qualityand reliability of most of the logs. The gamma ray and porositylogs (Figure 2b) show the limited variations in lithology and
JOURNAL OF GEOPHYSICAL RESEARCH, VOL. 107, NO. B5, 10.1029/2001JB000556, 2002
Copyright 2002 by the American Geophysical Union.0148-0227/02/2001JB000556$09.00
EPM 1 - 1
porosity along the well. The presence of hydrate is indicated byhigher resistivity and by higher compressional and shear velocityin Figures 2c, 2d, and 2e, respectively. This can be observed inparticular over several intervals: 895–920, 950–995, 1005–1030,and 1070–1110 m (indicated by shaded areas). The relatively high
gamma ray readings between these intervals (Figure 2b) indicatethe presence of more shaly sediments and suggest a lithologiccontrol on hydrate deposition: hydrate accumulates preferably inthe larger pores of sandy intervals. The increase in shear velocity inhydrate-rich zones was observed in logging data by Collett et al.
Figure 1. Location of the MALLIK 2L-38 Gas Hydrate Research Well in the Mackenzie Delta, NorthwestTerritories, Canada. Neighboring wells (hollow circles) were used by Collett et al. [1999b] to characterize the regionalextent of the hydrate deposit.
800 1200 1600Vs (m/s)
2.0 2.5 3.0 3.5Vp (km/s)
10 20 30 40 50Resistivity (ohm.m)
30 40 50 60 70Gamma Ray (API)
Porosity (%)
20 10 0 10 20
700
750
800
850
900
950
1000
1050
1100
Hole Radius(cm)
Dep
th(m
)
0 20 40 60 80
700
750
800
850
900
950
1000
1050
1100
Hydrate Saturation(%)
a. e.d.c.b.
Depth
(m)
quick lookstandard
f.
Figure 2. Downhole logs recorded in the Mallik 2L-38 well (data from Collett et al. [1999a]). Shaded areasindicate the presence of hydrate. (a) Caliper. The solid area represents the diameter of the drill bit. Bit changesoccurred at �790 and 900 m. (b) Lithology characterization for natural gamma ray (solid line) and porosity(dashed line). (c) Resistivity. (d) Compressional sonic velocity (Vp). (e) Shear sonic velocity (Vs). The dashed lineshows the velocity log originally produced by automatic slowness-time coherence. The solid curve was reprocessedwith an interactive semblance algorithm. (f ) Gas hydrate concentration estimated from the resistivity log with the‘‘quick look’’ and ‘‘standard’’ Archie [1942] relationships. Results of hydrate dissociation modeling (open circles)agree well, while chlorinity analysis (solid circles) suggests lower values.
EPM 1 - 2 GUERIN AND GOLDBERG: SONIC ATTENUATION IN HYDRATED SEDIMENTS
[1999a] and Lee and Collett [1999], and in the shear verticalseismic profile (VSP) data by Sakai [1999]. It is consistent with theresults of the only previously recorded Vs log in hydrate-bearingsediments on the Blake Ridge [Guerin et al., 1999].[6] The Vs log in Figure 2e was reprocessed above �900 m with
an interactive semblance algorithm. The original Vs log computed atthe time of the acquisition using an automatic slowness-timecoherence (STC) procedure [Kimball and Marzetta, 1984] is shownfor comparison. Above�900 m, the automatic algorithm performedpoorly, and Sakai [1999] noted a discrepancy between the Vs
estimates of the shear VSP and of the original log above 840 m.The reprocessed Vs log agrees better with the VSP results. Sakai[1999] also notes that the Vs log has to be corrected for thedispersion of the flexural wave. Harrisson et al. [1990] show thatthe flexural dispersion bias does not exceed 10% at its strongest invery slow formations and very large boreholes. This is not a strongfactor in these data. This reprocessed Vs log improves the accuracyof our attenuation estimation and the comparison between hydrate-bearing and hydrate-free sediments.[7] Lee and Collett [1999] and Collett et al. [1999a] used both
resistivity and sonic logs to estimate the amount of gas hydrate inthe vicinity of Mallik 2L-38. They calculated saturation from thesonic velocity using weighted combination of the time-average andWood [1941] formulations [Lee and Collett, 1999]. Their resistiv-ity-derived estimates were calculated with Archie’s [1942] formu-lation. Both methods rely on time-honored models and agreeoverall on the hydrate concentration around the Mallik well. Weuse a ‘‘quick look’’ Archie method similar to the method describedby Collett [1998] and Guerin et al. [1999] to calculate the hydratesaturation values in Figure 2f. In this method the resistivity datarecorded in formations without hydrate are used as a baselineprofile (R0(z)) from which any increase is attributed to the presenceof hydrate. The equation for the baseline in the Mallik well iscalculated with a third-order polynomial fit to data in hydrate-freeintervals (above 900 m and below 1120 m) and the saturation (S ) is
expressed in fraction of the pore space as a function of R0 and ofthe recorded resistivity R(z):
where 1.19386 is an empirical constant determined by Pearsonet al. [1983] and R(z) is the deep resistivity recorded with thearray induction tool (AIT). The gamma ray log shows that in thehydrate-bearing intervals the lithology is generally similar to theformation above 900 m, indicating that the baseline is a validreference to estimate hydrate saturation in these intervals withoutcorrecting for lithology. The results (solid line) show that inintervals where the highest resistivity and sonic velocity aremeasured, hydrate saturation is close to 80%. For comparison,we show discrete saturation estimates from Uchida et al. [1999]calculated by chlorinity analysis of recovered core samples (solidcircles) and results of hydrate dissociation modeling byWright et al.[1999] (open circles). The dashed curve in the same track is the resultof the ‘‘standard’’ Archie formulation described by Collett et al.[1999a]:
S ¼ 1� aRw= R�mð Þð Þ1=1:9386; ð3Þ
where a andm are empirical constants (Collett et al. [1999a; 1999b]use the so-called ‘‘Humble’’ values: a = 0.62 and m = 2.15) and Rw
is the formation water resistivity, calculated with Arp’s formula[Desai and Moore, 1969], using a linear regional temperatureprofile (T(�C) =�23.1 + 0.036z [Majorowicz and Smith, 1999]) anda salinity of 25 ppt [Collett et al., 1999a]. Figure 2f shows that theresults of both standard and quick look Archie methods are similar,with maximum a maximum difference of the order of 10%. Because
Figure 3. Sonic waveforms recorded with Schlumberger’s dipole sonic imager tool. Only four out of the eightreceivers are shown for each mode. Sampling rates are 100 and 25 kHz for monopole and dipole waveforms,respectively, with 512 samples per waveform. Intervals where hydrate have been identified in logs in Figure 2 arehighlighted.
GUERIN AND GOLDBERG: SONIC ATTENUATION IN HYDRATED SEDIMENTS EPM 1 - 3
it has slightly less scatter, we use the results of the quick lookmethod for cross plots later in the paper.
3. Sonic Waveforms
[8] Sonic velocity logs are acquired by sending an acousticpulse through the formation and recording it a known distanceaway with an array of receivers. Two kinds of sources are typicallyused: a monopole, which generates a spherical isotropic pressurepulse traveling at the compressional sound velocity, and a dipole,which produces an asymmetric pulse and flexural waves travelingnear the shear velocity of the formation. The Vp and Vs logs inFigure 2 were calculated from, respectively, the monopole anddipole waveforms shown in Figure 3 by slowness-time coherenceanalysis [Kimball and Marzetta, 1984] and partially reprocessed byan interactive semblance algorithm. The reprocessed Vs log above900 m accurately reflects the flexural mode arrival apparent withhigher amplitudes in the dipole waveforms. All waveforms showdistinctly earlier arrivals in intervals where hydrate are present,which corresponds to the velocity increase characteristic ofhydrate. In addition, both types of waveform have significantlylower amplitudes in these intervals and the amplitude contrastbetween hydrate-bearing and hydrate-free intervals is stronger inthe monopole waveforms.
4. Waveform Attenuation
[9] Waveform amplitude is the result of geometric (spherical)dispersion, tool coupling, and the intrinsic attenuation of theformation [Goldberg et al., 1984]. Assuming that the energyemitted by the sonic transducer and the borehole shape are
constant, geometric spreading and coupling are relatively uniformover the entire hole. Hence variations in waveform amplitudeindicate a strong intrinsic attenuation in these hydrate-bearingsediments.[10] Attenuation can be expressed as the loss of strain energy or
wave amplitude in one cycle of waves oscillation. It is a function offrequency ( f ), or of the wave number (w = 2pf, the angularfrequency), and is usually represented by the Q factor:
1
Q wð Þ ¼ � 1
2p�E
Eð4aÞ
or
1
Q wð Þ ¼ � 1
p�A
A; ð4bÞ
where �E and �A are the loss of energy and amplitude,respectively, during one cycle and E and A are the peak energyand maximum amplitude during the cycle. Q is usually consideredindependent of frequency over the limited range of frequency inlogging tools [Goldberg et al., 1984; Paillet and Cheng, 1991].Frazer et al. [1997] and Sun et al. [2000] describe algorithms toderive in situ attenuation from full waveform logs. Applying aconcept of ‘‘median frequency shift’’ to the amplitude spectrum ofthe recorded waveforms, Sun et al. [2000] derive a simpleexpression for the intrinsic attenuation of the formation:
Q�1 zð Þ ¼Ai � �i zð Þ� �
� t i zð Þ ; ð5Þ
where�ti(z) is the travel time, �i(z) is calculated from the recordedwaveforms and Ai is a constant characteristic of the source and ofthe tool geometry for each receiver. An expression for �i(z) is
�i zð Þ ¼ median w � z;wð Þ�median zf � z;wð Þ �meanw � z;wð Þ½ g;ð6Þ
where � (z, w) = 2 ln Xi(z, w)/ w andXi(z, w ) is the power spectrumof the waveform recorded by the i th receiver. The subscriptsindicate the variable on which the median or mean are calculated.The principle behind this expression is to average the spectrumover the frequency range to remove any depth-independent shift inthe attenuation profile [Frazer et al., 1997]. A first estimation ofQ�1(z) can be calculated by choosing a reference value Qref
�1 at adepth x, which will determine the values for Ai. Because it dependson an arbitrary reference, the resulting values represent theattenuation ‘‘relative’’ to this reference. If d is the differencebetween the true attenuation at ξ and Qref
�1 (Qtrue�1(x) = Qref
�1 � d), andif we assume that the value of Ai is the same for all receivers, then dcan be calculated from the data at two receivers i and j :
d ¼� i ��j
� �(�ti(ξ) - ∆ tj(ξ))
with
� i ¼ mean z[ ].�i zð Þ þ Q� 1est zð Þ� t i z( ) (7)
With this value of d the true attenuation is
Q�1true zð Þ ¼ Q�1
est zð Þ � d� t i xð Þ� t i zð Þ : ð8Þ
0 0.05 0.1 0.15
700
750
800
850
900
950
1000
1050
1100
Monopole Attenuation
Dep
th(m
)
0 0.1 0.2 0.3
Receiver 7Receiver 5Receiver 3Receiver 1
Dipole Attenuation
a) b)Receiver 7Receiver 5Receiver 3Receiver 1
Figure 4. Attenuation logs calculated from the Mallik 2L-38sonic waveforms using the method described by Frazer et al.[1997] and Sun et al. [2000]. (a) Monopole attenuation. (b) Dipoleattenuation. Shaded areas indicate the main hydrate-bearingintervals.
EPM 1 - 4 GUERIN AND GOLDBERG: SONIC ATTENUATION IN HYDRATED SEDIMENTS
The results of this procedure applied to the Mallik 2L-38monopole and dipole waveforms are shown in Figures 4a and4b, respectively. The results show that in the intervals wherehydrate is present, the dipole attenuation increases by a factor of2–3, and that monopole attenuation increases by almost 1 orderof magnitude. For both monopole and dipole logs we displaythe results for receivers 1, 3, 5, and 7 to illustrate the consistency ofthe attenuation estimation between separate receivers.[11] The correlation between attenuation and saturation is
quantified by the cross plots shown in Figure 5a. In Figure 5b,we show a cross plot of Vp and Vs versus hydrate saturation. Theleast squares linear fit equations are
where regression coefficients are in brackets.[12] Despite a slightly wider scatter in the attenuation than in
the velocity relationships, both Qp�1 and Qs
�1 data sets haveregression coefficients 0.84. The correlation quality for Q�1
likely differs from velocity correlations because of the differencesin computational methods and because of the stronger sensitivity ofattenuation to changes in formation physical properties. It is alsodue to the use of the velocity in calculating Q�1, which includesthe velocity uncertainty in the Q�1 calculations. Figure 5 shows,overall, that both attenuation and velocity can be related directly tohydrate saturation.
5. Waveform Modeling
[13] To understand how wave amplitudes relate to the physicalproperties of the formation, it is useful to model sonic waveformswhile varying parameters such as sonic velocity and attenuation.We use the modeling technique described by Tsang and Rader[1979], Cheng and Toksoz [1981] and Kurkjian and Chang[1986]. Assuming that the borehole is an infinite fluid-filledcylinder in an infinite elastic medium, the excitation of a receiverlocated at a distance z from the transmitter is the sum of a direct
pulse through the borehole fluid pi and of a formation responsepulse pr given by
pi ¼1
zx 1� z
Vf
� �
pr ¼1
2pð Þ2Z1
�1
Z1
�1
X wð ÞA kz;wð Þ½ e ik zze�iwtdk z dw;ð11Þ
where X(w) is the Fourier transform of the source pulse x(t), Vf isthe sonic velocity in the fluid, kz is the along-axis wave number,and A(kz,w) a function describing the response of the formation[Tsang and Rader, 1979; Kurkjian , 1985; Kurkjian and Chang ,1986]. The attenuation is introduced by using complexvelocities:
V ! V[ 1 þ 1n(ω/ω0) ] = p Qð Þ 1 þ j =2Qð Þ�1; ð12Þ
where w0 is the source central frequency and j is the unit imaginarycomplex number [Cheng et al., 1982]. The source function issimplified by an exponentially decaying sinusoid. Tsang and Rader[1979] and Kurkjian and Chang [1986] use Hankel functions togive the expressions for A in the case of monopole and dipolesource, respectively, and the branch cut integration is detailed byTsang and Rader [1979] and Kurkjian [1985].[14] Figure 6 shows the modeled waveforms corresponding to
end-members values of Vp, Vs, Qp�1, and Qs
�1 in the differentformations penetrated by the Mallik well. Only two receivers weresimulated, the furthest corresponding to the middle (fifth) receiverin the array. Figures 6a and 6b show monopole and dipolewaveforms, respectively. Each quadrant of four panels corre-sponds to fixed (Vp, Vs) with varying attenuation. In each quad-rant, Qp
�1 increases from the left to the right panel and Qs�1 from
the top to the bottom panel. Generally, for a fixed combination ofhole diameter, tool spacing and source frequency, the relativevalues of Vp, Vs, and Vf determine the different componentsobserved in the waveforms such as compressional and shear headwaves, trapped and surface modes [Paillet and Cheng, 1991].Changing Qp
�1 and Qs�1 values controls the amplitude of these
0.00
0.05
0.10
0.15
0.20
0.25
0.00
0.05
0.10
0.15
0.20
0.25
0 20 40 60 80 100
Mon
opol
eA
ttenu
atio
n Dipole
Attenuation
Hydrate Concentration (%)
Qp
-1
Qs-1
1500
2000
2500
3000
3500
4000
4500
00
500
1000
1500
2000
0 20 40 60 80 100
Vp
(ms-1
) Vss (m
s-11)
Hydrate Concentration (%)
Vp
= 2070 + 15.5S [0.90]V
s= 790 + 9.3S [0.86]
a) Attenuation b) Velocity
= 0.029 + 0.0012S [0.88]= 0.065 + 0.0017S [0.85]
Figure 5. Relationship between gas hydrate saturation estimated from the resistivity log (quick look Archie) and(a) sonic attenuation and (b) sonic velocity. Solid circles are compressional values (Qp
�1 and Vp), open symbols areshear data (Qs
�1 and Vs). Regression coefficients for the least squares linear fits are in brackets.
GUERIN AND GOLDBERG: SONIC ATTENUATION IN HYDRATED SEDIMENTS EPM 1 - 5
modes. The entire set of model results shows that Vp, Vs, Qp�1,
and Qs�1 all influence the amplitude of the monopole waveforms,
but dipole waveforms are mostly sensitive to Vs and Qs�1.
[15] By varying all the parameters and comparing simultane-ously monopole and dipole waveforms with the recorded data, we
evaluate various combinations of parameters to reproduce wave-forms recorded at two depths in Mallik 2L-38 (Figure 7). Forexample, the dipole waveforms recorded at 800 m are reasonablywell reproduced by the model with Vs = 715 m s�1 and Qs
-1 = 0.07 (Figure 6b, top panels). Comparison of the monopole waveforms
a) Monopole waveform modeling b) Dipole waveform modeling
Qp-1 = 0.1 Qs
-1 = 0.07
Qp-1 = 0.1 Qs
-1 = 0.2
Qp-1 = 0.02 Qs
-1 = 0.07
Qp-1 = 0.02 Qs
-1 = 0.2
Vp = 2150 ms-1 Vs = 715 ms-1
Qp-1 = 0.1 Qs
-1 = 0.07
Qp-1 = 0.1 Qs
-1 = 0.2
Qp-1 = 0.02 Qs
-1 = 0.07
Qp-1 = 0.02 Qs
-1 = 0.2
Vp = 3640 ms-1 Vs = 1780 ms-1
0 1 2 3 4 5 6 7 8 1 2 3 4 5 6 7 8Time (ms)
Qp-1 = 0.1 Qs
-1 = 0.07
Qp-1 = 0.1 Qs
-1 = 0.2
Qp-1 = 0.02 Qs
-1 = 0.07
Qp-1 = 0.02 Qs
-1 = 0.2
Vp = 3640 ms-1 Vs = 1780 ms-1
0 1 2 3 4 5 6 7 8 1 2 3 4 5 6 7 8Time (ms)
Qp-1 = 0.1 Qs
-1 = 0.07
Qp-1 = 0.1 Qs
-1 = 0.2
Qp-1 = 0.02 Qs
-1 = 0.07
Qp-1 = 0.02 Qs
-1 = 0.2
Vp = 2150 ms-1 Vs = 715 ms-1
Figure 6. Results of waveform modeling for various velocity and attenuation values. (a) Monopole waveforms.(b) Dipole waveforms. Comparison between models and data have to include both monopole and dipole waveforms.Shaded panels correspond to values of Q�1 and V representative of Mallik 2L-38 with (dark) and without (light)hydrate.
0 1 2 3 4 5 6 7 8Time (ms)
1105m (hydrate)
800m (no hydrate)
Time (ms)0 1 2 3 4
800m (no hydrate)87654321
87654321
1105m (hydrate)
a) Monopole Mallik waveform and model b) Dipole Mallik waveform and model
Rec
eive
rnu
mbe
rR
ecei
ver
num
ber
Figure 7. Comparison of recorded waveforms (dashed lines) with best matching models. The shading correspondsto the model with the same parameter values in Figure 6.
EPM 1 - 6 GUERIN AND GOLDBERG: SONIC ATTENUATION IN HYDRATED SEDIMENTS
at the same depth, however, shows that the best match is obtainedwith Vp = 2150 m s�1 and Q p
� 1= 0.02 (Figure 6a, top left panel).
[16] The two sets of waveforms in Figure 7 (eight receivers foreach mode) were recorded in the absence of and in the presence ofhydrate, at 800 m and 1105 m, respectively . The results of thebest matching models are superimposed for comparison.Despite wider frequency content and more noise in the recordeddata than in the models, the synthetic waveforms reproduce themain features observed in the recorded data in both environmentsby varying only four parameters.[17] Various components of the recorded waveforms can be
identified by comparison with the models. At 800 m the first arrivalin the short-offset monopole waveform (low amplitude at 1.5 ms)
is the compressional wave followed by the fluid arrival (higheramplitude at �1.8 ms). At this depth the shear velocity is muchlower than Vf so there is no shear arrival. The compressional andfluid arrivals are also present in the dipole waveforms, althoughthey have lower amplitudes than in the monopole waveforms. After5 ms transit time the dipole waveform consists mostly of theflexural wave, but this mode appears to be more dispersive thanpredicted by the model. At 1105 m the monopole waveform at theshort-offset receiver shows a compressional arrival at �0.9 ms witha short- and low-amplitude tail. The fluid and shear waves arriveat 1.8 and 1.9 ms, respectively, and are very weak. At this depththe compressional arrival in the dipole waveforms is very weak at�1 ms. The main component observed in the dipole waveforms isthe flexural wave arrival at �1.8 ms.
0.00
0.05
0.10
0.15
0 20 40 60 80 1000.00
0.05
0.10
0.15
0.20
0 20 40 60 80 100
0.00
0.05
0.10
0.15
0 20 40 60 80 1000.00
0.05
0.10
0.15
0.20
0 20 40 60 80 100
0.00
0.05
0.10
0.15
0.00
0.05
0.10
0.15
0.20
0 5000 10000 15000 0 5000 10000 15000
Qp-1
Qs -1
Hydrate Saturation (%) Hydrate Saturation (%)
Qp-1
Qs -1
Qp-1
Qs -1
a) Results vs. hydrate saturation Φ = 35%
b) Results vs. hydrate saturation Φ = 60%
c) Results vs. frequency Φ = 50% S = 50%
Hydrate Saturation (%) Hydrate Saturation (%)
Frequency (Hz) Frequency (Hz)
Figure 8. Predicted attenuation changes with hydrate saturation using the model of Leclaire et al. [1994] for wavepropagation in frozen porous media. All models show results for three values of the ice permeability (dotted line isfor ki0 = 10�8; dashed line is for ki0 = 10�9; and solid line is for ki0 = 10�10). (a) Results for a porosity of 35%,typical of the Mallik sediments. The data measured in the Mallik 2L-38 well are shown for comparison (same asFigure 5). (b) Results with a porosity of 60%, similar to the Blake Ridge. In Figures 8a and 8b, compressionalfrequency is 12 kHz and shear frequency is 2.5 kHz. (c) Results of the Leclaire et al. model as a function offrequency. Saturation and porosity are both 50%.
GUERIN AND GOLDBERG: SONIC ATTENUATION IN HYDRATED SEDIMENTS EPM 1 - 7
[18] These modeling results confirm that velocity and attenuationpred ictabl y i nfluenc e soni c wavefor m shape and ampli tud e. Anincrease in Q� 1 reduces the observed waveforms to essentially asingle dominant component: a compressional mode for a monopolesource and a flexural mode for a dipole source. Increase in Q �1 alsosuppresses later arrivals such as the shear and water arrivals inmonopole waveforms and the slower components of the flexuralmode in dipole waveforms. The presence or absence of hydrate in theformation, as shown at the two depths in Figure 7, can be modeledusi ng con vent ion al met hods and rea sona ble par amete riza tion offormation velocity ( Vp and V s) and attenuation ( Q p
� 1 and Qs� 1).
6. Modeling of Frozen Porous Media
[19] Our waveform modeling shows that only four parametersmay be used to simulate the observations and that these parameters(Vp, V s , Qp
�1, and Qs�1) can be extracted from sonic logs. We
therefore considered models that could also predict these param-eters in various fluid-solid media and found a preliminary suitableformula tion develo ped by Lec laire et al . [1994]. They extendBiot’s [1956] theory of wave propagation to frozen porous mediawhere ice particles and unfrozen water coexist. Assuming that thesolid substrate and ice particle do not interact except in the case ofa totally frozen medium, elastic waves propagate through a three-phase system: an effective solid grain matrix, the unfrozen water,and an effective solid ice matrix. Both matrices interact with thefluid but do not interact with each other. The longitudinal andtransverse displacement potentials (j and y) generated by thepropagating waves are expressed by standard equations of prop-agation:
R �∇J ¼ R �jþ A _j �and µ∇ψ = ρ�ψ + Αψ; ð13Þ
where R, m , r , and A are the matrices of rigidity, shear moduli,mass densities, and friction coefficient, respectively, which arecalculated with the properties of the effective media. Assuming thatthe wave has a single frequency w, these equations can be solvedby calculating the eigenvalues of (r � j/wA) relatively to R andm . This comes to calculating the complex roots ( � = l r + jli) oftwo polynomials for the compressional and shear waves, fromwhere velocity and attenuation can be expressed by
V ¼ 1=l r a ¼ 2 V li : ð14Þ
The coefficients of the different matrices are derived from variousvolumetric averages defined by the representation of each effectivemedium [Kuster and Toksoz, 1974; Biot, 1956]. Percolation theoryis used to describe the transition of the system between continuous(fully saturated) and discontinuous (partially saturated) states. If weassume that hydrate can fill the entire pore space, the expressionsfor the bulk and shear modulus for the hydrate matrix are
Kim ¼ KmaxSt m im ¼ mmaxS
t; ð15Þ
where t is a critical exponent estimated to be t = 3.8 [Deptuck et al.,1985], Kmax and mmax are maximum values of the elastic moduliestimated with the formulation of Kuster and Toksoz [1974], and Sis the hydrate saturation. The model also uses explicit expressionsfor the permeability of both ice and grain matrices to calculate theenergy dissipation and the attenuation in the friction coefficientmatrix A. The permeabilities are determined by Kozeny-Carman’srelationships applied to the water fraction �(1 � S ):
k s ¼ k s0 1� Sð Þ3 k i ¼ k i0 S�2 � 1� Sð Þ= 1� �ð Þ½ 3; ð16Þ
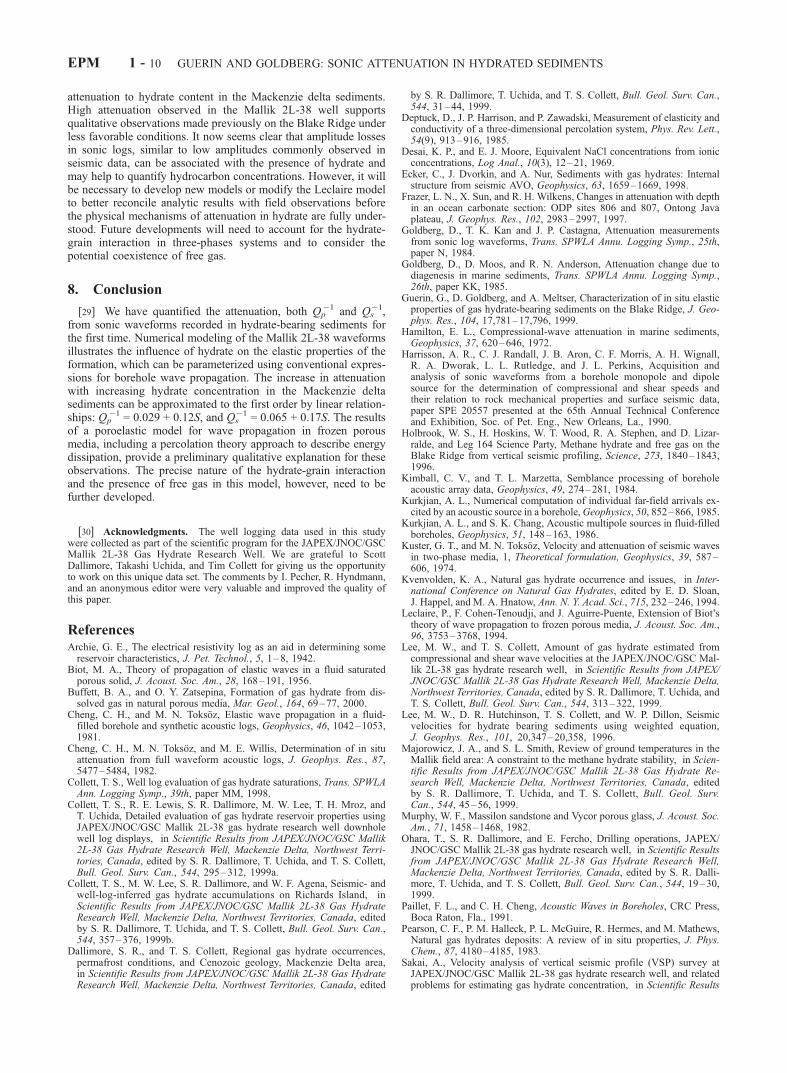
where ki0 and ks0 are the permeabilities of the ice and grainmatrices, respectively.[20] Figure 8 shows some results of this model. The values used
for the parameters are listed in Table 1. In Figure 8a we show theeffect of hydrate saturation on attenuation for several values of ki0,which is the less constrained parameter, and for a porosity� = 35%,which is an average value in Mallik 2L-38. Our results calculatedfrom theMallik 2L-38waveforms are also displayed. The best matchbetween the measured data and the model is for ki0 = 10�10 m2. Themodel curves do not reproduce the trends of the data, but theyindicate increases in attenuation for increasing hydrate saturation.Both model and data also suggest that Qs
�1 is generally higherthan Qp
�1 and that Qs�1 starts to increase at lower hydrate
saturations than Qp�1. The more rapid increase in Qs
�1 at lowhydrate saturation may explain why only dipole waveforms areattenuated in the hydrate-bearing sediments of the Blake Ridgewhere saturation does not exceed 15% of the pore space [Guerinet al., 1999]. In Figure 8b we display the result of the same modelwith � = 60%, typical of the Blake Ridge sediments. It shows thatcompressional attenuation does not become significant for satu-rations less than �60%, while shear attenuation starts to increasewith only 15% hydrate saturation, approximately the occupation ofthe pore space by hydrate the Blake Ridge.
7. Discussion
[21] While the presence of hydrate has been known to increaseseismic velocity since the earliest investigations, only few studies ofsonic waveform logs have been undertaken in hydrate-bearingsediments. Although the exact nature of the interaction betweengrains and hydrate is still subject to some debate, all observationsand models agree that the occurrence of hydrate increases thecompressional velocity of the formation [Lee et al., 1996; Eckeret al., 1998]. Fundamentally, the increase in Vp can be explained bythe indurating effect of ice-like particles replacing water in openpore space. Guerin et al. [1999] observe similar increase in Vs logsin the hydrate-bearing sediments of the Blake Ridge, and the datafrom the Mallik 2L-38 well [Collett et al., 1999a, 1999b; Lee andCollett, 1999] confirm conclusively that the presence of hydrateincreases shear velocity. By comparison, waveform amplitudeanalyses in hydrate-bearing sediments are rare. Guerin et al.[1999] described the apparent attenuation of dipole waveforms inthe sediments of the Blake Ridge but rough hole conditions and lowhydrate concentration (<15% of the pore space) limited interpre-tation to a qualitative discussion. They observe dipole waveamplitudes to be lower in hydrates, but there is no apparent effecton monopole waveforms. The Mallik 2L-38 data suggest thatgiven higher hydrate saturation, both monopole and dipole wave-form amplitudes are affected by the presence of hydrate. To ourknowledge, however, these sonic attenuation measurements in theMallik 2L-38 well are the first quantitative attenuation estimates inhydrate-bearing sediments.
Table 1. Parameter Used in the Models
Parameter Value
Grain density, kg m�3 2,590Water density, kg m�3 1,000Hydrate density, kg m�3 900Formation permeability, m2 10�15
Grain bulk modulus, � 109 Pa 30Grain shear modulus, � 109 Pa 30Water bulk modulus, � 109 Pa 2.67Hydrate bulk modulus, � 109 Pa 6.4Hydrate shear modulus, � 109 Pa 15Source frequency, Hz 12,000 (monopole)
2,500 (dipole)Water viscosity, kg m�1 s�1 1.8 � 10�3
EPM 1 - 8 GUERIN AND GOLDBERG: SONIC ATTENUATION IN HYDRATED SEDIMENTS
[22] In the Mallik 2L-38 well the velocity increase itself cannotexplain the high attenuation in hydrate-bearing intervals: Thestrong positive correlation between attenuation and velocity thatwe observe in the Mallik 2L-38 well is not intuitive. In his reviewof sonic attenuation in marine sediments, Hamilton [1972] com-piles data showing that attenuation decreases with decreasingporosity. If hydrate is considered as a pore-filling material, anincrease in saturation corresponds to a decrease in porosity and,likewise, to a decrease in attenuation. Goldberg et al. [1984]calculated intrinsic attenuation from sonic waveforms in consoli-dated sediments but did not observe any correlation with velocityor porosity. Goldberg et al. [1985], however, describe an increasein attenuation with decreasing porosity and increasing velocity inmarine sediments undergoing silica diagenesis. Because they areall made in different environments, these varying conclusionssuggest that energy dissipation in sediments is controlled bysmaller, pore-scale interactions between grains and infilling mate-rial, rather than by macroscopic bulk parameters such as velocity orporosity. Quantifying the relationship between attenuation andhydrate saturation may help to describe the grain-hydrate config-uration at this microscopic scale. However, the physical mecha-nisms responsible for the increase in both velocity and attenuationin the presence of hydrate still remains to be determined. Thismechanism may also be responsible for the blanking effect some-times observed in seismic data that are associated with the presenceof hydrate.[23] Because attenuation is frequency-dependent, the energy
dissipation in hydrate-bearing sediments does not necessarilytranslate from the sonic (1–20 kHz) to the seismic frequencyrange (1–200 Hz). Wood et al. [2000] used spectral inversion ofsingle-channel seismic and VSP data to calculate P wave seismicattenuation on the Blake Ridge. They observe slightly higherattenuation values in the hydrate-bearing intervals but concludethat attenuation is likely not responsible for the observed seismicblanking. They also note, however, that attenuation may beaffected by hydrate at shorter wavelengths and with higher con-centrations. Wood and Ruppel [2000] argue that the reducedreflectivity on the Blake Ridge is due to scattering and destructiveinterference rather than to the homogeneity of the formation, assuggested by Holbrook et al. [1996]. If attenuation and scatteringabove the bottom simulating reflector (BSR) were high enough,this strong reflector might likewise be attenuated. This is not thecase on the Blake Ridge. The impedance contrast across the BSR isso large that the attenuation above would have to be unrealisticallyhigh in order to reduce this reflector significantly. To reduce itsamplitude by one order of magnitude over a hydrated thickness of�0.2 ms two-way travel time (twtt), equation (4) shows that Q�1
should be on the order of 5 � 10�2 at �100 Hz. Wood et al. [2000]estimate seismic attenuation to be �5–10 times less within thehydrate stability zone. Therefore the BSR persists despite seismicscattering and attenuation above it. Low seismic amplitudes in thehydrate-bearing interval above this BSR is most likely a combi-nation of different mechanisms, including intrinsic attenuationwithin hydrate, seismic scattering at bed boundaries and lithologicuniformity.[24] In the Mackenzie delta the high hydrate concentrations
should affect seismic amplitude, in a similar and complex manner.In the two-dimensional seismic lines presented by Collett et al.[1999b], no attenuation is apparent in hydrate-bearing intervals(�700–900 ms twtt). However, alternating hydrate-bearing andhydrate-free intervals that reflect seismic energy may be too thin(less than a seismic wavelength) to resolve seismic amplitude losswithin the hydrate intervals alone. The compressional wave VSPdescribed by Sakai [1999] and Walia et al. [1999] do not showhigh apparent attenuation either, although Sakai [1999] notes thatthe shear VSP may be strongly attenuated between 950 and 1000 mdepth. This interval contains the bulk of the hydrate deposit inMallik 2L-38. Although it is not entirely clear how hydrate
attenuates seismic waves, nor which other formation effects mayor may not be present, these results suggest that the effect ofhydrate on the attenuation of shear waves is stronger than oncompressional waves.[25] Despite the present limitations of this model, we have also
used the Leclaire et al. [1994] model to predict the influence offrequency on attenuation due to the presence of hydrate in poroussediments. In Figure 8c we show the results for three values of theice permeability ki0 and over a frequency range from seismic tosonic logging experiments (0.1 Hz to 15 kHz). We use values ofporosity and saturation of 50%, between the end-member values onthe Blake Ridge and in the Mackenzie delta. For ki0 = 10�10,which seems to give the most realistic values, compressionalattenuation increases with frequency to �1 kHz then decreasessteadily to 15 Hz but remains low. By contrast, shear attenuation ishigh at frequencies below 1 kHz and decreases rapidly whileremaining significant at least for ki0 = 10�10. Qs
�1 decreases moregradually as ice permeability ki0 decreases. These results areconsistent with the observed shear attenuation in hydrate-bearingintervals for logging and VSP experiments.[26] In general, the Leclaire et al. [1994] model predicts lower
attenuation and velocity than we observe in the Mallik 2L-38 well.The difference between the model and our data tends to decreasewith increasing hydrate saturation. Our observations indicate anincrease in velocity and attenuation at very low hydrate saturation,while the model predicts a significant increase only at saturationsgreater than �40%. This may result from the assumption that ice/hydrate and grains do not interact. Only interactions between iceand fluid, and separately between fluid and grains, are allowed inthe model for numerical simplicity. As a result, interactionbetween grains and hydrate occurs indirectly through the porefluid and does not become significant until a critically highhydrate saturation level. Certain forms of hydrate deposition, suchas uniform distribution of hydrate on grain surfaces, may alsogenerate dissipative frictional interaction between grains andhydrate which should introduce more attenuation at lower satu-rations than predicted by this model. Despite its limitations, theLeclaire model offers a qualitative approach that explains ourobservations: high compressional and shear wave attenuation aswell as an increase in attenuation with increasing hydrate satu-ration in the Mallik 2L-38 well.[27] As an alternative or compounding explanation, the
observed attenuation in these hydrate-bearing sediments may beenhanced by the presence of free gas, which is not considered inthis model. Low concentrations (<20%) of free gas can increasesonic attenuation significantly [Murphy, 1982]. At high hydratesaturation such as in the Mackenzie delta sediments, there could betwo main reasons for the presence of free gas: (1) pore watercontent may be insufficient for complete methane hydration, andsome free gas remains in the pore space and (2) drilling operationsmay have induced dissociation of hydrate in the vicinity of theborehole. Such partial dissociation effects and the resulting influ-ence of free gas on the observed sonic waveforms are difficult toquantify. However, anticipating these effects, the temperature ofthe drilling mud was reduced during drilling operations in order tolimit hydrate decomposition [Ohara et al., 1999]. Though moti-vated by safety reasons, this measure should have limited thephysical extent of hydrate dissociation to the immediate vicinity ofthe borehole and any liberated free gas should have been evacuatedby the drilling fluids before logging. In either case, any remainingamount of free gas should significantly reduce the compressionalvelocity. The sonic log measures high Vp in the hydrate-bearingintervals, and therefore the amount of free gas is extremely limited.We conclude that free gas should contribute only modestly, if at all,to the observed waveforms attenuation.[28] A principal result of this study is the quantitative relation-
ships established between attenuation and saturation. Equations (9)and (10) provide empirical tools that can be used to relate
GUERIN AND GOLDBERG: SONIC ATTENUATION IN HYDRATED SEDIMENTS EPM 1 - 9
attenuation to hydrate content in the Mackenzie delta sediments.High attenuation observed in the Mallik 2L-38 well supportsqualitative observations made previously on the Blake Ridge underless favorable conditions. It now seems clear that amplitude lossesin sonic logs, similar to low amplitudes commonly observed inseismic data, can be associated with the presence of hydrate andmay help to quantify hydrocarbon concentrations. However, it willbe necessary to develop new models or modify the Leclaire modelto better reconcile analytic results with field observations beforethe physical mechanisms of attenuation in hydrate are fully under-stood. Future developments will need to account for the hydrate-grain interaction in three-phases systems and to consider thepotential coexistence of free gas.
8. Conclusion
[29] We have quantified the attenuation, both Qp�1 and Qs
�1,from sonic waveforms recorded in hydrate-bearing sediments forthe first time. Numerical modeling of the Mallik 2L-38 waveformsillustrates the influence of hydrate on the elastic properties of theformation, which can be parameterized using conventional expres-sions for borehole wave propagation. The increase in attenuationwith increasing hydrate concentration in the Mackenzie deltasediments can be approximated to the first order by linear relation-ships: Qp
�1 = 0.029 + 0.12S, and Qs�1 = 0.065 + 0.17S. The results
of a poroelastic model for wave propagation in frozen porousmedia, including a percolation theory approach to describe energydissipation, provide a preliminary qualitative explanation for theseobservations. The precise nature of the hydrate-grain interactionand the presence of free gas in this model, however, need to befurther developed.
[30] Acknowledgments. The well logging data used in this studywere collected as part of the scientific program for the JAPEX/JNOC/GSCMallik 2L-38 Gas Hydrate Research Well. We are grateful to ScottDallimore, Takashi Uchida, and Tim Collett for giving us the opportunityto work on this unique data set. The comments by I. Pecher, R. Hyndmann,and an anonymous editor were very valuable and improved the quality ofthis paper.
ReferencesArchie, G. E., The electrical resistivity log as an aid in determining somereservoir characteristics, J. Pet. Technol., 5, 1–8, 1942.
Biot, M. A., Theory of propagation of elastic waves in a fluid saturatedporous solid, J. Acoust. Soc. Am., 28, 168–191, 1956.
Buffett, B. A., and O. Y. Zatsepina, Formation of gas hydrate from dis-solved gas in natural porous media, Mar. Geol., 164, 69–77, 2000.
Cheng, C. H., and M. N. Toksoz, Elastic wave propagation in a fluid-filled borehole and synthetic acoustic logs, Geophysics, 46, 1042–1053,1981.
Cheng, C. H., M. N. Toksoz, and M. E. Willis, Determination of in situattenuation from full waveform acoustic logs, J. Geophys. Res., 87,5477–5484, 1982.
Collett, T. S., Well log evaluation of gas hydrate saturations, Trans. SPWLAAnn. Logging Symp., 39th, paper MM, 1998.
Collett, T. S., R. E. Lewis, S. R. Dallimore, M. W. Lee, T. H. Mroz, andT. Uchida, Detailed evaluation of gas hydrate reservoir properties usingJAPEX/JNOC/GSC Mallik 2L-38 gas hydrate research well downholewell log displays, in Scientific Results from JAPEX/JNOC/GSC Mallik2L-38 Gas Hydrate Research Well, Mackenzie Delta, Northwest Terri-tories, Canada, edited by S. R. Dallimore, T. Uchida, and T. S. Collett,Bull. Geol. Surv. Can., 544, 295–312, 1999a.
Collett, T. S., M. W. Lee, S. R. Dallimore, and W. F. Agena, Seismic- andwell-log-inferred gas hydrate accumulations on Richards Island, inScientific Results from JAPEX/JNOC/GSC Mallik 2L-38 Gas HydrateResearch Well, Mackenzie Delta, Northwest Territories, Canada, editedby S. R. Dallimore, T. Uchida, and T. S. Collett, Bull. Geol. Surv. Can.,544, 357–376, 1999b.
Dallimore, S. R., and T. S. Collett, Regional gas hydrate occurrences,permafrost conditions, and Cenozoic geology, Mackenzie Delta area,in Scientific Results from JAPEX/JNOC/GSC Mallik 2L-38 Gas HydrateResearch Well, Mackenzie Delta, Northwest Territories, Canada, edited
by S. R. Dallimore, T. Uchida, and T. S. Collett, Bull. Geol. Surv. Can.,544, 31–44, 1999.
Deptuck, D., J. P. Harrison, and P. Zawadski, Measurement of elasticity andconductivity of a three-dimensional percolation system, Phys. Rev. Lett.,54(9), 913–916, 1985.
Desai, K. P., and E. J. Moore, Equivalent NaCl concentrations from ionicconcentrations, Log Anal., 10(3), 12–21, 1969.
Ecker, C., J. Dvorkin, and A. Nur, Sediments with gas hydrates: Internalstructure from seismic AVO, Geophysics, 63, 1659–1669, 1998.
Frazer, L. N., X. Sun, and R. H. Wilkens, Changes in attenuation with depthin an ocean carbonate section: ODP sites 806 and 807, Ontong Javaplateau, J. Geophys. Res., 102, 2983–2997, 1997.
Goldberg, D., T. K. Kan and J. P. Castagna, Attenuation measurementsfrom sonic log waveforms, Trans. SPWLA Annu. Logging Symp., 25th,paper N, 1984.
Goldberg, D., D. Moos, and R. N. Anderson, Attenuation change due todiagenesis in marine sediments, Trans. SPWLA Annu. Logging Symp.,26th, paper KK, 1985.
Guerin, G., D. Goldberg, and A. Meltser, Characterization of in situ elasticproperties of gas hydrate-bearing sediments on the Blake Ridge, J. Geo-phys. Res., 104, 17,781–17,796, 1999.
Hamilton, E. L., Compressional-wave attenuation in marine sediments,Geophysics, 37, 620–646, 1972.
Harrisson, A. R., C. J. Randall, J. B. Aron, C. F. Morris, A. H. Wignall,R. A. Dworak, L. L. Rutledge, and J. L. Perkins, Acquisition andanalysis of sonic waveforms from a borehole monopole and dipolesource for the determination of compressional and shear speeds andtheir relation to rock mechanical properties and surface seismic data,paper SPE 20557 presented at the 65th Annual Technical Conferenceand Exhibition, Soc. of Pet. Eng., New Orleans, La., 1990.
Holbrook, W. S., H. Hoskins, W. T. Wood, R. A. Stephen, and D. Lizar-ralde, and Leg 164 Science Party, Methane hydrate and free gas on theBlake Ridge from vertical seismic profiling, Science, 273, 1840–1843,1996.
Kimball, C. V., and T. L. Marzetta, Semblance processing of boreholeacoustic array data, Geophysics, 49, 274–281, 1984.
Kurkjian, A. L., Numerical computation of individual far-field arrivals ex-cited by an acoustic source in a borehole,Geophysics, 50, 852–866, 1985.
Kurkjian, A. L., and S. K. Chang, Acoustic multipole sources in fluid-filledboreholes, Geophysics, 51, 148–163, 1986.
Kuster, G. T., and M. N. Toksoz, Velocity and attenuation of seismic wavesin two-phase media, 1, Theoretical formulation, Geophysics, 39, 587–606, 1974.
Kvenvolden, K. A., Natural gas hydrate occurrence and issues, in Inter-national Conference on Natural Gas Hydrates, edited by E. D. Sloan,J. Happel, and M. A. Hnatow, Ann. N. Y. Acad. Sci., 715, 232–246, 1994.
Leclaire, P., F. Cohen-Tenoudji, and J. Aguirre-Puente, Extension of Biot’stheory of wave propagation to frozen porous media, J. Acoust. Soc. Am.,96, 3753–3768, 1994.
Lee, M. W., and T. S. Collett, Amount of gas hydrate estimated fromcompressional and shear wave velocities at the JAPEX/JNOC/GSC Mal-lik 2L-38 gas hydrate research well, in Scientific Results from JAPEX/JNOC/GSC Mallik 2L-38 Gas Hydrate Research Well, Mackenzie Delta,Northwest Territories, Canada, edited by S. R. Dallimore, T. Uchida, andT. S. Collett, Bull. Geol. Surv. Can., 544, 313–322, 1999.
Lee, M. W., D. R. Hutchinson, T. S. Collett, and W. P. Dillon, Seismicvelocities for hydrate bearing sediments using weighted equation,J. Geophys. Res., 101, 20,347–20,358, 1996.
Majorowicz, J. A., and S. L. Smith, Review of ground temperatures in theMallik field area: A constraint to the methane hydrate stability, in Scien-tific Results from JAPEX/JNOC/GSC Mallik 2L-38 Gas Hydrate Re-search Well, Mackenzie Delta, Northwest Territories, Canada, editedby S. R. Dallimore, T. Uchida, and T. S. Collett, Bull. Geol. Surv.Can., 544, 45–56, 1999.
Murphy, W. F., Massilon sandstone and Vycor porous glass, J. Acoust. Soc.Am., 71, 1458–1468, 1982.
Ohara, T., S. R. Dallimore, and E. Fercho, Drilling operations, JAPEX/JNOC/GSC Mallik 2L-38 gas hydrate research well, in Scientific Resultsfrom JAPEX/JNOC/GSC Mallik 2L-38 Gas Hydrate Research Well,Mackenzie Delta, Northwest Territories, Canada, edited by S. R. Dalli-more, T. Uchida, and T. S. Collett, Bull. Geol. Surv. Can., 544, 19–30,1999.
Paillet, F. L., and C. H. Cheng, Acoustic Waves in Boreholes, CRC Press,Boca Raton, Fla., 1991.
Pearson, C. F., P. M. Halleck, P. L. McGuire, R. Hermes, and M. Mathews,Natural gas hydrates deposits: A review of in situ properties, J. Phys.Chem., 87, 4180–4185, 1983.
Sakai, A., Velocity analysis of vertical seismic profile (VSP) survey atJAPEX/JNOC/GSC Mallik 2L-38 gas hydrate research well, and relatedproblems for estimating gas hydrate concentration, in Scientific Results
EPM 1 - 10 GUERIN AND GOLDBERG: SONIC ATTENUATION IN HYDRATED SEDIMENTS
from JAPEX/JNOC/GSC Mallik 2L-38 Gas Hydrate Research Well,Mackenzie Delta, Northwest Territories, Canada, edited by S. R. Dalli-more, T. Uchida, and T. S. Collett, Bull. Geol. Surv. Can., 544, 323–340,1999.
Sloan, E. D., Clathrate Hydrates of Natural Gases, Marcel Dekker, NewYork, 1990.
Sun, X., X. Tang, C. H. Cheng, and L. N. Frazer, P- and S-wave attenuationlogs from monopole sonic data, Geophysics, 65, 755–765, 2000.
Tsang, L., and D. Rader, Numerical evaluation of transient acoustic wave-forms due to a point source in a fluid-filled borehole, Geophysics, 44,1706–1720, 1979.
Uchida, T., R. Matsumoto, A. Waseda, T. Okui, K. Yamada, T. Uchida,S. Okada, and O. Takano, Summary of physicochemical properties ofnatural gas hydrate and associated gas-hydrate-bearing sediments, JA-PEX/JNOC/GSC Mallik 2L-38 gas hydrate research well, by the Japa-nese research consortium, in Scientific Results from JAPEX/JNOC/GSC Mallik 2L-38 Gas Hydrate Research Well, Mackenzie Delta,Northwest Territories, Canada, edited by S. R. Dallimore, T. Uchida,and T. S. Collett, Bull. Geol. Surv. Can., 544, 205–228, 1999.
Walia, R., Y. Mi, R. D. Hyndman, and A. Sakai, Vertical seismic profile(VSP) in the JAPEX/JNOC/GSC Mallik 2L-38 gas hydrate research well,in Scientific Results from JAPEX/JNOC/GSC Mallik 2L-38 Gas HydrateResearch Well, Mackenzie Delta, Northwest territories, Canada, editedby S. R. Dallimore, T. Uchida, and T. S. Collett, Geol. Surv. Can. Bull.,544, 323–340, 1999.
Wood, A. B., A Textbook of Sound, G. Bell, London, 1941.Wood, W. T., and C. Ruppel, Seismic and thermal investigations of theBlake Ridge gas hydrate area: A synthesis, Proc. Ocean Drill. Program,Sci. Results, 164, 253–264, 2000.
Wood, W. T., W. S. Holbrook, and H. Hoskins, In situ measurements ofP-wave attenuation in the methane hydrate- and gas-bearing sedimentsof the Blake Ridge, Proc. Ocean Drill. Program, Sci. Results, 164,265–272, 2000.
Wright, J. F., A. E. Taylor, S. R. Dallimore, and F. M. Nixon, Estimating insitu gas hydrate saturation from core temperature observations, JAPEX/JNOC/GSC Mallik 2L-38 gas hydrate research well, in Scientific Resultsfrom JAPEX/JNOC/GSC Mallik 2L-38 Gas Hydrate Research Well,Mackenzie Delta, Northwest Territories, Canada, edited by S. R. Dalli-more, T. Uchida, and T. S. Collett, Bull. Geol. Surv. Can., 544, 101–108,1999.
Xu, W., and C. Ruppel, Predicting the occurrence, distribution, and evolu-tion of methane gas hydrate in porous marine sediments, J. Geophys.Res., 104, 5081–5095, 1999.
�����������D. Goldberg and G. Guerin, Borehole Research Group, Lamont-Doherty