January / 2020 1 Sounding Better! HYPACK® 2020 Development By Judy Bragg GENERAL • Add a file of the world magnetic model into the build for calculations to determine magnetic declination. • “No Project Loaded” message appears in the title bar when you need to load a project. This will be the case if it is the first time you open HYPACK®, or if the most recent project is not currently available (for example, if your project is on a network drive, and the drive is not currently connected). PREPARATION CHARTS • Shift Geo-TIF with the cursor: You can use your cursor to resize, rotate and reposition your image in the HYPACK® Map window display. Typically, you would overlay your image and adjust it to fit existing charts and project file features. • ACOE (Army Corps of Engineers) Buoy catalog server is included in the default list of servers in the Web Maps panel. • Added support for Tile Map Service Web Maps. GEODESY • Time Variable Transformation disabled beyond 2019. New models are required for later calculations. • New Grid: Geocentric Datum of Australia 2020 (GDA2020) • New Geoids: > GEOID18 covers CONUS, Puerto Rico, and the U.S. Virgin Islands and supersedes GEOID12B in these regions. GEOID18 does not cover Alaska, Hawaii, Guam and the Commonwealth of the Northern Mariana Islands (CNMI) where users should continue to use GEOID12B. > AusGeoid2020
Transcript
Sounding Better!
HYPACK® 2020 Development
By Judy Bragg
GENERAL• Add a file of the world magnetic model into the build for calculations to determine
magnetic declination.• “No Project Loaded” message appears in the title bar when you need to load a project.
This will be the case if it is the first time you open HYPACK®, or if the most recent project is not currently available (for example, if your project is on a network drive, and the drive is not currently connected).
PREPARATION
CHARTS• Shift Geo-TIF with the cursor: You can use your cursor to resize, rotate and reposition
your image in the HYPACK® Map window display. Typically, you would overlay your image and adjust it to fit existing charts and project file features.
• ACOE (Army Corps of Engineers) Buoy catalog server is included in the default list of servers in the Web Maps panel.
• Added support for Tile Map Service Web Maps.
GEODESY• Time Variable Transformation disabled beyond 2019. New models are required for
later calculations.• New Grid: Geocentric Datum of Australia 2020 (GDA2020)• New Geoids:
> GEOID18 covers CONUS, Puerto Rico, and the U.S. Virgin Islands and supersedes GEOID12B in these regions. GEOID18 does not cover Alaska, Hawaii, Guam and the Commonwealth of the Northern Mariana Islands (CNMI) where users should continue to use GEOID12B.
> AusGeoid2020
January / 2020 1
ADVANCED CHANNEL DESIGN: MULTISELECTING ZONE FACES
The TIN MODEL and CROSS SECTIONS AND VOLUMES programs can both calculate volumes of user-defined channel zones. CROSS SECTIONS AND VOLUMES calculates the volume in each zone for each section.
You use ADVANCED CHANNEL DESIGN to define the channel zones. In the zones tab, you first name the zones in your channel, then assign each face in the channel file to a zone. ADVANCED CHANNEL DESIGN paints the selected faces with the zone color.
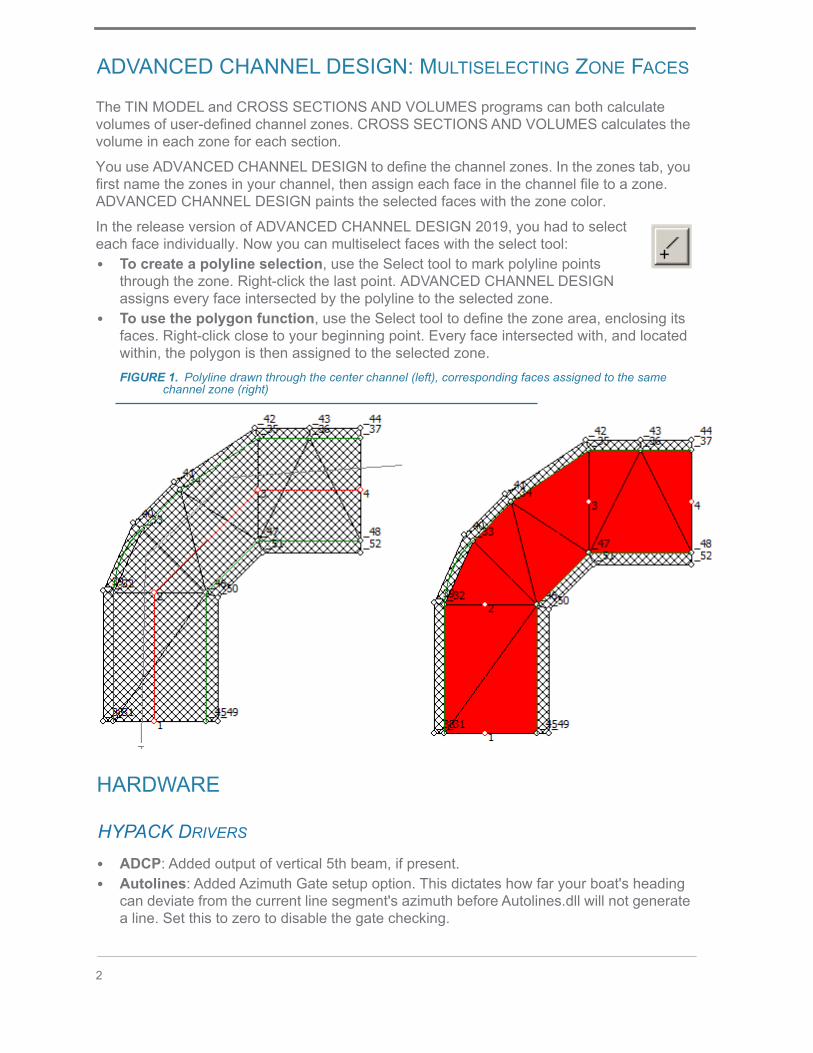
In the release version of ADVANCED CHANNEL DESIGN 2019, you had to select each face individually. Now you can multiselect faces with the select tool:• To create a polyline selection, use the Select tool to mark polyline points
through the zone. Right-click the last point. ADVANCED CHANNEL DESIGN assigns every face intersected by the polyline to the selected zone.
• To use the polygon function, use the Select tool to define the zone area, enclosing its faces. Right-click close to your beginning point. Every face intersected with, and located within, the polygon is then assigned to the selected zone.FIGURE 1. Polyline drawn through the center channel (left), corresponding faces assigned to the same
channel zone (right)
HARDWARE
HYPACK DRIVERS
• ADCP: Added output of vertical 5th beam, if present.• Autolines: Added Azimuth Gate setup option. This dictates how far your boat's heading
can deviate from the current line segment's azimuth before Autolines.dll will not generate a line. Set this to zero to disable the gate checking.
2
• EchoTrac E20: Support for dual frequency data.• Hydrosweep: New Driver! Reads MD50, MD30, and DS systems.• MavLink:
> Buttons disabled until connection is successful.> Status message changes colors depending on connection status: red for
disconnected, yellow for unarmed, green for armed.> Added device controls:
• Added [Start at Nearest Waypoint] sets the nearest waypoint as the first waypoint destination for the boat. This option evaluates all waypoints of all lines.
• Added cruise speed, cruise throttle, turning radius, and waypoint radius controls. Edit the values in the text boxes, then click [Set Params] to send them to the device.
• SeaRobotics: Support for the ERP Target. The ERP X and Y that was last sent to the device is displayed in the Device window. A red square is drawn on the map at the current ERP. Even if the target is deleted the red square persists as it is still the most recent position sent to the device.
• RemoteLogLine: New Driver! Synchronizes Survey between two computers in terms of logging and line functions. > File logging functions: start, end, abort, suspend, resume logging functions
performed from either computer.> Survey line functions: line increment, decrement, swap, select, add, unload
functions performed from either computer.
DREDGEPACK DRIVERS
Numerous custom drivers as contracted.
HYSWEEP® DRIVERS
• Rename Swathplus driver to Bathyswath to match equipment name change.• NORBIT: New Driver! Logs and displays NORBIT water column data.• Klein DSP: When performing match filtering, the depth mode chosen in the side scan
controls, backtracking tab is used in the calculation.• Ping DSP: HYSWEEP® sends file name, and start and end logging commands to the
device via UDP message on port 23842 to the sonar IP address.• R2Sonic 2020:
> Multiple instances of this device now supported.> Supports simultaneous logging of snippets and true pix imagery.
• VLP-16: Multiple instances of this device now supported.
DATA ACQUISITION
SURVEY• Fixed target display issue.
January / 2020 3
SIDE SCAN SURVEY• Side Scan Options merged to one dialog. View Options, Device Selections, Target
Parameters and Side Scan Controls are now merged in one dialog.FIGURE 2. Side Scan Options Dialog
• Targeting improvements:> GeoTiffs are now always slant range corrected. This means that across-track
imagery is at an accurate range from the centerline and geo-referenced.> Support for NOAA Naming convention of JJJ-hhmmssC, where:
JJJ - Julian day number hh - UTC hour mm - minutes ss - seconds C - channel (P for port, S for starboard)
> Option to attach a scale bar to target images (Target Parameters). A scale along the bottom edge of the captured image provides perspective.
FIGURE 3. Sample Range Ruler
4
HYSWEEP®• “MULTIBEAM AUTO-PROCESSING” occurs during the during your survey, but it is
actually an extension of the 64-bit HYSWEEP® EDITOR.• Support for an additional Nadir Depth window, providing
separate displays for helmsman and surveyor.• WATER COLUMN LOGGER:
> Fixed Range for display added to support NORBIT WC. A fixed range of 0 uses the full sonar range.
> Click [Network] to view the number of datagrams received and lost, and the number of transmission errors.
DREDGEPACK®: 3D DREDGE DISPLAY WITH REAL TIME CLOUD
The Real Time Cloud Shared Memory module provides a 3D display of your dredging project. Currently, we can display cutter suction dredges and excavators to show the location of the cutter head or the bucket teeth relative to the water surface and the channel template based on information from the inclinometer or excavator device driver. Used in conjunction with the SURVEY Map and Profile views, the 3D display improves the visualization of your dredge depth and coverage.
FIGURE 4. Cutter Suction Dredge in Real Time Cloud Shows Missed Spots More Clearly Than in the Map Window.
The 3-dimensional display shows increased detail in your dredge surface. If you configure your channel template with some transparency, you can see the dredge surface and channel template together.
Painting a matrix with your dredge cutting tool in Real Time Cloud requires the following conditions:• An dredge matrix enabled in your project and in DREDGEPACK®.• Your HARDWARE setup must have at least two mobiles:
> Typically the first (dredge body) receives your positioning.
January / 2020 5
> The second, positioned relative to the first, calculates the position of the bucket or cutter head using the excavator or inclinometer driver, respectively. • Configure your cutting tool to log depth and paint the matrix.• On a cutter suction dredge, disable the Draft function for the inclinometer driver.• On the Offsets tab, set Relative To the dredge body.
• In the Real Time Cloud Settings dialog, select Capture Matrix. Use the Channel File options to enable the channel file (*.CHN) and configure its color and transparency in the display.
• Real Time Cloud Boat Settings:> DREDGEPACK® draws the entire dredge based on the type of dredge (indicated by
the driver) and the position of the cutter head or bucket. Select the default boat shape option to use the dredge shape built into DREDGEPACK®. Feel free to adjust the size.
> The Enable options determine which mobiles appear in the Real Time Cloud display. Since the entire dredge is drawn based on the position of the cutting tool, that is the only mobile that you should enable. Make sure the Enabled option for the first mobile is unchecked to prevent a second, unnecessary boat shape at the dredge body position.
> The Active options determine the mobile on which Real Time Cloud focuses the display. We typically choose the dredge body.
PROCESSING
64-BIT SINGLE BEAM EDITOR
ADDED EXPORT XYZ OPTIONS
You can save your soundings to one or more XYZ format files. If you are editing dual frequency or multiple transducer data, you must configure the output using the XYZ drop-down list and the One File Per Line option.
The XYZ drop-down list determines which beam or beams the output includes:• Depth n: Individual frequency or beam number.• All Separate: Each frequency or beam number are exported to separate output files.• All Combined: All frequencies or beam numbers are exported to the same output file.
One File Per Line generates one file, or set of files per line according to the XYZ drop-down list; otherwise the editor includes all output soundings to one XYZ file.
The following table, shows how the two options work together to affect the output:
6
TABLE 1. Output Results for 4 Lines of Multitransducer Data with 9 Beams
SUPPORT FLOW VECTOR DATA FROM ADCP.DLL
Added support to draw the flow vector data logged by the ADCP driver (*.ADP) in the Flow window,
FIGURE 5. Sample Flow Vector Window
64-BIT HYSWEEP® EDITOR
MULTIBEAM AUTO-PROCESSING
MULTIBEAM AUTO-PROCESSING is the 64-bit HYSWEEP® EDITOR in an auto-processing mode that enables you to begin the post-processing while you are still logging data in order to reduce the final processing time. Only tools to adjust the display in the Map window are enabled.
Drop-down One File/Line? OutputDepth 1 Yes 4 files: LineName_Depth1.xyz
Depth 1 No 1 file: UserName_Depth1.xyz
All Separate Yes 36 files: LineNameUserName_DepthNumber.xyz
All Separate No 9 files: UserName_DepthNumber.xyz
All Combined Yes 4files: LineName.xyz
All Combined No 1 file: UserName.xyz
January / 2020 7
MULTIBEAM AUTO-PROCESSING runs simultaneously with HYSWEEP® SURVEY. As you close each survey file in SURVEY, MULTIBEAM AUTO-PROCESSING performs initial processing according to user-defined read parameters, then stores the results to a binary, HS2X file in the project Edit folder.
NOTE: MULTIBEAM AUTO-PROCESSING can not process files with both hydrographic and LIDAR data.
The preliminary processing serves two purposes:• Applies initial corrections and filters.• Converts the ASCII, raw data to our binary, edited format for significantly faster loading to
the 64-bit HYSWEEP® EDITOR for final editing.
IMPORTANT: MULTIBEAM AUTO-PROCESSING is not a substitute for manual processing in the 64-bit HYSWEEP® EDITOR.
NEW CUSTOM XYZ EXPORT OPTIONS
• Export Point Flags as Targets• Option to export X, Y, CUBE Depth, CUBE Uncertainty
OTHER IMPROVEMENTS
• Support for NORBIT and Hydrosweep sonar systems. - Soundings and Water Column displays.
• Improved RTK tide calculations in elevation mode.• Kongsberg delayed heave: Support to import and apply.• R2 multifrequency data: Improved handling.• Water column display:
> Fixed Range option for the display replaces (unused) Kongsberg Range. A value of 0 uses the sonar range.
> Network Statistics: Click [Network] to view the Number of datagrams received and lost, and the number of transmission errors.
• Beam Angle Tests: Modifications to assure consistent results between the two tests.
TARGETING AND MOSAICKING• Side Scan Controls dialog update.• Blank Imagery Adjacent to Nadir: In Scanview (stage 2), a green line marks the end of
the user-defined nadir blanking and that area appears blank in the mosaic. When you have a line that overlaps the nadir of another line, use this option to remove the poor quality imagery common in the nadir area.
8
FIGURE 6. Side Scan Options
• Support for Multifrequency Data: When you load multifrequency data, the program reads all frequencies, but you may display one or more at a time. In the Selections tab or the Read Parameters, choose what you want to see first. After the data is loaded, a drop-down list in the toolbar (or a selection in the Multiple Frequencies tab of the View Options dialog) enables you to make a different choice.
FIGURE 7. View Options - Multiple Frequencies Tab
• Suggested Resolution added in the Resolution Calculator
MAGNETOMETER EDITOR
UPDATED INTERFACE
In the updated interface, you can resize and reposition the windows into any layout you want or, in one easy click, pin them to the side of the shell window.
When you pin a window, it “slides out of view” leaving a 0.25 inch (0.5 cm) tab on the side of the window where it is docked. When you want to access the pane, click its tab and it slides into view. When you move your cursor to a different window, HYPACK® knows you have finished in the pinned window and it slides back out of view and out of your way.
January / 2020 9
When you drag the toolbar of any window to reposition the window, the interface displays "landing pads" to indicate where you can dock your window.
MAGNETOMETER EDITOR
SPECIALIZED MARINE INSTRUMENT PROCESSING
Some magnetometers log environmental data in addition to the mag data. In previous releases, you could select only 2 of these values to process in a single session. In HYPACK® 2020, you can process any number. You can examine and edit the data, displaying one or more values at once, in the Profile and Depth Display window graphs and in the numerical presentation in the Spreadsheet.
10
One Profile Window.
The Depth Display window graphs one channel at a time. It used to show the towfish depth. Now you can choose the data displayed by selecting the correct channel.
To read a different value, select the channel in the toolbar and click [Refresh].FIGURE 8. Depth Display
WATER COLUMN PLAYBACKSupport for NORBIT and Hydrosweep sonar systems.
January / 2020 11
UTILITIES
XYZ MANAGER
EXPORT COMBINED OR SEPARATE FILES
Choose whether to export a single, merged XYZ file or a catalog of XYZ files including only soundings remaining after any clipping or filtering you may have done.
FIGURE 9. XYZ LOG File by Date in HYPACK®
FIGURE 10. All File Combined
12
DATE/TIME FILTERS
• Date/Time filters enable you output data including only files whose Date and (optionally) Time properties fall within the user-defined range. The Source Date filter option defaults to the earliest and latest dates of files from your database.
FIGURE 11. Sample Database (left), Filtering the Latest File by Date and Time (right)
FIGURE 12. Filtering the Last File—No Filter (left), Combined with Latest (yellow) Filtered (right)
BORDER TOOL
When you add an XYZ file to the database, the XYZ MANAGER connects the data points to create a TIN Model. It is the perimeter of this model that describes the area covered by the data set.
January / 2020 13
In the Border Tool, you can view the current border for an individual XYZ file, and adjust the parameters by which it is drawn:
FIGURE 13. Border Tool—Max Leg = 200 (left), Max Leg = 100 (right)
ADDITIONAL IMPROVEMENTS
• If only one sounding database is available in the project, it opens automatically. Otherwise, it opens a File Open dialog listing available databases from which to choose.
• Select/Deselect all items in the Database with right-click menu options Enable All and Disable All respectively.
• Provides progress feedback during export: When you Export your data, a progress bar provides feedback, then an “Export Complete” Message appears. Click [OK] and the Export dialog closes.
• Capture TIF Image: You can export a geo-referenced image of the graphical display in the XYZ MANAGER. The program uses the Map window' dimensions for the TIF width and height and stores it, by default, in the project folder. You can display it as a background chart in the Map window or other modules that support chart files.
PLAYBACK RAW DATA
RAW PLAYBACK reads raw (RAW) and your HARDWARE settings to recreate the travel of your vessel in the Map window, drawing a temporary track line.


![HYPACK MAX - Knudsen Eng · 2019-04-18 · HYPACK® MAX sounding data super-imposed on a Microstation DGN file. [DGN file courtesy USACE – Tuscaloosa] Display from HYPACK® MAX’s](https://static.documents.pub/doc/80x56/5e90e9587c4e3f6689675b27/hypack-max-knudsen-eng-2019-04-18-hypack-max-sounding-data-super-imposed-on.jpg)


