Resumo: Um total de 183 amostras de sondagem de sete poços
exploratórios que foram furados através dos membros Lam e Meem da
Formação Madbi, que contém as rochas-fonte dos poços de petróleo do
Blosco 18, Iémen central, foram escolhidas para análise por pirólise
Rock-Eval. A maioria das amostras tem bom a excelente potencial de
geração de petróleo, relativamente aos resultados de PP, PI, HI e TOC.
De uma forma geral, as amostras estudadas dos dois membros tem
valores TOC suficientes com uma média de1.48 wt% e um valor máximo
de 12.34 wt% e um bom potencial petrolífero com uma média de 4.54 kg
HC/ton de rocha e um valor máximo de 44.78 kg HC/ton de rocha. Os
valores de HI da Formação Madbi variam entre 16 a 1114 mg HC/g TOC
com uma média de 273 mg HC/g TOC. Querogénio de tipo II, III e uma
pequena quantidade de I podem ser observados. Estes querogénios são
termicamente maduros e maioritariamente dentro da zona de geração de
hidrocarbonetos. Foram modeladas numa aproximação por simulação
numérica, as histórias térmicas e de soterramento do poço Alif-1,
representativo da área. A concordância entre valores medidos de R0,
usados como parâmetro de calibração, pode ser atingida assumindo uma
erosão de 1100 m do Grupo Tawilah Superior. O fluxo de calor é
maximizado no começo do processo de rifting da bacia no Jurássico
Superior a 90 mW/m2 até 60 mW/m
2.
Palavras-chave: Potencial de hidrocarbonetos, Bacia Sab’atayn,
Jurássico, Iémen.
1Taiz University, Faculty of Applied Sciences, Geology Department, Taiz 6803, Yemen. 2 RWTH Aachen University, Inst. of Geology and Geochemistry of Petroleum and Coal,
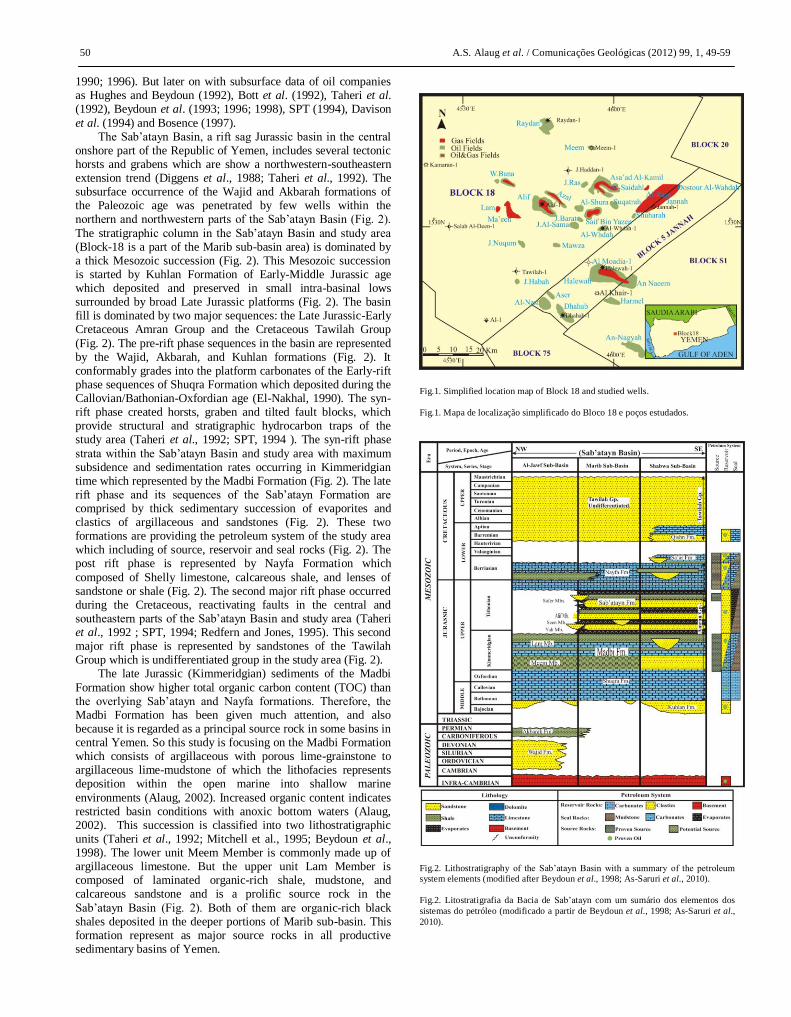
The earliest exploration for hydrocarbons in Yemen commenced in 1961 within the Red Sea coastal region. However, the first commercial discovery was in 1984 in the Block 18, Sab’atayn
Basin in the central part of the Republic of Yemen (Fig. 1). Yemen has entered the era of oil in the summer of 1984 when the former Yemen Hunt Oil Company (YHOC) announced the first commercial discovery of oil in the Alif field (Fig. 1). The well Alif-1 started with a producing rate of 8000 Barrel Per Day (BOPD). Since then several oil and/or gas fields were discovered in Block 18 (Fig. 1). Further development of this block was carried out by construction of a pipeline to the Red Sea. In
September 1986, the production and export of the first oil shipment from Block 18 was executed. In 1987, oil discoveries in several fields in the nearing blocks were announced by Technoexport (former) Russian oil company. In September 1996, oil was discovered in Halewah oilfield, Block 5 (Fig. 1). It was discovered by a consortium of companies operating in this block. In 2003, the Vintage Petroleum Company and the operator of Block S1 announced another commercial oil discovery. Further activity spread to southern and eastern parts of the Republic of
Yemen with a series of discoveries made by different petroleum companies from the early 1990’s until now.
Hydrocarbon exploration activity increased extensively after 1984 and provided considerable amounts of subsurface data, such as the work of Redfern and Jones (1995), Ellis et al. (1996), Beydoun et al. (1996; 1998), Fantozzi (1996), Touché et al. (1997) and Brannan et al. (1999) which allowed a revised synthesis of the basin evolution in Yemen. Only few publications
have addressed the geology of the Sab’atayn Basin as Taheri et al. (1992), Seaborne (1996), Brannan et al. (1999), Csato et al. (2001) and Worden (2005), but no one discuses the source rock evaluation, maturation and hydrocarbon potential of the study area.
2. Geological Setting
The geological evolution of Yemen was driven by the plate motions that broke southern Gondwana apart in the Mesozoic and formed the Gulf of Aden and Red Sea in the Cenozoic. The regional geology of Yemen was established on outcrops studies
by Lamare (1930), Lamare et al. (1930), Wetzel and Morton (1948-1950), GeuKens (1960; 1966), Beydoun (1964; 1966; 1997), Beydoun and Greenwood (1968), El-Nakhal (1987; 1988;
1990; 1996). But later on with subsurface data of oil companies as Hughes and Beydoun (1992), Bott et al. (1992), Taheri et al. (1992), Beydoun et al. (1993; 1996; 1998), SPT (1994), Davison
et al. (1994) and Bosence (1997). The Sab’atayn Basin, a rift sag Jurassic basin in the central
onshore part of the Republic of Yemen, includes several tectonic horsts and grabens which are show a northwestern-southeastern extension trend (Diggens et al., 1988; Taheri et al., 1992). The subsurface occurrence of the Wajid and Akbarah formations of the Paleozoic age was penetrated by few wells within the northern and northwestern parts of the Sab’atayn Basin (Fig. 2).
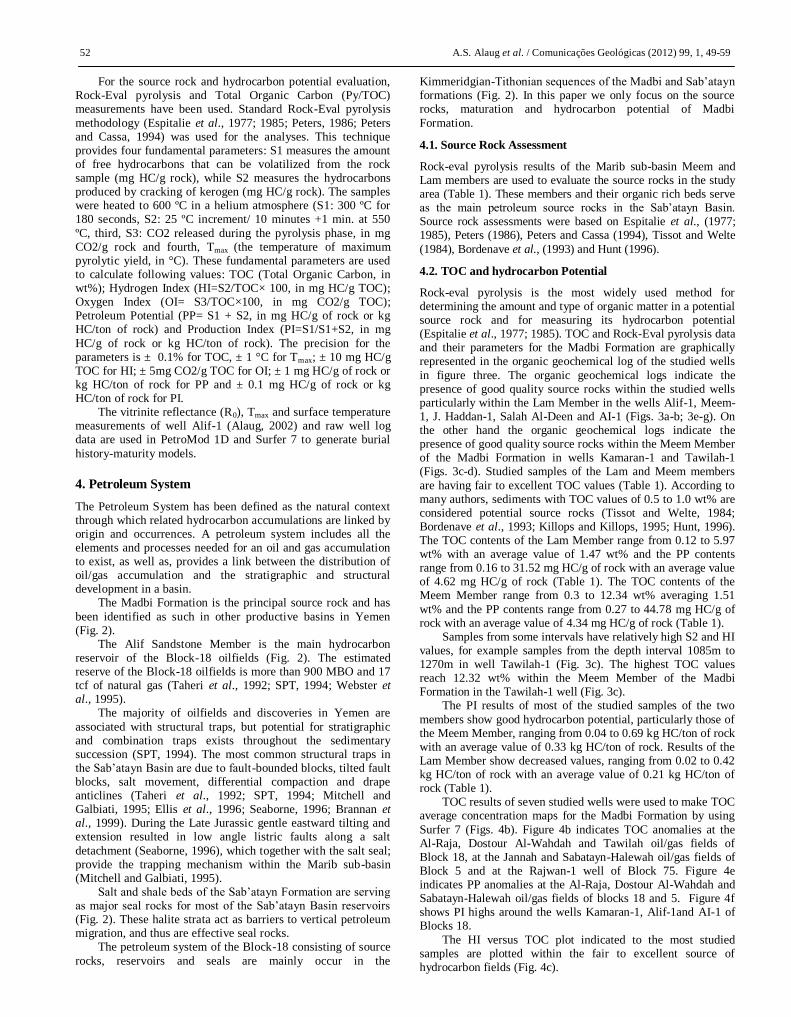
The stratigraphic column in the Sab’atayn Basin and study area (Block-18 is a part of the Marib sub-basin area) is dominated by a thick Mesozoic succession (Fig. 2). This Mesozoic succession is started by Kuhlan Formation of Early-Middle Jurassic age which deposited and preserved in small intra-basinal lows surrounded by broad Late Jurassic platforms (Fig. 2). The basin fill is dominated by two major sequences: the Late Jurassic-Early Cretaceous Amran Group and the Cretaceous Tawilah Group
(Fig. 2). The pre-rift phase sequences in the basin are represented by the Wajid, Akbarah, and Kuhlan formations (Fig. 2). It conformably grades into the platform carbonates of the Early-rift phase sequences of Shuqra Formation which deposited during the Callovian/Bathonian-Oxfordian age (El-Nakhal, 1990). The syn-rift phase created horsts, graben and tilted fault blocks, which provide structural and stratigraphic hydrocarbon traps of the study area (Taheri et al., 1992; SPT, 1994 ). The syn-rift phase
strata within the Sab’atayn Basin and study area with maximum subsidence and sedimentation rates occurring in Kimmeridgian time which represented by the Madbi Formation (Fig. 2). The late rift phase and its sequences of the Sab’atayn Formation are comprised by thick sedimentary succession of evaporites and clastics of argillaceous and sandstones (Fig. 2). These two formations are providing the petroleum system of the study area which including of source, reservoir and seal rocks (Fig. 2). The post rift phase is represented by Nayfa Formation which
composed of Shelly limestone, calcareous shale, and lenses of sandstone or shale (Fig. 2). The second major rift phase occurred during the Cretaceous, reactivating faults in the central and southeastern parts of the Sab’atayn Basin and study area (Taheri et al., 1992 ; SPT, 1994; Redfern and Jones, 1995). This second major rift phase is represented by sandstones of the Tawilah Group which is undifferentiated group in the study area (Fig. 2).
The late Jurassic (Kimmeridgian) sediments of the Madbi
Formation show higher total organic carbon content (TOC) than the overlying Sab’atayn and Nayfa formations. Therefore, the Madbi Formation has been given much attention, and also because it is regarded as a principal source rock in some basins in central Yemen. So this study is focusing on the Madbi Formation which consists of argillaceous with porous lime-grainstone to argillaceous lime-mudstone of which the lithofacies represents deposition within the open marine into shallow marine
environments (Alaug, 2002). Increased organic content indicates restricted basin conditions with anoxic bottom waters (Alaug, 2002). This succession is classified into two lithostratigraphic units (Taheri et al., 1992; Mitchell et al., 1995; Beydoun et al., 1998). The lower unit Meem Member is commonly made up of argillaceous limestone. But the upper unit Lam Member is composed of laminated organic-rich shale, mudstone, and calcareous sandstone and is a prolific source rock in the
Sab’atayn Basin (Fig. 2). Both of them are organic-rich black shales deposited in the deeper portions of Marib sub-basin. This formation represent as major source rocks in all productive sedimentary basins of Yemen.
Fig.1. Simplified location map of Block 18 and studied wells.
Fig.1. Mapa de localização simplificado do Bloco 18 e poços estudados.
Fig.2. Lithostratigraphy of the Sab’atayn Basin with a summary of the petroleum
system elements (modified after Beydoun et al., 1998; As-Saruri et al., 2010).
Fig.2. Litostratigrafia da Bacia de Sab’atayn com um sumário dos elementos dos
sistemas do petróleo (modificado a partir de Beydoun et al., 1998; As-Saruri et al.,
2010).
Source Rock, Maturation and Hydrocarbon Potential 51
3. Materials and Methods
In this paper, maturation and hydrocarbon potential of the Block 18, Sab’atayn Basin, central Republic of Yemen are evaluated on the basis of organic geochemical analysis, as well as, PetroMod
modeling and its interpretation. A total of 183 core and cutting samples were selected and
prepared for organic geochemical analysis of the study area by the corresponding author (Alaug, 2002). These core and cutting samples of the Meem and Lam members of the Madbi Formation (Amran Group) come from seven onshore exploratory wells (Table 1, Figs.1-2). 129 samples of them come from the Lam Member and 54 samples of the Meem Member (Table 1, Fig. 2). These studied wells are Alif-1, Tawilah-1, AI-1, Meem-1, Salah
Al-Deen, J. Haddan-1 and Kamaran-1 (Fig. 1).
Table 1. Organic geochemical rock pyrolysis/TOC results of the studied wells.
Tabela 1. Resultados geoquímicos de pirólise/TOC de rocha dos poços estudados.
For the source rock and hydrocarbon potential evaluation, Rock-Eval pyrolysis and Total Organic Carbon (Py/TOC) measurements have been used. Standard Rock-Eval pyrolysis
methodology (Espitalie et al., 1977; 1985; Peters, 1986; Peters and Cassa, 1994) was used for the analyses. This technique provides four fundamental parameters: S1 measures the amount of free hydrocarbons that can be volatilized from the rock sample (mg HC/g rock), while S2 measures the hydrocarbons produced by cracking of kerogen (mg HC/g rock). The samples were heated to 600 ºC in a helium atmosphere (S1: 300 ºC for 180 seconds, S2: 25 ºC increment/ 10 minutes +1 min. at 550
ºC, third, S3: CO2 released during the pyrolysis phase, in mg CO2/g rock and fourth, Tmax (the temperature of maximum pyrolytic yield, in °C). These fundamental parameters are used to calculate following values: TOC (Total Organic Carbon, in wt%); Hydrogen Index (HI=S2/TOC× 100, in mg HC/g TOC); Oxygen Index (OI= S3/TOC×100, in mg CO2/g TOC); Petroleum Potential (PP= S1 + S2, in mg HC/g of rock or kg HC/ton of rock) and Production Index (PI=S1/S1+S2, in mg
HC/g of rock or kg HC/ton of rock). The precision for the parameters is ± 0.1% for TOC, ± 1 °C for Tmax; ± 10 mg HC/g TOC for HI; ± 5mg CO2/g TOC for OI; ± 1 mg HC/g of rock or kg HC/ton of rock for PP and ± 0.1 mg HC/g of rock or kg HC/ton of rock for PI.
The vitrinite reflectance (R0), Tmax and surface temperature measurements of well Alif-1 (Alaug, 2002) and raw well log data are used in PetroMod 1D and Surfer 7 to generate burial
history-maturity models.
4. Petroleum System
The Petroleum System has been defined as the natural context through which related hydrocarbon accumulations are linked by origin and occurrences. A petroleum system includes all the elements and processes needed for an oil and gas accumulation to exist, as well as, provides a link between the distribution of oil/gas accumulation and the stratigraphic and structural development in a basin.
The Madbi Formation is the principal source rock and has
been identified as such in other productive basins in Yemen (Fig. 2).
The Alif Sandstone Member is the main hydrocarbon reservoir of the Block-18 oilfields (Fig. 2). The estimated reserve of the Block-18 oilfields is more than 900 MBO and 17 tcf of natural gas (Taheri et al., 1992; SPT, 1994; Webster et al., 1995).
The majority of oilfields and discoveries in Yemen are
associated with structural traps, but potential for stratigraphic and combination traps exists throughout the sedimentary succession (SPT, 1994). The most common structural traps in the Sab’atayn Basin are due to fault-bounded blocks, tilted fault blocks, salt movement, differential compaction and drape anticlines (Taheri et al., 1992; SPT, 1994; Mitchell and Galbiati, 1995; Ellis et al., 1996; Seaborne, 1996; Brannan et al., 1999). During the Late Jurassic gentle eastward tilting and extension resulted in low angle listric faults along a salt
detachment (Seaborne, 1996), which together with the salt seal; provide the trapping mechanism within the Marib sub-basin (Mitchell and Galbiati, 1995).
Salt and shale beds of the Sab’atayn Formation are serving as major seal rocks for most of the Sab’atayn Basin reservoirs (Fig. 2). These halite strata act as barriers to vertical petroleum migration, and thus are effective seal rocks.
The petroleum system of the Block-18 consisting of source
rocks, reservoirs and seals are mainly occur in the
Kimmeridgian-Tithonian sequences of the Madbi and Sab’atayn formations (Fig. 2). In this paper we only focus on the source rocks, maturation and hydrocarbon potential of Madbi
Formation.
4.1. Source Rock Assessment
Rock-eval pyrolysis results of the Marib sub-basin Meem and Lam members are used to evaluate the source rocks in the study area (Table 1). These members and their organic rich beds serve as the main petroleum source rocks in the Sab’atayn Basin. Source rock assessments were based on Espitalie et al., (1977; 1985), Peters (1986), Peters and Cassa (1994), Tissot and Welte
(1984), Bordenave et al., (1993) and Hunt (1996).
4.2. TOC and hydrocarbon Potential
Rock-eval pyrolysis is the most widely used method for determining the amount and type of organic matter in a potential source rock and for measuring its hydrocarbon potential (Espitalie et al., 1977; 1985). TOC and Rock-Eval pyrolysis data and their parameters for the Madbi Formation are graphically represented in the organic geochemical log of the studied wells
in figure three. The organic geochemical logs indicate the presence of good quality source rocks within the studied wells particularly within the Lam Member in the wells Alif-1, Meem-1, J. Haddan-1, Salah Al-Deen and AI-1 (Figs. 3a-b; 3e-g). On the other hand the organic geochemical logs indicate the presence of good quality source rocks within the Meem Member of the Madbi Formation in wells Kamaran-1 and Tawilah-1 (Figs. 3c-d). Studied samples of the Lam and Meem members
are having fair to excellent TOC values (Table 1). According to many authors, sediments with TOC values of 0.5 to 1.0 wt% are considered potential source rocks (Tissot and Welte, 1984; Bordenave et al., 1993; Killops and Killops, 1995; Hunt, 1996). The TOC contents of the Lam Member range from 0.12 to 5.97 wt% with an average value of 1.47 wt% and the PP contents range from 0.16 to 31.52 mg HC/g of rock with an average value of 4.62 mg HC/g of rock (Table 1). The TOC contents of the Meem Member range from 0.3 to 12.34 wt% averaging 1.51
wt% and the PP contents range from 0.27 to 44.78 mg HC/g of rock with an average value of 4.34 mg HC/g of rock (Table 1).
Samples from some intervals have relatively high S2 and HI values, for example samples from the depth interval 1085m to 1270m in well Tawilah-1 (Fig. 3c). The highest TOC values reach 12.32 wt% within the Meem Member of the Madbi Formation in the Tawilah-1 well (Fig. 3c).
The PI results of most of the studied samples of the two
members show good hydrocarbon potential, particularly those of the Meem Member, ranging from 0.04 to 0.69 kg HC/ton of rock with an average value of 0.33 kg HC/ton of rock. Results of the Lam Member show decreased values, ranging from 0.02 to 0.42 kg HC/ton of rock with an average value of 0.21 kg HC/ton of rock (Table 1).
TOC results of seven studied wells were used to make TOC average concentration maps for the Madbi Formation by using
Surfer 7 (Figs. 4b). Figure 4b indicates TOC anomalies at the Al-Raja, Dostour Al-Wahdah and Tawilah oil/gas fields of Block 18, at the Jannah and Sabatayn-Halewah oil/gas fields of Block 5 and at the Rajwan-1 well of Block 75. Figure 4e indicates PP anomalies at the Al-Raja, Dostour Al-Wahdah and Sabatayn-Halewah oil/gas fields of blocks 18 and 5. Figure 4f shows PI highs around the wells Kamaran-1, Alif-1and AI-1 of Blocks 18.
The HI versus TOC plot indicated to the most studied samples are plotted within the fair to excellent source of hydrocarbon fields (Fig. 4c).
Source Rock, Maturation and Hydrocarbon Potential 53
Fig.3a. Organic geochemical log summarizing Rock-Eval pyrolysis/TOC results for
the Madbi Formation of well J. Haddan-1.
Fig.3a. Log de geoquímica orgânica resumidos de Rock-Eval pirólise/TOC para a
Formação Madbi do poço J. Haddan-1.
Fig.3b. Organic geochemical log of well Alif-1.
Fig.3b. Geoquímica orgânica do poço Alif-1.
Fig.3c. Organic geochemical log of well Tawilah-1.
Fig.3c. Geoquímica orgânica do poço Tawilah-1.
Fig.3d. Organic geochemical log of well Kamaran-1.
Fig.3g. Organic geochemical log of well Salah Al-Deen.
Fig.3g. Geoquímica orgânica do poço Salah Al-Deen.
Fig.4a. Plot of PP versus TOC displaying the generation potential of the studied samples.
Fig.4a. Projecção de PP versus TOC mostrando o potencial de geração das amostras
estudadas.
Fig.4b. Average TOC concentration map of the Madbi Formation in the study area.
Fig.4b. Mapa das médias das concentrações de TOC da Formação Madbi na área
estudada.
0
150
300
450
600
0 0.5 1 1.5 2
Hy
dro
gen
In
dex
(H
I)
TOC (wt%)
Alif-1
Tawilah-1
Meem-1
J.Haddan-1
Kamaran-1
AI-1
Salah Al-Deen-1
Poor SourceField
FairSource Field
GoodSource Field
ExcellentSource Field
Fig.4c. Plot of HI versus TOC showing of hydrocarbon source potential.
Fig.4c. Projecção de HI versus TOC mostrando o potencial da fonte de
hidrocarbonetos.
4.3. Kerogen type and maturation
In general, the Tmax value interval is narrow for organic material
of kerogen type I (organic matter from algae), is wider for kerogen type II (mixed marine organic matter) and much wider for kerogen type III (terrestrial organic matter) due to increasing molecular complexity (Tissot et al., 1987). The maturation window for oil and condensate/wet gas generation from organic matter of kerogen type II ranges from 430 to 470 °C within the catagenesis stage. Organic matter of kerogen type III may generate wet/dry gas within the early stage of metagenesis,
however, generation of dry gas is associated with pyrolysis temperatures of 470 °C to 500 °C according to Espitalie et al. (1985), Tissot et al. (1987), Peters (1986), Peters and Cassa (1994), Bordenave (1993), Killops and Killops (1995) and Hunt (1996). Plots of HI versus Tmax and HI versus OI show that most studied samples are dominated by kerogen types II and III and less by type I (Figs. 5a).
HI values of the Madbi Formation range from 16 to 1114 mg HC/g TOC with an average value of 273 mg HC/g TOC (Table
1). HI values of the Lam Member are greater than those of the Meem Member which range from 40 to 1114 mg HC/g TOC with an average value of 291 mg HC/g TOC. On the other hand HI values of the Meem Member range from 15 to 690 mg HC/g TOC with an average value of 184.8 mg HC/g TOC and indicate the presence of kerogen types II and III. Kerogen type II content is greater than type III in the analysed samples of the Lam Member whereas kerogen type III content is greater than type II
in the analysed samples of the Meem Member. The high values of HI within the depth interval between 1058m and 1270m of well Tawilah-1 indicate kerogen type I (Figs. 5a). High HI values are also recorded at depths of 2058m-2060m, 2178m, 2282m, 2385m, 2605m, 2747m and 2800m-2817m of well J. Haddan-1 and within the depth interval between1800m-1850m of well AI-
Source Rock, Maturation and Hydrocarbon Potential 55
1 (Table 1; Figs. 3a-g). These intervals of high HI values from three wells indicate to kerogen type I.
Tmax results show that most of the studied samples of the two
members are within the catagenesis stage, particularly those of the Lam Member, as they range from 400 to 482 °C with an average value of 436.34 °C. Samples of the Meem Member vary between the immature and the peak of the mature stage and range from 224 to 474 °C with an average value of 423.91 °C (Table 1, Figs. 5a-b).
Fig.5a. Plot of HI versus Tmax indicating kerogen types and maturation stages.
Fig.5a. Projecção de HI versus Tmax indicando tipos de querogénio e estágios de
maturação.
Fig.5b. Average Tmax concentration of the Madbi Fm. in the study area.
Fig.5b. Concentração média de Tmax da F. Madbi na área estudada.
The Tmax results of the studied wells were used to generate a map of the Tmax distribution in the study area (Fig. 5b). This figure indicates anomalies of Tmax at the Raydan, Meem and
As’ad Al-Kaml oil/gas fields in the northern and southwestern part of Block-18 (at AI-1 Well) and in the southern part of block 5 down to the to An-Nagyah oilfield in Block S-1.
4.4. Generation Potential
The generation potential (GP) of the studied Madbi Formation samples is represented in organic geochemical logs (Figs. 3a-g). These organic geochemical logs indicate that sufficient organic matter is preserved within the Lam and Meem members of the
Madbi Formation to qualify them as potential source rocks within the Marib sub-basin.
Most of the studied samples of these two members have good TOC values with an average value of 1.48 wt%, a maximum value of 12.34 wt%, good petroleum potential contents averaging 4.54 kg HC/ton of rock and a maximum value of 44.78 kg HC/ton of rock (Table 1; Fig. 4a).
In general, hydrocarbon generation depends on three
parameters, including good quantity and quality of organic matter and maturation, to generate hydrocarbons. The data obtained in this study shows these attributes: high contents of type II kerogen in the studied samples that are at the peak of oil generation. This is reflected by using a Tmax versus PI plot (Langford and Blance-Valleron, 1990; Hunt, 1996) showing that the studied samples from the Lam and Meem members are within the hydrocarbon generation zone (Fig. 5c).
Fig.5c. GP plot of Tmax versus PI showing that nearly most of the studied samples
are located within the hydrocarbon generating zone.
Fig.5c. Projecção GP da Tmax versus PI mostrando que a maioria das amostras
estudadas estão localizadas na zona de geração de hidrocarbonetos.
Results of generation potential are represented in diagrams of HI versus Tmax and Tmax versus PI (Figs. 5a; 5c). These plots indicate the presence of kerogen types II, III and less amount of kerogen type I which are mostly thermal mature and have potential to generate oil and gas. Hydrocarbon expulsion from the Madbi Formation source rocks may have commenced
during the Early Cretaceous and continued until the Tertiary associated to the Red Sea and Gulf of Aden rifting and volcanism events during this time.
5. Modelling Results
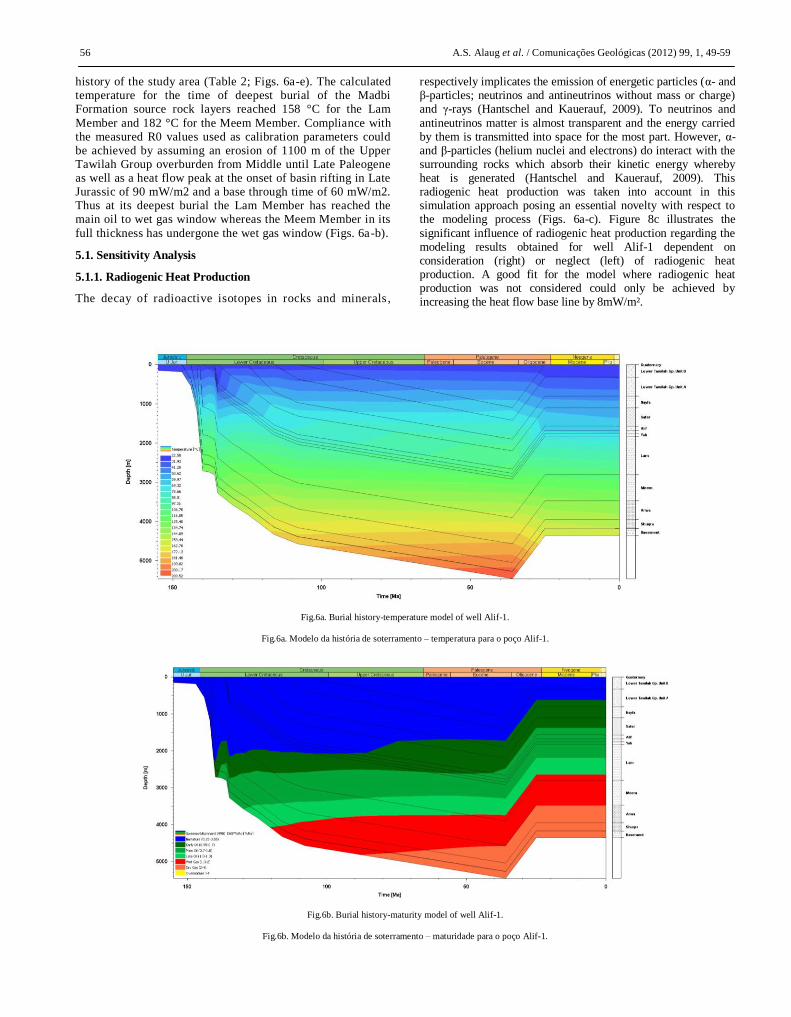
The R0, subsurface temperature and log data of well Alif-1, Block 18 were used to calibrate the maturity and burial
history of the study area (Table 2; Figs. 6a-e). The calculated temperature for the time of deepest burial of the Madbi Formation source rock layers reached 158 °C for the Lam
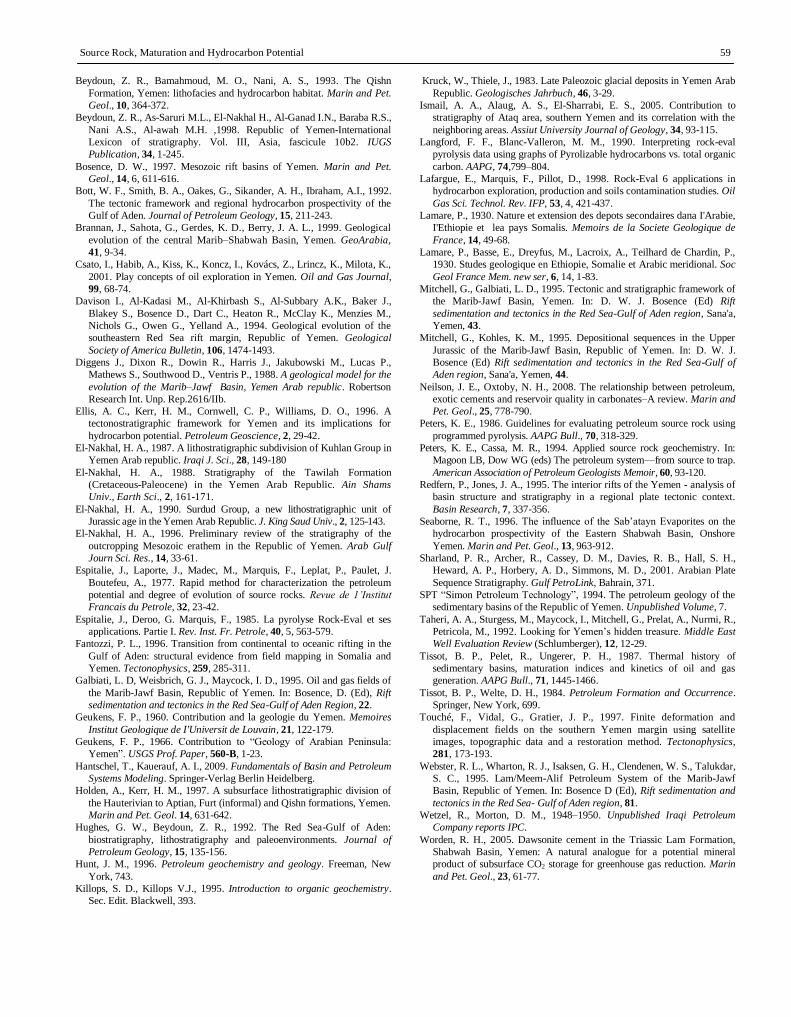
Member and 182 °C for the Meem Member. Compliance with the measured R0 values used as calibration parameters could be achieved by assuming an erosion of 1100 m of the Upper Tawilah Group overburden from Middle until Late Paleogene as well as a heat flow peak at the onset of basin rifting in Late Jurassic of 90 mW/m2 and a base through time of 60 mW/m2. Thus at its deepest burial the Lam Member has reached the main oil to wet gas window whereas the Meem Member in its
full thickness has undergone the wet gas window (Figs. 6a-b).
5.1. Sensitivity Analysis
5.1.1. Radiogenic Heat Production
The decay of radioactive isotopes in rocks and minerals ,
respectively implicates the emission of energetic particles (α- and β-particles; neutrinos and antineutrinos without mass or charge) and γ-rays (Hantschel and Kauerauf, 2009). To neutrinos and
antineutrinos matter is almost transparent and the energy carried by them is transmitted into space for the most part. However, α- and β-particles (helium nuclei and electrons) do interact with the surrounding rocks which absorb their kinetic energy whereby heat is generated (Hantschel and Kauerauf, 2009). This radiogenic heat production was taken into account in this simulation approach posing an essential novelty with respect to the modeling process (Figs. 6a-c). Figure 8c illustrates the
significant influence of radiogenic heat production regarding the modeling results obtained for well Alif-1 dependent on consideration (right) or neglect (left) of radiogenic heat production. A good fit for the model where radiogenic heat production was not considered could only be achieved by increasing the heat flow base line by 8mW/m².
Fig.6a. Burial history-temperature model of well Alif-1.
Fig.6a. Modelo da história de soterramento – temperatura para o poço Alif-1.
Fig.6b. Burial history-maturity model of well Alif-1.
Fig.6b. Modelo da história de soterramento – maturidade para o poço Alif-1.
Source Rock, Maturation and Hydrocarbon Potential 57
Table 2. Vitrinite reflectance and Tmax results of well Alif-1.
Tabela 2. Reflectância da vitrinite e resultados de Tmax do poço Alif-1.
5.1.2. Basement Thickness
Due to the fact that mostly only little or no exact information about the basement thickness is available this parameter frequently underlies assumptions or interpolations and should be considered highly speculative. However, figure 6c reveals that the variation of basement thickness with its according internal
radiogenic heat production involves only minor neglectable impacts on modeling results even though the basement thickness has been increased significantly from 183 m to 1000 m in this example.
5.1.3. Erosion
The process of erosion which is mostly accompanied by inversion or uplift events is of crucial importance for the trend of the coalification gradient. While the variation of
erosional thicknesses poses a common approach of calibrating numerical models the exact amount still remains speculative. In order to test the sensitivity regarding erosion the amount of 1100m erosional thickness has been splitted into several events according to known unconformities (Top Tawilah Group, Top Nayfa Formation, Top Madbi Formation and Top Kuhlan Formation). Cretaceous and Tertiary sediments were eroded after uplift related to the Red Sea rifting which has
been estimated a 1000m in the Marib sub-basin (Mitchell and Galbiati, 1995). Figure 6d displays that the splitting of the erosional thickness results in a declined calibration match. A good fit between measured and calculated R0 values would require an additional major increase of erosion thickness and/or heat flow.
5.1.3. Heat Flow
The heat flow is one of the most essential parameters affecting the temperature gradient of a numerical model (Hantschel and
Kauerauf, 2009). For well Alif-1 a paleo heat flow having its peak during Late Jurassic (90 mW/m²) with a base line of 60 mW/m² has been applied successfully. This peak relates to the initial rifting event starting the basin development (Fig. 6e). Since calibration values are only present for the post-rift basin fill the heat flow peak does not influence the model calibration and only displays the characteristic minimum heat flow regime of a rifting event (90-115 mW/m²) (Figs. 6c-e).
Fig.6c-1, 6c-2. Modeling results of well Alif1 for a basement thickness of 183m
(left) and 1000m (right).
Fig.6c-1, 6c-2. Resultados da modelação do poço Alif1 para uma espessura de soco
Fig.6d-1, 6d-2. Modeling results of well Alif-1 for a single erosion event of 1100m
(left) and 1100m splitted into several events (right).
Fig.6d-1, 6d-2. Resultados da modelação do poço Alif1 para um único evento de
erosão a 1100m (esquerda) e 1100m dividido em vários eventos (direita).
Fig.6e. Paleo heat flow through time.
Fig.6e. Paleo-fluxo de calor ao longo do tempo.
6. Conclusion
Our data of Rock-Eval pyrolysis analysis of 183 core and cutting
samples of the Lam and Meem members in the Madbi Formation (Kimmeridgian) from seven wells and basin modeling results in the Block 18, Sab’atayn Basin, central Yemen, allowed the following conclusions to be drawn:
1. Most of the studied samples of the two members have good TOC values with an average value of 1.48 wt%, a maximum value of 12.34 wt% and good PP contents with an average value of 4.54 kg HC/ton of rock and a maximum value of
44.78 kg HC/ton of rock. The TOC contents of the Lam Member range from 0.12 to 5.97 wt% with an average value of 1.47 wt% and the PP contents range from 0.16 to 31.52 kg HC/ton of rock with an average value of 4.62 kg HC/ton of rock. The TOC contents of the Meem Member range from 0.3 to 12.34 wt% with an average value of 1.51 wt% and the PP contents range from 0.27 to 44.78 kg HC/ton of rock with an average value of 4.34 kg HC/ton of rock.
2. PI results show that most of the studied samples of the two members are good, particularly those of the Meem Member ranging from 0.04 to 0.69 kg HC/ton of rock with an average value of 0.33 kg HC/ton of rock. The Lam Member´s decreased PI ranges from 0.02 to 0.42 kg HC/ton of rock with an average value of 0.21 kg HC/ton of rock.
3. Tmax results show that most of the studied samples of the two members are within the mature stage (catagenesis stage),
particularly those of the Lam Member ranging from 400 to 482 °C with an average value of 436.34 °C. The samples of the Meem Member are immature to late-mature with Tmax ranging from 224 to 474 °C with an average value of 423.91 °C.
4. HI values of the Madbi Formation range from 16 to 1114 mg HC/g TOC with an average value of 273 mg HC/g TOC. According to the HI and OI results the kerogen type II content is greater than type III in the Lam Member. The Meem Member shows kerogen type III contents being greater than type
II. 5. Basin modeling results show the calculated
temperatures for the time of deepest burial of the Madbi Formation source rock layers reaching 158 °C for the Lam Member and 182 °C for the Meem Member. The R0 data and
maturity modeling results indicate that the Lam Member has reached the main oil to wet gas window whereas the Meem Member in its full thickness has undergone the wet gas window.
Acknowledgements
The first author thanks the Petroleum Exploration and Production Authority-Yemen (PEPA), former Yemen Hunt Oil Company
(YHOC) for providing core and cutting samples as well as raw data upon which the present work was carried out. The authors are deeply thanked to Dr. Telmo M. Bento dos Santos, Editor of Comunicações Geológicas, and both anonymous reviewers.
References
Alaug, A. S., 2002. Source Rocks Evaluation and Palynofacies of Late
Jurassic-Early Cretaceous Succession of Marib-Shabwah Basin, Republic
of Yemen. Unpublished PhD Thesis, University of Baghdad-Iraq, 295.
Al-Dabbagh, M. E., 2011. Effect of tectonic prominence and growth of the
Arabian shield on Paleozoic sandstone successions in Saudi Arabia.
Arab. J. Geosci..
Al-Thour, K. A., 1997. Facies sequences of the Middle-Upper Jurassic
carbonate platform (Amran Group) in the Sana’a region, Republic of
Yemen. Marin and Pet. Geol., 14, 6, 643-660.
Al-Wosabi, M., Wasel, S., 2010. Lithostratigraphic subdivision of the
Kuhlan Formation in Yemen. Arab. J. Geosci..
As-Saruri, M. L., Sorkhabi, R., Baraba, R., 2010. Sedimentary basins of
Yemen: their tectonic development and lithostratigraphic cover. Arab. J.
Geosci..
Behar, F., Beaumont, V., De B Penteado, H. L., 2001. Rock-Eval 6
technology: performances and developments. Oil Gas Sci. Technol. Rev.
IFP, 56, 2, 11-134.
Beydoun, Z. R., 1964. The stratigraphy and structure of the Eastern Aden
Protectorate. Overseas Geology. Mineral Resources Bull. Supp., 5, 1-107.
Beydoun, Z. R., 1997. Introduction to the revised Mesozoic stratigraphy and
nomenclature for Yemen. Marin and Pet. Geol., 14, 617-629.
Beydoun, Z. R., Greenwood, J. E, 1968. Aden Protectorate and Dhufar. In:
Asie, L. Dubertret, (Eds) Lexique Stratigraphy International. CNRS,
Paris, III, 1062.
Beydoun, Z. R., As-Saruri, M. L., Baraba, R. S., 1996. Sedimentary basins
of the Republic of Yemen: their structural evolution and geological