82
SOUTH ASIA ECONOMIC FOCUS SPRING 2017 Globalization Backlash

SOUTH ASIA ECONOMIC FOCUS SPRING 2017
Globalization Backlash
© 2017 International Bank for Reconstruction and Development / The World Bank1818 H Street NW, Washington DC 20433Telephone: 202-473-1000; Internet: www.worldbank.orgSome rights reserved1 2 3 4 20 19 18 17 This work is a product of the staff of The World Bank with external contributions. The findings, interpretations, and conclusions expressed in this work do not necessarily reflect the views of The World Bank, its Board of Executive Directors, or the governments they represent. The World Bank does not guarantee the accuracy of the data included in this work. The boundaries, colors, denominations, and other information shown on any map in this work do not imply any judgment on the part of The World Bank concerning the legal status of any territory or the endorsement or acceptance of such boundaries.Nothing herein shall constitute or be considered to be a limitation upon or waiver of the privileges and immunities of The World Bank, all of which are specifically reserved.
Rights and Permissions
This work is available under the Creative Commons Attribution 3.0 IGO license (CC BY 3.0 IGO) http://creativecommons.org/licenses/by/3.0/igo. Under the Creative Commons Attribution license, you are free to copy, distribute, transmit, and adapt this work, including for commercial purposes, under the following conditions:Attribution—Please cite the work as follows: World Bank. 2017. “Globalization Backlash.” South Asia Economic Focus (April), Washington, DC: World Bank. Doi: 10.1596/978-1-4648-1095-4. License: Creative Commons Attribution CC BY 3.0 IGOTranslations—If you create a translation of this work, please add the following disclaimer along with the attribution: This translation was not created by The World Bank and should not be considered an official World Bank translation. The World Bank shall not be liable for any content or error in this translation.Adaptations—If you create an adaptation of this work, please add the following disclaimer along with the attribution: This is an adaptation of an original work by The World Bank. Views and opinions expressed in the adaptation are the sole responsibility of the author or authors of the adaptation and are not endorsed by The World Bank.Third-party content—The World Bank does not necessarily own each component of the content contained within the work. The World Bank therefore does not warrant that the use of any third-party-owned individual component or part contained in the work will not infringe on the rights of those third parties. The risk of claims resulting from such infringement rests solely with you. If you wish to re-use a component of the work, it is your responsibility to determine whether permission is needed for that re-use and to obtain permission from the copyright owner. Examples of components can include, but are not limited to, tables, figures, or images.All queries on rights and licenses should be addressed to World Bank Publications, The World Bank Group, 1818 H Street NW, Washington, DC 20433, USA; e-mail: [email protected] (electronic): 978-1-4648-1095-4DOI: 10.1596/978-1-4648-1095-4
Cover photo: © Mandar Deodhar / India TodayCover design: aejandro espinosa/sonideas.com
SOUTH ASIA ECONOMIC FOCUS SPRING 2017
Globalization backlash

This report is a joint product of the South Asia Regional Chief Economist office (SARCE) and the Macro and Fiscal Management Global Practice (MFM). Its preparation was led by Robert Beyer (Economist) under
the oversight of Martin Rama (Chief Economist, South Asia Region), with substantive contributions by Muhammad Faisal Baig, Martin Melecky, and Yan (Sarah) Xu (all with SARCE). The report greatly benefitted from inputs by Boaz Nandwa, Temel Taskin and other colleagues in the Development Economics Prospects Group (DECPG) under the supervision of Ayhan Kose (Director DECPG). Csilla Lakatos (DECPG), Maryla Maliszewska (Trade & Competitiveness Global Practice), and Hiau Looi Kee (Development Economics Research Group) undertook analyses that enriched the report crucially. We are grateful to Enrique Blanco Armas, Frederico Gil Sander, Volker Treichel and Ralph Van Doorn (all with MFM) and Jose Guilherme, Esperanza Lasagabaster, Sanjay Kathuria, Ruchita Manghnani, Michele Ruta, and Sebastian Saez (all with T&C) for insightful comments and suggestion, as well as to Rupa Duttagupta and Aqip Aslam (both with International Monetary Fund) for the sharing of macro modelling code. The country briefs were prepared by Kishan Abeygunawardana, Damir Cosic, Sudyumna Dahal, Adnan Ghumann, Zahid Hussain, Tenzin Lhaden, Yoichiro Ishihara, Mohammad Omar Joya, Frederico Gil Sander, Smriti Seth, and Ralph Van Doorn, under the supervision of Manuela Francisco (Practice Manager, MFM). Alejandro Espinosa at Sonideas was responsible for the layout, design and typesetting of the report, Alexander Ferguson (Senior Manager, South Asia External Communications), Yann Doignon and Joe Qian coordinated its dissemination, and Neelam Chowdhry provided administrative support. Special thanks go to Markus Kitzmuller (MFM) who had led the production of the report since its inception in 2013 and arranged a smooth handover of the task.
South Asia as used in this report includes Afghanistan, Bangladesh, Bhutan, India, Maldives, Nepal, Pakistan and Sri Lanka.
The cutoff date for this report was April 13, 2017.
South Asia Chief Economist OfficeMacro and Fiscal Management Global Practice
SOUTH ASIA ECONOMIC FOCUS SPRING 2017GLOBALIZATION BACKLASH
v
Table of ContentsRecent economic developments 1
World growth is low but turning around 1South Asia again outperforms all other regions 4Inflation in South Asia slowed down 8Current and capital accounts are for the most part in order 13Fiscal balances and debt levels remain a concern 15
South Asia economic outlook 19
Globalization backlash 25Global trade is under threat 26Should South Asia worry? 26Gains from trade diversion 29Gains from faster global growth 35Seize the opportunity 37
South Asia country briefs 43Afghanistan 44Bangladesh 47Bhutan 50India 52Maldives 54Nepal 57Pakistan 60Sri Lanka 63
South Asia at a glance 66Notes 68
SOUTH ASIA ECONOMIC FOCUS SPRING 2017GLOBALIZATION BACKLASH
vii

Recent economic developments
South Asia remains the fastest growing region in the world. With a strong performance in the east-ern part of the region – in particular in Bhutan, Ban-gladesh and India – the region defied disappoint-ing world growth in 2016. Inflation slowed down in the second half of 2016, mainly due to lower food prices, but appears to be turning up again. Despite recent real exchange rate appreciation, current ac-count balances are mostly in order throughout the region. After a sharp decline triggered by lower oil prices, remittance inflows are stabilizing in most countries and international reserves are mostly at comfortable levels. Progress on fiscal consolida-tion has been more gradual and public debt levels remain high.
World growth is low but turning aroundAfter a disappointing year, a pickup in growth rates is finally in sight. In 2016, global growth was in a post-crisis low and the first six months of the year were characterized by especially weak growth in ad-vanced economies. At 2.3 percent on average, glob-al growth (y-o-y) in 2016 was 0.4 percentage points
SOUTH ASIA ECONOMIC FOCUS SPRING 2017GLOBALIZATION BACKLASH
1
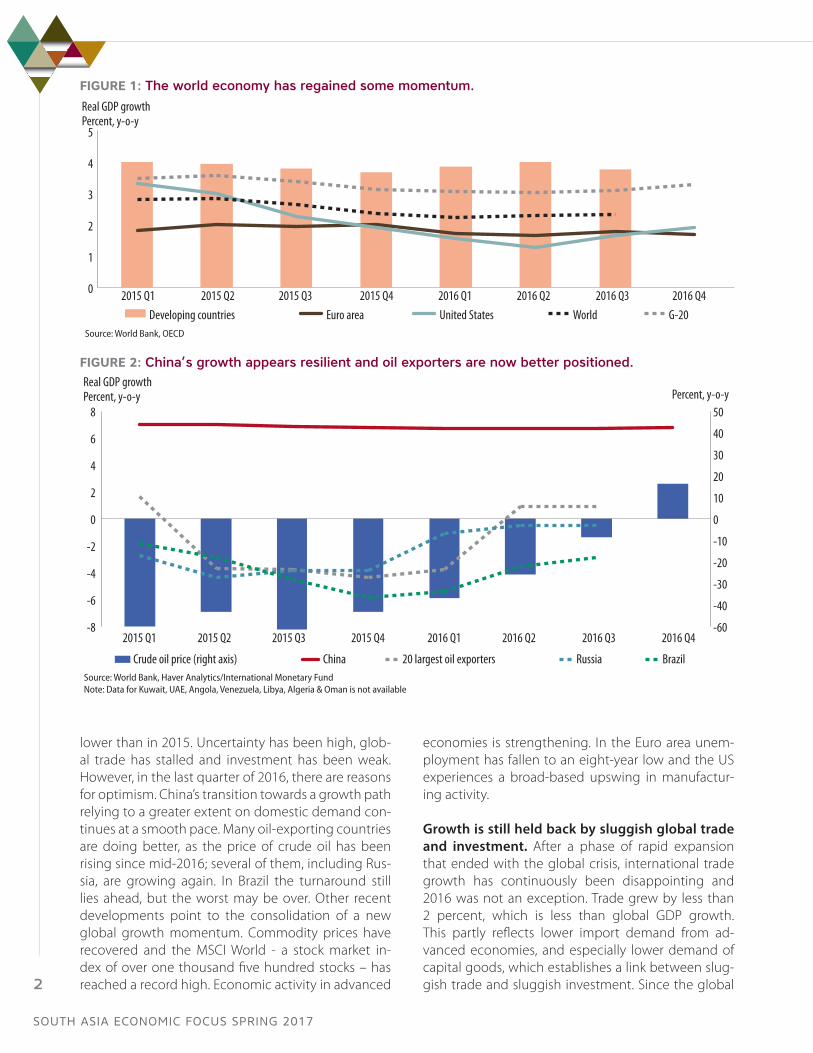
lower than in 2015. Uncertainty has been high, glob-al trade has stalled and investment has been weak. However, in the last quarter of 2016, there are reasons for optimism. China’s transition towards a growth path relying to a greater extent on domestic demand con-tinues at a smooth pace. Many oil-exporting countries are doing better, as the price of crude oil has been rising since mid-2016; several of them, including Rus-sia, are growing again. In Brazil the turnaround still lies ahead, but the worst may be over. Other recent developments point to the consolidation of a new global growth momentum. Commodity prices have recovered and the MSCI World - a stock market in-dex of over one thousand five hundred stocks – has reached a record high. Economic activity in advanced
economies is strengthening. In the Euro area unem-ployment has fallen to an eight-year low and the US experiences a broad-based upswing in manufactur-ing activity.
Growth is still held back by sluggish global trade and investment. After a phase of rapid expansion that ended with the global crisis, international trade growth has continuously been disappointing and 2016 was not an exception. Trade grew by less than 2 percent, which is less than global GDP growth. This partly reflects lower import demand from ad-vanced economies, and especially lower demand of capital goods, which establishes a link between slug-gish trade and sluggish investment. Since the global
FIGURE 1: The world economy has regained some momentum.
0
1
2
3
4
5
Developing countries Euro area United States World G-20Source: World Bank, OECD
Real GDP growthPercent, y-o-y
2015 Q1 2015 Q2 2015 Q3 2015 Q4 2016 Q1 2016 Q2 2016 Q3 2016 Q4
FIGURE 2: China’s growth appears resilient and oil exporters are now better positioned.
-60
-40
-30
-20
-10
0
10
20
30
40
50
-8
-6
-4
-2
0
2
4
6
8
Crude oil price (right axis) China 20 largest oil exporters Russia BrazilSource: World Bank, Haver Analytics/International Monetary FundNote: Data for Kuwait, UAE, Angola, Venezuela, Libya, Algeria & Oman is not available
Real GDP growthPercent, y-o-y Percent, y-o-y
2015 Q1 2015 Q2 2015 Q3 2015 Q4 2016 Q1 2016 Q2 2016 Q3 2016 Q4
SOUTH ASIA ECONOMIC FOCUS SPRING 2017
2
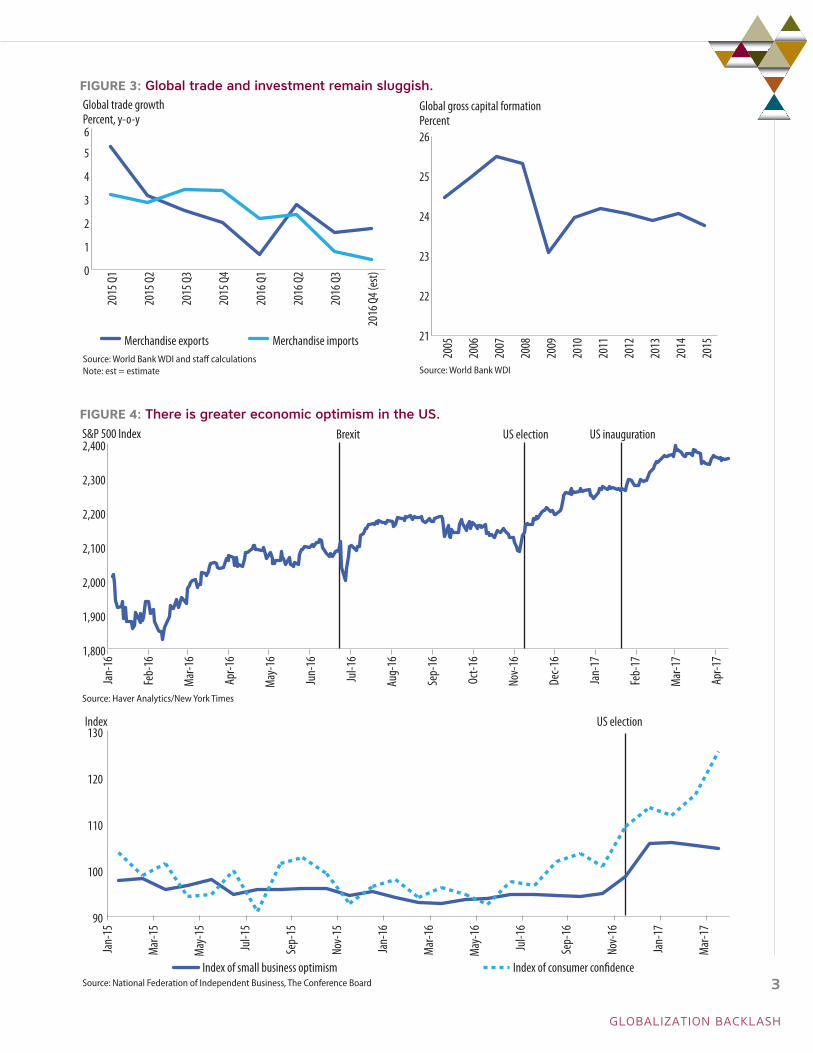
FIGURE 3: Global trade and investment remain sluggish.
0
1
2
3
4
5
6
Merchandise exports Merchandise imports
Global trade growthPercent, y-o-y
Source: World Bank WDI and staff calculationsNote: est = estimate
2015
Q1
2015
Q2
2015
Q3
2015
Q4
2016
Q1
2016
Q2
2016
Q3
2016
Q4 (
est)
21
22
23
24
25
26
Global gross capital formationPercent
Source: World Bank WDI
2005
2006
2007
2008
2009
2010
2011
2012
2013
2014
2015
FIGURE 4: There is greater economic optimism in the US.
1,800
1,900
2,000
2,100
2,200
2,300
2,400Brexit US election US inauguration
Source: Haver Analytics/New York Times
S&P 500 Index
Jan-
16
Feb-
16
Mar
-16
Apr-1
6
May
-16
Jun-
16
Jul-1
6
Aug-
16
Sep-
16
Oct-1
6
Nov-
16
Dec-1
6
Jan-
17
Feb-
17
Mar
-17
Apr-1
7
90
100
110
120
130
Index of small business optimism Index of consumer con�dence
Index US election
Source: National Federation of Independent Business, The Conference Board
Jan-
15
Mar
-15
May
-15
Jul-1
5
Sep-
15
Nov-
15
Jan-
16
Mar
-16
May
-16
Jul-1
6
Sep-
16
Nov-
16
Jan-
17
Mar
-17
GLOBALIZATION BACKLASH
3

financial crisis, world gross capital formation is hov-ering around 24 percent of GDP and is not further recovering.
The expectation of pro-business policies has bol-stered economic optimism in the US. The S&P 500, an American stock market index covering the shares of 500 large companies, has rallied since the US election. At the beginning of April it stood 10 percent higher than in early November 2016. In the 2017 JP Morgan Chase Business Leaders Outlook, over three quarters of respondents expected a positive impact of the new administration on their businesses. The top three rea-sons named were pro-business policies, tax reforms and reduced regulation. Optimism is not limited to financial markets and big businesses: it is also shared more broadly, as shown by rising indices of small busi-ness confidence and consumer confidence. Due to the size and international linkages of the US economy, these developments have global implications. The Federal Reserve’s assessment of the economic outlook, however, remains measured. A potentially more pro-tectionist US trade policy could affect both the US and the global economy negatively. In the 2017 JP Morgan Chase Business Leaders Outlook, among those who are expecting a negative impact of the new adminis-tration for their business, trade concerns featured most prominently.
With different paces of recovery, interest rates in advanced economies are diverging. In March, the Federal Reserve raised its benchmark rate for the third time since the financial crisis and the second
time in three months. US interest rates are expected to increase further. In contrast, the Euro area and Ja-pan still follow a dovish monetary policy. As a result, one-year interest rate swaps of advanced economies are drifting further apart. The effect of the US inter-est rate hike on the financing conditions in emerging markets has been muted, in particular compared to the 2013 Taper Tantrum. One reason is that the higher interest rates go hand in hand with higher inflation-ary expectations. A strong and unexpected rise in US bond yields or appreciation of the US dollar, could still cause financial market turbulence in emerging markets.
South Asia again outperforms all other regionsSouth Asia has by now consolidated its position as the global leader in economic growth. While the pick-up in growth in the first quarter of 2016 was only temporary, South Asia is still expected to have grown by an impressive 6.7 percent (y-o-y) over the year as a whole. This strong performance was despite the tem-porary setback caused by India’s demonetization effort at the end of the year. Growth in South Asia was higher than in East Asia, where it stood at 6.3 percent. Other regions are growing either much more slowly or are even contracting.
FIGURE 5: Interest rates diverge as US monetary policy normalizes.
-0.6-0.4-0.20.00.20.40.60.81.01.21.4
United States Japan Euro area
Source: Haver Analytics/Reuters
One-year interest rate swapPercent
Jan-
15
Feb-
15
Mar
-15
Apr-1
5
May
-15
Jun-
15
Jul-1
5
Aug-
15
Sep-
15
Oct-1
5
Nov-
15
Dec-1
5
Jan-
16
Feb-
16
Mar
-16
Apr-1
6
May
-16
Jun-
16
Jul-1
6
Aug-
16
Sep-
16
Oct-1
6
Nov-
16
Dec-1
6
Jan-
17
Feb-
17
Mar
-17
Apr-1
7
SOUTH ASIA ECONOMIC FOCUS SPRING 2017
4

Despite sub-regional differences, most South Asian countries have shown improvements. At around 7 percent, growth has been particularly high in Bhutan, in Bangladesh, and in India. Bhutan, the fastest growing economy in South Asia, benefited from a dynamic en-ergy sector, thanks to ongoing hydropower construc-tion. In Bangladesh, growth has been driven mainly by private investment and exports, with industrial produc-tion recently reaching a record high. India’s economy benefited from a favorable monsoon and strong urban consumption. The setback due to demonetization was noticeable but modest. After two consecutive years of very weak growth due to devastating earthquakes and a disruption in cross-border trade with India, growth
in Nepal is bouncing back strongly. In Pakistan and Sri Lanka, growth has been around 5 percent. For Pakistan this implies a continuation of an upward trend. Growth there is, among other things, supported by the China Pakistan Economic Corridor and tangible improve-ments in security. Recent data on industrial produc-tion looks encouraging. In Sri Lanka, on the other hand, growth declined from 4.8 percent to 4.4 percent mainly due to floods and droughts. As a consequence of large investment projects growth in Maldives rebounded to 4.1 percent, and this despite a slowdown in tourism. The weakest performance was in Afghanistan, were security concerns have kept economic growth below population growth for yet another year.
FIGURE 6: South Asia remains the fastest-growing region in the world.
-4
-2
0
2
4
6
8
10
East Asia & Paci�c Euro area Europe & Central Asia Sub-Saharan AfricaLatin America & Caribbean Middle East & North Africa South Asia
Real GDP growthPercent, y-o-y
Source: World Bank, OECD
2015 Q1 2015 Q2 2015 Q3 2015 Q4 2016 Q1 2016 Q2 2016 Q3 2016 Q4
FIGURE 7: The eastern part of the region is leading, Nepal and Maldives are bouncing back.
0
1
2
3
4
5
6
7
8
9
2015 2016 (est) 2017 (f)India (FY) Bangladesh (FY) Bhutan (CY) Nepal (FY)
Pakistan (FY)Sri Lanka (CY) Maldives (CY) Afghanistan (CY)Source: World BankNote: est = estimate, f = forecast
Real GDP growthPercent, y-o-y
GLOBALIZATION BACKLASH
5
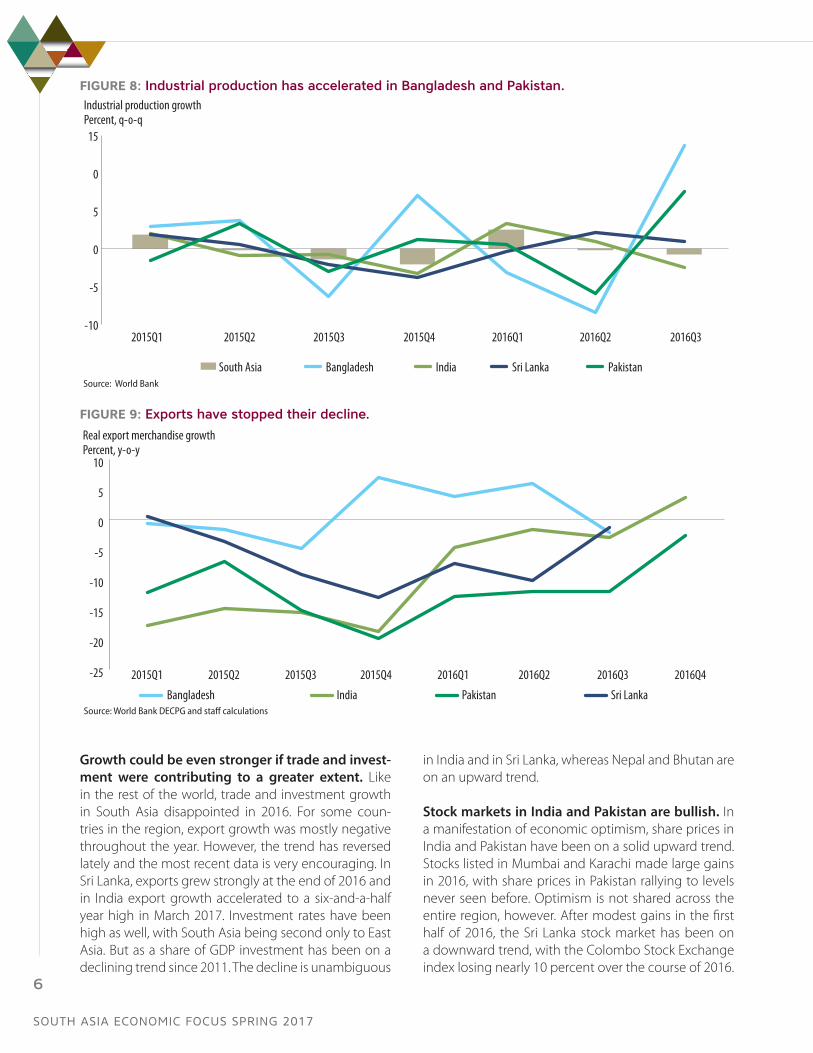
Growth could be even stronger if trade and invest-ment were contributing to a greater extent. Like in the rest of the world, trade and investment growth in South Asia disappointed in 2016. For some coun-tries in the region, export growth was mostly negative throughout the year. However, the trend has reversed lately and the most recent data is very encouraging. In Sri Lanka, exports grew strongly at the end of 2016 and in India export growth accelerated to a six-and-a-half year high in March 2017. Investment rates have been high as well, with South Asia being second only to East Asia. But as a share of GDP investment has been on a declining trend since 2011. The decline is unambiguous
in India and in Sri Lanka, whereas Nepal and Bhutan are on an upward trend.
Stock markets in India and Pakistan are bullish. In a manifestation of economic optimism, share prices in India and Pakistan have been on a solid upward trend. Stocks listed in Mumbai and Karachi made large gains in 2016, with share prices in Pakistan rallying to levels never seen before. Optimism is not shared across the entire region, however. After modest gains in the first half of 2016, the Sri Lanka stock market has been on a downward trend, with the Colombo Stock Exchange index losing nearly 10 percent over the course of 2016.
FIGURE 8: Industrial production has accelerated in Bangladesh and Pakistan.
-10
-5
0
5
0
15
South Asia Bangladesh India Sri Lanka Pakistan
Industrial production growthPercent, q-o-q
Source: World Bank
2015Q1 2015Q2 2015Q3 2015Q4 2016Q1 2016Q2 2016Q3
FIGURE 9: Exports have stopped their decline.
-25
-20
-15
-10
-5
0
5
10
Bangladesh India Pakistan Sri Lanka
Real export merchandise growthPercent, y-o-y
Source: World Bank DECPG and staff calculations
2015Q1 2015Q2 2015Q3 2015Q4 2016Q1 2016Q2 2016Q3 2016Q4
SOUTH ASIA ECONOMIC FOCUS SPRING 2017
6
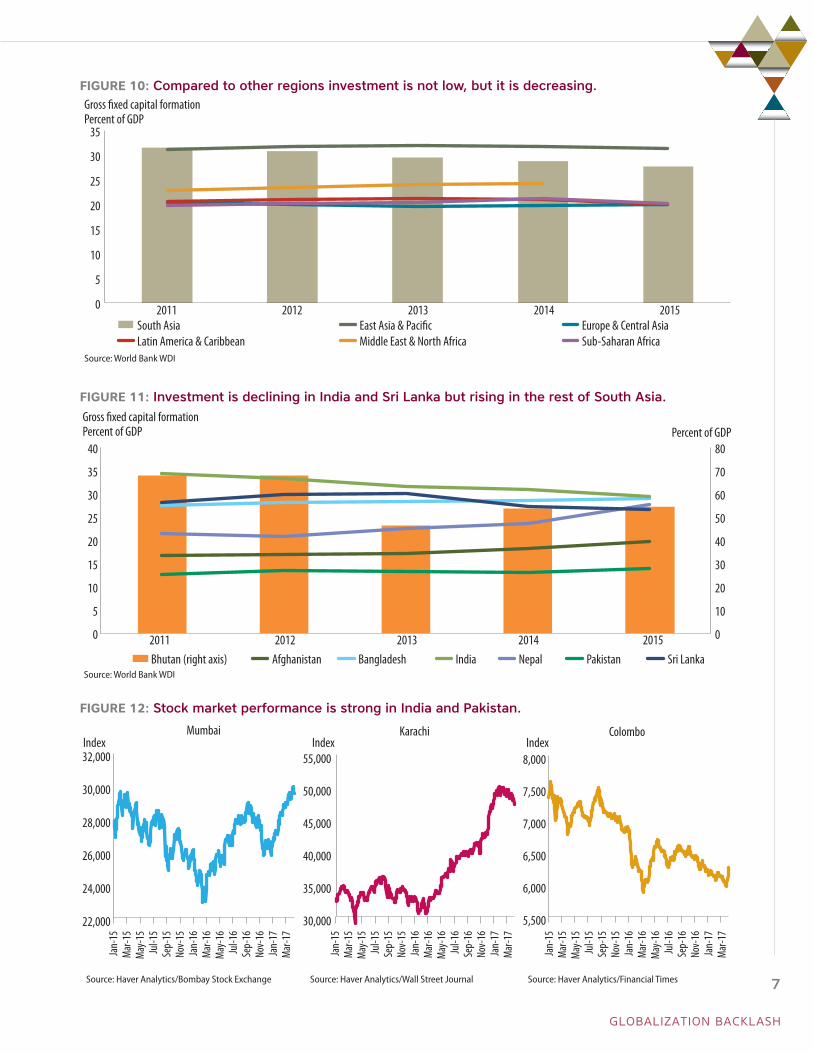
FIGURE 10: Compared to other regions investment is not low, but it is decreasing.
0
5
10
15
20
25
30
35
2011 2012 2013 2014 2015South Asia East Asia & Paci�c Europe & Central AsiaLatin America & Caribbean Middle East & North Africa Sub-Saharan Africa
Gross �xed capital formationPercent of GDP
Source: World Bank WDI
FIGURE 11: Investment is declining in India and Sri Lanka but rising in the rest of South Asia.
0
10
20
30
40
50
60
70
80
0
5
10
15
20
25
30
35
40
2011 2012 2013 2014 2015Bhutan (right axis) Afghanistan Bangladesh India Nepal Pakistan Sri Lanka
Gross �xed capital formationPercent of GDP
Source: World Bank WDI
Percent of GDP
FIGURE 12: Stock market performance is strong in India and Pakistan.
22,000
24,000
26,000
28,000
30,000
32,000
Mumbai
Source: Haver Analytics/Bombay Stock Exchange
30,000
35,000
40,000
45,000
50,000
55,000
Karachi
Source: Haver Analytics/Wall Street Journal
5,500
6,000
6,500
7,000
7,500
8,000
ColomboIndexIndex Index
Source: Haver Analytics/Financial Times
Jan-
15M
ar-1
5M
ay-1
5Ju
l-15
Sep-
15No
v-15
Jan-
16M
ar-1
6M
ay-1
6Ju
l-16
Sep-
16No
v-16
Jan-
17M
ar-1
7
Jan-
15M
ar-1
5M
ay-1
5Ju
l-15
Sep-
15No
v-15
Jan-
16M
ar-1
6M
ay-1
6Ju
l-16
Sep-
16No
v-16
Jan-
17M
ar-1
7
Jan-
15M
ar-1
5M
ay-1
5Ju
l-15
Sep-
15No
v-15
Jan-
16M
ar-1
6M
ay-1
6Ju
l-16
Sep-
16No
v-16
Jan-
17M
ar-1
7
GLOBALIZATION BACKLASH
7
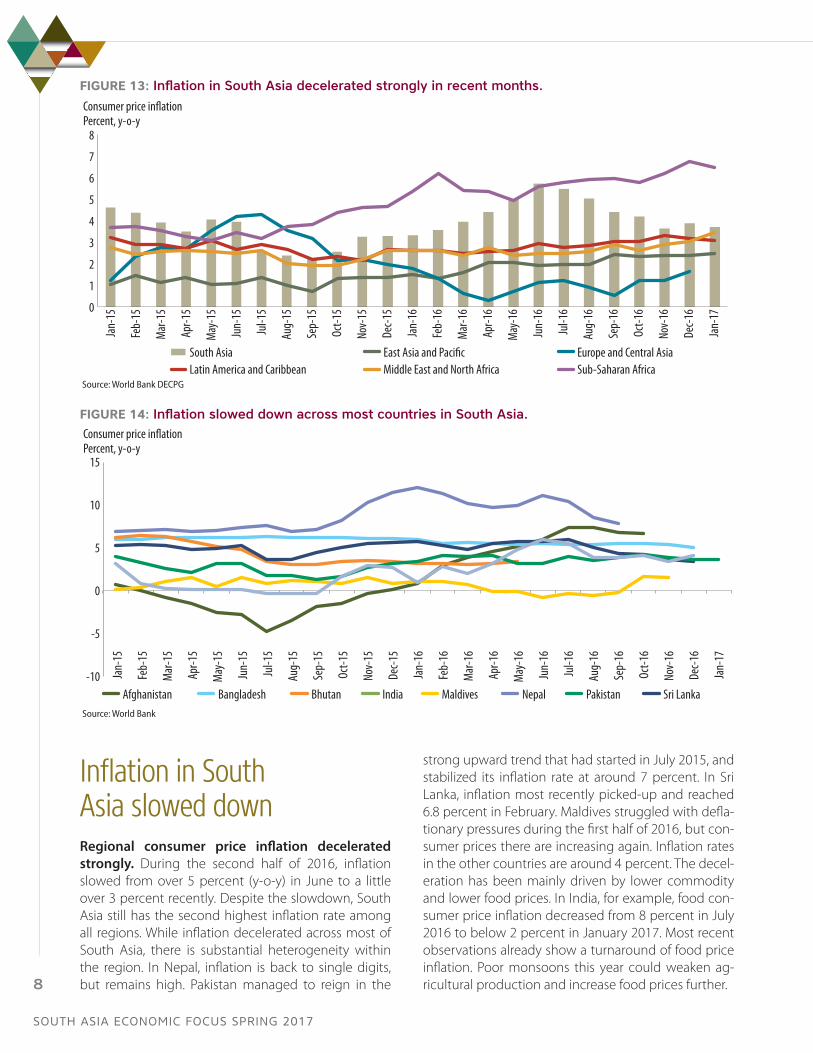
Inflation in South Asia slowed downRegional consumer price inflation decelerated strongly. During the second half of 2016, inflation slowed from over 5 percent (y-o-y) in June to a little over 3 percent recently. Despite the slowdown, South Asia still has the second highest inflation rate among all regions. While inflation decelerated across most of South Asia, there is substantial heterogeneity within the region. In Nepal, inflation is back to single digits, but remains high. Pakistan managed to reign in the
strong upward trend that had started in July 2015, and stabilized its inflation rate at around 7 percent. In Sri Lanka, inflation most recently picked-up and reached 6.8 percent in February. Maldives struggled with defla-tionary pressures during the first half of 2016, but con-sumer prices there are increasing again. Inflation rates in the other countries are around 4 percent. The decel-eration has been mainly driven by lower commodity and lower food prices. In India, for example, food con-sumer price inflation decreased from 8 percent in July 2016 to below 2 percent in January 2017. Most recent observations already show a turnaround of food price inflation. Poor monsoons this year could weaken ag-ricultural production and increase food prices further.
FIGURE 13: Inflation in South Asia decelerated strongly in recent months.
0
1
2
3
4
5
6
7
8
South Asia East Asia and Paci�c Europe and Central AsiaLatin America and Caribbean Middle East and North Africa Sub-Saharan Africa
Consumer price in�ationPercent, y-o-y
Source: World Bank DECPG
Jan-
15
Feb-
15
Mar
-15
Apr-1
5
May
-15
Jun-
15
Jul-1
5
Aug-
15
Sep-
15
Oct-1
5
Nov-
15
Dec-1
5
Jan-
16
Feb-
16
Mar
-16
Apr-1
6
May
-16
Jun-
16
Jul-1
6
Aug-
16
Sep-
16
Oct-1
6
Nov-
16
Dec-1
6
Jan-
17
FIGURE 14: Inflation slowed down across most countries in South Asia.
-10
-5
0
5
10
15
Afghanistan Bangladesh Bhutan India Maldives Nepal Pakistan Sri LankaSource: World Bank
Consumer price in�ationPercent, y-o-y
Jan-
15
Feb-
15
Mar
-15
Apr-1
5
May
-15
Jun-
15
Jul-1
5
Aug-
15
Sep-
15
Oct-1
5
Nov-
15
Dec-1
5
Jan-
16
Feb-
16
Mar
-16
Apr-1
6
May
-16
Jun-
16
Jul-1
6
Aug-
16
Sep-
16
Oct-1
6
Nov-
16
Dec-1
6
Jan-
17
SOUTH ASIA ECONOMIC FOCUS SPRING 2017
8
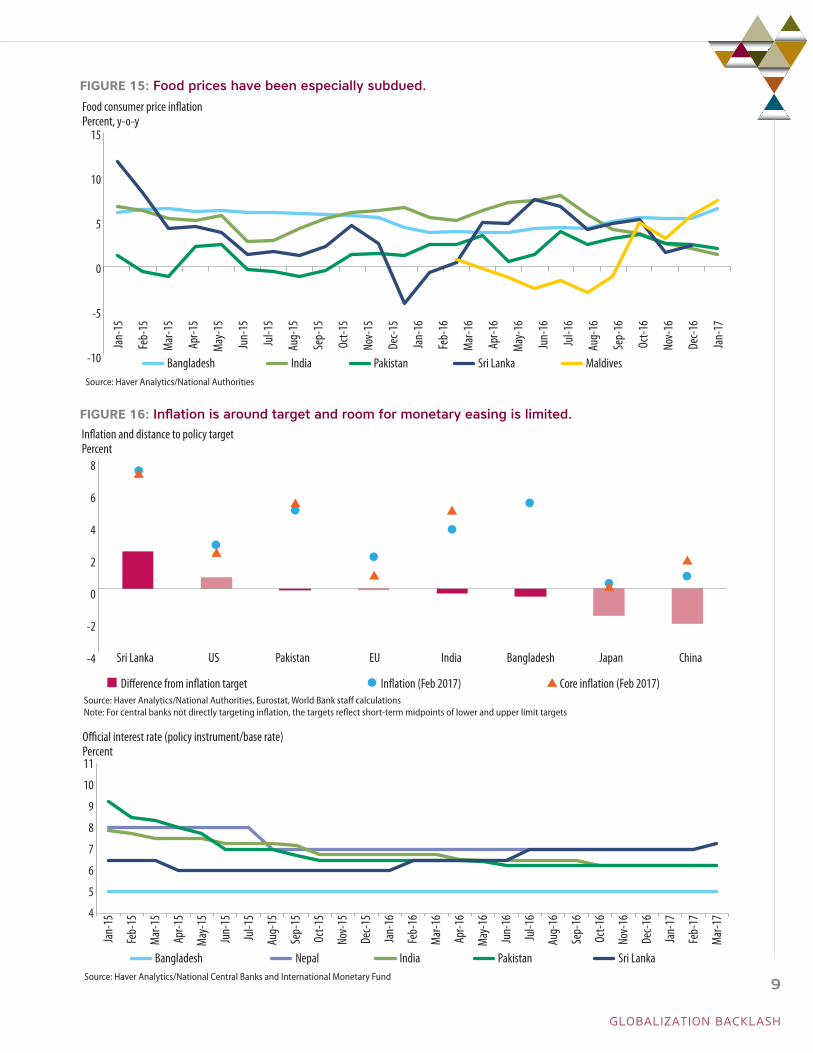
FIGURE 15: Food prices have been especially subdued.
-10
-5
0
5
10
15
Food consumer price in�ationPercent, y-o-y
Bangladesh India Pakistan Sri Lanka MaldivesSource: Haver Analytics/National Authorities
Jan-
15
Feb-
15
Mar
-15
Apr-1
5
May
-15
Jun-
15
Jul-1
5
Aug-
15
Sep-
15
Oct-1
5
Nov-
15
Dec-1
5
Jan-
16
Feb-
16
Mar
-16
Apr-1
6
May
-16
Jun-
16
Jul-1
6
Aug-
16
Sep-
16
Oct-1
6
Nov-
16
Dec-1
6
Jan-
17
FIGURE 16: Inflation is around target and room for monetary easing is limited.
-4
-2
0
2
4
6
8
Di�erence from in�ation target In�ation (Feb 2017) Core in�ation (Feb 2017)Source: Haver Analytics/National Authorities, Eurostat, World Bank staff calculationsNote: For central banks not directly targeting inflation, the targets reflect short-term midpoints of lower and upper limit targets
In�ation and distance to policy targetPercent
Sri Lanka US Pakistan EU India Bangladesh Japan China
4
5
6
7
8
9
10
11
Bangladesh Nepal India Pakistan Sri Lanka
O�cial interest rate (policy instrument/base rate) Percent
Source: Haver Analytics/National Central Banks and International Monetary Fund
Jan-
15
Feb-
15
Mar
-15
Apr-1
5
May
-15
Jun-
15
Jul-1
5
Aug-
15
Sep-
15
Oct-1
5
Nov-
15
Dec-1
5
Jan-
16
Feb-
16
Mar
-16
Apr-1
6
May
-16
Jun-
16
Jul-1
6
Aug-
16
Sep-
16
Oct-1
6
Nov-
16
Dec-1
6
Jan-
17
Feb-
17
Mar
-17
GLOBALIZATION BACKLASH
9
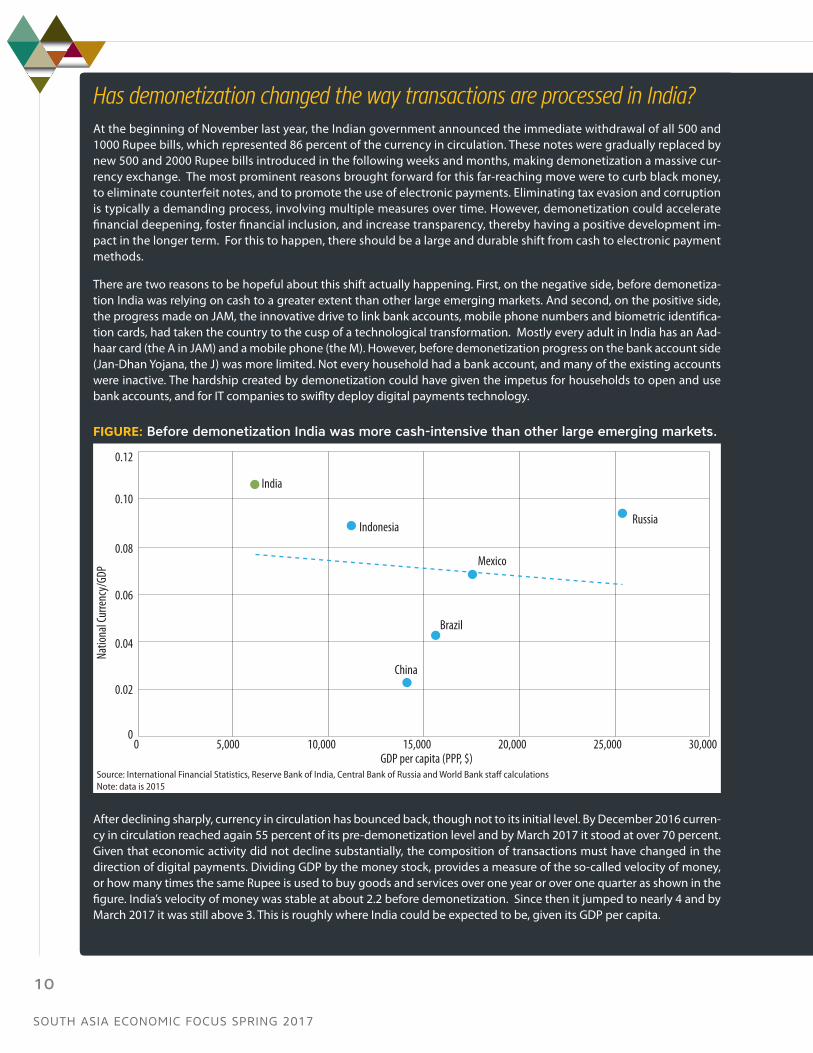
Has demonetization changed the way transactions are processed in India? At the beginning of November last year, the Indian government announced the immediate withdrawal of all 500 and 1000 Rupee bills, which represented 86 percent of the currency in circulation. These notes were gradually replaced by new 500 and 2000 Rupee bills introduced in the following weeks and months, making demonetization a massive cur-rency exchange. The most prominent reasons brought forward for this far-reaching move were to curb black money, to eliminate counterfeit notes, and to promote the use of electronic payments. Eliminating tax evasion and corruption is typically a demanding process, involving multiple measures over time. However, demonetization could accelerate financial deepening, foster financial inclusion, and increase transparency, thereby having a positive development im-pact in the longer term. For this to happen, there should be a large and durable shift from cash to electronic payment methods.
There are two reasons to be hopeful about this shift actually happening. First, on the negative side, before demonetiza-tion India was relying on cash to a greater extent than other large emerging markets. And second, on the positive side, the progress made on JAM, the innovative drive to link bank accounts, mobile phone numbers and biometric identifica-tion cards, had taken the country to the cusp of a technological transformation. Mostly every adult in India has an Aad-haar card (the A in JAM) and a mobile phone (the M). However, before demonetization progress on the bank account side (Jan-Dhan Yojana, the J) was more limited. Not every household had a bank account, and many of the existing accounts were inactive. The hardship created by demonetization could have given the impetus for households to open and use bank accounts, and for IT companies to swiflty deploy digital payments technology.
FIGURE: Before demonetization India was more cash-intensive than other large emerging markets.
Brazil
China
India
Mexico
Indonesia Russia
0
0.02
0.04
0.06
0.08
0.10
0.12
0 5,000 10,000 15,000 20,000 25,000 30,000
Natio
nal C
urre
ncy/
GDP
GDP per capita (PPP, $)Source: International Financial Statistics, Reserve Bank of India, Central Bank of Russia and World Bank staff calculationsNote: data is 2015
After declining sharply, currency in circulation has bounced back, though not to its initial level. By December 2016 curren-cy in circulation reached again 55 percent of its pre-demonetization level and by March 2017 it stood at over 70 percent. Given that economic activity did not decline substantially, the composition of transactions must have changed in the direction of digital payments. Dividing GDP by the money stock, provides a measure of the so-called velocity of money, or how many times the same Rupee is used to buy goods and services over one year or over one quarter as shown in the figure. India’s velocity of money was stable at about 2.2 before demonetization. Since then it jumped to nearly 4 and by March 2017 it was still above 3. This is roughly where India could be expected to be, given its GDP per capita.
SOUTH ASIA ECONOMIC FOCUS SPRING 2017
10
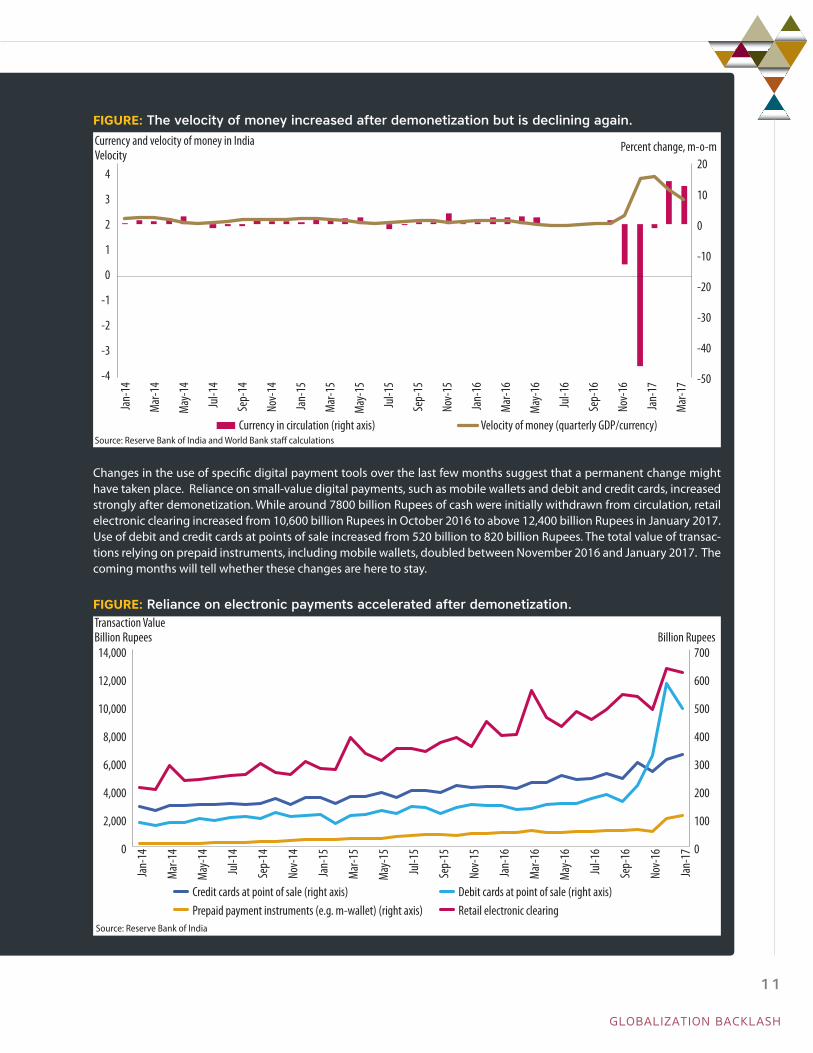
FIGURE: The velocity of money increased after demonetization but is declining again.
-50
-40
-30
-20
-10
0
10
20
-4
-3
-2
-1
0
1
2
3
4
Currency in circulation (right axis) Velocity of money (quarterly GDP/currency)Source: Reserve Bank of India and World Bank staff calculations
Currency and velocity of money in IndiaVelocity
Percent change, m-o-m
Jan-
14
Mar
-14
May
-14
Jul-1
4
Sep-
14
Nov-
14
Jan-
15
Mar
-15
May
-15
Jul-1
5
Sep-
15
Nov-
15
Jan-
16
Mar
-16
May
-16
Jul-1
6
Sep-
16
Nov-
16
Jan-
17
Mar
-17
Changes in the use of specific digital payment tools over the last few months suggest that a permanent change might have taken place. Reliance on small-value digital payments, such as mobile wallets and debit and credit cards, increased strongly after demonetization. While around 7800 billion Rupees of cash were initially withdrawn from circulation, retail electronic clearing increased from 10,600 billion Rupees in October 2016 to above 12,400 billion Rupees in January 2017. Use of debit and credit cards at points of sale increased from 520 billion to 820 billion Rupees. The total value of transac-tions relying on prepaid instruments, including mobile wallets, doubled between November 2016 and January 2017. The coming months will tell whether these changes are here to stay.
FIGURE: Reliance on electronic payments accelerated after demonetization.
0
2,000
4,000
6,000
8,000
10,000
12,000
14,000
0
100
200
300
400
500
600
700
Credit cards at point of sale (right axis) Debit cards at point of sale (right axis)Prepaid payment instruments (e.g. m-wallet) (right axis) Retail electronic clearing
Transaction ValueBillion Rupees
Source: Reserve Bank of India
Billion Rupees
Jan-
14
Mar
-14
May
-14
Jul-1
4
Sep-
14
Nov-
14
Jan-
15
Mar
-15
May
-15
Jul-1
5
Sep-
15
Nov-
15
Jan-
16
Mar
-16
May
-16
Jul-1
6
Sep-
16
Nov-
16
Jan-
17
GLOBALIZATION BACKLASH
11
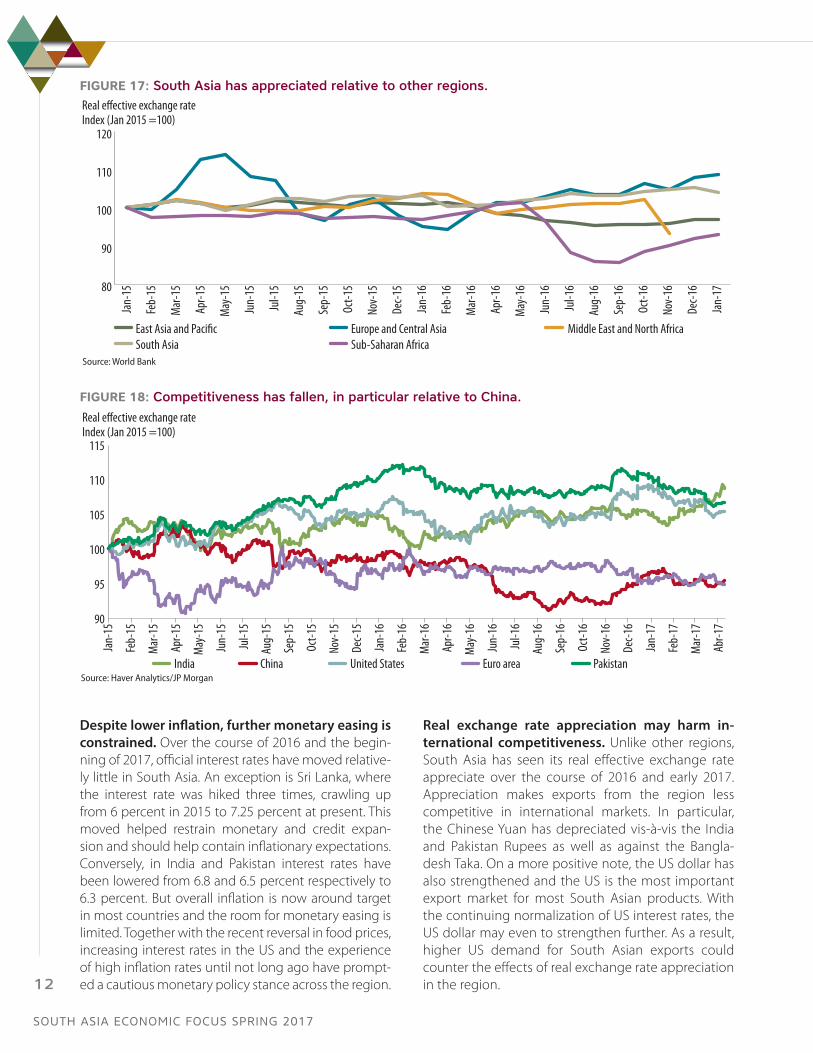
Despite lower inflation, further monetary easing is constrained. Over the course of 2016 and the begin-ning of 2017, official interest rates have moved relative-ly little in South Asia. An exception is Sri Lanka, where the interest rate was hiked three times, crawling up from 6 percent in 2015 to 7.25 percent at present. This moved helped restrain monetary and credit expan-sion and should help contain inflationary expectations. Conversely, in India and Pakistan interest rates have been lowered from 6.8 and 6.5 percent respectively to 6.3 percent. But overall inflation is now around target in most countries and the room for monetary easing is limited. Together with the recent reversal in food prices, increasing interest rates in the US and the experience of high inflation rates until not long ago have prompt-ed a cautious monetary policy stance across the region.
Real exchange rate appreciation may harm in-ternational competitiveness. Unlike other regions, South Asia has seen its real effective exchange rate appreciate over the course of 2016 and early 2017. Appreciation makes exports from the region less competitive in international markets. In particular, the Chinese Yuan has depreciated vis-à-vis the India and Pakistan Rupees as well as against the Bangla-desh Taka. On a more positive note, the US dollar has also strengthened and the US is the most important export market for most South Asian products. With the continuing normalization of US interest rates, the US dollar may even to strengthen further. As a result, higher US demand for South Asian exports could counter the effects of real exchange rate appreciation in the region.
FIGURE 17: South Asia has appreciated relative to other regions.
80
90
100
110
120
East Asia and Paci�c Europe and Central Asia Middle East and North AfricaSouth Asia Sub-Saharan Africa
Source: World Bank
Real e�ective exchange rateIndex (Jan 2015 =100)
Jan-
15
Feb-
15
Mar
-15
Apr-1
5
May
-15
Jun-
15
Jul-1
5
Aug-
15
Sep-
15
Oct-1
5
Nov-
15
Dec-1
5
Jan-
16
Feb-
16
Mar
-16
Apr-1
6
May
-16
Jun-
16
Jul-1
6
Aug-
16
Sep-
16
Oct-1
6
Nov-
16
Dec-1
6
Jan-
17
FIGURE 18: Competitiveness has fallen, in particular relative to China.
90
95
100
105
110
115
India China United States Euro area PakistanSource: Haver Analytics/JP Morgan
Real e�ective exchange rateIndex (Jan 2015 =100)
Jan-
15
Feb-
15
Mar
-15
Apr-1
5
May
-15
Jun-
15
Jul-1
5
Aug-
15
Sep-
15
Oct-1
5
Nov-
15
Dec-1
5
Jan-
16
Feb-
16
Mar
-16
Apr-1
6
May
-16
Jun-
16
Jul-1
6
Aug-
16
Sep-
16
Oct-1
6
Nov-
16
Dec-1
6
Jan-
17
Feb-
17
Mar
-17
Abr-1
7
SOUTH ASIA ECONOMIC FOCUS SPRING 2017
12
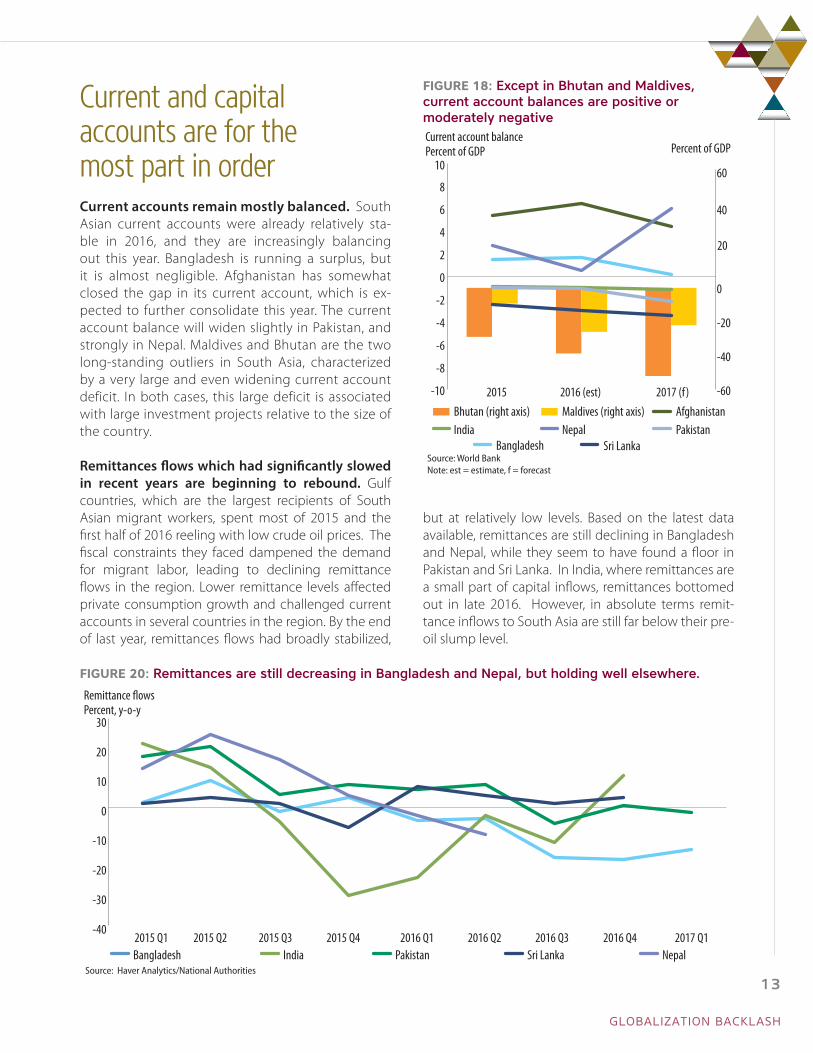
Current and capital accounts are for the most part in orderCurrent accounts remain mostly balanced. South Asian current accounts were already relatively sta-ble in 2016, and they are increasingly balancing out this year. Bangladesh is running a surplus, but it is almost negligible. Afghanistan has somewhat closed the gap in its current account, which is ex-pected to further consolidate this year. The current account balance will widen slightly in Pakistan, and strongly in Nepal. Maldives and Bhutan are the two long-standing outliers in South Asia, characterized by a very large and even widening current account deficit. In both cases, this large deficit is associated with large investment projects relative to the size of the country.
Remittances flows which had significantly slowed in recent years are beginning to rebound. Gulf countries, which are the largest recipients of South Asian migrant workers, spent most of 2015 and the first half of 2016 reeling with low crude oil prices. The fiscal constraints they faced dampened the demand for migrant labor, leading to declining remittance flows in the region. Lower remittance levels affected private consumption growth and challenged current accounts in several countries in the region. By the end of last year, remittances flows had broadly stabilized,
but at relatively low levels. Based on the latest data available, remittances are still declining in Bangladesh and Nepal, while they seem to have found a floor in Pakistan and Sri Lanka. In India, where remittances are a small part of capital inflows, remittances bottomed out in late 2016. However, in absolute terms remit-tance inflows to South Asia are still far below their pre-oil slump level.
FIGURE 18: Except in Bhutan and Maldives, current account balances are positive or moderately negativeCurrent account balancePercent of GDP
-60
-40
-20
0
20
40
60
-10
-8
-6
-4
-2
0
2
4
6
8
10
2015 2016 (est) 2017 (f)Bhutan (right axis) Maldives (right axis) Afghanistan
BangladeshIndia Nepal Pakistan
Sri LankaSource: World BankNote: est = estimate, f = forecast
Percent of GDP
FIGURE 20: Remittances are still decreasing in Bangladesh and Nepal, but holding well elsewhere.
-40
-30
-20
-10
0
10
20
30
Bangladesh India Pakistan Sri Lanka NepalSource: Haver Analytics/National Authorities
Remittance �owsPercent, y-o-y
2015 Q1 2015 Q2 2015 Q3 2015 Q4 2016 Q1 2016 Q2 2016 Q3 2016 Q4 2017 Q1
GLOBALIZATION BACKLASH
13
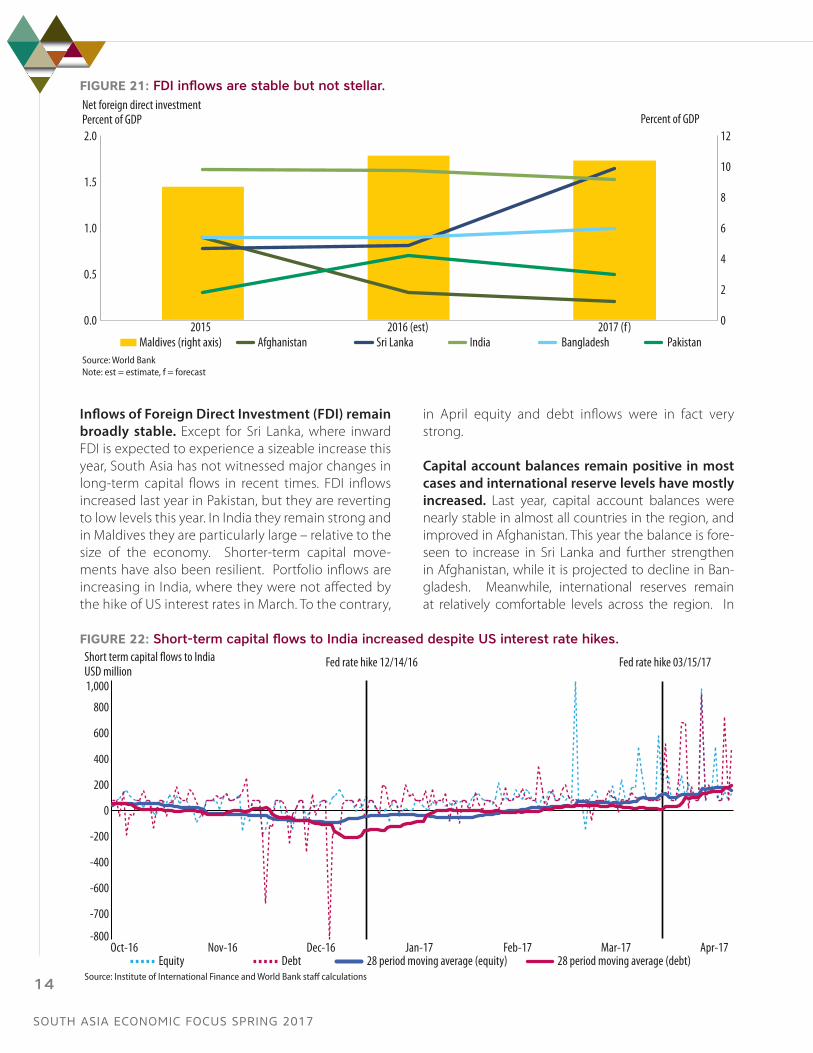
Inflows of Foreign Direct Investment (FDI) remain broadly stable. Except for Sri Lanka, where inward FDI is expected to experience a sizeable increase this year, South Asia has not witnessed major changes in long-term capital flows in recent times. FDI inflows increased last year in Pakistan, but they are reverting to low levels this year. In India they remain strong and in Maldives they are particularly large – relative to the size of the economy. Shorter-term capital move-ments have also been resilient. Portfolio inflows are increasing in India, where they were not affected by the hike of US interest rates in March. To the contrary,
in April equity and debt inflows were in fact very strong.
Capital account balances remain positive in most cases and international reserve levels have mostly increased. Last year, capital account balances were nearly stable in almost all countries in the region, and improved in Afghanistan. This year the balance is fore-seen to increase in Sri Lanka and further strengthen in Afghanistan, while it is projected to decline in Ban-gladesh. Meanwhile, international reserves remain at relatively comfortable levels across the region. In
FIGURE 21: FDI inflows are stable but not stellar.
0
2
4
6
8
10
12
0.0
0.5
1.0
1.5
2.0
2015 2016 (est) 2017 (f)
Net foreign direct investmentPercent of GDP
Maldives (right axis) Afghanistan Sri Lanka India Bangladesh PakistanSource: World BankNote: est = estimate, f = forecast
Percent of GDP
FIGURE 22: Short-term capital flows to India increased despite US interest rate hikes.
-800
-700
-600
-400
-200
0
200
400
600
800
1,000
Oct-16 Nov-16 Dec-16 Jan-17 Feb-17 Mar-17 Apr-17Equity Debt 28 period moving average (equity) 28 period moving average (debt)
Source: Institute of International Finance and World Bank staff calculations
Fed rate hike 12/14/16 Fed rate hike 03/15/17 Short term capital �ows to IndiaUSD million
SOUTH ASIA ECONOMIC FOCUS SPRING 2017
14
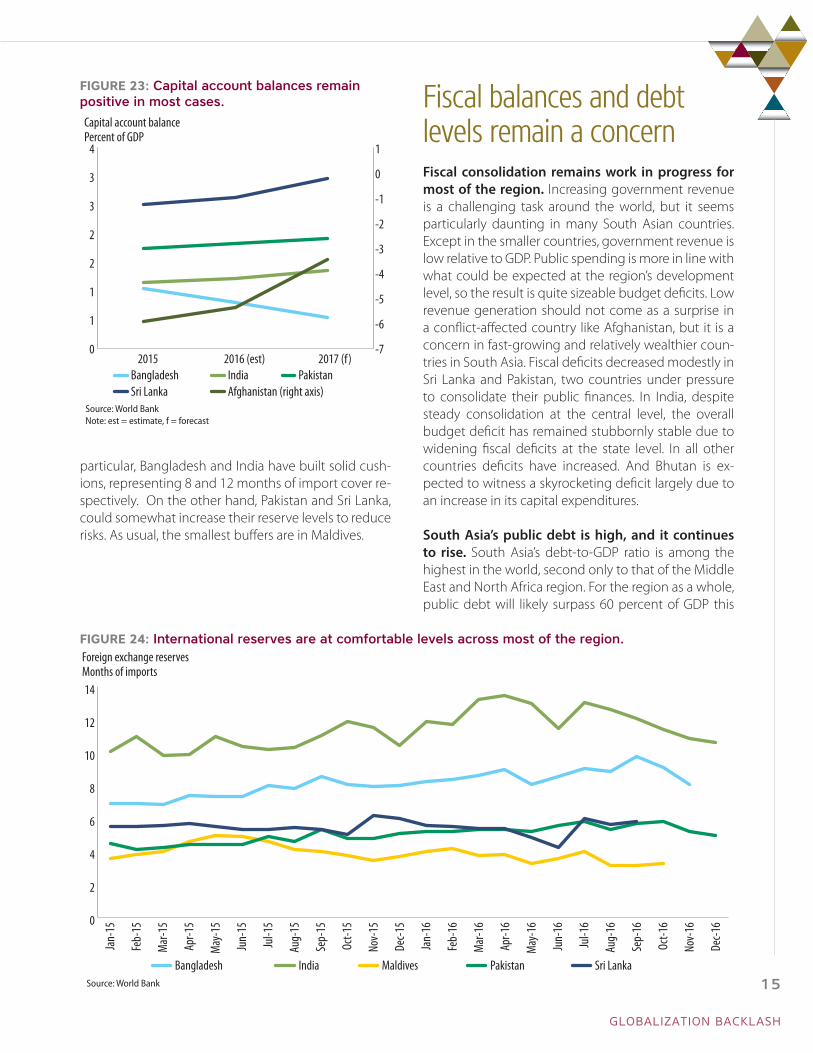
particular, Bangladesh and India have built solid cush-ions, representing 8 and 12 months of import cover re-spectively. On the other hand, Pakistan and Sri Lanka, could somewhat increase their reserve levels to reduce risks. As usual, the smallest buffers are in Maldives.
Fiscal balances and debt levels remain a concernFiscal consolidation remains work in progress for most of the region. Increasing government revenue is a challenging task around the world, but it seems particularly daunting in many South Asian countries. Except in the smaller countries, government revenue is low relative to GDP. Public spending is more in line with what could be expected at the region’s development level, so the result is quite sizeable budget deficits. Low revenue generation should not come as a surprise in a conflict-affected country like Afghanistan, but it is a concern in fast-growing and relatively wealthier coun-tries in South Asia. Fiscal deficits decreased modestly in Sri Lanka and Pakistan, two countries under pressure to consolidate their public finances. In India, despite steady consolidation at the central level, the overall budget deficit has remained stubbornly stable due to widening fiscal deficits at the state level. In all other countries deficits have increased. And Bhutan is ex-pected to witness a skyrocketing deficit largely due to an increase in its capital expenditures.
South Asia’s public debt is high, and it continues to rise. South Asia’s debt-to-GDP ratio is among the highest in the world, second only to that of the Middle East and North Africa region. For the region as a whole, public debt will likely surpass 60 percent of GDP this
FIGURE 23: Capital account balances remain positive in most cases.
-7
-6
-5
-4
-3
-2
-1
0
1
0
1
1
2
2
3
3
4
2015 2016 (est) 2017 (f)Bangladesh India PakistanSri Lanka Afghanistan (right axis)
Capital account balancePercent of GDP
Source: World BankNote: est = estimate, f = forecast
FIGURE 24: International reserves are at comfortable levels across most of the region.
0
2
4
6
8
10
12
14
Bangladesh India Maldives Pakistan Sri Lanka
Foreign exchange reservesMonths of imports
Source: World Bank
Jan-
15
Feb-
15
Mar
-15
Apr-1
5
May
-15
Jun-
15
Jul-1
5
Aug-
15
Sep-
15
Oct-1
5
Nov-
15
Dec-1
5
Jan-
16
Feb-
16
Mar
-16
Apr-1
6
May
-16
Jun-
16
Jul-1
6
Aug-
16
Sep-
16
Oct-1
6
Nov-
16
Dec-1
6
GLOBALIZATION BACKLASH
15
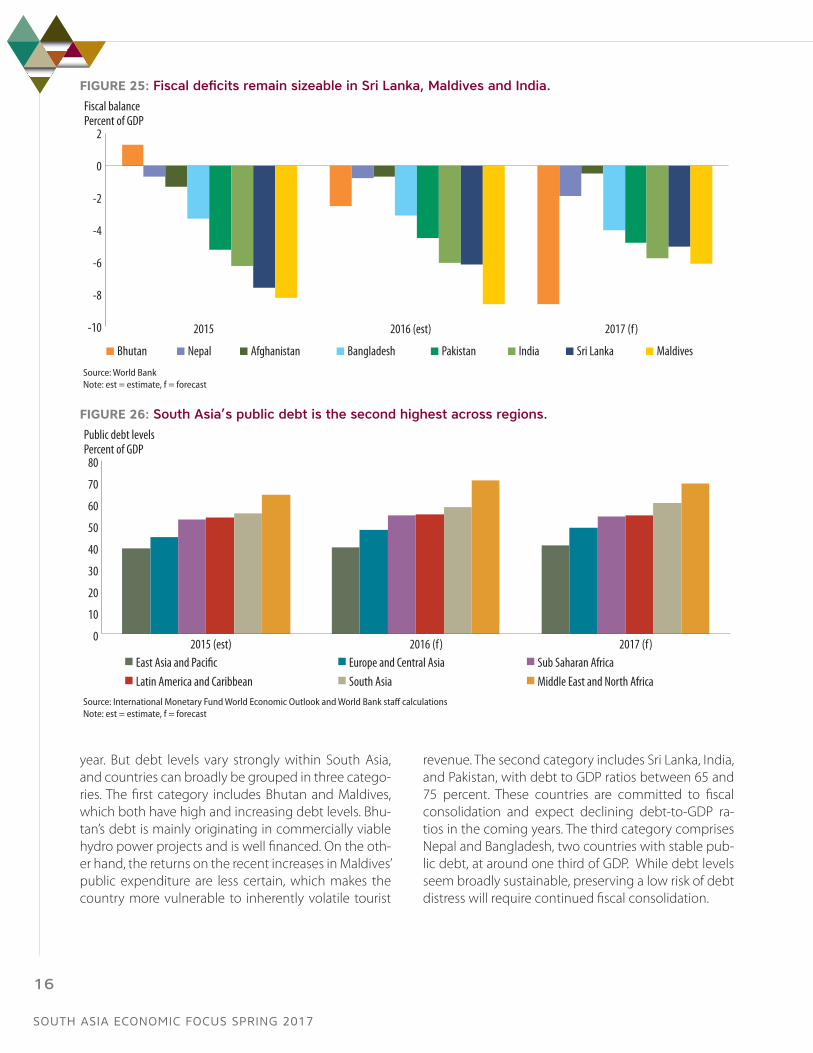
year. But debt levels vary strongly within South Asia, and countries can broadly be grouped in three catego-ries. The first category includes Bhutan and Maldives, which both have high and increasing debt levels. Bhu-tan’s debt is mainly originating in commercially viable hydro power projects and is well financed. On the oth-er hand, the returns on the recent increases in Maldives’ public expenditure are less certain, which makes the country more vulnerable to inherently volatile tourist
revenue. The second category includes Sri Lanka, India, and Pakistan, with debt to GDP ratios between 65 and 75 percent. These countries are committed to fiscal consolidation and expect declining debt-to-GDP ra-tios in the coming years. The third category comprises Nepal and Bangladesh, two countries with stable pub-lic debt, at around one third of GDP. While debt levels seem broadly sustainable, preserving a low risk of debt distress will require continued fiscal consolidation.
FIGURE 25: Fiscal deficits remain sizeable in Sri Lanka, Maldives and India.
-10
-8
-6
-4
-2
0
2
2015 2016 (est) 2017 (f)
Bhutan Nepal Afghanistan Bangladesh Pakistan India Sri Lanka Maldives
Fiscal balancePercent of GDP
Source: World BankNote: est = estimate, f = forecast
FIGURE 26: South Asia’s public debt is the second highest across regions.
0
10
20
30
40
50
60
70
80
2015 (est) 2016 (f) 2017 (f)East Asia and Paci�c Europe and Central Asia Sub Saharan AfricaLatin America and Caribbean South Asia Middle East and North Africa
Source: International Monetary Fund World Economic Outlook and World Bank staff calculationsNote: est = estimate, f = forecast
Public debt levelsPercent of GDP
SOUTH ASIA ECONOMIC FOCUS SPRING 2017
16

FIGURE 27: Debt levels are stable in most countries, but increasing in Bhutan and Maldives.
0
20
40
60
80
100
120
2015 2016 (est) 2017 (f)Afghanistan Nepal Bangladesh Maldives Pakistan India Sri Lanka Bhutan
Public debt levels in South AsiaPercent of GDP
Source: World BankNote: est = estimate, f = forecast
GLOBALIZATION BACKLASH
17
South Asia economic outlook
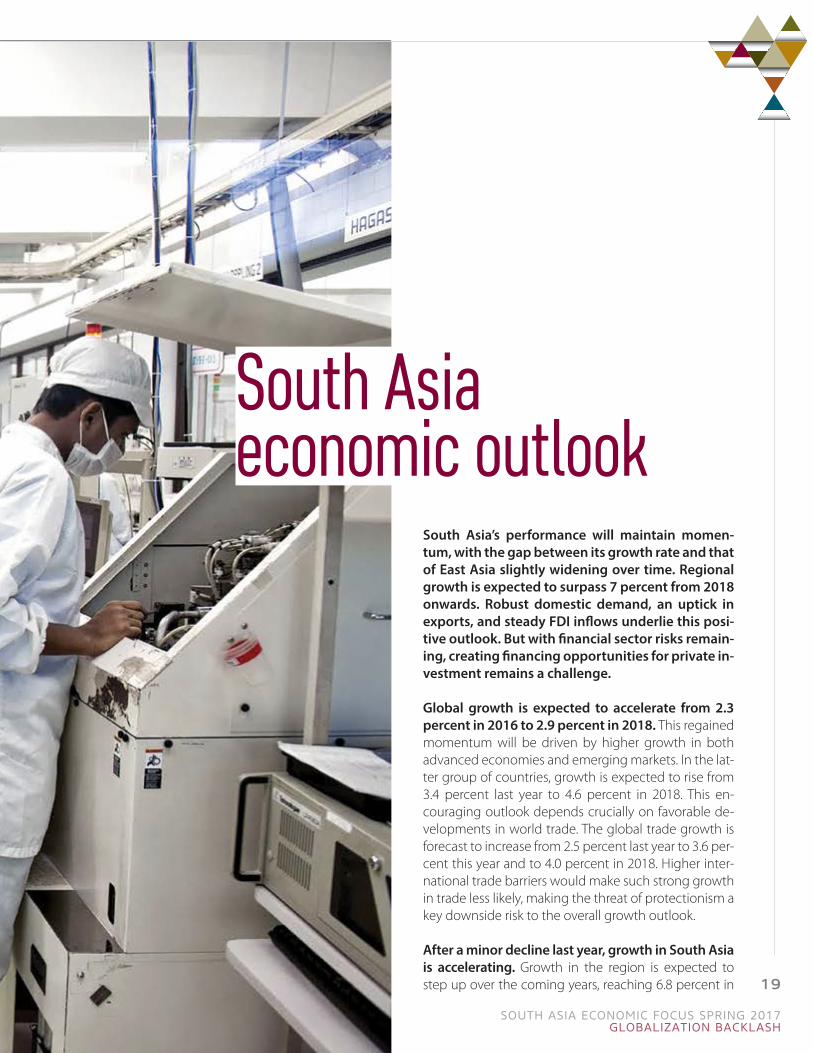
South Asia’s performance will maintain momen-tum, with the gap between its growth rate and that of East Asia slightly widening over time. Regional growth is expected to surpass 7 percent from 2018 onwards. Robust domestic demand, an uptick in exports, and steady FDI inflows underlie this posi-tive outlook. But with financial sector risks remain-ing, creating financing opportunities for private in-vestment remains a challenge.
Global growth is expected to accelerate from 2.3 percent in 2016 to 2.9 percent in 2018. This regained momentum will be driven by higher growth in both advanced economies and emerging markets. In the lat-ter group of countries, growth is expected to rise from 3.4 percent last year to 4.6 percent in 2018. This en-couraging outlook depends crucially on favorable de-velopments in world trade. The global trade growth is forecast to increase from 2.5 percent last year to 3.6 per-cent this year and to 4.0 percent in 2018. Higher inter-national trade barriers would make such strong growth in trade less likely, making the threat of protectionism a key downside risk to the overall growth outlook.
After a minor decline last year, growth in South Asia is accelerating. Growth in the region is expected to step up over the coming years, reaching 6.8 percent in
SOUTH ASIA ECONOMIC FOCUS SPRING 2017GLOBALIZATION BACKLASH
19

2017, 7.1 percent in 2018 and 7.3 percent in 2019. While this is a very encouraging outlook, it implies slightly low-er growth than predicted before. In the near future, dis-ruptions from demonetization in India are still expected to leave a temporary mark. Regarding the longer-term, the persistent weakness in investment rates has led to a slight downward revision of the region’s potential out-put. Regardless, with growth in East Asia expected to remain relatively stable, at slightly above 6 percent, the gap between the two regions will widen. South Asia is thus expected to expand its leadership of global growth.
In the coming years, growth in South Asia will be supported by higher exports and stronger
investment growth. Private and government con-sumption are expected to remain broadly stable and to continue making a robust contribution to regional growth. Salary hikes for civil servants in Bangladesh and India, and larger government spending in infra-structure could even enhance the role of government consumption in the medium term. But there is also an expected acceleration of private investment and ex-ports. By 2018, investment is anticipated to become the major driver of growth and the contribution of ex-ports is projected to double.
While growth rates vary across countries, the ac-celeration of growth should be experienced across
FIGURE 28: Global growth will accelerate.
0
1
2
3
4
5
0
1
2
3
4
5
0
1
2
3
4
5
2016 (est) 2017 (f) 2018 (f) 2016 (est) 2017 (f) 2018 (f) 2016 (est) 2017 (f) 2018 (f)
GlobalGDP growthPercent, y-o-y
GDP growthPercent, y-o-y
Trade growth ratePercent, y-o-y
Source: World BankNote: est = estimate, f = forecast
Emerging markets Global
FIGURE 29: South Asia will consolidate its leadership of global growth.
-2-1012345678
2015 2016 (est) 2017 (f) 2018 (f) 2019 (f)
East Asia and Paci�c Middle East and North Africa Sub Saharan Africa Europe and Central AsiaLatin America and Caribbean South Asia Developing Countries
Source: World BankNote: est = estimate, f = forecast
Real GDP growthPercent, y-o-y
SOUTH ASIA ECONOMIC FOCUS SPRING 2017
20

most of the region. Both Bhutan and India are fore-seen to grow at rates exceeding 7 percent within the coming years. In Bhutan, the upturn in investment is expected to continue and growth in agriculture will ac-celerate. In India, medium-term growth will be under-pinned by a recovery in private investment supported by an improvement in the investment climate. Paki-stan’s medium-term growth prospects have improved in recent years. And assuming that the security situa-tion will not deteriorate further, growth in Afghanistan could reach over 3 percent in 2018. After a slowdown last year, Sri Lanka is now benefiting from its efforts to improve its fiscal sustainability and to reform its econo-my. It is projected to grow by 4.7 percent this year and by marginally over 5.0 percent in the medium term. Af-ter a very strong recovery, growth in Nepal is expected to moderate again. At about 4 to 5 percent, it would be close to its potential. Based on an expansion of the
FIGURE 30: South Asia will increasingly be driven by exports and investment.
-6
-4
-2
0
2
4
6
8
10
2015 2016 (est) 2017 (f) 2018 (f) 2019 (f)Private consumption Government consumption Gross �xed investmentExports Imports Real GDP growth (market prices)
GDP growth by componentPercent, y-o-y
Source: World BankNote: est = estimate, f = forecast
FIGURE 31: Growth is expected to accelerate across the region.
0123456789
2015 2016 (est) 2017 (f) 2018 (f)Bhutan (CY) India (FY) Bangladesh (FY) Pakistan (FY)
Sri Lanka (CY)Nepal (FY) Maldives (CY) Afghanistan (CY)Source: World BankNote: CY = calendar year, FY = financial year, est = estimate, f = forecast
Real GDP growthPercent, y-o-y
TABLE 1: Growth is expected to accelerate across most of the region
Real GDP growth 2015 2016 (est) 2017 (f) 2018 (f)
Afghanistan (CY) 0.8 1.2 2.4 3.4
Bangladesh (FY) 6.6 7.1 6.8 6.4
Bhutan (CY) 6.5 6.8 6.8 7.7
India (FY) 7.9 6.8 7.2 7.5
Maldives (CY) 2.8 4.1 4.5 4.6
Nepal (FY) 2.7 0.6 6.0 5.5
Pakistan (FY, at factor cost) 4.0 4.7 5.2 5.5
Sri Lanka (CY) 4.8 4.4 4.7 5.0
Source: World BankNote: CY = calendar year, FY = financial year, est = estimate, f = forecast
GLOBALIZATION BACKLASH
21
number of resorts and large FDI inflows, Maldives is ex-pected to sustain a growth rate above 4 percent that will gradually accelerate.
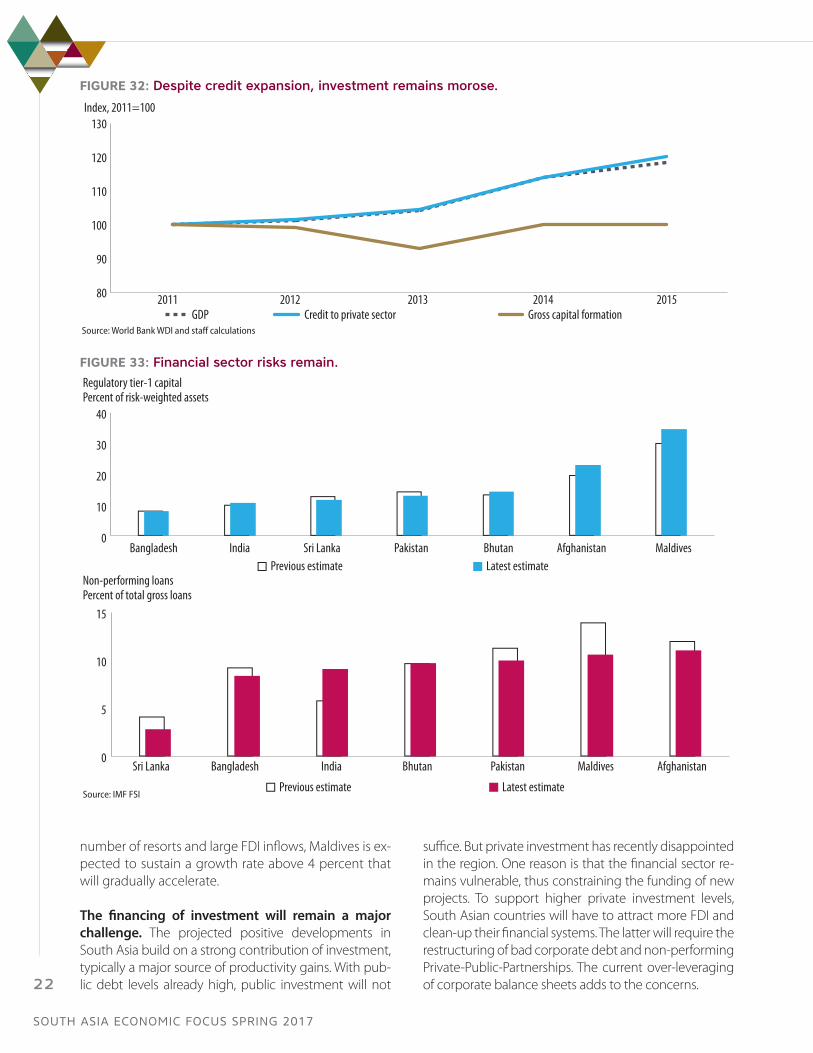
The financing of investment will remain a major challenge. The projected positive developments in South Asia build on a strong contribution of investment, typically a major source of productivity gains. With pub-lic debt levels already high, public investment will not
suffice. But private investment has recently disappointed in the region. One reason is that the financial sector re-mains vulnerable, thus constraining the funding of new projects. To support higher private investment levels, South Asian countries will have to attract more FDI and clean-up their financial systems. The latter will require the restructuring of bad corporate debt and non-performing Private-Public-Partnerships. The current over-leveraging of corporate balance sheets adds to the concerns.
FIGURE 32: Despite credit expansion, investment remains morose.
80
90
100
110
120
130
2011 2012 2013 2014 2015
Index, 2011=100
GDP Credit to private sector Gross capital formationSource: World Bank WDI and staff calculations
FIGURE 33: Financial sector risks remain.
0
10
20
30
40
Bangladesh
Bangladesh
India
India
Sri Lanka
Sri Lanka
Pakistan
Pakistan
Bhutan
Bhutan
Afghanistan
Afghanistan
Maldives
Maldives
Previous estimate Latest estimate
Regulatory tier-1 capitalPercent of risk-weighted assets
0
5
10
15
Previous estimate Latest estimate
Non-performing loansPercent of total gross loans
Source: IMF FSI
SOUTH ASIA ECONOMIC FOCUS SPRING 2017
22
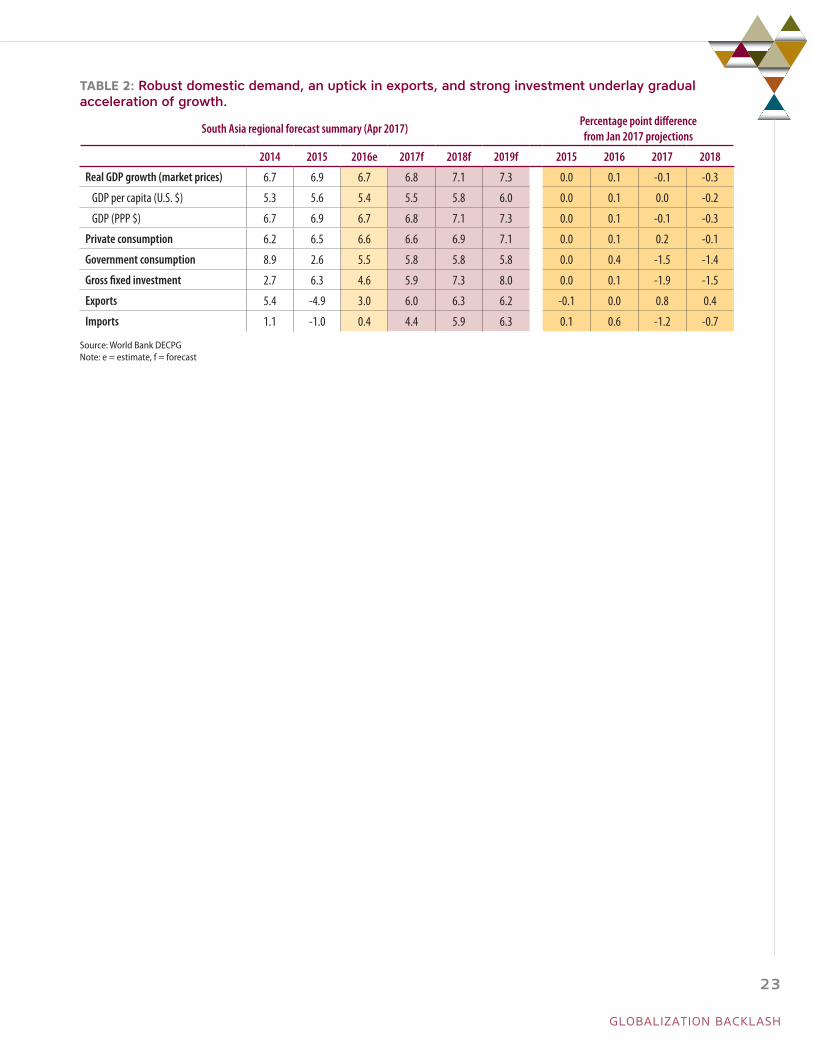
TABLE 2: Robust domestic demand, an uptick in exports, and strong investment underlay gradual acceleration of growth.
South Asia regional forecast summary (Apr 2017)Percentage point difference from Jan 2017 projections
2014 2015 2016e 2017f 2018f 2019f 2015 2016 2017 2018
Real GDP growth (market prices) 6.7 6.9 6.7 6.8 7.1 7.3 0.0 0.1 -0.1 -0.3
GDP per capita (U.S. $) 5.3 5.6 5.4 5.5 5.8 6.0 0.0 0.1 0.0 -0.2
GDP (PPP $) 6.7 6.9 6.7 6.8 7.1 7.3 0.0 0.1 -0.1 -0.3
Private consumption 6.2 6.5 6.6 6.6 6.9 7.1 0.0 0.1 0.2 -0.1
Government consumption 8.9 2.6 5.5 5.8 5.8 5.8 0.0 0.4 -1.5 -1.4
Gross fixed investment 2.7 6.3 4.6 5.9 7.3 8.0 0.0 0.1 -1.9 -1.5
Exports 5.4 -4.9 3.0 6.0 6.3 6.2 -0.1 0.0 0.8 0.4
Imports 1.1 -1.0 0.4 4.4 5.9 6.3 0.1 0.6 -1.2 -0.7
Source: World Bank DECPGNote: e = estimate, f = forecast
GLOBALIZATION BACKLASH
23
Globalization backlash
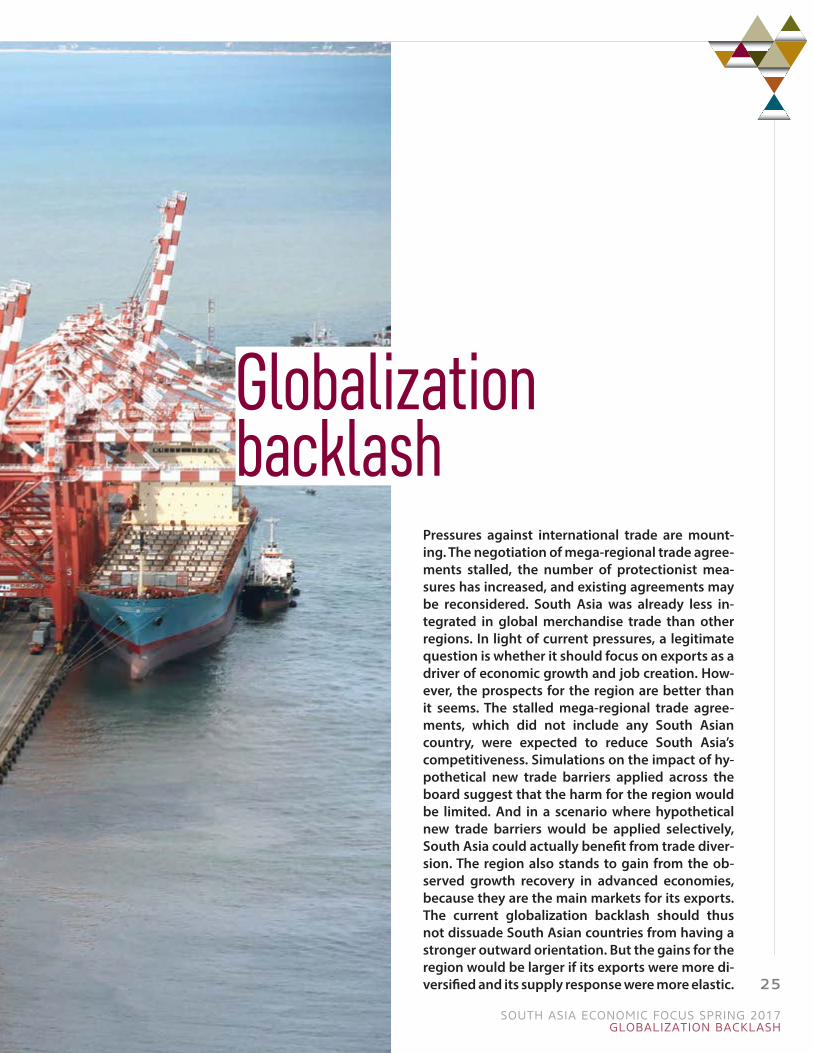
Pressures against international trade are mount-ing. The negotiation of mega-regional trade agree-ments stalled, the number of protectionist mea-sures has increased, and existing agreements may be reconsidered. South Asia was already less in-tegrated in global merchandise trade than other regions. In light of current pressures, a legitimate question is whether it should focus on exports as a driver of economic growth and job creation. How-ever, the prospects for the region are better than it seems. The stalled mega-regional trade agree-ments, which did not include any South Asian country, were expected to reduce South Asia’s competitiveness. Simulations on the impact of hy-pothetical new trade barriers applied across the board suggest that the harm for the region would be limited. And in a scenario where hypothetical new trade barriers would be applied selectively, South Asia could actually benefit from trade diver-sion. The region also stands to gain from the ob-served growth recovery in advanced economies, because they are the main markets for its exports. The current globalization backlash should thus not dissuade South Asian countries from having a stronger outward orientation. But the gains for the region would be larger if its exports were more di-versified and its supply response were more elastic.
SOUTH ASIA ECONOMIC FOCUS SPRING 2017GLOBALIZATION BACKLASH
25
Global trade is under threatAnti-trade moves are on the rise. The number of trade restrictions has been slowly increasing across the world, reaching last year a post-crisis high. Emerging markets and developing economies have engaged in a broad set of restrictive measures including import tar-iffs and export taxes. And advanced economies have enacted numerous trade defense measures. Recent political developments suggest that for many people in advanced economies globalization has gone too far. The vote for Brexit in the UK, and the election of Don-ald Trump as US President, have been interpreted as signaling a further shift against the international trade architecture built over the last few decades.
The future of trade policies is uncertain. Until not so long ago the World Trade Organization was a key player in negotiating global reductions in trade barriers. The last series of negotiations, the so-called Doha Round, aimed for a major reform of the international trading system through even lower barriers and upgraded standards. As no agreement could be reached, ef-forts shifted to the negotiation of mega-regional trade agreements with a broad geographic and economic coverage. The Trans-Pacific Partnership (TPP) original-ly included twelve countries which together account for roughly 40 percent of global GDP. The Transatlantic Trade and Investment Partnership (TTIP) was supposed to bring the US and the EU closer together. Because of their scope, these mega-regional trade agreements were expected to take global integration to a higher level. But with the recently announced US withdrawal from TPP and strong reservations against TTIP both in
the US and the EU, negotiations are effectively stalled. More recently, US President Trump signed two execu-tive orders aimed at tackling possible trade abuses, raising the prospects of trade barriers against imports from countries with large trade surpluses. In light of these developments, there is concern that interna-tional trade will be increasingly restricted. Much will depend on how the US trade policy agenda evolves.
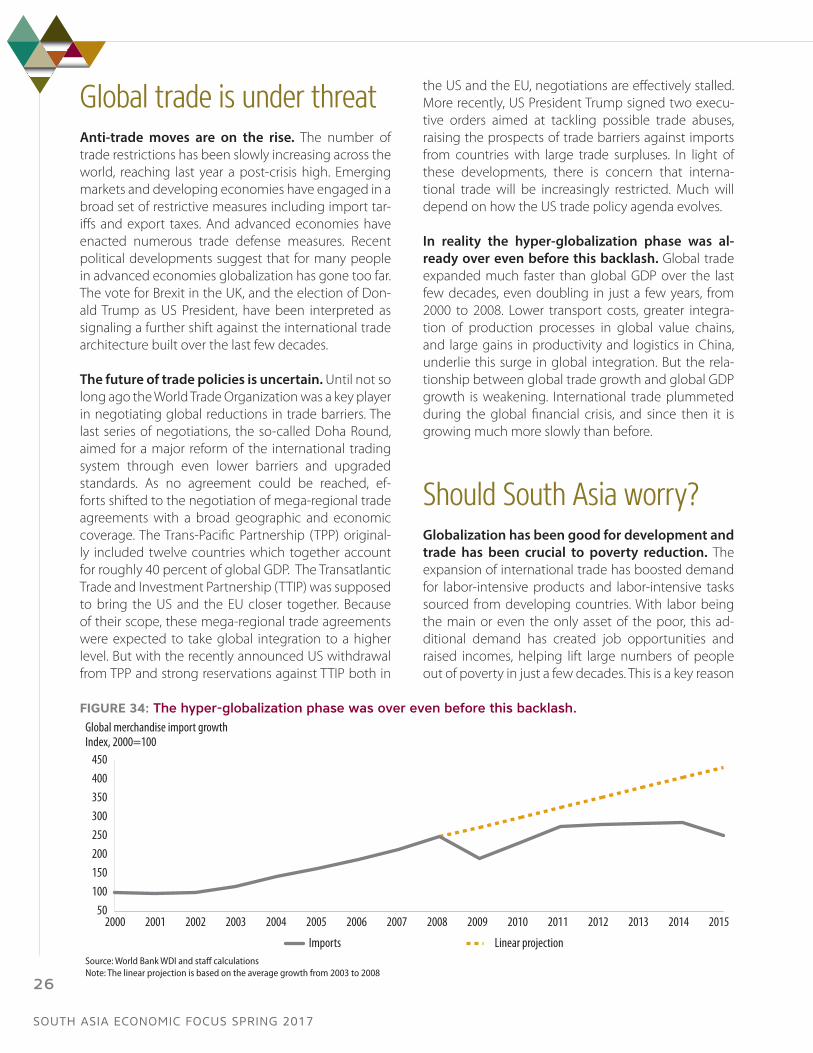
In reality the hyper-globalization phase was al-ready over even before this backlash. Global trade expanded much faster than global GDP over the last few decades, even doubling in just a few years, from 2000 to 2008. Lower transport costs, greater integra-tion of production processes in global value chains, and large gains in productivity and logistics in China, underlie this surge in global integration. But the rela-tionship between global trade growth and global GDP growth is weakening. International trade plummeted during the global financial crisis, and since then it is growing much more slowly than before.
Should South Asia worry?Globalization has been good for development and trade has been crucial to poverty reduction. The expansion of international trade has boosted demand for labor-intensive products and labor-intensive tasks sourced from developing countries. With labor being the main or even the only asset of the poor, this ad-ditional demand has created job opportunities and raised incomes, helping lift large numbers of people out of poverty in just a few decades. This is a key reason
FIGURE 34: The hyper-globalization phase was over even before this backlash.
50100150200250300350400450
Global merchandise import growthIndex, 2000=100
Imports Linear projectionSource: World Bank WDI and staff calculationsNote: The linear projection is based on the average growth from 2003 to 2008
2000 2001 2002 2003 2004 2005 2006 2007 2008 2009 2010 2011 2012 2013 2014 2015
SOUTH ASIA ECONOMIC FOCUS SPRING 2017
26
why the prospect of rising protectionism is a matter for concern. Protectionism can take multiple forms, in-volving a combination of tariff and non-tariff measures. Increasing trade barriers across the board unambigu-ously reduces international trade. But if barriers are in-creased unevenly across countries, there can be trade diversion in addition to trade destruction.
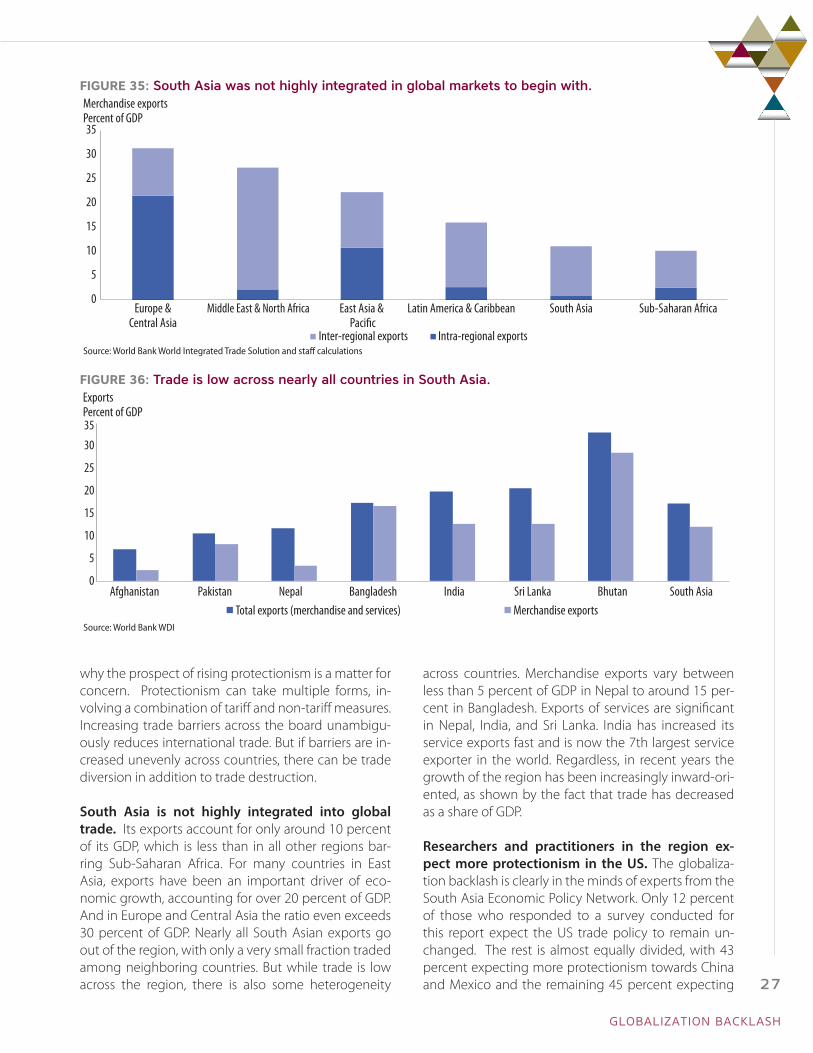
South Asia is not highly integrated into global trade. Its exports account for only around 10 percent of its GDP, which is less than in all other regions bar-ring Sub-Saharan Africa. For many countries in East Asia, exports have been an important driver of eco-nomic growth, accounting for over 20 percent of GDP. And in Europe and Central Asia the ratio even exceeds 30 percent of GDP. Nearly all South Asian exports go out of the region, with only a very small fraction traded among neighboring countries. But while trade is low across the region, there is also some heterogeneity
across countries. Merchandise exports vary between less than 5 percent of GDP in Nepal to around 15 per-cent in Bangladesh. Exports of services are significant in Nepal, India, and Sri Lanka. India has increased its service exports fast and is now the 7th largest service exporter in the world. Regardless, in recent years the growth of the region has been increasingly inward-ori-ented, as shown by the fact that trade has decreased as a share of GDP.
Researchers and practitioners in the region ex-pect more protectionism in the US. The globaliza-tion backlash is clearly in the minds of experts from the South Asia Economic Policy Network. Only 12 percent of those who responded to a survey conducted for this report expect the US trade policy to remain un-changed. The rest is almost equally divided, with 43 percent expecting more protectionism towards China and Mexico and the remaining 45 percent expecting
FIGURE 35: South Asia was not highly integrated in global markets to begin with.
0
5
10
15
20
25
30
35
Europe & Central Asia
Middle East & North Africa East Asia & Paci�c
Latin America & Caribbean South Asia Sub-Saharan Africa
Merchandise exportsPercent of GDP
Inter-regional exports Intra-regional exportsSource: World Bank World Integrated Trade Solution and staff calculations
FIGURE 36: Trade is low across nearly all countries in South Asia.
0
5
10
15
20
25
30
35
Total exports (merchandise and services) Merchandise exportsSource: World Bank WDI
ExportsPercent of GDP
Afghanistan Pakistan Nepal Bangladesh India Sri Lanka Bhutan South Asia
GLOBALIZATION BACKLASH
27

more protectionism across the board, including to-wards South Asia. Hence an overwhelming majority anticipates more protectionism, in one form or the other. This broad consensus calls for rigorous analy-sis aimed at understanding how mounting barriers to trade would affect the region.
The implications of the globalization backlash for South Asia are not straightforward. Given the pros-pect of rising protectionism, it could be argued that South Asia should not even try to rely on exports as a driver of growth. If the region found it difficult to ex-port already in the time of hyper-globalization, how challenging would it be now? This export pessimism is often reinforced by concerns about so-called prema-ture deindustrialization. The share of manufacturing in total GDP typically peaks at some point in a country’s structural transformation, as it transitions from agrarian
economy to advanced society. But the level of the peak is becoming lower over time, undermining indus-trialization hopes among late-comers. It is thus legiti-mate to ask whether South Asia should follow on the steps of East Asia and aim for export-driven growth.
Numerical simulations provide a clearer perspec-tive on South Asia’s trade prospects than theoreti-cal speculation. Four methodological approaches are used in what follows. First, an analytical review of research on TPP and TTIP allows quantifying the pos-sible impact of these mega-regional trade agreements failing to materialize. Two other approaches are used to illustrate the consequences of hypothetical trade policy scenarios. These scenarios are not predictions about commercial policy in advanced economies, which this report does not make. They are only meant to inform a concerned region. One of the scenarios (trade destruction) involves a relatively small hike in US tariffs across the board; the other (trade diversion), a larger hike in tariffs against China and Mexico only. Under the assumption of approximately linear effects, these scenarios can be combined, or multiplied, to explore the possible consequences of more dramatic protectionist moves. The second methodological ap-proach in this report employs a computable general equilibrium (CGE) model to understand the impact of these scenarios. CGE models reproduce the structure of the economy as a whole as realistically as possible, taking into account market interactions between households and firms, as well as technical linkages between sectors. The third approach adds granular-ity to this analysis by using a microeconometric trade model comprising thousands of products. While this approach incorporates less economic structure than a CGE model, it takes into account the relationship
FIGURE 37: Economic growth was already becoming inward-oriented.
0
50
100
150
200
250
Exports of goods and servicesIndex, 2000 = 100
Bangladesh Bhutan India Maldives Nepal Pakistan Sri LankaSource: World Bank WDI and staff calculations
2000 2001 2002 2003 2004 2005 2006 2007 2008 2009 2010 2011 2012 2013 2014 2015
FIGURE 38: Researchers and practitioners expect more protectionism.What do you expect to happen with US trade policy?Proportion of responses
UnchangedMore protectionist towards Mexico and China
More protectionist across the board, including South Asia
Source: South Asia Economic Policy Network
SOUTH ASIA ECONOMIC FOCUS SPRING 2017
28
between the price of a product and the quantity de-manded of it by international buyers on a product-by-product basis. Finally, the fourth approach is based on time-series analysis of aggregate indicators. In this case the methodology captures the dynamic relation-ship between key indicators such as GDP growth in advanced economies and in South Asia. All four ap-proaches involve simplifying hypotheses that could be questioned. But the combination of the four gives some reassurance about the robustness of the find-ings. Further insights come from systematically com-paring the results of these approaches with the views and predictions of experts from the region.
Gains from trade diversionTPP and TTIP were expected to have a small nega-tive impact on the region. Research about the effects of the two mega-regional trade agreements conclud-ed that both would have had adverse repercussions on the region. Some aspects of such agreements, for example in the realm of regulation, tend to be non-discriminatory in nature and benefit both member and non-member countries. However, by giving their members tariff-free access to each other’s markets, agreements like TPP and TTIP were expected to lead to trade diversion. The estimated impact of TPP on South Asia was larger, but the impact of TTIP was comparable in magnitude. The completion of these agreements would have caused large losses to exports of textiles and clothing from Nepal and Bangladesh. From TPP alone, exports of textiles and clothing from Vietnam – a major competitor for South Asian countries – would have increased by about 40 percent, mostly due to the
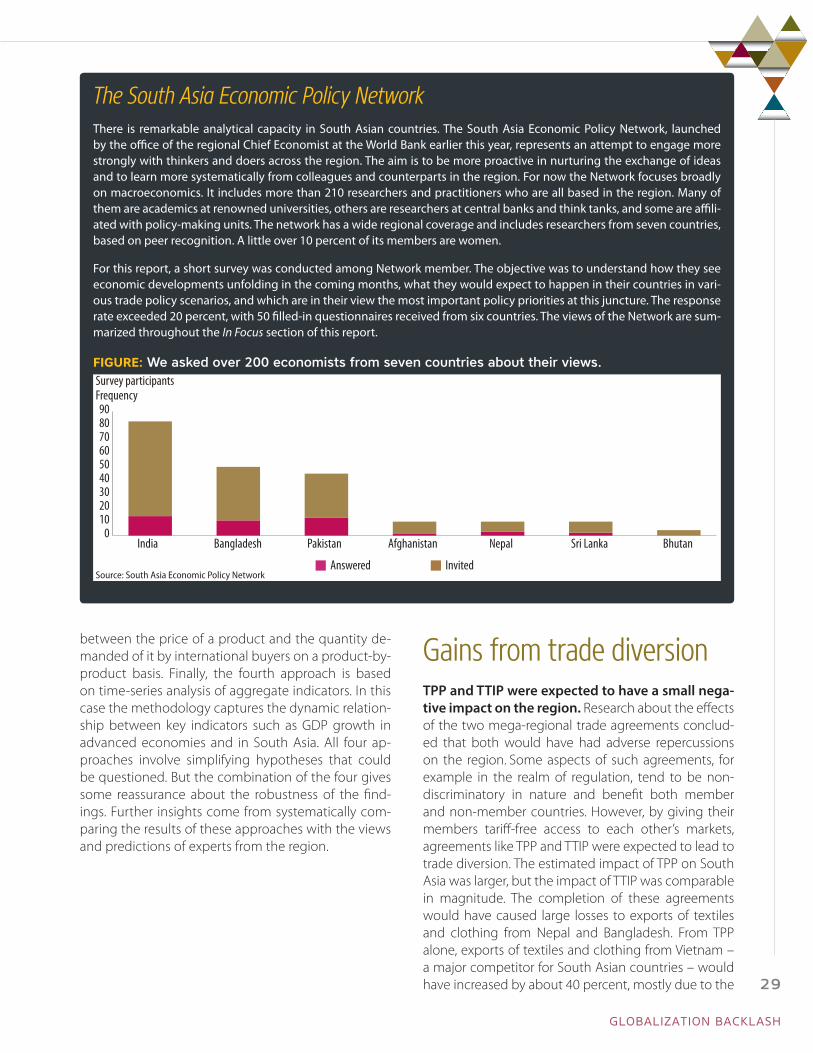
The South Asia Economic Policy NetworkThere is remarkable analytical capacity in South Asian countries. The South Asia Economic Policy Network, launched by the office of the regional Chief Economist at the World Bank earlier this year, represents an attempt to engage more strongly with thinkers and doers across the region. The aim is to be more proactive in nurturing the exchange of ideas and to learn more systematically from colleagues and counterparts in the region. For now the Network focuses broadly on macroeconomics. It includes more than 210 researchers and practitioners who are all based in the region. Many of them are academics at renowned universities, others are researchers at central banks and think tanks, and some are affili-ated with policy-making units. The network has a wide regional coverage and includes researchers from seven countries, based on peer recognition. A little over 10 percent of its members are women.
For this report, a short survey was conducted among Network member. The objective was to understand how they see economic developments unfolding in the coming months, what they would expect to happen in their countries in vari-ous trade policy scenarios, and which are in their view the most important policy priorities at this juncture. The response rate exceeded 20 percent, with 50 filled-in questionnaires received from six countries. The views of the Network are sum-marized throughout the In Focus section of this report.
FIGURE: We asked over 200 economists from seven countries about their views.
0102030405060708090
India Bangladesh Pakistan Afghanistan Nepal Sri Lanka Bhutan
Survey participantsFrequency
Source: South Asia Economic Policy NetworkAnswered Invited
GLOBALIZATION BACKLASH
29
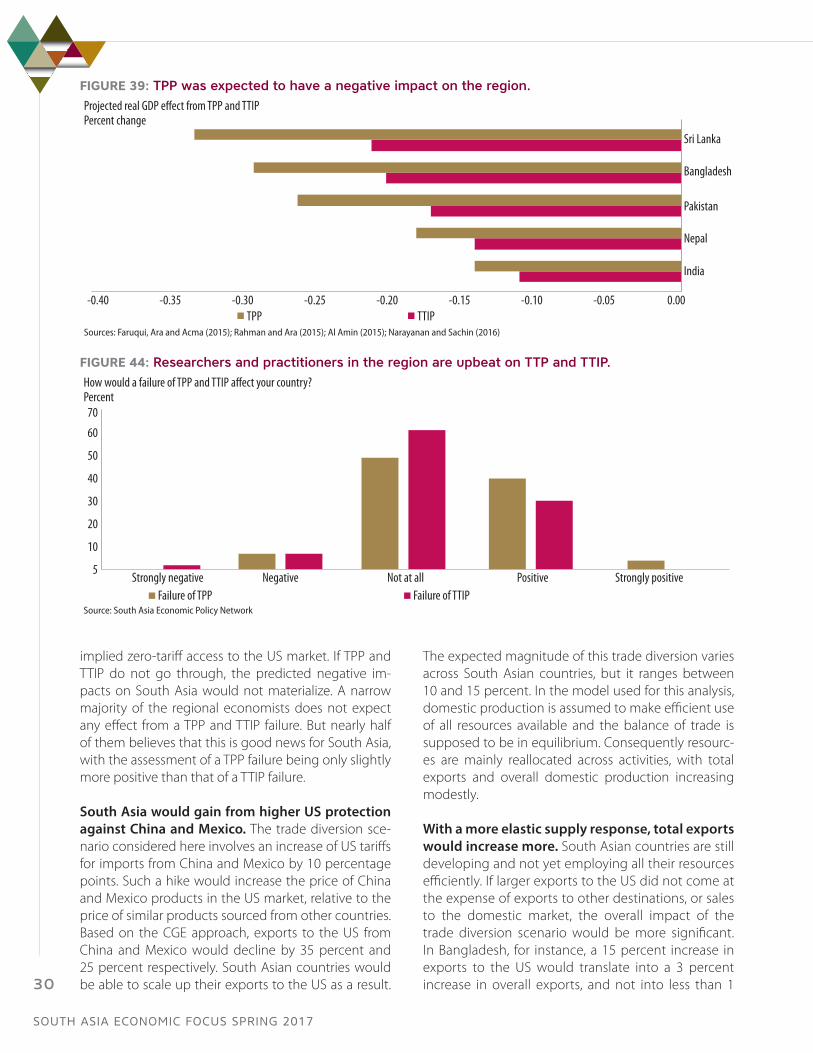
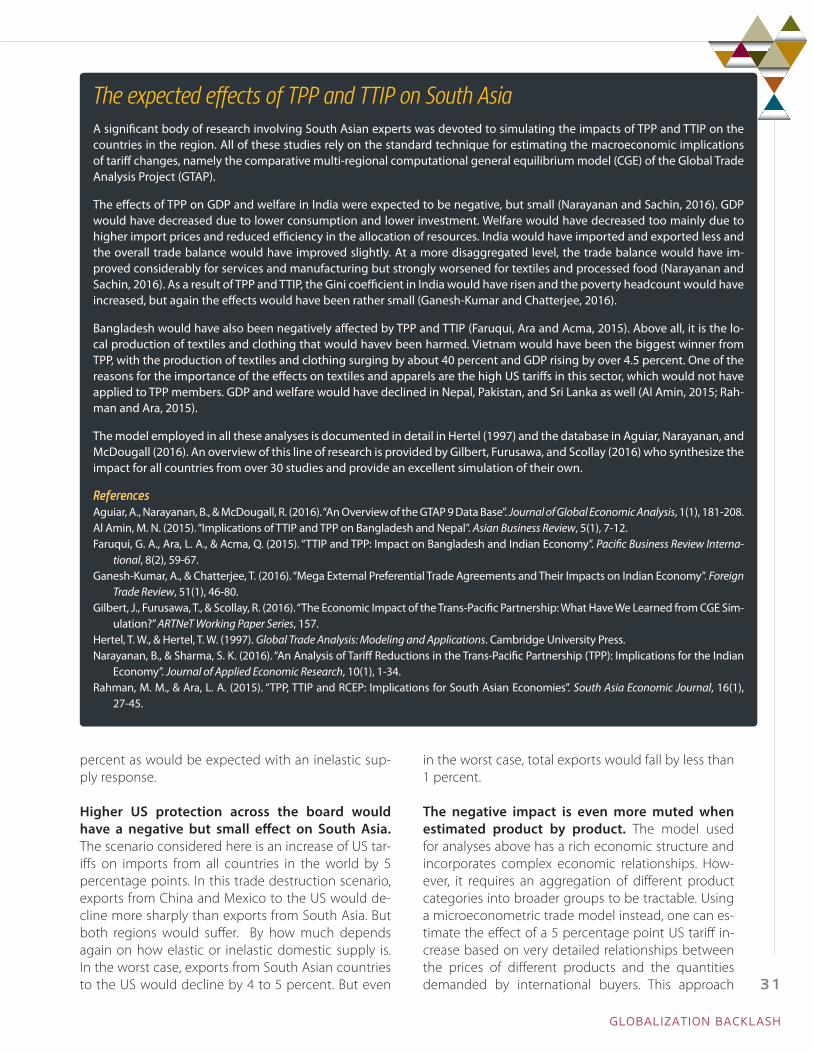
implied zero-tariff access to the US market. If TPP and TTIP do not go through, the predicted negative im-pacts on South Asia would not materialize. A narrow majority of the regional economists does not expect any effect from a TPP and TTIP failure. But nearly half of them believes that this is good news for South Asia, with the assessment of a TPP failure being only slightly more positive than that of a TTIP failure.
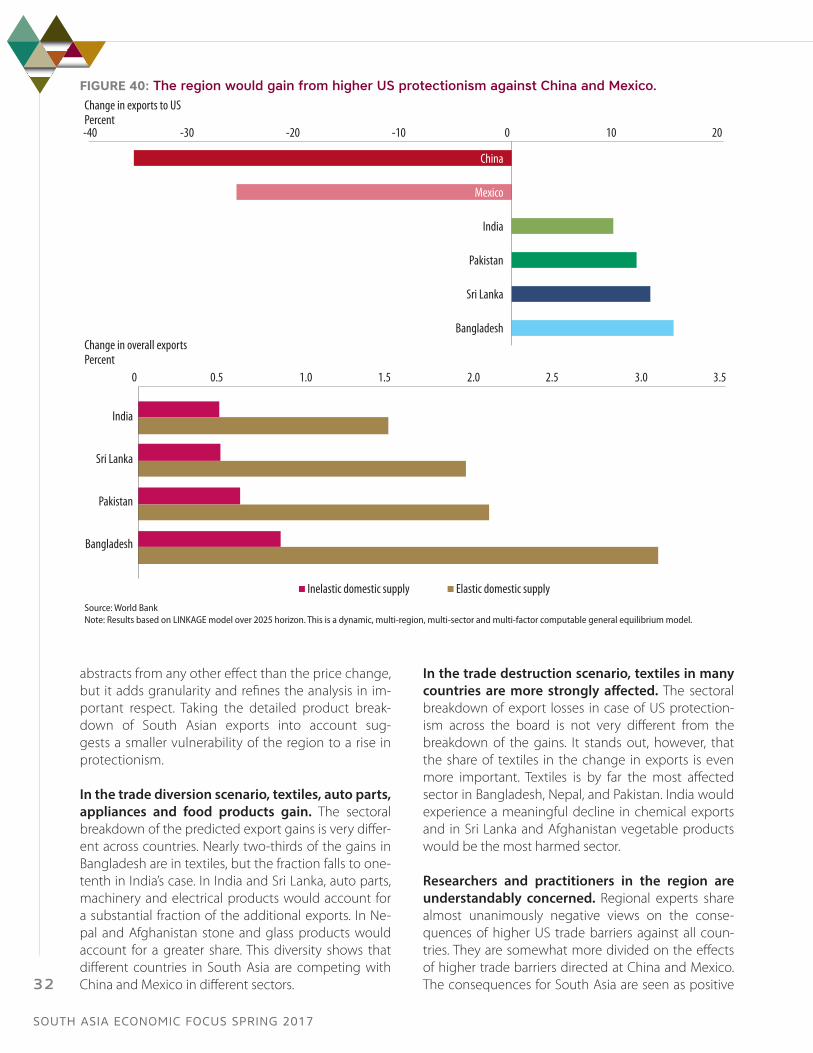
South Asia would gain from higher US protection against China and Mexico. The trade diversion sce-nario considered here involves an increase of US tariffs for imports from China and Mexico by 10 percentage points. Such a hike would increase the price of China and Mexico products in the US market, relative to the price of similar products sourced from other countries. Based on the CGE approach, exports to the US from China and Mexico would decline by 35 percent and 25 percent respectively. South Asian countries would be able to scale up their exports to the US as a result.
The expected magnitude of this trade diversion varies across South Asian countries, but it ranges between 10 and 15 percent. In the model used for this analysis, domestic production is assumed to make efficient use of all resources available and the balance of trade is supposed to be in equilibrium. Consequently resourc-es are mainly reallocated across activities, with total exports and overall domestic production increasing modestly.
With a more elastic supply response, total exports would increase more. South Asian countries are still developing and not yet employing all their resources efficiently. If larger exports to the US did not come at the expense of exports to other destinations, or sales to the domestic market, the overall impact of the trade diversion scenario would be more significant. In Bangladesh, for instance, a 15 percent increase in exports to the US would translate into a 3 percent increase in overall exports, and not into less than 1
FIGURE 39: TPP was expected to have a negative impact on the region.
-0.40 -0.35 -0.30 -0.25 -0.20 -0.15 -0.10 -0.05 0.00
India
Nepal
Bangladesh
Pakistan
Sri Lanka
Projected real GDP e�ect from TPP and TTIPPercent change
TPP TTIPSources: Faruqui, Ara and Acma (2015); Rahman and Ara (2015); Al Amin (2015); Narayanan and Sachin (2016)
FIGURE 44: Researchers and practitioners in the region are upbeat on TTP and TTIP.
5
10
20
30
40
50
60
70
Strongly negative Negative Not at all Positive Strongly positive
How would a failure of TPP and TTIP a�ect your country?Percent
Failure of TPP Failure of TTIPSource: South Asia Economic Policy Network
SOUTH ASIA ECONOMIC FOCUS SPRING 2017
30
percent as would be expected with an inelastic sup-ply response.
Higher US protection across the board would have a negative but small effect on South Asia. The scenario considered here is an increase of US tar-iffs on imports from all countries in the world by 5 percentage points. In this trade destruction scenario, exports from China and Mexico to the US would de-cline more sharply than exports from South Asia. But both regions would suffer. By how much depends again on how elastic or inelastic domestic supply is. In the worst case, exports from South Asian countries to the US would decline by 4 to 5 percent. But even
in the worst case, total exports would fall by less than 1 percent.
The negative impact is even more muted when estimated product by product. The model used for analyses above has a rich economic structure and incorporates complex economic relationships. How-ever, it requires an aggregation of different product categories into broader groups to be tractable. Using a microeconometric trade model instead, one can es-timate the effect of a 5 percentage point US tariff in-crease based on very detailed relationships between the prices of different products and the quantities demanded by international buyers. This approach
The expected effects of TPP and TTIP on South AsiaA significant body of research involving South Asian experts was devoted to simulating the impacts of TPP and TTIP on the countries in the region. All of these studies rely on the standard technique for estimating the macroeconomic implications of tariff changes, namely the comparative multi-regional computational general equilibrium model (CGE) of the Global Trade Analysis Project (GTAP).
The effects of TPP on GDP and welfare in India were expected to be negative, but small (Narayanan and Sachin, 2016). GDP would have decreased due to lower consumption and lower investment. Welfare would have decreased too mainly due to higher import prices and reduced efficiency in the allocation of resources. India would have imported and exported less and the overall trade balance would have improved slightly. At a more disaggregated level, the trade balance would have im-proved considerably for services and manufacturing but strongly worsened for textiles and processed food (Narayanan and Sachin, 2016). As a result of TPP and TTIP, the Gini coefficient in India would have risen and the poverty headcount would have increased, but again the effects would have been rather small (Ganesh-Kumar and Chatterjee, 2016).
Bangladesh would have also been negatively affected by TPP and TTIP (Faruqui, Ara and Acma, 2015). Above all, it is the lo-cal production of textiles and clothing that would havev been harmed. Vietnam would have been the biggest winner from TPP, with the production of textiles and clothing surging by about 40 percent and GDP rising by over 4.5 percent. One of the reasons for the importance of the effects on textiles and apparels are the high US tariffs in this sector, which would not have applied to TPP members. GDP and welfare would have declined in Nepal, Pakistan, and Sri Lanka as well (Al Amin, 2015; Rah-man and Ara, 2015).
The model employed in all these analyses is documented in detail in Hertel (1997) and the database in Aguiar, Narayanan, and McDougall (2016). An overview of this line of research is provided by Gilbert, Furusawa, and Scollay (2016) who synthesize the impact for all countries from over 30 studies and provide an excellent simulation of their own.
ReferencesAguiar, A., Narayanan, B., & McDougall, R. (2016). “An Overview of the GTAP 9 Data Base”. Journal of Global Economic Analysis, 1(1), 181-208.Al Amin, M. N. (2015). “Implications of TTIP and TPP on Bangladesh and Nepal”. Asian Business Review, 5(1), 7-12.Faruqui, G. A., Ara, L. A., & Acma, Q. (2015). “TTIP and TPP: Impact on Bangladesh and Indian Economy”. Pacific Business Review Interna-
tional, 8(2), 59-67.Ganesh-Kumar, A., & Chatterjee, T. (2016). “Mega External Preferential Trade Agreements and Their Impacts on Indian Economy”. Foreign
Trade Review, 51(1), 46-80.Gilbert, J., Furusawa, T., & Scollay, R. (2016). “The Economic Impact of the Trans-Pacific Partnership: What Have We Learned from CGE Sim-
ulation?” ARTNeT Working Paper Series, 157.Hertel, T. W., & Hertel, T. W. (1997). Global Trade Analysis: Modeling and Applications. Cambridge University Press.Narayanan, B., & Sharma, S. K. (2016). “An Analysis of Tariff Reductions in the Trans-Pacific Partnership (TPP): Implications for the Indian
Economy”. Journal of Applied Economic Research, 10(1), 1-34.Rahman, M. M., & Ara, L. A. (2015). “TPP, TTIP and RCEP: Implications for South Asian Economies”. South Asia Economic Journal, 16(1),
27-45.
GLOBALIZATION BACKLASH
31
abstracts from any other effect than the price change, but it adds granularity and refines the analysis in im-portant respect. Taking the detailed product break-down of South Asian exports into account sug-gests a smaller vulnerability of the region to a rise in protectionism.
In the trade diversion scenario, textiles, auto parts, appliances and food products gain. The sectoral breakdown of the predicted export gains is very differ-ent across countries. Nearly two-thirds of the gains in Bangladesh are in textiles, but the fraction falls to one-tenth in India’s case. In India and Sri Lanka, auto parts, machinery and electrical products would account for a substantial fraction of the additional exports. In Ne-pal and Afghanistan stone and glass products would account for a greater share. This diversity shows that different countries in South Asia are competing with China and Mexico in different sectors.
In the trade destruction scenario, textiles in many countries are more strongly affected. The sectoral breakdown of export losses in case of US protection-ism across the board is not very different from the breakdown of the gains. It stands out, however, that the share of textiles in the change in exports is even more important. Textiles is by far the most affected sector in Bangladesh, Nepal, and Pakistan. India would experience a meaningful decline in chemical exports and in Sri Lanka and Afghanistan vegetable products would be the most harmed sector.
Researchers and practitioners in the region are understandably concerned. Regional experts share almost unanimously negative views on the conse-quences of higher US trade barriers against all coun-tries. They are somewhat more divided on the effects of higher trade barriers directed at China and Mexico. The consequences for South Asia are seen as positive
FIGURE 40: The region would gain from higher US protectionism against China and Mexico.
-40 -30 -20 -10 0 10 20
China
Mexico
India
Pakistan
Sri Lanka
Bangladesh
Change in exports to USPercent
Change in overall exportsPercent
India
Sri Lanka
Pakistan
Bangladesh
0 0.5 1.0 1.5 2.0 2.5 3.0 3.5
Inelastic domestic supply Elastic domestic supplySource: World BankNote: Results based on LINKAGE model over 2025 horizon. This is a dynamic, multi-region, multi-sector and multi-factor computable general equilibrium model.
SOUTH ASIA ECONOMIC FOCUS SPRING 2017
32
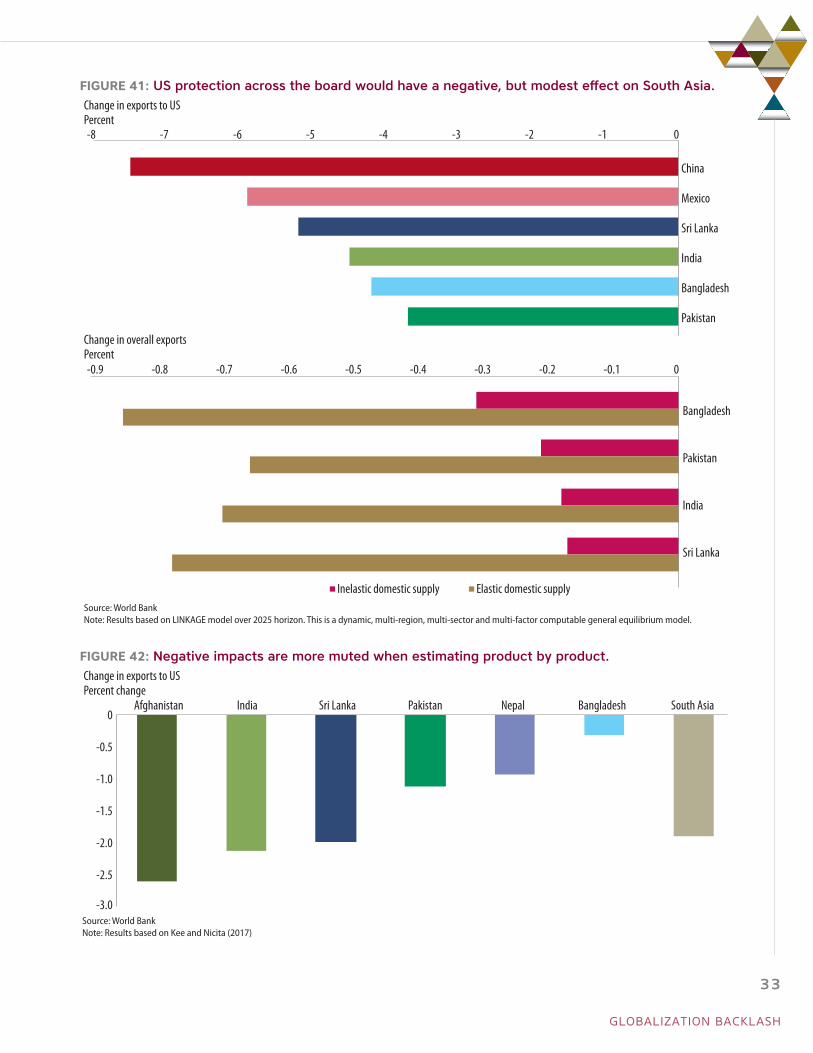
FIGURE 41: US protection across the board would have a negative, but modest effect on South Asia.
-8 -7 -6 -5 -4 -3 -2 -1 0
China
Mexico
Sri Lanka
India
Bangladesh
Pakistan
Change in exports to USPercent
-0.9 -0.8 -0.7 -0.6 -0.5 -0.4 -0.3 -0.2 -0.1 0
Bangladesh
Pakistan
India
Sri Lanka
Change in overall exportsPercent
Inelastic domestic supply Elastic domestic supplySource: World BankNote: Results based on LINKAGE model over 2025 horizon. This is a dynamic, multi-region, multi-sector and multi-factor computable general equilibrium model.
FIGURE 42: Negative impacts are more muted when estimating product by product.
-3.0
-2.5
-2.0
-1.5
-1.0
-0.5
0Afghanistan India Sri Lanka Pakistan Nepal Bangladesh South Asia
Change in exports to US Percent change
Source: World BankNote: Results based on Kee and Nicita (2017)
GLOBALIZATION BACKLASH
33

FIGURE 43: Textiles, auto parts, appliances and food gain in the trade diversion scenario.
0 10 20 30 40 50 60 70 80 90 100
Bangladesh
Pakistan
Sri Lanka
Nepal
India
Afghanistan
South Asia
Sectoral breakdown of increase in exportsPercent of total
Textiles Chemicals & allied industries Machinery / electrical Vegetable productsAnimal & animal products Metals Mineral products Wood & wood productsStone / glass Transportation Foodstu�s Other
Source: World BankNote: Results based on Kee and Nicita (2017)
FIGURE 44: Textiles, chemicals and vegetable products lose in the trade destruction scenario.Sectoral breakdown of decrease in exports Percent of total
Bangladesh
Nepal
Pakistan
Sri Lanka
Afghanistan
India
South Asia
Textiles Chemicals & allied industries Machinery / electrical Vegetable productsAnimal & animal products Metals Mineral products Wood & wood productsStone / glass Transportation Foodstu�s Other
Source: World BankNote: Results based on Kee and Nicita (2017)
0 10 20 30 40 50 60 70 80 90 100
or strongly positive by 47 percent, and 29 percent ex-pect no change at all. But 24 percent still anticipate negative or strongly negative effects. This assessment is more pessimistic than the numerical simulations for the trade diversion scenario would lead to expect. One
possible reason for this divergence may be different expectations about the strength of the measures. An-other could be the expectation that any form of pro-tectionism will affect the overall business environment, and international trade with it.
SOUTH ASIA ECONOMIC FOCUS SPRING 2017
34
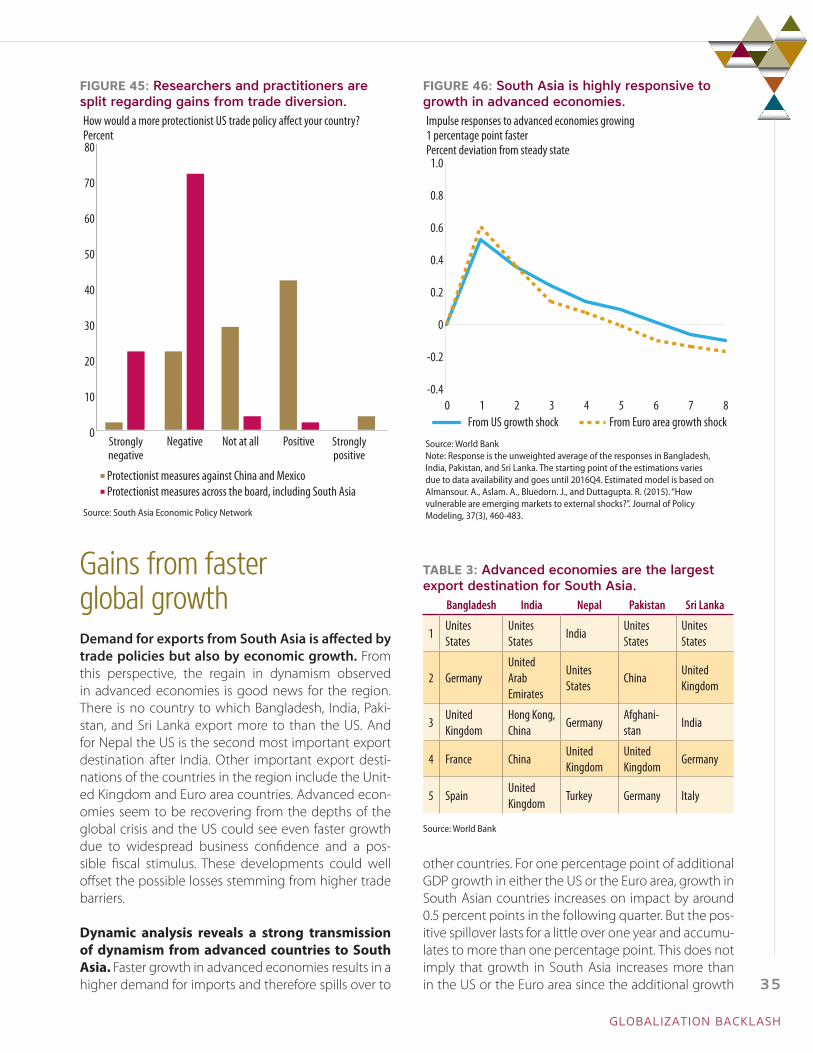
FIGURE 45: Researchers and practitioners are split regarding gains from trade diversion.
0
10
20
30
40
50
60
70
80
Stronglynegative
Negative Not at all Positive Stronglypositive
How would a more protectionist US trade policy a�ect your country?Percent
Protectionist measures against China and MexicoProtectionist measures across the board, including South Asia
Source: South Asia Economic Policy Network
FIGURE 46: South Asia is highly responsive to growth in advanced economies.
-0.4
-0.2
0
0.2
0.4
0.6
0.8
1.0
From US growth shock From Euro area growth shock
Impulse responses to advanced economies growing 1 percentage point fasterPercent deviation from steady state
Source: World BankNote: Response is the unweighted average of the responses in Bangladesh, India, Pakistan, and Sri Lanka. The starting point of the estimations varies due to data availability and goes until 2016Q4. Estimated model is based on Almansour. A., Aslam. A., Bluedorn. J., and Duttagupta. R. (2015). “How vulnerable are emerging markets to external shocks?”. Journal of Policy Modeling, 37(3), 460-483.
0 1 2 3 4 5 6 7 8
Gains from faster global growthDemand for exports from South Asia is affected by trade policies but also by economic growth. From this perspective, the regain in dynamism observed in advanced economies is good news for the region. There is no country to which Bangladesh, India, Paki-stan, and Sri Lanka export more to than the US. And for Nepal the US is the second most important export destination after India. Other important export desti-nations of the countries in the region include the Unit-ed Kingdom and Euro area countries. Advanced econ-omies seem to be recovering from the depths of the global crisis and the US could see even faster growth due to widespread business confidence and a pos-sible fiscal stimulus. These developments could well offset the possible losses stemming from higher trade barriers.
Dynamic analysis reveals a strong transmission of dynamism from advanced countries to South Asia. Faster growth in advanced economies results in a higher demand for imports and therefore spills over to
other countries. For one percentage point of additional GDP growth in either the US or the Euro area, growth in South Asian countries increases on impact by around 0.5 percent points in the following quarter. But the pos-itive spillover lasts for a little over one year and accumu-lates to more than one percentage point. This does not imply that growth in South Asia increases more than in the US or the Euro area since the additional growth
TABLE 3: Advanced economies are the largest export destination for South Asia.
Bangladesh India Nepal Pakistan Sri Lanka
1Unites States
Unites States
IndiaUnites States
Unites States
2 GermanyUnited Arab Emirates
Unites States
ChinaUnited Kingdom
3United Kingdom
Hong Kong, China
GermanyAfghani-stan
India
4 France ChinaUnited Kingdom
United Kingdom
Germany
5 SpainUnited Kingdom
Turkey Germany Italy
Source: World Bank
GLOBALIZATION BACKLASH
35
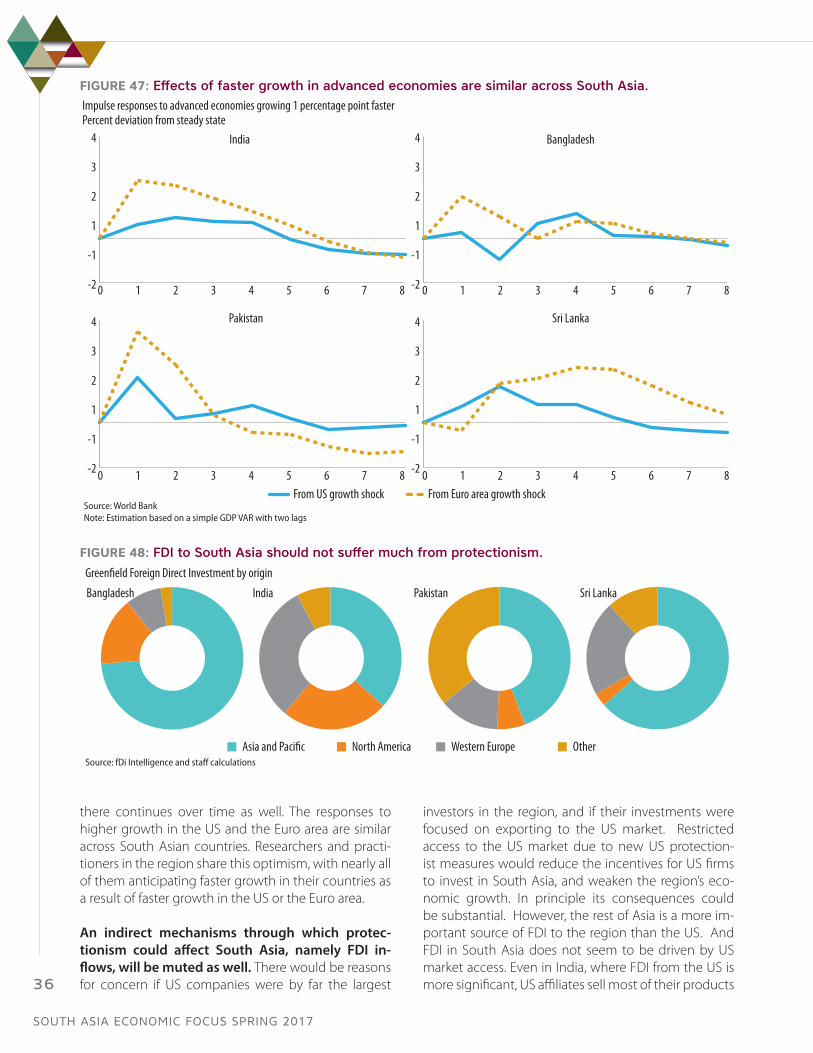
there continues over time as well. The responses to higher growth in the US and the Euro area are similar across South Asian countries. Researchers and practi-tioners in the region share this optimism, with nearly all of them anticipating faster growth in their countries as a result of faster growth in the US or the Euro area.
An indirect mechanisms through which protec-tionism could affect South Asia, namely FDI in-flows, will be muted as well. There would be reasons for concern if US companies were by far the largest
investors in the region, and if their investments were focused on exporting to the US market. Restricted access to the US market due to new US protection-ist measures would reduce the incentives for US firms to invest in South Asia, and weaken the region’s eco-nomic growth. In principle its consequences could be substantial. However, the rest of Asia is a more im-portant source of FDI to the region than the US. And FDI in South Asia does not seem to be driven by US market access. Even in India, where FDI from the US is more significant, US affiliates sell most of their products
FIGURE 48: FDI to South Asia should not suffer much from protectionism.
Source: fDi Intelligence and staff calculations
Bangladesh India Pakistan Sri Lanka
Asia and Paci�c North America Western Europe Other
Green�eld Foreign Direct Investment by origin
FIGURE 47: Effects of faster growth in advanced economies are similar across South Asia.Impulse responses to advanced economies growing 1 percentage point fasterPercent deviation from steady state
Source: World BankNote: Estimation based on a simple GDP VAR with two lags
-2
-1
1
2
3
4
-2
-1
1
2
3
4
-2
-1
1
2
3
4
-2
-1
1
2
3
4India Bangladesh
Pakistan Sri Lanka
From US growth shock From Euro area growth shock
0 1 2 3 4 5 6 7 8 0 1 2 3 4 5 6 7 8
0 1 2 3 4 5 6 7 8 0 1 2 3 4 5 6 7 8
SOUTH ASIA ECONOMIC FOCUS SPRING 2017
36
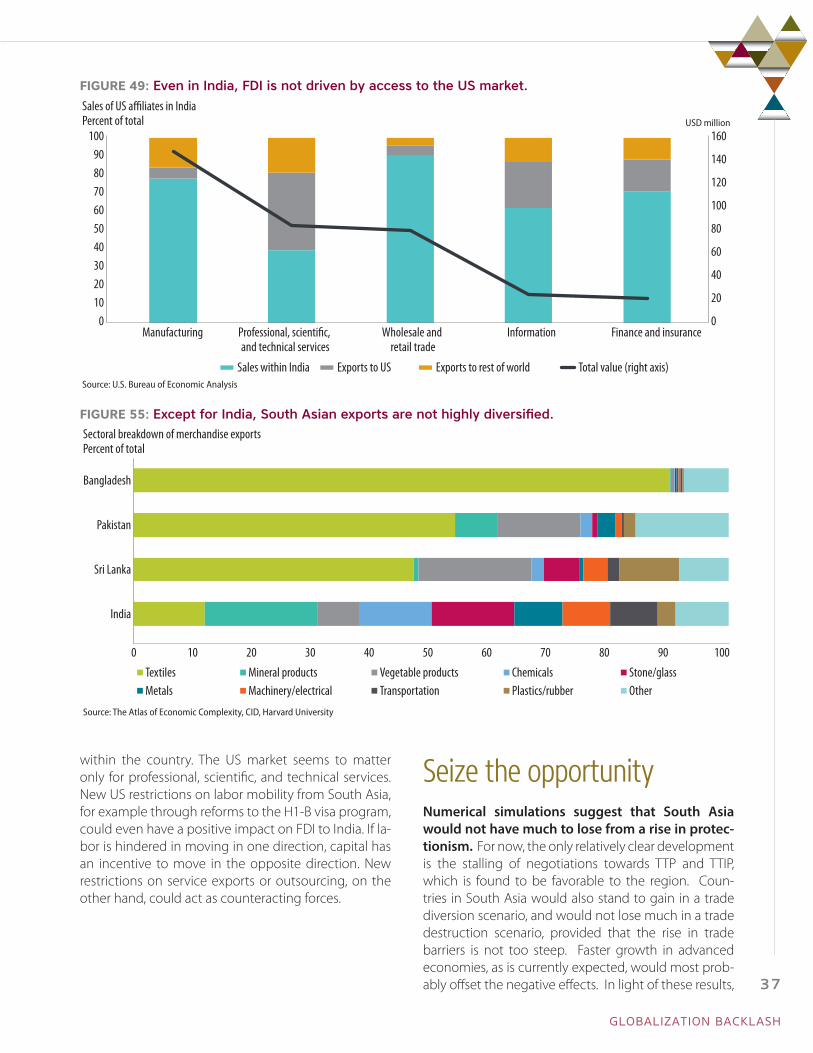
within the country. The US market seems to matter only for professional, scientific, and technical services. New US restrictions on labor mobility from South Asia, for example through reforms to the H1-B visa program, could even have a positive impact on FDI to India. If la-bor is hindered in moving in one direction, capital has an incentive to move in the opposite direction. New restrictions on service exports or outsourcing, on the other hand, could act as counteracting forces.
Seize the opportunityNumerical simulations suggest that South Asia would not have much to lose from a rise in protec-tionism. For now, the only relatively clear development is the stalling of negotiations towards TTP and TTIP, which is found to be favorable to the region. Coun-tries in South Asia would also stand to gain in a trade diversion scenario, and would not lose much in a trade destruction scenario, provided that the rise in trade barriers is not too steep. Faster growth in advanced economies, as is currently expected, would most prob-ably offset the negative effects. In light of these results,
FIGURE 49: Even in India, FDI is not driven by access to the US market.
0
20
40
60
80
100
120
140
160
0102030405060708090
100
Sales of US a�liates in IndiaPercent of total
Sales within India Exports to US Exports to rest of world Total value (right axis)
USD million
Source: U.S. Bureau of Economic Analysis
Manufacturing Professional, scienti�c, and technical services
Wholesale and retail trade
Information Finance and insurance
FIGURE 55: Except for India, South Asian exports are not highly diversified.
0 10 20 30 40 50 60 70 80 90 100
India
Sri Lanka
Pakistan
Bangladesh
Sectoral breakdown of merchandise exportsPercent of total
Textiles Mineral products Vegetable products Chemicals Stone/glassMetals Machinery/electrical Transportation Plastics/rubber Other
Source: The Atlas of Economic Complexity, CID, Harvard University
GLOBALIZATION BACKLASH
37
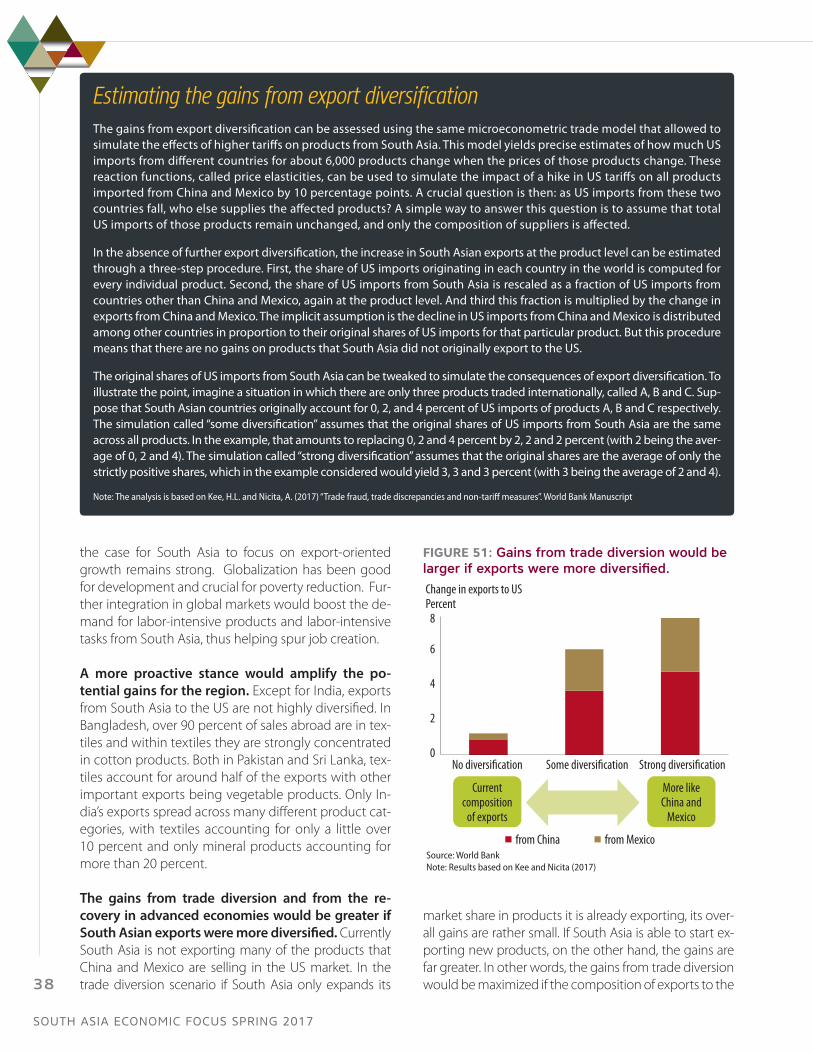
the case for South Asia to focus on export-oriented growth remains strong. Globalization has been good for development and crucial for poverty reduction. Fur-ther integration in global markets would boost the de-mand for labor-intensive products and labor-intensive tasks from South Asia, thus helping spur job creation.
A more proactive stance would amplify the po-tential gains for the region. Except for India, exports from South Asia to the US are not highly diversified. In Bangladesh, over 90 percent of sales abroad are in tex-tiles and within textiles they are strongly concentrated in cotton products. Both in Pakistan and Sri Lanka, tex-tiles account for around half of the exports with other important exports being vegetable products. Only In-dia’s exports spread across many different product cat-egories, with textiles accounting for only a little over 10 percent and only mineral products accounting for more than 20 percent.
The gains from trade diversion and from the re-covery in advanced economies would be greater if South Asian exports were more diversified. Currently South Asia is not exporting many of the products that China and Mexico are selling in the US market. In the trade diversion scenario if South Asia only expands its
market share in products it is already exporting, its over-all gains are rather small. If South Asia is able to start ex-porting new products, on the other hand, the gains are far greater. In other words, the gains from trade diversion would be maximized if the composition of exports to the
FIGURE 51: Gains from trade diversion would be larger if exports were more diversified.
0
2
4
6
8
Change in exports to USPercent
from China from MexicoSource: World BankNote: Results based on Kee and Nicita (2017)
Current composition
of exports
More like China and
Mexico
No diversi�cation Some diversi�cation Strong diversi�cation
Estimating the gains from export diversificationThe gains from export diversification can be assessed using the same microeconometric trade model that allowed to simulate the effects of higher tariffs on products from South Asia. This model yields precise estimates of how much US imports from different countries for about 6,000 products change when the prices of those products change. These reaction functions, called price elasticities, can be used to simulate the impact of a hike in US tariffs on all products imported from China and Mexico by 10 percentage points. A crucial question is then: as US imports from these two countries fall, who else supplies the affected products? A simple way to answer this question is to assume that total US imports of those products remain unchanged, and only the composition of suppliers is affected.
In the absence of further export diversification, the increase in South Asian exports at the product level can be estimated through a three-step procedure. First, the share of US imports originating in each country in the world is computed for every individual product. Second, the share of US imports from South Asia is rescaled as a fraction of US imports from countries other than China and Mexico, again at the product level. And third this fraction is multiplied by the change in exports from China and Mexico. The implicit assumption is the decline in US imports from China and Mexico is distributed among other countries in proportion to their original shares of US imports for that particular product. But this procedure means that there are no gains on products that South Asia did not originally export to the US.
The original shares of US imports from South Asia can be tweaked to simulate the consequences of export diversification. To illustrate the point, imagine a situation in which there are only three products traded internationally, called A, B and C. Sup-pose that South Asian countries originally account for 0, 2, and 4 percent of US imports of products A, B and C respectively. The simulation called “some diversification” assumes that the original shares of US imports from South Asia are the same across all products. In the example, that amounts to replacing 0, 2 and 4 percent by 2, 2 and 2 percent (with 2 being the aver-age of 0, 2 and 4). The simulation called “strong diversification” assumes that the original shares are the average of only the strictly positive shares, which in the example considered would yield 3, 3 and 3 percent (with 3 being the average of 2 and 4).
Note: The analysis is based on Kee, H.L. and Nicita, A. (2017) “Trade fraud, trade discrepancies and non-tariff measures”. World Bank Manuscript
SOUTH ASIA ECONOMIC FOCUS SPRING 2017
38
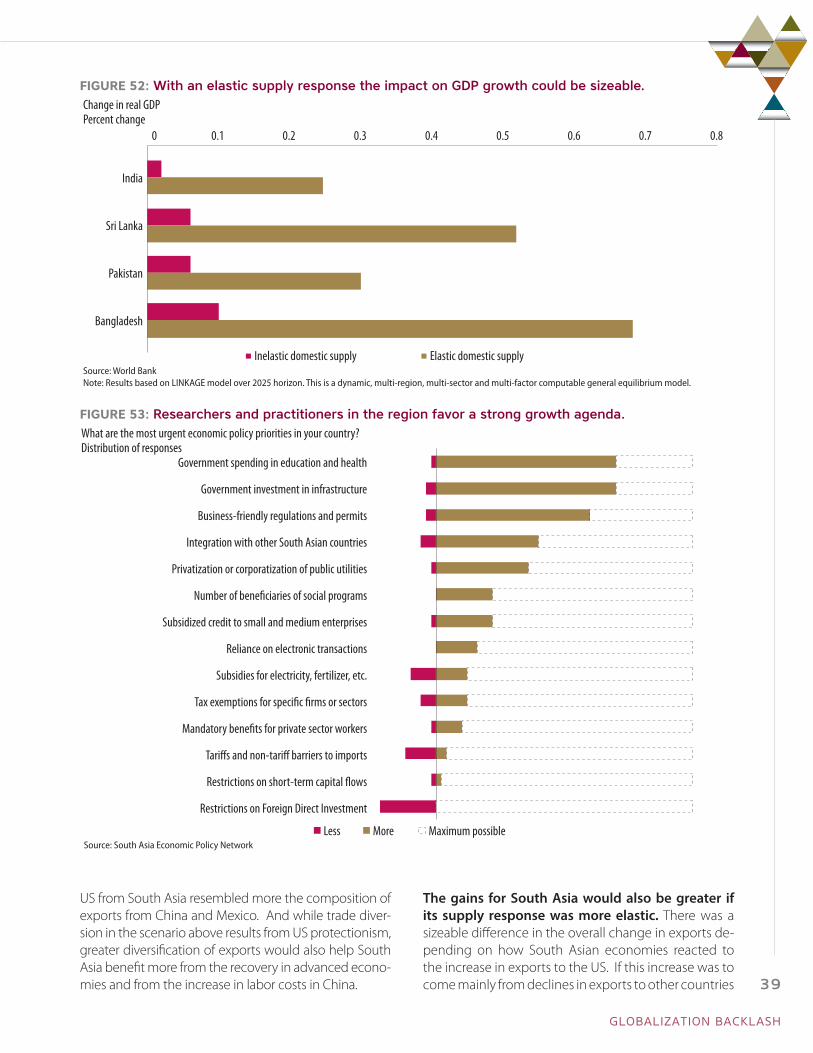
US from South Asia resembled more the composition of exports from China and Mexico. And while trade diver-sion in the scenario above results from US protectionism, greater diversification of exports would also help South Asia benefit more from the recovery in advanced econo-mies and from the increase in labor costs in China.
The gains for South Asia would also be greater if its supply response was more elastic. There was a sizeable difference in the overall change in exports de-pending on how South Asian economies reacted to the increase in exports to the US. If this increase was to come mainly from declines in exports to other countries
FIGURE 52: With an elastic supply response the impact on GDP growth could be sizeable.
0 0.1 0.2 0.3 0.4 0.5 0.6 0.7 0.8
India
Sri Lanka
Pakistan
Bangladesh
Change in real GDPPercent change
Inelastic domestic supply Elastic domestic supplySource: World BankNote: Results based on LINKAGE model over 2025 horizon. This is a dynamic, multi-region, multi-sector and multi-factor computable general equilibrium model.
FIGURE 53: Researchers and practitioners in the region favor a strong growth agenda.
Government spending in education and health
Government investment in infrastructure
Business-friendly regulations and permits
Integration with other South Asian countries
Privatization or corporatization of public utilities
Number of bene�ciaries of social programs
Subsidized credit to small and medium enterprises
Reliance on electronic transactions
Subsidies for electricity, fertilizer, etc.
Tax exemptions for speci�c �rms or sectors
Mandatory bene�ts for private sector workers
Tari�s and non-tari� barriers to imports
Restrictions on short-term capital �ows
Restrictions on Foreign Direct Investment
What are the most urgent economic policy priorities in your country?Distribution of responses
Less More Maximum possibleSource: South Asia Economic Policy Network
GLOBALIZATION BACKLASH
39
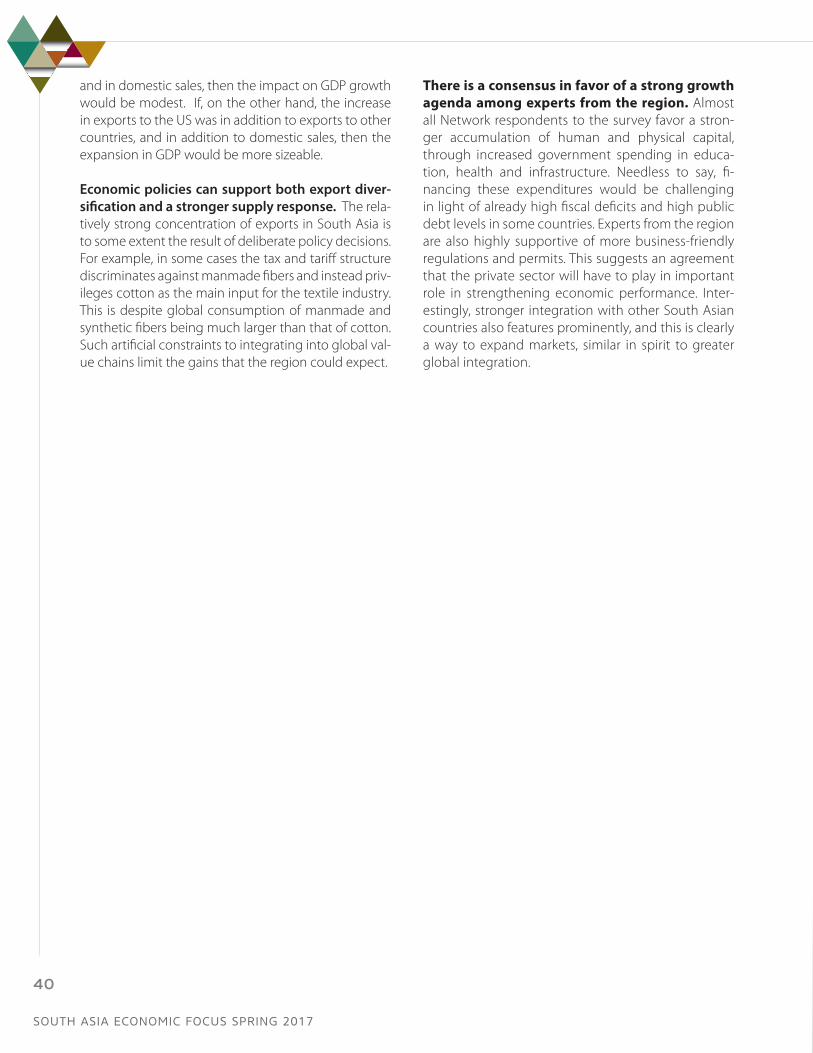
and in domestic sales, then the impact on GDP growth would be modest. If, on the other hand, the increase in exports to the US was in addition to exports to other countries, and in addition to domestic sales, then the expansion in GDP would be more sizeable.
Economic policies can support both export diver-sification and a stronger supply response. The rela-tively strong concentration of exports in South Asia is to some extent the result of deliberate policy decisions. For example, in some cases the tax and tariff structure discriminates against manmade fibers and instead priv-ileges cotton as the main input for the textile industry. This is despite global consumption of manmade and synthetic fibers being much larger than that of cotton. Such artificial constraints to integrating into global val-ue chains limit the gains that the region could expect.
There is a consensus in favor of a strong growth agenda among experts from the region. Almost all Network respondents to the survey favor a stron-ger accumulation of human and physical capital, through increased government spending in educa-tion, health and infrastructure. Needless to say, fi-nancing these expenditures would be challenging in light of already high fiscal deficits and high public debt levels in some countries. Experts from the region are also highly supportive of more business-friendly regulations and permits. This suggests an agreement that the private sector will have to play in important role in strengthening economic performance. Inter-estingly, stronger integration with other South Asian countries also features prominently, and this is clearly a way to expand markets, similar in spirit to greater global integration.
SOUTH ASIA ECONOMIC FOCUS SPRING 2017
40

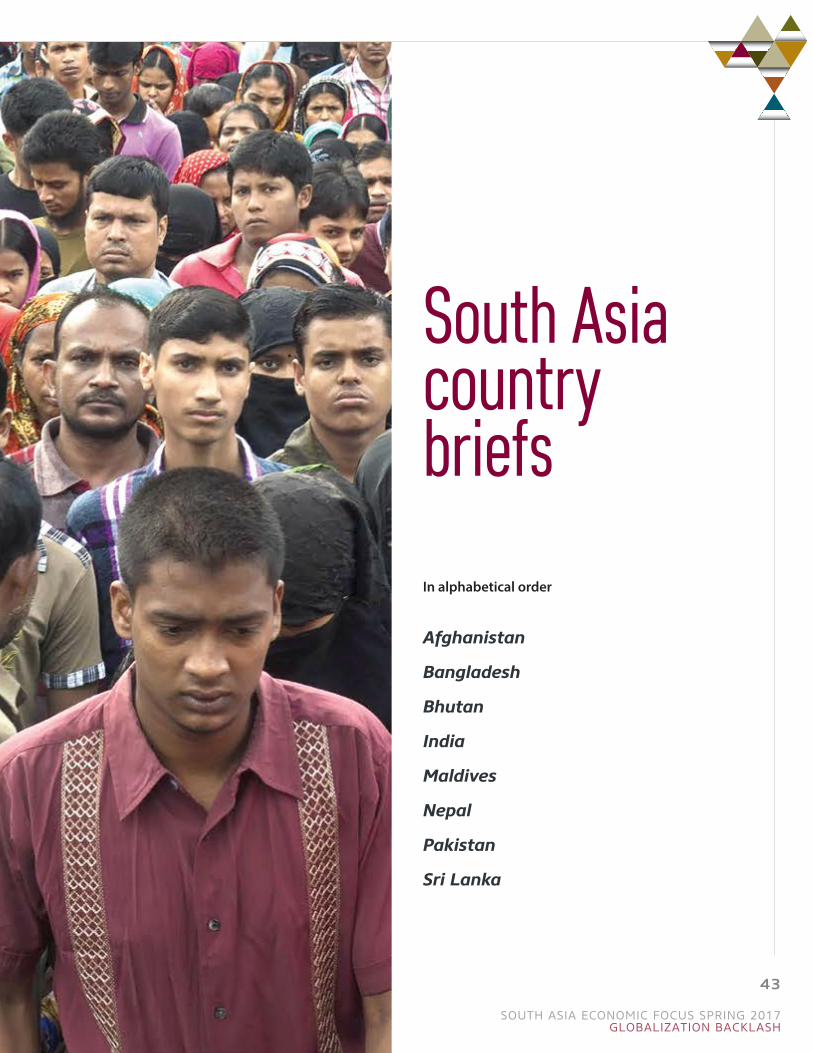
South Asia country briefsIn alphabetical order
Afghanistan
Bangladesh
Bhutan
India
Maldives
Nepal
Pakistan
Sri Lanka
SOUTH ASIA ECONOMIC FOCUS SPRING 2017GLOBALIZATION BACKLASH
43

AfghanistanEconomic recovery in Afghanistan has been slow, as insecurity continues to curtail private investment and consumer demand in the economy. While revenue mobilization has intensified, risks to fiscal stability over the medium-term remain pronounced as sub-stantial donor grants are required to meet the country’s basic de-velopment needs. Increasing number of returnees and internally displaced persons, due to growing violence, have escalated the hu-manitarian challenges for the country.
Recent developmentsViolence continues to affect the security of livelihoods and economic activity in the country. Civilian casualties increased by around 3 percent in 2016, reaching un-precedented levels. Business sentiment remains sup-pressed, with the number of new firm registrations be-ing about the same level as in the previous year. Other proxy indicators, such as vehicle registration, do not indicate a strong pick-up in economic activity in the first three quarters of 2016. Agriculture sector’s perfor-mance has been mixed; cereals production recorded a decline of nearly 5 percent while fruit production has been higher.
Real GDP growth is thus projected to have only margin-ally increased from 0.8 percent in 2015 to 1.2 percent in 2016. With a population growth of nearly 3 percent,
such level of economic growth implies a decline in per capita income.
Inflation increased from -1.5 percent in 2015 to 4.4 percent in 2016, driven by lagged effects of currency depreciation. As most consumer goods in Afghanistan are imported, global prices and exchange rate move-ments tend to heavily drive domestic prices.
2016 also saw a worsening of the humanitarian situa-tion in the country. Afghans represent the world’s larg-est and most protracted refugee population, with an estimated 3.5 million people currently living abroad as refugees. Afghanistan is now facing a sharp increase in displacement due to the escalation of internal conflict, and a new wave of often involuntary refugee returns. Currently, an estimated 1.2 million people are internally
2016
Population, million 33.4
GDP, current US$ billion 19.4
GDP per capita, current US$ 581Sources: World Bank WDI
SOUTH ASIA ECONOMIC FOCUS SPRING 2017
44
-10
-5
0
5
10
15
20
25
Agriculture Industry Services GDP growth
Percent Contributions to real GDP growth
Sources: Central Statistics Organization and World Bank staff projectionsNote: p = projection
2007 2008 2009 2010 2011 2012 2013 2014 2015 2016 (p)
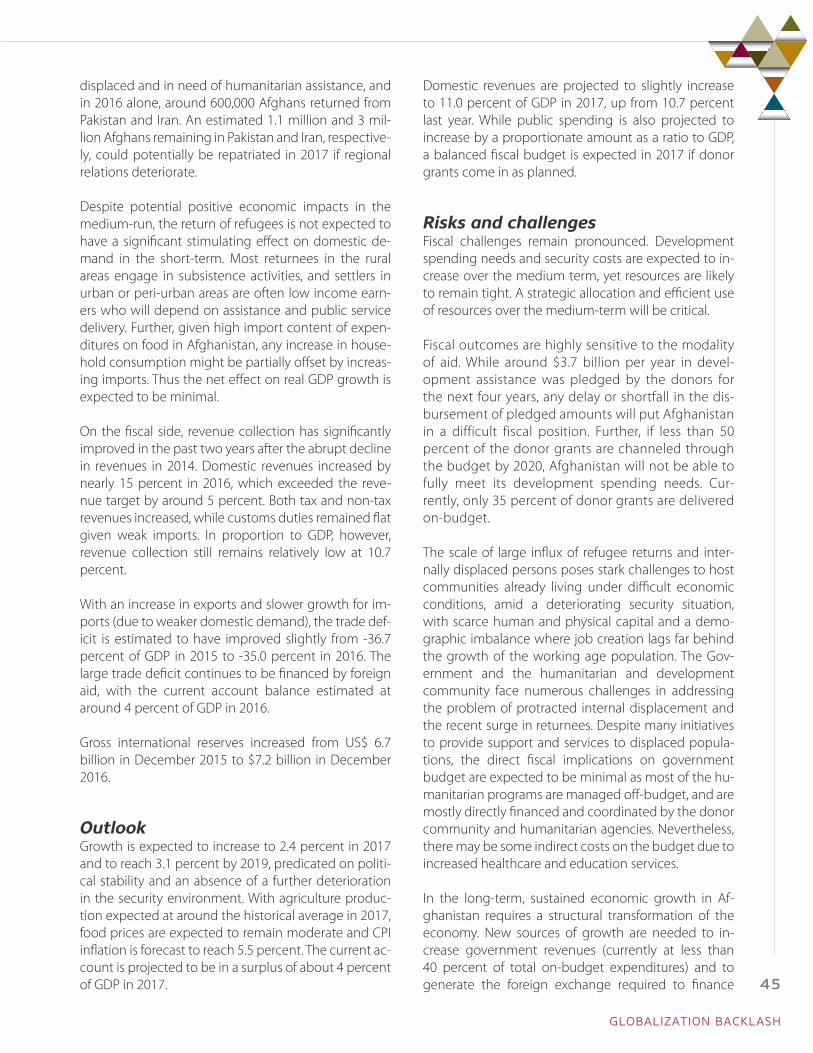
displaced and in need of humanitarian assistance, and in 2016 alone, around 600,000 Afghans returned from Pakistan and Iran. An estimated 1.1 million and 3 mil-lion Afghans remaining in Pakistan and Iran, respective-ly, could potentially be repatriated in 2017 if regional relations deteriorate.
Despite potential positive economic impacts in the medium-run, the return of refugees is not expected to have a significant stimulating effect on domestic de-mand in the short-term. Most returnees in the rural areas engage in subsistence activities, and settlers in urban or peri-urban areas are often low income earn-ers who will depend on assistance and public service delivery. Further, given high import content of expen-ditures on food in Afghanistan, any increase in house-hold consumption might be partially offset by increas-ing imports. Thus the net effect on real GDP growth is expected to be minimal.
On the fiscal side, revenue collection has significantly improved in the past two years after the abrupt decline in revenues in 2014. Domestic revenues increased by nearly 15 percent in 2016, which exceeded the reve-nue target by around 5 percent. Both tax and non-tax revenues increased, while customs duties remained flat given weak imports. In proportion to GDP, however, revenue collection still remains relatively low at 10.7 percent.
With an increase in exports and slower growth for im-ports (due to weaker domestic demand), the trade def-icit is estimated to have improved slightly from -36.7 percent of GDP in 2015 to -35.0 percent in 2016. The large trade deficit continues to be financed by foreign aid, with the current account balance estimated at around 4 percent of GDP in 2016.
Gross international reserves increased from US$ 6.7 billion in December 2015 to $7.2 billion in December 2016.
OutlookGrowth is expected to increase to 2.4 percent in 2017 and to reach 3.1 percent by 2019, predicated on politi-cal stability and an absence of a further deterioration in the security environment. With agriculture produc-tion expected at around the historical average in 2017, food prices are expected to remain moderate and CPI inflation is forecast to reach 5.5 percent. The current ac-count is projected to be in a surplus of about 4 percent of GDP in 2017.
Domestic revenues are projected to slightly increase to 11.0 percent of GDP in 2017, up from 10.7 percent last year. While public spending is also projected to increase by a proportionate amount as a ratio to GDP, a balanced fiscal budget is expected in 2017 if donor grants come in as planned.
Risks and challengesFiscal challenges remain pronounced. Development spending needs and security costs are expected to in-crease over the medium term, yet resources are likely to remain tight. A strategic allocation and efficient use of resources over the medium-term will be critical.
Fiscal outcomes are highly sensitive to the modality of aid. While around $3.7 billion per year in devel-opment assistance was pledged by the donors for the next four years, any delay or shortfall in the dis-bursement of pledged amounts will put Afghanistan in a difficult fiscal position. Further, if less than 50 percent of the donor grants are channeled through the budget by 2020, Afghanistan will not be able to fully meet its development spending needs. Cur-rently, only 35 percent of donor grants are delivered on-budget.
The scale of large influx of refugee returns and inter-nally displaced persons poses stark challenges to host communities already living under difficult economic conditions, amid a deteriorating security situation, with scarce human and physical capital and a demo-graphic imbalance where job creation lags far behind the growth of the working age population. The Gov-ernment and the humanitarian and development community face numerous challenges in addressing the problem of protracted internal displacement and the recent surge in returnees. Despite many initiatives to provide support and services to displaced popula-tions, the direct fiscal implications on government budget are expected to be minimal as most of the hu-manitarian programs are managed off-budget, and are mostly directly financed and coordinated by the donor community and humanitarian agencies. Nevertheless, there may be some indirect costs on the budget due to increased healthcare and education services.
In the long-term, sustained economic growth in Af-ghanistan requires a structural transformation of the economy. New sources of growth are needed to in-crease government revenues (currently at less than 40 percent of total on-budget expenditures) and to generate the foreign exchange required to finance
GLOBALIZATION BACKLASH
45

Afghanistan’s large import bill. Increased human capi-tal investment and improved agriculture productivity could provide significant economic growth and in-crease employment opportunities. The development
of the extractives sector could offer an important opportunity for revenue generation and foreign ex-change earnings to compensate for a possible decline in aid in the future.
TABLE: Afghanistan macro outlook indicators (annual percent change unless indicated otherwise) 2014 2015 2016 (est) 2017 (f) 2018 (f) 2019 (f)
Real GDP growth, at constant market prices 1.3 0.8 1.2 2.4 3.4 3.1
Private Consumption 3.4 2.5 1.2 1.5 1.8 2
Government Consumption 3.2 3 6.4 9.3 6.5 4.9
Gross Fixed Capital Investment -4.3 1.5 1 1.5 2.8 2.6
Exports, Goods and Services -19.7 -2.5 5 7 8 8
Imports, Goods and Services -4.2 5 5 8 5 5
Real GDP growth, at constant factor prices 1.8 0.8 1.2 2.4 3.4 3.1
Agriculture -0.1 -5.7 -0.5 2.5 2 1.5
Industry 2.4 4.1 2 2.2 3 3
Services 2.2 1.6 1.4 2.5 4.1 3.6
Inflation (Consumer Price Index) 4.6 -1.5 4.4 5.5 5 5
Current Account Balance (percent of GDP) 8 5.4 6.4 4.4 1 -1.1
Financial and Capital Account (percent of GDP) 0.6 -6.1 -5.6 -3.9 -0.5 1.6
Net Foreign Direct Investment (percent of GDP) 0.6 0.9 0.3 0.2 0.2 0.2
Fiscal Balance (percent of GDP) -1.8 -1.3 -0.7 -0.5 0.2 -0.4
Debt (percent of GDP) 6.5 6.2 6.5 6.4 6.2 6
Primary Balance (percent of GDP) -1.7 -1.2 -0.7 -0.5 0.3 -0.4Sources: World Bank, Macroeconomics and Fiscal Management Global PracticeNotes: est = estimate, f = forecast
SOUTH ASIA ECONOMIC FOCUS SPRING 2017
46

BangladeshThe economy is weathering global uncertainties relatively well. The garment industry continues to anchor the external sector. Growth in FY16 remained resilient, aided by strengthening in-vestment and a recovery of exports. Inflation decelerated and the budget deficit narrowed, while the current account remained in surplus, despite a fall in remittances. Infrastructure gaps and inad-equate energy supply, combined with the high cost of doing busi-ness, remain the main obstacles to the realization of Bangladesh’s growth potential.
Recent developmentsGDP growth increased to 7.1 percent in FY16 from 6.6 percent in FY15 (official estimates), driven by private investment and net exports. However, data on high frequency indicators point to only marginal improve-ments in private investment. Exports bounced back due to a resurgence in Ready Made Garments and oth-er manufacturing activities. A 7.1 percent decline in real imports reinforced the contribution of rising exports to net export growth. Remittances through formal chan-nels declined 2.5 percent in FY16, thus slowing private consumption growth. Agricultural growth decelerated to 2.8 percent , as the expansion in staple crops and horticulture moderated. Industrial growth increased to 11.1 percent from 9.7 percent in FY15. The export oriented garments industry and manufacturing for the
domestic market performed well. Services growth was also stronger at 6.3 percent , reflecting higher spending in public administration, education, and health services.
Inflation slowed to 5.9 percent in FY16 from 6.4 per-cent in FY15, and further to 5.2 percent (y-o-y) in Jan-uary 2017. A confluence of domestic output growth, accommodative monetary policy and moderation in global commodity prices contained inflation. Non-food inflation decelerated steadily since June 2016, reflecting weakening demand due to a large decline in remittances and the effect of the public sector wage increases tapering off. Food inflation acceler-ated in recent months, driven by rice price increases, the latter caused by a higher tariff on rice imports and production losses due to floods.
2016
Population, million 162.9GDP, current US$ billion 221.4GDP per capita, current US$ 1,359
Sources: World Bank WDI.
-2
0
2
4
6
8
10
Final consumption Gross �xed investment Net export Statistical discrepancy GDP growthSource: Bangladesh Bureau of Statistics (BBS) and World Bank staff estimatesNote: f=forecast
Percent Contributions to real GDP growth
2008 2009 2010 2011 2012 2013 2014 2015 2016 2017 (f)
GLOBALIZATION BACKLASH
47
Macroeconomic balances remained prudent. The 13.8 percent broad money growth was short of the 14.3 percent nominal GDP growth in FY16. Low levels of expenditure outturns relative to revenues resulted in a significantly lower budget deficit of 3.1 percent of GDP, compared with the 5 percent target. Financ-ing relied heavily on domestic non-bank sources, constituting 2.2 percent of GDP. The planned expan-sionary fiscal stance turned out to be less expansion-ary than expected. Overall, the balance of payments remained comfortable, with a surplus of $5.0 billion in FY16, compared with $4.4 billion in FY15. Foreign exchange reserves exceeded $32 billion at the end of February, 2017, equivalent to over 8 months of im-ports. The real effective exchange rate appreciated 6.5 percent in the 12 months ending December 2016.
OutlookGDP is projected to grow by 6.8 percent in FY17, with agriculture growth accelerating to 4.1 percent as farm-ers respond to sustained relative price increases of rice, vegetable and livestock products in the last half of 2016. Weaker domestic demand from a large decline in remittances and a base effect of high growth last year may edge down the rate of industrial growth to 8.9 percent . Services are projected to grow at a steady 6 percent , benefitting from political stability, a rise in agricultural growth, and increases in public sector ben-efit payments. The upturn in private investment is pro-jected to continue in FY17, helped by political stability and a reduction in trade logistics costs due to the com-pletion of two key road projects. Strong performance of high-frequency indicators so far give confidence that the economy is on course to maintaining robust growth.
Macroeconomic stability is expected to be main-tained, notwithstanding a moderate increase in infla-tion. The global commodity outlook suggests emer-gence of pressures from higher import prices. Output is projected to continue above potential, rising from 0.4 to 0.7 percentage points above potential, thus ex-erting upward pressure on core inflation and sustain-ing relatively high inflationary expectations. The mon-etary policy statement for the second half of FY17 is committed to stabilizing inflation, while supporting output and employment growth by accommodat-ing the projected FY17 nominal GDP growth. The cur-rent account surplus is projected to shrink with lower
export growth and declining remittances, without im-pairing stability in the foreign exchange market given the cushion in reserves. The FY17 budget aims to raise revenue through the implementation of the new VAT law and improved revenue administration. Current spending will grow with an increase in public sector benefits and larger subsidies directed mainly to agri-culture and social welfare. Capital spending is slated to rise as well. The deficit is projected around 4 per-cent of GDP with 60 percent financed by domestic borrowing.
Risks and challengesDomestic risks include further deterioration in finan-cial sector stability, slippages in implementing fiscal reforms, and elevated political tensions in the run up to elections in 2019. External risks remain, despite Ban-gladesh’s still limited global integration. They include heightened policy uncertainty in the United States and Euro Area (Bangladesh’s largest export markets and the most important source of remittance inflows after the GCC), and a jump in energy prices. High levels of non-performing bank loans make banks vulnerable to financial stress. The business environment continues to be weak, with Bangladesh ranking 176th out of 190 countries in Doing Business and 107th out of 140 in the Global Competitiveness Index 2016, one of the lowest in South Asia.
Continued fiscal and financial sector strengthening will help to maintain fiscal space and investor confi-dence. Improved public financial management and better revenue collection through streamlining direct and indirect taxes, expanding the tax base and im-proving the efficiency of tax collection would anchor expectations of fiscal sustainability. Reforming SOEs could lessen strains on the budget. Needed bank-ing reforms include strengthening supervision to en-courage competitive behavior and ensuring capital adequacy.
Structural reforms to raise potential growth and in-crease productivity are a priority. This can be accom-plished by expanding investments in human capital, increasing female labor force participation, and raising productivity through increased global value chain in-tegration. Reducing infrastructure gaps and improving the business climate would allow new productive sec-tors to develop and generate jobs.
SOUTH ASIA ECONOMIC FOCUS SPRING 2017
48
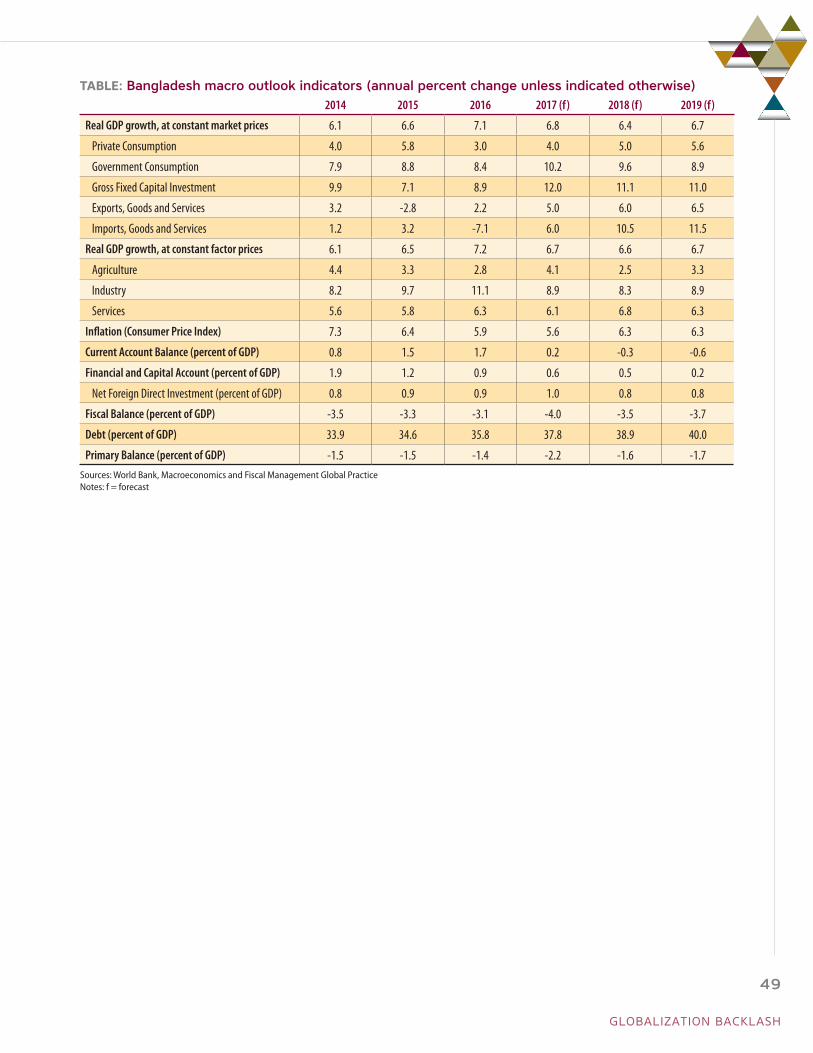
TABLE: Bangladesh macro outlook indicators (annual percent change unless indicated otherwise) 2014 2015 2016 2017 (f) 2018 (f) 2019 (f)
Real GDP growth, at constant market prices 6.1 6.6 7.1 6.8 6.4 6.7
Private Consumption 4.0 5.8 3.0 4.0 5.0 5.6
Government Consumption 7.9 8.8 8.4 10.2 9.6 8.9
Gross Fixed Capital Investment 9.9 7.1 8.9 12.0 11.1 11.0
Exports, Goods and Services 3.2 -2.8 2.2 5.0 6.0 6.5
Imports, Goods and Services 1.2 3.2 -7.1 6.0 10.5 11.5
Real GDP growth, at constant factor prices 6.1 6.5 7.2 6.7 6.6 6.7
Agriculture 4.4 3.3 2.8 4.1 2.5 3.3
Industry 8.2 9.7 11.1 8.9 8.3 8.9
Services 5.6 5.8 6.3 6.1 6.8 6.3
Inflation (Consumer Price Index) 7.3 6.4 5.9 5.6 6.3 6.3
Current Account Balance (percent of GDP) 0.8 1.5 1.7 0.2 -0.3 -0.6
Financial and Capital Account (percent of GDP) 1.9 1.2 0.9 0.6 0.5 0.2
Net Foreign Direct Investment (percent of GDP) 0.8 0.9 0.9 1.0 0.8 0.8
Fiscal Balance (percent of GDP) -3.5 -3.3 -3.1 -4.0 -3.5 -3.7
Debt (percent of GDP) 33.9 34.6 35.8 37.8 38.9 40.0
Primary Balance (percent of GDP) -1.5 -1.5 -1.4 -2.2 -1.6 -1.7Sources: World Bank, Macroeconomics and Fiscal Management Global PracticeNotes: f = forecast
GLOBALIZATION BACKLASH
49
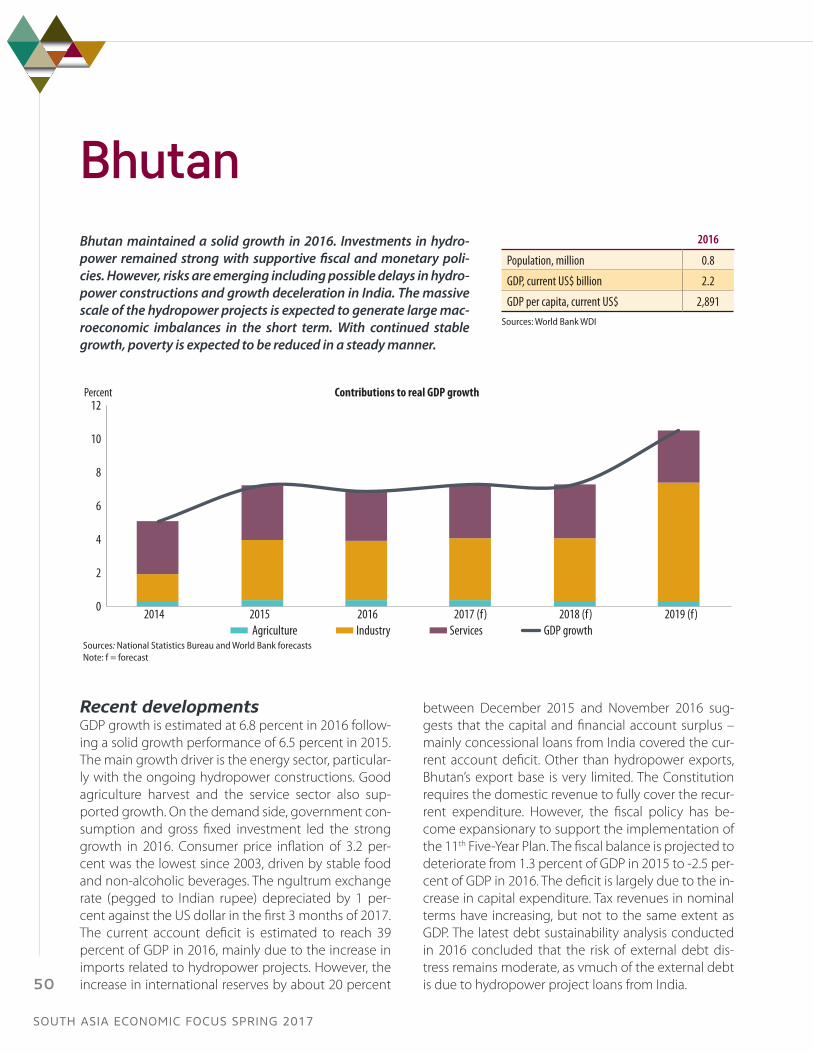
BhutanBhutan maintained a solid growth in 2016. Investments in hydro-power remained strong with supportive fiscal and monetary poli-cies. However, risks are emerging including possible delays in hydro-power constructions and growth deceleration in India. The massive scale of the hydropower projects is expected to generate large mac-roeconomic imbalances in the short term. With continued stable growth, poverty is expected to be reduced in a steady manner.
Recent developmentsGDP growth is estimated at 6.8 percent in 2016 follow-ing a solid growth performance of 6.5 percent in 2015. The main growth driver is the energy sector, particular-ly with the ongoing hydropower constructions. Good agriculture harvest and the service sector also sup-ported growth. On the demand side, government con-sumption and gross fixed investment led the strong growth in 2016. Consumer price inflation of 3.2 per-cent was the lowest since 2003, driven by stable food and non-alcoholic beverages. The ngultrum exchange rate (pegged to Indian rupee) depreciated by 1 per-cent against the US dollar in the first 3 months of 2017. The current account deficit is estimated to reach 39 percent of GDP in 2016, mainly due to the increase in imports related to hydropower projects. However, the increase in international reserves by about 20 percent
between December 2015 and November 2016 sug-gests that the capital and financial account surplus – mainly concessional loans from India covered the cur-rent account deficit. Other than hydropower exports, Bhutan’s export base is very limited. The Constitution requires the domestic revenue to fully cover the recur-rent expenditure. However, the fiscal policy has be-come expansionary to support the implementation of the 11th Five-Year Plan. The fiscal balance is projected to deteriorate from 1.3 percent of GDP in 2015 to -2.5 per-cent of GDP in 2016. The deficit is largely due to the in-crease in capital expenditure. Tax revenues in nominal terms have increasing, but not to the same extent as GDP. The latest debt sustainability analysis conducted in 2016 concluded that the risk of external debt dis-tress remains moderate, as vmuch of the external debt is due to hydropower project loans from India.
2016
Population, million 0.8
GDP, current US$ billion 2.2
GDP per capita, current US$ 2,891Sources: World Bank WDI
0
2
4
6
8
10
12
Agriculture Industry Services GDP growth
Percent Contributions to real GDP growth
Sources: National Statistics Bureau and World Bank forecastsNote: f = forecast
2014 2015 2016 2017 (f) 2018 (f) 2019 (f)
SOUTH ASIA ECONOMIC FOCUS SPRING 2017
50
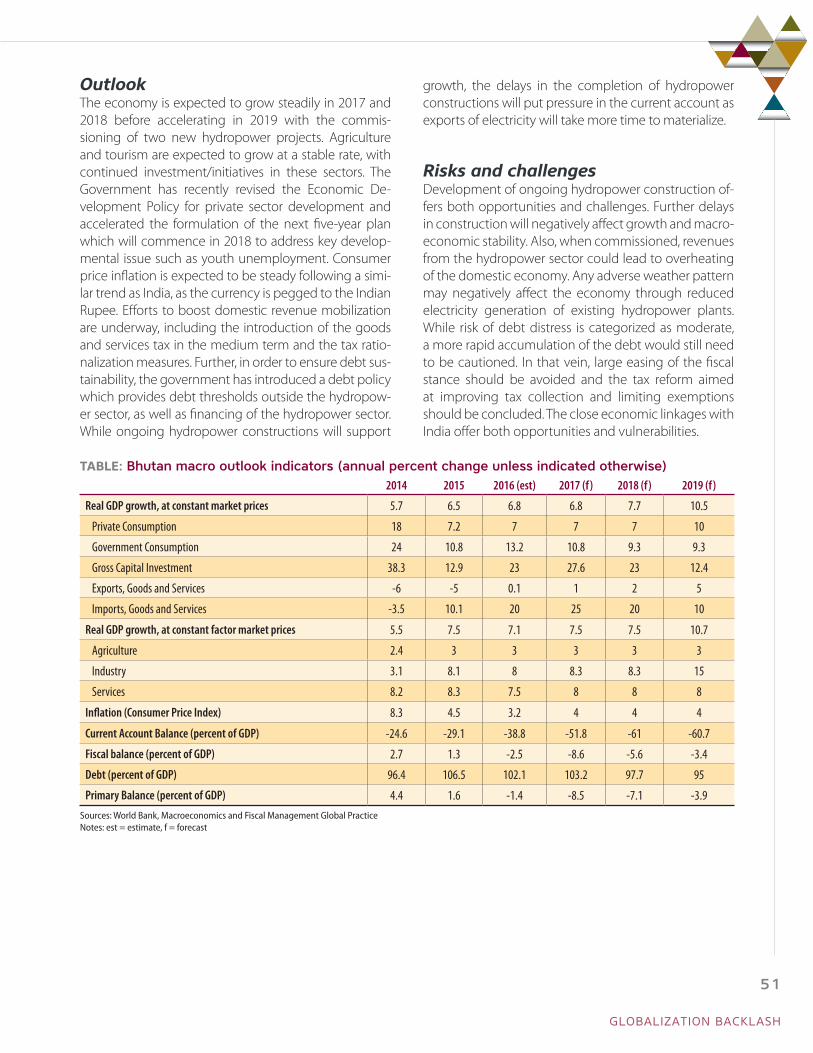
OutlookThe economy is expected to grow steadily in 2017 and 2018 before accelerating in 2019 with the commis-sioning of two new hydropower projects. Agriculture and tourism are expected to grow at a stable rate, with continued investment/initiatives in these sectors. The Government has recently revised the Economic De-velopment Policy for private sector development and accelerated the formulation of the next five-year plan which will commence in 2018 to address key develop-mental issue such as youth unemployment. Consumer price inflation is expected to be steady following a simi-lar trend as India, as the currency is pegged to the Indian Rupee. Efforts to boost domestic revenue mobilization are underway, including the introduction of the goods and services tax in the medium term and the tax ratio-nalization measures. Further, in order to ensure debt sus-tainability, the government has introduced a debt policy which provides debt thresholds outside the hydropow-er sector, as well as financing of the hydropower sector. While ongoing hydropower constructions will support
growth, the delays in the completion of hydropower constructions will put pressure in the current account as exports of electricity will take more time to materialize.
Risks and challengesDevelopment of ongoing hydropower construction of-fers both opportunities and challenges. Further delays in construction will negatively affect growth and macro-economic stability. Also, when commissioned, revenues from the hydropower sector could lead to overheating of the domestic economy. Any adverse weather pattern may negatively affect the economy through reduced electricity generation of existing hydropower plants. While risk of debt distress is categorized as moderate, a more rapid accumulation of the debt would still need to be cautioned. In that vein, large easing of the fiscal stance should be avoided and the tax reform aimed at improving tax collection and limiting exemptions should be concluded. The close economic linkages with India offer both opportunities and vulnerabilities.
TABLE: Bhutan macro outlook indicators (annual percent change unless indicated otherwise) 2014 2015 2016 (est) 2017 (f) 2018 (f) 2019 (f)
Real GDP growth, at constant market prices 5.7 6.5 6.8 6.8 7.7 10.5
Private Consumption 18 7.2 7 7 7 10
Government Consumption 24 10.8 13.2 10.8 9.3 9.3
Gross Capital Investment 38.3 12.9 23 27.6 23 12.4
Exports, Goods and Services -6 -5 0.1 1 2 5
Imports, Goods and Services -3.5 10.1 20 25 20 10
Real GDP growth, at constant factor market prices 5.5 7.5 7.1 7.5 7.5 10.7
Agriculture 2.4 3 3 3 3 3
Industry 3.1 8.1 8 8.3 8.3 15
Services 8.2 8.3 7.5 8 8 8
Inflation (Consumer Price Index) 8.3 4.5 3.2 4 4 4
Current Account Balance (percent of GDP) -24.6 -29.1 -38.8 -51.8 -61 -60.7
Fiscal balance (percent of GDP) 2.7 1.3 -2.5 -8.6 -5.6 -3.4
Debt (percent of GDP) 96.4 106.5 102.1 103.2 97.7 95
Primary Balance (percent of GDP) 4.4 1.6 -1.4 -8.5 -7.1 -3.9 Sources: World Bank, Macroeconomics and Fiscal Management Global PracticeNotes: est = estimate, f = forecast
GLOBALIZATION BACKLASH
51
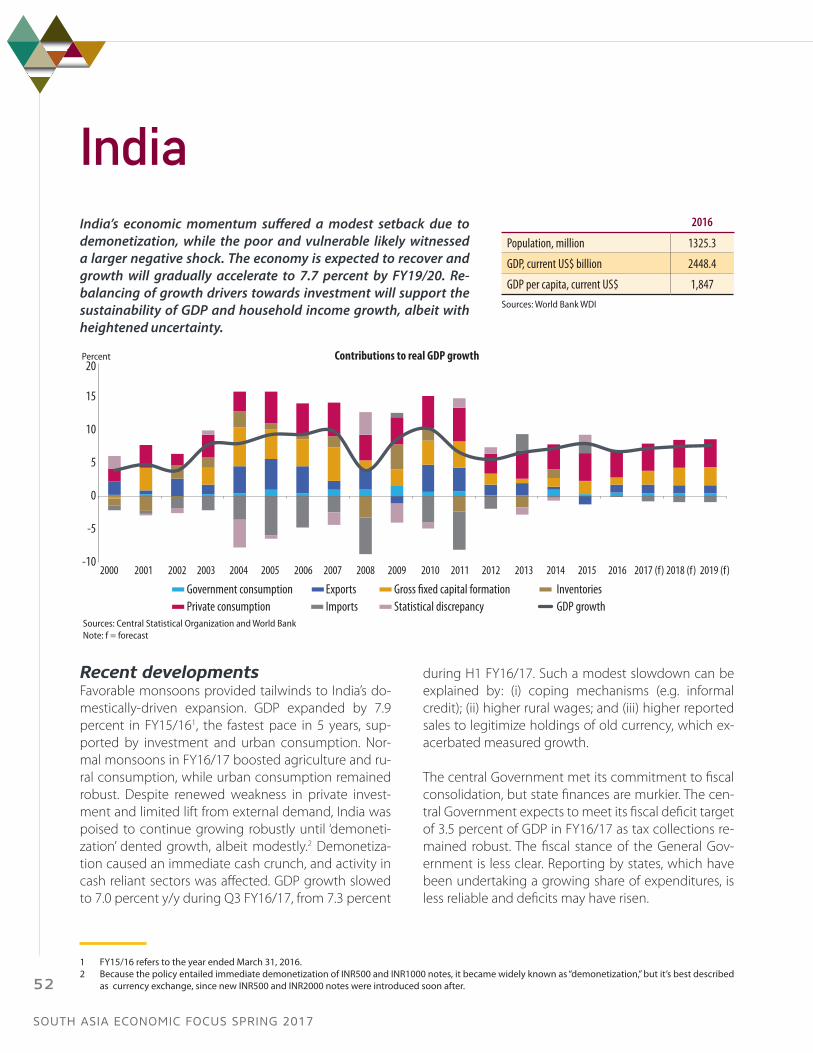
IndiaIndia’s economic momentum suffered a modest setback due to demonetization, while the poor and vulnerable likely witnessed a larger negative shock. The economy is expected to recover and growth will gradually accelerate to 7.7 percent by FY19/20. Re-balancing of growth drivers towards investment will support the sustainability of GDP and household income growth, albeit with heightened uncertainty.
1 FY15/16 refers to the year ended March 31, 2016. 2 Because the policy entailed immediate demonetization of INR500 and INR1000 notes, it became widely known as “demonetization,” but it’s best described
as currency exchange, since new INR500 and INR2000 notes were introduced soon after.
Recent developmentsFavorable monsoons provided tailwinds to India’s do-mestically-driven expansion. GDP expanded by 7.9 percent in FY15/161, the fastest pace in 5 years, sup-ported by investment and urban consumption. Nor-mal monsoons in FY16/17 boosted agriculture and ru-ral consumption, while urban consumption remained robust. Despite renewed weakness in private invest-ment and limited lift from external demand, India was poised to continue growing robustly until ‘demoneti-zation’ dented growth, albeit modestly.2 Demonetiza-tion caused an immediate cash crunch, and activity in cash reliant sectors was affected. GDP growth slowed to 7.0 percent y/y during Q3 FY16/17, from 7.3 percent
during H1 FY16/17. Such a modest slowdown can be explained by: (i) coping mechanisms (e.g. informal credit); (ii) higher rural wages; and (iii) higher reported sales to legitimize holdings of old currency, which ex-acerbated measured growth.
The central Government met its commitment to fiscal consolidation, but state finances are murkier. The cen-tral Government expects to meet its fiscal deficit target of 3.5 percent of GDP in FY16/17 as tax collections re-mained robust. The fiscal stance of the General Gov-ernment is less clear. Reporting by states, which have been undertaking a growing share of expenditures, is less reliable and deficits may have risen.
2016
Population, million 1325.3
GDP, current US$ billion 2448.4
GDP per capita, current US$ 1,847Sources: World Bank WDI
-10
-5
0
5
10
15
20
Government consumption Exports Gross �xed capital formation InventoriesPrivate consumption Imports Statistical discrepancy GDP growth
Percent Contributions to real GDP growth
Sources: Central Statistical Organization and World BankNote: f = forecast
2000 2001 2002 2003 2004 2005 2006 2007 2008 2009 2010 2011 2012 2013 2014 2015 2016 2017 (f) 2018 (f) 2019 (f)
SOUTH ASIA ECONOMIC FOCUS SPRING 2017
52
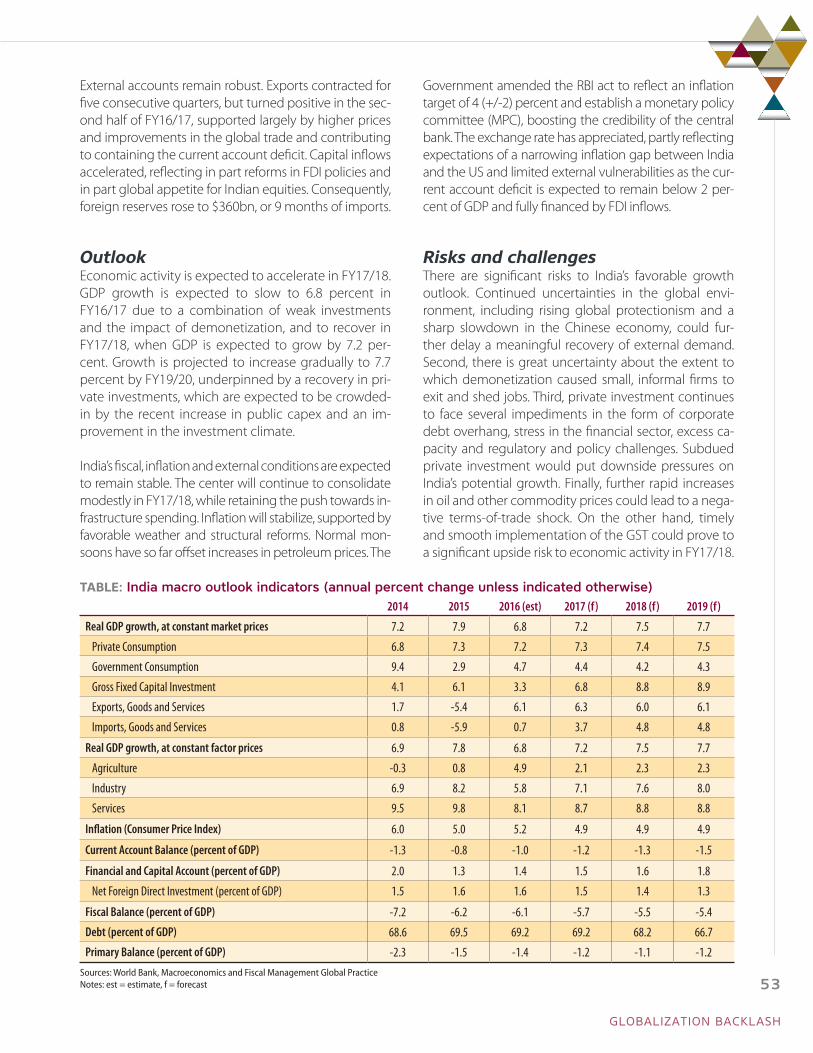
External accounts remain robust. Exports contracted for five consecutive quarters, but turned positive in the sec-ond half of FY16/17, supported largely by higher prices and improvements in the global trade and contributing to containing the current account deficit. Capital inflows accelerated, reflecting in part reforms in FDI policies and in part global appetite for Indian equities. Consequently, foreign reserves rose to $360bn, or 9 months of imports.
OutlookEconomic activity is expected to accelerate in FY17/18. GDP growth is expected to slow to 6.8 percent in FY16/17 due to a combination of weak investments and the impact of demonetization, and to recover in FY17/18, when GDP is expected to grow by 7.2 per-cent. Growth is projected to increase gradually to 7.7 percent by FY19/20, underpinned by a recovery in pri-vate investments, which are expected to be crowded-in by the recent increase in public capex and an im-provement in the investment climate.
India’s fiscal, inflation and external conditions are expected to remain stable. The center will continue to consolidate modestly in FY17/18, while retaining the push towards in-frastructure spending. Inflation will stabilize, supported by favorable weather and structural reforms. Normal mon-soons have so far offset increases in petroleum prices. The
Government amended the RBI act to reflect an inflation target of 4 (+/-2) percent and establish a monetary policy committee (MPC), boosting the credibility of the central bank. The exchange rate has appreciated, partly reflecting expectations of a narrowing inflation gap between India and the US and limited external vulnerabilities as the cur-rent account deficit is expected to remain below 2 per-cent of GDP and fully financed by FDI inflows.
Risks and challengesThere are significant risks to India’s favorable growth outlook. Continued uncertainties in the global envi-ronment, including rising global protectionism and a sharp slowdown in the Chinese economy, could fur-ther delay a meaningful recovery of external demand. Second, there is great uncertainty about the extent to which demonetization caused small, informal firms to exit and shed jobs. Third, private investment continues to face several impediments in the form of corporate debt overhang, stress in the financial sector, excess ca-pacity and regulatory and policy challenges. Subdued private investment would put downside pressures on India’s potential growth. Finally, further rapid increases in oil and other commodity prices could lead to a nega-tive terms-of-trade shock. On the other hand, timely and smooth implementation of the GST could prove to a significant upside risk to economic activity in FY17/18.
TABLE: India macro outlook indicators (annual percent change unless indicated otherwise)2014 2015 2016 (est) 2017 (f) 2018 (f) 2019 (f)
Real GDP growth, at constant market prices 7.2 7.9 6.8 7.2 7.5 7.7
Private Consumption 6.8 7.3 7.2 7.3 7.4 7.5
Government Consumption 9.4 2.9 4.7 4.4 4.2 4.3
Gross Fixed Capital Investment 4.1 6.1 3.3 6.8 8.8 8.9
Exports, Goods and Services 1.7 -5.4 6.1 6.3 6.0 6.1
Imports, Goods and Services 0.8 -5.9 0.7 3.7 4.8 4.8
Real GDP growth, at constant factor prices 6.9 7.8 6.8 7.2 7.5 7.7
Agriculture -0.3 0.8 4.9 2.1 2.3 2.3
Industry 6.9 8.2 5.8 7.1 7.6 8.0
Services 9.5 9.8 8.1 8.7 8.8 8.8
Inflation (Consumer Price Index) 6.0 5.0 5.2 4.9 4.9 4.9
Current Account Balance (percent of GDP) -1.3 -0.8 -1.0 -1.2 -1.3 -1.5
Financial and Capital Account (percent of GDP) 2.0 1.3 1.4 1.5 1.6 1.8
Net Foreign Direct Investment (percent of GDP) 1.5 1.6 1.6 1.5 1.4 1.3
Fiscal Balance (percent of GDP) -7.2 -6.2 -6.1 -5.7 -5.5 -5.4
Debt (percent of GDP) 68.6 69.5 69.2 69.2 68.2 66.7
Primary Balance (percent of GDP) -2.3 -1.5 -1.4 -1.2 -1.1 -1.2Sources: World Bank, Macroeconomics and Fiscal Management Global PracticeNotes: est = estimate, f = forecast
GLOBALIZATION BACKLASH
53
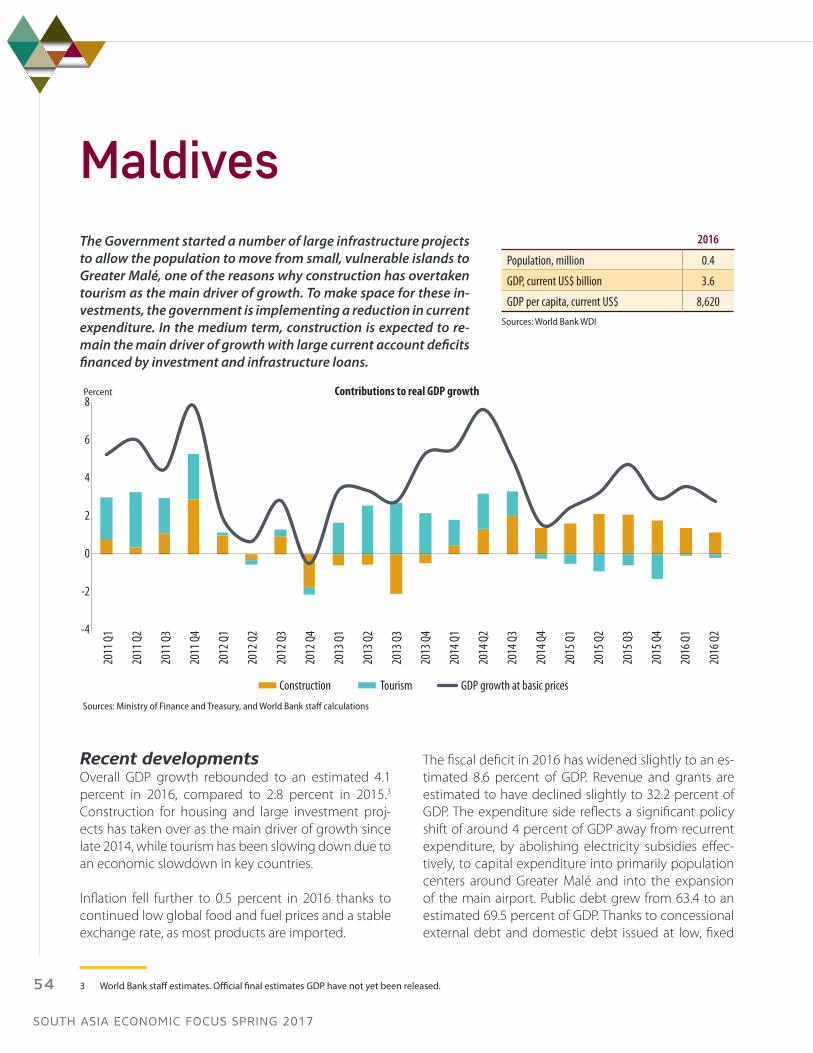
MaldivesThe Government started a number of large infrastructure projects to allow the population to move from small, vulnerable islands to Greater Malé, one of the reasons why construction has overtaken tourism as the main driver of growth. To make space for these in-vestments, the government is implementing a reduction in current expenditure. In the medium term, construction is expected to re-main the main driver of growth with large current account deficits financed by investment and infrastructure loans.
3 World Bank staff estimates. Official final estimates GDP have not yet been released.
Recent developmentsOverall GDP growth rebounded to an estimated 4.1 percent in 2016, compared to 2.8 percent in 2015.3 Construction for housing and large investment proj-ects has taken over as the main driver of growth since late 2014, while tourism has been slowing down due to an economic slowdown in key countries.
Inflation fell further to 0.5 percent in 2016 thanks to continued low global food and fuel prices and a stable exchange rate, as most products are imported.
The fiscal deficit in 2016 has widened slightly to an es-timated 8.6 percent of GDP. Revenue and grants are estimated to have declined slightly to 32.2 percent of GDP. The expenditure side reflects a significant policy shift of around 4 percent of GDP away from recurrent expenditure, by abolishing electricity subsidies effec-tively, to capital expenditure into primarily population centers around Greater Malé and into the expansion of the main airport. Public debt grew from 63.4 to an estimated 69.5 percent of GDP. Thanks to concessional external debt and domestic debt issued at low, fixed
2016
Population, million 0.4
GDP, current US$ billion 3.6
GDP per capita, current US$ 8,620Sources: World Bank WDI
-4
-2
0
2
4
6
8
Construction Tourism GDP growth at basic prices
Percent Contributions to real GDP growth
Sources: Ministry of Finance and Treasury, and World Bank staff calculations
2011
Q1
2011
Q2
2011
Q3
2011
Q4
2012
Q1
2012
Q2
2012
Q3
2012
Q4
2013
Q1
2013
Q2
2013
Q3
2013
Q4
2014
Q1
2014
Q2
2014
Q3
2014
Q4
2015
Q1
2015
Q2
2015
Q3
2015
Q4
2016
Q1
2016
Q2
SOUTH ASIA ECONOMIC FOCUS SPRING 2017
54
rates, and relatively high revenue collection, the cost of debt service is low at 17 percent of revenue. In a sign of increased transparency, the Ministry of Finance and Treasury started to publish monthly fiscal outcomes on its website.
A long-running court case between the airport SOE and an Indian engineering company was settled for USD 271 million in November 2016, partly through selling a bond to the central bank, which used a USD 100 million 6-month currency swap with the Reserve Bank of India to replenish reserves. The current ac-count deficit has widened sharply from 9.5 percent in 2015 to 25.7 percent of GDP in 2016, on the back of re-duced tourist services income, further declines in fish exports and increased imports of construction mate-rials, and the one-off impact of the settlement on the current account, while commodity imports fell thanks to low global prices. FDI inflows were not sufficient to cover the current account deficit unlike previous years. Gross official reserves fell to USD 467 million at end-2016, although usable reserves4 were only USD 200 million (1.2 months of imports). The exchange rate to the USD remains at 15.4, the low end of the currency band.
OutlookMaldives is expected to continue to expand the num-ber of resorts, attracting substantial FDI inflows of around 9-10 percent of GDP a year. Construction is also likely to remain a key growth driver, while the tourism sector growth is likely to remain below pre-vious growth rates, reflecting lower growth expecta-tions in key countries, despite an expected recovery in Russia.
As food subsidies are being gradually phased out in 2017, inflation is expected to spike due to the direct impact and knock-on effect on other food items. The Govern-ment has put in place a targeted cash transfer program to protect vulnerable households from the impact, even if take-up of the cash transfer has been limited so far.
The Government has projected a budget deficit for 2017 of 1 percent of GDP. While acknowledging the effort to phase out food subsidies, it may be difficult to meet the deficit target unless new revenue mea-sures and further expenditure savings are realized, and the World Bank projects a fiscal deficit of 6.1 percent
4 After netting out short-term foreign currency liabilities to the banking sector.
of GDP instead, which would still be the lowest defi-cit since 2007. Efficiency gains in the universal health system could make the budget more flexible and sub-sidies reduction make it less exposed to global com-modity price shocks. However, the level of public debt is expected to remain elevated as long as the invest-ment boom continues.
The current account deficit is likely to remain around 20 percent of GDP, financed by FDI, external loans, an expected Eurobond issuance and one-off income sources. Usable reserves are expected to remain low, as the currency swap and other foreign loans will be due for repayment.
Risks and challengesIt is important that Maldives preserves its tax base and efficient tax system, as it prepares to develop Special Economic Zones offering tax concessions. On the ex-penditure side, the World Bank encourages the Gov-ernment to continue to seek efficiency improvements in the health system, while updating and strengthen-ing its targeted social protection system to avoid a re-turn of food and electricity subsidies once commodity prices rise again. Improved project selection, planning and budgeting for construction, maintenance and op-erations could increase the value-for-money for pub-lic investment. A Sovereign Development Fund set up to receive the newly introduced Airport Development Charge and dividends from the airport SOE will ring-fence funds to repay the loans to finance the airport expansion.
The level of reserves at the central bank is structural-ly low, but large economic actors are typically able to supply dollars to the market to keep the parallel market premium low.
While construction and resort tourism are expected to drive growth in the medium term, these sectors do not create sufficient jobs for Maldivians. The consolida-tion of population from vulnerable islands and atolls to larger islands in Greater Malé, while also reducing pressure on Malé is a country priority. If successful, it may eventually allow for new forms of economic activ-ity in line with the aspirations of Maldivian youth and provide employment, improve the quality of public services such as health and education, and make the country more resilient to climate change.
GLOBALIZATION BACKLASH
55

TABLE: Maldives macro outlook indicators (annual percent change unless indicated otherwise)2014 2015 2016 (est) 2017 (f) 2018 (f) 2019 (f)
Real GDP growth, at constant market prices 6 2.8 4.1 4.5 4.6 4.6
Private Consumption .. .. .. .. .. ..
Government Consumption .. .. .. .. .. ..
Gross Fixed Capital Investment .. .. .. .. .. ..
Exports, Goods and Services .. .. .. .. .. ..
Imports, Goods and Services .. .. .. .. .. ..
Real GDP growth, at constant factor prices 6 2.8 4.1 4.5 4.6 4.6
Agriculture 0.2 -0.5 1.9 2.3 2.5 2.4
Industry 12.9 18.3 6.6 6.7 6.8 6.9
Services 4.6 1.6 3.3 3.8 4 3.9
Inflation (Consumer Price Index) 2.1 1 0.5 2.4 2.8 3
Current Account Balance (percent of GDP) -3.8 -9.5 -25.7 -21.9 -21 -19.4
Net Foreign Direct Investment (percent of GDP) 10.8 8.7 10.7 10.4 9.9 9.4
Fiscal Balance (percent of GDP) -8.2 -8.2 -8.6 -6.1 .. ..
Debt (percent of GDP) 65.9 63.4 69.5 71.2 .. ..
Primary Balance (percent of GDP) -4.6 -5.6 -5.6 -2.7 .. ..Sources: World Bank, Macroeconomics and Fiscal Management Global Practice.Notes: est = estimate, f = forecast
SOUTH ASIA ECONOMIC FOCUS SPRING 2017
56
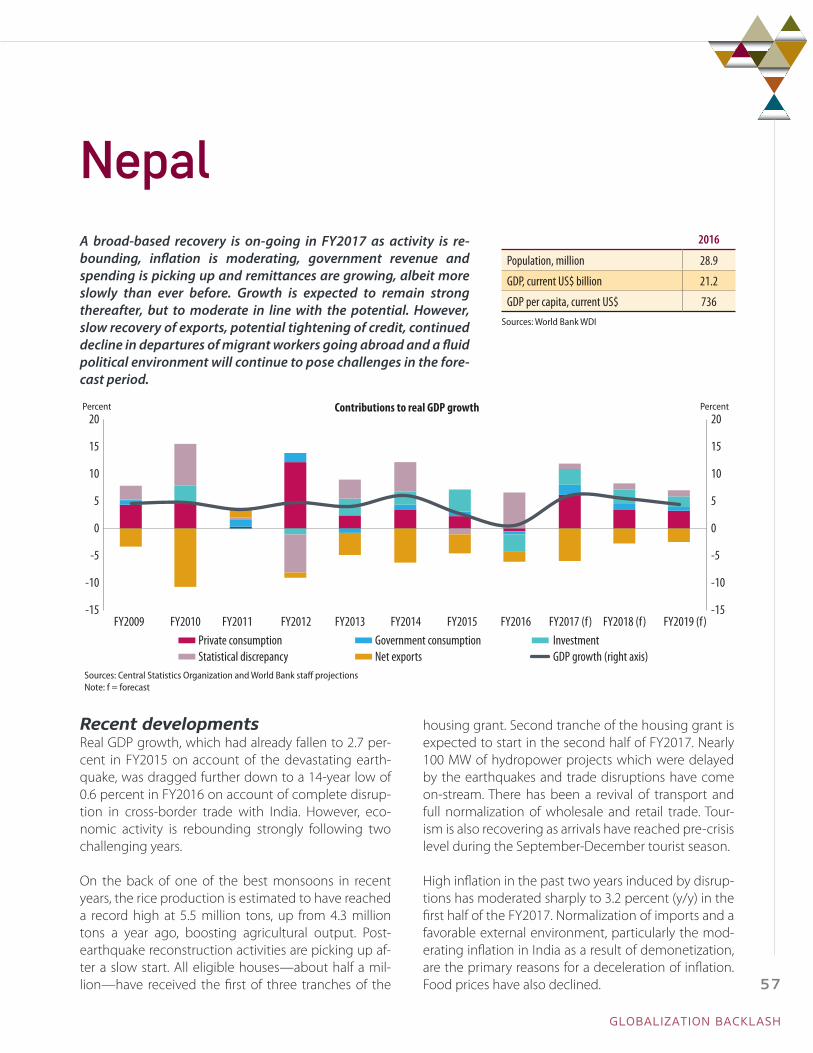
NepalA broad-based recovery is on-going in FY2017 as activity is re-bounding, inflation is moderating, government revenue and spending is picking up and remittances are growing, albeit more slowly than ever before. Growth is expected to remain strong thereafter, but to moderate in line with the potential. However, slow recovery of exports, potential tightening of credit, continued decline in departures of migrant workers going abroad and a fluid political environment will continue to pose challenges in the fore-cast period.
Recent developmentsReal GDP growth, which had already fallen to 2.7 per-cent in FY2015 on account of the devastating earth-quake, was dragged further down to a 14-year low of 0.6 percent in FY2016 on account of complete disrup-tion in cross-border trade with India. However, eco-nomic activity is rebounding strongly following two challenging years.
On the back of one of the best monsoons in recent years, the rice production is estimated to have reached a record high at 5.5 million tons, up from 4.3 million tons a year ago, boosting agricultural output. Post-earthquake reconstruction activities are picking up af-ter a slow start. All eligible houses—about half a mil-lion—have received the first of three tranches of the
housing grant. Second tranche of the housing grant is expected to start in the second half of FY2017. Nearly 100 MW of hydropower projects which were delayed by the earthquakes and trade disruptions have come on-stream. There has been a revival of transport and full normalization of wholesale and retail trade. Tour-ism is also recovering as arrivals have reached pre-crisis level during the September-December tourist season.
High inflation in the past two years induced by disrup-tions has moderated sharply to 3.2 percent (y/y) in the first half of the FY2017. Normalization of imports and a favorable external environment, particularly the mod-erating inflation in India as a result of demonetization, are the primary reasons for a deceleration of inflation. Food prices have also declined.
2016
Population, million 28.9
GDP, current US$ billion 21.2
GDP per capita, current US$ 736Sources: World Bank WDI
-15
-10
-5
0
5
10
15
20
-15
-10
-5
0
5
10
15
20Percent
Private consumption Government consumption InvestmentStatistical discrepancy Net exports GDP growth (right axis)
Percent Contributions to real GDP growth
Sources: Central Statistics Organization and World Bank staff projections Note: f = forecast
FY2009 FY2010 FY2011 FY2012 FY2013 FY2014 FY2015 FY2016 FY2017 (f) FY2018 (f) FY2019 (f)
GLOBALIZATION BACKLASH
57
The new government has initiated a series of reforms in electricity and health, with the most visible impact in the electricity sector with the elimination of pow-er cuts in several major cities across Nepal. Efforts to reduce the financial/technical losses of the electricity utility, NEA, are also showing results.
Government revenue and spending have also per-formed well. Revenue has exceeded the six months’ target and spending, including on capital goods, has also significantly picked up compared to previous years and is on par with revenue. Nevertheless, overly ambitious expenditure envisioned in the budget has not materialized leaving previously accumulated gov-ernment deposits (10 percent of GDP) intact.
Credit has grown rapidly over the past year and has reached 30 percent (y/y) while deposits growth slowed marginally to 18 percent (y/y). However, banks are run-ning up against prudential limits on lending. Addi-tionally, government’s large cash balances have had the effect of a monetary tightening at a time when the banks are trying to increase their capital base to meet the increased regulatory requirements for paid up capital.
Imports which had rebounded fast following the end of trade disruptions have reached a record high. Exports despite some recovery are yet to reach their pre-disruption levels whose recovery is also affected by continued appreciation of real effective exchange rate. As a result, trade deficit has continued to increase. While the remittances continue to grow, although at a slower pace, they are still high enough to offset the trade deficit.
OutlookGrowth is expected to rebound strongly and reach 6 percent in FY2017 on the back of increased agriculture output, increased availability of electricity, and greater investment as the earthquake reconstruction gathers speed. However, it is expected to moderate thereafter in line with the country’s potential. The inflation gap with India has reduced to pre-disruption levels indicat-ing reduced supply-side constraints and it is expected to pick up somewhat as the effect of demonetization tapers off in India. Nonetheless, inflation is expected to be below the central bank’s target of 7.5 percent for entire FY2017.
Fiscal deficit is expected to widen during the forecast period, however, given the large cash balance on hand, financing is not expected to be a problem. Govern-ment’s spending will grow substantially in FY2017 ow-ing to increase in earthquake related cash assistance and proposed election related spending as well as measures introduced to increase civil servants’ com-pensations, pensions and social protection. FY2017 budget called for an expenditure increase of more than 10 percent of GDP which is unlikely to materialize as in the previous years. Realizing this, the government’s mid-year budget has already lowered the spending tar-gets. Meanwhile, the current account surplus is expect-ed to narrow and turn into a deficit as import growth is expected to persist coupled with the slower growth in remittances.
Risks and challengesDomestic risks predominate and are on the downside. The political environment remains fluid as the term of the current government—which was sworn in dur-ing July 2016 as part of the power-sharing agreement among the coalition partners—is coming to an end. In addition, a series of elections (local, provincial, federal) needs to be held by early 2018, as stipulated by the new constitution, with a date for local elections an-nounced for May 2017.
Banks are running up against regulatory limits for lend-ing which risks a sudden stop in new credit. Banks are allowed to lend up to 80 percent of their local currency deposits and core capital and are running up against this limit. As a result, the central bank announced reg-ulatory measures to ease the constraints and has also warned six banks that have breached the lending limit. Increased vulnerability in the financial sector could pose a challenge in the remainder of the forecast period.
The external environment is likely to be less favorable as well. Continued underperformance of the exports despite the end of disruptions remains a persisting challenge. Remittances account for 30 percent of GDP with the majority of migrants going to oil-exporting Gulf Co-operation Countries (GCC). Significant spend-ing cuts, including on capital spending, announced in the GCC countries and persistent contraction in depar-tures of migrants have contributed to lower growth of remittances and risk a possible sharper slowdown dur-ing the forecast period.
SOUTH ASIA ECONOMIC FOCUS SPRING 2017
58
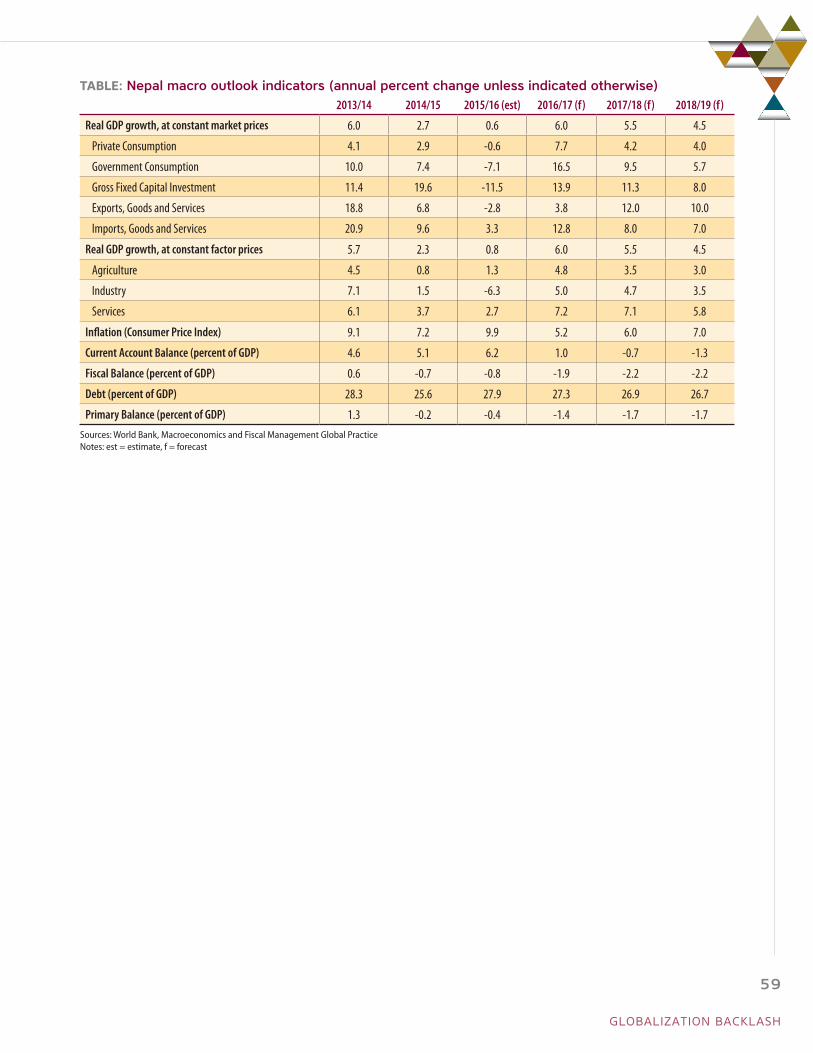
TABLE: Nepal macro outlook indicators (annual percent change unless indicated otherwise)2013/14 2014/15 2015/16 (est) 2016/17 (f) 2017/18 (f) 2018/19 (f)
Real GDP growth, at constant market prices 6.0 2.7 0.6 6.0 5.5 4.5
Private Consumption 4.1 2.9 -0.6 7.7 4.2 4.0
Government Consumption 10.0 7.4 -7.1 16.5 9.5 5.7
Gross Fixed Capital Investment 11.4 19.6 -11.5 13.9 11.3 8.0
Exports, Goods and Services 18.8 6.8 -2.8 3.8 12.0 10.0
Imports, Goods and Services 20.9 9.6 3.3 12.8 8.0 7.0
Real GDP growth, at constant factor prices 5.7 2.3 0.8 6.0 5.5 4.5
Agriculture 4.5 0.8 1.3 4.8 3.5 3.0
Industry 7.1 1.5 -6.3 5.0 4.7 3.5
Services 6.1 3.7 2.7 7.2 7.1 5.8
Inflation (Consumer Price Index) 9.1 7.2 9.9 5.2 6.0 7.0
Current Account Balance (percent of GDP) 4.6 5.1 6.2 1.0 -0.7 -1.3
Fiscal Balance (percent of GDP) 0.6 -0.7 -0.8 -1.9 -2.2 -2.2
Debt (percent of GDP) 28.3 25.6 27.9 27.3 26.9 26.7
Primary Balance (percent of GDP) 1.3 -0.2 -0.4 -1.4 -1.7 -1.7Sources: World Bank, Macroeconomics and Fiscal Management Global PracticeNotes: est = estimate, f = forecast
GLOBALIZATION BACKLASH
59
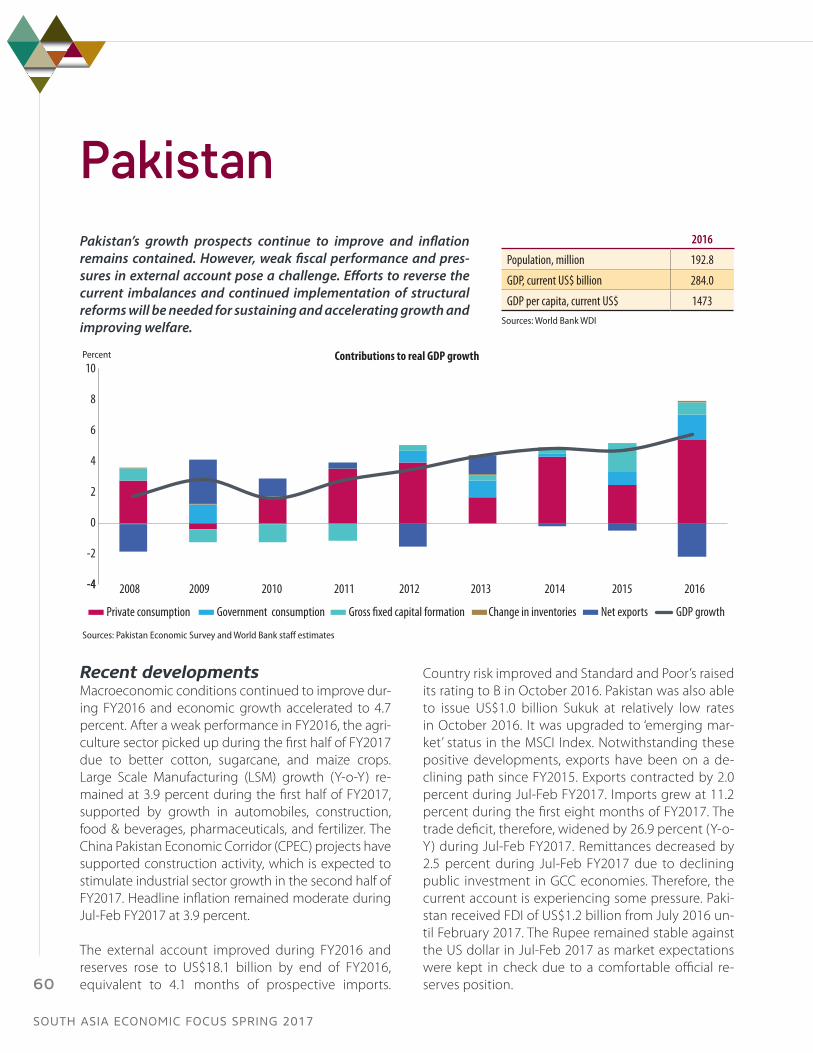
PakistanPakistan’s growth prospects continue to improve and inflation remains contained. However, weak fiscal performance and pres-sures in external account pose a challenge. Efforts to reverse the current imbalances and continued implementation of structural reforms will be needed for sustaining and accelerating growth and improving welfare.
Recent developmentsMacroeconomic conditions continued to improve dur-ing FY2016 and economic growth accelerated to 4.7 percent. After a weak performance in FY2016, the agri-culture sector picked up during the first half of FY2017 due to better cotton, sugarcane, and maize crops. Large Scale Manufacturing (LSM) growth (Y-o-Y) re-mained at 3.9 percent during the first half of FY2017, supported by growth in automobiles, construction, food & beverages, pharmaceuticals, and fertilizer. The China Pakistan Economic Corridor (CPEC) projects have supported construction activity, which is expected to stimulate industrial sector growth in the second half of FY2017. Headline inflation remained moderate during Jul-Feb FY2017 at 3.9 percent.
The external account improved during FY2016 and reserves rose to US$18.1 billion by end of FY2016, equivalent to 4.1 months of prospective imports.
Country risk improved and Standard and Poor’s raised its rating to B in October 2016. Pakistan was also able to issue US$1.0 billion Sukuk at relatively low rates in October 2016. It was upgraded to ‘emerging mar-ket’ status in the MSCI Index. Notwithstanding these positive developments, exports have been on a de-clining path since FY2015. Exports contracted by 2.0 percent during Jul-Feb FY2017. Imports grew at 11.2 percent during the first eight months of FY2017. The trade deficit, therefore, widened by 26.9 percent (Y-o-Y) during Jul-Feb FY2017. Remittances decreased by 2.5 percent during Jul-Feb FY2017 due to declining public investment in GCC economies. Therefore, the current account is experiencing some pressure. Paki-stan received FDI of US$1.2 billion from July 2016 un-til February 2017. The Rupee remained stable against the US dollar in Jul-Feb 2017 as market expectations were kept in check due to a comfortable official re-serves position.
2016
Population, million 192.8
GDP, current US$ billion 284.0
GDP per capita, current US$ 1473Sources: World Bank WDI
-4-4
-2
0
2
4
6
8
10
Private consumption Government consumption Gross �xed capital formation Change in inventories Net exports GDP growth
Percent Contributions to real GDP growth
Sources: Pakistan Economic Survey and World Bank staff estimates
2008 2009 2010 2011 2012 2013 2014 2015 2016
SOUTH ASIA ECONOMIC FOCUS SPRING 2017
60

The consolidated fiscal deficit (including grants) de-clined from 5.2 percent of GDP in FY2015 to 4.5 percent in FY2016—the lowest in nine years. Weaker revenue collection and strong growth in the expenditures has led to a widening of the deficit to 2.4 percent in the first half of FY2017, 0.7 percentage points higher than the same period of last year. Debt to GDP ratio stands high at 62.8 percent at the end of Q2-FY2017.
Outlook The economy is projected to grow by 5.2 percent in FY2017. On the demand side, the near-term growth outlook will primarily be supported by public and pri-vate consumption. Investment to GDP ratio will improve marginally due to CPEC and other public investment.
On the supply side, impetus to growth is projected to come from services and the industrial sector. The ser-vices sector is expected to grow by 5.6 percent and the industrial sector is expected to grow by 6.1 percent in FY2017. After a weak performance in FY2016, the ag-riculture sector is expected to grow at 3.4 percent in FY2017.
The current account deficit is expected to widen from 1.2 percent of GDP in FY2016 to 2.2 percent in FY2017 and 2.4 percent by FY2019. The key contributor to this will be a widening of the trade deficit due to moderate growth in exports (due to weakening of exports com-petitiveness and global demand) and higher growth in imports due increased economic activity. FDI flows will strengthen due to the accelerated implementation of CPEC projects. Official foreign exchange reserves are projected to decline to 3.2 months of imports
by FY2019 due to larger current account deficit, and higher debt repayments (due to IMF repayments) in FY2018.
The fiscal deficit is projected to be 4.8 percent in FY2017, 0.3 percentage point higher than the FY2016 deficit. This widening is primarily driven by slower in-crease in government tax revenues (both federal and provincial) coupled with decline in non-tax revenues.
Inflation has already bottomed out. Projected increases in economic activity and an expected gradual increase in energy prices will push up domestic prices. Inflation is projected to increase from 2.9 percent in FY2016 to 5.0 percent in FY2017 and 7.0 percent in FY2019.
Risks and challengesThere are significant downside risks to the projected outlook. The upcoming national election in 2018 may affect reform momentum and macroeconomic policy orientation. Slower progress in much-needed struc-tural reforms could weaken growth prospects.A stable PKR/US$ nominal exchange rate has resulted in ap-preciation of Real Effective Exchange Rate (REER). Fur-thermore, lingering uncertainty about the course of US economic policy and the possibility of a protracted global economic weakness, especially in the Euro area due to Brexit, could negatively affect exports. Pakistan is also vulnerable to any significant decline in remit-tance flows, particularly from oil-rich countries (around two thirds of all remittances), if oil prices remain de-pressed. But low oil prices will also improve the current account deficit and create an environment conducive for a reduction in energy subsidies.
GLOBALIZATION BACKLASH
61
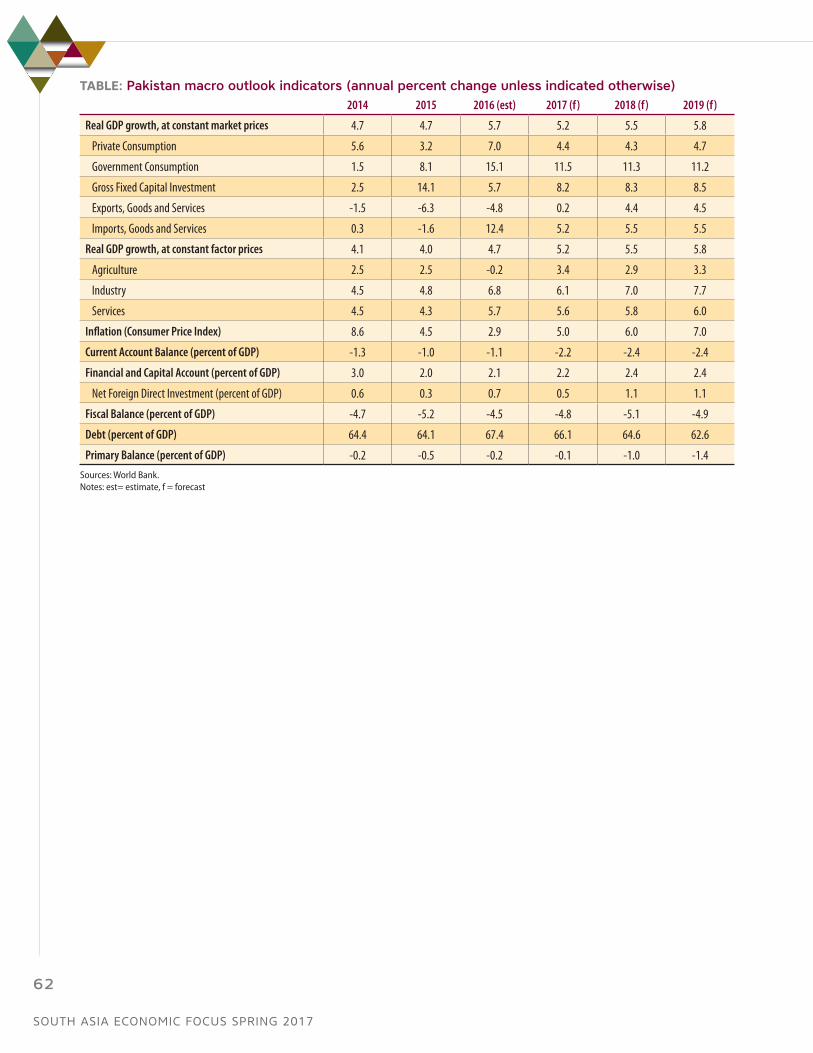
TABLE: Pakistan macro outlook indicators (annual percent change unless indicated otherwise)2014 2015 2016 (est) 2017 (f) 2018 (f) 2019 (f)
Real GDP growth, at constant market prices 4.7 4.7 5.7 5.2 5.5 5.8
Private Consumption 5.6 3.2 7.0 4.4 4.3 4.7
Government Consumption 1.5 8.1 15.1 11.5 11.3 11.2
Gross Fixed Capital Investment 2.5 14.1 5.7 8.2 8.3 8.5
Exports, Goods and Services -1.5 -6.3 -4.8 0.2 4.4 4.5
Imports, Goods and Services 0.3 -1.6 12.4 5.2 5.5 5.5
Real GDP growth, at constant factor prices 4.1 4.0 4.7 5.2 5.5 5.8
Agriculture 2.5 2.5 -0.2 3.4 2.9 3.3
Industry 4.5 4.8 6.8 6.1 7.0 7.7
Services 4.5 4.3 5.7 5.6 5.8 6.0
Inflation (Consumer Price Index) 8.6 4.5 2.9 5.0 6.0 7.0
Current Account Balance (percent of GDP) -1.3 -1.0 -1.1 -2.2 -2.4 -2.4
Financial and Capital Account (percent of GDP) 3.0 2.0 2.1 2.2 2.4 2.4
Net Foreign Direct Investment (percent of GDP) 0.6 0.3 0.7 0.5 1.1 1.1
Fiscal Balance (percent of GDP) -4.7 -5.2 -4.5 -4.8 -5.1 -4.9
Debt (percent of GDP) 64.4 64.1 67.4 66.1 64.6 62.6
Primary Balance (percent of GDP) -0.2 -0.5 -0.2 -0.1 -1.0 -1.4Sources: World Bank.Notes: est= estimate, f = forecast
SOUTH ASIA ECONOMIC FOCUS SPRING 2017
62

Sri LankaRecent policy measures supporting fiscal consolidation and monetary tightening contributed to an improved outlook, against the backdrop of the IMF program. Despite a high budget deficit and public debt, signs of improvements in public finance were seen in 2016; however, exter-nal buffers remained weak on account of subdued export performance, low FDI and capital outflows. It is critical to expedite structural reforms to promote competitiveness and governance, and continue on fiscal consolidation in order to ensure sustained growth and development.
Recent developmentsDespite formidable challenges, Sri Lanka’s macroeco-nomic performance remained broadly satisfactory in 2016 thanks to key policy measures taken during the year. The changes to the VAT Act and improved reve-nue administration helped strengthen the revenue-led fiscal consolidation, while monetary policy was tight-ened to dampen high monetary growth and support external sector stability. These measures provided a platform to lower the fiscal deficit, stabilize the pub-lic debt-to-GDP ratio and support external stability in 2017 and beyond. Nevertheless, weak external liquidity remains a key challenge amid capital outflows and low FDI inflows.
The IMF-supported program continued to anchor macroeconomic stability and structural reforms while
strengthening external resiliency. In November 2016, the first review of the Extended Fund Facility (about USD 1.5 billion) was completed, allowing the disburse-ment of the second tranche. The program calls for fis-cal consolidation; transition to flexible inflation target-ing; and reforms in public financial management, state enterprises and trade and competitiveness. During the year, budget support through a Development Policy Financing operation by the World Bank and Japan International Cooperation Agency reinforced policy reforms to improve private sector competitiveness, transparency, public sector management, and fiscal sustainability.
Real GDP growth in 2016 slowed to 4.4 percent, reflect-ing the impact of floods and droughts, despite signifi-cant contributions from construction, trade, financial
2016
Population, million 21.1
GDP, current US$ billion 80.6
GDP per capita, current US$ 3,824Sources: World Bank WDI
-2
0
2
4
6
8
10
Agriculture Construction Other industry Financial services TradeTransportation Other services Net taxes GDP growth
Percent Contributions to real GDP growth
Sources: Department of Census and Statistics, Sri Lanka
2011 2012 2013 2014 2015 2016
GLOBALIZATION BACKLASH
63
and other services. Although the VAT rate was increased, annual average inflation measured by the Colombo Consumer Price Index remained benign, 4.5 percent in year-on-year terms as of December 2016, due to low international commodity prices and domestic price controls on staples. Core inflation, which excludes fresh food and energy, closed the year at 5.8 percent, reflect-ing demand-side pressures and high monetary growth.
The fiscal deficit for 2016 is anticipated to decline to 6.1 percent of GDP from 7.6 percent in 2015, due both to increased revenue collection, less capital expenditure, and control of current expenditure. The benefit of low oil prices appears to have been offset by greater im-ports of food and petroleum due to the drought, while broadly stable remittances and increasing tourism re-ceipts continue provide a cushion. Nevertheless, low FDI, sizeable external debt service and capital outflows have all exerted pressure on the currency, while foreign reserves, at around 2.9 months of imports, were below comfortable levels.
OutlookRecent policy reforms including monetary tightening and revenue-led fiscal consolidation have improved the outlook. Continuation of the IMF program will add to the confidence and support fiscal sustainability while structural reforms supported by the World Bank are expected to yield benefits in the medium term.
The economy is projected to grow by 4.7 percent in 2017 and marginally exceed 5.0 percent growth in the medium term, driven by private consumption and in-vestment. The impact of past currency depreciation and the rise in the VAT rate will increase inflation in 2017 despite downward pressure from low interna-tional commodity prices. The external sector is poised to benefit from the reinstatement of GSP+ preferential access to European Union and rapidly growing tour-ism, although the drought could adversely impact exports and increase petroleum imports. External buf-fers are projected to improve, with emphasis placed on purchasing foreign exchange, maintaining a more market-determined exchange rate, using monetary policy and the sale of selected government assets. The fiscal deficit is projected to fall to 5.0 percent of GDP for 2017 due to the implementation of revenue measures.
Risks and challengesThe immediate challenge is to improve the external liquidity position and prepare for active liability man-agement. Given the significantly large external obliga-tions falling due, especially starting in 2019, potential actions include buying back and re-issuing longer-dat-ed bonds.
Structural challenges include further progress on reve-nue-led fiscal consolidation; and narrowing the persis-tent current account deficit. The latter is linked to struc-tural competitiveness issues, as indicated by a low level of exports and a stale export basket. The country’s tran-sition towards upper middle income status is expected to lead to more commercial borrowing terms, leading to increased fiscal pressures. Finally, given low national savings rates, more FDI is needed in the manufacturing and export sectors to sustain a high growth path.
Key risks include a growth slowdown, which would lead to fast rising public debt; and delays in key reforms in a challenging political environment. While global policy uncertainty could weigh on the external sector performance, the direct impact of a slowdown in China and the Brexit would be limited. Continued economic woes in the Middle East and the EU could adversely affect exports and remittances. Tightening global fi-nancial conditions could elevate capital outflows and make borrowing more expensive.
It is important that fiscal policy is used to promote competitiveness and reduce poverty while pursuing the path of revenue-led fiscal consolidation. The coun-try has already embarked on bold steps to increase fis-cal space, taken measures to reduce fiscal risks from SOEs and make the country more export-oriented. Ad-ditional fiscal space could help minimize the impact of the reforms on vulnerable citizens through reforms, tar-geted social protection programs and pro-poor invest-ments. Ongoing efforts to reform the targeting system used by the flagship Samurdhi Social Protection pro-gram will help in this regard. Fiscal buffers could also help counter the impact of frequent natural disasters. Structural changes to public expenditure are needed to focus on investment in human and productivity-en-hancing physical capital to return to a higher growth trajectory and maintain its strong recent record of pov-erty reduction while preparing to take care of an aging society.
SOUTH ASIA ECONOMIC FOCUS SPRING 2017
64
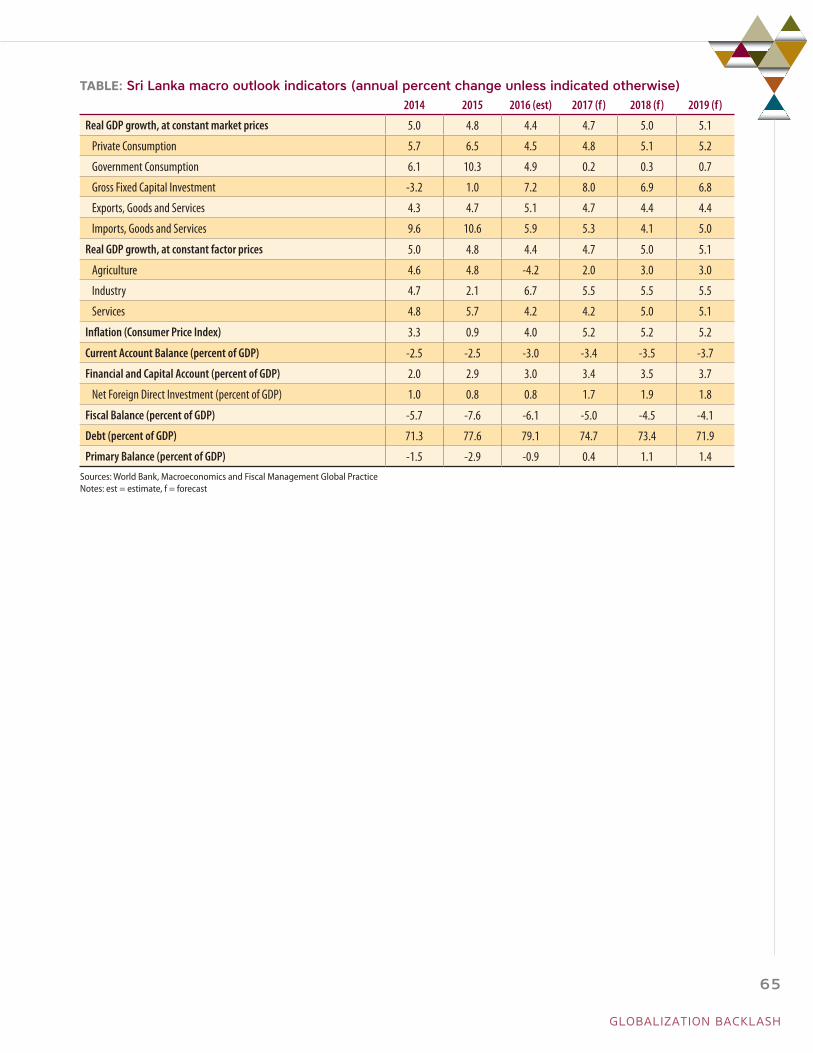
TABLE: Sri Lanka macro outlook indicators (annual percent change unless indicated otherwise)2014 2015 2016 (est) 2017 (f) 2018 (f) 2019 (f)
Real GDP growth, at constant market prices 5.0 4.8 4.4 4.7 5.0 5.1
Private Consumption 5.7 6.5 4.5 4.8 5.1 5.2
Government Consumption 6.1 10.3 4.9 0.2 0.3 0.7
Gross Fixed Capital Investment -3.2 1.0 7.2 8.0 6.9 6.8
Exports, Goods and Services 4.3 4.7 5.1 4.7 4.4 4.4
Imports, Goods and Services 9.6 10.6 5.9 5.3 4.1 5.0
Real GDP growth, at constant factor prices 5.0 4.8 4.4 4.7 5.0 5.1
Agriculture 4.6 4.8 -4.2 2.0 3.0 3.0
Industry 4.7 2.1 6.7 5.5 5.5 5.5
Services 4.8 5.7 4.2 4.2 5.0 5.1
Inflation (Consumer Price Index) 3.3 0.9 4.0 5.2 5.2 5.2
Current Account Balance (percent of GDP) -2.5 -2.5 -3.0 -3.4 -3.5 -3.7
Financial and Capital Account (percent of GDP) 2.0 2.9 3.0 3.4 3.5 3.7
Net Foreign Direct Investment (percent of GDP) 1.0 0.8 0.8 1.7 1.9 1.8
Fiscal Balance (percent of GDP) -5.7 -7.6 -6.1 -5.0 -4.5 -4.1
Debt (percent of GDP) 71.3 77.6 79.1 74.7 73.4 71.9
Primary Balance (percent of GDP) -1.5 -2.9 -0.9 0.4 1.1 1.4Sources: World Bank, Macroeconomics and Fiscal Management Global PracticeNotes: est = estimate, f = forecast
GLOBALIZATION BACKLASH
65
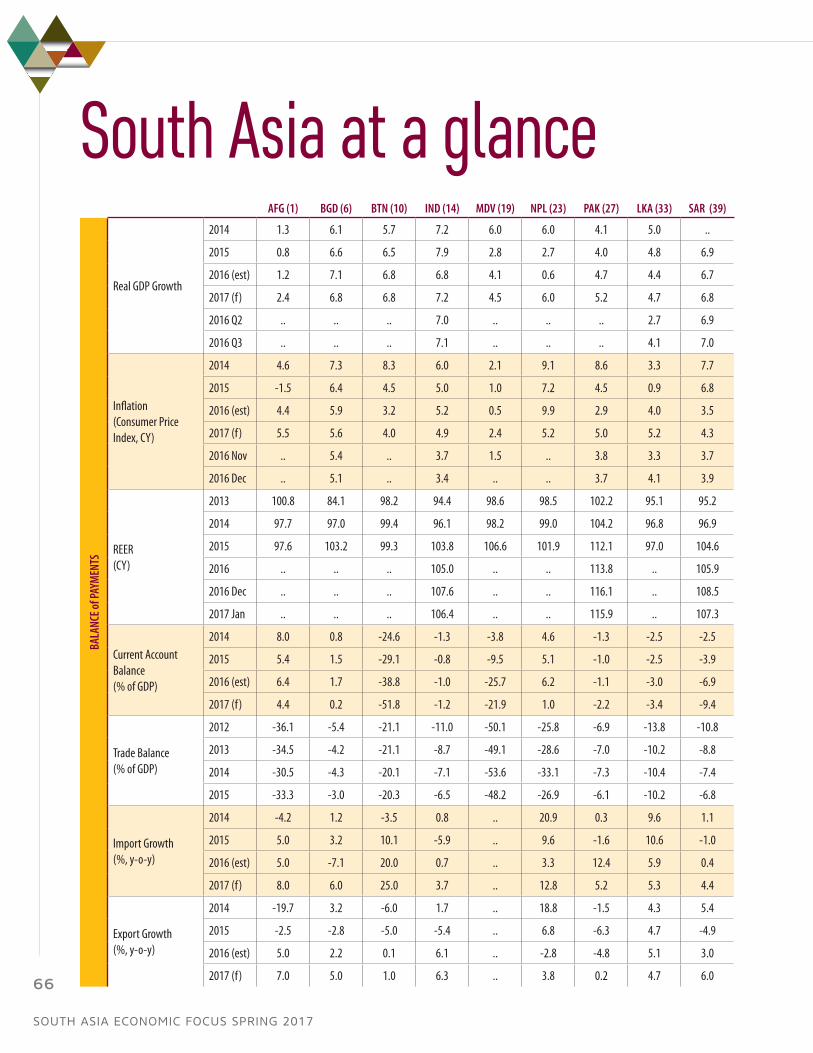
South Asia at a glanceAFG (1) BGD (6) BTN (10) IND (14) MDV (19) NPL (23) PAK (27) LKA (33) SAR (39)
BALA
NCE o
f PAY
MEN
TS
Real GDP Growth
2014 1.3 6.1 5.7 7.2 6.0 6.0 4.1 5.0 ..
2015 0.8 6.6 6.5 7.9 2.8 2.7 4.0 4.8 6.9
2016 (est) 1.2 7.1 6.8 6.8 4.1 0.6 4.7 4.4 6.7
2017 (f) 2.4 6.8 6.8 7.2 4.5 6.0 5.2 4.7 6.8
2016 Q2 .. .. .. 7.0 .. .. .. 2.7 6.9
2016 Q3 .. .. .. 7.1 .. .. .. 4.1 7.0
Inflation (Consumer Price Index, CY)
2014 4.6 7.3 8.3 6.0 2.1 9.1 8.6 3.3 7.7
2015 -1.5 6.4 4.5 5.0 1.0 7.2 4.5 0.9 6.8
2016 (est) 4.4 5.9 3.2 5.2 0.5 9.9 2.9 4.0 3.5
2017 (f) 5.5 5.6 4.0 4.9 2.4 5.2 5.0 5.2 4.3
2016 Nov .. 5.4 .. 3.7 1.5 .. 3.8 3.3 3.7
2016 Dec .. 5.1 .. 3.4 .. .. 3.7 4.1 3.9
REER(CY)
2013 100.8 84.1 98.2 94.4 98.6 98.5 102.2 95.1 95.2
2014 97.7 97.0 99.4 96.1 98.2 99.0 104.2 96.8 96.9
2015 97.6 103.2 99.3 103.8 106.6 101.9 112.1 97.0 104.6
2016 .. .. .. 105.0 .. .. 113.8 .. 105.9
2016 Dec .. .. .. 107.6 .. .. 116.1 .. 108.5
2017 Jan .. .. .. 106.4 .. .. 115.9 .. 107.3
Current Account Balance (% of GDP)
2014 8.0 0.8 -24.6 -1.3 -3.8 4.6 -1.3 -2.5 -2.5
2015 5.4 1.5 -29.1 -0.8 -9.5 5.1 -1.0 -2.5 -3.9
2016 (est) 6.4 1.7 -38.8 -1.0 -25.7 6.2 -1.1 -3.0 -6.9
2017 (f) 4.4 0.2 -51.8 -1.2 -21.9 1.0 -2.2 -3.4 -9.4
Trade Balance (% of GDP)
2012 -36.1 -5.4 -21.1 -11.0 -50.1 -25.8 -6.9 -13.8 -10.8
2013 -34.5 -4.2 -21.1 -8.7 -49.1 -28.6 -7.0 -10.2 -8.8
2014 -30.5 -4.3 -20.1 -7.1 -53.6 -33.1 -7.3 -10.4 -7.4
2015 -33.3 -3.0 -20.3 -6.5 -48.2 -26.9 -6.1 -10.2 -6.8
Import Growth(%, y-o-y)
2014 -4.2 1.2 -3.5 0.8 .. 20.9 0.3 9.6 1.1
2015 5.0 3.2 10.1 -5.9 .. 9.6 -1.6 10.6 -1.0
2016 (est) 5.0 -7.1 20.0 0.7 .. 3.3 12.4 5.9 0.4
2017 (f) 8.0 6.0 25.0 3.7 .. 12.8 5.2 5.3 4.4
Export Growth(%, y-o-y)
2014 -19.7 3.2 -6.0 1.7 .. 18.8 -1.5 4.3 5.4
2015 -2.5 -2.8 -5.0 -5.4 .. 6.8 -6.3 4.7 -4.9
2016 (est) 5.0 2.2 0.1 6.1 .. -2.8 -4.8 5.1 3.0
2017 (f) 7.0 5.0 1.0 6.3 .. 3.8 0.2 4.7 6.0
SOUTH ASIA ECONOMIC FOCUS SPRING 2017
66
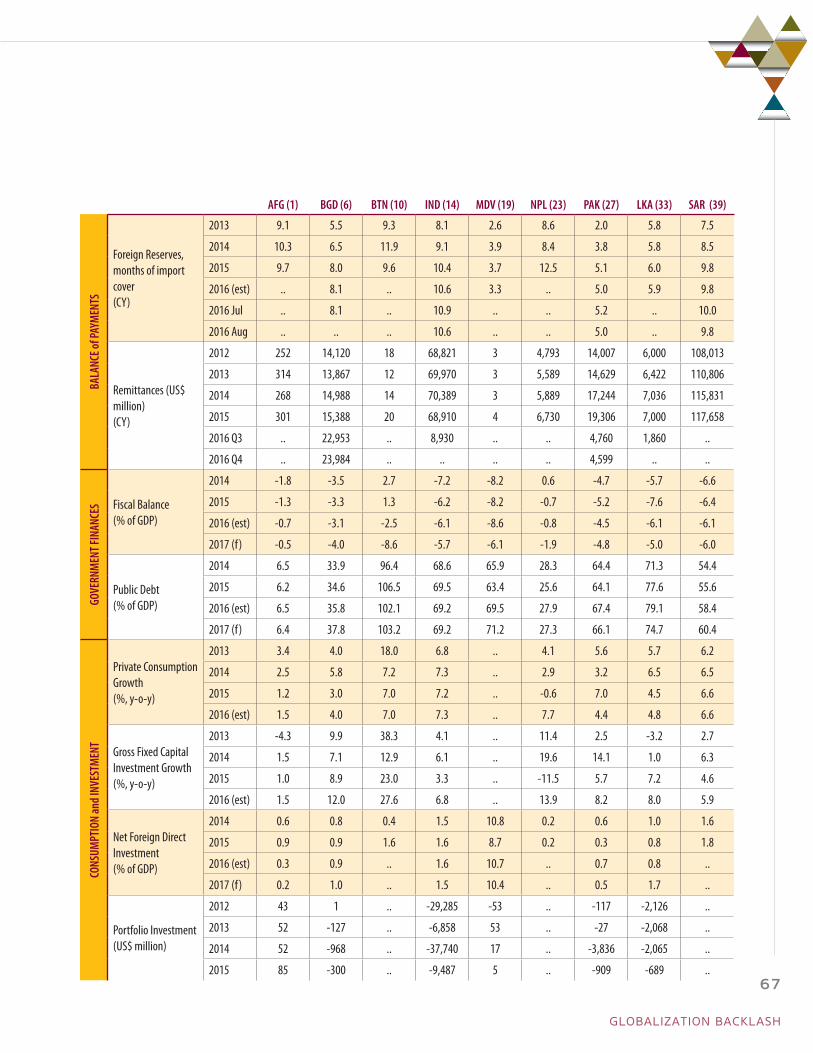
AFG (1) BGD (6) BTN (10) IND (14) MDV (19) NPL (23) PAK (27) LKA (33) SAR (39)
BALA
NCE o
f PAY
MEN
TS
Foreign Reserves, months of import cover(CY)
2013 9.1 5.5 9.3 8.1 2.6 8.6 2.0 5.8 7.5
2014 10.3 6.5 11.9 9.1 3.9 8.4 3.8 5.8 8.5
2015 9.7 8.0 9.6 10.4 3.7 12.5 5.1 6.0 9.8
2016 (est) .. 8.1 .. 10.6 3.3 .. 5.0 5.9 9.8
2016 Jul .. 8.1 .. 10.9 .. .. 5.2 .. 10.0
2016 Aug .. .. .. 10.6 .. .. 5.0 .. 9.8
Remittances (US$ million) (CY)
2012 252 14,120 18 68,821 3 4,793 14,007 6,000 108,013
2013 314 13,867 12 69,970 3 5,589 14,629 6,422 110,806
2014 268 14,988 14 70,389 3 5,889 17,244 7,036 115,831
2015 301 15,388 20 68,910 4 6,730 19,306 7,000 117,658
2016 Q3 .. 22,953 .. 8,930 .. .. 4,760 1,860 ..
2016 Q4 .. 23,984 .. .. .. .. 4,599 .. ..
GOVE
RNM
ENT F
INAN
CES Fiscal Balance
(% of GDP)
2014 -1.8 -3.5 2.7 -7.2 -8.2 0.6 -4.7 -5.7 -6.6
2015 -1.3 -3.3 1.3 -6.2 -8.2 -0.7 -5.2 -7.6 -6.4
2016 (est) -0.7 -3.1 -2.5 -6.1 -8.6 -0.8 -4.5 -6.1 -6.1
2017 (f) -0.5 -4.0 -8.6 -5.7 -6.1 -1.9 -4.8 -5.0 -6.0
Public Debt(% of GDP)
2014 6.5 33.9 96.4 68.6 65.9 28.3 64.4 71.3 54.4
2015 6.2 34.6 106.5 69.5 63.4 25.6 64.1 77.6 55.6
2016 (est) 6.5 35.8 102.1 69.2 69.5 27.9 67.4 79.1 58.4
2017 (f) 6.4 37.8 103.2 69.2 71.2 27.3 66.1 74.7 60.4
CONS
UMPT
ION
and
INVE
STM
ENT
Private Consumption Growth(%, y-o-y)
2013 3.4 4.0 18.0 6.8 .. 4.1 5.6 5.7 6.2
2014 2.5 5.8 7.2 7.3 .. 2.9 3.2 6.5 6.5
2015 1.2 3.0 7.0 7.2 .. -0.6 7.0 4.5 6.6
2016 (est) 1.5 4.0 7.0 7.3 .. 7.7 4.4 4.8 6.6
Gross Fixed Capital Investment Growth(%, y-o-y)
2013 -4.3 9.9 38.3 4.1 .. 11.4 2.5 -3.2 2.7
2014 1.5 7.1 12.9 6.1 .. 19.6 14.1 1.0 6.3
2015 1.0 8.9 23.0 3.3 .. -11.5 5.7 7.2 4.6
2016 (est) 1.5 12.0 27.6 6.8 .. 13.9 8.2 8.0 5.9
Net Foreign Direct Investment(% of GDP)
2014 0.6 0.8 0.4 1.5 10.8 0.2 0.6 1.0 1.6
2015 0.9 0.9 1.6 1.6 8.7 0.2 0.3 0.8 1.8
2016 (est) 0.3 0.9 .. 1.6 10.7 .. 0.7 0.8 ..
2017 (f) 0.2 1.0 .. 1.5 10.4 .. 0.5 1.7 ..
Portfolio Investment(US$ million)
2012 43 1 .. -29,285 -53 .. -117 -2,126 ..
2013 52 -127 .. -6,858 53 .. -27 -2,068 ..
2014 52 -968 .. -37,740 17 .. -3,836 -2,065 ..
2015 85 -300 .. -9,487 5 .. -909 -689 ..
GLOBALIZATION BACKLASH
67
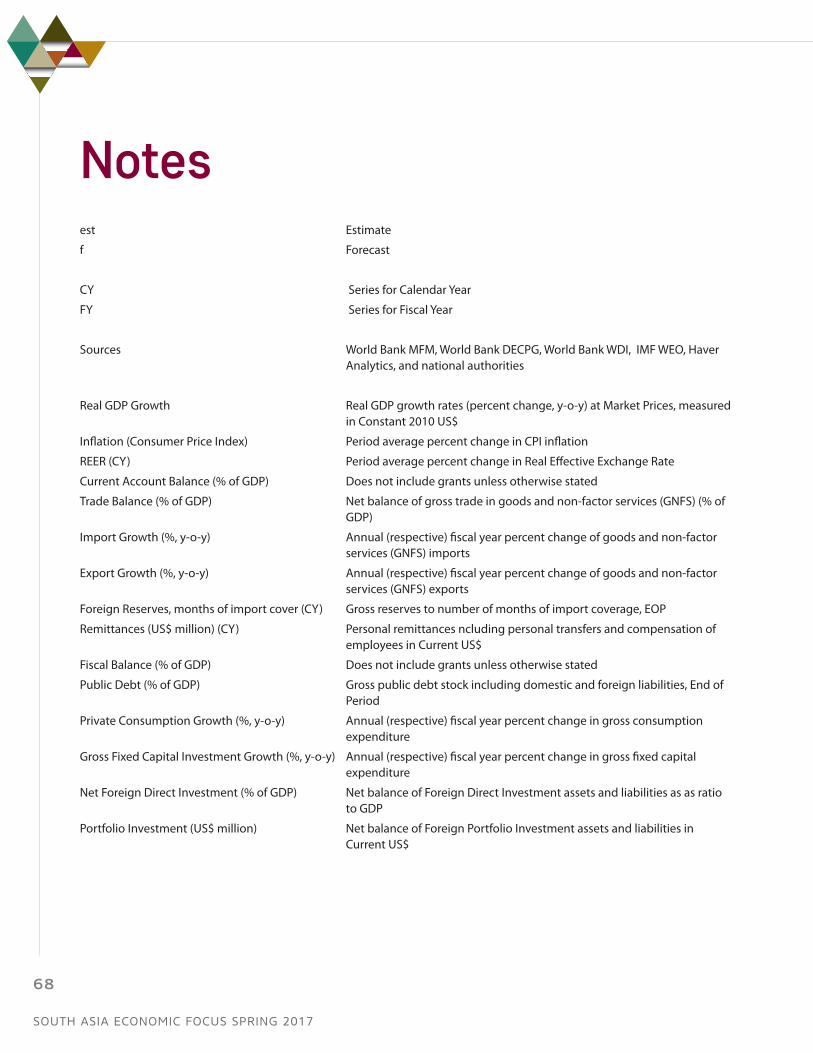
Notesest Estimate
f Forecast
CY Series for Calendar Year
FY Series for Fiscal Year
Sources World Bank MFM, World Bank DECPG, World Bank WDI, IMF WEO, Haver Analytics, and national authorities
Real GDP Growth Real GDP growth rates (percent change, y-o-y) at Market Prices, measured in Constant 2010 US$
Inflation (Consumer Price Index) Period average percent change in CPI inflation
REER (CY) Period average percent change in Real Effective Exchange Rate
Current Account Balance (% of GDP) Does not include grants unless otherwise stated
Trade Balance (% of GDP) Net balance of gross trade in goods and non-factor services (GNFS) (% of GDP)
Import Growth (%, y-o-y) Annual (respective) fiscal year percent change of goods and non-factor services (GNFS) imports
Export Growth (%, y-o-y) Annual (respective) fiscal year percent change of goods and non-factor services (GNFS) exports
Foreign Reserves, months of import cover (CY) Gross reserves to number of months of import coverage, EOP
Remittances (US$ million) (CY) Personal remittances ncluding personal transfers and compensation of employees in Current US$
Fiscal Balance (% of GDP) Does not include grants unless otherwise stated
Public Debt (% of GDP) Gross public debt stock including domestic and foreign liabilities, End of Period
Private Consumption Growth (%, y-o-y) Annual (respective) fiscal year percent change in gross consumption expenditure
Gross Fixed Capital Investment Growth (%, y-o-y) Annual (respective) fiscal year percent change in gross fixed capital expenditure
Net Foreign Direct Investment (% of GDP) Net balance of Foreign Direct Investment assets and liabilities as as ratio to GDP
Portfolio Investment (US$ million) Net balance of Foreign Portfolio Investment assets and liabilities in Current US$
SOUTH ASIA ECONOMIC FOCUS SPRING 2017
68

Afghanistan1 Real GDP Growth figures for calendar year
2 REER (CY): World Bank DECPG
3 Foreign Reserves, months of import cover (CY): World Bank WDI
4 Current Account Balance (% of GDP): Including donor grants
5 Fiscal Balance: Includes donor grants
Bangladesh6 Fiscal Year runs from Jul-1 to Jun-30; for exmaple: for 2016 observations
2015-2016 values are used
7 Inflation (Consumer Price Index) monthly data is End-of-Period values
8 REER (CY): World Bank DECPG
9 Remittances (US$ million) (CY): Haver Analytics (National Sources)
Bhutan10 Fiscal Year runs from Jul-1 to Jun-30; for exmaple: for 2016 observations
2015-2016 values are used
11 REER (CY): World Bank DECPG
12 Foreign Reserves, months of import cover (CY): World Bank WDI
13 Net Foreign Direct Investment (% of GDP): World Bank WDI
India14 Fiscal Year runs from Apr-1 to Mar-31; for exmaple: for 2016 observations
2015-2016 values are used
15 Quarterly Real GDP Growth (y-o-y): World Bank DECPG
16 Monthly Inflation (Consumer Price Index) uses nominal, seasonally adjusted data from World Bank DECPG
17 REER (CY): World Bank DECPG
18 Quarterly Remittances (US$ million) (CY): Haver Analytics (National Sources)
Maldives19 Real GDP Growth figures for calendar year
20 Monthly Inflation (Consumer Price Index) uses nominal, seasonally adjusted data from World Bank DECPG
21 REER (CY): World Bank DECPG
22 Foreign Reserves, months of import cover (CY): World Bank WDI
Nepal23 Fiscal Year runs from Jul-16 to Jul-15; for exmaple: for 2017 observations
2016-2017 values are used
24 REER (CY): World Bank DECPG
25 Foreign Reserves, months of import cover (CY): World Bank WDI
26 Net Foreign Direct Investment (% of GDP): World Bank WDI
GLOBALIZATION BACKLASH
69
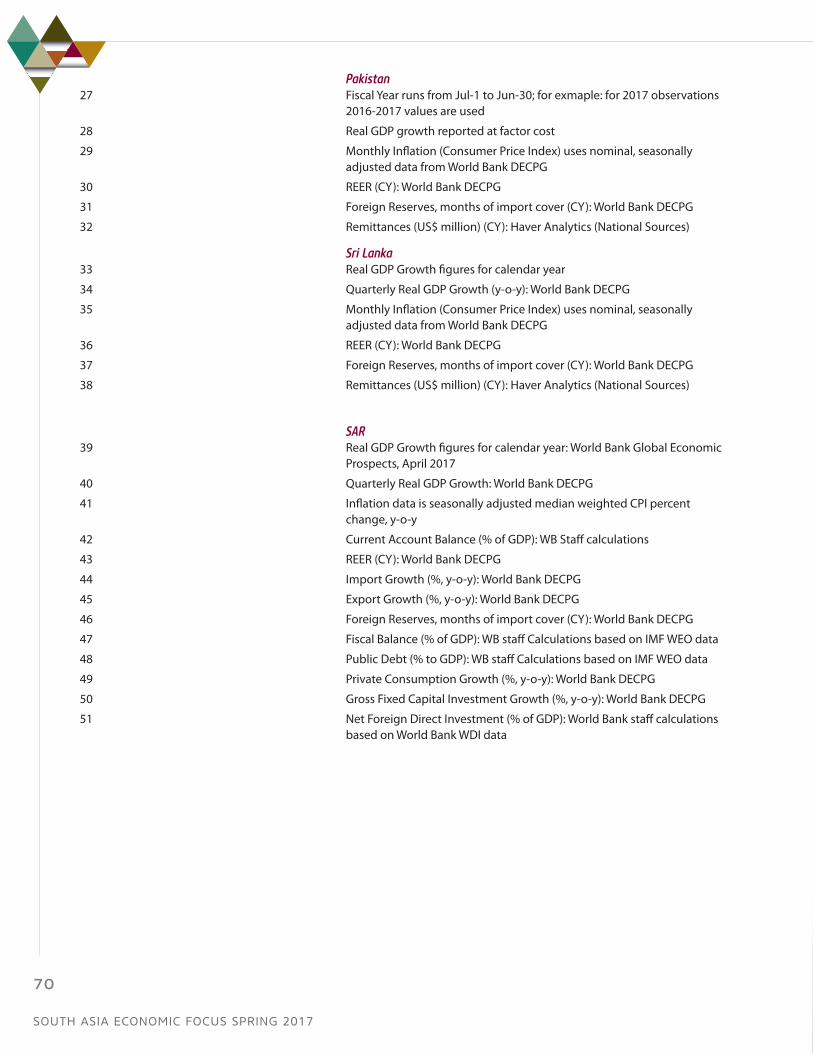
Pakistan27 Fiscal Year runs from Jul-1 to Jun-30; for exmaple: for 2017 observations
2016-2017 values are used
28 Real GDP growth reported at factor cost
29 Monthly Inflation (Consumer Price Index) uses nominal, seasonally adjusted data from World Bank DECPG
30 REER (CY): World Bank DECPG
31 Foreign Reserves, months of import cover (CY): World Bank DECPG
32 Remittances (US$ million) (CY): Haver Analytics (National Sources)
Sri Lanka33 Real GDP Growth figures for calendar year
34 Quarterly Real GDP Growth (y-o-y): World Bank DECPG
35 Monthly Inflation (Consumer Price Index) uses nominal, seasonally adjusted data from World Bank DECPG
36 REER (CY): World Bank DECPG
37 Foreign Reserves, months of import cover (CY): World Bank DECPG
38 Remittances (US$ million) (CY): Haver Analytics (National Sources)
SAR39 Real GDP Growth figures for calendar year: World Bank Global Economic
Prospects, April 2017
40 Quarterly Real GDP Growth: World Bank DECPG
41 Inflation data is seasonally adjusted median weighted CPI percent change, y-o-y
42 Current Account Balance (% of GDP): WB Staff calculations
43 REER (CY): World Bank DECPG
44 Import Growth (%, y-o-y): World Bank DECPG
45 Export Growth (%, y-o-y): World Bank DECPG
46 Foreign Reserves, months of import cover (CY): World Bank DECPG
47 Fiscal Balance (% of GDP): WB staff Calculations based on IMF WEO data
48 Public Debt (% to GDP): WB staff Calculations based on IMF WEO data
49 Private Consumption Growth (%, y-o-y): World Bank DECPG
50 Gross Fixed Capital Investment Growth (%, y-o-y): World Bank DECPG
51 Net Foreign Direct Investment (% of GDP): World Bank staff calculations based on World Bank WDI data
SOUTH ASIA ECONOMIC FOCUS SPRING 2017
70


1818 H Street, N.W.Washington, DC 20433


