South Norfolk Council Local Development Framework Sustainability Appraisal Framework for the Site Specific Policies and Allocations Development Plan Document and Area Action Plans October 2010
Transcript
South Norfolk Council Local Development Framework
Sustainability Appraisal Framework for the Site Specific Policies and Allocations Development Plan Document and Area Action Plans
October 2010
Page Contents 2 Introduction 3 Task A1 - Review of Literature, Plans, Programmes and Policies 7 Task A2 - Social, environmental and economic baseline information 8 Task A3 - Sustainability Issues 34 Task A4 - The Sustainability Framework 46 Task A5 - Consulting on the Scope of the Sustainability Appraisal 49 Appendix 1 - Review of Plans, Programmes and Policies 51 Appendix 2 - Baseline Information for South Norfolk 80 Appendix 3 - Compatibility between SA objectives 85 Appendix 4 - Sustainability Appraisal Framework 86 Sustainability Appraisal Framework Timeline Cabinet approve consultation version 12th July 2010 Consultation period 6th August – 10th September 2010 Cabinet approves changes to Sustainability Appraisal in response to representations received during consultation 4th October 2010 Final document published 6th October 2010
2
Introduction to Sustainability Appraisal and Strategic Environmental Assessment This Sustainability Appraisal forms part of the evidence base for the South Norfolk Site Specific Policies and Allocations DPD. It sets out the scope and level of detail of the SA. It is intended to define the key environmental and sustainability problems for the whole of South Norfolk District and sets out the findings from Stage A of the Sustainability Appraisal.
“Sustainable development is central to the reformed planning system. The purpose of sustainability appraisal (SA) is to promote sustainable development through the integration of social, environmental and economic considerations into the preparation of new or revised Development Plan Documents (DPDs) and Supplementary Planning Documents (SPDs).” (Sustainability Appraisal of Regional Spatial Strategies and Local Development Documents, ODPM 2005)
SEA is required by European and UK law. It involves the systematic identification and evaluation of the environmental impacts of a plan or programme (EC Directive 2001/42/EC). The aim of the SEA Directive is “to provide for a high level of protection of the environment and to contribute to the integration of environmental considerations into the preparation and adoption of plans and programmes, with a view to promoting sustainable development”. The EC Directive was transposed into UK legislation by the Environmental Assessment of Plans and Programmes Regulations 2004 (the ‘SEA Regulations’), which came into force on 21st July 2004. The SEA Regulations apply to plans and programmes prepared by a national, regional or local authority. The Planning and Compulsory Purchase Act 2004 (PCPA) requires Local Planning Authorities to undertake SA for each of their Local Development Documents (LDDs), including Site Specific policies and allocations (SS) DPD and Area Action Plans (AAPs). SA extends the concept of SEA to encompass economic and social concerns. SA is a statutory requirement. Sustainability Appraisal (SA) is an iterative process that identifies and reports on the likely significant effects of a plan. It achieves this by testing the performance of the plan against a series of environmental, social and economic objectives which together define sustainable development. This process can identify issues to be addressed as well as enhancement opportunities. It is a systematic and transparent process for informing decision-making and for improving the performance and sustainability of plans. Government guidance sets out a five-stage approach to undertaking SA as part of DPD production (see Table 1). Table 1: Five Stages of Sustainability Appraisal Stage A: Setting the context & objectives, evidence gathering to establish baseline
and deciding on the scope, culminating in production of scoping report Stage B: Developing and refining the options and assessing the effects and
mitigation by testing plan objectives against the SA Framework Stage C: Documenting & appraising the effects of the plan & preparing SA report Stage D: Consulting on the plan and the SA report Stage E: Monitoring the significant effects of implementing the plan Source - Sustainability Appraisal of RSSs and LDDs, ODPM 2005 Government guidance states that the Scoping Report should set out the findings of Stage A together with information on what happens next in the process. Stage A consists of five key tasks Table 2: Stage A Key Tasks Task A1: Identify other relevant plans, programmes and sustainability objectives
3
that will influence the LDF Task A2: Collect relevant social, environmental and economic baseline
information Task A3: Identify key sustainability issues for the SA / plan to address Task A4: Develop the SA framework, consisting of the SA objectives, indicators
and targets Task A5: Produce a Scoping Report and consult relevant authorities on the scope
of the appraisal Source - Sustainability Appraisal of Regional Spatial Strategies and Local Development Documents, ODPM 2005 The iterative nature of Sustainability Appraisal (SA) means that it should inform decision-making throughout production of the DPD. Consideration of sustainability issues and/or implications highlighted through the SA should form part of the deliberations at each key milestone and the reasons for each decision recorded. The SA will also help develop monitoring arrangements. This Sustainability Appraisal has had regard to the (now revoked) East of England Plan (2008) and the Greater Norwich Development Partnership (GNDP) Joint Core Strategy Sustainability Appraisal Scoping Report (2007). The GNDP Joint Core Strategy was produced to cover the Broadland, Norwich and South Norfolk Councils and contains a range of information relevant to South Norfolk documents, a comprehensive SA assessment framework & indicators. The SS and the AAPs are subsidiary and must conform to the overarching JCS. Therefore sustainability principles in higher-level documents are also applicable to this SA. In the interests of brevity sustainability issues covered in higher order Sustainability Appraisals are not repeated, although they may be referred to or expanded upon where necessary. The format of Sustainability Appraisal seeks to allow for a greater consideration of site-specific details than the broader approach adopted in higher-level documents. ODPM SA Guidance 2005 states that planning authorities can prepare a single SA when consulting on a number of LDDs at the same time as long as the report provides adequate information on the scope and level of detail required for the SA of each LDD. The Council has considered the nature of the DPDs covered by this SA (Site Specific allocations & policies and Area Action Plans) and feels that they are similar enough in purpose and scale that potential sustainability issues can be addressed by a single SA. The Area Action Plans and the Site Specific DPD are concerned with allocation of site specific development sites and introduction of site specific policies, the main difference is the increased focus on deliverability of the AAPs. This SA sets out the objectives, specific sustainability issues, locally relevant baseline information and broad options to be considered of the following LDDs
• Site Specific Policies and Allocations DPD • Wymondham AAP • Long Stratton AAP • Norwich Research Park AAP • Park Road, Diss AAP
Habitats Directive and Appropriate Assessment The Site Specific DPD and the AAPs will also have to comply with the Directive on Conservation of Natural Habitats and of Wild Flora and Fauna 92/43/EEC (Habitats Directive) transposed into UK law through the Conservation of Habitats and Species Regulations 2010. The Directive requires plans and programmes to undergo an “Appropriate Assessment” to
4
ascertain what the potential effects on European sites (also known as Natura 2000 sites) of nature conservation interest e.g. Special Areas of Conservation (SACs), Special Protection Areas (SPAs) and RAMSAR sites (internationally important wetland sites). Appropriate Assessment is concerned with any potential effects arising as a result of the plan or programme upon European sites. Such effects can be direct or indirect; Appropriate Assessment seeks to establish the significance of such effects, the implications for the site and to suggest alternatives. Plans should avoid significant impacts, mitigate those that remain and where necessary provide compensation (habitat relocation/creation etc.) Although it should be noted that compensation is the last stage of the process and is not considered in the AA itself – only after a project has received a negative AA but is deemed to be of over-riding public interest and with no satisfactory alternatives (Regulation 62). Appropriate Assessment considers the reasons for the sites designation (habitat/species) and the conservation objectives of management plans in place to preserve these. If these are compromised directly or through a combination of factors – including other plans/development, the plan must set out how it is intended to avoid or mitigate such impacts. South Norfolk Development Plan Documents Joint Core Strategy (JCS) The Greater Norwich Development Partnership (GNDP), comprising the Councils of South Norfolk, Broadland and Norwich City in conjunction with Norfolk County Council are producing a Joint Core Strategy (JCS) for growth across all three Council areas up to 2026. The JCS will establish the overall vision and strategic direction of growth for the GNDP area. The JCS will also set the strategic framework for growth in South Norfolk (e.g. settlement hierarchy) and therefore exerts a critical influence over the Site Specific DPD and the AAPs which must demonstrate that they are in conformity with higher level documents. South Norfolk’s contribution to the Joint Core Strategy housing requirement target is 10,600 new homes by 2026. South Norfolk’s minimum housing requirement in the submitted JCS is as below: Wymondham - 2200 Long Stratton - 1800 Cringleford - 1200 Easton / Costessey - 1000 Hethersett - 1000 Other smaller sites within the NPA - 1800 Other sites outside of the NPA - 1600 Windfall sites may come forward as a result of infill development within defined development boundaries but will not be counted towards South Norfolk’s housing requirement but can contribute to 5 year housing land supply calculations. Site Specific Policies and Allocations DPD The Site Specific Policies and Allocations DPD will contain detailed site specific policies, define the precise extent of development boundaries (in accordance with the Joint Core Strategy) and allocate sites for particular land uses e.g.
• Housing – includes identification of “floating 1800” in Norwich Policy Area from Joint Core Strategy and allocations in the main towns and service villages.
• Employment & Retail sites • Mixed use allocations • Open space • Transport
5
Each allocation will set out the requirements specific to the site e.g. developer contributions, environmental, design and access issues etc. The DPD will also provide detail for those policies requiring a spatial definition e.g.
• Development boundary extents for all settlements included in Joint Core Strategy Settlement Hierarchy.
• Designated areas e.g. County Wildlife Sites, Sites of Archaeological Interest, areas within development boundaries not to be developed
• Local Landscape designations e.g. River Valleys, strategic breaks • Primary & secondary shopping areas
Settlement specific policies as their title suggests are self explanatory but could be many and varied in scope e.g. policy for enhancement of Diss Mere, assisting with provision of a new burial ground in Long Stratton, surface water drainage policy for Poringland or protection of views to Wymondham Abbey Area Action Plans South Norfolk’s published Local Development Scheme includes four Area Action Plans
• Wymondham • Long Stratton • Norwich Research Park • Park Road, Diss
The Area Action Plan DPDs will establish detailed guidance for the four growth areas identified above. Wymondham, Long Stratton and Norwich Research Park are strategic growth locations identified in the Joint Core Strategy. Wymondham is a strategic housing and employment location, Long Stratton strategic housing location (required to deliver a bypass) and local employment location. The Norwich Research Park is a specialist employment location and Park Road, Diss is a brownfield edge of town centre site requiring an extra level of focus to resolve a range of issues and ensure delivery. The Area Action Plans set out the detailed policies, phasing, infrastructure and delivery plans for each of the target areas in order to ensure growth is delivered in a co-ordinated and comprehensive manner. This comprehensive approach aims to ensure that well-integrated, sustainable development takes place in each location and seeks to build consensus amongst interested parties.
6
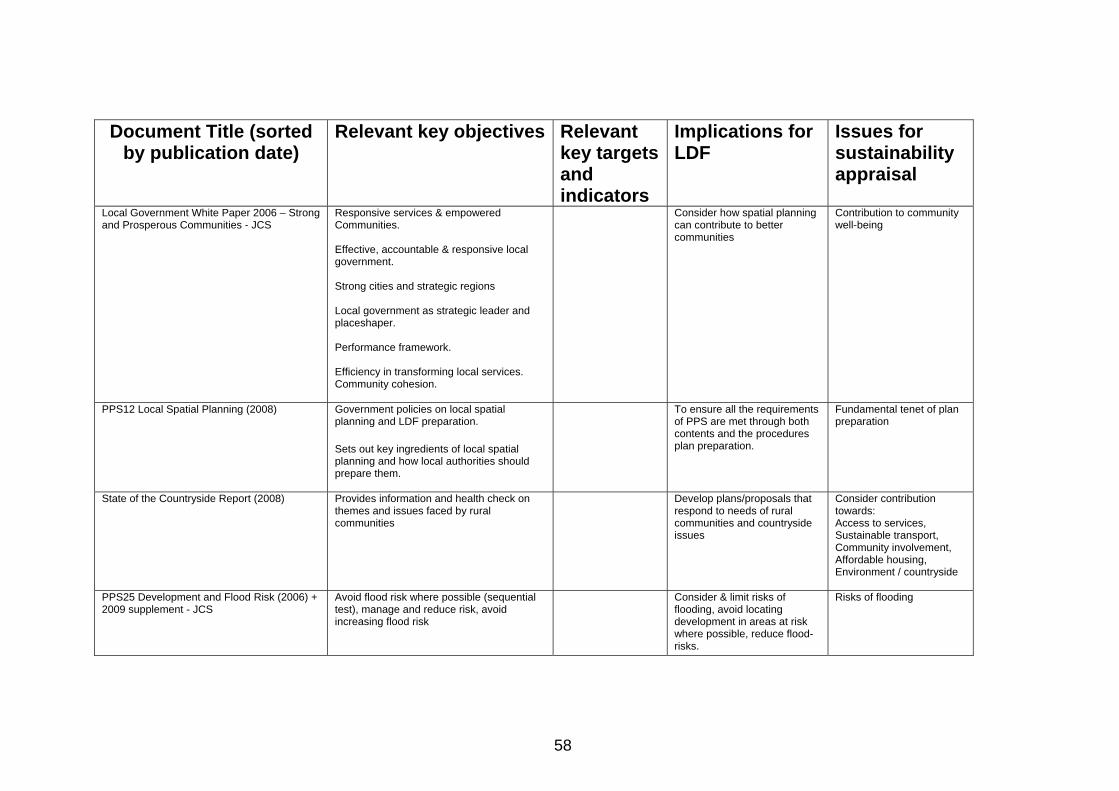
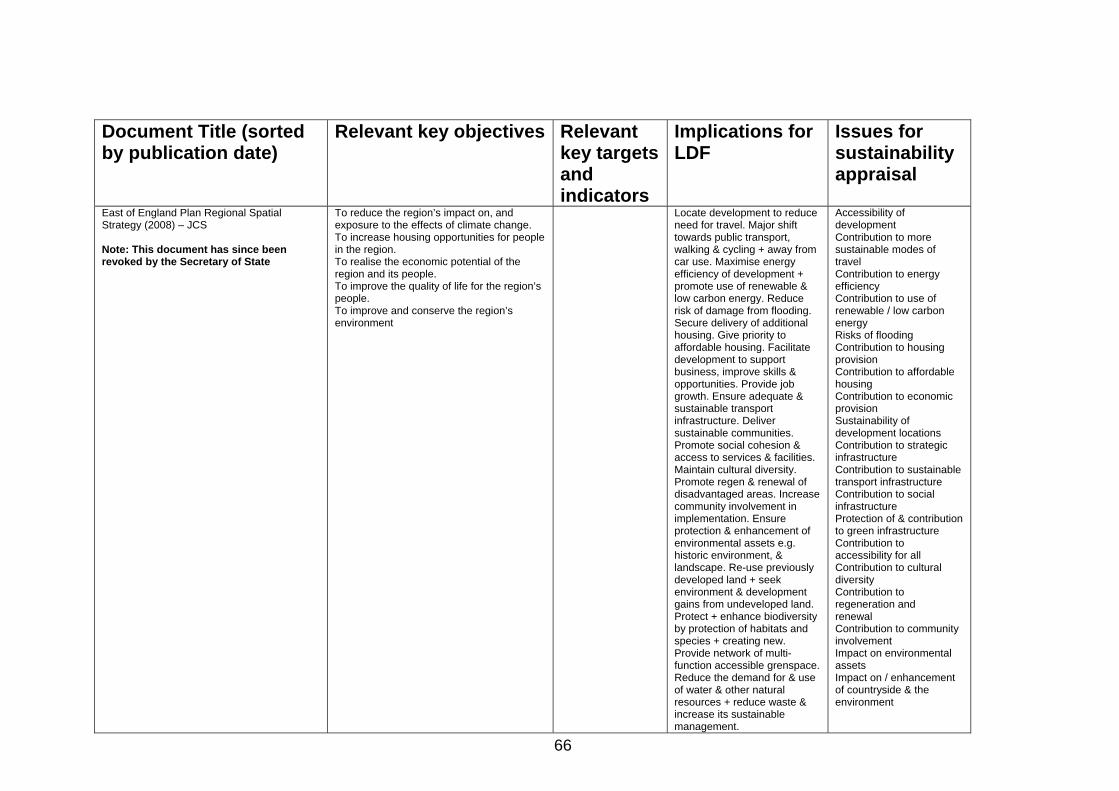
Task A1 – Review of Literature, Plans, Programmes and Policies The first task for the Sustainability Appraisal Scoping Report is to assess other relevant plans, programmes and policies. This is intended to identify issues, opportunities and implications for the Site Specific Policies and Allocations DPD, the Area Action Plans and the Sustainability Appraisal process. The Local Planning Authority must take account of relationships between the DPD and other relevant policies, plans, programmes and sustainability objectives. The SEA Directive specifically requires environmental protection objectives established at international, European Community or national levels to be taken into account. Other relevant documents include the UK Sustainable Development Strategy, and PPSs, and a range of other plans and strategies, all of which may influence the options to be considered in preparation of the DPD. Information on these relationships will enable potential synergies to be exploited and any inconsistencies and constraints to be addressed. The Joint Core Strategy Scoping Report includes a wide ranging review of the plans, programmes and policies which are likely to impact upon the proposals in the Joint Core Strategy area, of which South Norfolk is a part (see Appendix 1 of the Joint Core Strategy Scoping Report - http://www.gndp.org.uk/sustainabilityappraisal. There is a degree of overlap between documents with lower level documents reflecting and applying objectives and policies from higher-level documents. The list of documents within the Joint Core Strategy Scoping Report have been examined to establish whether any have been revised or superseded and whether any other lower level documents with particular relevance to the production of the Site Specific Policies and Allocations DPD or Area Action Plans should be included. Below is a list of the newly reviewed documents. The full review, which details the key objectives, targets and indicators of each document plus considers the possible implications for the Site Specifics DPD and the Area Action Plans as well as some emerging issues for the Sustainability Appraisal can be found at Appendix 1 of this report. Recently reviewed literature – see Appendix 1 for full list
• PPS 4 – Planning for Sustainable Economic Growth • Supplement to PPS 25 – Development and Coastal Change • Consultation PPS – Planning for a Natural and Healthy Environment • Consultation PPS – Planning for a Low Carbon Future in a Changing Climate
Task A2 - Social, environmental and economic baseline information Introduction The Scoping Report for the Joint Core Strategy sustainability appraisal establishes a wide range of baseline information for Broadland, Norwich and South Norfolk Council areas. Given the strategic nature of the Joint Core Strategy much of the information is generic for the area as a whole rather than specific to each Council area. Brief summaries are provided highlighting the differences/unique qualities of each district. As this SA covers the South Norfolk Site Specific Policies and Allocations DPD and Area Action Plans for Wymondham and Long Stratton growth locations, Diss (Park Road) and the Norwich Research Park further baseline information for South Norfolk is included. Collecting and using baseline information There is a wide range of information and data relating to the district. It is not possible to present or respond to the full range of information available, therefore certain aspects of the available data have been used to provide a ‘baseline’ of the current status of South Norfolk as set out in this report. The baseline information is intended to establish the characteristics and present a spatial portrait of the district – see Appendix 2. The information at Appendix 2 gives the current situation as well as trend information, where available. Most of the information presented is available publicly, such as though the Audit Commission, or from assessments such as the Census or Indices of Multiple Deprivation. The wider evidence base The Local Development Framework process relies on a large and ongoing process of evidence gathering. A new of key strategic studies have already been completed to inform the Joint Core Strategy and may benefit other Local Development Documents. The range of studies of potential interest to the Sites Specifics Policies and Allocations DPD and the four Area Action Plans include:
• Appropriate Assessment of the Joint Core Strategy for Broadland, Norwich and South Norfolk (2009/10)
• Joint Core Strategy Sustainability Appraisal (2008-09) • GNDP Infrastructure Needs and Funding Study (volume 1 – 2007, volume 2
- 2009) • Greater Norwich Economic Strategy (2009) • GNDP Norwich Sub Region: Retail and Town Centres Study (2007) and
South Norfolk Retail Study (2004) • Greater Norwich Employment Growth and Sites & Premises Study (2008) • Knowledge Economy Strategy (2009) Prepared for Greater Norwich
Development Partnership by SQW Consulting. • Greater Norwich Housing Market Assessment (2007 & 2009 update;
Greater Norwich Housing Strategy 2008-2011 and Greater Norwich Housing Needs and Stock Condition Survey (2007)
• GNDP Strategic Housing Land Availability Assessment (2009) • Gypsy and Traveller Accommodation Needs Survey. South Norfolk (2006) • GNDP Green Infrastructure Strategy (2007) • GNDP Green Infrastructure Delivery Plan (2009) • GNDP Historic Landscape Assessment of Growth Locations (2009) • South Norfolk PPG17 Open Spaces, Indoor Sports and Community
• Sustainable Energy Study for the Joint Core Strategy for Broadland, Norwich and South Norfolk (2009)
• GNDP Integrated Water Cycle Study (Stages 1 & 2a complete, Stage 2b February 2010)
• Local Transport Plan & Norwich Area Transportation Strategy • GNDP Public Transport Requirements of Growth (2008) & A47 Southern
Bypass Junctions Capacity Assessment Report (2008) • A Feasibility study on a Conference Centre and Concert Hall for the Greater
Norwich area (2009)
Other background documents to inform preparation of the South Norfolk LDF include:
• District Council Strategies e.g. Economic Development Strategy, Housing Strategy, Environment Strategy, Tourism Strategy;
• South Norfolk Sustainable Community Strategy; • Various Parish & Town Plans; • Residential Land Availability Study (published annually) • South Norfolk Landscape Character Assessment (2001 and 2008); • National Land Use Database (published annually). • Biodiversity Action Plans; • Employment Monitor (Published annually); • Annual Monitoring Report (published annually);
A Spatial Portrait of South Norfolk The following chapter of the Sustainability Appraisal Report offers a characterisation, or a spatial portrait, of South Norfolk. It provides baseline information to enable the identification of sustainability issues, which should be addressed through the various LDDs. It will also act as a reference against which the sustainability implications of those LDF documents can be monitored. Information is presented under the following headings
• Demographics • Environment • Landscape • Water Resources • Waste, Energy and Resources • Society and Housing • Education • Economy • Transport and Access
9
South Norfolk Demographics South Norfolk District is composed of 119 parishes, with 34 wards Baseline figures South Norfolk Previous population 1991 Census 103,410 Previous households 1991 Census 43,916 Population 2001 Census 110,710 Households 2001 Census 46,607 Population 2001 (%): a) 0 – 15 years old
18.7%
b) 16 – 44 years old 33.9% c) 45 – 64 years old 28.2% d) 65 years old and over 19.3% Urban: fringe: rural split (%) 19.4%: 27.8%: 52.8% Population density 2008 (estimate) 1.30 2008 mid-year population estimate 119,200 Projected population 2011 122,000 Projected population 2021 135,100 (Source: Norfolk Insight, ONS & South Norfolk AMR) Environment & Landscape The South Norfolk landscape is a mixture of broad, open arable farmland plateaus and six main river valleys, including the major watercourses of the Rivers Yare and Waveney and the adjoining Norfolk and Suffolk Broads to the north and east. The district lies mainly on glacial deposit geology. The local Landscape Character Assessment refines the national Landscape Character Areas shown in Figure 6 and identifies seven separate landscape types across the district. Throughout the district there are a number of areas of locally significant landscape value. Many of these follow the route of important river valleys, predominantly along the River Wensum and the rivers Waveney, Tiffey, Yare, Tas, Tud and Chet. Additional areas of landscape value also include areas of open land that maintain a separation between certain settlements, and a large landscape protection area around the A47 south of Norwich, which is considered important for preserving the historic context of the city of Norwich. There are many valuable wildlife habitats of international (Natura 2000 sites) and national importance, nearly 250 County Wildlife Sites and over 100 areas of ancient woodland within and in proximity to South Norfolk that could be affected by development. Of the 1,289 hectares of SSSI (some 26 sites), 36% were in ‘favourable’ or ‘unfavourable recovering’ condition in May 2007. The towns and villages scattered around the district are home to many historic buildings and heritage features, which help create their own distinctive character. The district has a wealth of Listed Buildings, Scheduled Ancient Monuments, and Conservation Areas. In fact, there are three times as many Conservation Areas and Listed Buildings as in the other authorities, and nearly twice as many Monuments. There are also historic gardens covering 25 hectares remaining from significant estates in the District, although at least 26 more have been lost since the 1880s. There are also many areas of archaeological interest within the district, including a protected area of Roman-era hedgerow patterns in Dickleburgh. South Norfolk is amongst the lowest producer of household waste per capita in Norfolk (360kg per person), recycled almost 39% of this and composted 8.8% of its household waste in 2008/9. There are a number of small household-size renewable energy projects installed across the district, but as of yet no major renewable energy generation facilities exist. Along
10
with CO2 emissions being, with Broadland, the highest in Greater Norwich, South Norfolk’s ecological footprint is also the most resource-intensive, with residents requiring some 5.8 global hectares of land per capita to support their lifestyles.
Figure 1: Natural England National Landscape Character Areas. Source: East of England Plan (2008)
Figure 2: Agricultural Land Classification. Source: www.magic.gov.uk
11
Figure 3: Landscape Types and Character Areas of South Norfolk. Source: South Norfolk Landscape Assessment (2001)
12
SSSI name Habitat Aslacton Parish Land Neutral grassland - lowland Bramerton Pits Earth heritage Broome Heath Pits Earth heritage Caistor St. Edmund Chalk Pit Earth heritage Coston Fen, Runhall Fen, marsh and swamp - lowland Ducan's Marsh, Claxton Fen, marsh and swamp - lowland
Flordon Common Fen, marsh and swamp – lowland + broadleaved, mixed and yew woodland - lowland
Forncett Meadows Neutral grassland - lowland Fritton Common Acid & Neutral grassland - lowland Gawdyhall Big Wood, Harleston Broadleaved, mixed and yew woodland - lowland
Geldeston Meadows Fen, marsh and swamp – lowland + standing open
ater and canals w
Hardley Flood Fen, marsh and swamp – lowland & standing open
ater and canals w Hedenham Wood Broadleaved, mixed and yew woodland - lowland Leet Hill, Kirby Cane Earth heritage Lower Wood, Ashwellthorpe Broadleaved, mixed and yew woodland - lowland Poplar Farm Meadows, Langley Fen, marsh and swamp - lowland Pulham Market Big Wood Broadleaved, mixed and yew woodland - lowland River Wensum R ivers and streams + neutral grassland - lowland
Sea Mere, Hingham Standing open water and canals & neutral grassland lowland -
Sexton Wood Broadleaved, mixed and yew woodland - lowland Shelfanger Meadows Neutral grassland - lowland Shotesham Common Neutral grassland - lowland Shotesham-woodton Hornbeam Woods Broadleaved, mixed and yew woodland - lowland Stanley And Alder Carrs, Aldeby Fen, marsh and swamp - lowland Tindall Wood, Ditchingham Broadleaved, mixed and yew woodland - lowland
Yare Broads And Marshes
Fen, marsh and swamp – lowland + broadleaved, mixed and yew woodland – lowland & standing open
ater and canals w (Source: Natural England) In addition to Natura 2000 sites and SSSIs South Norfolk contains many priority habitats and species and 245 ‘County Wildlife Sites’ that cover 1835 hectares throughout the District. There are also a number of valuable sites close to, but not within, the District and any potential impacts upon these must also be considered. There are also a number of significant listed buildings, ancient monuments, historic parklands and NHER sites (sites of local archaeological interest) that contribute towards the special character and distinctiveness found in South Norfolk. Asset Number Grade I Listed Buildings 102 Grade II* Listed Buildings 147 Grade II Listed Buildings 3061 Scheduled Ancient Monuments 46 Sites of local archaeological interest 2875 Historic Parks and Gardens (English Heritage Register) 19
13
Water Resources East Anglia is recognised as one of the driest areas of the country. Pressure on water resource supplies are exacerbated by lower rainfall, agricultural practices as well as continued residential and employment growth. Water is a vital societal, ecological and economic resource. Increased pressure on water quality, supply and drainage/flooding aspects are significant issues for the Sites Specific Policies and Allocations DPD and the Area Action Plans to assess/take into consideration. The presence of The Broads Authority area (equivalent to a National Park) and numerous international, national and locally important water based conservation areas highlights the importance of water resources in the plan area. Rivers such as the Wensum, Yare and Waveney are important aspects of the catchment area across South Norfolk, feeding into the Broads, providing nutrients as well as an important habitat in their own right. The Broads and parts of the Wensum are designated as internationally important ‘Special Areas of Conservation’. Waste, Energy and Resources The reduction of waste and continued increase of re-use and recycling in the District are key Council priorities. All households in South Norfolk now have an alternate weekly kerbside waste and recycling service through which paper, card, metal cans and plastic bottles are collected for recycling. In addition the County Council provides four Household Waste Recycling Centres within South Norfolk and there are nearly 90 community-based mini recycling centres provide facilities for recycling glass bottles, textiles and other materials throughout the District. Future waste strategies will reduce the amount of waste collected from every household, maximise the rate of recycling and extend the range of materials recycled or composted. The Council has a published Environment Strategy that sets out the upcoming challenges and a range of measures to tackle them. The Environment Strategy covers the following topics:
• Managing the environmental impact of Council activities • Understanding and preparing for future climatic impacts in South Norfolk • Reducing energy consumption and use of natural resources • Transport • Air, land and water quality • Bio and geo-diversity • Built and urban environment • Managing waste
The Environment Strategy can be downloaded via the following link: http://www.south-norfolk.gov.uk/democracy/media/environment_strategy.pdf South Norfolk’s ecological footprint was assessed as 5.80gha per person (compared to Broadland’s 5.76gha and a UK average of 5.4gha). Whilst there is clearly a need to reduce both national and local ecological footprints to sustainable levels; South Norfolk’s higher than average assessment reflects the high food and transport energy costs to be found in a predominantly rural area.
Society and Housing The residents of South Norfolk are some of the healthiest in the country, although the higher levels of deprivation in Costessey and Diss do present challenges of a less healthy population. If present trends continue, South Norfolk as a whole is the only district in Norfolk expected to achieve all 4 Our Healthier Nation targets by 2010. Educational achievement in 2006/07 was higher than the national average at GCSE grade level. Crime levels are lower than the national average but are slightly higher than the figures for Broadland. The district is not ranked highly in the Index of Deprivation (ranking 291 out of 354), although some pockets of deprivation exist. Old Costessey is the most deprived ward in the district, and is within the third most deprived nationally for income, education and child poverty. The District’s rural character presents some problems in accessing services, with five wards in the district being within the thousand most deprived nationally.
Similar to Broadland, the housing is predominantly owner-occupied (78%) and contains only 11% social housing. However, provision of new affordable housing has been slower in South Norfolk than elsewhere in Greater Norwich, as only 38 affordable homes were provided between 2004 and 2006. Characterised by a large proportion of older, rural housing stock, South Norfolk has the highest share of the Greater Norwich housing stock that fails to meet the ‘decent homes’ standard. The price of houses in South Norfolk has increased the most rapidly in Greater Norwich, and the average price is consistently above the Norfolk average. Housing Stock South Norfolk Owner Occupied 38,000 Private Rented 5,100 Registered Social Landlord / Housing Association 5,500 Local Authority 0 Detached 27,900 Semi-detached 13,300 Terraced 5,800 Flats 2,500 (Source: Greater Norwich Housing Need & Stock Condition Study 2006)
Figure 4: South Norfolk House Prices (Mean) Source: Norfolk Insight Education The provision of education in South Norfolk is typical for a predominantly rural District. First and Primary Schools of varying sizes are located throughout the area with High Schools concentrated on the larger Market Towns and within Norwich. Further education is primarily from the major urban centres abutting South Norfolk e.g. Norwich and Great Yarmouth. Attainment levels in South Norfolk are very positive, with schools throughout the District achieving higher qualification rates than County, Regional and National average. South Norfolk Norfolk East of
England England
% people working age (16 – 74 yrs) with no qualifications (at 2001)
28.7%
32.4%
27.9%
28.9%
% Pupils at end Key Stage 4 with 5 or more GCSEs at A* - C grade (inc. Maths + English) 2008
58.9%
49.01%
50.3%
48.3%
% people of working age (16-74yrs) with highest qualification gained from level 4/5 (GCE ‘A’ level or equivalent (at 2001)
20.8%
19.5%
20.5%
19.4%
(Source: 2001 Census and Norfolk Insight)
16
Economy For a predominantly rural area, South Norfolk is relatively affluent, and does not have the significant issues of unemployment or deprivation of more urban areas. Some residents do experience issues associated with low income, at or towards the minimum wage (average adult earnings are only 85% of the national average) and obtaining access to services, especially in the more remote parts of the district, is often problematic in accessing the workplace. Within South Norfolk, the biggest employers are the Norfolk and Norwich Hospital and the science research park at Colney. More than half of South Norfolk’s resident workforce is employed within Norwich city. Wymondham is recognised as a regionally important strategic employment centre and is already home to Lotus Cars, the Hethel Engineering Centre, Gateway 11 Business Park and the Norfolk Police Headquarters.
The majority of employers are small; only 5% employ more than 25 people. To the south of the district, most of the land is used for agriculture and food related uses, which remains a significant influence. Despite the rural nature of the district, agriculture and fishing only form 3.5% of employment. The economy continues to move from traditional agriculture and industry towards an office-based economy.
Sector (% of total employment) South Norfolk East of England England Manufacturing 10.7% 10.3% 10.2% Construction 6.5% 5.4% 4.8% Distribution, hotels and restaurants 21.0% 25.0% 23.4% Transport and communications 2.4% 6.0% 5.8% Banking, finance, insurance etc. 15.2% 21.4% 22.0% Public administration, education and health
36.0% 25.3% 27.0%
Other services 3.7% 4.8% 5.3% (Source: Nomis, Annual Business Inquiry 2007) Transport and Access South Norfolk is a predominantly rural district, abutting the major urban centre of Norwich. The district is bisected by a number of key strategic routes (A11, A47, A140 & A143) and rail routes to London and Cambridge. As might be expected in a rural area use of private motor vehicles is higher than average. Public transport to the main market towns and along the strategic road routes is generally good but more limited in the rural areas, as evidenced in the statistics below.
Modes of Travel to Work (%) South Norfolk East of England England Car or van 71.0% 65.2% 61.5% Motor cycle / scooter 1.4% 1.1% 1.1% Public transport 17.1% 20.3% 24.1% On foot/cycle/other 10.5% 13.4% 13.3% Works at or mainly from home 22.8% 15.7% 13.6% Travel less than 2 km to work 18.8% 21.7% 19.9% Travel 2 – 20 km to work 45.5% 48.3% 53.8%
Travel more than 20 km to work 12.9% 14.3% 12.7% (Source: National Statistics from 2001 Census)
17
Living in a rural area can increase the degree of isolation, result in poor access to facilities and create a dependence upon private motor transport. The problems of accessing a key service is illustrated in the following table. Access to GP Services South Norfolk East of England England % households within 15mins walk/public transport
65.63% 83.41% 89.31%
% households within 15mins by cycle
65.75% 88.78% 93.70%
% households within 15mins by car 100.00% 100.00% 99.99% % households within 30mins walk/public transport
94.32% 96.41% 98.83%
% households within 30mins by cycle
96.67% 95.94% 99.13%
% households within 30mins by car 100.00% 100.00% 100.00% (Source: Norfolk Insight) Transport improvements for the area are set out in Norfolk County Council’s Local Transport Plan and the Norwich Area Transportation Strategy.
• Norfolk Local Transport Plan: http://www.norfolk.gov.uk/consumption/idcplg?IdcService=SS_GET_PAGE&nodeId=3361
South Norfolk also has a number of long distance footpaths and an extensive network of public footpaths and bridleways. Enhancement of these is identified in the Green Infrastructure Strategy and Delivery Plan.
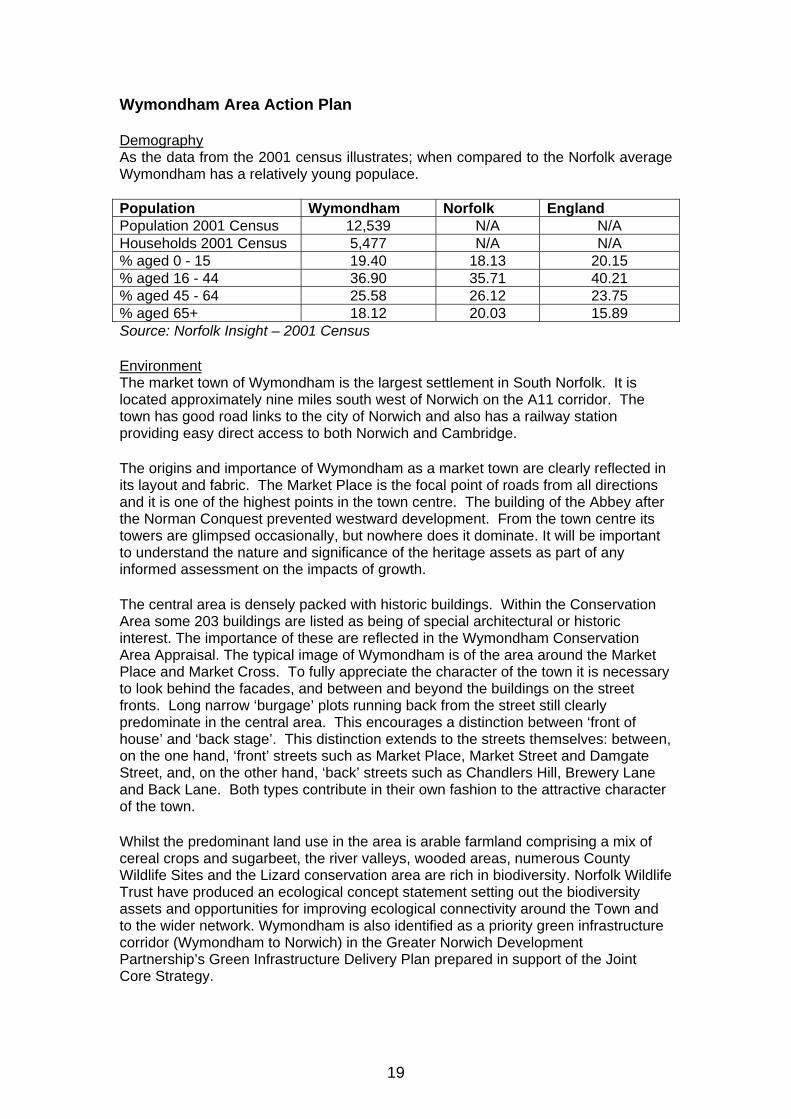
Wymondham Area Action Plan Demography As the data from the 2001 census illustrates; when compared to the Norfolk average Wymondham has a relatively young populace. Population Wymondham Norfolk England Population 2001 Census 12,539 N/A N/A Households 2001 Census 5,477 N/A N/A % aged 0 - 15 19.40 18.13 20.15 % aged 16 - 44 36.90 35.71 40.21 % aged 45 - 64 25.58 26.12 23.75 % aged 65+ 18.12 20.03 15.89 Source: Norfolk Insight – 2001 Census Environment The market town of Wymondham is the largest settlement in South Norfolk. It is located approximately nine miles south west of Norwich on the A11 corridor. The town has good road links to the city of Norwich and also has a railway station providing easy direct access to both Norwich and Cambridge. The origins and importance of Wymondham as a market town are clearly reflected in its layout and fabric. The Market Place is the focal point of roads from all directions and it is one of the highest points in the town centre. The building of the Abbey after the Norman Conquest prevented westward development. From the town centre its towers are glimpsed occasionally, but nowhere does it dominate. It will be important to understand the nature and significance of the heritage assets as part of any informed assessment on the impacts of growth. The central area is densely packed with historic buildings. Within the Conservation Area some 203 buildings are listed as being of special architectural or historic interest. The importance of these are reflected in the Wymondham Conservation Area Appraisal. The typical image of Wymondham is of the area around the Market Place and Market Cross. To fully appreciate the character of the town it is necessary to look behind the facades, and between and beyond the buildings on the street fronts. Long narrow ‘burgage’ plots running back from the street still clearly predominate in the central area. This encourages a distinction between ‘front of house’ and ‘back stage’. This distinction extends to the streets themselves: between, on the one hand, ‘front’ streets such as Market Place, Market Street and Damgate Street, and, on the other hand, ‘back’ streets such as Chandlers Hill, Brewery Lane and Back Lane. Both types contribute in their own fashion to the attractive character of the town. Whilst the predominant land use in the area is arable farmland comprising a mix of cereal crops and sugarbeet, the river valleys, wooded areas, numerous County Wildlife Sites and the Lizard conservation area are rich in biodiversity. Norfolk Wildlife Trust have produced an ecological concept statement setting out the biodiversity assets and opportunities for improving ecological connectivity around the Town and to the wider network. Wymondham is also identified as a priority green infrastructure corridor (Wymondham to Norwich) in the Greater Norwich Development Partnership’s Green Infrastructure Delivery Plan prepared in support of the Joint Core Strategy.
19
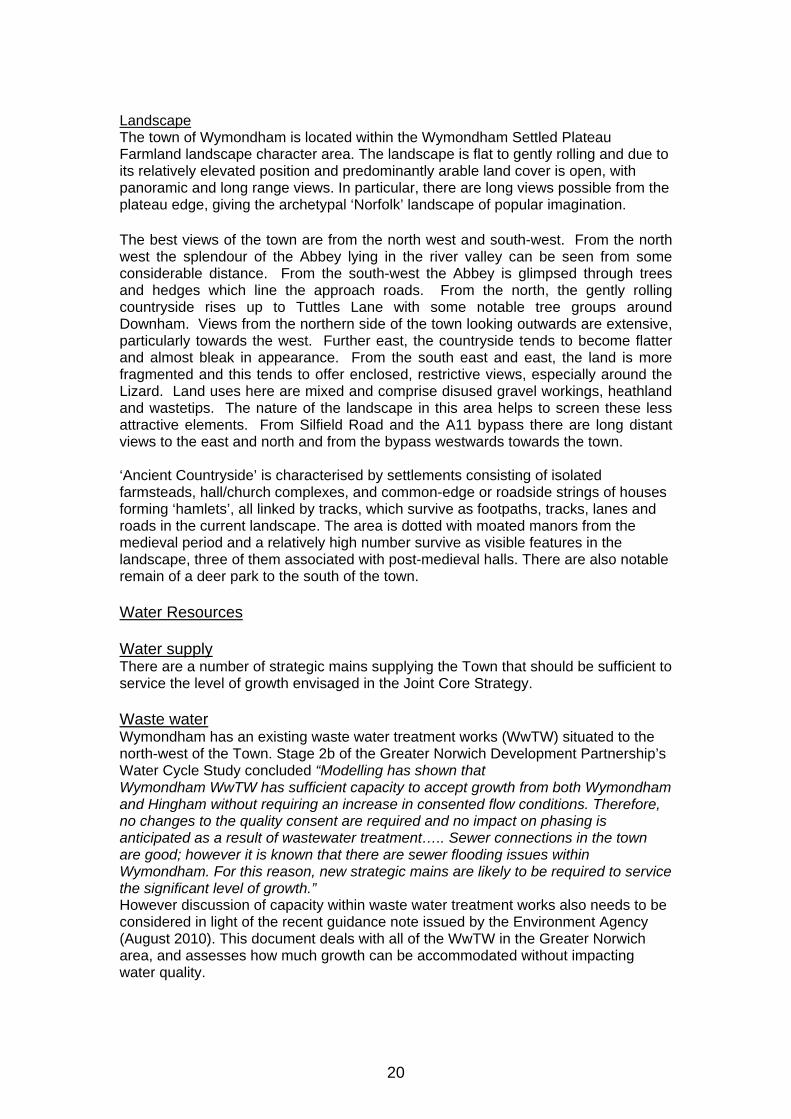
Landscape The town of Wymondham is located within the Wymondham Settled Plateau Farmland landscape character area. The landscape is flat to gently rolling and due to its relatively elevated position and predominantly arable land cover is open, with panoramic and long range views. In particular, there are long views possible from the plateau edge, giving the archetypal ‘Norfolk’ landscape of popular imagination. The best views of the town are from the north west and south-west. From the north west the splendour of the Abbey lying in the river valley can be seen from some considerable distance. From the south-west the Abbey is glimpsed through trees and hedges which line the approach roads. From the north, the gently rolling countryside rises up to Tuttles Lane with some notable tree groups around Downham. Views from the northern side of the town looking outwards are extensive, particularly towards the west. Further east, the countryside tends to become flatter and almost bleak in appearance. From the south east and east, the land is more fragmented and this tends to offer enclosed, restrictive views, especially around the Lizard. Land uses here are mixed and comprise disused gravel workings, heathland and wastetips. The nature of the landscape in this area helps to screen these less attractive elements. From Silfield Road and the A11 bypass there are long distant views to the east and north and from the bypass westwards towards the town. ‘Ancient Countryside’ is characterised by settlements consisting of isolated farmsteads, hall/church complexes, and common-edge or roadside strings of houses forming ‘hamlets’, all linked by tracks, which survive as footpaths, tracks, lanes and roads in the current landscape. The area is dotted with moated manors from the medieval period and a relatively high number survive as visible features in the landscape, three of them associated with post-medieval halls. There are also notable remain of a deer park to the south of the town. Water Resources Water supply There are a number of strategic mains supplying the Town that should be sufficient to service the level of growth envisaged in the Joint Core Strategy. Waste water Wymondham has an existing waste water treatment works (WwTW) situated to the north-west of the Town. Stage 2b of the Greater Norwich Development Partnership’s Water Cycle Study concluded “Modelling has shown that Wymondham WwTW has sufficient capacity to accept growth from both Wymondham and Hingham without requiring an increase in consented flow conditions. Therefore, no changes to the quality consent are required and no impact on phasing is anticipated as a result of wastewater treatment….. Sewer connections in the town are good; however it is known that there are sewer flooding issues within Wymondham. For this reason, new strategic mains are likely to be required to service the significant level of growth.” However discussion of capacity within waste water treatment works also needs to be considered in light of the recent guidance note issued by the Environment Agency (August 2010). This document deals with all of the WwTW in the Greater Norwich area, and assesses how much growth can be accommodated without impacting water quality.
20
Flood Risk Areas of Flood Zones 3 and 2 following the River Tiffey transect the Town from west to east and south to central. Sustainable Urban Drainage (SUDS) SUDS are now a legal requirement under the Flood and Water Management Act 2010, the Wymondham area has generally poor SuDS suitability and is therefore unlikely to be suitable for infiltration SuDS (the preferred SuDS option in the hierarchy); hence greenfield attenuation requirements will largely have to be met through surface water attenuation features such as detention or balancing ponds. Some development to the central and central east areas could be feasible for infiltration SuDs (Swales and Soakaways). Developers should undertake site specific infiltration tests to determine whether infiltration is possible and therefore whether infiltration drainage techniques or surface water storage SUDS are more appropriate. Decisions on SUDS will need to be made on a site by site basis based upon feasibility and environmental issues. SUDS should be used in all cases unless proven unsuitable. Furthermore, depending upon the location, pollution control measures may be required and it should be ensured that groundwater quality is protected in line with the Environment Agency’s Groundwater Protection Policy. Society and Housing The tables below give details of the broad housing types and indications of the percentages of certain households in the Wymondham area from the 2001 census. Wymondham has a higher proportion of couples and house/bungalows and a lower percentage of lone parents than the county and the national averages. Wymondham Norfolk England All households 5479 N/A N/A % one person households 29.12 29.21 30.07 % pensioner only households 25.93 28.77 23.71 % with dependant children 27.62 25.96 29.45 % couple households 60.97 58.69 53.77 % lone parent households 6.59 7.36 9.46 % with persons with long term limiting illness
30.18 34.66 33.55
Source: Norfolk Insight – 2001 Census Wymondham Norfolk England All Household spaces 5652 N/A N/A % of which are houses or bungalows
91.68 88.02 79.92
% of which are flats or apartments
8.19 11.33 19.66
% temporary structures 0.05 0.65 0.42 Source: Norfolk Insight – 2001 Census Other issues surrounding housing provision has been examined in the Housing Market Assessment ‘A Study of Housing Need and Stock Condition’ and update carried out to inform the Greater Norwich Development Partnership’s Joint Core Strategy (available to download from http://www.gndp.org.uk/resources/document-finder/?downloadIndex=H)
Education Wymondham has existing pre-school, primary and secondary educational provision. The Greater Norwich Infrastructure Needs and Funding Study (EDAW 2009) anticipates the following increase in child numbers as a result of the growth planned in the Joint Core Strategy Pre-School
Source: Greater Norwich Infrastructure Needs and Funding Study (EDAW 2009) Economy Wymondham and the A11 corridor are recognised as important to the future of employment growth (particularly for high-tech development) for the Norwich sub-region. Major employers in the town include the headquarters of Norfolk Constabulary and Group Lotus at nearby Hethel. The importance of further diversifying and strengthening the economy of market towns such as Wymondham is set out in the Joint Core Strategy (JCS) and the Greater Norwich Economic Strategy. The JCS identifies the need for expanded employment opportunities (new allocations of around 20 hectares) and enhanced links with the employment centre at Hethel. Wymondham Norfolk England All people aged 16-74 9004 N/A N/A % in employment 66.71 60.55 60.93 % unemployed 2.03 2.97 3.35 % economically inactive 29.54 34.39 33.14 Source: Norfolk Insight – 2001 Census The attractiveness and success of Wymondham as an employment location and as a centre for job growth is demonstrated by the strong uptake of employment land. The South Norfolk Local Plan (2003) allocated 25.4 hectares of employment land in Wymondham. The 2008/9 Annual Monitoring Report identifies that of those 25.4 hectares only 1.39 remained ‘available’ at the end of 2009. Transport and Access Wymondham is situated 9 miles south west of Norwich on the A11 trunk road. As such it enjoys a good location within the strategic highway network with good access to Norwich, the A47 and Cambridge. Public transport to the city is good and there are a number of park and ride sites situated around the Norwich fringe. Wymondham has an award winning rail station that has regular services to Norwich and Cambridge. Modes of Travel to Work (%) Wymondham Norfolk England % who travel by rail 0.91 0.85 7.39 % who travel by bus 5.25 4.78 7.51 % who travel by motorcycle /scooter 1.49 1.32 1.11 % who travel by car/van/taxi 70.79 66.00 61.54 % who travel by bicycle or other means 12.57 16.65 13.28 % without car or van 15.61 20.61 30.62 Source: Norfolk Insight – 2001 Census
22
Long Stratton Area Action Plan Demography As the data from the 2001 census illustrates; when compared to the Norfolk average Long Stratton has a relatively young populace. Population Long Stratton Norfolk England Population 2001 Census 3535 N/A N/A Households 2001 Census 1510 N/A N/A % aged 0 - 15 19.68 18.13 20.15 % aged 16 - 44 40.54 35.71 40.21 % aged 45 - 64 23.66 26.12 23.75 % aged 65+ 16.12 20.03 15.89 Source: Norfolk Insight – 2001 Census Environment Long Stratton has developed from its linear origins as a street village located on the Norwich to Ipswich Road (which is based upon an earlier Roman Road that linked Scole to Long Stratton and Caistor St. Edmund), to become a larger settlement with good road links with Norwich. Its historic core has a Conservation Area (for which the Council will produce a Conservation Area Appraisal) that extends along The Street to reflect the quality of the built environment of this part of the village. It will be important to understand the nature and significance of the heritage assets as part of any informed assessment on the impacts of growth. Long Stratton to Norwich is identified as a priority green infrastructure corridor (Long Stratton to Norwich) in the Greater Norwich Development Partnership’s Green Infrastructure Delivery Plan prepared in support of the Joint Core Strategy. Landscape Long Stratton is located within the Tas Tributary Farmland, bordering Great Moulton landscape character area. The area is typified by Open, gently undulating to flat and sloping landscape incised by shallow tributary valleys, large open arable fields, framed open views and small blocks of deciduous woodland. The land to the east of Long Stratton retains a high number of features of typical ‘Ancient’ countryside, with a significant number of surviving greens, cohesive settlements of timber-framed buildings grouped around them, church/hall complexes and an extensive network of ancient track ways linking them together. In addition, the land to the east contains a rare grid system of lanes which dates from at least the medieval period, and may well be much earlier. Water Resources Water supply There is a single strategic water main servicing Long Stratton (from the west) that should be sufficient to supply enough water to accommodate the intended level of growth. Wastewater The existing wastewater treatment works is located to the northwest of Long Stratton. However, using the existing WwTW will require an increase in the volume of discharge to be consented, but it is considered that transferring flows a long distance to the next nearest WwTW is not feasible.
23
The GNDP Water Cycle Stage 2b notes “Modelling has shown that it will not be possible to accommodate all of the growth and still meet the requirements of the WFD and HD downstream within the limits of BATNEEC. If all new wastewater flow was treated at the WwTW, the downstream quality of the Hempnall Beck would fail on Ammonia and P WFD targets and fail on HD targets for P. Up to 1400 dwellings could be accommodated within the existing flow consent, hence this number of dwellings could go forward; however the remaining 527 would require an innovative wastewater solution such as reedbed wetlands, discharge to ground or a high specification package treatment plant. These options would need to be investigated on a site specific basis if the residual 527 dwelling target is to be met.” However, discussion of capacity within waste water treatment should also be considered in light of the recent guidance note issued by the Environment Agency (August 2010). This document deals with all of the WwTW in the Greater Norwich area, and assesses how much growth can be accommodated without impacting water quality. Flood risk There are no Flood Zones likely to impact upon development around Long Stratton although clearly surface water considerations remain. Sustainable Urban Drainage (SUDS) Whilst SUDS are now a legal requirement under the Flood and Water Management Act 2010 the Long Stratton has a generally poor SuDS suitability and is therefore unlikely to be suitable for infiltration SuDS (the preferred SuDS option in the hierarchy); hence greenfield attenuation requirements will largely have to be met through surface water attenuation features such as detention or balancing ponds. Decisions on SUDS will need to be made on a site by site basis based upon feasibility and environmental issues. SUDS should be used in all cases unless proven unsuitable. Furthermore, depending upon the location, pollution control measures may be required and it should be ensured that groundwater quality is protected in line with the Environment Agency’s Groundwater Protection Policy. Society and Housing The tables below give details of the broad housing types and indications of the percentages of certain households in the Long Stratton area from the 2001 census. Long Stratton has a higher proportion of couples and house/bungalows and a lower percentage of lone parents than the county and the national averages. Long Stratton Norfolk England % one person households 25.82 29.21 30.07 % pensioner only households 22.82 28.77 23.71 % with dependant children 29.57 25.96 29.45 % couple households 64.92 58.69 53.77 % lone parent households 6.17 7.36 9.46 % with persons with long term limiting illness
30.16 34.66 33.55
Source: Norfolk Insight – 2001 Census Long Stratton Norfolk England All Household spaces 1510 N/A N/A % of which are houses or bungalows 97.58 88.02 79.92 % of which are flats or apartments 2.07 11.33 19.66 % temporary structures 0.26 0.65 0.42 Source: Norfolk Insight – 2001 Census
24
Other issues surrounding housing provision has been examined in the Housing Market Assessment ‘A Study of Housing Need and Stock Condition’ and update carried out to inform the Greater Norwich Development Partnership’s Joint Core Strategy (available to download from http://www.gndp.org.uk/resources/document-finder/?downloadIndex=H) Education Long Stratton has existing pre-school, primary and secondary educational provision. The Greater Norwich Infrastructure Needs and Funding Study (EDAW 2009) anticipates the following increase in child numbers as a result of the growth planned in the Joint Core Strategy Pre-School
(Ages 3-4) Primary (Ages 5-11)
Secondary (Ages 12-16)
Post 16 (Ages 17-18)
Total
Long Stratton 125 378 208 42 752 Additional facilities required
2 x 60 facility
2021-26
420 place facility 2026
County Council suggest expand
existing
Source: Greater Norwich Infrastructure Needs and Funding Study (EDAW 2009) The study also suggests two 60 place pre-school facilities are required between 2021-26, Economy The submitted Joint Core Strategy describes Long Stratton as having “by far the best range of local shops, services and employment opportunities of the area’s Key Service Centres. Long Stratton hosts the offices of South Norfolk Council, Saffron Housing Trust and a virtually fully occupied local industrial estate. Whilst the existing employment sites are essential full there has been no activity on the additional employment land allocated in the South Norfolk Local Plan. Long Stratton Norfolk England All people aged 16-74 2533 N/A N/A % in employment 69.52 60.55 60.93 % unemployed 2.03 2.97 3.35 % economically inactive 26.70 34.39 33.14 Source: Norfolk Insight – 2001 Census Transport and Access Long Stratton is located on the A140, a major north south arterial route in South Norfolk. The A140 currently passes through the centre of the village creating problems with peak hour congestion, volume of traffic and air quality. As part of the proposals for significant development in Long Stratton, the Joint Core Strategy envisages a growth-funded bypass for the village. There are reasonable bus services to Norwich that are earmarked for enhancement (journey times and reliability) in response to the levels of growth proposed in the Joint Core Strategy. Modes of Travel to Work (%) Long Stratton Norfolk England % who travel by rail 0.60 0.85 7.39 % who travel by bus 6.38 4.78 7.51 % who travel by motorcycle /scooter 1.21 1.32 1.11 % who travel by car/van/taxi 71.94 66.00 61.54 % who travel by bicycle or other means 11.01 16.65 13.28 % without car or van 12.25 20.61 30.62 Source: Norfolk Insight – 2001 Census
Norwich Research Park Area Action Plan The Norwich Research Park (NRP) is a powerful co-operative of world class research facilities covering the University of East Anglia, the Norfolk and Norwich University Hospital and three independent research centres: the John Innes Centre, the Institute of Food Research and the Sainsbury Laboratory. With a total of over 9,000 staff across these institutions and 1,000 postgraduate research science students, the Norwich Research Park has one of the largest single-site concentrations of research in health, food and environmental sciences, computer and information systems and chemistry in Europe. Located just 5 kilometres from Norwich City centre the NRP is at the heart of Norwich’s future development and economic growth, the importance of which is recognised in the Joint Core Strategy and Economic Strategies. Demography Colney consists of two very distinct elements, those that comprise the Norwich Research Park and the significantly smaller permanent residents. In terms of residents Colney can be considered a hamlet; this is in marked contrast to the number of workers (at the various Institutions), visitors and traffic movements that the parish experiences on a daily basis. Population Colney Norfolk England Population 2001 Census 149 N/A N/A Households 2001 Census 61 N/A N/A % aged 0 - 15 19.99 18.13 20.15 % aged 16 - 44 30.05 35.71 40.21 % aged 45 - 64 30.18 26.12 23.75 % aged 65+ 19.78 20.03 15.89 Source: Norfolk Insight – 2001 Census Environment Much of the existing NRP area is in agricultural use. However there are a number of significant areas of archaeological interest, tree preservation orders, county wildlife sites and excellent opportunities for green infrastructure enhancement present. Particular attention should be given to impact upon the river and the possibility of extending the access opportunities and biodiversity of the river Yare and developing green infrastructure links from the urban area. Landscape The NRP falls within two landscape character areas.
• The ‘Yare Valley Urban Fringe’ that accounts for the north-eastern part of the NRP. The area is significant in that it provides an open and distinctive boundary with the City. Particular characteristics include its valley form, which is relatively unusual for South Norfolk, and its woodlands and waterways. The river valley is particularly important for its landscape and biodiversity value.
• ‘Yare Tributary Farmland with Parkland’ this area is characterised by arable landscapes, intermittent long views to the city of Norwich and a gently undulating topography.
The river valley and the wooded slopes that can be found in the area are considered to be significant elements in what is termed the ‘historic setting of the City of Norwich’. The land around Colney Hall is also important in landscape terms as it contains significant elements of the historic parkland associated with the Hall.
26
Water Resources Water supply Water is supplied via a strategic main from Heigham water treatment work. However all areas within the NRP have Groundwater Source Protection Zone II status and drainage proposals should include suitable facilities to prevent groundwater pollution. Drainage systems should be designed to accommodate high-risk storm events and should anticipate more violent rainfall events predicted through climate change. Wastewater Wastewater from development at the NRP is treated at Whitlingham sewage treatment works. The Greater Norwich Development Partnership Water Cycle Study identifies the need for a new strategic interceptor sewer to accommodate the additional flow arising from the growth envisaged in the SW sector. However, discussion of capacity within waste water treatment works should also be considered in light of the recent guidance note issued by the Environment Agency (August 2010). This document deals with all of the WwTW in the Greater Norwich area, and assesses how much growth can be accommodated without impacting water quality. Flood risk There are areas of flood zones two and three that could impact upon future development at the NRP. These are associated with the River Yare. Sustainable Urban Drainage (SUDS) SuDS are now a legal requirement under the Flood and Water Management Act 2010. The Colney area has a varied geology and therefore varied suitability for SuDS. The NRP development framework (Supplementary Planning Document) identifies that ‘Sustainable drainage system (SuDS) principles should be adopted throughout the NRP.’ SuDS techniques need to be informed by a detailed site assessment regarded the most appropriate mechanism but could include ditches, attenuation ponds and possible reed beds for grey water treatment.Decisions on SUDS will need to be made on a site by site basis based upon feasibility and environmental issues. SUDS should be used in all cases unless proven unsuitable. Furthermore, depending upon the location, pollution control measures may be required and it should be ensured that groundwater quality is protected in line with the Environment Agency’s Groundwater Protection Policy. Society and Housing The tables below give details of the broad housing types and indications of the percentages of certain households in Colney parish from the 2001 census. Colney has a higher proportion of couples and a lower percentage of lone parents than the county and the national averages. Colney Norfolk England All households 61 N/A N/A % one person households 19.86 29.21 30.07 % pensioner only households 27.29 28.77 23.71 % with dependant children 29.81 25.96 29.45 % couple households 72.37 58.69 53.77 % lone parent households 5.18 7.36 9.46 % with persons with long term limiting illness
28.42 34.66 33.55
Source: Norfolk Insight – 2001 Census
27
Colney Norfolk England All Household spaces 61 N/A N/A % of which are houses or bungalows 97.33 88.02 79.92 % of which are flats or apartments 1.83 11.33 19.66 % temporary structures 0.50 0.65 0.42 Source: Norfolk Insight – 2001 Census Other issues surrounding housing provision has been examined in the Housing Market Assessment ‘A Study of Housing Need and Stock Condition’ and update carried out to inform the Greater Norwich Development Partnership’s Joint Core Strategy (available to download from http://www.gndp.org.uk/resources/document-finder/?downloadIndex=H) Education The Norwich Research Park has a wealth of higher and further educational opportunities available from numerous institutions. These range from the spectrum of courses offered by the University to the more specific vocational opportunities at the School of Nursing and Midwifery and the specialist post-graduate plant science studies at the Sainsbury and Cambridge Laboratories and John Innes Institute. A full range of childrens schools is easily accessible and available in Norwich although there are no education facilities for children in the parish itself. Economy Employment in health and life sciences is higher than average in South Norfolk because of Norwich Research Park. The Norwich Research Park (NRP) includes: the University of East Anglia, one of the UK’s leading universities, the John Innes Institute, the Institute of Food Research Institute, the Sainsbury Laboratory and the Norfolk and Norwich University Hospital and boasts world leading research expertise in climate change environmental and life science. The importance of Colney/Cringleford (expansion of the Research Park reserved for research and development, higher education and hospital/health related uses) and the A11 corridor to the future of employment growth (particularly for high-tech development) for the Norwich sub-region is recognised in the Joint Core Strategy and various Economic strategies. The need to support and promote plant biotechnology is also recognised. Employer / Institution Number of staff / students Institute of Food Research 290 staff Norfolk and Norwich University Hospital 5500 staff, treating more than 600,000
people a year University of East Anglia 2,500 staff and over 13,000 students with
over 300 courses of study on offer Norwich Bio-Incubator 20,000 feet of bioscience laboratory for
development of new/innovative ideas John Innes Centre 600 staff (including 300 scientists and
100 post graduate students) Sainsbury Laboratory 60 staff Source: www.nrp.org.uk
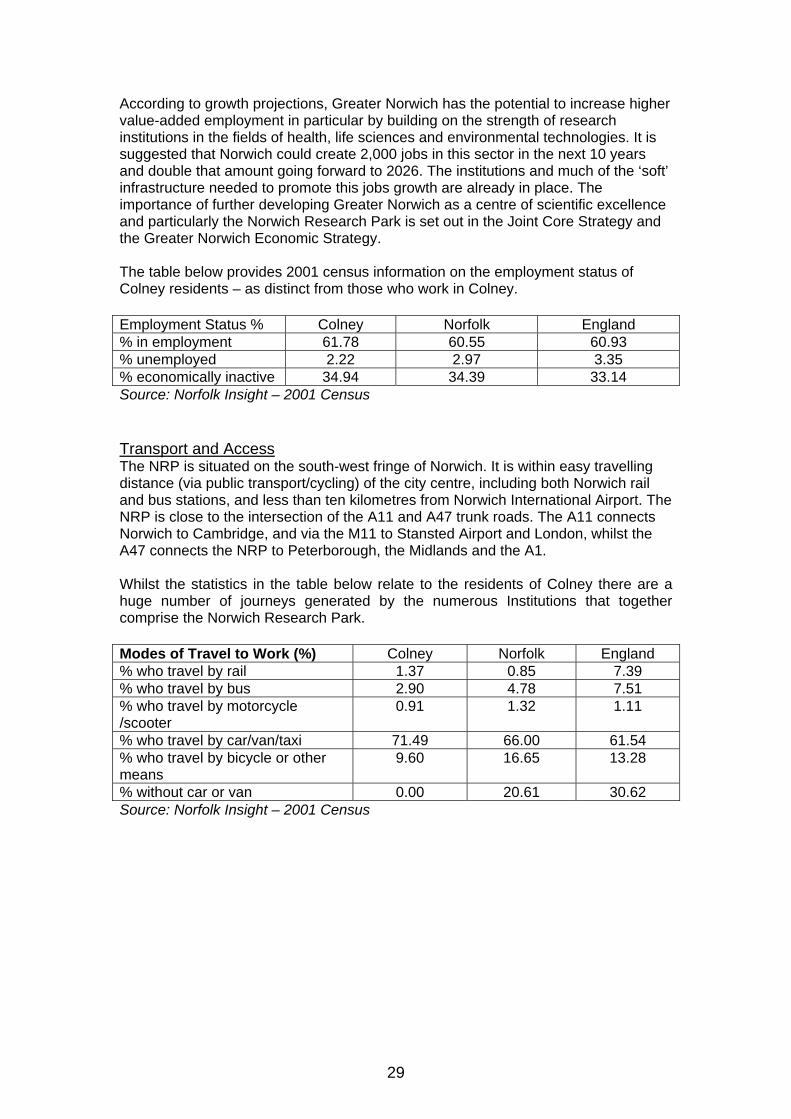
According to growth projections, Greater Norwich has the potential to increase higher value-added employment in particular by building on the strength of research institutions in the fields of health, life sciences and environmental technologies. It is suggested that Norwich could create 2,000 jobs in this sector in the next 10 years and double that amount going forward to 2026. The institutions and much of the ‘soft’ infrastructure needed to promote this jobs growth are already in place. The importance of further developing Greater Norwich as a centre of scientific excellence and particularly the Norwich Research Park is set out in the Joint Core Strategy and the Greater Norwich Economic Strategy. The table below provides 2001 census information on the employment status of Colney residents – as distinct from those who work in Colney. Employment Status % Colney Norfolk England % in employment 61.78 60.55 60.93 % unemployed 2.22 2.97 3.35 % economically inactive 34.94 34.39 33.14 Source: Norfolk Insight – 2001 Census Transport and Access The NRP is situated on the south-west fringe of Norwich. It is within easy travelling distance (via public transport/cycling) of the city centre, including both Norwich rail and bus stations, and less than ten kilometres from Norwich International Airport. The NRP is close to the intersection of the A11 and A47 trunk roads. The A11 connects Norwich to Cambridge, and via the M11 to Stansted Airport and London, whilst the A47 connects the NRP to Peterborough, the Midlands and the A1. Whilst the statistics in the table below relate to the residents of Colney there are a huge number of journeys generated by the numerous Institutions that together comprise the Norwich Research Park. Modes of Travel to Work (%) Colney Norfolk England % who travel by rail 1.37 0.85 7.39 % who travel by bus 2.90 4.78 7.51 % who travel by motorcycle /scooter
0.91 1.32 1.11
% who travel by car/van/taxi 71.49 66.00 61.54 % who travel by bicycle or other means
9.60 16.65 13.28
% without car or van 0.00 20.61 30.62 Source: Norfolk Insight – 2001 Census
29
Park Road, Diss Area Action Plan Demography As the data from the 2001 census illustrates; when compared to the Norfolk average Diss has a high proportion of elderly residents. Responding to the challenges posed by changing population structures is on of the issues the Local Development Framework will need to respond to. Population Diss Norfolk England Population 2001 Census 6733 N/A N/A Households 2001 Census 3344 N/A N/A % aged 0 - 15 16.08 18.13 20.15 % aged 16 - 44 34.74 35.71 40.21 % aged 45 - 64 24.06 26.12 23.75 % aged 65+ 25.12 20.03 15.89 Source: Norfolk Insight – 2001 Census Environment The town is situated on the A1066 and A143 on the northern slopes of the Waveney Valley and located around ‘The Mere’, a lake of over two hectares set into the valley side. The Mere forms a large attractive central feature that has partly constrained the development of the town centre to around the northern and eastern sides of the lake. The major attraction of Diss arises from the rich heritage of historic buildings which have survived in and near the town centre, complemented by the natural setting of The Mere and the historic nature of the area’s streets, yards and open spaces. This has been recognised by the Council’s designation of a large part of the central, northern and south western parts of Diss as a Conservation Area (for which the Council intends to produce Conservation Area Appraisals), characterised by a large number of attractive views and a number of historic residential streets. It will be important to understand the nature and significance of the heritage assets as part of any informed assessment on the impacts of growth. Landscape Overall the town is surrounded by generally open countryside comprising the Waveney Rural River Valley landscape character area to the south, the River Frenze to the east and north, and a small strip of open fields separating the town from the village of Roydon to the west. The valleys provide attractive landscape features of great amenity and ecological value and the open areas of farmland provide distant views while maintaining the separation of the town from the nearby settlements. Each of these elements enhances the rural setting of the town. Water Resources Water supply There are several water mains servicing Diss (from the north and northeast). These mains should supply sufficient water to accommodate the intended growth. Waste water Diss Waste Water Treatment Works are located to the south of the Town and has sufficient capacity to accept the level of growth envisaged in the Joint Core Strategy without requiring an increase in consented flow conditions. However, any discussion of capacity within waste water treatment works should also be considered in light of the recent guidance note issued by the Environment Agency (August 2010). This document deals with all of the major growth locations and
30
WwTWs in the Joint Core Strategy area, and assesses how much growth can be accommodated without impacting water quality. Flood risk There are areas of Flood Zone 2 and 3 associated with the River Waveney to the south of the Town. Sustainable Urban Drainage SuDS are now a legal requirement under the Flood and Water Management Act 2010. Much of the town is covered by a Source Protection Zone (SPZ), including a zone of SPZ 1 to the northwest of the town centre associated with a groundwater abstraction point. SPZ 2 and ‘total catchment’ areas are therefore located across most of the central, northern and western areas of the town and areas to the north and west of the main town itself. These SPZ designations would restrict development types here and will require some form of water quality control such as oil interceptors if infiltration of runoff (other than clean roof runoff) is proposed. Delivery of SuDS could therefore be problematic given space constraints within the town itself and careful designing and planning (including policy) will be required to ensure no increase in flood risk as a result of development) in the centre, north and west of the town. Restrictions to the far east of the main town are unlikely to be onerous if suitable for infiltration; however, pollution control measures may also be required outside of SPZs, depending upon the nature of development proposed and the risk posed by the runoff type. The absence of a SPZ does not necessary indicate that there will be no restrictions and no pollution control measures will be required. Decisions on SUDS will need to be made on a site by site basis based upon feasibility and environmental issues. SUDS should be used in all cases unless proven unsuitable. Furthermore, depending upon the location, pollution control measures may be required and it should be ensured that groundwater quality is protected in line with the Environment Agency’s Groundwater Protection Policy. Society and Housing The tables below give details of the broad housing types and indications of the percentages of certain households in the Diss area from the 2001 census. Diss has a higher proportion of pensioner households and a lower percentage of couple households than the county and the national averages. Diss Norfolk England All households 3344 N/A N/A % one person households 36.58 29.21 30.07 % pensioner only households 35.68 28.77 23.71 % with dependant children 21.30 25.96 29.45 % couple households 51.58 58.69 53.77 % lone parent households 7.52 7.36 9.46 % with persons with long term limiting illness 32.99 34.66 33.55 Source: Norfolk Insight – 2001 Census Diss Norfolk England All Household spaces 3344 N/A N/A % of which are houses or bungalows 84.24 88.02 79.92 % of which are flats or apartments 14.50 11.33 19.66
Other issues surrounding housing provision has been examined in the Housing Market Assessment ‘A Study of Housing Need and Stock Condition’ and update carried out to inform the Greater Norwich Development Partnership’s Joint Core Strategy (available to download from http://www.gndp.org.uk/resources/document-finder/?downloadIndex=H) Education Diss enjoys a full range of education institutions up to and including High School level. Places are popular and levels of attainment are good. The High School has an excellent record of both academic and sporting achievement with examination results that are consistently above the county and national average. Since September 2005, the school has been designated a Specialist Humanities College with English as the lead subject, and Citizenship and Classics in support. Diss Church of England Junior School is a Voluntary Controlled Junior School located close to centre of the town. Younger children attend Diss Infant and Nursery School. Economy Diss is described in the Joint Core Strategy as “an attractive market town with the largest number of shops and services outside Norwich. It serves a large rural catchment covering parts of South Norfolk and northern Suffolk and has the development potential for significant new shopping floor space which will be located on the existing retail allocation adjacent to the town centre…. The town centre will be enhanced by the implementation of an Area Action Plan to encourage the mixed use redevelopment of brownfield land along Park Road, while the town’s general quality of life will be enhanced by the encouragement of community measures to further its Cittaslow status. Job growth will be encouraged to serve the needs of this growth and the town’s catchment. Employment allocations will be made to provide a total of around 15ha of available land”. Diss Norfolk England % in employment 62.11 60.55 60.93 % unemployed 2.71 2.97 3.35 % economically inactive 33.25 34.39 33.14 Source: Norfolk Insight – 2001 Census Three sites were allocated in the town through the South Norfolk Local Plan. The Sandy lane/Sawmills Road employment allocation and the mixed use Mission Road allocations have been granted permission and development is largely complete. The allocation South of Park Road has seen some development (an extension to the adjacent Supermarket) and been the subject of a public consultation on suggested masterplan for the area but otherwise remains undeveloped. The prominent location of the site makes it vital to deliver high quality development that meets the needs of the Town. The AAP will seek to reconcile the conflicting objectives of the different landowners, residents etc. with the needs of the Town in order to establish consensus on the appropriate scale, mix and quality of development for this key area of opportunity. The AAP will also seek to address long-standing traffic circulation and congestion issues in the area, improve linkages to and from the town for pedestrians and cyclists. It will have regard to the need to conserve and enhance the adjacent Conservation Area, the historic character of Diss and reflecting the towns Cittaslow status. The Park Road area has many sensitive and complex issues associated with it. The Council believes that as a key site within the historic market town of Diss it offers a number of opportunities but the complexity of issues and difficulties in bringing the site forward necessitate the preparation of an Area Action Plan.
Transport and Access Diss is located on the Norfolk/Suffolk border on the A1066 within easy access of the A140 and the A143. The A1066 is the main route through Diss and has been the source of complaints from the Town Council regarding levels of congestion at peak times. The town is situated on the Norwich – London rail line and the station is popular with travellers in both directions. As a rural market town Diss acts as a hub to quite an extensive hinterland, public transport availability is reasonably good and the levels of cycling in the town are above the County and national average. Modes of Travel to Work (%) Diss Norfolk England % who travel by rail 1.79 0.85 7.39 % who travel by bus 1.49 4.78 7.51 % who travel by motorcycle /scooter
0.50 1.32 1.11
% who travel by car/van/taxi 59.61 66.00 61.54 % who travel by bicycle or other means
28.00 16.65 13.28
% without car or van 8.87 20.61 30.62 Source: Norfolk Insight – 2001 Census
33
Task A3 – Sustainability Issues Identifying Sustainability Issues After conducting a review of the relevant literature, plans, programmes and policies (Task A1) and taking into consideration the social, environmental and economic baseline information collected for South Norfolk (Task A2) the next task (A3) was to identify a number of “sustainability issues” for South Norfolk. Table 3 sets out the identified sustainability issues grouped into environmental, social and economic categories. As issues emerge they help to identify Sustainability Appraisal Objectives. These objectives form the basis of the appraisal framework (Task A4), and will help to assess how sustainable the policies, approaches and proposals are for each of the DPDs as they are developed. Links between the issues and the objectives are shown to highlight how the framework will ensure the issues are considered throughout the appraisal process. The Sustainability Issues also fall under the remit of certain topics identified by the SEA Directive that need to be covered within development strategies. These are also identified within Table 3. In addition, the issues and the objectives “Sustainable Futures: Integrated Sustainability Framework for the East of England” has also informed the process. The relationship between issues in South Norfolk and their links to both the SEA topics and the objectives of the integrated regional framework are also identified within the Table. The issues identified in Task A3 are those faced across South Norfolk, which need to be tackled by the Site Specific Policies and Allocations DPD and the four Area Action Plans. They reflect the issues and implications for managing and delivering growth throughout the district. Although certain aspects will, necessarily be spatially specific, there is also a need to reflect important differences faced across the area. A very brief overview of the main issues reveals that:
• As the population grows and ages, the need to supply facilities and services, and in particular the access to them, especially in the rural area, will become increasingly pressing;
• The retention and attraction of young people through jobs provision and
access to the housing market will be a key priority;
• The character/quality of natural and built environments must be preserved and enhanced whilst being faced by widespread development pressure;
• South Norfolk acts as a gateway to The Norfolk and Suffolk Broads and has a
critical role in promoting tourism, preserving character and protecting the environment through its spatial policies.
• Reducing contributions to, and mitigating against the impacts of, climate
change will be crucial to the long-term viability of South Norfolk as a place to live and work, to visit and to invest in.
• Reliance on the car should be reduced through improved access to public
transport and improved cycling and walking links to local facilities / services.
34
• Creating balanced and integrated communities will be an essential aspect of providing new development, through design benefits, for example.
• Promoting healthy lifestyles will be important throughout policy.
• Lifelong learning opportunities should be increased for all members of
society, particularly in providing vocational training for school leavers.
• Difficulties in accessing the housing market must be minimised;
• Housing of all types and tenures is essential for mixed communities;
• Employment businesses, particularly in rural areas, need support to diversify. This will be particularly important to strengthening the tourism industry, although promoting the tourism product of the area will need to be done in a sustainable way.
35
36
Table 3: Key Sustainability Issues Identified for the Site Specific Policies and Allocations DPD and the Wymondham, Long Stratton, Diss (Park Road) and Norwich Research Park Area Action Plans SEA Directive Topic
Key Sustainability Issues for South Norfolk DPDs Sustainability Appraisal Objectives
ENVIRONMENT Biodiversity, Fauna and Flora Water and Soil / Land Cultural Heritage and Landscape
Natural environment: • There is a wealth of natural assets and ecology (including high levels of water quality), that needs
protecting, maintaining and enhancing, and re-creating where possible. • There is a wealth of high quality agricultural land, which makes South Norfolk an important agricultural
producer. This resource needs protecting, as its loss would be irreversible. • Improving sustainable access to the countryside. • Making the Market Towns and villages greener and with increased links to & from the urban fringe
around Norwich. This may require some retrofitting of existing areas if genuinely sustainable and accessible settlements are to be achieved.
• Green spaces and green corridors will need to be integrated into development, and include the use of
walking and cycling networks. • There is a generally poor status of SSSIs, particularly water based ones. Overall, the quality of
habitats needs to be improved and extended. • Pressures from new development and the relative lack of brownfield land in the district means that a
significant area of greenfield land will be needed. • Landscape character & heritage should be retained, reflected & enhanced in development designs.
• Cross-boundary effects are also an important consideration. Activity promoted through the SS or the AAPs could impact on areas outside of South Norfolk e.g. the Broads & Norwich City.
• Water quality & biodiversity (particularly R. Wensum & downstream in The Broads) will be particularly vulnerable to changes from new development. Water quality will need to be preserved and enhanced through land use practices, use of SuDS and improvements to treatment works. Issues of water supply, quality and impact on protected sites are high priority and are considered critical elements to the delivery of sustainable growth.
ENV 1 ENV 6 ENV 7 ENV 8 SOC 8 EC 4
37
SEA Directive Topic
Key Sustainability Issues for South Norfolk DPDs Sustainability Appraisal Objectives
Cultural Heritage and Landscape The Urban Environment
Built environment: • South Norfolk has a wealth of Scheduled Ancient Monuments, Listed Buildings and other
architecturally distinctive structures and cultural heritage assets all of which need protection. • The special historic character of South Norfolk, its Market Towns and hinterland should be preserved
and enhanced; the high number of medieval churches, listed buildings and conservation areas are all significant contributors to the unique character and heritage of the area.
• Preserve the distinctive character of the historic built environment (e.g. Venta Icenorum) and
landscape, protecting and enhancing these and using them to promote the South Norfolk area. • New developments will need to be integrated into the existing form and character of local areas in
order to minimise the negative impacts that could be brought to the heritage of the area. Historic Landscape Characterisations can provide valuable assistance for integrating landscape distinctiveness into new developments.
• Brownfield land is in increasingly short supply, particularly in rural areas, so there is pressure to make
best use of sites that do exist. • New construction can have negative impacts on existing development and townscape from noise, air
quality and dust. • Indirect impacts on the built environment could arise from the additional pressures of development and
climate change. • Measures should be taken to enhance the historic core of Market Towns, villages and other distinctive
heritage features, by either avoiding or making them able to withstand development pressures arising in the immediate future, such as traffic growth.
ENV 6 ENV 7 SOC 8 EC 4
38
SEA Directive Topic
Key Sustainability Issues for South Norfolk DPDs Sustainability Appraisal Objectives
Biodiversity, Fauna and Flora Water and Soil / Land Natural Resources and Climate The Global Environment and Local Resources The Urban Environment
Climate change: • Climate change threatens the long-term future of some habitats and species; their capacity to
withstand these changes must be improved. • Many areas at risk of flooding, that will increase with climate change. • Flood risk in areas like the Broads can be exacerbated by developments upstream causing a change
to natural watercourses & the water cycle. There is also a threat of saline incursion as a result of climate change. Retrofitting could also include water infrastructure
• There is a need to reduce greenhouse gas emissions and ensure that contributions to climate change
are reduced throughout, particularly as the rural areas of South Norfolk are so much more reliant on private car use.
• All new, and some existing, developments will need to adapt to the likely consequences of climate
change through their design and locations. • Norfolk is one of the driest parts of the country so adapting to the effects of climate change, including
the ability to design developments that are water efficient and recycle water resources is important. • Retrofitting existing development, such as improving energy efficiency in private sector housing,
tackling traffic congestion and promoting reduction, reuse and recycling of waste as help reduce emissions. Retrofitting of water efficiency measures/devices may also be undertaken.
• Some aspects of change could bring benefits. • Renewable energy solutions for the area will be essential and should be sought for energy generation.
This would also have the benefit of opening a number of new opportunities for economic development. • Norfolk’s carbon footprint is currently unsustainable, and promoting adaptive lifestyles will be
necessary to reduce them. • New developments in all sectors, land uses and activities will need to minimise their carbon emissions. • Reduction of waste.
ENV 1 ENV 2 ENV 5 SOC 8 EC 4
39
SEA Directive Topic
Key Sustainability Issues for South Norfolk DPDs Sustainability Appraisal Objectives
Natural Resources and Climate Water and Soil / Land Air The Global Environment and Local Resources
Natural resources • There is increasing pressure on the natural resources needed to facilitate new development, which will
impact on water quality and supply, air quality, energy and minerals use. • Water quality must be enhanced given the rise in phosphate levels that are occurring in water courses
(in order to comply with WFD standards). • The irrevocable loss of quality soil resources should be minimised. • Water supplies must be able to sufficiently service new developments which should be designed to
conserve water as much as possible in order to reduce the water use throughout the area. Potential impact on catchment reserves should also be considered.
• Minerals efficiency will need to be improved to minimise the environmental impact of extraction and processing, including increasing the use of aggregate captured from recycled construction material.
• Ensuring that existing and new development is resource efficient. • There is a need to reduce the amount of waste from South Norfolk sent to landfill sites, and find
alternative methods of disposal. • Waste management will experience increased pressure on services to accommodate growth, supply
new treatment facilities and minimise waste production overall. • Efforts should be made to prioritise, treat and use contaminated land for restoration, provided its use
won’t present a risk to the environment (pollution of controlled waters) or to site works and end users (health risk).
ENV 2 ENV 3 ENV 5 ENV 7 ENV 8 ENV 9 EC 4
Air Natural Resources and Climate Population and Human Health The Urban Environment
Transport • High motor vehicle use, particularly in rural areas, arising from general dependency on private car. • Use of transport, particularly in urban areas & towns, its growth in volume has impacts on human
health through contributing to poorer air quality. • There is an ongoing and urgent need to encourage a modal shift in transport use away from private
cars and into public transport, and to replace CO2 emitting modes with less polluting forms of transport. • General environmental amenity will be put under pressure from new development, particularly due to
noise, air and water pollution. • Transport movements associated with minerals, waste and other service provision will need to be
minimised.
ENV 2 ENV 4 ENV 5 ENV 6 SOC 4 SOC 6 EC 3
40
SEA Directive Topic
Key Sustainability Issues for South Norfolk DPDs Sustainability Appraisal Objectives
SOCIAL Population and Human Health The Global Environment and Local Resources Natural Resources and Climate
Population • Rising population through inward migration will require more homes, services and facilities. • Increased life expectancy, greater proportion of population classified as ‘elderly’, impact upon
services, healthcare & accommodation • Creation of unbalanced communities through:
o Increasingly ageing population in rural areas; o Increasingly younger population in the city; and, o Migration of families from cities towards the suburban & rural areas.
• Household sizes are becoming smaller as more people remain single for longer or become single & thus require more homes to cater for this trend.
• In-migration of populations from other areas in the region, and nationally and internationally, is increasing the demand for housing, community facilities and services.
• The proportion of the population for whom English is their second language is increasing. This is likely to have implications for the future provision of services and facilities such as education and community learning.
• Reducing the environmental impact of individuals will be important in maintaining sustainable communities.
ENV 2 ENV 3 ENV 9 SOC 2 SOC 4 SOC 7 SOC 8 EC 4
Population and Human Health
Deprivation • Deprivation affects certain sectors of the community in many different ways, including distinct
variations between urban and rural areas. • Deprivation is generally heightened in urban areas, but in South Norfolk also affects significant
pockets of rural communities. • Reducing deprivation includes:
o Education and attainment o Income deprivation o Health and environmental quality o Crime o Social exclusion
• Reducing levels of unemployment will help reduce poverty and inequality and improve home affordability.
• If the house price – income ratio continues to widen, home owners will have less disposable income as mortgages/rents increase.
SOC 1 SOC 2 SOC 3 SOC 4 SOC 5 SOC 6 SOC 7 SOC 8
41
SEA Directive Topic
Key Sustainability Issues for South Norfolk DPDs Sustainability Appraisal Objectives
Population and Human Health The Urban Environment
Access to services • Population dispersal has a distinct urban (primarily Norwich), rural and urban-fringe split, which has
implications for accessing facilities, providing services for dispersed communities, and identifying a role for some settlements.
• Pressing need to find the best location for new development to have access to services and facilities. • Services must be provided for an increasingly aging population, and all services must take into
account the rising levels of disability in the population. This includes building homes to lifetime homes standards as well as providing specialised accommodation.
• Access to higher education establishments is problematic for pupils in the more rural areas where
public transport links are poor. Difficulties in accessibility should not be allowed to restrict training opportunities, as this would have economic impacts for the future.
• As the population is rather dispersed, the roles of Market Towns and local settlements will be
important in order to cater for people’s needs. • Need for developer funding for the sustainable provision of facilities and infrastructure at district and
county level
ENV 6 SOC 2 SOC 3 SOC 4 SOC 5 SOC 6 SOC 7
Population and Human Health
Health • The need to promote healthy lifestyles, particularly through the design of, and access to, new
developments. • More health infrastructure, and better access to health facilities for all communities. • Addressing the links between lower levels of health and higher deprivation will help to reduce social
inequalities. • Air Quality Management Areas should be mitigated and the impacts of congestion and localised
emissions concentrations should be reduced through traffic management schemes. • Traffic can have negative health impacts across the area and these should be mitigated against. • Providing permanent sites for Gypsy and traveller groups will lead to better access to health care
facilities and education. • Localised health facilities, such as cottage hospitals, could be more viable and provide an essential
service to new growth, particularly in the rural areas, to relieve pressure on the major hospitals.
ENV 5 ENV 6 SOC 4 SOC 6 SOC 8
42
SEA Directive Topic
Key Sustainability Issues for South Norfolk DPDs Sustainability Appraisal Objectives
Population and Human Health The Urban Environment
Crime • Some higher crime levels exist in the urban area and market towns, particularly in the more deprived
wards. • Improving community identity and welfare will be needed to help to reduce anti-social behaviour and
increase the feel of local ownership of an area. • Reducing anti-social behaviour • Building-up community cohesion will increase the viability of local community-based events and
facilities, and improve local democracy and public participation in local elections and Parish planning.
SOC 2 SOC 7 SOC 8 EC 4
Population and Human Health The Urban Environment
Leisure, culture and recreation • Need to provide access to a good range of cultural and leisure facilities, including improved access to
the countryside, local green spaces and new green spaces. • Facilities for local play and interaction are needed to help build strong communities. • Access to cultural activity is very important for recreation and personal development and community
integration. Adequate cultural provision, such as libraries, will be integral to sustainable communities and need to be planned for from the outset.
• Lifelong learning can also utilise cultural facilities and provision of community centres where community capacity and neighbourhood identity can be promoted.
• An emphasis on good design of new facilities will ensure that communities can benefit from improves standards and it will bring some more ‘identity’ and community involvement in the area.
• Tourism can play an important part in building-up cultural awareness and also for providing jobs and business growth. Support should be given to local tourism-related development linking cultural, social and economic aspects.
• Town and village centres should be retained and encouraged as a focus point or a hub of community activity, particularly in response to local services and facilities being amalgamated or withdrawn from villages into larger settlements, affecting the viability of communities.
• Need for developer funding for the sustainable provision of facilities and infrastructure at district and county level
ENV 6 SOC 4 SOC 6 SOC 7 SOC 8 EC 1 EC 2 EC 4
43
SEA Directive Topic
Key Sustainability Issues for South Norfolk DPDs Sustainability Appraisal Objectives
Population and Human Health The Urban Environment
Education • There are varying levels of attainment across the area; generally lower levels are experienced in the
main urban areas and amongst older people. • Ensuring the viability of educational services in rural areas will be increasingly difficult as populations
in those areas become collectively older. This has implications not only for facilities provision but also for maintaining the existing high standards of educational achievement.
• Opportunities for lifelong skills and training need to be encouraged in order to ‘up-skill’ the overall workforce.
• Links between lower educational attainment, workplace qualifications and deprivation need to be addressed.
• As in-migration rises there may be a need to improve educational opportunities within communities. • Need for developer funding for the sustainable provision of facilities and infrastructure at district and
county level
SOC 2 SOC 3 SOC 4 SOC 5 SOC 7 EC 2 EC 4
Population and Human Health
Housing • There is a variety of housing tenure across the area, with significantly more owner-occupation in South
Norfolk than in Norwich City. • There is a need to provide a sufficient and appropriate mix of housing types and tenures to meet the
needs of all and reduce the number of household in unsuitable accommodation. • The most sustainable locations for a substantial number of new housing developments will need to be
found and planned for in accordance with the East of England Plan and the Joint Core Strategy. • The need to improve the quality of new and existing housing stock. • There is concern about any further increase in the gap between house prices and income levels in
South Norfolk. • The affordability of new housing stock needs to be at a level that will ensure that local communities
and key workers can access their local housing markets. • The potential for providing new affordable homes must be maximised in each development proposal. • Gypsies and Travellers should also benefit from provision of sites in South Norfolk. • More effective use of the exiting housing stock, such as returning vacant homes to beneficial use,
Key Sustainability Issues for South Norfolk DPDs Sustainability Appraisal Objectives
Population and Human Health
Transport and accessibility • Improving access to jobs, services and facilities by public transport and reducing the need to travel by
private car. • Providing appropriate transport infrastructure. • Improving the accessibility to services and facilities for those who wish to walk and cycle. • There is a need to improve the opportunities to walk and cycle and use open space provisions as a
means of recreation and for leading a healthier and more sustainable lifestyle. • Need for developer funding for the sustainable provision of facilities and infrastructure at district and
ECONOMIC Population and Human Health The Global Environment and Local Resources
Growth • There is a generally diverse, successful and growing economy, with strong Research and
Development and specialist engineering industries. • Whilst the main focus of employment provision is within Norwich, South Norfolk has a number of
smaller, but significant, employment growth areas that are expected to expand further. • Currently, across the Joint Core Strategy area, there is an emphasis towards large employers being
located in the City, and small employers in Broadland and South Norfolk. This may suggest a need to improve diversity of employers across the economy.
• Maintain high levels of employment & improve the ability of local populations & those with fewer qualifications to access employment markets.
• Where agricultural viability declines, diversification and indigenous investment needs support in rural economies.
• Locating employment growth and allocations for new jobs, as required under the East of England Plan must be in the most sustainable locations and will be a key factor for a prosperous economy.
• Development of the evening economy can bring increased diversity for business in some areas. • Increasing the provision of jobs in local areas will increase local economic growth and prosperity, so
local jobs provision should be encouraged that can also offer vocational training opportunities. Diversification and extension of the tourism base across the area. Promotion of tourism development whilst protecting the important landscapes, environment and
cultural heritage of South Norfolk.
SOC 2 SOC 3 SOC 4 SOC 5 EC 1 EC 2 EC 3 EC 4 EC 5
45
SEA Directive Topic
Key Sustainability Issues for South Norfolk DPDs Sustainability Appraisal Objectives
Natural Resources and Climate The Global Environment and Local Resources
Resources • Domestic and business waste management, including waste minimisation, increased recycling and
resource efficiency improvements, such as energy generation and recovery. • Maximising opportunities for economic growth and employment through new waste management
facilities. • Promotion of sustainable energy technologies. • Enabling sustainable production and consumption. • Agriculture provides a significant resource for the South Norfolk economy and its ability to compete in
the national and regional sector needs to be supported. • An environmentally sustainable economy can be developed through a general reduction in food and
business mile generation, improved energy savings, development of the renewable energy sector, and through enterprises such as eco-tourism.
Skills • Promoting the knowledge economy will be a key influence in the growth of South Norfolk and will
require support through business infrastructure and training opportunities. • There is an unbalanced workforce, as graduates take up intermediate jobs and so present difficulties
for those with lower qualifications to access jobs. • Improving levels of educational attainment amongst school-leavers will be a vital part of improving the
skills and training of the South Norfolk workforce. • The knowledge economy needs to be able to develop an environmentally friendly sector that helps
provide localised training.
SOC 2 SOC 3 SOC 4 SOC 5 EC 1 EC 2 EC 4
Population and Human Health
Transport Infrastructure • Access to jobs needs to be improved, particularly for those in rural areas where local employment
opportunities may not be so readily available. • Providing job opportunities closer to centres of population, particularly in the rural areas, will be
important in reducing the dependency on the private car, reducing the need to travel, and building community cohesion.
• Links to regional, national and international transport networks should be maximised for their ability to bring growth and investment.
• Need for developer funding for the sustainable provision of facilities and infrastructure at district and county level
ENV 2 ENV 4 ENV 5 ENV 6 SOC 4 EC 1 EC 2 EC 3 EC 5
46
Task A4 – The Sustainability Framework In order to respond to the wide range of environmental, social and economic factors arising from the characterisation and issues assessment, a framework of objectives including questions for decision-making criteria and relevant indicators has been developed. Together these comprise the Sustainability Appraisal Matrix that will be used to assess the relative ‘performance’ of the policies, approaches and proposals put forward for consideration of the Site Specific DPD or the Area Action Plans. The Sustainability Appraisal Matrix is used to inform choices, in sustainability terms, about the direction of the DPDs being prepared. The overall goal is to make the final document(s) as sustainable as possible and to demonstrate that the decision-making procedures have taken the various issues raised in the assessment into account. The objectives are based upon those put forward in National guidance and those used in former Regional guidance and appraisals, include issues of particular relevance for South Norfolk developed from the characterisation, baseline data and other sources e.g. Council corporate objectives. The Sustainability Appraisals of the (now revoked) East of England Plan and the Joint Core Strategy for Broadland, Norwich and South Norfolk identified and assessed a number of key issues and approaches that have an influence on the content of this Sustainability Appraisal. It is not proposed to repeat an assessment that has already been performed as part of a higher-level document, but local issues and effects that result will be included. For example whilst the overall housing provision will not be assessed the site-specific impacts of development sites delivering the requirement will be. The proposed Sustainability Appraisal Objectives are listed in table 4 below. Environmental Objectives ENV 1 To maintain and enhance biodiversity, geodiversity, species and habitat
quality, and avoid habitat fragmentation ENV 2 To limit or reduce vulnerability to climate change, including minimising the
risks from flooding ENV 3 To maximise the use of renewable energy solutions and reduce
contributions to climate change ENV 4 To reduce the effect of traffic on the environment ENV 5 To improve air quality and minimise noise, vibration and light pollution ENV 6 To maintain and enhance the distinctiveness and quality of landscapes,
townscapes and the historic environment ENV 7 To minimise the loss of undeveloped land and conserve and improve the
quality of soil resources
47
ENV 8 To improve water qualities and provide for sustainable sources of supply and sustainable use
ENV 9 To minimise the production of waste and increase recycling Social Objectives S 1 To provide everybody with the opportunity to live in a decent, suitable and
affordable home S 2 To reduce poverty, inequality and social exclusion S 3 To offer opportunities for all sections of the population to have rewarding
and satisfying employment S 4 To improve accessibility to essential services, facilities and the workplace,
particularly for those most in need S 5 To improve the education and skills of the population overall S 6 To improve the health of the population overall S 7 To encourage local community identity and foster mixed communities with
co-operative attitudes, helping to reduce anti-social activity S 8 To improve the quality of where people live Economic Objectives EC 1 To encourage sustained economic growth EC 2 To encourage and accommodate both indigenous and inward investment
promoting a positive image of the District EC 3 To encourage efficient patterns of movement in support of economic growth EC 4 To improve the social and environmental performance of the economy EC 5 To improve economic performance in rural areas Table 4: Proposed Sustainability Appraisal Objectives The appraisal process allows for consideration of short, medium and long-term effects, possible mitigation measures, cumulative impacts and a comments section where further detail can be provided. It may not be necessary to ‘answer’ the decision-making criteria in every instance. The criteria are intended to focus discussion and aid assessment, rather than being a prescriptive approach that becomes burdensome to the SA process. Appendix 3 explores the compatibility of the various objectives with each other. Certain objectives may result in a conflict or contradiction e.g. reducing contributions climate change vs. sustained economic growth. The presence of such contradictions does not undermine the SA process as long as such potential conflicts are acknowledged and recognised as part of the decision making process.
48
Appendix 4 presents the Sustainability Appraisal Framework as it will be used to assess the various policies, approaches and proposals considered for each DPD. The sustainability objectives are presented along with the decision making criteria and relevant indicators. Each policy/proposal assessed will have its anticipated effect (ranging from major negative, minor negative, no effect, uncertain, minor positive to major positive) ‘scored’ over a short, medium and long time period. In addition to a commentary box against each objective a summary and recommendation will be provided for each of the three objective categories, culminating in a conclusion and recommendation.
49
Task A5 – Consulting on the Scope of the Sustainability Appraisal In order to satisfy the requirements of the SEA Directive the SA Scoping Report must be available for consultation for a minimum of 5 weeks. The environmental consultation bodies specified in the 2005 guidance must be consulted (Natural England, Environment Agency and English Heritage). Other community groups and social and economic bodies should be consulted as the LPA considers appropriate.” The SA Guidance states that stakeholder consultation at Stage A is particularly important: “Consultation at this stage helps to ensure that the SA will be comprehensive and robust enough to support the DPD during the later stages of full public consultation and examination”. In particular, the Guidance suggests, “Sustainability objectives and indicators and targets should be developed with input from key stakeholders and ideally should be open to wider comment and discussion”. The following organisations were consulted on the content of the Sustainability Appraisal Scoping Report between 6th August – 10th September 2010. Statutory consultees: Natural England Environment Agency English Heritage Other organisations: Anglian Water Breckland District Council Broadland District Council Broads Authority Country Landowners Association CPRE Norfolk East of England Development Agency EDF Government Office for the East of England Great Yarmouth Borough Council Homes and Communities Agency Mid Suffolk District Council
National Farmers Union National Grid NHS Norfolk Norfolk Alliance Norfolk Association of Parish Councils Norfolk Biodiversity Partnership
50
Norfolk Chamber of Commerce Norfolk County Council Norfolk Police Norfolk Wildlife Trust
Norwich City Council Royal Society for the Protection of Birds Shaping Norfolk’s Future South Norfolk Alliance Suffolk County Council Waveney District Council The SA on the Area Action Plan DPDs and the Sites Specific Policies and Allocations DPD is also available on the Council’s website via the following link: http://www.south-norfolk.gov.uk/sustainabilityappraisal
Appendix 1 – Review of Plans, Programmes and Policies Document Title (sorted
by publication date) Relevant key objectives Relevant
key targets and indicators
Implications for LDF
Issues for sustainability appraisal
INTERNATIONAL
The Rio Earth Summit, 1992 – JCS Five separate agreements made at Summit • The Convention on Biological Diversity • The Framework Convention on Climate Change • Principles of Forest Management • The Rio Declaration on Environment and Development – 27 key principles • Agenda 21 - an action plan for developing the planet sustainably into the 21st century.
Promotion of renewable energy & energy efficiency. Promotion of sustainable development patterns & public transport. Promotion of water efficiency. Promotion of biodiversity
Sustainability of new development patterns. Contribution to public transport. Contribution to renewable energy and efficiency. Contribution to biodiversity
Kyoto Protocol and the UN Framework Convention on Climate Change, 1992 – EoEP & JCS
To achieve stabilisation of greenhouse gas concentrations in the atmosphere at safe levels
UK target is set at 12.5% less than the 1990 output emission levels by 2012. (Domestic goal of 20% reduction of CO2 emissions below 1990 levels by 2010 - Climate Change – UK Programme 2000)
To encourage a reduction in greenhouse gas emissions (directly or through the use of alternatives).
Impact on greenhouse gas emissions Contribution to renewable energy and efficiency
The Conservation of Natural Habitats and of Wild Fauna and Flora Directive (92/43/EEC) –EoEP & JCS
To contribute towards ensuring biodiversity through the conservation of natural habitats and of wild flora and fauna; designation of Special Areas of Conservation. Requirement for “appropriate assessments” to consider effects on sites of European importance.
Protection and management of biodiversity and areas of significant habitat and ecological importance.
Impact on habitats and species Development to avoid areas of particular importance Particular consideration of SACs and SPAs
European Air Quality Framework Directive (96/62/EC) (and supplementary ones) – EoEP & JCS
Maintain air quality where it is good, and improve where it is not.
Avoid detrimental impacts on air quality. Help to mitigate in designated Air Quality Management Areas.
Impact on air quality. Need to identify areas where improvement is necessary.
52
Document Title (sorted by publication date)
Relevant key objectives Relevant key targets and indicators
Implications for LDF
Issues for sustainability appraisal
European Water Framework Directive (2000/60/EC) – EoEP & JCS
Framework for the protection of inland, surface, transitional and coastal waters
Protection & management of water resources & environments.
Impact on water resources. Integration of different sectors. Impact upon European sites.
EC Directive on the assessment of the effects of certain plans and programmes on the environment (2001/42/EC)
“To provide for a high level of protection of the environment & to contribute to integration of environmental considerations into preparation of plans & programmes …. promoting sustainable development.” “Environmental assessments” should be carried out for plans which are likely to have significant effects on environment.
DPD should be accompanied by SA to ensure: Policies in plan will contribute to sustainable development. Τhat there is full stakeholder & public consultation in process.
SA framework should ensure the objectives of this overarching document are covered.
Directive (2001/77/EC) Promotion of development of renewable energy sources and their use – EoEP & JCS
Promotion of development of renewable energy sources and their use
Promotion of renewable energy
Contribution to use of renewable energy
The World Summit on Sustainable Development, Johannesburg, 2002 – EoEP & JCS
International commitment to Sustainable Development: • Reverse trend in loss of natural resources, e.g. through resource efficiency • Increase renewable energy and efficiency • Reduce loss of biodiversity
Strengthen global commitments on sustainable development set out at Rio (Plan of Implementation). Agreements made to halve the 2 billion people living without clean water by 2015, set up solidarity fund to wipe out poverty, restore depleted fish stocks by 2015 & reduce species loss by 2015.
Promotion of sustainable development patterns. Promotion of renewable energy & energy efficiency. Protection and enhancement of biodiversity. Protection of natural resources. Promotion of health and economic well-being
Sustainability of new development patterns. Renewable energy and Efficiency. Biodiversity & natural resources. Minimisation of waste. Health & economic well-being
Directive on the Promotion of Biofuels and other Renewable Fuels for transport (2003/30/EC) – EoEP & JCS
Creating European wide framework for adoption of biofuels in transport fuel.
National targets of 5.75% by 2010 & 10% by 2020.
Consider infrastructure requirements for expansion in biofuels (farming, manufacture, delivery etc
Contribution to use of biofuels.
European Spatial Development Perspective - JCS
Across the regions of EU: Economic & Social cohesion. Conservation & management of natural resources & cultural heritage. More balanced competitiveness.
Management of economic, social & environmental matters
Balancing of potentially conflicting economic, social & environmental issues.
53
Document Title (sorted by publication date)
Relevant key objectives Relevant key targets and indicators
Implications for LDF
Issues for sustainability appraisal
NATIONAL
PPG16 Archaeology and Planning (1993) - JCS
Ensure archaeological remains are not needlessly or thoughtlessly destroyed Presumption in favour of physical preservation of nationally important remains and their setting
Consider and address archaeological interests
Impact on archaeology
PPG15 Planning and the Historic Environment (1994) – EoEP & JCS
Effective protection for all aspects of the historic environment
Identify, protect and enhance the historic environment
Impact on historic environment Contribution to enhancement and restoration
PPG24 Planning and Noise (1994) – EoEP & JCS
Minimise the adverse impacts of noise
Consider risk of impacts from noise to/from development
Risks of noise impacts
Planning (Control of Major Accident Hazards) Regulations (implements obligations under Seveso II Directive Council Directive 96/82/EC) - JCS
Prevent major accidents from hazardous substances & limit their consequences
Consider location of establishments where hazardous substances are used or stored. Issue of development within vicinity of hazardous substance zones.
Consideration of hazardous substances & impact on health & environment
Saving Lives: Our Healthier Nation White Paper (1999) – JCS
An action plan to improve the health of everyone, focusing on particular illnesses
Consider how LDF can contribute to improved health
Contribution to health
DfT 10 year Transport Plan (2000) To tackle congestion & pollution by improving all types of transport in ways that increase choice. Based on: • integrated transport • public and private partnership • new projects.
Relevant targets: 10% increase in bus journeys to 2010. Bus priority schemes. Improve links to deprived urban areas. More park & ride schemes. Safer cycling & walking routes more 20mph areas & Home Zones
Promote integrated transport as part of sustainable development.
Contribution to achieving modal shift to sustainable forms of transport.
Rural White Paper: Our Countryside (2000) – EoEP & JCS
Sustain and enhance the distinctive environment, economy and social fabric of the English countryside for the benefit of all.
Consider contribution to environmental, social & economic life of rural areas
Contribution to rural environment, economy and community
54
Document Title (sorted by publication date)
Relevant key objectives Relevant key targets and indicators
Implications for LDF
Issues for sustainability appraisal
Urban White Paper- Our Towns and Cities: The Future (2000) - JCS
Urban areas that offer a high quality of life and opportunity for all. Urban renaissance should benefit everyone, making towns & cities vibrant & successful, & protecting the countryside from development pressure. Promotes- • Community involvement • Good sustainable design and planning • Prosperous and inclusive cities • Good quality services • Protection from crime
Consider the means for contributing to the environmental, social and economic fabric of the urban area
Contribution to urban environment, economy and social well-being
PPG8 Telecommunications (2001) – EoEP & JCS
Facilitate the growth of new and existing telecommunication systems whilst keeping environmental impact to a minimum.
Provide for telecomms development, having regard to environmental impacts & technical constraints
Contribution to telecommunications system development and sustainability
PPG13 Transport (2001) – EoEP & JCS Promote more sustainable transport choices for people and freight. Promote accessibility to jobs, shopping, leisure facilities and services by public transport, walking and cycling. Reduce the need to travel, especially by car.
National maximum parking standards (Annex D)
Promote development in sustainable locations (good accessibility by walking, cycling and public transport)
Accessibility of development links to jobs, services etc)
PPG17 Planning for open space, sport and recreation (2002) – EoEP & JCS
Local networks of high quality and well managed and maintained open spaces, sports and recreational facilities and the maintenance of an adequate supply.
Local standards to be set
Assess recreational needs, set standards, protect and enhance appropriate provision
Impact / contribution on recreational provision
Air Quality Strategy for England etc (Jan 2000 + Feb. 2003 addendum) – EoEP & JCS
Improve air quality to protect people's health & environment without imposing unacceptable economic or social costs. Objectives for nine main air pollutants.
Consider policies that encourage reduction in air pollutants
Assess likely implications on air quality / pollutants
Energy White Paper: Our Energy Future – creating a low carbon economy (2003) – JCS
Long term strategic vision for energy policy, combining environmental security of supply, competitiveness and social goals.
Promotion of sustainable energy, energy efficiency
Consider sustainable energy issues
Rural Strategy 2004 - JCS Economic and Social Regeneration – Supporting enterprise across rural England, but targeting greater resources at areas of greatest need; Social Justice for All – tackling rural social exclusion and providing fair access to services & opportunities for rural people. Enhancing the countryside – protecting the natural environment.
Consider means for contributing to environmental, social & economic fabric of rural areas.
Contribution to rural environment, economy and social well-being
55
Document Title (sorted by publication date)
Relevant key objectives Relevant key targets and indicators
Implications for LDF
Issues for sustainability appraisal
ODPM Safer Places: The Planning System and Crime Prevention (2004)
Early consideration of crime prevention as part of the design process to deliver safer places.
Contribution to reduction of crime rates.
Ensure policies take account of the need to consider & design out crime.
Contribution to designing out / reducing crime.
PPS7 Sustainable Development in Rural Areas (2004) – EoEP & JCS (partially superseded by PPS4)
Strictly control new housing in the open countryside. Protect character of rural settlements & sites with specific landscape, wildlife & historic value. Local landscape designations need to be rigorously justified. Support appropriate agricultural development/diversification. Protect most valuable agricultural land.
Promote sustainable economic activity development in rural areas. Protect countryside, rural character & specific sites. Protect agricultural land.
Protection of countryside & environmental assets. Sustainable economic development in rural areas. Protection of soil resources.
PPS22 Renewable Energy (2004) – EoEP & JCS
Increased development of renewable energy resources
20% of UK electricity to be from renewables by 2020
Promotion of renewable energy. Set criteria for renewable energy projects,
Contribution to renewable energy provision
PPS23 Planning and Pollution Control (2004) – EoEP & JCS
Protecting and improving the natural environment, public health and safety, and amenity
Consider risks from pollution, balance with other factors
Risks / impact from pollution
PPS9 Biodiversity and Geological Conservation (2005) – JCS
Biological and geological diversity are conserved and enhanced as part of sustainable development. Conserve, enhance and restore diversity of wildlife and geology. Contribute to rural renewal and urban renaissance (taking account of biodiversity's role in quality of life and high quality environments).
Identify, protect and enhance biodiversity and important geology
Impact on biodiversity (habitats and species) and geology. Contribution to enhancement and restoration
Securing the Future - the UK Sustainable Development Strategy 2005 - JCS
A sustainable, innovative & productive economy that delivers high levels of employment & a just society that promotes social inclusion, sustainable communities and personal well-being; done in ways that protect and enhance the physical and natural environment, and use resources and energy as efficiently as possible.
Promotion of sustainable economy & communities. Protect & enhance environment, promote resource and energy efficiency.
Contribution to: Economic objectives Sustainable communities Impact on / enhancement of environment Resource efficiency & energy efficiency
56
Document Title (sorted by publication date)
Relevant key objectives Relevant key targets and indicators
Delivery of sustainable development – inc. use of resources and reduction of GHG emissions. Contribute to Climate Change Programme, energy policies and sustainability. Provide homes, jobs, services, infrastructure, reduce emissions, efficient use of resources, resilience to climate change. Deliver sustainable patterns of urban and rural growth, maximising public transport and reducing need to travel (esp. by car). Promote social cohesion & inclusion. Conserve & enhance biodiversity (inc. impacts of climate change) Reflect development needs & interests of community and business. Enable them to contribute effectively. Encourage competitiveness & innovation
Consider how development can contribute towards all aspects of sustainable development, respond to challenges of climate change.
Overall consideration of sustainability and tackling climate change issues e.g. sustainable energy, flooding, biodiversity, locational strategy, accessibility, travel, economic and community development
PPS3 Housing (2006) - JCS Ensure that everyone has opportunity to live in a decent home, which they can afford, in a community where they want to live: To achieve a wide choice of high quality homes, both affordable & market housing, to address community needs. Widen opportunities for home ownership & ensure high quality housing for those who cannot afford market housing, particularly for vulnerable or in need. To improve affordability across housing market, inc. by increasing supply. To create sustainable, inclusive, mixed communities in both urban & rural areas.
Provide for housing development that is sustainable as regards location, layout & design and meets the needs of the community.
Contribution to meeting housing requirement (market and affordable) Sustainability & choice of locations Efficient use and management of land Quality of design Contribution to inclusive communities
Good Practice Guide on Planning for Tourism (May 2006) - JCS
Maximising the economic, social and environmental benefits of tourism, and achieving these in most sustainable manner.
Promote sustainable tourism
Contribution to tourism. Impact on economy, environment & social issues
57
Document Title (sorted by publication date)
Relevant key objectives Relevant key targets and indicators
Implications for LDF
Issues for sustainability appraisal
Code for Sustainable Homes: A step-change in sustainable home building practice. (2006) - JCS
Minimum standards for • Energy and Carbon Dioxide emissions • Water consumption • Materials used • Surface water run-off • Waste • Pollution • Health and well-being • Management • Ecology
Move towards improved environmental standards to minimise impact on environment & improve social well-being & health from home occupation. Consider how housing can enhance the environment & create a healthy living environment for residents.
Impact on greenhouse gas emissions. Contribution to renewable energy and efficiency. Contribution to water conservation. Making best use of resources. Minimising waste & increasing recycling. Minimising impacts from pollution. Contribution to community well-being. Improving health of residents. Improved security / minimised crime. Contribution to enhanced biodiversity.
UK Climate Change Programme (latest version March 2006) – EoEP & JCS
Strategy for climate change, reducing emissions that contribute to climate change and adaptation to climate change
Sets out how energy efficiency will save 10.2 million tonnes of carbon (MtC) per year by 2010. Savings will be split between business (5.1MtC) & household (4.8MtC) and public sectors (0.3MtC).
Consider means for reducing emissions and designing / locating development that deals with the risks from climate change
Impact on greenhouse gas emissions Contribution to renewable energy & efficiency Risks of flooding
Energy Review 2006 - JCS Tackle climate change by reducing CO2 & to deliver secure, clean energy at affordable prices, as we move to increasing dependence on imported energy
Energy Savings of 6-9 MtC by 2020 (this is on top of savings –12 MtC - announced in the Climate Change Programme of 2006 by 2010)
Promotion of energy efficiency, more efficient transport, distributed energy generation, renewable energy, security of supply.
Contribution to sustainable energy development and use
58
Document Title (sorted by publication date)
Relevant key objectives Relevant key targets and indicators
Implications for LDF
Issues for sustainability appraisal
Local Government White Paper 2006 – Strong and Prosperous Communities - JCS
Responsive services & empowered Communities. Effective, accountable & responsive local government. Strong cities and strategic regions Local government as strategic leader and placeshaper. Performance framework. Efficiency in transforming local services. Community cohesion.
Consider how spatial planning can contribute to better communities
Contribution to community well-being
PPS12 Local Spatial Planning (2008) Government policies on local spatial planning and LDF preparation. Sets out key ingredients of local spatial planning and how local authorities should prepare them.
To ensure all the requirements of PPS are met through both contents and the procedures plan preparation.
Fundamental tenet of plan preparation
State of the Countryside Report (2008)
Provides information and health check on themes and issues faced by rural communities
Develop plans/proposals that respond to needs of rural communities and countryside issues
Consider contribution towards: Access to services, Sustainable transport, Community involvement, Affordable housing, Environment / countryside
PPS25 Development and Flood Risk (2006) + 2009 supplement - JCS
Avoid flood risk where possible (sequential test), manage and reduce risk, avoid increasing flood risk
Consider & limit risks of flooding, avoid locating development in areas at risk where possible, reduce flood-risks.
Risks of flooding
59
Document Title (sorted by publication date)
Relevant key objectives Relevant key targets and indicators
Implications for LDF
Issues for sustainability appraisal
PPS4 Planning for Sustainable Economic Development (2009)
Proactive and flexible development plan policies that emphasise sustainable development, stresses importance of towns & cities, protecting the countryside but promoting appropriate development in rural areas for employment, tourism & leisure activities (e.g. conversion, re-use and replacement buildings & farm diversification) Need to: • Set out clear economic vision &
strategy, • Assess ‘need’ • Support existing businesses, • Set out management of & growth of
centres, • Plan for new or emerging sectors as
well as the knowledge/hi-tech industry • Prioritise use of previously developed
land • Reassess existing allocations • Identify local service centres,
network/hierarchy of town centres (including primary & secondary frontages) + range of sites for economic development
• Deliver sustainable transport • Set maximum parking standards • Set floorspace threshold for edge of
centre and out of centre • Manage evening & night time economy • Monitor - network & hierarchy of
centres, need for further development, vitality & viability of centres.
Positive approach towards sustainable economic development – including tourism & leisure. Continued emphasis on town & service centres, protection of countryside and appropriate economic development in rural areas.
Contribution towards economic development in existing centres and rural areas. Provision of jobs & employment opportunities. Sustainability of proposals (re-use, conversions, diversification) Protection of countryside
60
Document Title (sorted by publication date)
Relevant key objectives Relevant key targets and indicators
Implications for LDF
Issues for sustainability appraisal
PPS 5: Planning for the Historic Environment (2010)
Recognise that heritage assets are a valuable non-renewable resource. Need to maintain information on assets and their significance & contribution to area & sense of place. Need positive, proactive approach to conservation of historic assets.
Need to consider proposals in light of proximity to historic assets, any impact upon them and with regard to their level of significance.
Contribution to built environment in urban & rural areas. Contributes to distinctiveness of landscape & townscapes.
Consultation draft of PPS 1 supplement: Planning for a Low Carbon Future in a Changing Climate (2010)
Planning should fully support the transition to a low carbon future in a changing climate by • shaping places to help secure radical cuts in greenhouse gas emissions. This requires the location and layout of new development to be planned to deliver the highest viable energy efficiency, including through the use of decentralized energy, reducing the need to travel, and the fullest possible use of sustainable transport. • actively support and help drive the delivery of renewable and low carbon energy. • shape places and secure new development so as to minimise vulnerability and provide resilience to impacts arising from climate change, and do so in ways consistent with cutting greenhouse gas emissions. • ensure local communities are given real opportunities to take positive action on climate change; in particular by encouraging community-led initiatives to reduce energy use and secure more renewable and low-carbon energy.
Continued emphasis on low carbon development, renewable energy and imperative need to respond to challenges of climate change
Contribution to reduction of greenhouse gas emissions, renewable energy, and impacts pf climate change.
61
Document Title (sorted by publication date)
Relevant key objectives Relevant key targets and indicators
Implications for LDF
Issues for sustainability appraisal
Consultation draft of PPS: Planning for a Natural and Healthy Environment (2010)
Need to conserve & enhance natural environment, inc. quality, character & value of landscape, biodiversity, geodiversity & soil within rural & urban areas by ensuring that: –– natural environment is integrated into strategic vision of communities –– policies & decisions are based on an understanding of the nature, extent & value of the natural environment & recognise its importance; and –– development & regeneration has minimal impacts on biodiversity & should enhance it wherever possible to contribute to the overall aim of no net loss to biodiversity. • minimise vulnerability of places, people & wildlife to the impacts of climate change & contribute to effective climate change adaptation measures by maintaining, creating and improving networks of green infrastructure within both urban and rural areas • deliver safe & attractive places to live, which respect the areas character, promote health & wellbeing, & reduce social inequalities by ensuring peoples access to high quality open spaces, green infrastructure & sports & play spaces & facilities which are safely & easily accessible by walking, cycling or public transport • provide access & appropriate recreational opportunities in rural areas to enable urban & rural dwellers to enjoy wider countryside.
Need to ensure up to date data available on natural environment, habitats and green infrastructure and open space etc. when preparing LDF. Need to consider how best to conserve and enhance areas assets and develop strategy to address deficiencies.
Consider impacts upon biodiversity and environmental quality and townscapes/landscapes. Access to environment, promotion of healthy and active populations, provision of high quality local environment.
62
Document Title (sorted by publication date)
Relevant key objectives Relevant key targets and indicators
Implications for LDF
Issues for sustainability appraisal
Sustainable Communities Plan: Building for the future – EoEP & JCS
Ensure all social tenants have a decent home Ensure all communities have a clean, safe & attractive environment. Ensure that existing housing stock standards are improved. Tackle the housing shortage - more homes of right type in the right place; address the needs for more affordable housing; make best use of existing housing stock. Work towards a better balance in housing market in longer term. Ensure communities are sustainable, the environment is enhanced and countryside protected. Protect the countryside and enhance its quality, avoiding urban sprawl. Address the housing needs of rural communities. Alleviate pressures on services & housing caused by economic success where these pressures cannot readily be dealt with within existing towns and cities. Ensure new & expanded communities are sustainable, well-designed, high quality and attractive places in which people will positively choose to live & work.
Provision of housing for all sectors of the community. Promote good community Environments & improved housing standards. Housing that meets the needs of community, in type & location, whilst protecting environment. Encourage brownfield development. Protect & enhance the countryside. Provide for rural housing needs Provide for adequate levels of housing & service development. Apply aims of sustainable development to new / expanded communities
Contribution to: Meet housing requirement. Environmental quality. Housing suitability. Appropriateness of type and sustainability of location. Efficient use/management of land. Impact on / contribution to Environment. Impact on countryside. Meet rural housing needs. Services requirement. Sustainability of policies and proposals
Conservation of Habitats and Species Regulations 2010
To contribute towards ensuring biodiversity through the conservation of natural habitats and of wild flora and fauna; designation of Special Areas of Conservation. Requirement for “appropriate assessments” to consider effects on sites of European importance.
Protection and management of biodiversity and areas of significant habitat and ecological importance.
Impact on habitats and species Development to avoid areas of particular importance Particular consideration of SACs and SPAs
63
Document Title (sorted by publication date)
Relevant key objectives Relevant key targets and indicators
Implications for LDF
Issues for sustainability appraisal
REGIONAL
A Sustainable Development Framework for the East of England (EERA, 2001) – EoEP & JCS
High level objectives: To achieve sustainable levels of prosperity and economic growth. To deliver more sustainable patterns of location of development, including employment and housing. To protect and maintain our most valuable regional assets such as designated habitats, landscapes of natural beauty, and our historic built heritage, and to improve the wider environment by means of adequate investment and management. To reduce our consumption of fossil fuels. To achieve a more equitable sharing of the benefits of prosperity across all sectors of society & fairer access to services, focusing on deprived areas in the region. To use natural resources (finite & Renewable) efficiently as possible, re-use or recycled alts wherever possible. Minimise production of by-products or wastes, aiming for "closed systems". To avoid using the global environment to underwrite our own unsustainable way of life (eg. dependence on unsustainably produced and/or transported food imports or timber). To revitalise town centres to promote a return to sustainable urban living.
Promote sustainable development, inc. location & urban living. Protect and enhance environmental assets. Promote resource and energy efficiency. Improve access to jobs, services & facilities.
Sustainability of development. Impact on environment. Impact on resources. Contribution to energy efficiency & renewable energy. Accessibility of development.
Woodland for Life – Regional Woodland strategy for the East of England (Nov. 2003) – EoEP & JCS
Improve the lives of individuals and the places in which they live and work. Add to general economy of region, with woodland economy providing wide range of social & environmental benefits. The use of wood as an alternative source of energy to fossil fuels. Deliver wider societal benefits using woodlands as resources for learning. A high quality natural environment that is protected and enhanced.
Consider the retention and enhancement of woodland for its contribution to social, economic & environmental factors
Impact on, or contribution to enhancement of, woodlands
64
Document Title (sorted by publication date)
Relevant key objectives Relevant key targets and indicators
Implications for LDF
Issues for sustainability appraisal
Sustainable Communities in the East of England (2003) - JCS
Creation of sustainable communities, addressing housing, planning and neighbourhood renewal issues.
Encourage creation of sustainable communities
Contribution towards community well-being
Our Environment, Our Future. Regional Environmental Strategy for East of England EERA (2003)
Vision: A wealthy & inclusive region which recognises value of environment to sustainable development. Agenda: to celebrate, protect & enhance East of England’s natural, historic & built environment. Importance of environment Green space – health & recreation investment. Regeneration focus through repair & conservation of built environment. Priorities & strategic aims. Development should promote: • good design • protection of the historic environment • sustainable transport • enhanced environment • addressing of climate change issues (including energy efficiency) • enhanced biodiversity • sustainable lifestyles (including understanding of environmental issues).
Protection for range of existing assets, improve access to them and create new assets where possible.
Contribution to built, historic and environmental assets. Access to environment. Responds to challenges of climate change. Biodiversity
Sustainable Tourism Strategy for the East of England (2004) - JCS
Achievement of tourism goals in a sustainable manner
Encourage sustainable tourism Contribution to sustainable tourism
Economic Strategy for the East of England EEDA (2004)
1. Skills base that can support a worldclass economy: 2. Growing competitiveness, productivity and entrepreneurship: 3.Promoting Technology and research industries 4. High quality places to work and live: 5. Social inclusion and participation: 6. Development of international gateways: 7. A leading information society. 8. Exemplar in efficient use of resources.
Encourage development of skills & training. Encourage competitiveness & specialisms. Promote high quality work & home environments. Accessible economic opportunities. Socially inclusive. Maximise opportunities from overseas & use of technology. Efficient resource use.
Contribution to economic development. Access to employment (transport and skills) Diverse economy. Sustainable economic development. Efficient use of resources.
65
Document Title (sorted by publication date)
Relevant key objectives Relevant key targets and indicators
Implications for LDF
Issues for sustainability appraisal
Sustainable Futures: The Integrated Regional strategy for the East of England (2005) - JCS
Priorities include: Achieving high quality and sustainable solutions in areas facing growth and regeneration pressures. Harness strengths in science, R & D. Address persistent deprivation & social exclusion. Use and manage resources and environmental assets efficiently. Sustainable management of transport infrastructure.
Ensure that priorities are addressed in an integrated and sustainable manner.
Identification and consideration of conflicts. Contribution to sustainable development and construction. Contribution to quality of life.
East of England Social Strategy (2007) “Society has duty to ensure decent standard of living for everyone & prevent damaging inequalities in health & life chances in general. Tackle poverty & reduce income inequalities. Promote access to work, tackle low pay & improve conditions. Improve life chances of children/young people from disadvantaged families. Improve life chances of adults through learning / skills development. Promote active ageing & reduce exclusion of elderly. Support development of sustainable communities. Improve access to services. Develop social networks, promote community cohesion. Tackle poverty. Interventions related to planning: Public transport, Housing, Design, Regeneration, Community involvement in decision-making. Key actions: Support development of community & social enterprises. Delivery of affordable & decent homes. Actively promote development of strategic networks of green space. Promote policies for the closer location of homes, jobs & services & better accessibility through public transport, cycling & walking.
Address issues of: Respond to strategic objectives. Inequality in health & life chances. Promoting social inclusion. Promote economic activity to raise average incomes. Help address issue of community cohesion. Involve all sections of community in decision-making.
Consider issues of: Strategic objectives & social issues. Health & life chances. Social inclusion. Low income.
66
Document Title (sorted by publication date)
Relevant key objectives Relevant key targets and indicators
Implications for LDF
Issues for sustainability appraisal
East of England Plan Regional Spatial Strategy (2008) – JCS Note: This document has since been revoked by the Secretary of State
To reduce the region’s impact on, and exposure to the effects of climate change. To increase housing opportunities for people in the region. To realise the economic potential of the region and its people. To improve the quality of life for the region’s people. To improve and conserve the region’s environment
Locate development to reduce need for travel. Major shift towards public transport, walking & cycling + away from car use. Maximise energy efficiency of development + promote use of renewable & low carbon energy. Reduce risk of damage from flooding. Secure delivery of additional housing. Give priority to affordable housing. Facilitate development to support business, improve skills & opportunities. Provide job growth. Ensure adequate & sustainable transport infrastructure. Deliver sustainable communities. Promote social cohesion & access to services & facilities. Maintain cultural diversity. Promote regen & renewal of disadvantaged areas. Increase community involvement in implementation. Ensure protection & enhancement of environmental assets e.g. historic environment, & landscape. Re-use previously developed land + seek environment & development gains from undeveloped land. Protect + enhance biodiversity by protection of habitats and species + creating new. Provide network of multi-function accessible grenspace. Reduce the demand for & use of water & other natural resources + reduce waste & increase its sustainable management.
Accessibility of development Contribution to more sustainable modes of travel Contribution to energy efficiency Contribution to use of renewable / low carbon energy Risks of flooding Contribution to housing provision Contribution to affordable housing Contribution to economic provision Sustainability of development locations Contribution to strategic infrastructure Contribution to sustainable transport infrastructure Contribution to social infrastructure Protection of & contribution to green infrastructure Contribution to accessibility for all Contribution to cultural diversity Contribution to regeneration and renewal Contribution to community involvement Impact on environmental assets Impact on / enhancement of countryside & the environment
67
Document Title (sorted by publication date)
Relevant key objectives Relevant key targets and indicators
Implications for LDF
Issues for sustainability appraisal
Norfolk, Suffolk and Cambridgeshire Strategic Health Authority Health Strategy 2005 – 2010 - JCS
Vision People choosing healthier lifestyles. People fully involved in decisions about their healthcare. Better quality care, with safe, more effective treatment tailored to the individual. Services delivered locally with more support at home & in community & less time in hospital. Improved health outcomes for vulnerable groups and reduced inequalities. Efficient and effective use of available resources to deliver sustainable services.
Consider the issue of promoting healthier lifestyles and provision of facilities
Contribution to healthy lifestyles and provision of facilities
Living with Climate Change in the East of England – EoEP & JCS
Key messages: By planning ahead we can avoid the worst impacts & take advantage of opportunities. Climate change will create opportunities as well as threats eg tourism. Business activity will be significantly affected. The "northern heartland", which includes the Greater Norwich Area, is the least vulnerable area in the East of England (with fluvial flooding and agricultural impacts likely being the most significant impacts). Planning policies should influence the location and design of new buildings to minimise vulnerability to climate change. Address impacts on economic development. Adapt properties to make them more resilient to flood damage and ensure siting does not exacerbate flood risk. Improve ventilation, cooling and shading in properties. Include Water conservation measures. Create well-shaded green spaces.
Consider and limit risks of flooding. Promote good design that addresses climate change (eg flood risk, ventilation, shading).
Risks of flooding. Contribution to quality of design / sustainable construction.
68
Document Title (sorted by publication date)
Relevant key objectives Relevant key targets and indicators
Implications for LDF
Issues for sustainability appraisal
East of England Plan: Single issue review ‘Planning for Gypsy and Traveller Accommodation in the East of England’ (2009)
Need for best available evidence & professional judgement to respond to accommodation needs of Gypsy and Travellers.
Draft policy H.4 requires at least 1,187 net additional pitches to 2011 (66% increase on existing permitted sites).
Need to identify & respond to Gypsy & Traveller accommodation.
Reduce poverty & social exclusion Improve health, well-being, education & skills, cohesive communities and access to jobs & services. Ability to live in decent home.
Water resources for the future: a strategy for the Anglian Region – EoEP & JCS
Abstraction of water that is environmentally & economically sustainable, providing right amount of water for people, agriculture, commerce and industry & an improved water-related environment.
Availability of water supply. Limit impacts on the water resource.
Impact on water resource (supply and environment) Contribution to water efficiency
Manage water to ensure that it is available for abstraction whilst protecting the needs of the natural environment
Consider the implications for the water resource.
Impacts on water resource (supply and environment)
Broadland Rivers Catchment Flood Management Plan - JCS
Reduce flood risk to people, especially vulnerable groups, property and infrastructure. Reduce risk to life from flooding. Reduce disruption to major transport links, essential infrastructure & communities. Restore, protect and where possible improve nature conservation sites of international importance. Protect and where possible improve recreation and fisheries resources. Extend navigation where appropriate. Protect and improve sustainable water abstraction schemes. Maintain and increase connectivity of the river and floodplain. Restore new areas of functional flood plain and improve in-stream features. Meet river quality objectives and standards. Protect designated cultural heritage features from flooding, where possible.
Consider the implications of flood risk for development, avoiding risks where possible and enabling improvements
Risks of flooding. Contribution to reducing risks and impacts of flooding
69
Document Title (sorted by publication date)
Relevant key objectives Relevant key targets and indicators
Implications for LDF
Issues for sustainability appraisal
LOCAL
South Norfolk Crime Reduction Strategy (2003) - JCS
Strategic Priorities: Burglary + Vehicle-related crime + Crimes of violence: Public and Domestic Partnerships give strategic importance to violent crime & disorder. As issues surrounding domestic violence differ from violent crime these were given distinct priority status.
Consider issue of crime & links with promoting reduced crime through good design & need for early liaison with Police.
Contribution to improving quality of where people live Reducing anti-social activity. Encouraging local community identity, good behaviour & and co-operative attitudes
South Norfolk Corporate Equality Plan (2003) - JCS
AIMING FOR EQUALITY OF OPPORTUNITY “Putting People First” ensure that views & priorities of all citizens are reflected in Council policies. Aim to ensure that equality included in day-to-day work delivering services & in our role as employer. To achieve that, the Council will: Make our services & information about them accessible to all. Ensure, where appropriate, that we work in partnership with others to deliver equality. Meet our statutory requirements. Ensure that employees are treated fairly. Ensure policy development & planning recognise importance of equalities.
Reflect equalities issues
Contribution to equality
South Norfolk Empty Homes Strategy (2003) - JCS
Objectives and targets - bringing empty homes back into productive use for benefit of South Norfolk’s residents will assist in: Reduce number of unfit dwellings. Contribute to revitalisation of market towns. Increasing supply of affordable housing. Increase provision of rented properties for those without homes.
Contribution to housing provision
Contribution to providing everybody with opportunity of a decent home.
Norfolk Biodiversity Action Plan 2004 - JCS Conservation of species and habitats in Norfolk, inc. action plans
Protect and enhance the natural environment (habitats and species)
Impact on biodiversity
Biodiversity SPG for Norfolk (2004) Need to consider biodiversity issues as integral & at earliest stage of planning e.g. site species/habitat surveys. Gives advice on protection, enhancement & mitigation.
Opportunities for species protection & habitat creation & enhancement.
Consider impacts on biodiversity
70
Document Title (sorted by publication date)
Relevant key objectives Relevant key targets and indicators
Implications for LDF
Issues for sustainability appraisal
The Broads Plan 2004 - JCS The Broads will be promoted as national park, accessible to people of all abilities & social backgrounds to enjoy in quiet & environmentally sustainable ways that are in keeping with its distinctive natural & cultural beauty & that are appropriate to a nationally & internationally protected area. Tranquillity & wildness of area protected & enhanced. Information will be readily accessible. Tourism will be of a high standard, contributing to local communities etc. Water resources will be managed sustainably to ensure the proper functioning of the wetland system. Archaeological features will be identified and safeguarded; the Broads distinctiveness will be restored, enhanced & protected; good design & sustainable construction will be encouraged. Waterways will be maintained & enhanced. Land-based access protected & enhanced. Precautionary measures will be taken to prevent environmental degradation. Management will be informed by scientific knowledge. Economic & social development will focus on sustaining thriving rural communities through key sectors e.g. tourism, marine industry & agriculture. Impacts of climate change will be managed sustainably over the longer term. The flood plain will be managed sustainably to alleviate flooding in the Broads.
Consider the implications of potential effects on the Broads Area & contributions to the achievement of the Broads Plan
Impacts on the Broads Area & its management
South Norfolk Economic Development Strategy (2004) - JCS
The Vision for 2009 for South Norfolk’s Economy is: “To be an area where economic opportunity & development is diverse, sustainable & accessible to all the community.” Stimulate creation & retention of all employment in South Norfolk. Raise learning expectation & achievements. Meet needs of economy. Break down the barriers to economic success in rural areas
Economic development, allowing new developments. Consider accessibility issues. Effects on rural communities.
Sustained economic Growth. Contribution to encouraging indigenous & inward investment. Opportunities for all sections of population to have rewarding & satisfying employment. Improving education & skills of the population. Improving economic performance in rural area.
71
Document Title (sorted by publication date)
Relevant key objectives Relevant key targets and indicators
Implications for LDF
Issues for sustainability appraisal
South Norfolk Tourism Strategy (2004) - JCS
Plan to achieve: 1. Increase income from tourism. 2. We will encourage more accommodation providers & attractions to meet quality standards with a series of initiatives 3. The South Norfolk tourism profile will be improved to increase the number of visitors. 4. Responding to the industry’s requests, partners will promote schemes to extend the season, retain skills & encourage investment 5. Involve all tourism partnerships & communities in marketing of destinations, events & themes in South Norfolk. 6. Help local tourism businesses to promote & identify themselves to public. Development of tourism in South Norfolk will enhance the natural and built environment.
Reflect locations of tourist activities. Built & natural environment is key factor.
Contribution to sustained economic growth. Contribution to maintaining & enhancing distinctiveness & quality of landscapes & townscapes. Contribution to conserving & enhancing historic environment.
Gypsies and Travellers Strategy for Norfolk (2005-2008) - JCS
A Norfolk where Gypsies & Travellers have equality of opportunity with other communities to enable them to access services provided by agencies working together in an inclusive, cohesive & transparent manner.
Address the identified need of Gypsy and Traveller communities
Reduction of social exclusion & contribution to quality of life for all
Balancing the housing market. Increasing the supply of affordable housing. Tackling homelessness more effectively. Making best use of existing housing stock. Supporting independent living.
Provide for housing requirements (for all sectors of population)
Contribution to housing provision (market & social)
South Norfolk Leisure/Culture & Countryside Strategy (2006-2016) - JCS
The achievement & improvement of health and well-being & creating a sense of place & community.
Ensure adequate provision of facilities & protection & enhancement of environment. Links to community development.
Maintaining distinctiveness of environment. Reduction in social exclusion. Accessibility to services.
Towards Stronger Communities: South Norfolk’s Strategy for Community Cohesion (Oct 2006) - JCS
Everyone has sense of belonging & shares common values Those from different backgrounds have similar life opportunities Diversity of people’s backgrounds & circumstances is appreciated & valued. Mutual respect for differing opinions & views Strong & positive relationships are being developed from different backgrounds.
Consider issue of community cohesion & social inclusion
Contribution to local community identity, good behaviour & co-operative attitudes.
72
Document Title (sorted by publication date)
Relevant key objectives Relevant key targets and indicators
Implications for LDF
Issues for sustainability appraisal
Local Transport Plan for Norfolk 2006 – 2011 (inc. Transport Strategy to 2021) - JCS
Improve strategic accessibility to reduce Remoteness & improve economic performance. Reduce need to travel by balancing jobs & housing growth. Improve connections by road & particularly public transport. Make house & jobs growth more sustainable, by locating it to minimise need to travel, especially by car. Improve local connections & promote better accessibility to jobs & services, especially by public transport, cycling & walking. Prioritise improvements in more deprived areas. Reduce delays to people & traffic + focus interventions on worst congestion areas - by improving efficiency of transport network & reducing car use. Reduce emissions by enabling a shift to alternative fuels & low emission vehicles. Protect the environment. Reduce casualties. Increase focus on safer road user behaviour. Reduce danger for cyclists & pedestrians. Recognises Norwich area as a focus for growth. Supports Norwich's role as a Regional Interchange Centre and role of market towns; links between Norwich & market towns being of particular importance. Within the built up area, the Norwich Area Transportation Strategy is carried forward, including extending pedestrian dominated area of city-centre + promoting travel choice & accessibility into & within area by all modes. Recognises role of market towns as service centres. Will seek to: Improve role as interchange centres & within towns, improve walking & cycling. Remove traffic from town centres where possible, promote vibrant public spaces & thriving local economies to serving rural hinterland. Proposed major schemes include Norwich Northern Distributor Road.
Consider need for strategic transport improvements related to development. Consider accessibility for development & need for local transport improvements. Focus development on accessible locations where need to travel is reduced, providing for transport improvements where necessary. Reduce need for travel. Require road safety measures / improvements where appropriate. Provide for / require necessary transport infrastructure improvements. Provide for / require necessary transport infrastructure improvements. Provide for strategic transport infrastructure.
Accessibility of development / location and links to jobs and services. Impact on road safety. Contribution to transport infrastructure. Contribution to strategic transport infrastructure.
73
Document Title (sorted by publication date)
Relevant key objectives Relevant key targets and indicators
Implications for LDF
Issues for sustainability appraisal
Joint Municipal Waste Management Strategy for Norfolk 2006 – 2020 - JCS
To reduce the growth in municipal waste by promoting waste reduction and reuse initiatives; Promote waste awareness through public education & awareness campaigns; Increase recycling & composting of waste to achieve statutory performance standards & national recycling and recovery standards; Progressively increase the recovery & diversion of biodegradable waste from landfill in accordance with Landfill Allowance Trading Scheme; Deliver an efficient, effective & affordable waste management service that promotes the implementation of the most practical, social, environmental & economically acceptable solutions; Procure appropriate technologies to manage & treat residual municipal waste; Ensure that way residual waste is treated will support practices higher up waste hierarchy; Minimise as far as possible the residual waste requiring treatment & final disposal; Norfolk Authorities will work together to achieve the Objectives and Actions within the waste management strategy.
Improve the rates of waste recovery and recycling and re-use. To reduce the amount of waste produced at the beginning of the waste chain. To ensure that waste collections and treatment processes are sustainable and able to cater for the new growth from housing and employment. To utilise the waste treatment process as an important opportunity for employment generation.
To improve environmental amenity, including air quality; To make the best use of resources, including land and energy and to minimise waste production; To offer more opportunities for rewarding and satisfying employment for all; To improve the quality of where people live; To improve the social and environmental performance of the economy.
The Broads Authority Local Development Framework Core Strategy (Adopted 2007) – JCS
Vision: Maintaining the Broads & enhancing unique wildlife & leisure resource within special landscape. Policy framework for economically, socially & environmentally sensitive development will underpin a thriving community. Support diversification & sustainable infrastructures including maintenance & enhancement of Navigation + promoting enjoyment of the Broads. Only allowing development on the floodplain that has regard to social & economic well-being of area, landscape, natural resources, risks from flooding & respect natural functioning of flood plain. 12 Strategic Objectives for Core Strategy grouped in three themes: 1. Respecting environment & cultural assets; 2. The use and enjoyment of water & land; 3. Fostering communities.
Enhancing tourism offer for Greater Norwich & Broads area. Protecting & enhancing environmental resources & cultural heritage of the area. Increasing accessibility & use of public transport. Enhancing the business opportunities offered by area, particularly rural diversification. Building sustainable communities & increasing access to affordable housing, especially for key workers.
Impacts on water resource (supply & environment) Risks of flooding. Contribution to reducing risks and impacts of flooding. Reduction of social exclusion & contribution to quality of life for all. Contribution to housing provision (market & social) Impact on / enhancement of the environment. Contribution to healthy environment & provision of facilities.
74
Document Title (sorted by publication date)
Relevant key objectives Relevant key targets and indicators
Implications for LDF
Issues for sustainability appraisal
Learning Disability Employment Plan for Norfolk (2007) - JCS
People with learning difficulties should have same access to employment as others. People with learning difficulties should be supported to have a job and a career. There should be services to support people with learning difficulties to gain a job or job related activities as they want. People, their carers, families, friends & supporters of those with learning difficulties should have the right information about different ways of getting a job, benefits & who can help. Employers and services should be given support & good information so that they can work together to get more people into real jobs. Employment should be seen as a key issue for growing up amongst people with learning difficulties.
Address identified needs of people with learning difficulties and their support networks.
Reduction of social exclusion & contribution to quality of life for all. Contribution to economic provision.
Tomorrow’s Norfolk, Today’s Challenge – A Climate Change Strategy for Norfolk (2008)
Cut carbon emissions by reducing energy consumption & promoting shift to low-carbon technology. Improve resilience to range of risks posed by climate change.
Norfolk LAA target is 11% reduction in CO2 emissions across Norfolk by 2011. LAA target to reach Level 3 by 2011.
Consider means for reducing emissions & designing / locating development so that it can meet challenges / risks from climate change.
Consider how proposal meets challenges arising from climate change.
Partnership of Norfolk Authorities Strategic Flood Risk Assessment (2008)
Ensure flood risk is taken into account at all stages in the planning process to avoid inappropriate development in areas at risk of flooding & directing development away from high risk areas. Provides advice on likely impacts of climate change & areas of SuDS applicability.
Consider the implications of flood risk for development, avoid allocations in areas at risk of flooding. Promote water efficiency & use of SuDS.
Need to avoid, reduce & manage flood risk now & with regard to climate change. Promote water efficiency & use of SuDS.
Norfolk Action – Norfolk’s Local Area Agreement (2008-11)
Local Area Agreement takes Sustainable Community Strategy of Norfolk County Strategic Partnership (Norfolk Ambition) & looks to deliver its long term vision.
National & local indicators as monitoring tools.
Maintain & enhance elements that contribute to quality of life of residents.
Consider whether proposal improves: Quality of where people live. Health of population. Accessibility to services & Facilities. Local community identity, good behaviour & co-operative attitudes. Response to challenges of climate change. Education & skills.
75
Document Title (sorted by publication date)
Relevant key objectives Relevant key targets and indicators
Implications for LDF
Issues for sustainability appraisal
Breckland District Council Core Strategy and Development Control Policies (2009)
Sets out long-term development strategy & policies for Breckland District Council.
Consider cross border implications from proposals in Core Strategy and any potential cumulative effects.
Consider potential transport, environment, infrastructure and social impacts
Waveney District Council Core Strategy (2009)
Sets out long-term development strategy & policies for Waveney District Council.
Consider cross border implications from proposals in Core Strategy and any potential cumulative effects.
Consider potential transport, environment, infrastructure and social impacts
Joint Core Strategy for Broadland, Norwich and South Norfolk (publication document November 2009)
Sets out long-term development strategy & policies for South Norfolk, Broadland and Norwich City Councils up to 2026.
Identify sites for at least 47,500 new homes between 2001 & 2026. Target for growth in employment to provide 33,000 new jobs between 2008 & 2026.
Site Specific DPD will define growth locations identified in JCS including site allocations/ designations & policies. Site Specific DPD must be in conformity with Core Strategy.
SA objectives from JCS relevant & need to be translated, where appropriate to consideration of Site Specific issues.
Greater Norwich Development Partnership Green Infrastructure Strategy (2007) and Delivery Plan (2009)
Strategy for green infrastructure to complement housing & economic growth by providing high quality, accessible green infrastructure within a comprehensive landscape structure; promoting ecological networks & continuity & links between habitats; improving quality of life; helping to address climate change; improving access to habitats & green space & encouraging community well being.
Maximise opportunities for strategic & local green infrastructure. Protect & enhance existing sites, creating new sites & new linkages. Promote biodiversity, public access & health benefits arising from Green Infrastructure.
Contribution towards biodiversity, green infrastructure, public access, environmental improvements/protection & health benefits.
Defines priorities for economic development in greater Norwich area for a five year period.
Improve access to jobs. Provide facilities and services for all. Protect & enhance natural & built environment. Encourage economic development. Promote sustainable development.
Consider contribution to economic development, employment, skills, community life, infrastructure, sustainable development, environment & resource use.
76
Document Title (sorted by publication date)
Relevant key objectives Relevant key targets and indicators
Implications for LDF
Issues for sustainability appraisal
South Norfolk Alliance Sustainable Community Strategy - JCS
Vision: Healthier & even safer place to live, where crime levels & ‘fear of crime’ are low. Suitable accommodation, support & care are available for all. High learning expectations & achievement, meeting needs of individuals & economy. Environment is protected & respected, quality housing available to all & possible to travel around using varied forms of transport. Area where economic opportunity & development is diverse, sustainable, accessible & appropriate to needs of the community. Homes and Housing: Increase no. of affordable properties, inc. shared ownership Achieve high standard of design & efficient use of resources in developments. Development of the economy: Improve availability of jobs & ability of people to get them. Develop village & rural economy. Transport and getting about: Increase & improve use of public transport service. Improve rural accessibility. The environment: Reduce CO2 emissions & support renewables. Protect countryside, landscape & species & habitats. Minimise waste & increase recycling. Community life: Locate most new development where people have easy access to their essential needs & reduce need to travel. Promote social inclusion. Crime and community safety: Reduce crime, disorder, anti social behaviour & fear of crime. Health: Help people take responsibility for their lifestyles & health. Encourage walking & cycling & improve safety, fitness & health. Improve life for people suffering from mental health problems. Develop initiatives to tackle health inequalities. Young people: Tackle issues inc. lack of transport & leisure facilities, rural isolation, boredom & difficulty in accessing training.
Provide for housing requirements – for all sectors of community, in suitable locations. Encourage economic development. Promote accessibility. Promote sustainable development, address causes & implications of climate change, protect natural environments & countryside, minimise waste & encourage recycling. Promote safe environments. Promote healthy environments & provision of health & social facilities.
Contribution to housing provision. Contribution to economic Development. Contribution to accessibility Contribution to sustainable Development, impact on climate change, natural environment & countryside Contribution to a safe environment Contribution to a healthy environment Contribution provision of health & social facilities
77
Document Title (sorted by publication date)
Relevant key objectives Relevant key targets and indicators
Implications for LDF
Issues for sustainability appraisal
South Norfolk Cycling Strategy - JCS Maximise use of cycling as convenient, attractive, safe, healthy & secure means of transport & to integrate with other modes. Ensure that policies to encourage cycling & to provide for cyclists‘ needs are integrated with Community Strategy & LDF Maximise provision of convenient, safe & attractive cycle routes & parking. Integrate provisions for cycles with other forms of transport. To raise public awareness. To reduce cycle theft.
Encourage cycling & provision for cyclists needs
Contribution to accessibility & sustainable transport
South Norfolk Corporate Environment Strategy - JCS
7 key policy areas: Managing the Council’s environmental impact Reducing resource use & energy consumption Transport Air, land and water quality Bio- and Geo-diversity The built and urban environment Waste management
Consider means for reducing environmental impacts
Contribution to traffic reduction. Air quality. Maintaining & enhancing biodiversity, geodiversity, flora & fauna Maintaining & enhancing distinctiveness & quality of landscapes & townscapes. Contribution to use of renewable energy & energy efficiency Reducing vulnerability to climate change Impact on water resources Contribution to minimising production of waste
South Norfolk Council’s Strategy for Health and Well-Being - JCS
Improve health & well-being of everyone who lives or works in South Norfolk Reduce health inequalities of those who are most in need.
Promote regular exercise. Protect local air quality. Reduce health impact of land contamination. Reduce effects of noise. Protect public health. Reduce risk of road traffic accidents. Improve partnership working & community development. Integrate communities. Help people access transport. Reduce financial hardship. Improve standard of private housing stock. Increase availability of affordable housing. Help the most vulnerable.
Contribution to maintaining & improving health Reducing social exclusion. Accessibility to services.
78
Document Title (sorted by publication date)
Relevant key objectives Relevant key targets and indicators
Implications for LDF
Issues for sustainability appraisal
South Norfolk Local Agenda 21 Strategy - JCS
Promote Economic Success. Create vibrant local economy giving access to satisfying & rewarding work without damaging environment. Value unpaid work. Meet Social Needs. Protect human health & amenity through safe, clean, pleasant environments. Emphasise health service prevention action as well as care 65% Maximise access to skills & knowledge. Ensure access to good food, water, housing & fuel at reasonable cost. Encourage access to facilities, services, goods & other people in ways which make less use of car & minimise impacts on environment. Culture, leisure & recreation available to all. Meet local needs locally. Make settlements 'human' in scale & form. Value & protect diversity& distinctiveness, strengthen community & cultural identity. Protect & enhance environment. Use energy, water & other natural resources efficiently & with care. Minimise waste, re-use or recover through recycling, composting or energy recovery. Limit pollution to levels which do not damage natural systems. Value & protect the diversity of nature
Various issues to be reflected in LDD policy
Contribution to local economy. Maintain & improve population health. Improving education & skills of population. Encourage local community identity, good behaviour & co-operative attitudes. Opportunities for population to have rewarding & satisfying employment. Quality of where people live. Accessibility to essential services & facilities Reduce effect of traffic on environment. Maintaining & enhancing biodiversity, geodiversity. Maintaining & enhancing distinctiveness & quality of landscapes & townscapes. Provision for sustainable use & sources of water supply contribution to minimising production of waste
Norwich Area Transport Strategy – JCS Provide highest level of access to & within strategy area. Ensure journeys minimise adverse impact on people & built & natural environment. Promote vibrant city & other centres by improving accessibility for people & goods. Cater for travel consequences arising from growth aspirations. Maximise transport choice for all travelers. To reduce social exclusion. To enhance access for non-car modes. Minimise congestion and delays. Implement transport solutions that protect open space, wildlife habitats & water resources. Maximise safety & security. Protect & enhance residential amenity & minimise community severance.
Consider wide range of transport issues
Contribution to enhancing accessibility. Contribute to a safe environment Contribution to mitigate pollution & improve air quality.
79
Document Title (sorted by publication date)
Relevant key objectives Relevant key targets and indicators
Implications for LDF
Issues for sustainability appraisal
Norfolk Ambition (Norfolk Community Strategy) – JCS
To improve the quality of life for all the people of Norfolk. Key themes being: Individuals have the opportunity to achieve a good quality of life. Healthy lifestyles & access to health & social care. People feel safe. Educational attainment and opportunities for learning throughout life. All can play an active part in community life. Environment is respected and enhanced, including renewable energies. Culture, creativity and spirituality. Distinctive economy. Physical & virtual comms. infrastructure.
Maintain and enhance the elements that contribute to the quality of life of residents
Contribution to or impact on quality of life elements: health, safety, educational attainment, community life, environment, culture, economy, communications infrastructure.
Shaping the Future - an economic strategy for Norfolk and Waveney, and a social cohesion strategy for Norfolk - JCS
Increase wealth creation by building a dynamic and supportive environment for business and enable our people to participate in the economy and maximise their potential whilst ensuring that we protect and enhance our physical environment. 5 Social cohesion themes - access, sustainable jobs, employment and personnel practices, community development, young people's needs.
Raise annual average rate of growth from projected 2.1 % to 2.5%. Create by 2007 an additional 11,000 above the projected figure of 348,000 Reduce unemployment to 1% below UK national average.
Encourage employment development in appropriate locations.
Contribution to economic provision
80
Appendix 2 – Baseline Information for South Norfolk SA Objective
South Norfolk Value
Trends
Comparison Value
Target
Comments
ENV 1 % of SSSIs in ‘favourable’ or ‘unfavourable recovering’ condition Source: Natural England Change in County Wildlife Sites created/lost (ha) Source: South Norfolk AMR
Could consider developing indicators around: • candidate RIGS sites once NGP work
complete • BAP habitats (dependant upon NBP
resources)
ENV 2 Number of planning permissions granted contrary to Environment Agency advice on flood risk Source: South Norfolk AMR
2009 - 2
2005 – 0 2006 – 1 2007 – 0 2008 – 3 2009 – 2
Not applicable
Zero
ENV 3 Per capita reductions in CO2 emissions in the LA area (% in tonnes/CO2) Source: DEFRA (NI 186) Renewable energy generating capacity installed (MW) Source: South Norfolk AMR
ENV 4 % of residents who travel to work: a) by private motor vehicle b) by public transport c) by foot or cycle d) work at home or mainly from home Source: 2001 Census
a) 70.82% b) 5.15% c) 9.82% d) 12.02%
Not available
Norfolk a) 65.4% b) 4.8% c) 16.3% d) 10.8%
Reduce a) Increase b) c) & d)
ENV 5 Number of designated Air Quality Management Areas Source: Defra (www.airquality.co.uk) No. of areas where NO2 above 40µg/m3? No. of areas where further air quality investigation being undertaken? Source: South Norfolk Air Quality Update
Zero XXXX XXXX XXXX
Zero XXXX XXXX XXXX
Zero XXXX XXXX XXXX
Zero Zero Zero Zero
Awaiting further info from David Addy on data and best way to express indicator/s to monitor following discussions with Norfolk Environmental Protection Officers group
Appendix 2 – Baseline Information for South Norfolk SA Objective
South Norfolk Value
Trends
Comparison Value
Target
Comments
ENV 6 Number of heritage assets at risk e.g. a) Listed Buildings b) Scheduled Ancient Monuments added/removed from Buildings at Risk register Number of Conservation Area Character Appraisal & Management Plans adopted (0/52) Number of TPOs served Source: South Norfolk AMR Status of national landscape character areas No. applications where ENV1 reason for refusal
2008/9 a) 0/-4 b) 3/0 0/52 2008 – 12 Maintained Not available
2007/8 a) 0/-4 b) 0/0 2006/7 a) 0/-7 b) 0/0 N/a 2004 – 10 2005 – 15 2006 – 29 2007 – 20 1990-98: Not available
Not applicable Not applicable Not applicable Not applicable Not available
Net decrease for a) and b) 52/52 N/a Maintain/enhance To be determined
No trend data available
ENV 7 % of new dwellings built on previously developed land Source: South Norfolk AMR
Appendix 2 – Baseline Info. for South Norfolk SA Objective
South Norfolk Value
Trends
Comparison Value
Target
Comments
ENV 8 Daily domestic water use (per capita consumption – litres) Source: Audit Commission (OFWAT) Number of planning permissions granted contrary to Environment Agency advice on water quality Source: South Norfolk AMR
S 1 Affordable housing completions/year % of all completions that are affordable Source: South Norfolk AMR No. of Category 1 hazards in housing stock Source: Greater Norwich Household & Physical Survey 2005-06
S 2 Number of SOA in most deprived 10% of England. Source: Norfolk Insight % of economically active working age people (aged 16-64) - Unemployed Source: Norfolk Insight
Zero 2009 – 4.2%
None 2007 – 3.4% 2008 – 4.0%
Not applicable Norfolk 5.19%
Maintain/ Decrease Decrease
S 3 % of working age (16-64) population economically active Source: NOMIS Gross weekly pay (F/T workers) Source: NOMIS
Norfolk 80.91% East of England 2006 – £466.0 2007 – £479.9 2008 – £499.0 2009 – £509.4
Increase Increase
83
Appendix 2 – Baseline Info. for South Norfolk SA Objective
South Norfolk Value
Trends
Comparison Value
Target
Comments
S 4 % of residents who travel to work: a) by private motor vehicle b) by public transport c) by foot or cycle d) work at home or mainly from home Source: 2001 Census Accessibility of local GP services (15 & 30mins walk/public transport) Source: Norfolk Insight
a) 70.82% b) 5.15% c) 9.82% d) 12.02% 15mins – 65.63% 30mins – 94.32%
Not available N/a
Norfolk a) 65.4% b) 4.8% c) 16.3% d) 10.8% Norfolk 15mins – 72.42% 30mins – 96.41%
Reduce a) Increase b) c) & d) Increase
S 5 % of working age population with qualifications at NVQ lvl 4 or above Source: NOMIS % of 16 year old with 5 or more GCSEs grade A-C Source: EastNET
East of England 2005 – 25.0% 2006 – 25.0% 2007 – 26.0% 2008 – 26.1% Norfolk 2004/5 – 52.6
Increase Increase
S 6 Life expectancy, at birth, of
a) males b) females
Source: ONS Access to services and facilities by public transport, walking and cycling (%) Source: South Norfolk (N.I. 175)
a) 80.04 b) 83.27 76.55%
2002-4 a) 79.7 b) 82.5 Baseline year
East of England a) 78.94 b) 82.75 N/a
Increase 2009 – 78% 2010 – 79% 2011 – 80%
S 7 Incidences of crime committed
a) Domestic burglaries b) Violence c) Theft of a vehicle
Source: Norfolk Constabulary % people who agree crime & ASB is successfully dealt with in local area. Source: South Norfolk Neighbourhood Survey 2009 N.I. 21 (Ipsos MORI)
2009/10 a) 543 b) 619 c) 425 2009 27%
Same 3 month period last year a) –8.7% b) –1.3% c) +57.3% Average of all Districts 26%
Norfolk 2009/10 a) –18.1% b) +2.2% c) –2.7% Nationally 45%
Decrease a) b) and c) Increase
S 8 General resident satisfaction levels Source: MORI people survey
2008/9 91%
2006/7 90%
National 86%
Increase
84
Appendix 2 – Baseline Information for South Norfolk SA Objective
South Norfolk Value
Trends
Comparison Value
Target
Comments
EC 1 New business registration rate Source: NOMIS
2007 – 360
2004 – 325 2005 – 380 2006 – 345 2007 – 360
N/a
Increase
EC 2 New business registration rate Source: NOMIS Allocated employment land (Ha) without planning permission (COI BD3) Source: South Norfolk AMR
EC 3 % of residents who travel to work: a) by private motor vehicle b) by public transport c) by foot or cycle d) work at home or mainly from home Source: 2001 Census Average distance travelled to work by residents Source: National Statistics
a) 70.82% b) 5.15% c) 9.82% d) 12.02% 16km
Not available Not available
Norfolk a) 65.4% b) 4.8% c) 16.3% d) 10.8% East of England 15.8km
Reduce a) Increase b) c) & d) Decrease
EC 4 Proportion of population aged 19-64 for males and 19-59 for females qualified to at least Level 2 or higher Source: Audit Commission (N.I. 163) Per capita reductions in CO2 emissions in the LA area (tonnes/CO2) Source: DEFRA (NI 186)
EC 5 Planning permissions granted for new businesses in rural areas (policy EMP 4) Source: South Norfolk AMR
2009 - 26
2005 – 25 2006 – 27 2007 – 18 2008 – 33 2009 – 26
Not applicable
Increase
Appendix 3 – Compatibility between SA objectives SA Objective
E N V 1
E N V 2
E N V 3
E N V 4
E N V 5
E N V 6
E N V 7
E N V 8
E N V 9
S 1
S 2
S 3
S 4
S 5
S 6
S 7
S 8
E C 1
E C 2
E C 3
E C 4
E C 5
ENV 1 ENV 2 ENV 3 ENV 4 ENV 5 ENV 6 ENV 7 ENV 8 ENV 9 S 1 S 2 S 3 S 4 S 5 S 6 S 7 S 8 EC 1 EC 2 EC 3 EC 4 EC 5 = Positive/complimentary = No significant relationship = Negative/potentially conflicting
85
Appendix 4 – Sustainability Appraisal Framework
Site: Sustainability Appraisal
Objectives Assessing the impacts
(++ / + / 0 / - / - - / ?) ENVIRONMENTAL
FACTORS
Investigating Question or
Decision Making Criteria Short term
Medium term
Long term
Nature of Effects and Overall Assessment: Quantify where possible. Include justification, comments and recommendations e.g. for mitigation measures
ENV1: To maintain and enhance biodiversity, geodiversity, species and habitat quality, and avoid habitat fragmentation Indicator-based concerns
• Ability to enhance and protect SSSIs, County Wildlife Sites and river quality • Limiting detrimental change to areas designated for their intrinsic environmental value
Decision-making criteria • Will nature conservation sites of international, national and
local value be adversely affected by development of the site? • Will development of the site increase the number or diversity
of sites of nature conservation interest? Does it seek opportunities to integrate biodiversity into the development?
• Will it adversely affect sites of geological interest? • Will it contribute to achieving BAP targets and
conserve/enhance species and habitat diversity?
ENV2: To limit or reduce vulnerability to climate change, including minimising the risks from flooding Indicator-based concerns
• Reducing the number of planning applications permitted in flood zones • Reducing the vulnerability of planning applications permitted in flood zones
Decision-making criteria • Will development of the site minimise the risk of flooding? • Will it help reduce the vulnerability of agriculture to changes
in weather patterns? • Is it promoting sustainable use of flood zones by ensuring
that development is appropriate to the Flood Zone & passes Sequential Test & exception Test & requirements of PPS25
• Does it encourage habitat relocation or compensation? • Does the proposal make use of SUDS?
ENV3: To maximise the use of renewable energy solutions and reduce contributions to climate change Indicator-based concerns
• Improving the provision of renewable energy generating schemes • Reducing carbon dioxide emissions across the district
• Will it encourage efficient use of energy? • Is it promoting a sequential approach to the pattern of
development? • Will it reduce the emissions of greenhouse gases, including
from energy and traffic? • Will it increase the use of renewable energy sources?
86
Site: Sustainability Appraisal
Objectives Assessing the impacts
(++ / + / 0 / - / - - / ?) ENVIRONMENTAL
FACTORS
Investigating Question
or Decision Making Criteria
Short term
Medium
term
Long term
Nature of Effects and Overall Assessment: Quantify where possible.
Include justification, comments and recommendations eg. for mitigation measures
ENV4: To reduce the effect of traffic on the environment Indicator-based concerns
• Encouraging the use of non-car modes of transport Decision-making criteria • Will it reduce traffic volume or congestion? • Will it reduce the need to travel? • Will it reduce the effect of HGV traffic on people and environment?
• Will it increase the % of journeys using non-car modes?
ENV5: To improve air quality and minimise noise, vibration and light pollution Indicator-based concerns
• Minimising the instances of particulate, NO2 pollution • Trying to avoid the need for Air Quality Management Areas
Decision-making criteria • Will it reduce emissions of atmospheric pollution? • Will it improve air quality?
• Can it improve the ambiance of local areas?
ENV6: To maintain and enhance the distinctiveness and quality of landscapes, townscapes and the historic environment Indicator-based concerns
• Listed buildings, scheduled ancient monuments and all other heritage assets considered ‘at risk’ • Conservation Area Appraisals and management plans
Decision-making criteria • Will it protect the quality of landscapes and
townscapes, or mitigate the effects of inappropriate development?
• Will the site make a positive contribution to the local area, and enhance the character of local landscapes?
• Will it reduce the amount of derelict, degraded and under-used land?
• Will the District’s heritage be preserved and/or enhanced?
87
Site: Sustainability Appraisal
Objectives Assessing the impacts
(++ / + / 0 / - / - - / ?) ENVIRONMENTAL
FACTORS
Investigating Question
or Decision Making Criteria
Short term
Medium
term
Long term
Nature of Effects and Overall Assessment: Quantify where possible.
Include justification, comments and recommendations eg. for mitigation measures
ENV7: To minimise the loss of undeveloped land and conserve and improve the quality of soil resources Indicator-based concerns
• % of new dwellings built on previously developed land Decision-making criteria • Will it avoid the use of productive agricultural land? • Will it minimise the irreversible use of soil resources?
ENV8: To improve water qualities and provide for sustainable sources of supply and sustainable use Indicator-based concerns
• Planning permissions granted contrary to Environment Agency water quality advice • Water consumption per head
Decision-making criteria • Does it conserve groundwater resources? • Will it reduce water consumption? • Will the supply of water be efficient in terms of the overall
network? • What is impact upon water quality? Will it improve
ecological status of waterbodies as required by WFD
ENV9: To minimise the production of waste and increase recycling Indicator-based concerns
• Reducing the number of kilograms of household waste collected per head • Increasing the % of waste that is recycled or composted
Decision-making criteria • Will it result in less waste being produced or requiring
disposal? • Will it facilitate better community recycling facilities? • Will it minimise consumption of resources e.g. use local
materials and sustainably sourced products?
Summary: SA vs. Environmental Objectives
88
Site: Sustainability Appraisal
Objectives Assessing the impacts
(++ / + / 0 / - / - - / ?)
SOCIAL FACTORS
Investigating Question
or Decision Making Criteria
Short term
Medium term
Long term
Nature of Effects and Overall Assessment: Quantify where possible.
Include justification, comments and recommendations eg. for mitigation measures
S1: To provide everybody with the opportunity to live in a decent, suitable and affordable home Indicator-based concerns
• Affordable housing completions per year against overall housing completions • Reducing the number of unfit private sector dwellings
Decision-making criteria • Will it reduce homelessness? • Will it reduce housing need and ensure housing provision
addresses the needs of all? • Will it increase the range and affordability and quality
of housing stock for all social groups?
S2: To reduce poverty, inequality and social exclusion Indicator-based concerns
• % of the population living in the most deprived super output areas of the country • Reducing the numbers of people unemployed
Decision-making criteria • Will it reduce poverty and social exclusion in those
areas most affected? • Will it improve the level of activity available to young
people in the District? • Will it support the development of Social Cohesion? • Will it help to reduce levels of deprivation?
S3: To offer opportunities for all sections of the population to have rewarding and satisfying employment Indicator-based concerns
• % of the population of working age in employment • Improving the level of average earnings
Decision-making criteria • Will it reduce unemployment overall? • Will it improve earnings? • Will it improve access to employment and help to create a
better housing-jobs balance?
89
Site: Sustainability Appraisal
Objectives Assessing the impacts
(++ / + / 0 / - / - - / ?)
SOCIAL FACTORS
Investigating Question
or Decision Making Criteria
Short term
Medium
term
Long term
Nature of Effects and Overall Assessment: Quantify where possible.
Include justification, comments and recommendations eg. for mitigation measures
S4: To improve accessibility to essential services, facilities and the workplace, particularly for those most in need Indicator-based concerns
• Improving the effectiveness of public transport to service public facilities • Encouraging the use of non-car modes of transport
Decision-making criteria • Will it improve accessibility to key local services e.g.
health, education, leisure, open space, shops, community and religious facilities?
• Will it improve access to employment opportunities?
S5: To improve the education and skills of the population overall Indicator-based concerns
• Improving the level of school exam performance • Improving the vocational training amongst the working population
Decision-making criteria • Will it improve qualifications and skills of young
people? • Will it improve access to schools / education facilities
for communities? • Will it encourage opportunities for vocational skills
training and improve local links with the workplace? • Will it encourage lifelong learning and training?
S6: To improve the health of the population overall Indicator-based concerns
• Ability to access GP services • Improving the general life expectancy at birth
Decision-making criteria • Will it improve life expectancy? • Will it improve access to high quality health facilities? • Will it encourage healthy lifestyles? How?
90
Site: Sustainability Appraisal
Objectives Assessing the impacts
(++ / + / 0 / - / - - / ?)
SOCIAL FACTORS
Investigating Question
or Decision Making Criteria
Short term
Medium
term
Long term
Nature of Effects and Overall Assessment: Quantify where possible.
Include justification, comments and recommendations eg. for mitigation measures
S7: To encourage local community identity and foster mixed communities with co-operative attitudes, helping to reduce anti-social activity Indicator-based concerns
• Levels of crime and the community’s general fear of crime • Ability to create mixed and participative communities, eg. through election turnout
Decision-making criteria • Will it reduce actual levels of crime?/ fear of crime?
• Will it encourage engagement in community activities?
• Will it contribute towards creating mixed and balanced communities?
S8: To improve the quality of where people live Indicator-based concerns
• Residents’ perception of the quality of their neighbourhoods as places to live Decision-making criteria
• Will it improve satisfaction of people with their neighbourhoods?
Summary: SA vs. Social Objectives
91
Site: Sustainability Appraisal
Objectives Assessing the impacts
(++ / + / 0 / - / - - / ?)
ECONOMIC FACTORS
Investigating Question
or Decision Making Criteria
Short term
Medium
term
Long term
Nature of Effects and Overall Assessment: Quantify where possible.
Include justification, comments and recommendations eg. for mitigation measures
EC1: To encourage sustained economic growth Indicator-based concerns
• Reducing business premises vacancy rates • More VAT registered businesses in the District
Decision-making criteria • Will it strengthen the local economy and support
emerging employment uses in the District (e.g. Research, tourism)?
• Will it help retain existing businesses? • Will it aid farming diversification? • Will it increase the vitality and viability of Town
Centres?
EC2: To encourage and accommodate both indigenous and inward investment promoting a positive image of the District Indicator-based concerns
• Assessing the availability of employment land across the District • Business start ups
Decision-making criteria • Will it provide for a variety of locations for businesses? • Will it add to a ready supply of employment premises?
• Is it supporting targeted emerging employment types?
EC3: To encourage efficient patterns of movement in support of economic growth Indicator-based concerns
• Travel-to-work by mode data • Reducing the reliance on accessing the workplace via private car
Decision-making criteria • Will it encourage the development of local employment
locations/jobs? • Is it located so as to minimise the journey to work? • Will it enhance a group of existing employment generating
uses? • Will it encourage mixed use or live / work? • Will it reduce journey times between key
employment/service areas?
92
Site: Sustainability Appraisal
Objectives
Assessing the impacts (++ / + / 0 / - / - - / ?)
ECONOMIC FACTORS
Investigating Question
or Decision Making Criteria
Short term
Medium
term
Long term
Nature of Effects and Overall Assessment: Quantify where possible.
Include justification, comments and recommendations eg. for mitigation measures
EC4: To improve the social and environmental performance of the economy Indicator-based concerns
• Decision-making criteria • Will it offer the opportunity for more flexible working?
• Will it operate in a way that seeks to minimise impact on the environment?
EC5: To improve economic performance in rural areas Indicator-based concerns
• Planning permissions granted for business use outside towns Decision-making criteria • Will it encourage rural diversification? • Will it offer sources of employment in rural areas?
• Will it improve electronic communication potential?
Summary: SA vs. Economic Objectives
Key to Effects Score: ++ Major Positive + Minor Positive 0 Neutral Effect - Minor Negative -- Major Negative ? Uncertain Effect Overall Conclusions on site:
Recommendations:
93
South Norfolk Council Planning and Housing Policy Team Swan Lane Long Stratton Norfolk NR15 2XE October 2010