South Staffs Water Decision Making Framework for South Staffs Water PR19 Investment Programme Issue 3 | 29 November 2017 This report takes into account the particular instructions and requirements of our client. It is not intended for and should not be relied upon by any third party and no responsibility is undertaken to any third party. Job number 29 November 2017 Ove Arup & Partners Ltd The Arup Campus Blythe Gate Blythe Valley Park Solihull B90 8AE United Kingdom www.arup.com
Transcript
South Staffs Water
Decision Making Framework for
South Staffs Water
PR19 Investment Programme
Issue 3 | 29 November 2017
This report takes into account the particular
instructions and requirements of our client.
It is not intended for and should not be relied
upon by any third party and no responsibility
is undertaken to any third party.
Job number 29 November 2017
Ove Arup & Partners Ltd
The Arup Campus
Blythe Gate
Blythe Valley Park
Solihull B90 8AE
United Kingdom
www.arup.com
| Issue 3 | 29 November 2017
H:\SOUTH STAFFS WATER DECISION MAKING FRAMEWORK PR19.DOCX
Document Verification
Job title Decision Making Framework for South Staffs
Water
Job number
250257
Document title PR19 Investment Programme File reference
Document ref
Revision Date Filename
Issue 1 23 Jan
2017 Filename 20170127_South Staffs Water Decision Making Framework
PR19 iss1 Record.docx
Description Draft for Discussion
Prepared by Checked by Approved by
Name David Essex,
Sophie Thompson
Helen Jackson,
Mark Tindale Mark Tindale
Rev A 15 May
2017
Filename 20170515_South Staffs Water Decision Making Framework Description Final issue of report to client
Prepared by Checked by Approved by
Name Sophie Thompson
Gemma Holdsworth
Signature
Issue 3 29 Nov
2017 Filename
20171129_South Staffs Water Decision Making Framework
Every 5 years, water companies are required to develop a long term WRMP. This
requires:
• Making 25 year forecasts of supply and demand (Supply Demand forecasts). If a
deficit is forecast within 25 years, then;
• Developing Options which will contribute to meeting that deficit, and;
• Selecting the best Option or Set of Options.
South Staffs Water Decision Making Framework for South Staffs WaterPR19 Investment Programme
| Issue 3 | 29 November 2017
H:\SOUTH STAFFS WATER DECISION MAKING FRAMEWORK PR19.DOCX
Page 10
For companies with a forecast deficit, a typical problem visualisation is shown in Figure
3.
Figure 3: WRMP Problem Visualisation
In Figure 3, the problem is forecast to exist in Year X1 onwards when Water Available
for Use (WAFU) will fall below Demand + Target Headroom (THR). The problem is
then fully defined by the red area in the chart.
The water industry has developed a range of methodologies and guidance (Decision
Making Frameworks) which support water companies in the task of developing solutions
to this problem and in communicating the outputs to others.
Many water companies in the UK are predicting deficits in one or more Water Resource
Zones (WRZ). They have sought to apply versions of the decision making frameworks
developed over the last decade by UKWIR and regulators, and until recently, most of
those centred on variants of EBSD.
3.2.2 Economic Balance of Supply and Demand
EBSD is a decision framework that is well established within the water industry, with
supporting WRMP Guidelines developed by regulators to support its practical use and
application by water companies.
The EBSD Framework is designed to address a particular type of Problem / Solution
structure. The problem is that Demand and Supply are forecast to be unbalanced in the
future. The solution is a Portfolio (or a Schedule) of investments to increase Supply-side
Capacity or reduce Demand to ensure a future balance. EBSD guides in the steps for
making the decision of which is the best portfolio or schedule of investments.
The types of things that are included in the framework are:
• Level of spatial aggregation: Supply/Demand/Option Benefits are at Water
Resources Zone level
• Target Headroom calculated at WRZ level and added to Demand
• Level of time aggregation: Inputs and output are on annual time step
South Staffs Water Decision Making Framework for South Staffs WaterPR19 Investment Programme
| Issue 3 | 29 November 2017
H:\SOUTH STAFFS WATER DECISION MAKING FRAMEWORK PR19.DOCX
Page 11
• Within year Variability: captured via Planning Scenarios, Dry Year Annual Average,
Dry Year Critical Period
• Planning Period: Minimum of 25 years
• Cost Assessment Period: linked to new asset life
• Costs: Discounting, Calculation of Opex, inclusion of Social and Environmental costs
EBSD provides for varying levels of sophistication in the modelling. For example, in
PR14, some companies with less complex problems used a selection procedure within
their Options Appraisal which is a simple ranking of discounted unit costs (AIC/AISC’s).
3.2.3 Developments in WRMP Decision Making
As the complexity of water resource planning decision making has increased the industry
has developed enhanced water resource planning modelling technique. There are several
ways of extending EBSD, these include:
• MCA : Multi Criteria Analysis
• MGA : Modelling to Generate Alternatives
• Real Options Analysis
3.2.3.1 Multi-Criteria Analysis (MCA)
This approach is discussed in section 3.1.2. It goes beyond least Cost and can consider
other criteria such as increased resilience. This approach aligns with the desire to ensure
that investments are appraised on a range of relevant criteria and addresses one of the
main critiques of EBSD which requires all factors to be monetised.
3.2.3.2 Modelling to Generate Alternatives (MGA)
MGA is a modelling approach which seeks “Near Optimal” portfolio solutions. There
may be portfolios which have similarly good performance to the optimal, and MGA is a
mathematically orientated technique to locate them. It can be implemented within an
optimisation tool however we would not recommend it for the current SSC context as it
does not add significantly to the output of the less complex MCA approach. If required,
an MGA add on could be added to an MCA approach at a later date.
3.2.3.3 Real Options Analysis
Real Options is a technique which is well established in other industries but new within
WRMP. It is a method of valuing flexibility and examining the trade-off of delayed
investment; an example is given in Figure 4 to illustrate this technique. In practice,
implementing this approach in a consistent way within an EBSD type of model is
complex, and requires a large amount of analysis of potential decision routes under
different circumstances which are likely to be scheme specific.
Some appreciation of relative flexibility is worthy of considering within the SSC DMF
approach. At the current time, however, a full real options analysis is likely to be overly
complex.
South Staffs Water Decision Making Framework for South Staffs WaterPR19 Investment Programme
| Issue 3 | 29 November 2017
H:\SOUTH STAFFS WATER DECISION MAKING FRAMEWORK PR19.DOCX
Page 12
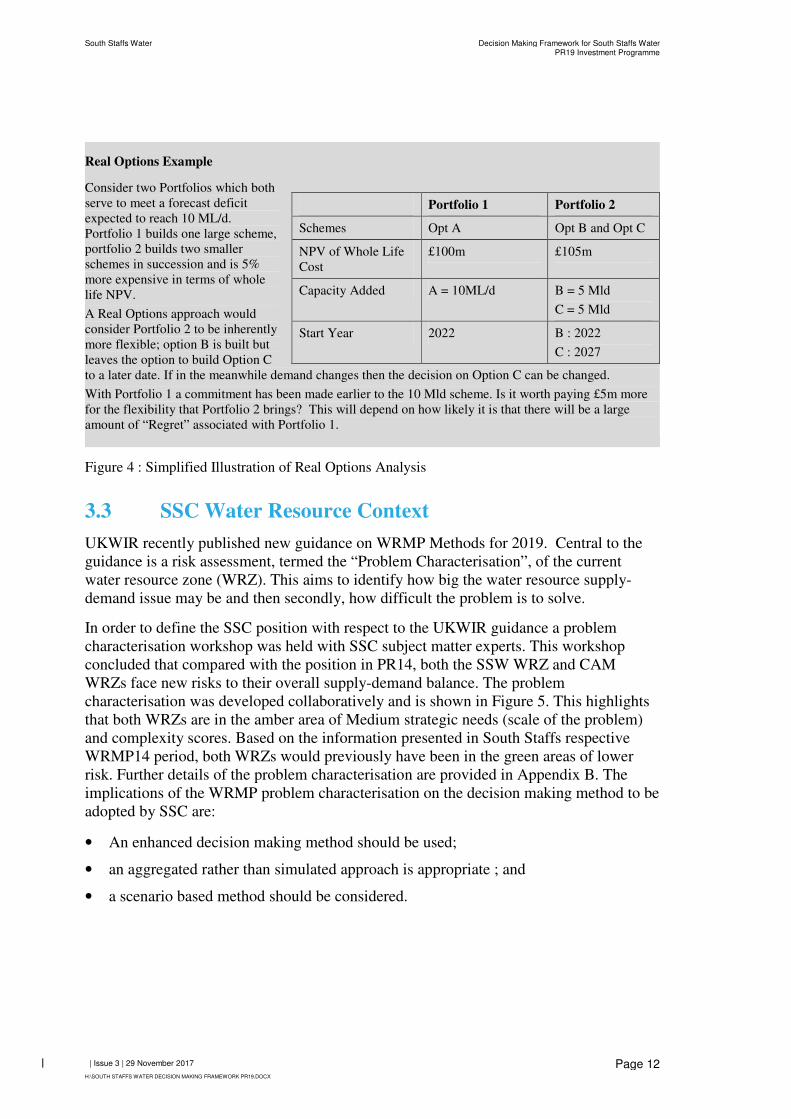
Real Options Example
Consider two Portfolios which both
serve to meet a forecast deficit
expected to reach 10 ML/d.
Portfolio 1 builds one large scheme,
portfolio 2 builds two smaller
schemes in succession and is 5%
more expensive in terms of whole
life NPV.
A Real Options approach would
consider Portfolio 2 to be inherently
more flexible; option B is built but
leaves the option to build Option C
to a later date. If in the meanwhile demand changes then the decision on Option C can be changed.
With Portfolio 1 a commitment has been made earlier to the 10 Mld scheme. Is it worth paying £5m more
for the flexibility that Portfolio 2 brings? This will depend on how likely it is that there will be a large
amount of “Regret” associated with Portfolio 1.
Portfolio 1 Portfolio 2
Schemes Opt A Opt B and Opt C
NPV of Whole Life
Cost
£100m £105m
Capacity Added A = 10ML/d B = 5 Mld
C = 5 Mld
Start Year 2022 B : 2022
C : 2027
Figure 4 : Simplified Illustration of Real Options Analysis
3.3 SSC Water Resource Context
UKWIR recently published new guidance on WRMP Methods for 2019. Central to the
guidance is a risk assessment, termed the “Problem Characterisation”, of the current
water resource zone (WRZ). This aims to identify how big the water resource supply-
demand issue may be and then secondly, how difficult the problem is to solve.
In order to define the SSC position with respect to the UKWIR guidance a problem
characterisation workshop was held with SSC subject matter experts. This workshop
concluded that compared with the position in PR14, both the SSW WRZ and CAM
WRZs face new risks to their overall supply-demand balance. The problem
characterisation was developed collaboratively and is shown in Figure 5. This highlights
that both WRZs are in the amber area of Medium strategic needs (scale of the problem)
and complexity scores. Based on the information presented in South Staffs respective
WRMP14 period, both WRZs would previously have been in the green areas of lower
risk. Further details of the problem characterisation are provided in Appendix B. The
implications of the WRMP problem characterisation on the decision making method to be
adopted by SSC are:
• An enhanced decision making method should be used;
• an aggregated rather than simulated approach is appropriate ; and
• a scenario based method should be considered.
South Staffs Water Decision Making Framework for South Staffs WaterPR19 Investment Programme
| Issue 3 | 29 November 2017
H:\SOUTH STAFFS WATER DECISION MAKING FRAMEWORK PR19.DOCX
Page 13
Figure 5: WRMP Problem Characterisation
3.4 Proposed Decision Making Method
With ideas from within the latest UKWIR guidance, the EBSD methodology can be
adapted to include multiple criteria for judging investments against non-financial criteria.
This addresses one of the major flaws that some people have had with the EBSD
methodology which originally set out that a single metric of cost was used to judge
competing investments and that non-financial criteria (environmental, social) were
monetised
It is proposed that a Multi Criteria Analysis (MCA) using an extended aggregated
approach is the basis of the new framework. It is a sufficiently flexible approach to
enable a range of sensitivity and scenario analysis to be developed to build confidence in
the final decision. This is to help ensure that investments are appraised on a range of
relevant criteria in line with the latest UKWIR WRMP guidance. Utilising the aggregated
approach in PR19 is considered the most pragmatic approach and a first step to applying
a more rigorous set of methods for the future.
The key drivers behind the changes to the level of risk are:
• A wider appreciation of drought resilience which means that both SSW and CAM may be vulnerable to
droughts that are different to those experienced historically.
• Wider resilience issues affecting both WRZs; in South Staffs there is a potential decline in the volume, quality
and reliability of available water resource without the renewal of long term treatment work assets, whereas in
Cambridge there are long term growth concerns and regulatory pressures on abstractions licenses.
• High level concerns due to regulatory pressures on abstraction licenses which are leading to license claw back
and sustainability reductions.
• In South Staffs added complexity is introduced due to the limited flexibility of the current water supply
network which potentially requires parallel upgrades to the two strategic treatment works.
• In Cambridge, long term regional growth is being encouraged by government but with large uncertainty over
the amount and timing.
• In Cambridge a limited amount of new supply side options are available which require consideration of
intercompany bulk import supply side solutions with associated additional uncertainty in timing, costs and
access.
South Staffs Water Decision Making Framework for South Staffs WaterPR19 Investment Programme
| Issue 3 | 29 November 2017
H:\SOUTH STAFFS WATER DECISION MAKING FRAMEWORK PR19.DOCX
Page 14
4 Development of the Decision Making
Framework
4.1 The SSC Context
In order to help develop the framework a series of workshops were held with SSC subject
matter experts and the SSC Executive Committee. These were as follows:
• Workshop 1: The bespoke Arup Drivers of Change methodology was utilised to help
identify the future impacts on the business and the core outcomes required of the
business. The outputs of this exercise are summarised in Table 1 and help set the
context for the investment decision making framework.
• Workshop 2: A water resources risk based problem characterisation for the South
Staffs and Cambridge region was jointly developed with SSC subject matter experts.
This followed the latest UKWIR guidance and was utilised to guide the choice of
decision making methods.
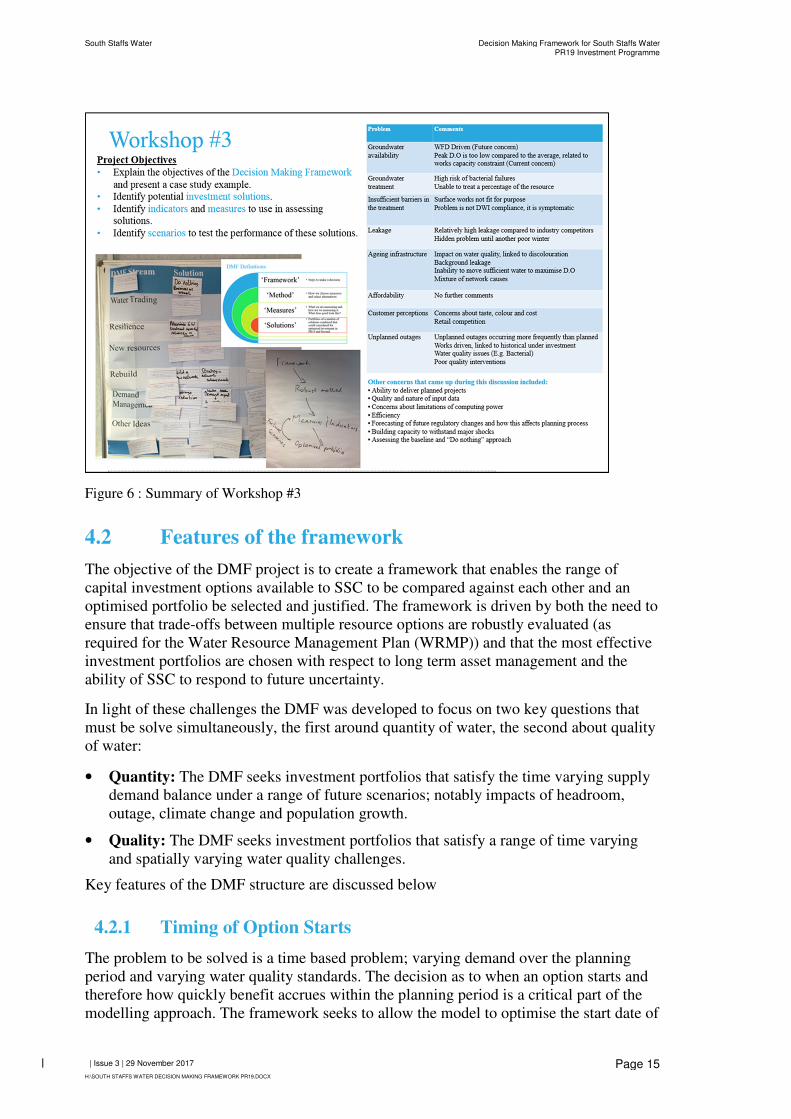
• Workshop 3: The focus of the third workshop was on the identification and selection
of indicators to guide the decision making process. This workshop was instrumental
in the design of the DMF that is presented in subsequent chapters of this report.
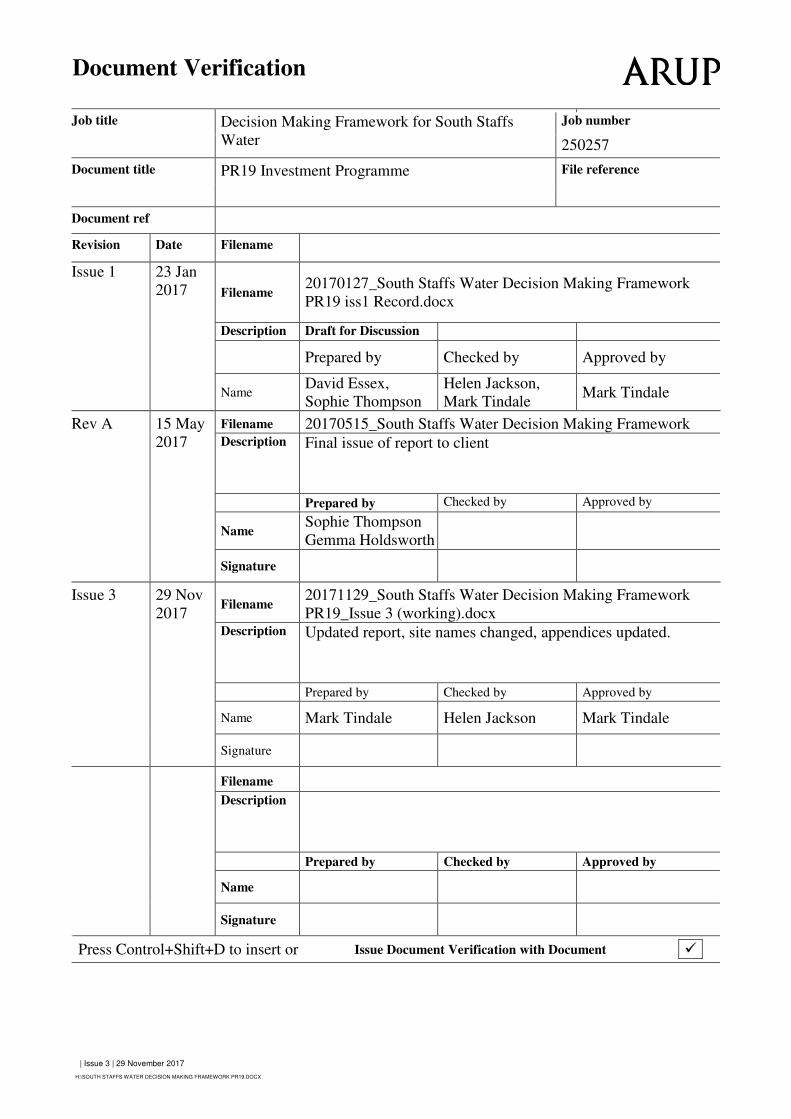
Figure 6 shows an extract from this workshop.
• Resilience Workstream: In parallel to the workshops a separate piece of work was
undertaken to develop a definition and measurement of resilience relevant to SSC.
Further details of the above are provided in the Appendices.
Table 1: Drivers and Outcome Delivery Incentives (ODIs)
Working Group Drivers Exec Drivers SSC’s ODIs
Raw availability Ability to meet demand Excellent water quality, now and in
the future
Fit for purpose system (now) Ability to meet Quality
Requirements
Secure and reliable supplies, now
and in the future
Resilience Ability to Influence
Demand
Excellent customer experience to
customers and community
Population growth and location Operations that are environmental
sustainable
Large scale effective demand
management
Provide shareholder
return
Fair Customer bills and fair investor
returns
Harnessing opportunities for
technological development
Ability to adapt in the
future
-
South Staffs Water Decision Making Framework for South Staffs WaterPR19 Investment Programme
| Issue 3 | 29 November 2017
H:\SOUTH STAFFS WATER DECISION MAKING FRAMEWORK PR19.DOCX
Page 15
Figure 6 : Summary of Workshop #3
4.2 Features of the framework
The objective of the DMF project is to create a framework that enables the range of
capital investment options available to SSC to be compared against each other and an
optimised portfolio be selected and justified. The framework is driven by both the need to
ensure that trade-offs between multiple resource options are robustly evaluated (as
required for the Water Resource Management Plan (WRMP)) and that the most effective
investment portfolios are chosen with respect to long term asset management and the
ability of SSC to respond to future uncertainty.
In light of these challenges the DMF was developed to focus on two key questions that
must be solve simultaneously, the first around quantity of water, the second about quality
of water:
• Quantity: The DMF seeks investment portfolios that satisfy the time varying supply
demand balance under a range of future scenarios; notably impacts of headroom,
outage, climate change and population growth.
• Quality: The DMF seeks investment portfolios that satisfy a range of time varying
and spatially varying water quality challenges.
Key features of the DMF structure are discussed below
4.2.1 Timing of Option Starts
The problem to be solved is a time based problem; varying demand over the planning
period and varying water quality standards. The decision as to when an option starts and
therefore how quickly benefit accrues within the planning period is a critical part of the
modelling approach. The framework seeks to allow the model to optimise the start date of
South Staffs Water Decision Making Framework for South Staffs WaterPR19 Investment Programme
| Issue 3 | 29 November 2017
H:\SOUTH STAFFS WATER DECISION MAKING FRAMEWORK PR19.DOCX
Page 16
options with varying impact on performance criteria and maximising the ability to
achieve a no-regrets decision. For example delaying a decision to the latest possible start
date retains the most flexibility for future decisions.
The framework is based on an annual time step. The magnitude of the problem is set for
each year of the planning period and varies through the planning period, the optimisation
model is required to identify portfolios of solutions that satisfy the problem in each year
of the planning period. For each year of the planning period the model accrues scores
against performance indicators based on the options that have been utilised; therefore the
earlier that a high scoring option is implemented the greater the performance score over
the whole planning period.
4.2.1.1 Capacity versus utilisation
A consideration of utilisation is very valid in a WRMP context with seasonal variations in
demand meaning that a balanced view of variable opex over the year should inform any
cost based decision.
Different types of options tend to have very different relationships between fixed and
variable costs. Since South Staffs are considering various option types then it makes
sense to consider both Fixed and Variable Opex in the decision and to provide for an
output in terms of different utilisation levels.
Certain options with relatively low Capex/high Variable Opex may be cost-effective if
their anticipated use is only in Peak Periods. Modelling utilisation of schemes allows this
to form part of the optimisation decision.
4.2.1.2 Interdependencies
Water resources options may typically be interdependent in some way. For example, in a
limited yield situation, two surface water options with potential yields of 0.5 ML/d and
0.8 ML/d may not have combined benefit of 1.3 ML/d if both are chosen.
In construction options it is common to have a one way dependency, for example, an
initial build A, could be followed by an extension build B. This implies that A can be
selected without choosing B. However, B cannot be selected without A having been
selected and constructed.
Within an aggregated modelling approach as is being proposed here for SSC, there are
limitations to the representation of interactions of sources. For very complex situations
of conjunctive use, a system simulation would be needed to fully represent those
interactions. It is however entirely feasible to pre-define certain logical relationships and
to ensure that a portfolio is only considered to be a candidate solution if it respects those
relationships. Typical dependencies included within the framework are shown below:
South Staffs Water Decision Making Framework for South Staffs WaterPR19 Investment Programme
| Issue 3 | 29 November 2017
H:\SOUTH STAFFS WATER DECISION MAKING FRAMEWORK PR19.DOCX
Page 17
Type of
Relationship
Data
Required
Example Constraint on the
Solution
Example Options
Mutually
Exclusive
Groups
Groupings of
Options
ME Group 1 =
{Opt1, Opt 2, Opt3}
Maximum of one
Option from the
group can be
included
Variants of Metering Schemes
Variants of a Build Scheme
Mutually
Inclusive
Groups
Groupings of
Options
MI Group 1 =
{Opt4, Opt5}
Neither Option
Or
Both Options
must be included
Option 5 is an upgrade option with no
direct benefit.
Option 5 enables the benefits for
Option 4 to be realised.
One Way
Dependence
Pairing,
direction.
Prerequisite =-Option6
Dependent = Option7
Can only choose
Option 7 if Option
6 has been chosen
at some time
earlier in the
schedule.
Can choose
Option 6 alone.
Option 6 = Phase 1 of a construction
scheme
Option 7 = a possible (but not
essential) Phase 2 of the same
scheme
Limited Yield Groupings and
Impact
LY group
Limit utilisation Two surface water schemes on same
river. Subject to a total yield limit.
4.2.1.3 Uncertainty and Risk
The type of uncertainty most relevant to the SSC is outcome uncertainty which arises
when a range of outcomes that do not consider all possibilities are utilised in the planning
process. There is no obvious solution or tool that can remove or completely resolve the
issue of uncertainty from the decision making process. However, there are techniques that
can be applied in the planning process to ensure that the decision making outcomes
remain robust and flexible even in the face of uncertainty. These are:
• Sensitivity analysis; this allows the modeller to understand the circumstances under
which the optimal solution changes. The optimal strategy is said to be robust if it is
insensitive to changes in parameters. The DMF has been set up to allow sensitivity of
key elements to be tested (for example variations in resource yield).
• Scenario analysis is a technique that allows
the performing of multiple sensitivity
analyses at the same time. It involves
describing uncertainty using a means of a set
of possible future outcomes called
‘scenarios’. Scenario analysis gives the
modeller an ability to reduce uncertainty in
the decision making process by exploring the
performance of the model under different
future conditions and selecting portfolios that
delay the decision point to the latest possible
date. The DMF has been established in order
that the impact of alternative future scenarios
around both demand and water quality can be
tested.
Figure 7 : Impact of different future scenarios
South Staffs Water Decision Making Framework for South Staffs WaterPR19 Investment Programme
| Issue 3 | 29 November 2017
H:\SOUTH STAFFS WATER DECISION MAKING FRAMEWORK PR19.DOCX
Page 18
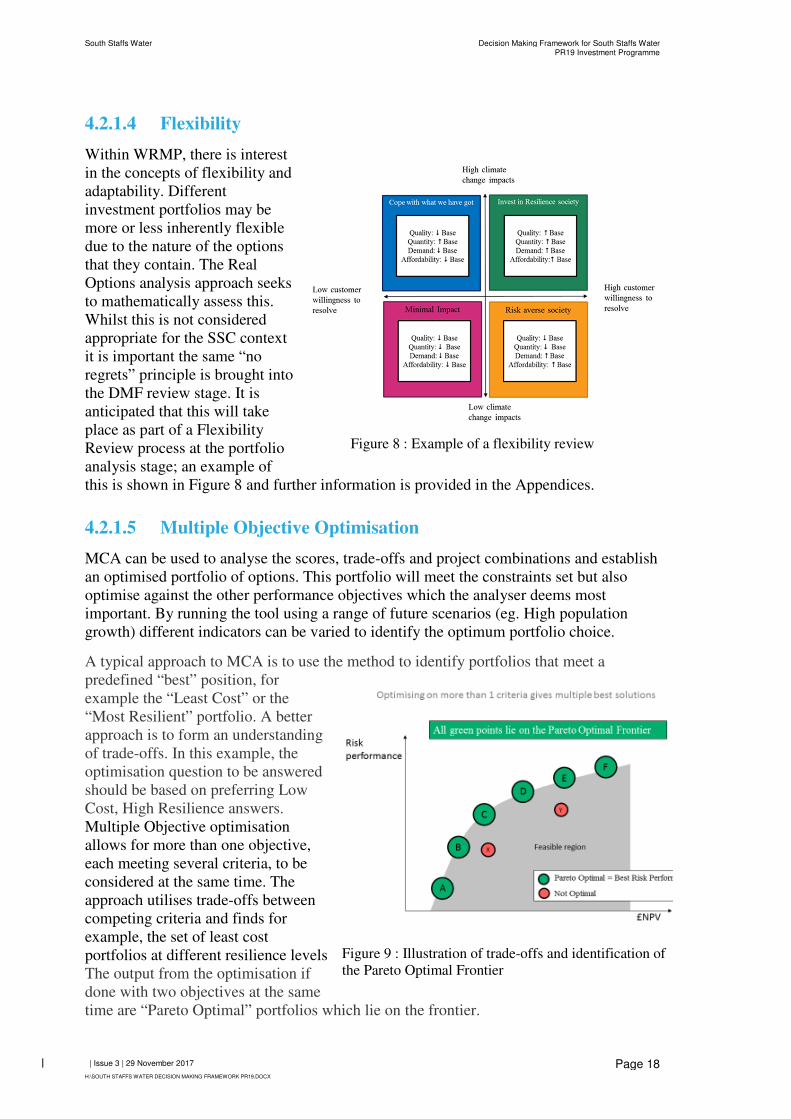
4.2.1.4 Flexibility
Within WRMP, there is interest
in the concepts of flexibility and
adaptability. Different
investment portfolios may be
more or less inherently flexible
due to the nature of the options
that they contain. The Real
Options analysis approach seeks
to mathematically assess this.
Whilst this is not considered
appropriate for the SSC context
it is important the same “no
regrets” principle is brought into
the DMF review stage. It is
anticipated that this will take
place as part of a Flexibility
Review process at the portfolio
analysis stage; an example of
this is shown in Figure 8 and further information is provided in the Appendices.
4.2.1.5 Multiple Objective Optimisation
MCA can be used to analyse the scores, trade-offs and project combinations and establish
an optimised portfolio of options. This portfolio will meet the constraints set but also
optimise against the other performance objectives which the analyser deems most
important. By running the tool using a range of future scenarios (eg. High population
growth) different indicators can be varied to identify the optimum portfolio choice.
A typical approach to MCA is to use the method to identify portfolios that meet a
predefined “best” position, for
example the “Least Cost” or the
“Most Resilient” portfolio. A better
approach is to form an understanding
of trade-offs. In this example, the
optimisation question to be answered
should be based on preferring Low
Cost, High Resilience answers.
Multiple Objective optimisation
allows for more than one objective,
each meeting several criteria, to be
considered at the same time. The
approach utilises trade-offs between
competing criteria and finds for
example, the set of least cost
portfolios at different resilience levels
The output from the optimisation if
done with two objectives at the same
time are “Pareto Optimal” portfolios which lie on the frontier.
Figure 8 : Example of a flexibility review
Figure 9 : Illustration of trade-offs and identification of
the Pareto Optimal Frontier
South Staffs Water Decision Making Framework for South Staffs WaterPR19 Investment Programme
| Issue 3 | 29 November 2017
H:\SOUTH STAFFS WATER DECISION MAKING FRAMEWORK PR19.DOCX
Page 19
The trade-offs approach is inherent to the framework outlined in this document. The aim
is to guide the decision making process through visibility of trade-offs between timing,
performance, impacts and cost. To this end, indicators do not have the same unit of
measurement as would be the case in a monetised framework, instead they are designed
to enable competing impacts to be balanced in a meaningful way. Figure 9 illustrates the
trade-off approach, all portfolios in the grey area are feasible but those on the frontier are
optimal.
South Staffs Water Decision Making Framework for South Staffs WaterPR19 Investment Programme
| Issue 3 | 29 November 2017
H:\SOUTH STAFFS WATER DECISION MAKING FRAMEWORK PR19.DOCX
Page 20
5 Framework Structure
This chapter sets out the full structure of the Decision Making Framework and the
required data inputs. It is split in two sections:
• Problem Definition; components of the framework that define the problem that
the model must solve.
• Option Assessment; details of the metrics used to measure the performance of all
investment options entered into the model.
5.1 Problem Definition
The framework has been developed to identify feasible portfolios of options that address
two primary future scenarios and one secondary scenario criteria as follows:
• Quantity; the selected portfolio must, as a minimum, be able to meet the water
resource zone supply demand balance for every year of the planning period.
• Quality; all options within the selected portfolio must meet the water quality target
set for the location. Options are only eligible for selection in any given year if they
meet the water quality target of that year.
• Affordability; a secondary criteria of maximum annual and AMP based expenditure
is also included within the functionality of the framework.
5.1.1 Quantity
For each year of the planning period the DMF requires the demand requirements to be set
for each water resource zone (wrz). This is the volume of water required for the zone
including allowances for headroom, climate change and population growth. In line with
water resource management planning guidelines, and in order to understand the normal
operating scenario, the annual demand in the framework is set as a three tier problem:
• Dry year annual average (DYAA)
• Dry year critical period (DYCP)
• Normal year annual average (NYAA)
In any year of the planning period the combination of options selected must be able to
deliver the volume required for each of these scenarios as a minimum. The model is free
to provide a volume greater than that required and subsequently partially utilise some
sources; utilisation in any given year is thus an indicator of the flexibility and an
important item of analysis. All volumes are mega litres per day (Mld).
In order to understand the impact of different population growth and climate change
projections it is envisaged that a series of different future demand projections are
generated that reflect different futures. Different portfolios would be generated by the
DMF to meet each of the scenarios and the output tested with respect to uncertainty and
flexibility. This is discussed further in section 6.
South Staffs Water Decision Making Framework for South Staffs WaterPR19 Investment Programme
| Issue 3 | 29 November 2017
H:\SOUTH STAFFS WATER DECISION MAKING FRAMEWORK PR19.DOCX
Page 21
5.1.2 Quality
The water quality component of the DMF is a result of the treatment challenges
experienced by SSC and the subsequent generation of the Long Term plan in conjunction
with the regulators. The company needs to ensure that investments related to a particular
source will deliver the required water quality both now and in the future against a range
of possible future challenges. The key questions faced by the company are, firstly the
level of current and future water quality risk that should exist across its sources and
secondly the speed at which improvements in the management of that risk against both
current and possible future challenges should be deployed. There are choices to be made
and trade-offs to consider in terms of the degree of sophistication, future proofing and
flexibility for future adaption depending on the pace and scale of emerging challenges.
There is likely to be more than one acceptable solution to the various quality issues, and
thus a degree of potential for different optimised portfolios.
Water quality is impacted by both external and internal factors and investment decisions
need to take account of known and likely changes to both. External factors such as raw
water quality arriving at abstraction points, pollution, climate change impacts on water
quality, peak summer temperatures and third party contamination can all be assessed in
terms of risks, historic information and assumptions made on current and future
challenges.
Assessments of water quality cover a wide range of parameters and it is not the intention
of this framework to provide a detailed analysis water quality; its purpose is to allow
comparison between different investment options. In conjunction with SSC’s water
quality experts, a series of high level water quality metrics have been identified against
which the performance of investment options can be assessed, these are as follows:
• Micro biology; E Coli, Coliforms, Clostridia, Cryptosporidia
• Pesticides; Nitrates, Metaldehyde
• THM potential
• Aesthetic / Discolouration potential; Iron, Manganese and Aluminium
A risk based approach to performance against these metrics was developed with SSC, and
is shown in Figure 10. At the left hand end of the scale is low performance and at the
right hand end is high performance, in all cases compliance is achieved.
For each source of water a target performance is set in the DMF that varies with time.
The target performance is based upon known current challenges, possible future
challenges and the company approach to managing water quality risk. The time based
nature of the framework allows the impact of future uncertainty to be tested through
different water quality scenarios; Figure 11 shows how these scenarios are inputted.
Within the DMF the quality target acts as binary switch; investment options are either
able to meet the required quality target at a given capacity in the given year, or they do
not. If they do not meet the target in a given year then they cannot be selected although
they could have been utilised in other years when there is reduced quality target. This
enables options to be utilised in the early part of the planning period but then removed or
downgraded in later years if the quality target has been increased or the raw quality has
deteriorated.
South Staffs Water Decision Making Framework for South Staffs WaterPR19 Investment Programme
| Issue 3 | 29 November 2017
H:\SOUTH STAFFS WATER DECISION MAKING FRAMEWORK PR19.DOCX
Page 22
Figure 10 : Water Quality Targets
Figure 11 : Template for entering water quality target scores per source
Water Quality Grade
1 3 5 7 10
Micro biology
E Coli, Coliforms, Clostridia, Cryptosporidia
Nitrates
Metaldehyde
Aesthetic / Discolouration potential
Fe, Mn, Al criteria
Al 30 ug/l
Fe 20 ug/l
Mn 15 ug/l
Al 25 ug/l
Fe 18 ug/l
Mn 10 ug/l
Al 15 µg/l
Fe 15 µg/l
Mn 5 µg/l
Al 10 ug/l
Fe 10 ug/l
Mn 1 ug/l
Al 5 ug/l
Fe 5 ug/l
Mn 0.5 µg/l
Unacceptable likelihood of failing to
meet regulatory compliance,
performance significantly lower than
industry norm.
Low likelihood of failure, low end
performance
Minimal likelihood of non-compliance but
low performance with respect to the
industry
Minimal likelihood of non-compliance but
average with respect to the overall water
quality
Minimal likelihood of non-compliance
with excellent water quality performance
for customers
Higher Water Quality Risk Lower Water Quality Risk
Source Name: Enter source name Standards to achieve (1,3,5,7,10) 5 Yearly blocks
Year 1 Year 2 Year 3 Year 4 Year 5 Year 6 Year 6 Year 8 Year 9 Year 10 3rd AMP 4th AMP 5th AMP 6th AMP 7th AMP 8th AMP
ex works compliant Score
E Coli
Coliforms
Clostridia
Cryptosporidia
Pesticides Pesticides
Nitrates Nitrates
THM formation potential THM formation potential
Metaldehyde Metaldehyde
Al
Fe
Mn
Enter target scores
(1,3,5,7) for the
source for each year
of the planning
period, based on
current and future
raw water quality
challenges.
Quality Problem Settings
Micriobiology
Future AMPsNext AMP Following AMP
Aesthetic / Discolouration
potential
South Staffs Water Decision Making Framework for South Staffs WaterPR19 Investment Programme
| Issue 3 | 29 November 2017
H:\SOUTH STAFFS WATER DECISION MAKING FRAMEWORK PR19.DOCX
Page 23
5.1.3 Affordability
Additional functionality has been included in the DMF to allow the annual and AMP
based Totex to be capped. This is intended as a proxy measure for affordability and
enables portfolios to be generated within the constraint of set expenditure limits. It is
anticipated that this functionality will be used towards the end of the business planning
process to guide the final portfolio selection.
5.2 Option Assessment
Each investment option that is entered into the DMF must be assessed against the
capability and performance criteria as shown in Figure 12.
Figure 12 Framework structure
The option capability criteria are those measures that quantify the ability of an option to
meet the quantity and quality problem definition as described previously; these are
absolute measures of capability.
The performance criteria are those measures that enable the DMF to optimise the
portfolio against competing factors that are not directly comparable, these are:
• Totex; whole life cost assessment of the options using a single discount factor set for
the whole framework allowing least cost optimisation to the undertaken.
• Resilience; Operational resilience of an option in meeting constraints and the ability
to adapt to change.
• Deliverability; Ease of implementing an option.
• Environmental Sustainability; Operational impact on the environment, including
carbon, biodiversity and sustainable abstraction.
• Customer Preference; the extent to which the option is in line with customer
preference.
Each of the criteria are further discussed below.
South Staffs Water Decision Making Framework for South Staffs WaterPR19 Investment Programme
| Issue 3 | 29 November 2017
H:\SOUTH STAFFS WATER DECISION MAKING FRAMEWORK PR19.DOCX
Page 24
5.2.1 Option Capability
5.2.1.1 Quantity
The quantity indicator seeks to demonstrate how each option will contribute to the supply
demand balance. All options will be required to show the quantity impact described in
terms of annual Mega litres per day (Ml/d) including a range of uncertainty. These are
against the following planning scenarios:
• Dry year annual average (DYAA)
• Normal year annual average (NYAA)
• Dry Year Critical Period (DYCP)
In order to reflect the uncertainty that commonly exists in the calculation of resource
yield at the planning stage, the framework requires users to enter a worst case and best
case as well as their normal estimate. This enables the sensitivity of resource projections
to be tested in the outputs. It should be noted that the DMF yield figures below may be
reduced under some water quality targets, this is discussed in the section below.
Savings from demand management (DM) measures are entered as an annual saving
through each year of the option, data entered into year 40 is assumed to be a residual
benefit and will be applied in every subsequent year of the planning period. Figure 13
shows how quantity data is entered into the framework.
Supply capacity
Ml/d
Dry year annual
average
(DYAA)
Normal year
annual average
(NYAA)
Dry Year Critical
Period
(DYCP)
Extreme
scenario yield
esimate
Lower Yield
Estimate
Best Central
Yield Estimate
Quantity (Ml/d)
provided by Option
Demand reduction profile
Year
Ml/d 1 2 3 4 5 …. 40+
Lower
Estimate
Best Central
Estimate
Upper
Estimate
Annual water
saving from
demand
management
measures
Figure 13 : Quantity Inputs
South Staffs Water Decision Making Framework for South Staffs WaterPR19 Investment Programme
| Issue 3 | 29 November 2017
H:\SOUTH STAFFS WATER DECISION MAKING FRAMEWORK PR19.DOCX
Page 25
5.2.1.2 Quality (Treatment Capability)
Provision of water at the right quality is an essential part of SSC’s operation and licence
to operate. The ability to meet this performance requirement is a core consideration in
relation to new investment decisions.
Individual options presented to the framework must state the quality standard which can
be achieved with respect to the quality performance standards. In some instances the
treatment performance standard is proportional to the volumetric output (for example a
progressive rebuild of the works); the quality input data is therefore linked to a maximum
works output. If the option is selected, the maximum volumetric output that the DMF can
utilise in the supply demand balance is the lower of the maximum works output at a
required quality standard and the yield as described in section 5.2.1.1.
Figure 14: Water quality leaving treatment works (ex works)
5.2.2 Option Performance Measurement
5.2.2.1 Cost
It is recognised that while decisions made on cost alone do not support holistic business
and service improvement, cost remains crucial together with the provision of shareholder
returns and fair customer billing.
Business investment costs are typically measured in the water industry in terms of total
expenditure ‘totex’ which references whole-life costs as opposed to traditional capital
expenditure (‘capex’) and operational expenditure (‘opex’) cost models. Ofwat
introduced ‘totex’ in PR14 in an attempt to move the industry away from capital intensive
solutions that provided return on regulatory capital value (RCV) but which were not
necessarily the most sustainable, socially acceptable or lowest whole life cost solutions.
The original methods of appraising a decision on different cost bases was often
Quality - Deployable Output
Raw Water Source Enter source reference IDEnter name of the source
Water Quality Indicator
Performance Level
[Column A]
Output
(Ml/d)
[Column B]
Performance Level
[Column C]
Output
(Ml/d)
[Column D]
Performance Level
[Column E]
Output
(Ml/d)
[Column F]
Micro Biology
Pesticides
Nitrates
Metaldehyde
THM Potential
Asethetic Discolouration
Notes:
1) When completing this worksheet it is essential to refer to the raw water quality target for the source. If the option does not meet the target, it will not be selected.
2) It is mandatory to complete columns A and B, columns C to F are optional and only required if a change in output would change the water quality performance level
Target Levels
Performance level
Water Quality Indicator 1 3 5 7 10
Micro biology
E Coli, Coliforms, Clostridia, Cryptosporidia
Nitrates
Metaldehyde
Aesthetic / Discolouration potential
Fe, Mn, Al criteria
Al 30 ug/l
Fe 20 ug/l
Mn 15 ug/l
Al 25 ug/l
Fe 18 ug/l
Mn 10 ug/l
Al 15 µg/l
Fe 15 µg/l
Mn 5 µg/l
Al 10 ug/l
Fe 10 ug/l
Mn 1 ug/l
Al 5 ug/l
Fe 5 ug/l
Mn 0.5 µg/l
Unacceptable
likelihood of failing to
meet regulatory
compliance,
performance
significantly lower
than industry norm.
Low likelihood of
failure, low end
performance
Minimal likelihood of
non-compliance but
low performance with
respect to the
industry
Minimal likelihood of
non-compliance but
average with respect
to the overall water
quality
Minimal likelihood of
non-compliance with
excellent water
quality performance
for customers
South Staffs Water Decision Making Framework for South Staffs WaterPR19 Investment Programme
| Issue 3 | 29 November 2017
H:\SOUTH STAFFS WATER DECISION MAKING FRAMEWORK PR19.DOCX
Page 26
influenced by different incentives (or penalties) potentially resulting in a biased
comparison.
The framework utilises when assets are built. For each asset, the cost spend over the asset
lives is considered, knowing for example after how many years replacement costs are
expected to incur for each asset, and the construction period over which the initial capex
spend is spread. The annual cost profiles of capex, opex and vopex costs are then
accounted starting from the first year of activation of selected schemes.
For each option, inputs will be required in annual minimum, medium and maximum
values for:
• Capital expenditure (£/yr)
• Capital Renewals (£/yr)
• Fixed operating costs (£/yr)
• Variable operating costs (£/ML)
• Network Costs and benefits (£/Ml)
Capital costs are split into “initial capex” and “replacement (or renewal) costs”. Initial
capex figures are non-recurring costs associated with the acquisition of fixed assets (e.g.
pipeline, land purchase), while replacement cost expenditure are asset replacement costs
required during the planning period. Figure 15 illustrates the cost breakdown concept
utilised in the framework.
Figure 15 : Application of cost data in the framework
All comparison of costs is done on whole life cost using a discount factor set at a global
level in the framework, this enables sensitivity analysis on the discount factor to be
undertaken.
Each component of the cost data is discussed further below.
Point at which water is available for use, CAPEX may continue beyond this point.
South Staffs Water Decision Making Framework for South Staffs WaterPR19 Investment Programme
| Issue 3 | 29 November 2017
H:\SOUTH STAFFS WATER DECISION MAKING FRAMEWORK PR19.DOCX
Page 27
Capital Expenditure
Financial capex reflects non-recurring costs associated with the acquisition of fixed
assets.
Initial capital expenditure (£’000): Physical structure or land purchase. Initial capital
expenditure may apply not only to supply-side schemes (e.g. new reservoirs) but also to
demand management measures that involve capital investment, such as new domestic
meters and leakage reduction (Figure 16).
The total construction period is the time that it takes for the benefit to commence. In
some instances, such as demand measures, benefit accrues immediately and so this period
will be set to zero although expenditure continues beyond year zero.
Figure 16: Capex inputs
Capital Renewals
Replacement expenditure (£’000): Data is either entered into the framework as periodic
costs against a defined set of asset classes (Figure 17) or as a cost profile through the
whole planning period.
Figure 17: Capital Renewals Input
Fixed Operational Expenditure (Fopex)
Fopex reflects costs incurred during the operation of an option that are fixed regardless of
changing levels of output, for example operating staff. These are expressed in £’000/year
and typically include staff costs (Figure 18).
Figure 18: Fixed Operating Costs Input
Variable Operational Expenditure (Vopex)
Vopex describes operational costs incurred during operational life of an option which
vary with changing levels of output. These are usually expressed in £/Ml/d and typically
reflect energy, chemical costs or network costs that vary depending upon the level of
utilisation of the option. (Figure 19)
Asset Class input SSW descriptions
Freq Renewal (Yrs) input SSW descriptions
low estimate should this be % of total capex or absolute £k?
mid estimate
max estimate
Lifecycle
Expenditure (£k)
Capital Renewals (£k)
South Staffs Water Decision Making Framework for South Staffs WaterPR19 Investment Programme
| Issue 3 | 29 November 2017
H:\SOUTH STAFFS WATER DECISION MAKING FRAMEWORK PR19.DOCX
Page 28
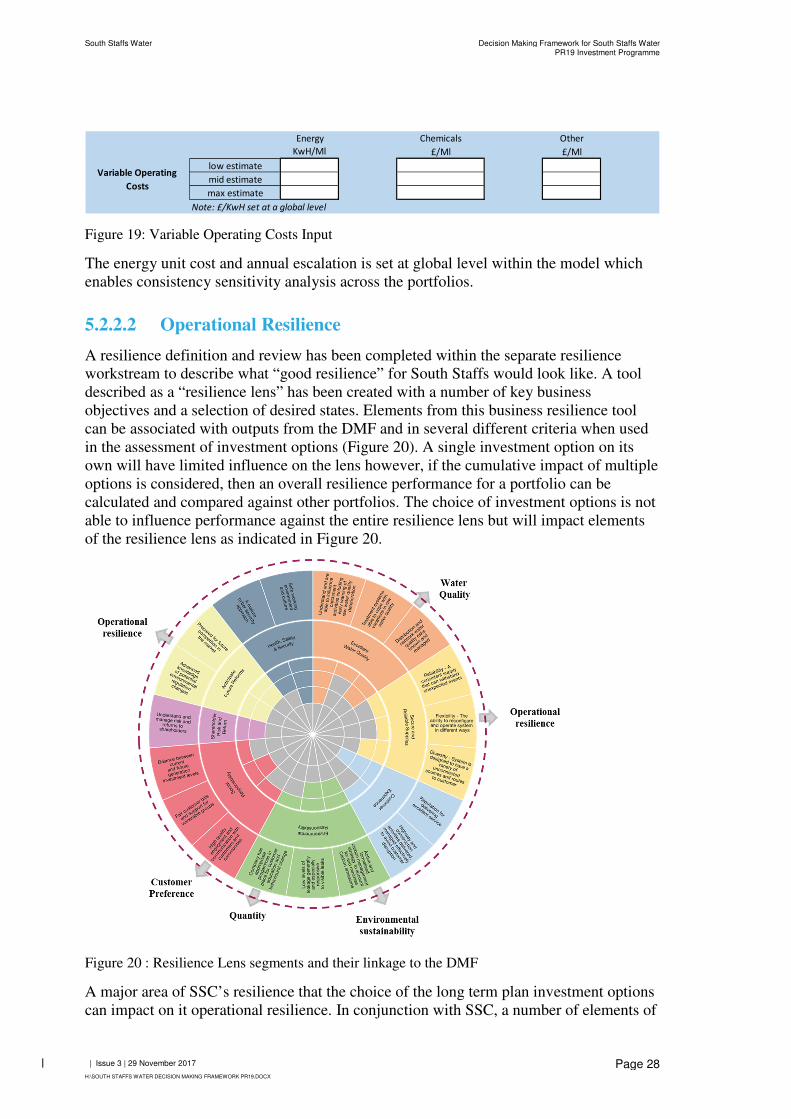
Figure 19: Variable Operating Costs Input
The energy unit cost and annual escalation is set at global level within the model which
enables consistency sensitivity analysis across the portfolios.
5.2.2.2 Operational Resilience
A resilience definition and review has been completed within the separate resilience
workstream to describe what “good resilience” for South Staffs would look like. A tool
described as a “resilience lens” has been created with a number of key business
objectives and a selection of desired states. Elements from this business resilience tool
can be associated with outputs from the DMF and in several different criteria when used
in the assessment of investment options (Figure 20). A single investment option on its
own will have limited influence on the lens however, if the cumulative impact of multiple
options is considered, then an overall resilience performance for a portfolio can be
calculated and compared against other portfolios. The choice of investment options is not
able to influence performance against the entire resilience lens but will impact elements
of the resilience lens as indicated in Figure 20.
Figure 20 : Resilience Lens segments and their linkage to the DMF
A major area of SSC’s resilience that the choice of the long term plan investment options
can impact on it operational resilience. In conjunction with SSC, a number of elements of
Energy Chemicals Other
KwH/Ml £/Ml £/Ml
low estimate
mid estimate
max estimate
Note: £/KwH set at a global level
Variable Operating
Costs
South Staffs Water Decision Making Framework for South Staffs WaterPR19 Investment Programme
| Issue 3 | 29 November 2017
H:\SOUTH STAFFS WATER DECISION MAKING FRAMEWORK PR19.DOCX
Page 29
operational resilience were considered for inclusion in the DMF, the selected categories
are listed below:
• The extent to which an option impacts the reliability of supply to customers at
the right volume and quality across the WRZ.
• The extent to which an option impacts the flexibility of supply options across the
WRZ.
• The extent to which an option impacts the diversity of supply options available in
the WRZ.
The purpose of the DMF is to assist SSC in making decisions about how best to meet the
supply demand balance in the long term through the replacement, upgrade or
abandonment of existing assets and resources. The assessment of operational resilience in
the DMF is therefore comparative rather than absolute; options are scored to show how
they impact the operational resilience of the WRZ when compared to other investment
options.
Each option is scored from zero to five, with the lowest score assigned to options that
have a low impact on resilience and the highest score to those that have the largest impact
on resilience. The factors considered in the scoring are shown in Figure 21.
Figure 21 : Operational Resilience
In order to allow comparison of options within the DMF a significance factor has been
applied to the resilience scores. This is the option’s volumetric output (Mld) as a fraction
of the total WRZ demand, thus a 10Mld option with a resilience score of 5 would have
the same overall score as a 50Mld option with a score of 1.
5.2.2.3 Deliverability
Deliverability describes the complexity of an option in terms of execution. More complex
solutions may provide a step change improvement but the benefits are less certain. A less
complex solution may be a quick win and simple to implement but may not provide
longevity of solution. For new technology there is also a risk that it will not work as well
as expected, or that it costs more than anticipated. The principle behind this indicator is
relevant to all five ODIs at South Staffs although water quality compliance and security
of supply are the most relevant. It provides a pragmatic means to measure the ease of an
Reliability Flexibility Diversity of supply
PrincipleThe degree of reliability of critical assets
- levels of unplanned outage
The degree of flexibility to reconfigure
system to respond to events
The degree of diversity of supplies
available; level of dependency on
sources.
Levels of drought susceptibility; range of yield
Level of competition for the resource
Physical location of the resource within the
network, ability to help support areas of single
source
Extent to which the WRZ deployable
output is dependent on this option
Treatment vulnerability; level of complexity,
difficulty of treatment, extent of dual
streaming, extent of bankside storage.
Experience of outage on existing sites
Ability to help the network recover, particularly
with respect to North South and South North
transfers
Extent to which the local network or area
of supply is dependent on this option.
Impact on discolouration eventsAbility to provide extra capacity from normal (peak
demand)
Score Enter Option Score (0 to 5) Enter Option Score (0 to 5) Enter Option Score (0 to 5)
Factors
South Staffs Water Decision Making Framework for South Staffs WaterPR19 Investment Programme
| Issue 3 | 29 November 2017
H:\SOUTH STAFFS WATER DECISION MAKING FRAMEWORK PR19.DOCX
Page 30
option in terms of development, implementation and operation to deliver a required
outcome.
Within the DMF deliverability is defined as follows:
Third Party Approvals - the degree of difficulty involved in obtaining permission to
undertake the option and the likelihood that the options will be approved. This
includes environmental impacts for example and effort associated with mitigating
unacceptable impacts, the costs of this are included in the totex figure. For example a
scheme which is located near or within an area of social or environmental
significance will incur significantly more complex and intensive third party approvals
and requirements.
Benefits Proven – the degree of confidence that the scheme will deliver anticipated
benefits. This is demonstrated through the strength of the evidence base of solution
benefits being demonstrated previously at scale in the water sector, and context
relevant to the scheme proposed (i.e. track record in material benefits). For example, a
well-established treatment technology may have a strong evidence base
demonstrating benefits but if it has never been applied at similar scale to that
proposed by SSC this option is less well proven than one which has a strong evidence
base at the relevant scale.
Operations Proven – the degree of confidence that South Staffs will be able to
operate, undertake or deliver the scheme without issue. This is based on both the
technology maturity and how well acquainted SSC are with the site, for example
introduction of an existing mothballed site would be more deliverable than the
introduction of a new resource.
Contractual Supply Chain Risk – Level of risk associated with suppliers and their
supply chain needs for scheme. This revolves around the number of players in the
supply chain with whom SSC do not already have existing or trusted relationships.
Each new relationship represents an additional element of risk within the scheme as
issues are more likely to arise within new relationships where expectations are not as
well established and understood as in long standing supply chain relationships.
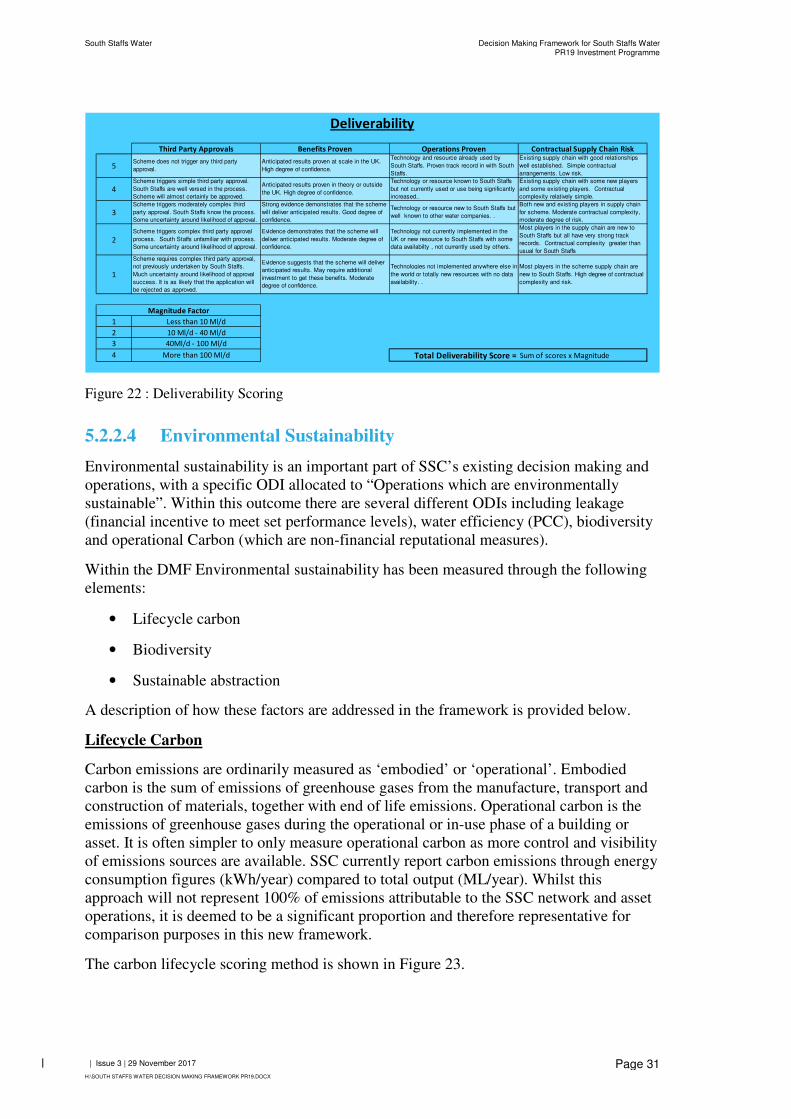
The scoring matrix is shown in Figure 22.
South Staffs Water Decision Making Framework for South Staffs WaterPR19 Investment Programme
| Issue 3 | 29 November 2017
H:\SOUTH STAFFS WATER DECISION MAKING FRAMEWORK PR19.DOCX
Page 31
Figure 22 : Deliverability Scoring
5.2.2.4 Environmental Sustainability
Environmental sustainability is an important part of SSC’s existing decision making and
operations, with a specific ODI allocated to “Operations which are environmentally
sustainable”. Within this outcome there are several different ODIs including leakage
(financial incentive to meet set performance levels), water efficiency (PCC), biodiversity
and operational Carbon (which are non-financial reputational measures).
Within the DMF Environmental sustainability has been measured through the following
elements:
• Lifecycle carbon
• Biodiversity
• Sustainable abstraction
A description of how these factors are addressed in the framework is provided below.
Lifecycle Carbon
Carbon emissions are ordinarily measured as ‘embodied’ or ‘operational’. Embodied
carbon is the sum of emissions of greenhouse gases from the manufacture, transport and
construction of materials, together with end of life emissions. Operational carbon is the
emissions of greenhouse gases during the operational or in-use phase of a building or
asset. It is often simpler to only measure operational carbon as more control and visibility
of emissions sources are available. SSC currently report carbon emissions through energy
consumption figures (kWh/year) compared to total output (ML/year). Whilst this
approach will not represent 100% of emissions attributable to the SSC network and asset
operations, it is deemed to be a significant proportion and therefore representative for
comparison purposes in this new framework.
The carbon lifecycle scoring method is shown in Figure 23.
Third Party Approvals Benefits Proven Operations Proven Contractual Supply Chain Risk
5Scheme does not trigger any third party
approval.
Anticipated results proven at scale in the UK.
High degree of confidence.
Technology and resource already used by
South Staffs. Proven track record in with South
Staffs.
Existing supply chain with good relationships
well established. Simple contractual
arrangements. Low risk.
4Scheme triggers simple third party approval.
South Staffs are well versed in the process.
Scheme will almost certainly be approved.
Anticipated results proven in theory or outside
the UK. High degree of confidence.
Technology or resource known to South Staffs
but not currently used or use being significantly
increased..
Existing supply chain with some new players
and some existing players. Contractual
complexity relatively simple.
3Scheme triggers moderately complex third
party approval. South Staffs know the process.
Some uncertainty around likelihood of approval.
Strong evidence demonstrates that the scheme
will deliver anticipated results. Good degree of
confidence.
Technology or resource new to South Staffs but
well known to other water companies. .
Both new and existing players in supply chain
for scheme. Moderate contractual complexity,
moderate degree of risk.
2
Scheme triggers complex third party approval
process. South Staffs unfamiliar with process.
Some uncertainty around likelihood of approval.
Evidence demonstrates that the scheme will
deliver anticipated results. Moderate degree of
confidence.
Technology not currently implemented in the
UK or new resource to South Staffs with some
data availabilty , not currently used by others.
Most players in the supply chain are new to
South Staffs but all have very strong track
records. Contractual complexity greater than
usual for South Staffs
1
Scheme requires complex third party approval,
not previously undertaken by South Staffs.
Much uncertainty around likelihood of approval
success. It is as likely that the application will
be rejected as approved.
Evidence suggests that the scheme will deliver
anticipated results. May require additional
investment to get these benefits. Moderate
degree of confidence.
Technologies not implemented anywhere else in
the world or totally new resources with no data
availability. .
Most players in the scheme supply chain are
new to South Staffs. High degree of contractual
complexity and risk.
1 Less than 10 Ml/d
2 10 Ml/d - 40 Ml/d
3 40Ml/d - 100 Ml/d
4 More than 100 Ml/d Total Deliverability Score = Sum of scores x Magnitude
Deliverability
Magnitude Factor
South Staffs Water Decision Making Framework for South Staffs WaterPR19 Investment Programme
| Issue 3 | 29 November 2017
H:\SOUTH STAFFS WATER DECISION MAKING FRAMEWORK PR19.DOCX
Page 32
Figure 23: Carbon scoring
The average energy consumption per year in full operation is calculated. This is then
divided by the expected output from the option to quantify KWh per ML. This is
multiplied by the emissions factor provided in the current UKWIR workbook.
The emissions result is then compared with the corporate total figure (currently
0.48TonnesCO2e/ML) and a score assigned. The final carbon score is calculated by
multiplying the assigned comparative score by the volumetric output of the option.
Biodiversity
Biodiversity represents the variety and population of animals and plants and the
effectiveness of the natural systems that support them. Measuring changes in Biodiversity
in a business’ decision making demonstrates stewardship and social responsibility in this
area.
In 2010, the UK was a signatory to Convention of Biological Targets, where a set of 20
global targets were defined dedicated to biodiversity goals (known as the ‘Aichi
Targets’). It has taken more than 5 years to define a biodiversity indicator to inform the
decision making process for a business. As biodiversity is a devolved responsibility in the
UK, it is difficult to pinpoint specific quantifiable measures that are comparable. There
are also many different indicators to choose from rendering any tool cumbersome for the
user. Since Aichi, The Joint Nature Conversation Committee (JNCC) has defined an
indicator for biodiversity specifically for decision making as the “number of publicly
accessible records [within the National Biodiversity Network Gateway] at 1km2
resolution or better” (http://jncc.defra.gov.uk/page-6073). Therefore, on a global, national
and regional scale, biodiversity can be used in decision making based on land area
impacted (hectares) and a qualitative means to represent change over time for any
indicator relevant to the decision. The indicator developed by the JNCC does not say if
the solution reaches a specific target or if the solution is ‘good or bad’ for biodiversity. It
does, however, define if a solution has a detrimental or improving effect on biodiversity,
or no change. The JNCC also included time in this qualitative method, short term
representing change over 5years or less and long term as changes over more than 10years
(http://jncc.defra.gov.uk/page-4230). The European Environment Agency and Defra both
subscribe to this method in their KPI expectations.
SSC’s current ODI for this indicator quantifies the ‘number of hectares under active
environmental management’. Whilst this is an easily understandable and comparable
measure, it does not define the extent of the success of the management being undertaken
from a particular approach or method. The Decision Making Framework takes both South
Energy Consumption kWh/year
Output ML/year
KWh/ML =Energy / Output KWh/ML
CO2e factor - energy 0.50036 kgCo2e/KWh (UKWIR workbook 15/16 value)
Operations Carbon for Option '= KWh/ML x kgCO2e/KWh kgCO2e/ML Score Comparison of option carbon with corporate measure
5 <0.1% of total corporate emissions
4 >0.1% - <0.3% of total corporate emissions
3 >0.3% - <0.5% of total corporate emissions
Comparison Score 2 >0.5 - <1% of total corporate emissions
1 >1% of total corporate emissions
Carbon Score =comparison score x output SST Region emissions 2015/16 = 42,796,197 Kg CO2 on 120,964Ml
Carbon Emissions
South Staffs Water Decision Making Framework for South Staffs WaterPR19 Investment Programme
| Issue 3 | 29 November 2017
H:\SOUTH STAFFS WATER DECISION MAKING FRAMEWORK PR19.DOCX
Page 33
Staffs current measure as a scaling factor and the JNCC indicative impact scale and
provides a simple way for the tool’s user to define biodiversity as appropriate to the
solution in question. As with the JNCC approach, it will not specify targets to be met or
if a solution is good or bad, but it does enable the decision to be informed regarding
likely positive and negative impacts to an area of space affected by the implementation of
a solution.
The biodiversity scoring method is shown in Figure 24.
Hectares affected is based on understanding of the biodiversity in the area and how the
solution may impact it.
To replicate the JNCC definition described above, ‘implementation’ period equates to
5years or less from the start of build/implementation to point of hand over. ‘Operation’
represents the long term effect on the biodiversity after the solution is implemented and is
operating as business as usual.
Figure 24: Biodiversity Scoring
This impact scores are defined as follows, compared to prior to implementation:
• Detrimental: For the biodiversity measures important to the area affected, a
detrimental impact is anticipated
• No change: There will be no impact or change to the existing biodiversity of the area
considered
• Improvement: A positive impact is anticipated from the solution in the area
considered.
The scores are then scaled by area affected for option comparison.
Sustainable Abstraction
Regulators and the industry at large agree that water abstraction must be sustainable and
does not damage the environment. Sustainable abstraction can incorporate leakage, water
efficiency, metering and consumer behaviour. As these are covered in other indicators
and workstreams, this sub indicator allows the user to score sustainable abstraction based
on designation against the affected catchment area and the difference estimated from
solution implementation. Solution development will be done with the appreciation of
water cycle in geographical and volume terms to ensure that demand is met in the right
location across the network. This is associated with the quantity measure but also that the
quantity is in the right place. The current Restoring Sustainable Abstraction (RSA)
Programme is likely to lead to licence changes and designation changes that are not
currently known which can make this a difficult measure to pinpoint over a longer time
horizon planning period. If a region is designated as over abstracted by the environment
Biodiversity
Hectares Affected hectares
Implementation PhaseOperational
Phase
1 Detrimental
Biodiversity 2 No Change
3 Improvement
Biodiversity Score =[implementation + operation] x hectares
South Staffs Water Decision Making Framework for South Staffs WaterPR19 Investment Programme
| Issue 3 | 29 November 2017
H:\SOUTH STAFFS WATER DECISION MAKING FRAMEWORK PR19.DOCX
Page 34
agency then abstraction licences are likely to be reduced or removed. Some licences are
also time limited.
The Environment Agency provide Catchment Abstraction Management Strategies for
specified catchment area. These are informed on a water availability status for the region.
South Staff area is considered a medium water stress area, Cambridge a high water stress
area (i.e. over abstracted). The framework needs to be account for the regional
differences and any potential future changes that may be enforced.
Abstraction licences impacts need to be considered using the following information:
• Size of catchment area available and the volume affected within this area
• Environment Agency designation of abstraction from the catchment that is deemed
sustainable
• The Abstraction Licence available to South Staffs, even if it not fully utilised
The decision framework assesses what the change in abstraction would be against the
Licenced volume due to a solution’s implementation.
The framework therefore uses volume abstracted (Ml/d) and a qualitative score based on
Environment Agency’s current water resource availability status designation as a scaling
factor (in order of increasing benefit):
• 1 – Over abstracted
• 2 - No Water Available (no new licences)
• 3 - Water available, no deterioration or impact on WFD
• 4 - Reduction in abstraction e.g. Demand Management
The sustainable abstraction scoring method is shown in Figure 25. The water sensitivity
score is based on the Environment Agency definitions for the area in question.
Impact scoring is arranged to show any reduction in abstraction to have a more
favourable (higher) score, and a lower score for where abstraction is taking place in areas
that are highly water stressed.
Figure 25: Sustainable Abstraction Scoring
The sustainability abstraction score is then derived by a simple multiplication of score
and output (ML/d).
Combined Score
The final environmental performance score score is a sum of the three inputs described
above. It is important to note that this indicator covers a number of different and complex
elements in sustainability. The scoring is to be used for comparison purposes only. A low
Sustainable Abstraction
80
1 Over Abstracted
Water Sensitivity Score 3 2 No water available
3 Water Available, no deterioration or impact on WFD
4 Reduction in abstraction (e.g. demand management)
Sustainable Abstraction Score = Volume x Water sensitivity
Volume of abstraction impacted (Ml/d)
South Staffs Water Decision Making Framework for South Staffs WaterPR19 Investment Programme
| Issue 3 | 29 November 2017
H:\SOUTH STAFFS WATER DECISION MAKING FRAMEWORK PR19.DOCX
Page 35
score does not necessarily imply a solution is detrimental to the environment, but that it
has less positive benefit compared to other solutions considered.
5.2.2.5 Customer Preference
The embedding of customer’s preference within the technical decision making process is
a critical element of investment planning; in order to allow decisions to be guided by this
a simple indicator has been utilised as shown in Figure 26. This applies a score to each
option based on how well it is aligned with customer preferences. This is informed by
customer engagement workshops.
Figure 26 : Scoring of customer preference
Customer Preference
Score Definition
3 Most aligned with customer preference
2
1
0 Neutral
-1
-2
-3 Least aligned with customer preference
South Staffs Water Decision Making Framework for South Staffs WaterPR19 Investment Programme
| Issue 3 | 29 November 2017
H:\SOUTH STAFFS WATER DECISION MAKING FRAMEWORK PR19.DOCX
Page 36
6 Using the Framework
The framework enables the collection of data on investment options in order that an
optimisation exercise can be undertaken to generate a number of different outputs. These
outputs will then need to be used in various ways to test both the sensitivity of the model,
as well as exploring how the proposed solutions would work in different future scenarios.
A key part of this is the generation of multiple objective trade of curves and how verse
vary under the different future scenarios.
The diagram in Figure 27 illustrates these steps:
• Step 1: The base approach will be run
to solve a specific problem (quality
and quantity) using “business as usual
scenario”, generating a least cost
optimisation as well as trade-off plots
and alternative objective
optimisations. Associated model
sensitivities will be identified and
quantified.
• Step 2: A series of alternative future
scenarios will be developed, for
example climate change or population
growth projects, each generating
slightly different specific problems to
solve. Alternative least cost and
alternative objective optimised
portfolios will be generated and
compared to the base model. Key
changes to the base approach will
need to be agreed with stakeholders.
• Step 3: A second iteration of the base
run is performed, incorporating
agreed changes.
• Step 4: Customer acceptability testing
of proposed solutions is then carried
out and feedback incorporated into
previous settings. Further iterations to be run as required.
Figure 27: Using the decision making model outputs
South Staffs Water Decision Making Framework for South Staffs WaterPR19 Investment Programme
| Issue 3 | 29 November 2017
H:\SOUTH STAFFS WATER DECISION MAKING FRAMEWORK PR19.DOCX
Page 37
7 Conclusion
The decision making framework developed for SSC sets out the proposed approach to
decision making, the content of the indicators and the data capture requirements. In order
to utilise the framework this must be operationalised using an optimisation engine that
will process and optimise the data in accordance with the rules set out in the DMF,
notably:
• Generation of all feasible portfolios (combination of options) that are able to
simultaneously satisfy defined quantity, quality and affordability scenarios in the
planning period.
• Optimisation of portfolios in order to demonstrate the pareto frontier between
least cost and the other performance criteria of resilience, environment,
deliverability and customer preference.
A number of options for the building of the optimisation engine were considered. SSC
subsequently decided to modify and develop new algorithms for their existing Investment
Optimiser software in preference to purchasing a new optimisation engine that had been