53
Southern Company Overview June 2014

Southern CompanyOverview
June 2014

Cautionary Note Regarding Forward-Looking Statements
2
Certain information contained in this presentation is forward‐looking information based on current expectations and plans that involve risks and uncertainties. Forward‐looking information includes, amongother things, statements concerning earnings per share guidance, future dividend growth, economic growth, sales growth, capital expenditures, financing plan, fuel mix, projected cost and schedule for thecompletion of ongoing construction projects, customer benefits and estimated rate impacts related to ongoing construction projects, financing activities, regulatory actions, and solar initiatives. SouthernCompany cautions that there are certain factors that can cause actual results to differ materially from the forward‐looking information that has been provided. The reader is cautioned not to put undue relianceon this forward‐looking information, which is not a guarantee of future performance and is subject to a number of uncertainties and other factors, many of which are outside the control of Southern Company;accordingly, there can be no assurance that such suggested results will be realized. The following factors, in addition to those discussed in Southern Company’s Annual Report on Form 10‐K for the year endedDecember 31, 2013, and subsequent securities filings, could cause actual results to differ materially from management expectations as suggested by such forward‐looking information: the impact of recent andfuture federal and state regulatory changes, including legislative and regulatory initiatives regarding deregulation and restructuring of the electric utility industry, environmental laws including regulation ofwater, coal combustion residuals, and emissions of sulfur, nitrogen, carbon, soot, particulate matter, hazardous air pollutants, including mercury, and other substances, and also changes in tax and other lawsand regulations to which Southern Company and its subsidiaries are subject, as well as changes in application of existing laws and regulations; current and future litigation, regulatory investigations,proceedings, or inquiries, including the pending Environmental Protection Agency civil actions against certain Southern Company subsidiaries, Federal Energy Regulatory Commission matters, and InternalRevenue Service and state tax audits; the effects, extent, and timing of the entry of additional competition in the markets in which Southern Company’s subsidiaries operate; variations in demand for electricity,including those relating to weather, the general economy and recovery from the recent recession, population and business growth (and declines), the effects of energy conservation measures, including fromthe development and deployment of alternative energy sources such as self‐generation and distributed generation technologies, and any potential economic impacts resulting from federal fiscal decisions;available sources and costs of fuels; effects of inflation; ability to control costs and avoid cost overruns during the development and construction of facilities, which include the development and construction ofgenerating facilities with designs that have not been finalized or previously constructed, including changes in labor costs and productivity factors, adverse weather conditions, shortages and inconsistent qualityof equipment, materials, and labor, contractor or supplier delay or non‐performance under construction or other agreements, operational performance, delays associated with start‐up activities, includingmajor equipment failure, system integration, and operations, and/or unforeseen engineering problems; ability to construct facilities in accordance with the requirements of permits and licenses, to satisfy anyoperational and environmental performance standards, including any Public Service Commission (“PSC”) requirements and the requirements of tax credits and other incentives, and to integrate facilities intothe Southern Company system upon completion of construction; investment performance of Southern Company’s employee and retiree benefit plans and the Southern Company system’s nucleardecommissioning trust funds; advances in technology; state and federal rate regulations and the impact of pending and future rate cases and negotiations, including rate actions relating to fuel and other costrecovery mechanisms; regulatory approvals and actions related to the Plant Vogtle expansion, including Georgia PSC approvals and Nuclear Regulatory Commission actions; actions related to cost recovery forthe integrated coal gasification combined cycle facility under construction in Kemper County, Mississippi (“Kemper IGCC”), including actions relating to proposed securitization, Mississippi PSC approval ofMississippi Power Company’s proposed rate recovery plan, as ultimately amended, which currently includes the ability to complete the proposed sale of an interest in the Kemper IGCC to South MississippiElectric Power Association, the ability to utilize bonus depreciation, which currently requires that assets be placed in service in 2014, and satisfaction of requirements to utilize investment tax credits and grants;Mississippi PSC review of the prudence of Kemper IGCC costs; the outcome of any legal or regulatory proceedings regarding the Mississippi PSC’s issuance of the Certificate of Public Convenience and Necessityfor the Kemper IGCC, the settlement agreement between Mississippi Power Company and the Mississippi PSC, the March 2013 rate order approving retail rate increases consistent with the terms of thesettlement agreement, or the State of Mississippi legislation designed to enhance the Mississippi PSC’s authority to facilitate development and construction of baseload generation in the State of Mississippi;the inherent risks involved in operating and constructing nuclear generating facilities, including environmental, health, regulatory, natural disaster, terrorism, and financial risks; the performance of projectsundertaken by the non‐utility businesses and the success of efforts to invest in and develop new opportunities; internal restructuring or other restructuring options that may be pursued; potential businessstrategies, including acquisitions or dispositions of assets or businesses, which cannot be assured to be completed or beneficial to Southern Company or its subsidiaries; the ability of counterparties of SouthernCompany and its subsidiaries to make payments as and when due and to perform as required; the ability to obtain new short‐ and long‐term contracts with wholesale customers; the direct or indirect effect onthe Southern Company system’s business resulting from terrorist incidents and the threat of terrorist incidents, including cyber intrusion; interest rate fluctuations and financial market conditions and theresults of financing efforts, including Southern Company’s and its subsidiaries’ credit ratings; the impacts of any potential U.S. credit rating downgrade or other sovereign financial issues, including impacts oninterest rates, access to capital markets, impacts on currency exchange rates, counterparty performance, and the economy in general, as well as potential impacts on the benefits of the U.S. Department ofEnergy loan guarantees; the ability of Southern Company and its subsidiaries to obtain additional generating capacity at competitive prices; catastrophic events such as fires, earthquakes, explosions, floods,hurricanes, droughts, pandemic health events such as influenzas, or other similar occurrences; the direct or indirect effects on the Southern Company system’s business resulting from incidents affecting theU.S. electric grid or operation of generating resources; and the effect of accounting pronouncements issued periodically by standard setting bodies. Southern Company expressly disclaims any obligation toupdate any forward‐looking information.

Investor Relations Contact Info
• Dan TuckerVice President, Investor Relations & Financial [email protected]
• Jimmy StewartManager, Investor [email protected]
Main website: www.southerncompany.com
IR website: http://investor.southerncompany.com
CSR website: http://southerncompany.com/what-doing/corporate-responsibility3
Environmental Reports
Carbon Disclosure ReportThis update for 2014 details actions the Southern Company system is taking on greenhouse gas emissions and incorporates information the company previously submitted to the Carbon Disclosure Project.http://www.southerncompany.com/what-doing/pdf/Carbon_Disclosure_Report_2014_final.pdf
Water Action ReportA report on how the Southern Company system manages water resources in the production of electricity. Updated for 2014.http://www.southerncompany.com/what-doing/pdf/water_action_report_2014_final.pdf
Coal Combustion ByproductsA report on the system's production and safe management of coal combustion byproducts. New - 2014 Update.http://www.southerncompany.com/what-doing/pdf/coal_Combustion_Byproducts_2014_final.pdf
Renewables and Distributed GenerationSouthern Company believes that to best meet customers’ needs, the full portfolio of America’s energy resources is required.
4
Southern Company – A Solid Foundation
5
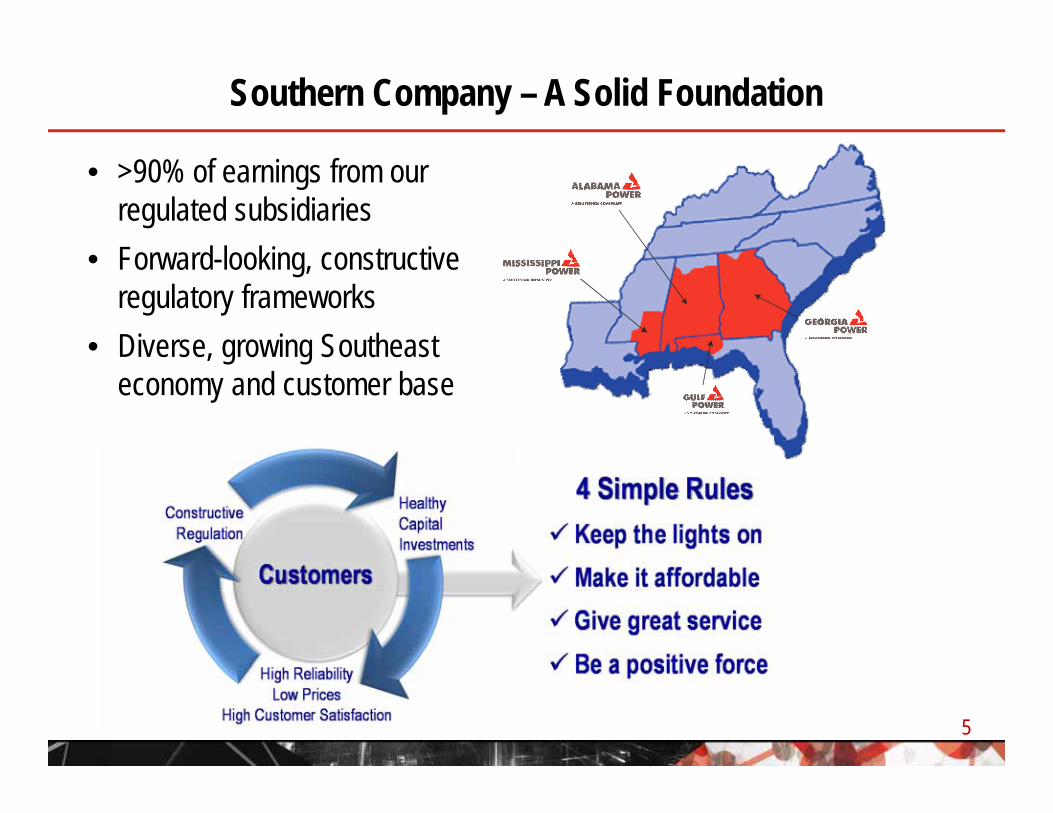
• >90% of earnings from our regulated subsidiaries
• Forward-looking, constructive regulatory frameworks
• Diverse, growing Southeast economy and customer base

Other Hallmarks of Southern Company
6
An Increasingly Diverse Energy Portfolio
Dividend History
Southern Power – a premier wholesale generation company
Our Strategic Priorities
• Excel at the Fundamentals
• Achieve Success with Major Construction
• Support Building National Energy Policy
• Promote Energy Innovation
• Value and Develop Our People
7

Constructive, Proven Regulatory Frameworks
8

Quality Southern Power Assets
99
Business Model
8,960 MWs of Capacity
Build or buy assets supported by long‐term contracts with credit‐worthy counterparties
Develop long‐term relationships / partnerships that leverage our operational excellence
Minimize fuel and transmission risk
Commitment to financial integrity and credit rating
Financial Overview
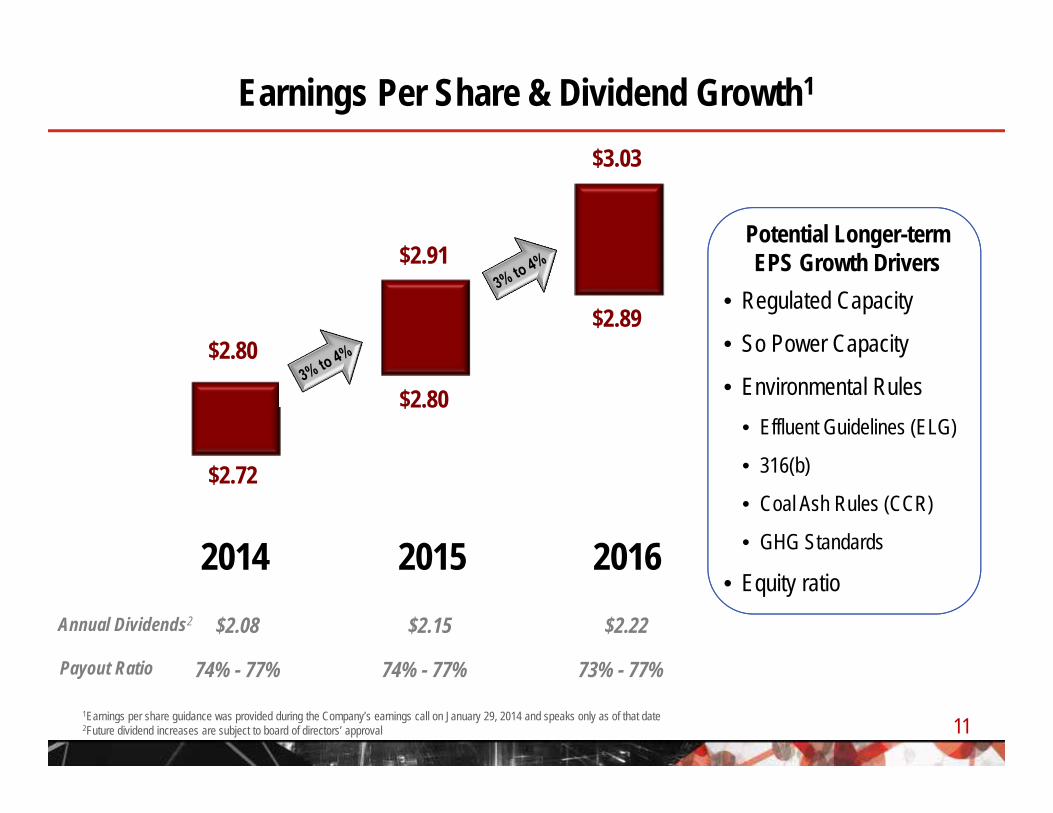
Earnings Per Share & Dividend Growth1
2014
$2.72
$2.80
$2.91
$2.80
2015
$3.03
$2.89
2016
74% - 77%
$2.08
74% - 77%
$2.15
73% - 77%
$2.22Annual Dividends2
Payout Ratio
Potential Longer-termEPS Growth Drivers
• Regulated Capacity
• So Power Capacity
• Environmental Rules• Effluent Guidelines (ELG)
• 316(b)
• Coal Ash Rules (CCR)
• GHG Standards
• Equity ratio
111Earnings per share guidance was provided during the Company’s earnings call on January 29, 2014 and speaks only as of that date2Future dividend increases are subject to board of directors’ approval
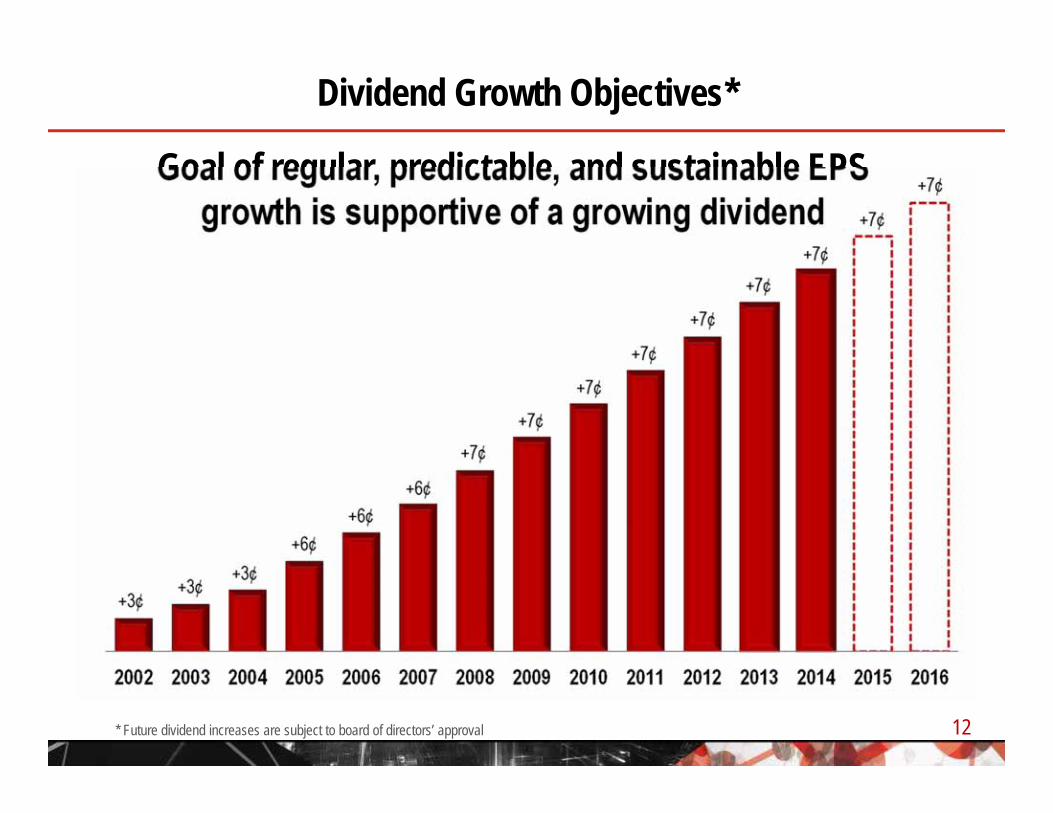
Dividend Growth Objectives*
12* Future dividend increases are subject to board of directors’ approval
Goal of regular, predictable, and sustainable EPS growth is supportive of a growing dividend

Dividends are an integral component of our value proposition
13Source: Bloomberg; assumes all dividends are reinvested and returns are compounded monthly, 2001 Mirant spin is treated as a dividend.

2014 Sales Growth Forecast
2014 Economic and Sales Forecast
Economic Roundtable
GDP projected to grow 2.5% – 3.0%
Industrial activity continues to improve with many new entrants being international firms
Housing markets continue to improve with housing-related sectors benefiting
Economic momentum from late 2013 carrying into 2014
14
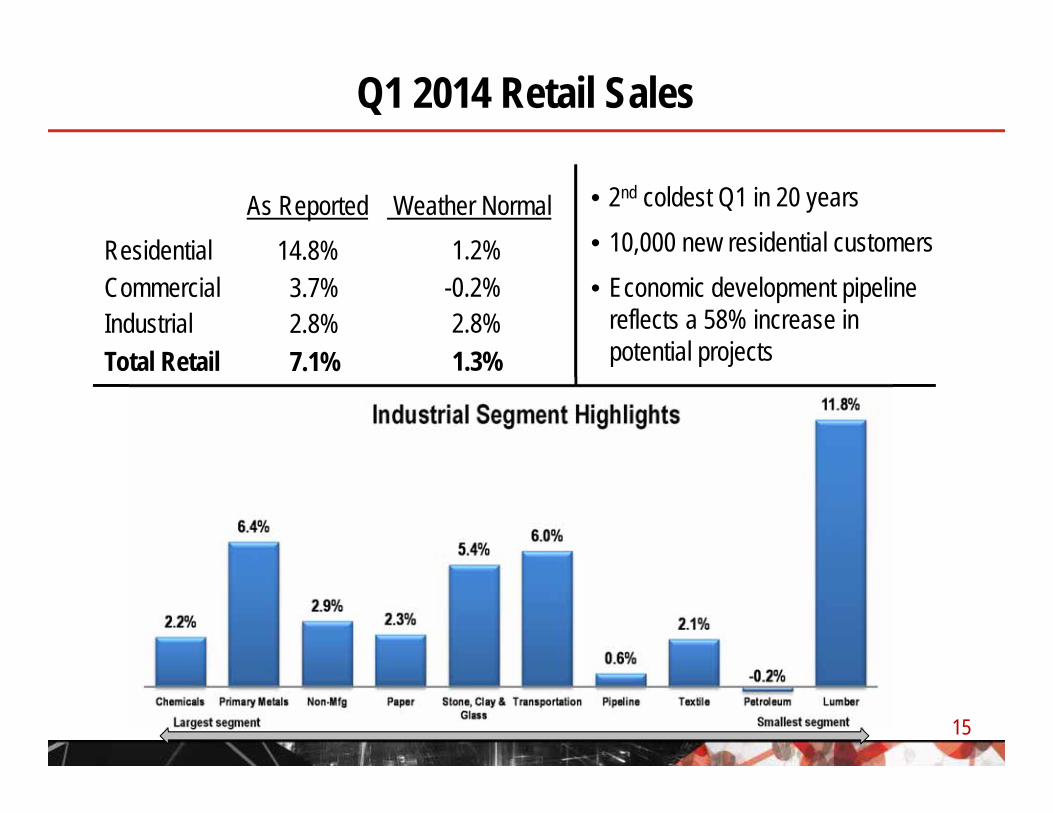
Q1 2014 Retail Sales
ResidentialCommercialIndustrialTotal Retail
As Reported Weather Normal14.8%
3.7%2.8%7.1%
1.2%-0.2%2.8%1.3%
Industrial Segment Highlights
• 2nd coldest Q1 in 20 years• 10,000 new residential customers• Economic development pipeline
reflects a 58% increase in potential projects
Largest segment Smallest segment 15
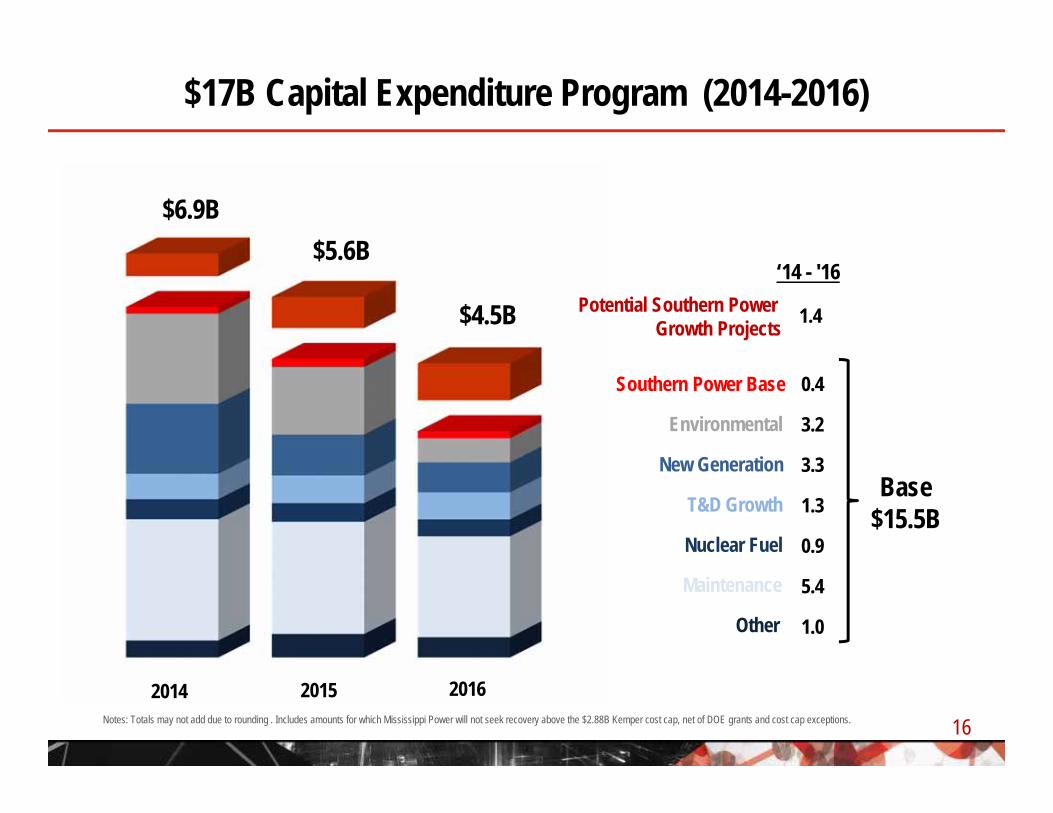
$17B Capital Expenditure Program (2014-2016)
16
‘14 - '16Potential Southern Power
Growth Projects 1.4
Southern Power Base 0.4
Environmental 3.2
New Generation 3.3
T&D Growth 1.3
Nuclear Fuel 0.9
Maintenance 5.4
Other 1.0
2014 2015 2016
$6.9B$5.6B
$4.5B
Base$15.5B
Notes: Totals may not add due to rounding . Includes amounts for which Mississippi Power will not seek recovery above the $2.88B Kemper cost cap, net of DOE grants and cost cap exceptions.

2014 – 2016 Financing Plan
17

Strong Credit Ratings Benefit our Customers
18

Source: Citigroup, as of 12/31/2013
Our Debt Portfolio Compares Favorably
Source: Citi
NextEra 7%Dominion 4%Duke Energy 0%
Exelon Corp. 9%
AEP 0%
Public Service Entp. Grp. 0%
Wisconsin Energy 9%
Entergy Corp. 16%
Ameren Corp. 0%
Con Edison 0%
PG&E 0%
Alabama 5%
Georgia 3%
Gulf 21%
Mississippi 5%
Southern Co. 5%
2.50%
3.00%
3.50%
4.00%
4.50%
5.00%
5.50%
6.00%
6.50%
7 9 11 13 15 17 19 21
Aver
age
Cost
(%)
Average Life (yrs)Black line represents average A/BBB+ utility yield curve for 5 previous years. % s represent % of fixed rate debt with a par call feature.
19
Generation OverviewIncluding Major Construction Projects

One of the Largest Biomass
Facilities in North America
MultipleWind Energy
PPAs
21
Committed to “All of the Above”
Utility Scale Solarat Southern Power
and initiatives atGeorgia Power
Kemper County IGCC~495MW OwnershipProprietary TRIG technology
Plant McDonough-Atkinson2,520 MW Natural Gas CC
Among of the most efficient in the nation
Vogtle Units 3 & 4~1,005MW OwnershipAP1000 technology

Transitioning the coal fleet to comply with EPA rules
22
Coal MWs as of 12/31/13 20,860
MWs to Convert to Natural Gas 3,200
MWs fuel switch (to PRB) / ACI / DSI 1,200
MWs to be retired by 2015 2,900
Well‐controlled MWs for long‐term use (scrubber+) 13,200
EPA’s MATS rule will drive most of the Southern Company system’s incremental compliance investments in the near‐term, although our analyses consider estimates of potential costs for all emerging rules ‐ including potential GHG standards.
78%
38%
4%
42%
16% 16%
23%
53%
53%
23%
18% 18%
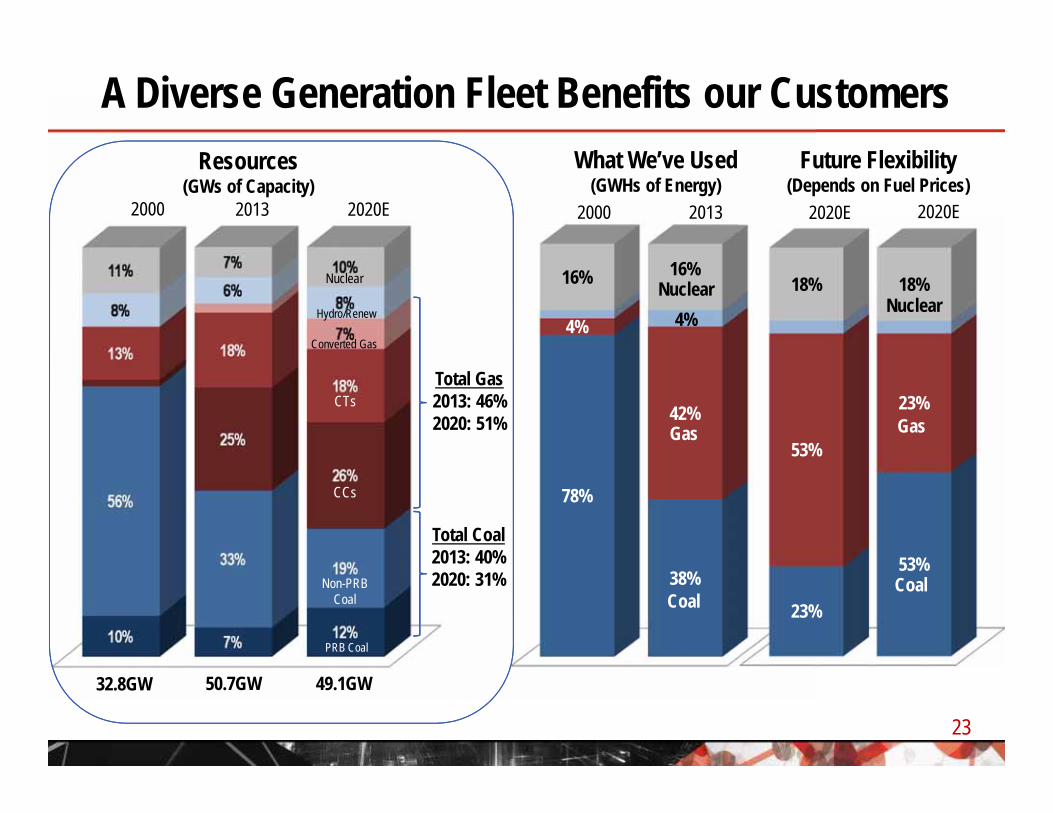
A Diverse Generation Fleet Benefits our Customers
23
Total Gas2013: 46%2020: 51%
2000 2013 2000 2013 2020E 2020E
Resources(GWs of Capacity)
What We’ve Used(GWHs of Energy)
Future Flexibility(Depends on Fuel Prices)
CTs
CCs
Non-PRBCoal
PRB Coal
32.8GW 50.7GW
Gas Gas
CoalCoal
NuclearNuclear
Hydro/Renew 4%Converted Gas
49.1GW
2020E
Nuclear
Total Coal2013: 40%2020: 31%
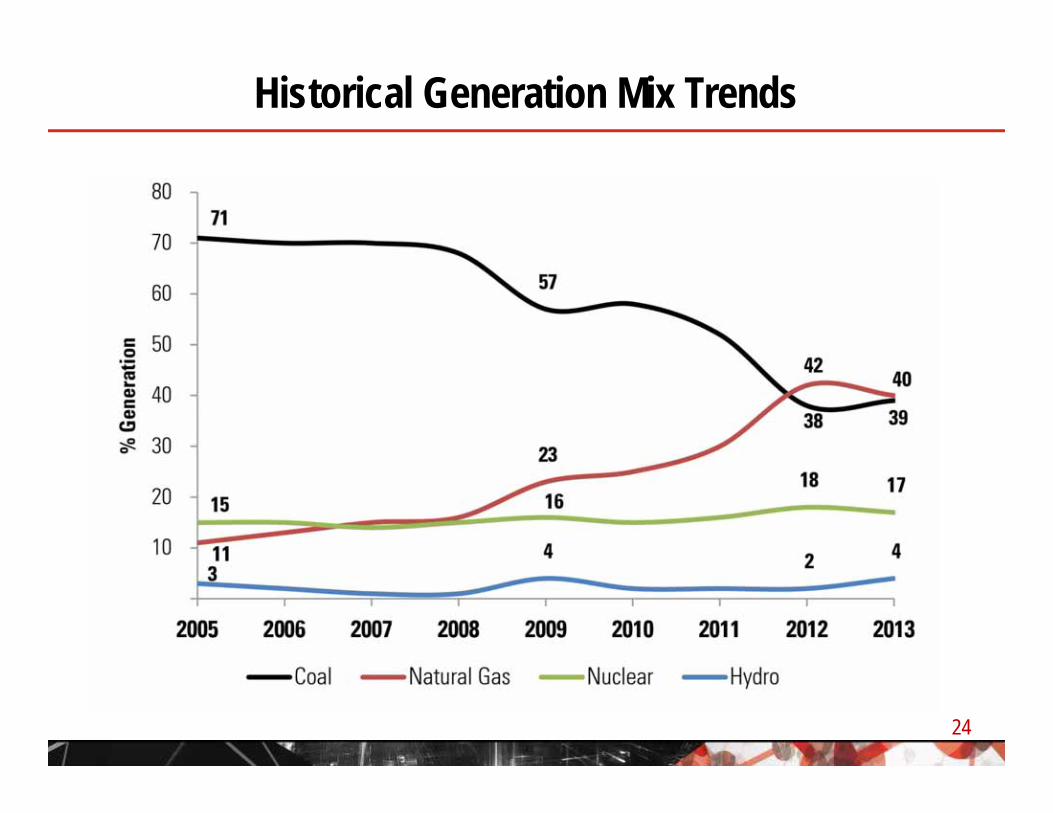
Historical Generation Mix Trends
24

Historical GHG Intensity(CO2e lbs/MWH)
25
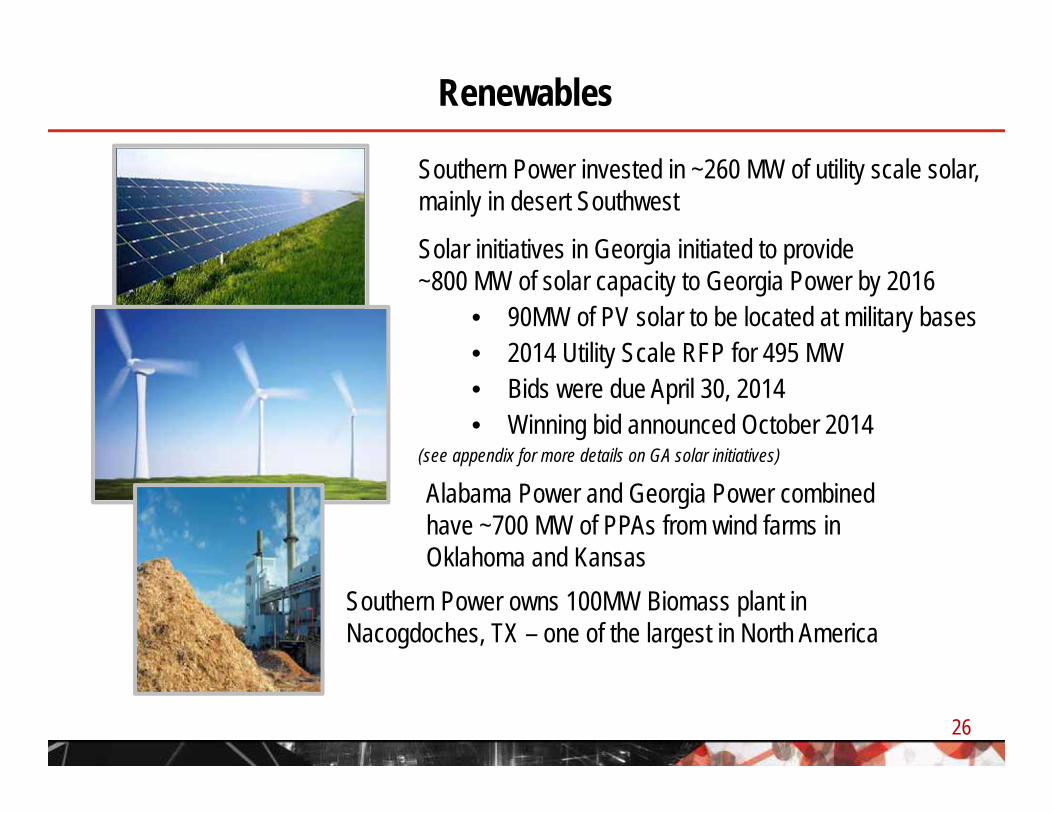
Renewables
26
Southern Power invested in ~260 MW of utility scale solar, mainly in desert Southwest
Solar initiatives in Georgia initiated to provide~800 MW of solar capacity to Georgia Power by 2016
• 90MW of PV solar to be located at military bases• 2014 Utility Scale RFP for 495 MW• Bids were due April 30, 2014• Winning bid announced October 2014
(see appendix for more details on GA solar initiatives)
Alabama Power and Georgia Power combined have ~700 MW of PPAs from wind farms in Oklahoma and Kansas
Southern Power owns 100MW Biomass plant in Nacogdoches, TX – one of the largest in North America

Vogtle 3&4 - New Nuclear Construction
• Approved by Georgia Public Service Commission in 2009
• Westinghouse AP1000 Technology
• Each unit totals approximately 1,100MW units
• Georgia Power is a 45.7% owner(Oglethorpe, 30%; MEAG, 22.7%; and Dalton Utilities, 1.6%)
• Received Combined Construction and Operating License (COL) from NRC in February 2012
• DOE Loan Guarantee finalized February 2014
• Financing costs (debt and equity) recovered during construction through “NCCR” tariff (a.k.a. CWIP in Rates)
• Projected in-service dates of Q4 2017 (Unit 3) and Q4 2018 (Unit 4)27
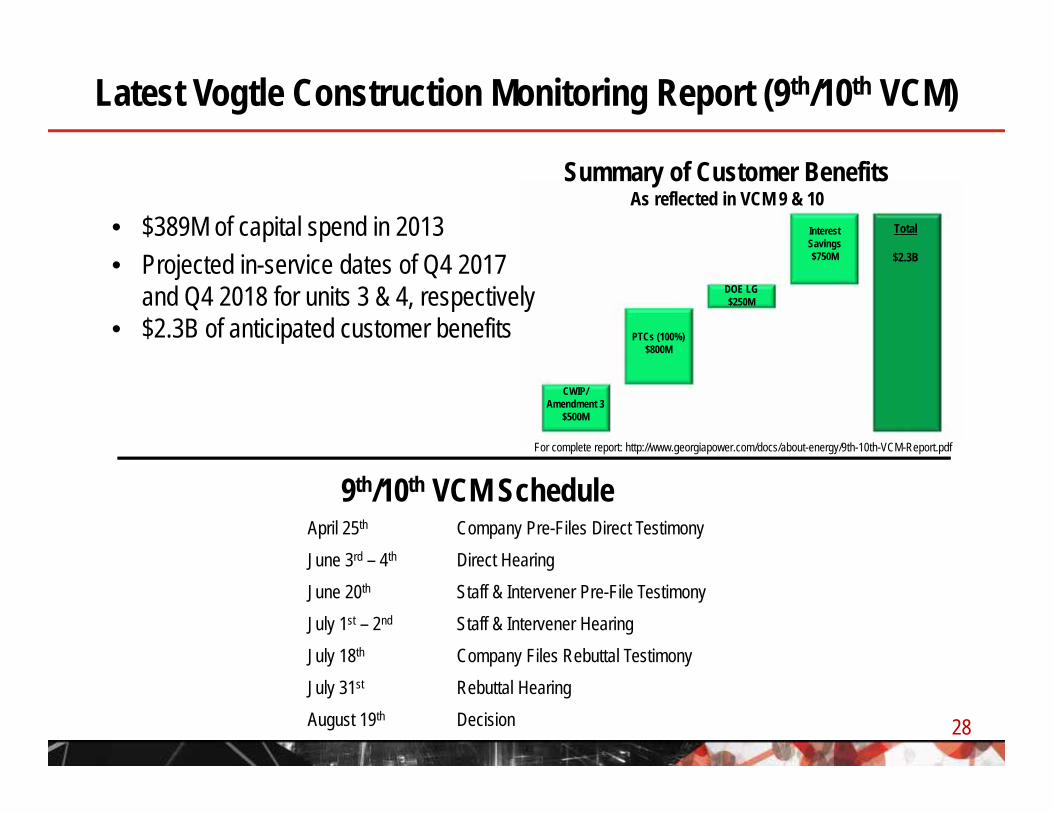
April 25th Company Pre-Files Direct TestimonyJune 3rd – 4th Direct HearingJune 20th Staff & Intervener Pre-File TestimonyJuly 1st – 2nd Staff & Intervener HearingJuly 18th Company Files Rebuttal TestimonyJuly 31st Rebuttal HearingAugust 19th Decision
Latest Vogtle Construction Monitoring Report (9th/10th VCM)
Summary of Customer BenefitsAs reflected in VCM 9 & 10
• $389M of capital spend in 2013• Projected in-service dates of Q4 2017
and Q4 2018 for units 3 & 4, respectively• $2.3B of anticipated customer benefits
9th/10th VCM Schedule
CWIP/ Amendment 3
$500M
PTCs (100%)$800M
DOE LG$250M
InterestSavings$750M
Total
$2.3B
For complete report: http://www.georgiapower.com/docs/about-energy/9th-10th-VCM-Report.pdf
28

No Change in Latest Cost Estimate (9th/10th VCM)
Largely schedule‐related costs
29

Estimated Cumulative Rate Impact of 6% to 8% at COD
• Fuel savings, along with the additional customer benefits, significantly lessen the overall rate impact to customers at the time the units are put into service.
The remaining projected rate impact for customers is only 2 to 4 percent
30

DOE Loan Guarantee – Georgia Power
• Finalized February 20, 2014• Credit Facility = $3.46B (70% of eligible project costs)• Draws mature February 20, 2044, with amortization of principal
beginning in 2020.• Interest Rate = Treasury + 0.375%• First draw of $1B taken the day of closing• Estimated Draw Schedule:
2014: $1.2B2015: $1.4B2016: $0.4B
2017-2018: $0.4B
31

Set CA-20 Concrete under bottom head Set turbine island condensers Cooling tower above 300’
Set containment cradle Containment vessel bottom head set Condenser assembly Cooling tower above 50’
Unit 3 Unit 4Pr
ogre
ss
• Set CA-05 (wall module)• Additional module fabrication• Annex building foundation• Complete cooling tower
• Module fabrication• Begin nuclear island walls• Turbine building vertical construction
Upco
min
gVogtle Construction Update
For additional Vogtle photos: http://www.georgiapower.com/about-energy/energy-sources/nuclear/gallery/search/index.cshtml
32

Vogtle 3&4 Update – Key Risk Mitigations
33
• 100% fixed/firm EPC contract
• Significant front-end engineering during NRC design certification
• PWR is not new technology(safety features of AP1000 are new)
• Significant oversight(SNC, NRC, GPSC, co-owners)
• Remaining annual rate increases <1% per year
• Statutory recovery of prudently incurred costs (O.C.G.A. § 46-3A-7)
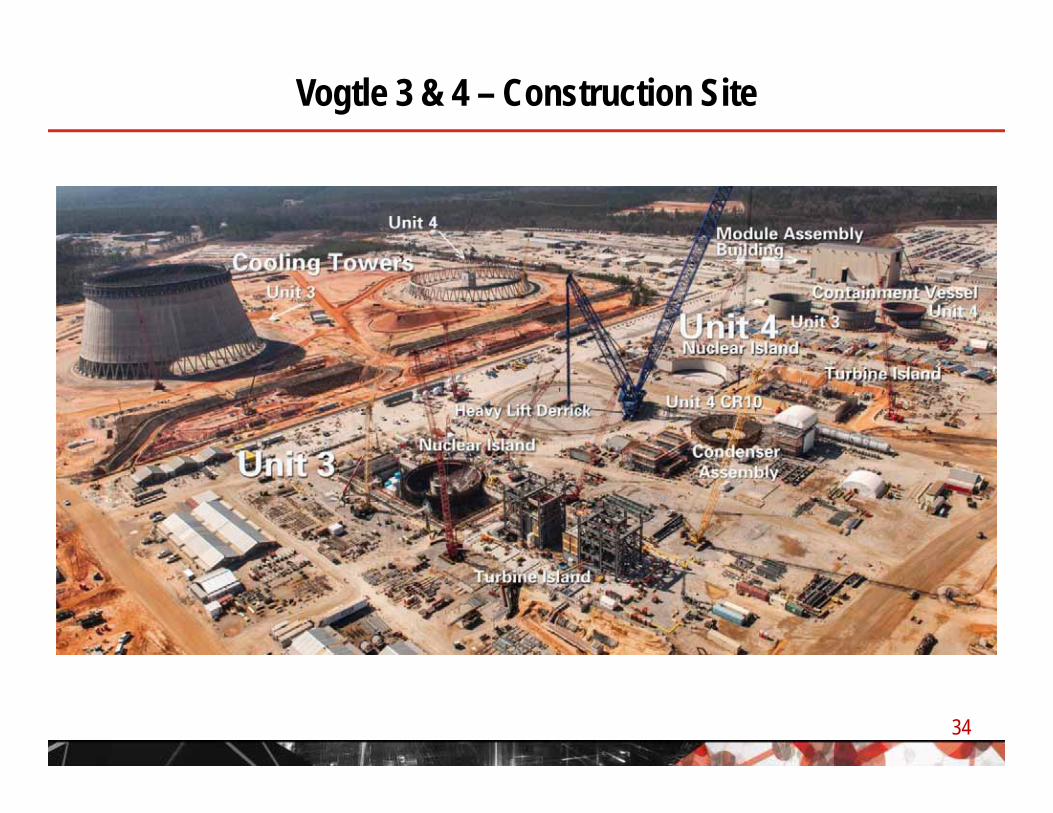
Vogtle 3 & 4 – Construction Site
34
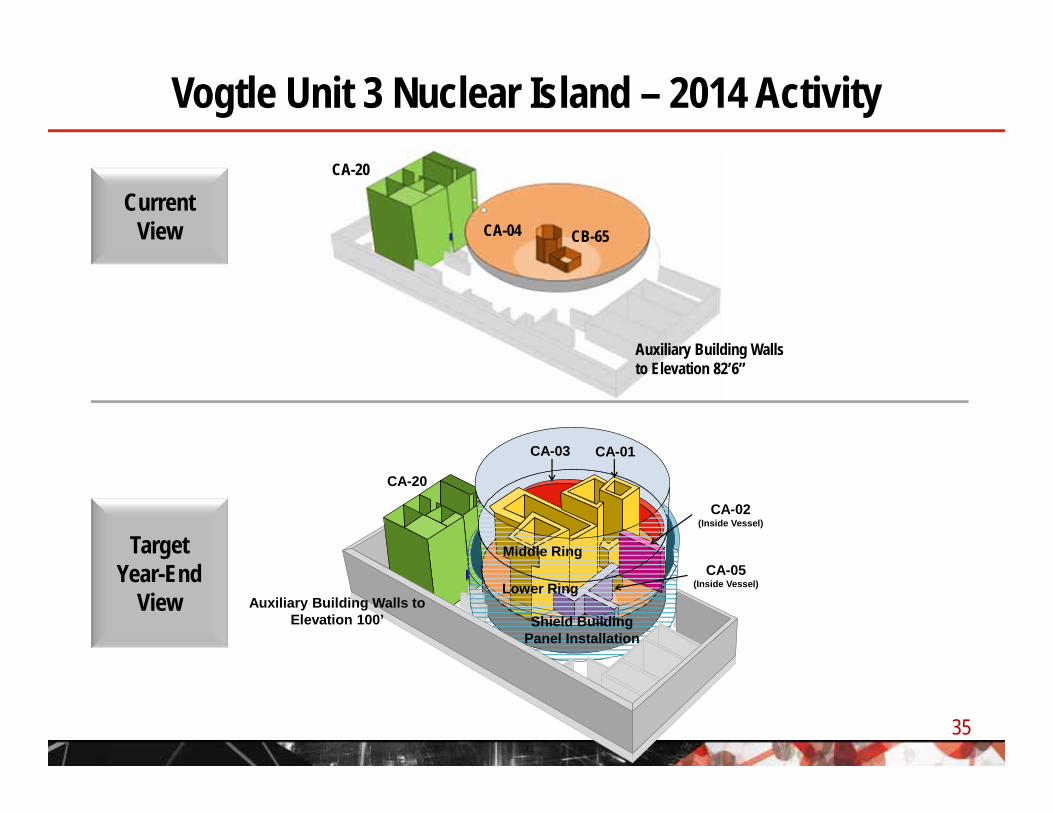
Vogtle Unit 3 Nuclear Island – 2014 Activity
Current View
Target Year-End
View
Middle Ring
Auxiliary Building Walls to Elevation 100’
CA-20
Lower Ring
CA-01
Shield Building Panel Installation
CA-03
CA-02(Inside Vessel)
CA-05(Inside Vessel)
Auxiliary Building Walls to Elevation 82’6”
CA-20
CA-04 CB-65
35

AP1000 Nuclear and Turbine Islands
36

Vogtle 3 Nuclear Island & Cooling Tower
37

Major Vogtle 3 Components
38
Containment Vessel Rings
TurbineBuilding
Shield BuildingWall Panels
CA‐05 Moduleinside ModuleAssembly Building(MAB)

Vogtle 4 Nuclear Island
39
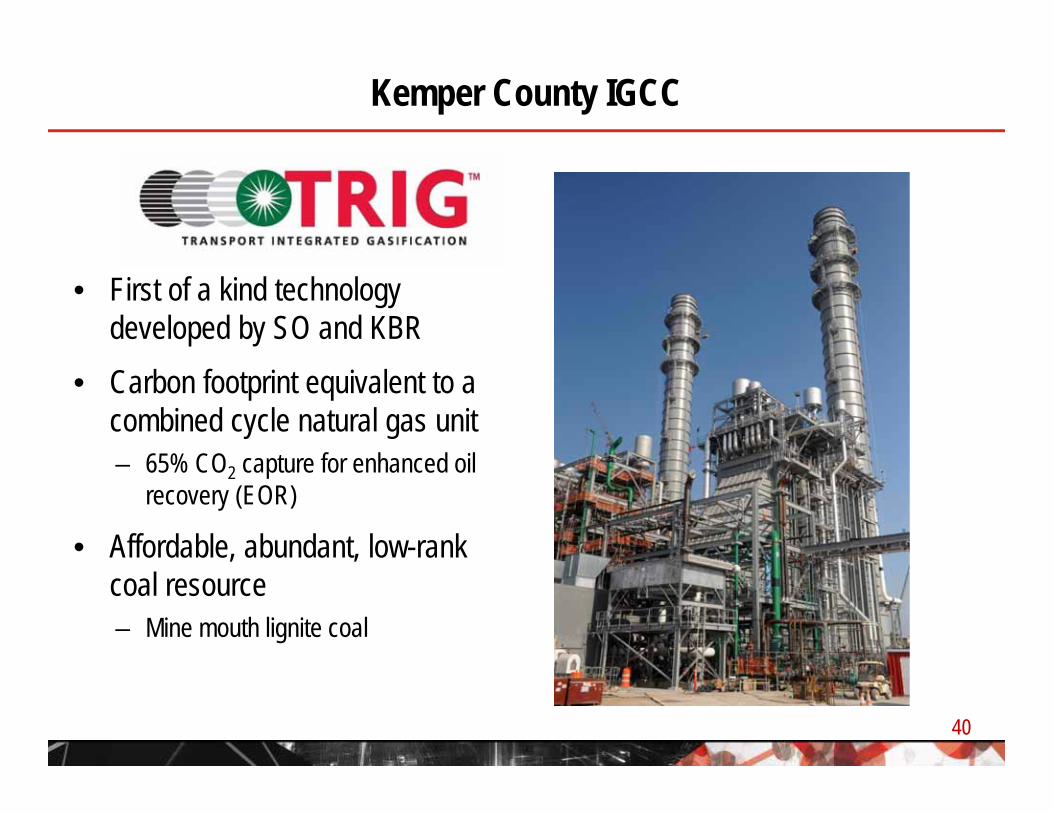
Kemper County IGCC
40
• First of a kind technology developed by SO and KBR
• Carbon footprint equivalent to a combined cycle natural gas unit– 65% CO2 capture for enhanced oil
recovery (EOR)
• Affordable, abundant, low-rankcoal resource– Mine mouth lignite coal

• Simple, well established design– Based on technology in use for 70 years
• Either Air- or Oxygen-blown– Air for power– Oxygen for liquid fuels and chemicals
• High Reliability Design– Non-slagging design:– Expect 10-20 year refractory life – Eliminates black water system– Provides non-fouling syngas cooler operation– No burners to fail and be replaced– Dry dust removal eliminates gray water system
• Lower Fuel Costs– Coarse, dry coal feed allows:– Fewer, lower power pulverizers– Less drying than other dry-feed gasifiers– Cost-effective using high moisture, high-ash,
low rank coals (PRB and lignite)• Excellent Environmental Performance
– Lower water use compared to pulverized coal (PC)– Excellent emissions performance– Easier to permit compared to PC – Lower cost carbon capture compared to PC
air/O2steam
coal
syngas
Presalter Cyclone
Mixing Zone
Riser
Standpipe Cyclone
Standpipe
J-leg
Startup Burner
Seal Leg
syngas
ash
air/O2steam
coal
syngas
Presalter Cyclone
Mixing Zone
Riser
Standpipe Cyclone
Standpipe
J-leg
Startup Burner
Seal Leg
syngas
ash
TRIGTM Attributes / Advantages
41
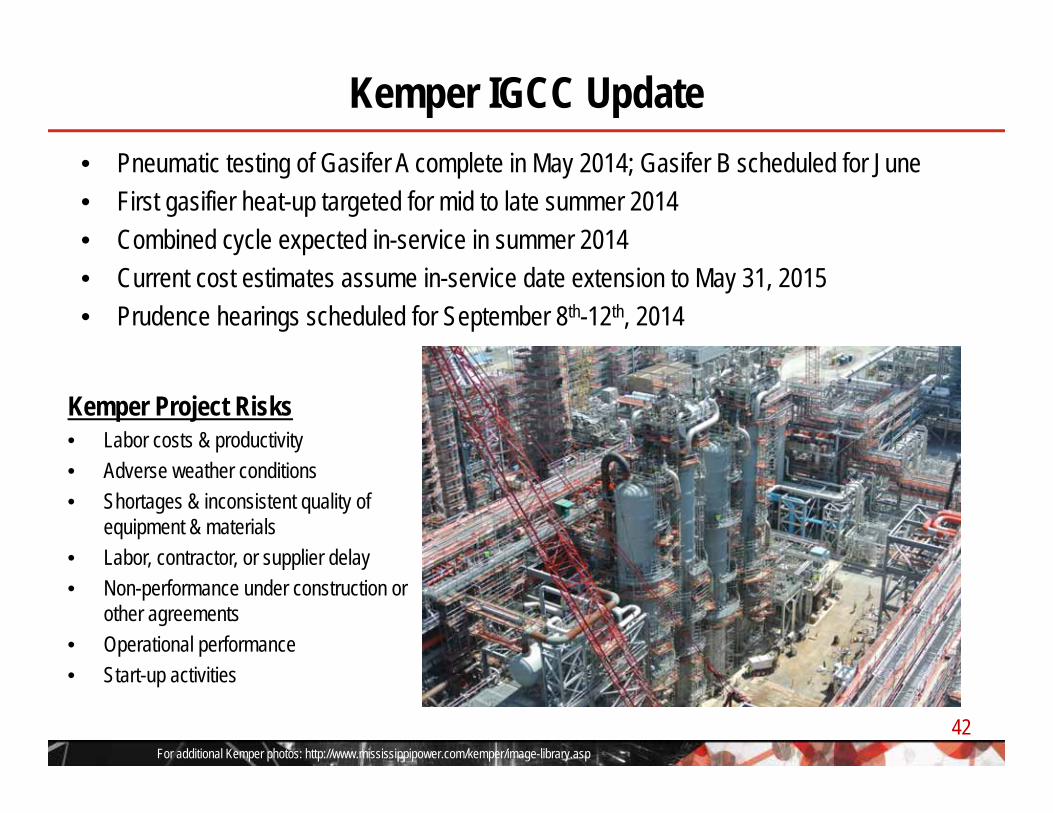
Kemper IGCC Update• Pneumatic testing of Gasifer A complete in May 2014; Gasifer B scheduled for June• First gasifier heat-up targeted for mid to late summer 2014• Combined cycle expected in-service in summer 2014• Current cost estimates assume in-service date extension to May 31, 2015• Prudence hearings scheduled for September 8th-12th, 2014
Kemper Project Risks• Labor costs & productivity• Adverse weather conditions• Shortages & inconsistent quality of
equipment & materials• Labor, contractor, or supplier delay• Non-performance under construction or
other agreements• Operational performance• Start-up activities
For additional Kemper photos: http://www.mississippipower.com/kemper/image-library.asp
42
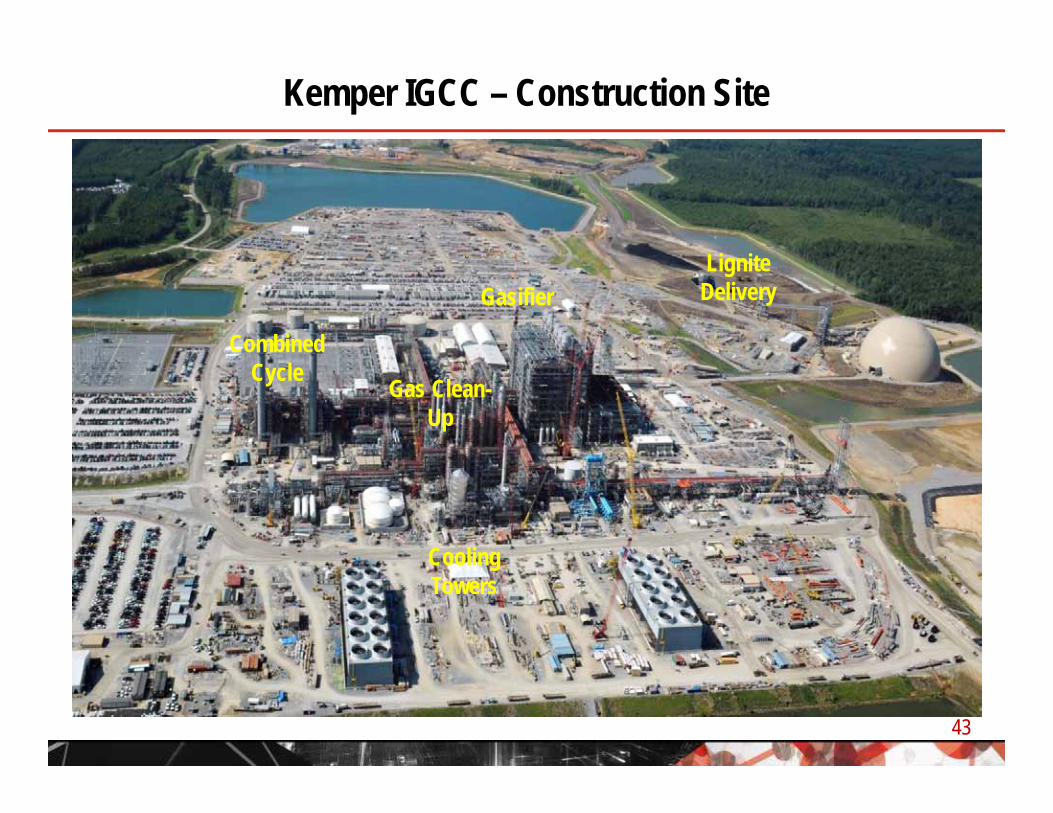
Kemper IGCC – Construction Site
43
Gasifier
Combined Cycle Gas Clean-
Up
Cooling Towers
LigniteDelivery

Kemper IGCC – Major Components
44
CO2 Flash Drums
Acid Gas Removal Area Gasifier Structure
Gasifier
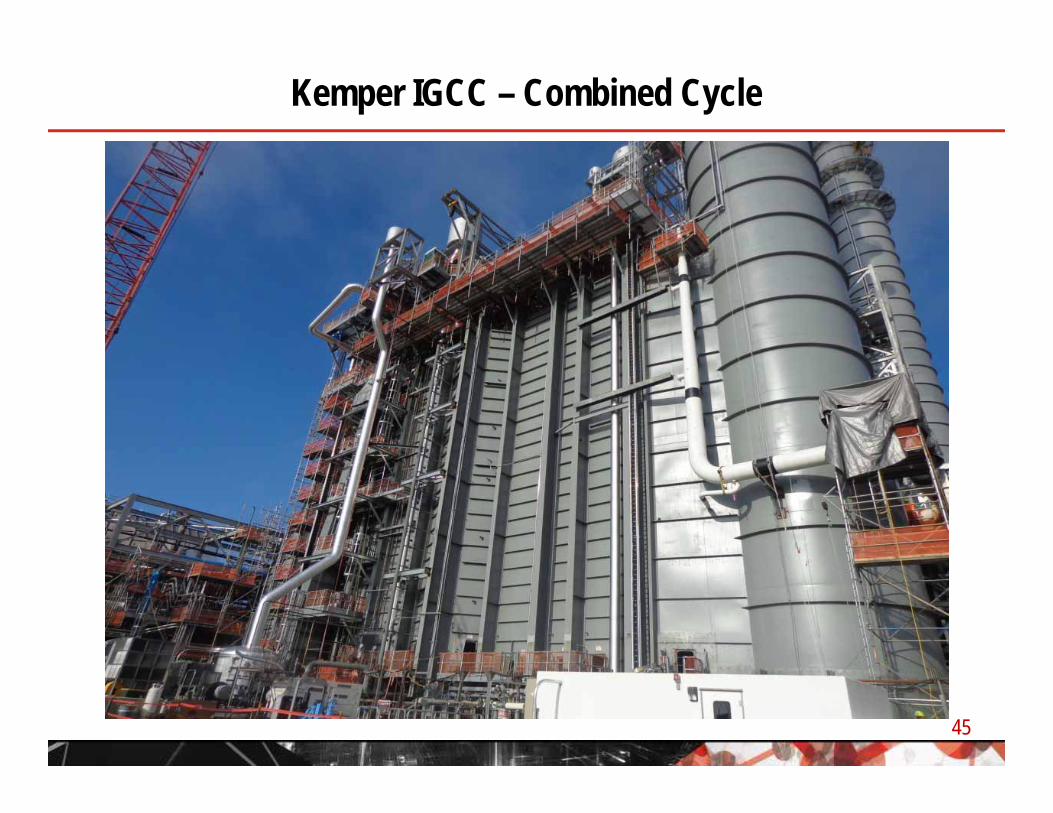
Kemper IGCC – Combined Cycle
45

APPENDIX

2014 – 2016 CapEx Forecast – Company
47
Total$billions 2014 2015 2016 '14 - '16
Alabama Power $1.7 $1.7 $1.2 $4.6Georgia Power 2.5 2.4 2.1 7.0Gulf Power 0.4 0.3 0.2 0.9Mississippi Power 1.6 0.5 0.2 2.3Other Subsidiaries 0.2 0.1 0.1 0.3Traditional OpCo Total $6.4 $4.9 $3.8 $15.1Southern Power 0.2 0.1 0.1 0.4
Potential Southern Power Growth Projects 0.3 0.5 0.6 1.4
Total Capex $6.9 $5.4 $4.5 $16.9
Base Total $6.6 $5.0 $3.9 $15.5
Notes: Totals may not add due to rounding. Includes amounts for which Mississippi Power will not seek recovery above the $2.88B Kemper cost cap, net of DOE grants and cost cap exceptions.

2014 – 2016 CapEx Forecast – Functional
48
Total$billions 2014 2015 2016 ‘14-’16
New Generation $2.0 $0.9 $0.5 $3.3Environmental Compliance 1.5 1.1 0.6 3.2
Transmission 0.1 0.2 0.1 0.4Distribution 0.3 0.3 0.3 0.9
Total T&D Growth 0.4 0.4 0.4 1.3Generation 0.9 0.9 0.8 2.7Transmission 0.6 0.5 0.4 1.5Distribution 0.4 0.4 0.4 1.2
Total Maintenance (G, T & D) 2.0 1.8 1.6 5.4Nuclear Fuel 0.3 0.3 0.3 0.9General 0.3 0.4 0.3 1.0Traditional OpCo Total $6.4 $4.9 $3.8 $15.1Southern Power 0.2 0.1 0.1 0.4
Potential Southern Power Growth Projects 0.3 0.5 0.6 1.4
Total Capex $6.9 $5.4 $4.5 $16.9
Base Total $6.6 $5.0 $3.9 $15.5
Notes: Totals may not add due to rounding. Includes amounts for which Mississippi Power will not seek recovery above the $2.88B Kemper cost cap, net of DOE grants and cost cap exceptions.
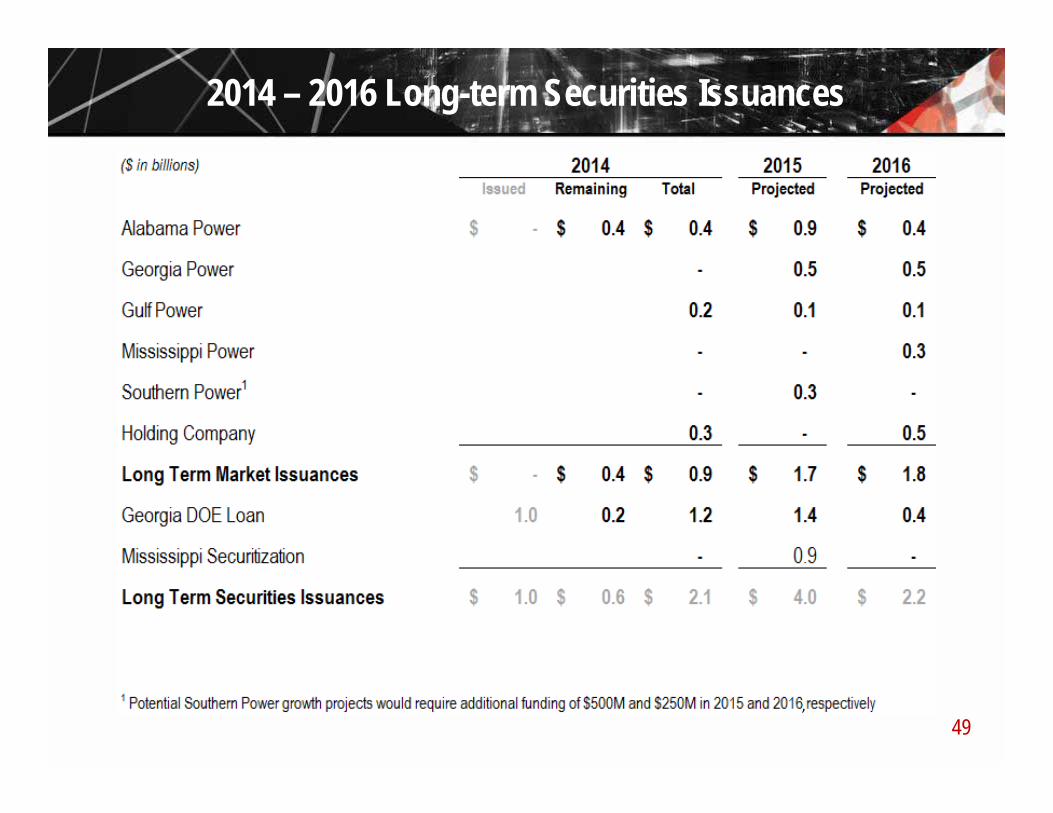
2014 – 2016 Long-term Securities Issuances
49,

2014 Key Regulatory Dockets
Georgia Power• Vogtle Construction Monitoring Report (VCM) – Docket 29849• Advanced Solar Initiative – Docket 36498 & 36325
Mississippi Power Company• Kemper IGCC Project – Docket 2009-UA-0014 • 7 Year Rate Mitigation Plan for Kemper IGCC Project – Docket 2013-UN-0039• Kemper Prudence Review – Docket 2013-UA-189
50
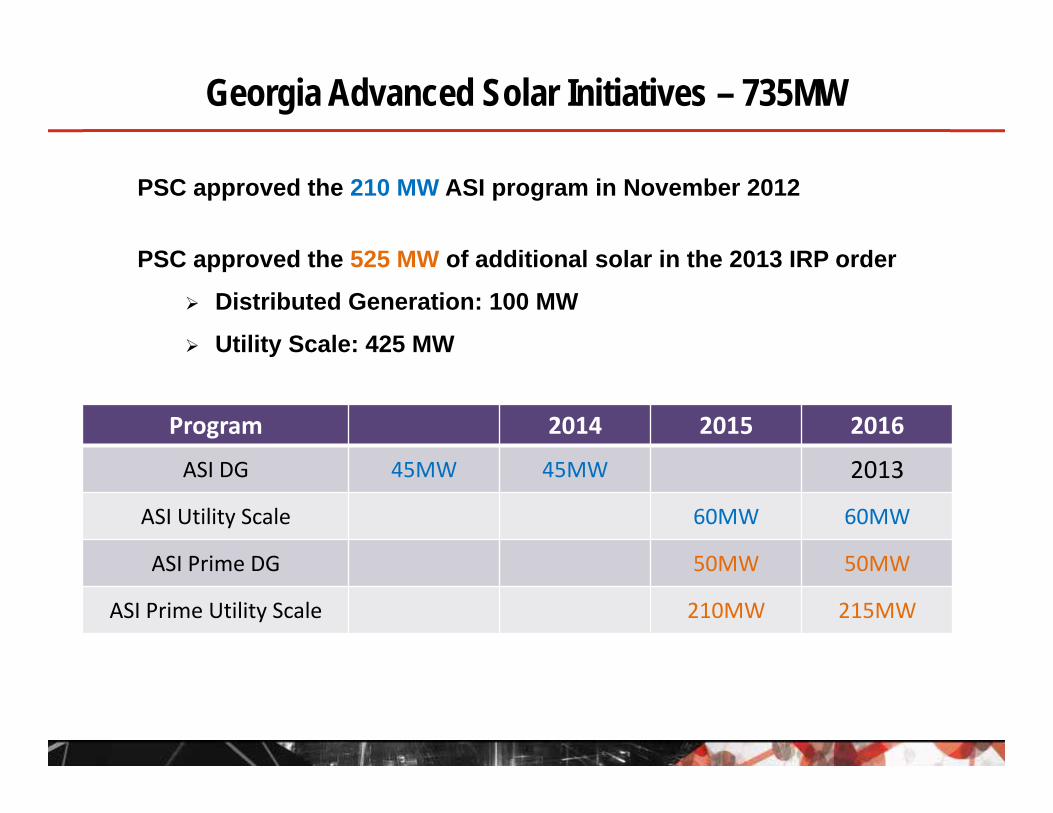
PSC approved the 210 MW ASI program in November 2012
PSC approved the 525 MW of additional solar in the 2013 IRP order
Distributed Generation: 100 MW
Utility Scale: 425 MW
Program 2014 2015 2016
ASI DG 45MW 45MW 2013
ASI Utility Scale 60MW 60MW
ASI Prime DG 50MW 50MW
ASI Prime Utility Scale 210MW 215MW
Georgia Advanced Solar Initiatives – 735MW

Georgia Power Rate Settlement Summary (Docket 36989)
52
• Original filing of $482M levelized rate increase ($1,446M over 3 years)
• 11.5% ROE (band of 10.25% to 12.25%)
Original Filing
• Step increases of $110M, $187M, $170M for 2014-2016 ($874M over 3 years)
• 10.95% ROE (band of 10% to 12%)
• Depreciation rates lowered
Settlement
ROE midpoint reduced 20bps from current level (11.15% to 10.95%)
Top end of allowed retail range dropped 25bps (12.25% to 12.00%)
Almost completely funds a normal O&M budget
Approved by Commission 12/17/13

Gulf Power Rate Settlement Summary (Docket 130140-EI)
53
• Original filing of $74M in 2014 & $16M in 2015 – Rates effective April 2014 ($56M collection)
& July 2015 ($8M collection) • Midpoint of 11.5% ROE
Original Filing
• Increases of $35M in 2014 & $20M in 2015 (rates effective in January of each year)
• 10.25% ROE (band of 9.25% to 11.25%)• Allowed non-cash adjustment (up to $62.5M)
if ROE below midpoint in any month• ROE adjustment of 25bps if Treasuries increase
by 75bps over any future 6 month period
Settlement
Maintains current allowedROE midpoint and range with potential for an increase
Mitigates downside throughnon-cash adjustment
Results in cash flowconsistent with expectations
Approved by Commission 12/3/13


