75
SPATIAL ANALYSIS AND ANALYSIS TOOLS Swapnil Shrivastav | Venkatesh RY.
| Date post: | 15-Jul-2015 |
| Category: |
Data & Analytics |
| Upload: | swapnil-shrivastav |
| View: | 192 times |
| Download: | 0 times |
SPATIAL ANALYSIS AND ANALYSIS TOOLS
Swapnil Shrivastav | Venkatesh RY.

Today, we are going to talk about
3very important topics
SPATIAL INFOGRAPHICS (bonus)
SPATIAL ANALYSIS
ANALYSIS TOOLS
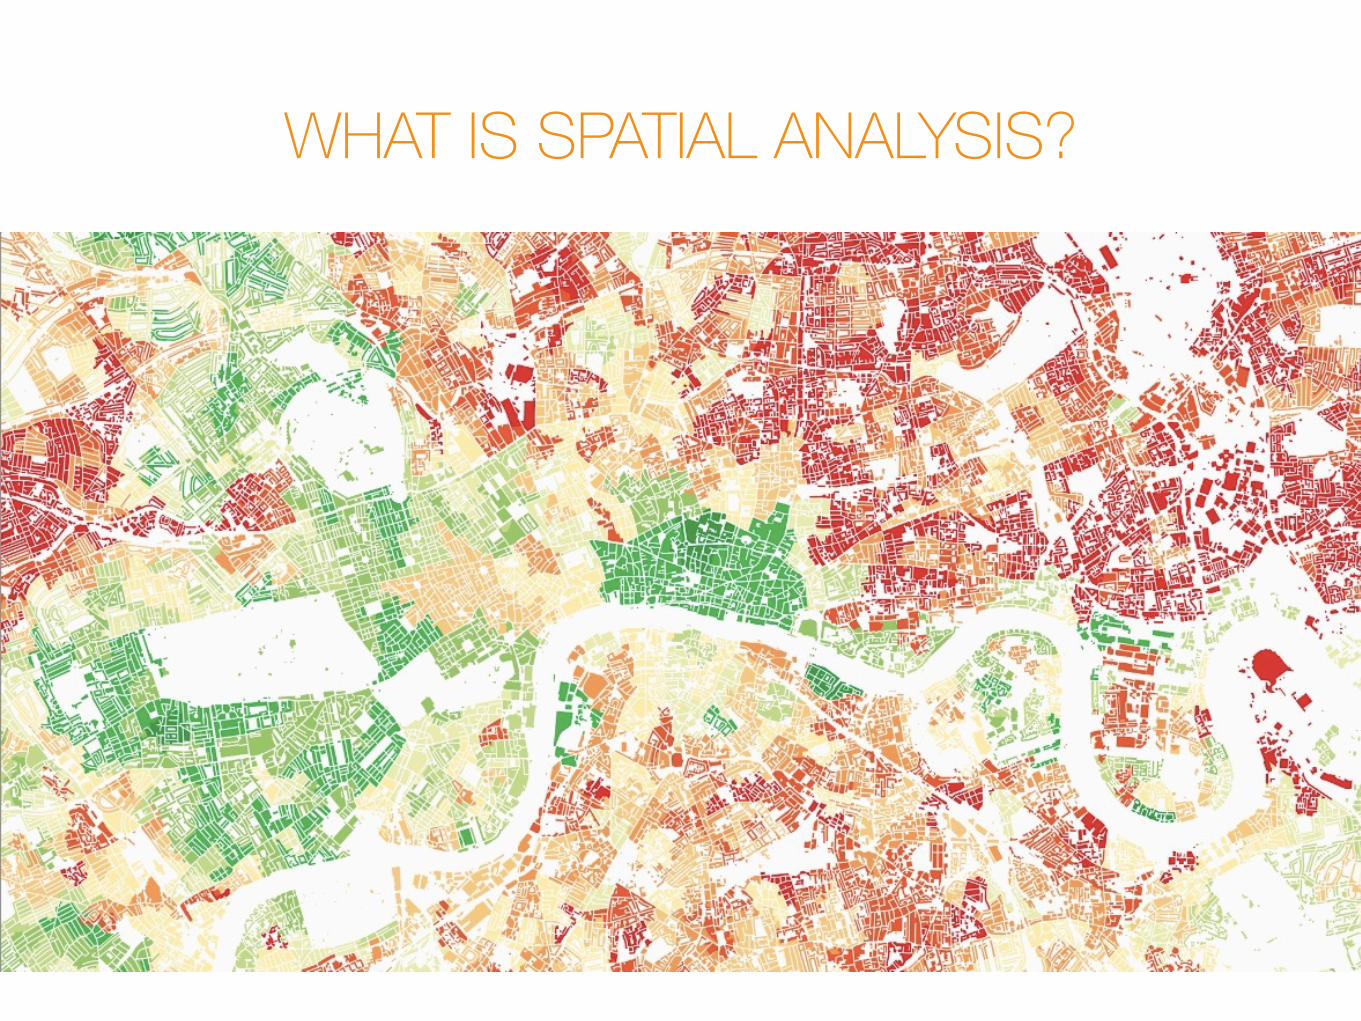
WHAT IS SPATIAL ANALYSIS?
WHAT IS SPATIAL ANALYSIS?
Spatial analysis is a set of techniques for analysing spatial data.
The results of spatial analysis are dependent on the locations of the objects being analysed.
Software that implements spatial analysis techniques requires access to both the locations of objects and their attributes.
So, we are mainly dealing with
GEOGRAPHIC DATA
but that’s not it.
ASTRONOMY, TOPOLOGY, FABRICATION ENGINEERING, ECONOMICS
also make use of spatial analysis.
Spatial analysis provides answers to
4W’s and 1H
WHAT are the most suitable locations for dams?
WHEN will the water table be re-instated?
WHY land use pattern needs variety?
WHERE are the densest places in the city?
HOW will traffic look like in next 3 days?
Moving on, to the types of Spatial Analysis
7 TYPES
1 SPATIAL DATA ANALYSIS
Large tables of spatial data obtained from censuses and surveys.
Simplifying the huge amount of detailed information in order to extract the main trends.
Multi-variate analysis is followed- it considers more than one variable at a time.
2 SPATIAL AUTOCORRELATION
Measures and analyses the degree of dependency among observations in a geographic space.
Eg- In a neighbourhood, the distances between neighbours, or whether they fall into a specified directional class.
Rainfall and the water table.
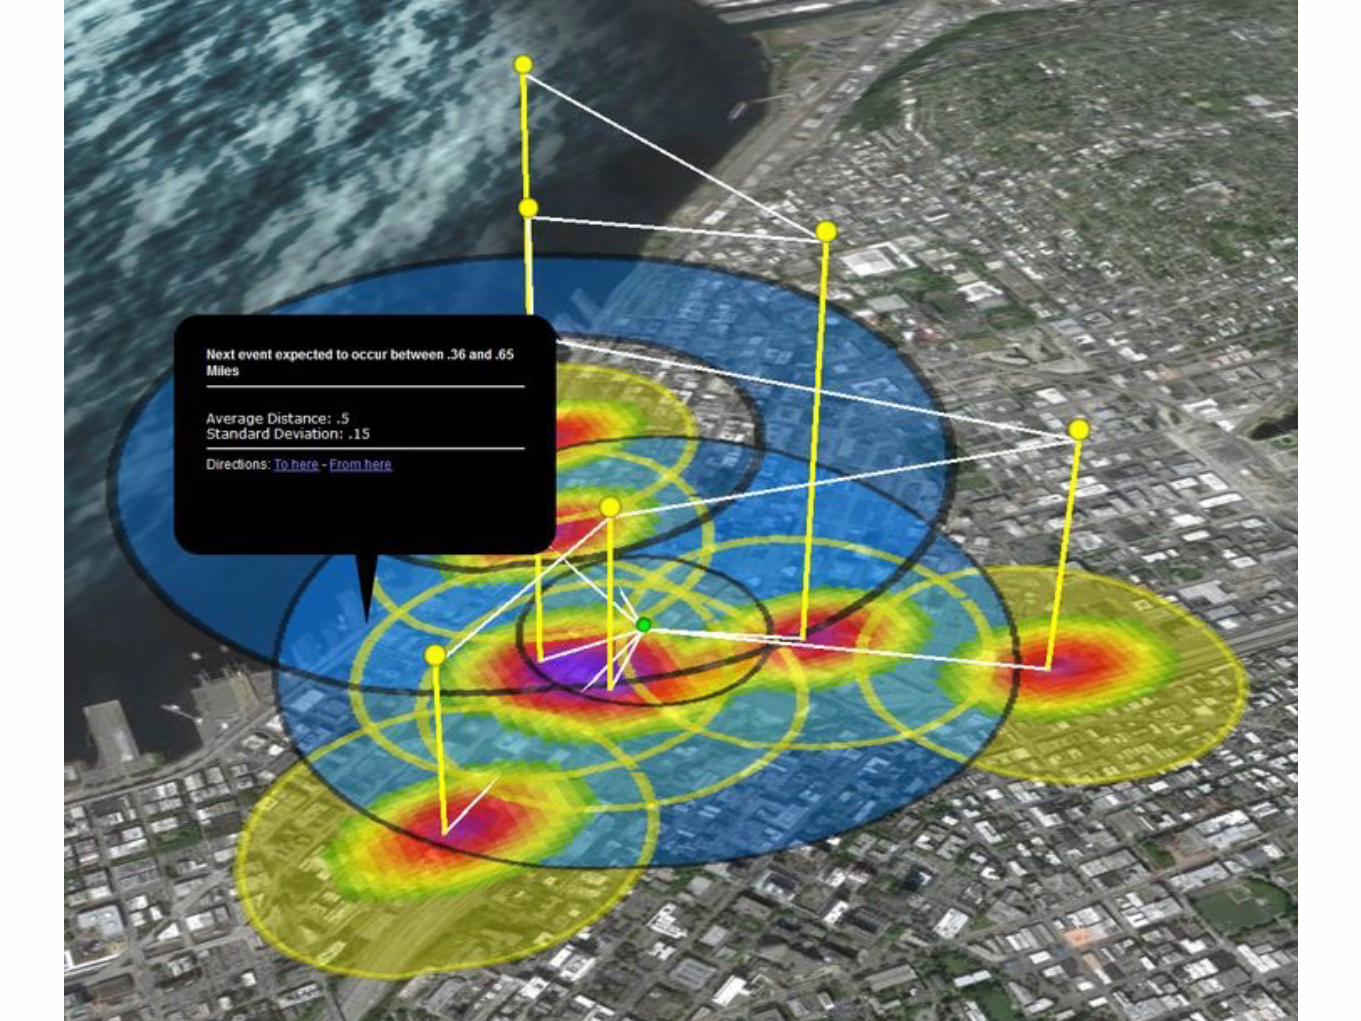
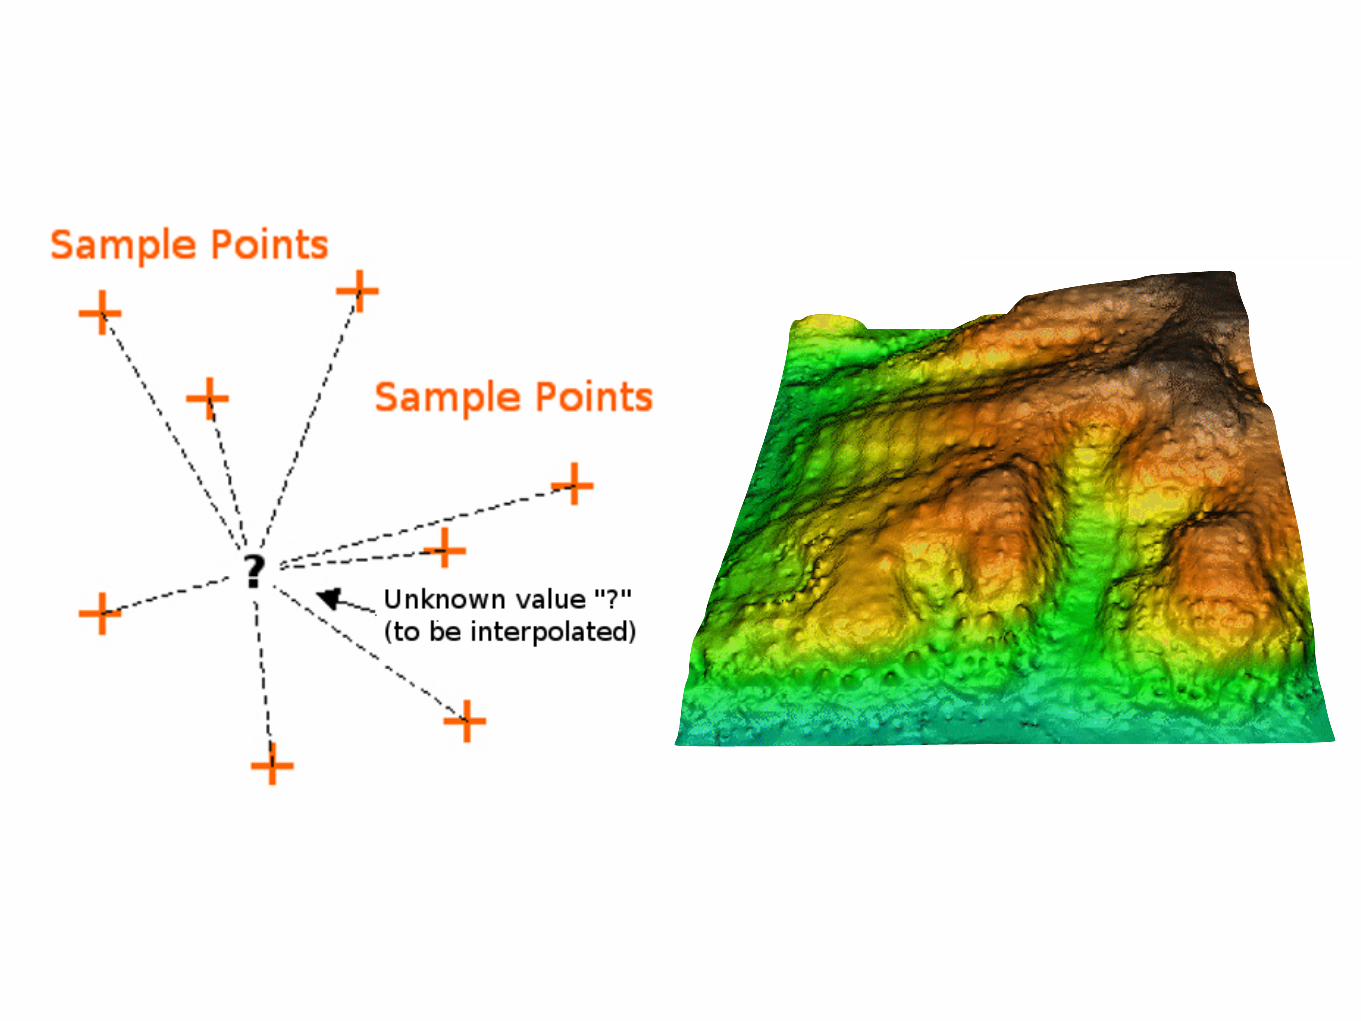
3 SPATIAL INTERPOLATION
Estimates the variables at unobserved locations in geographic space based on the values at observed locations.
Eg- Traffic prediction down the road.
4 SPATIAL REGRESSION
Captures spatial dependency, avoiding statistical problems such as unstable parameters and unreliable significance tests.
Generating predictions from partial data sets.
Eg- Archaeological survey and conservation
5 SPATIAL INTERACTION
Spatial interaction or "gravity models" estimate the flow of people, material or information between locations in geographic space.
Eg- Destination attractiveness variables such as the amount of office space in employment areas
Proximity relationships between the locations measured in terms such as driving distance or travel time.
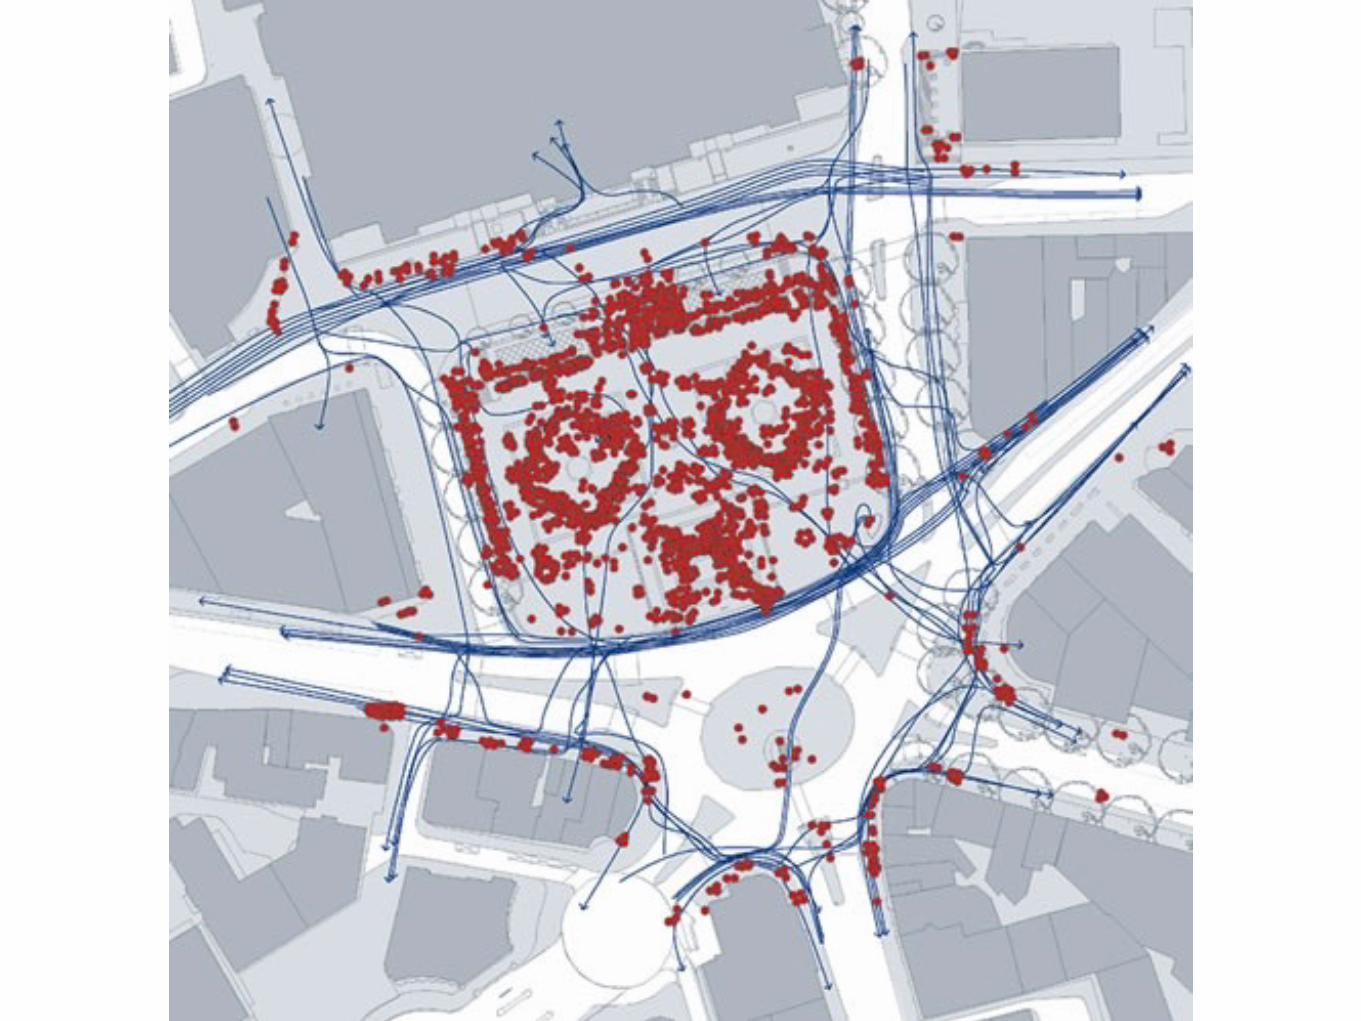
6 SIMULATION AND MODELLING
Study the emergence of complex patterns and relationships from behaviour and interactions at the individual level.
Eg- One could model traffic flow and dynamics using agents representing individual vehicles that try to minimise travel time between
specified origins and destinations.
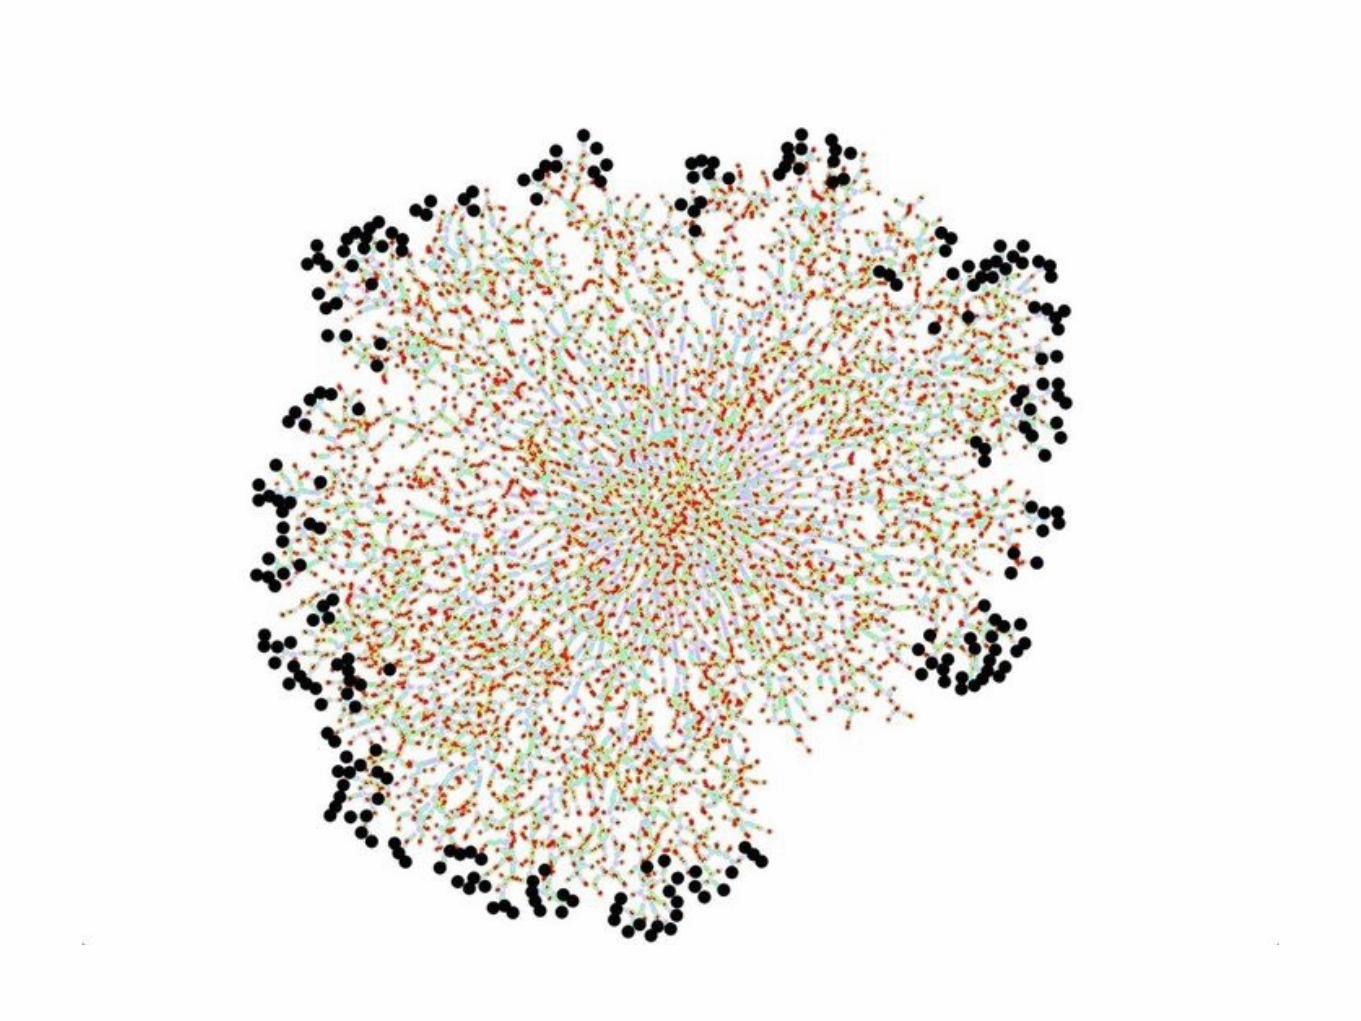
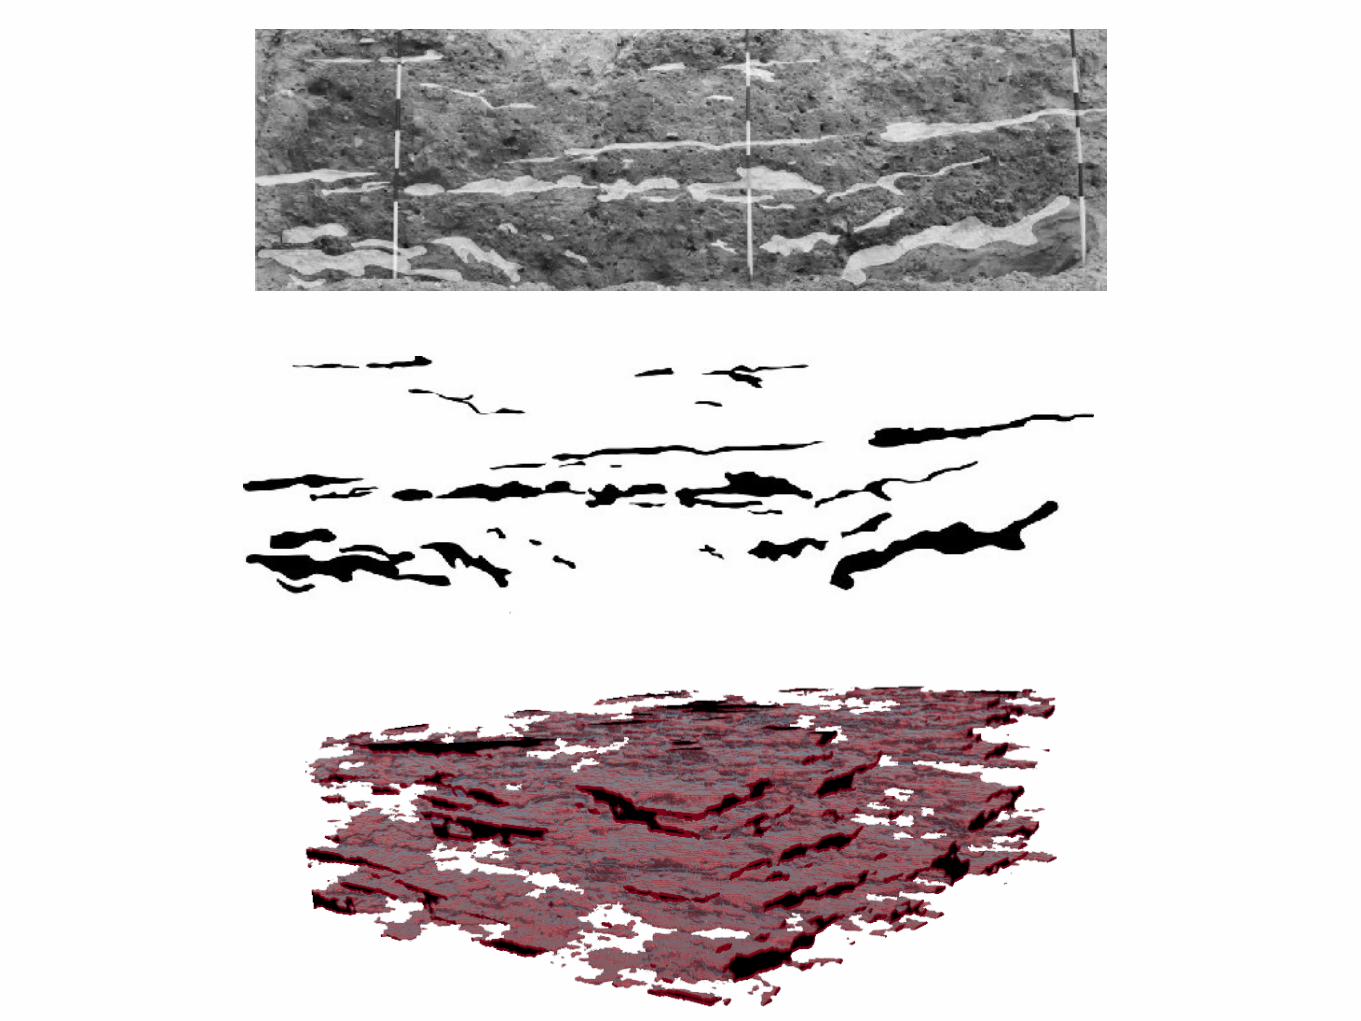
7 MULTIPLE-POINT GEOSTATISTICS
Spatial analysis of a conceptual geological model is the main purpose of any MPS algorithm.
Conceptual model is called training image.
The method analyzes the spatial statistics and generates realizations of the phenomena that honor those input multiple-point statistics.
To learn and simulate specific structural patterns.

Next, we are going to talk about
infinite analysis tools
#01map algebra
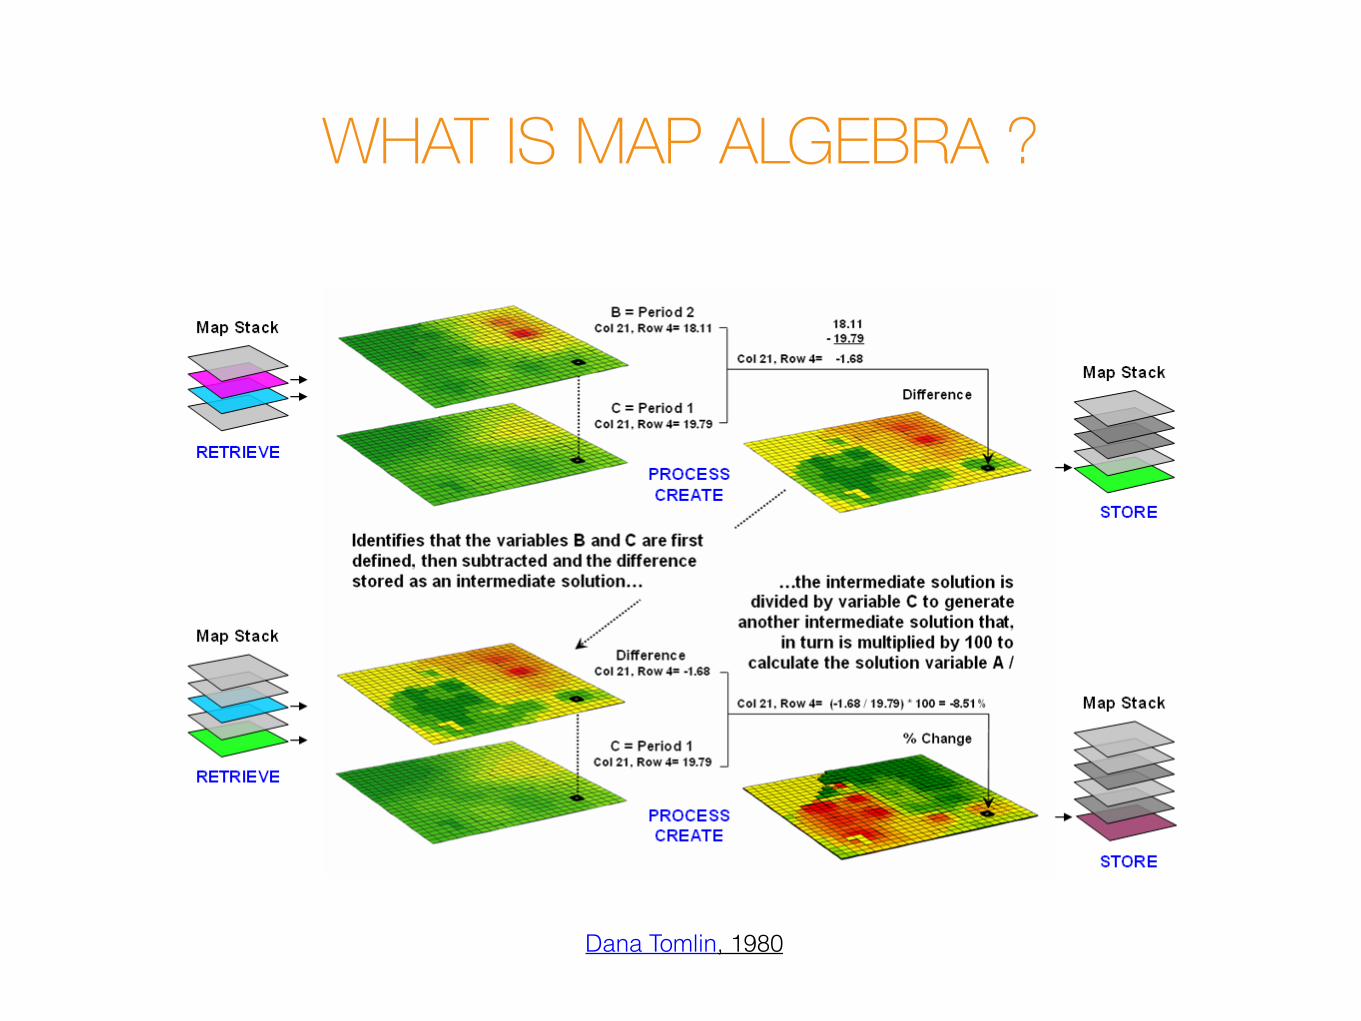
WHAT IS MAP ALGEBRA ?
Dana Tomlin, 1980
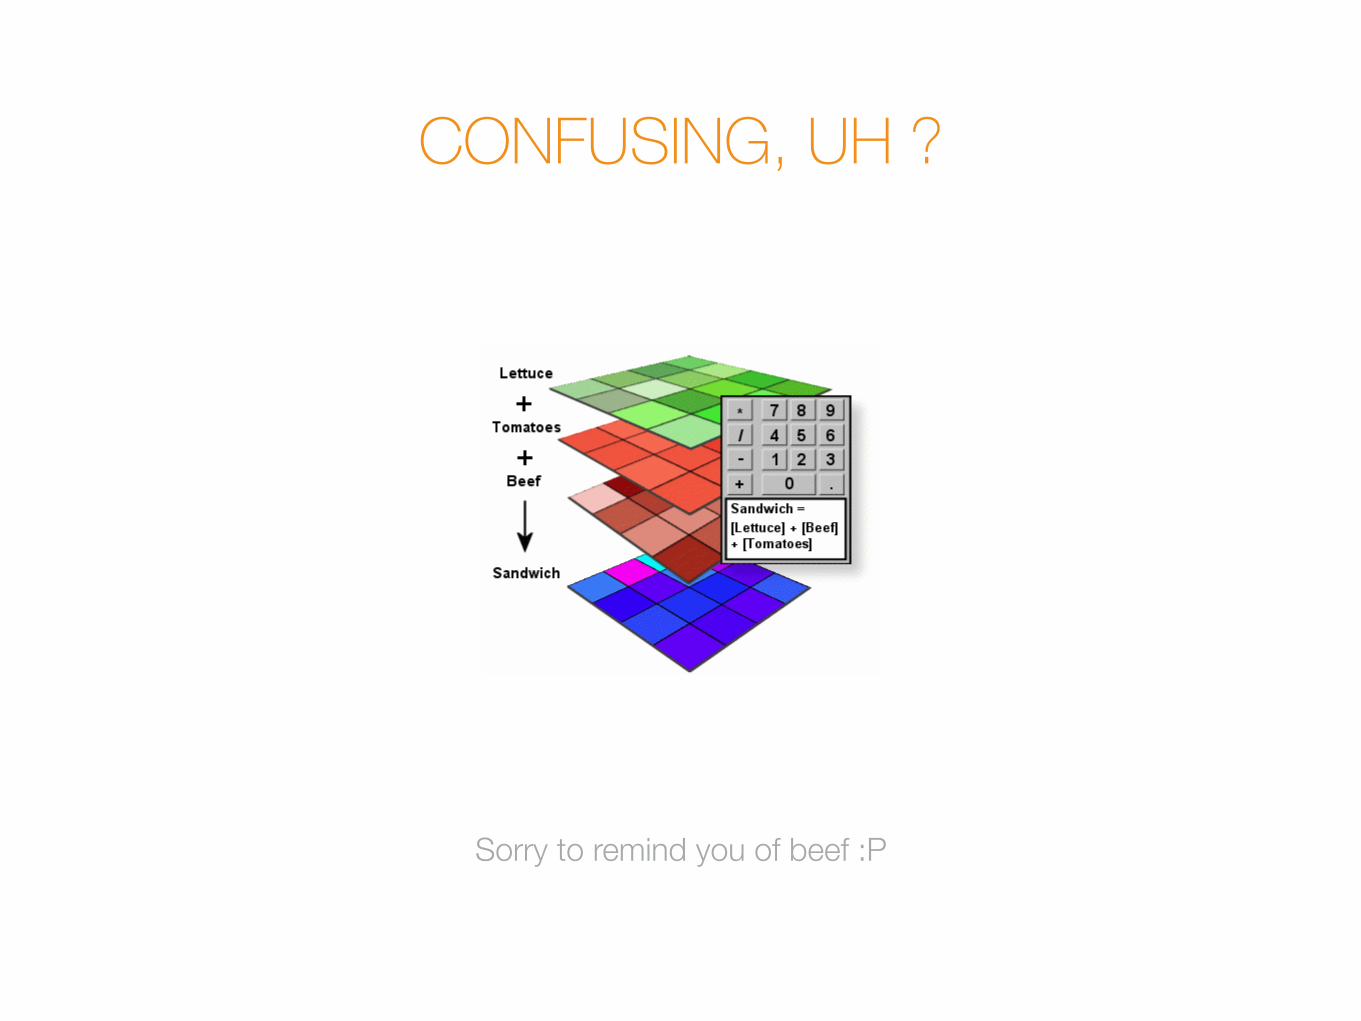
CONFUSING, UH ?
Sorry to remind you of beef :P
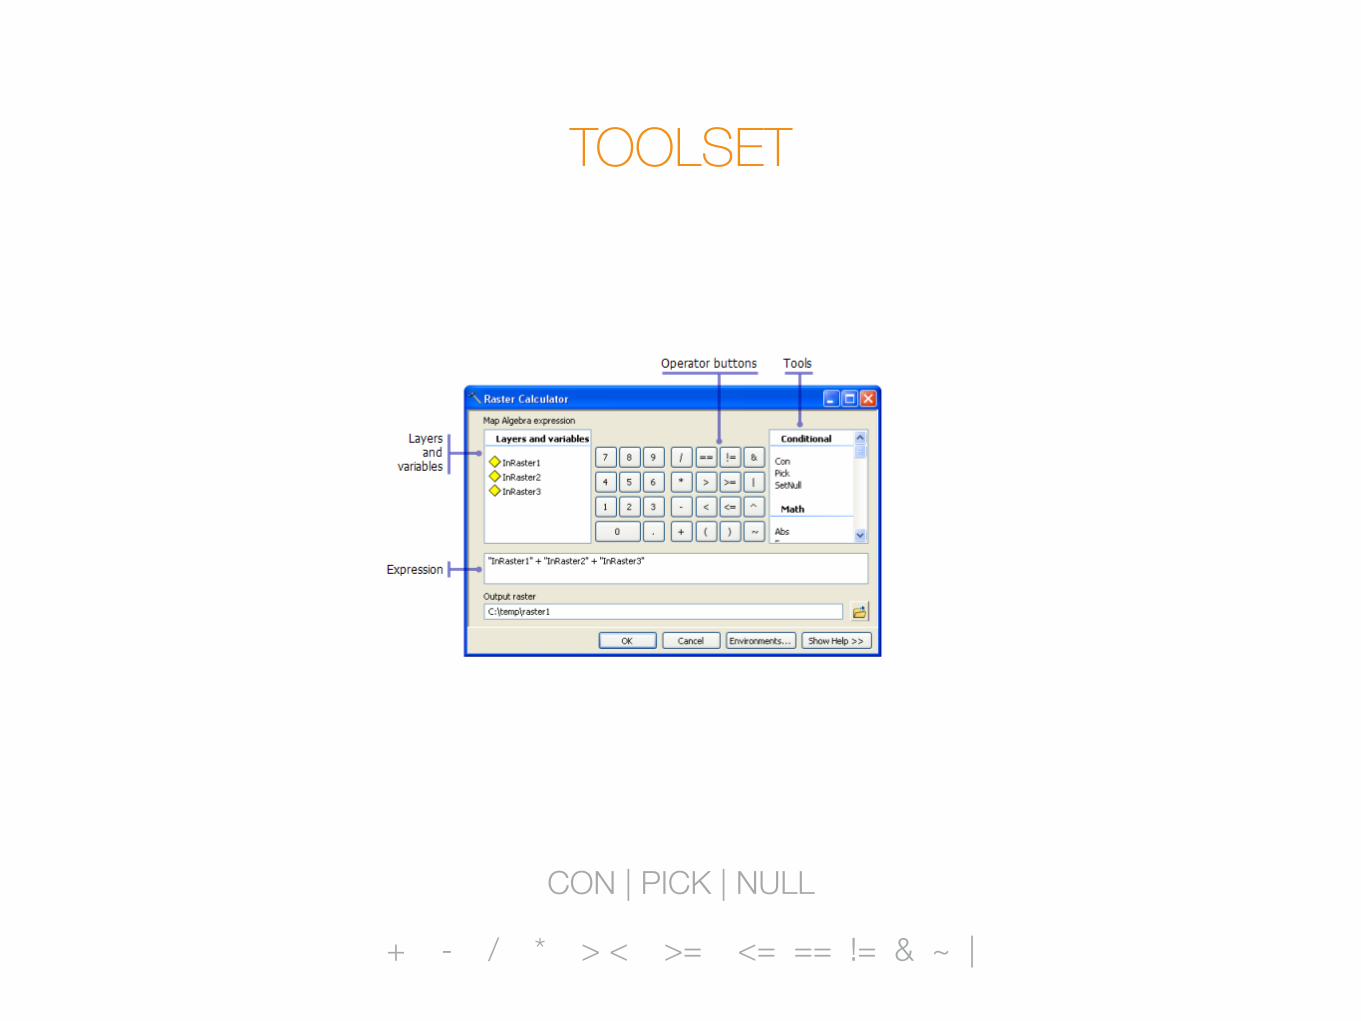
TOOLSET
CON | PICK | NULL
+ - / * > < >= <= == != & ~ |

#02math toolset
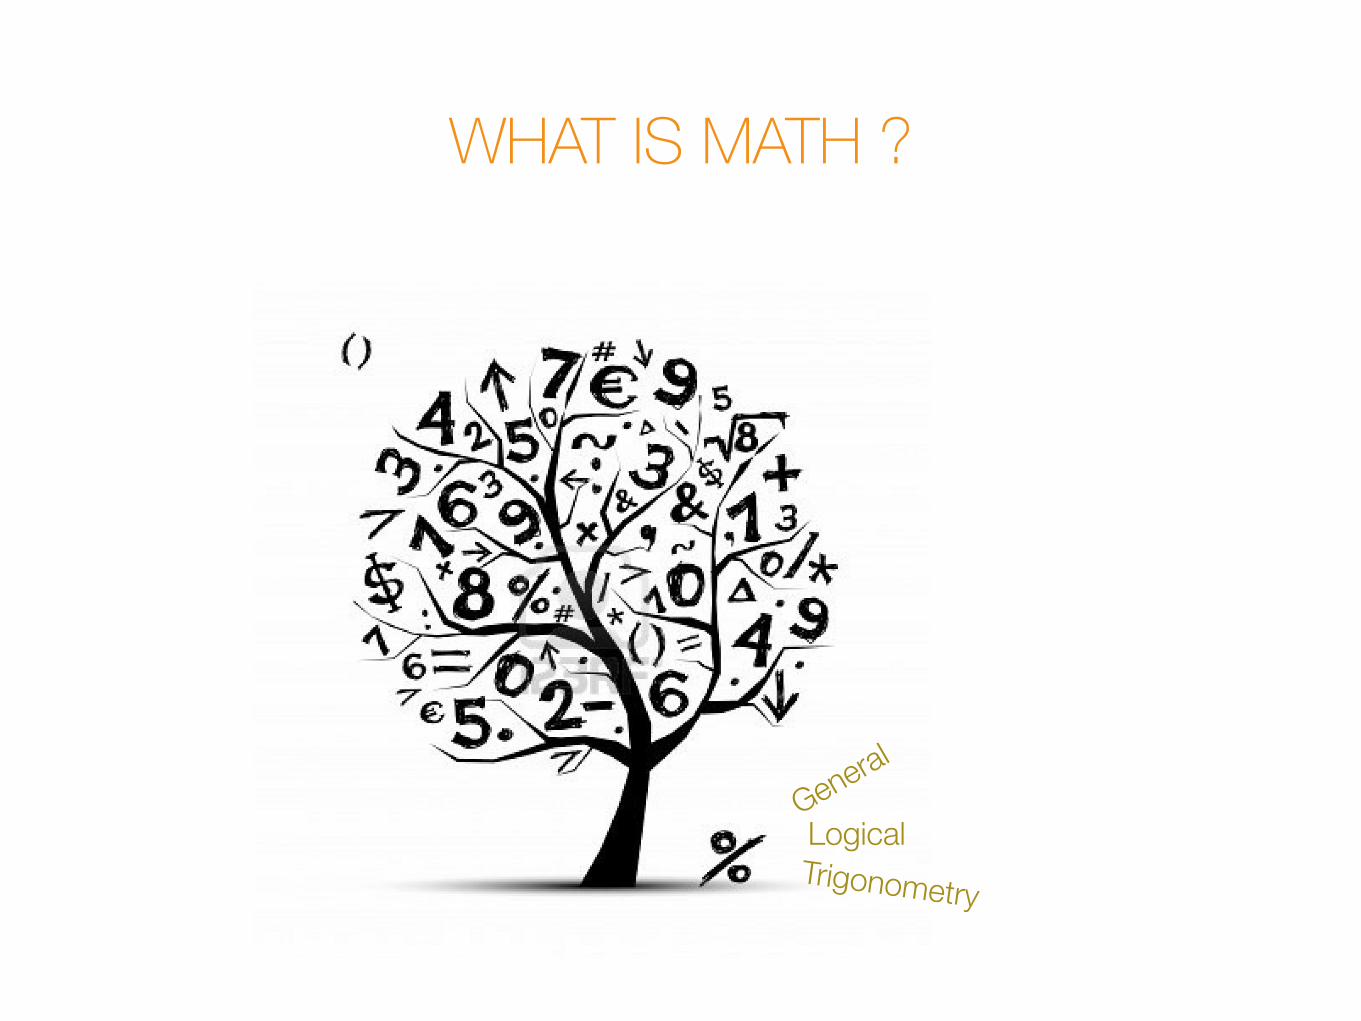
WHAT IS MATH ?
General
LogicalTrigonometry
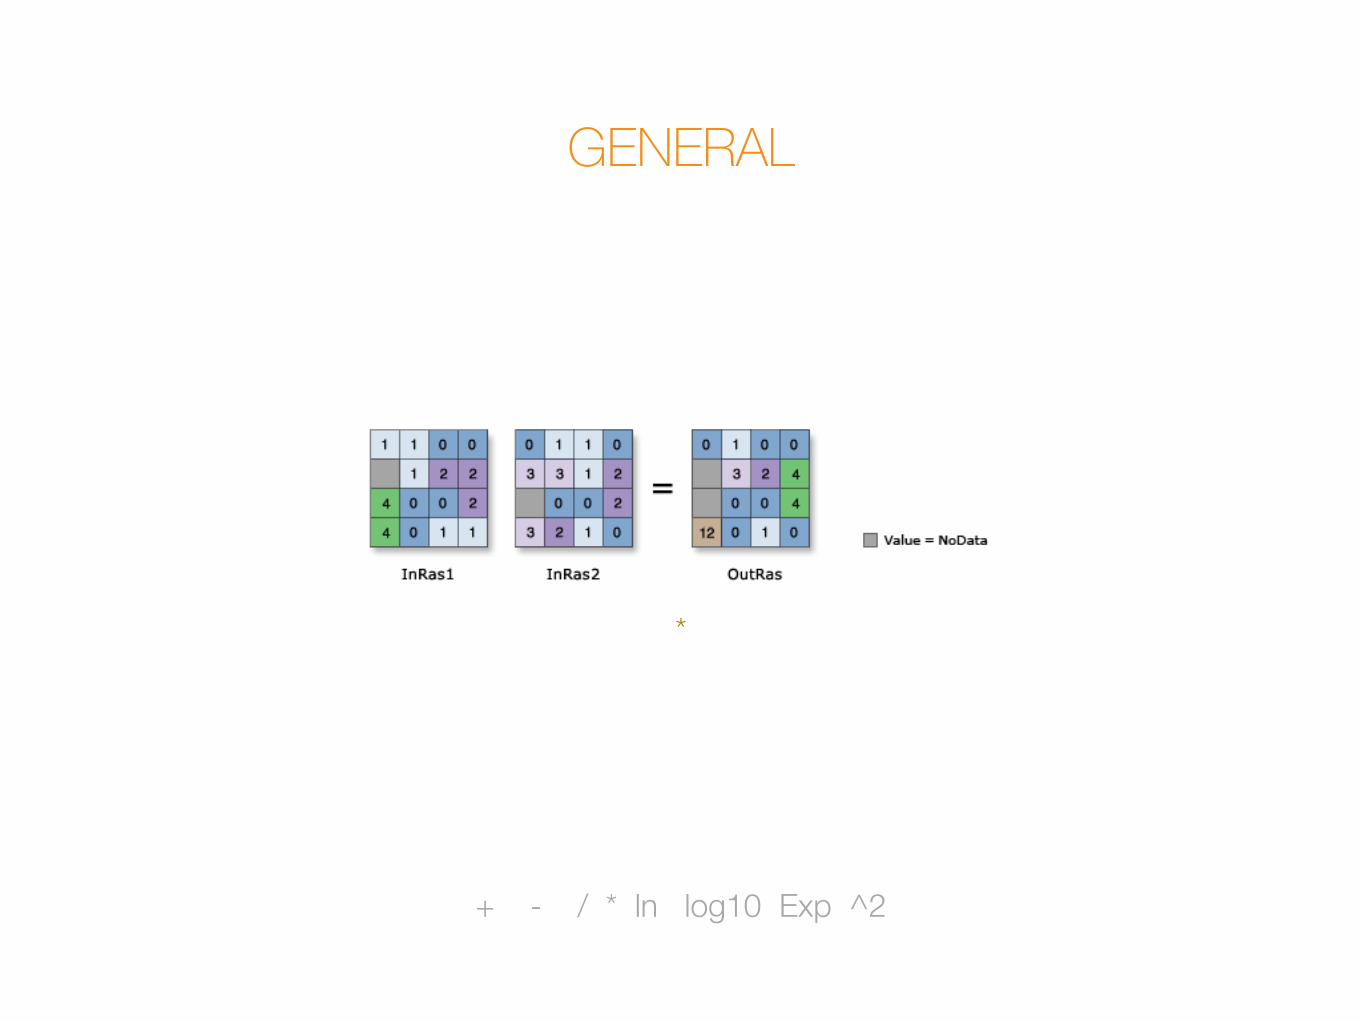
GENERAL
+ - / * ln log10 Exp ^2
*
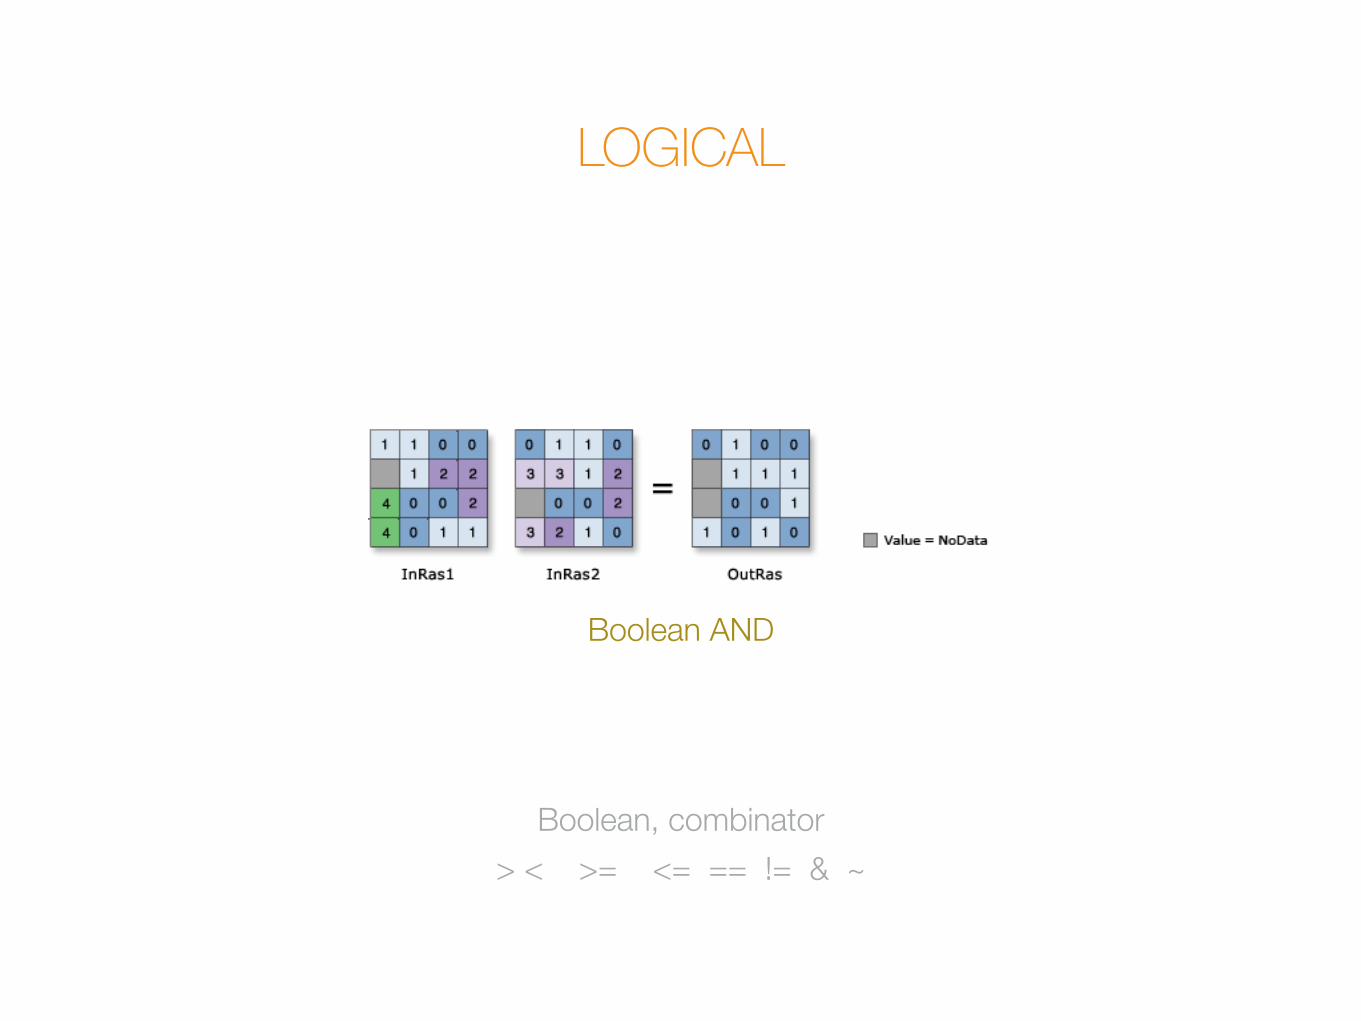
LOGICAL
> < >= <= == != & ~Boolean, combinator
Boolean AND
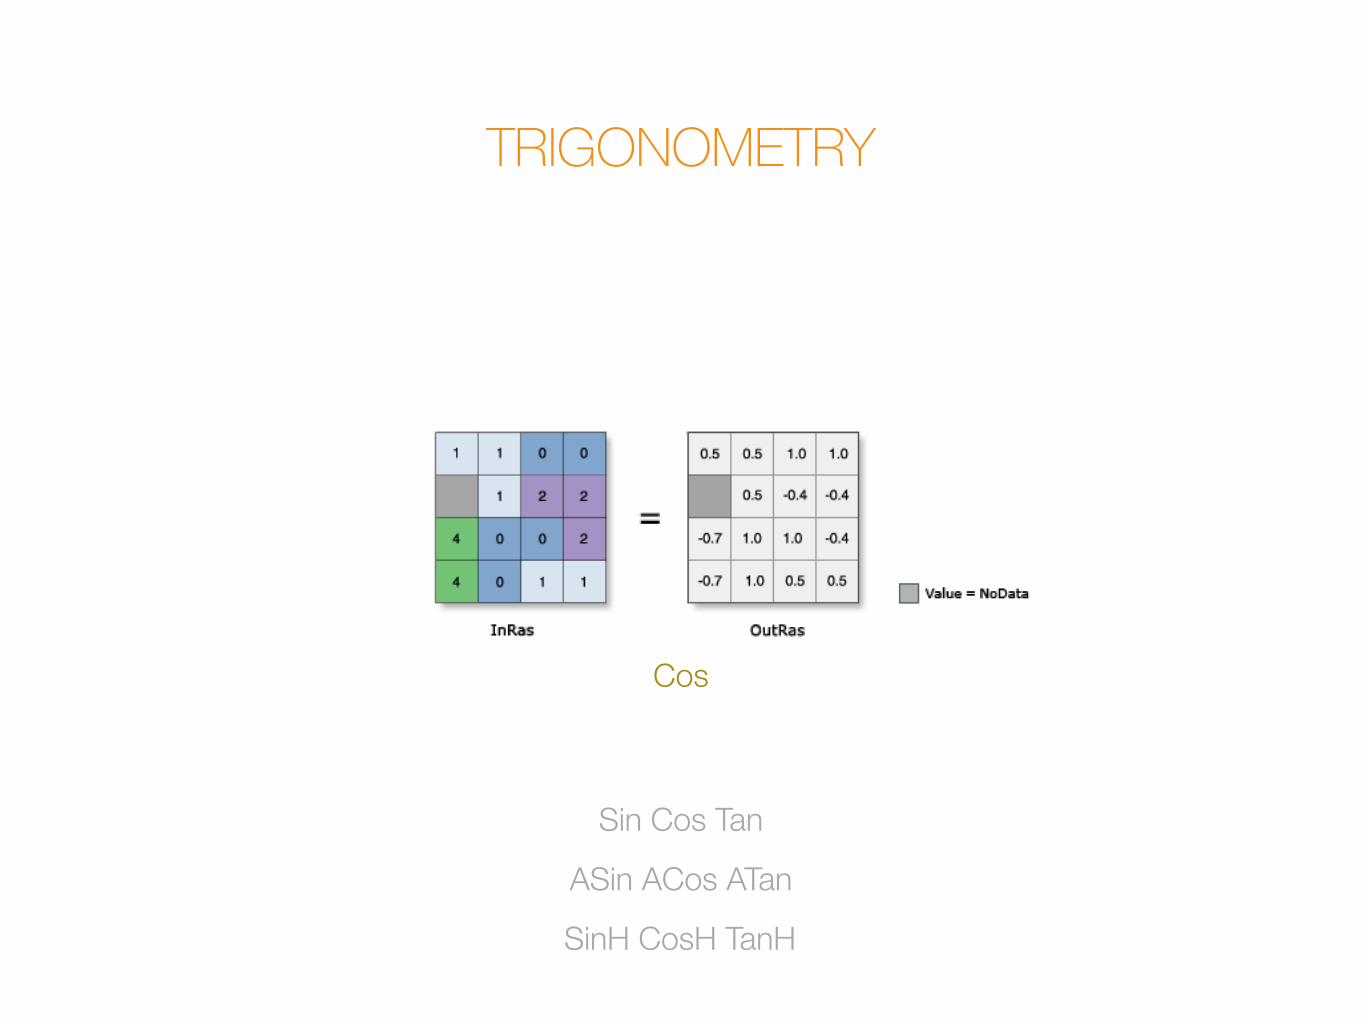
TRIGONOMETRY
Sin Cos Tan
Cos
ASin ACos ATan
SinH CosH TanH

#03multi-variate toolset
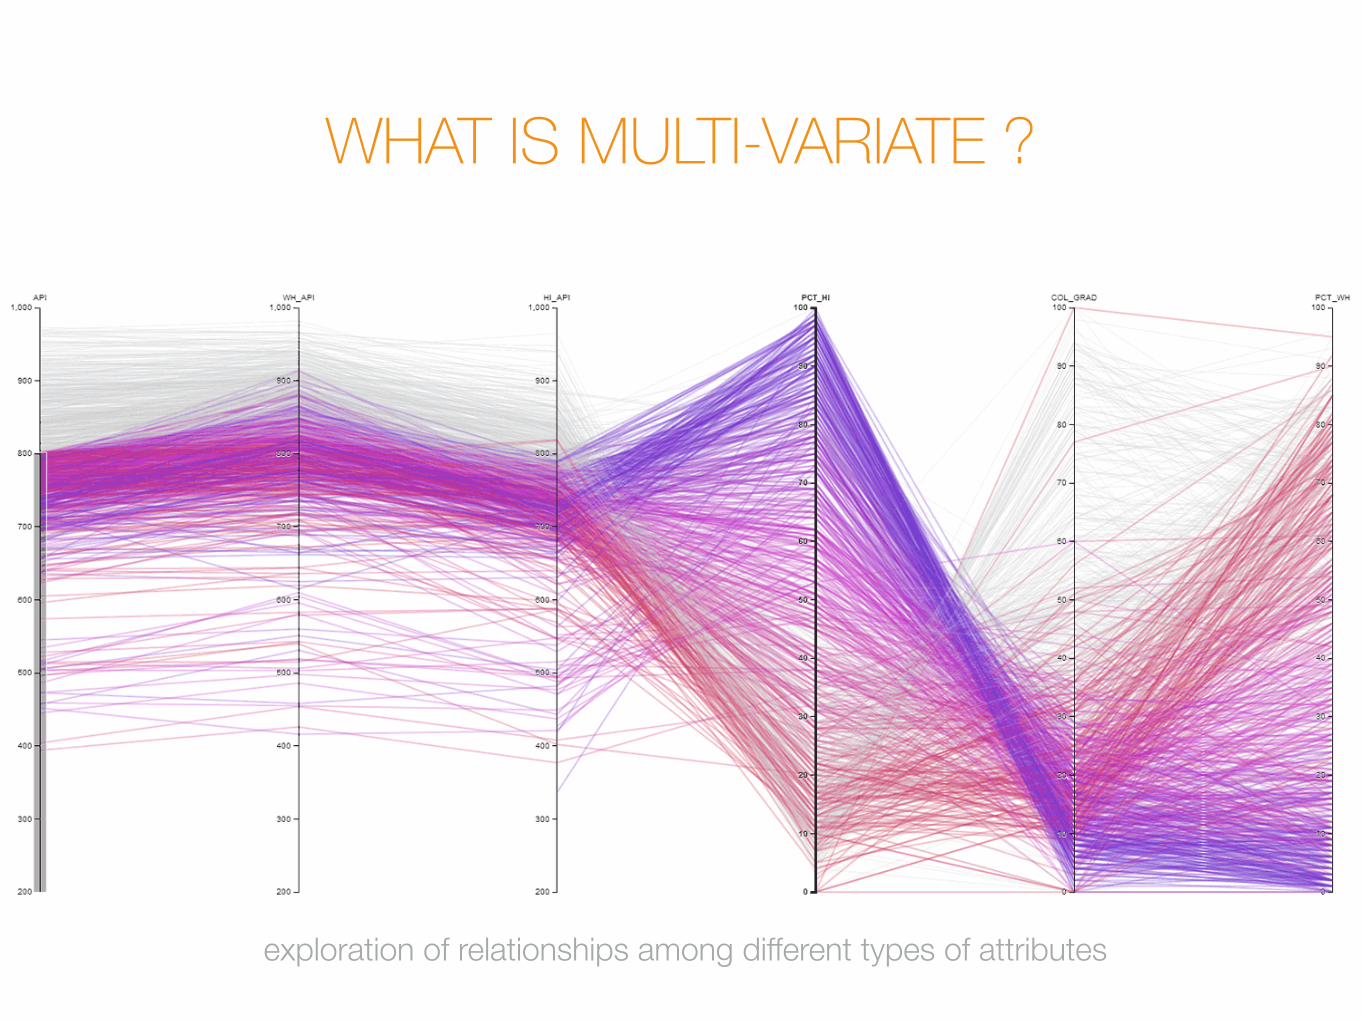
WHAT IS MULTI-VARIATE ?
exploration of relationships among different types of attributes
TOO MUCH !
Band Collection Statistics
Class Probability
Create Signatures
Dendrogram
Iso Cluster
Band collectionCombining and calculating
The statistics of raster bandsMore like extracting .xls from a layer
Class ProbabilityCreates a multiband raster
of probability bandsInput file to output raster
Create SignatureCreates an ASCII signature file defined by
input sample data and a set of raster bandsCreating a simple source
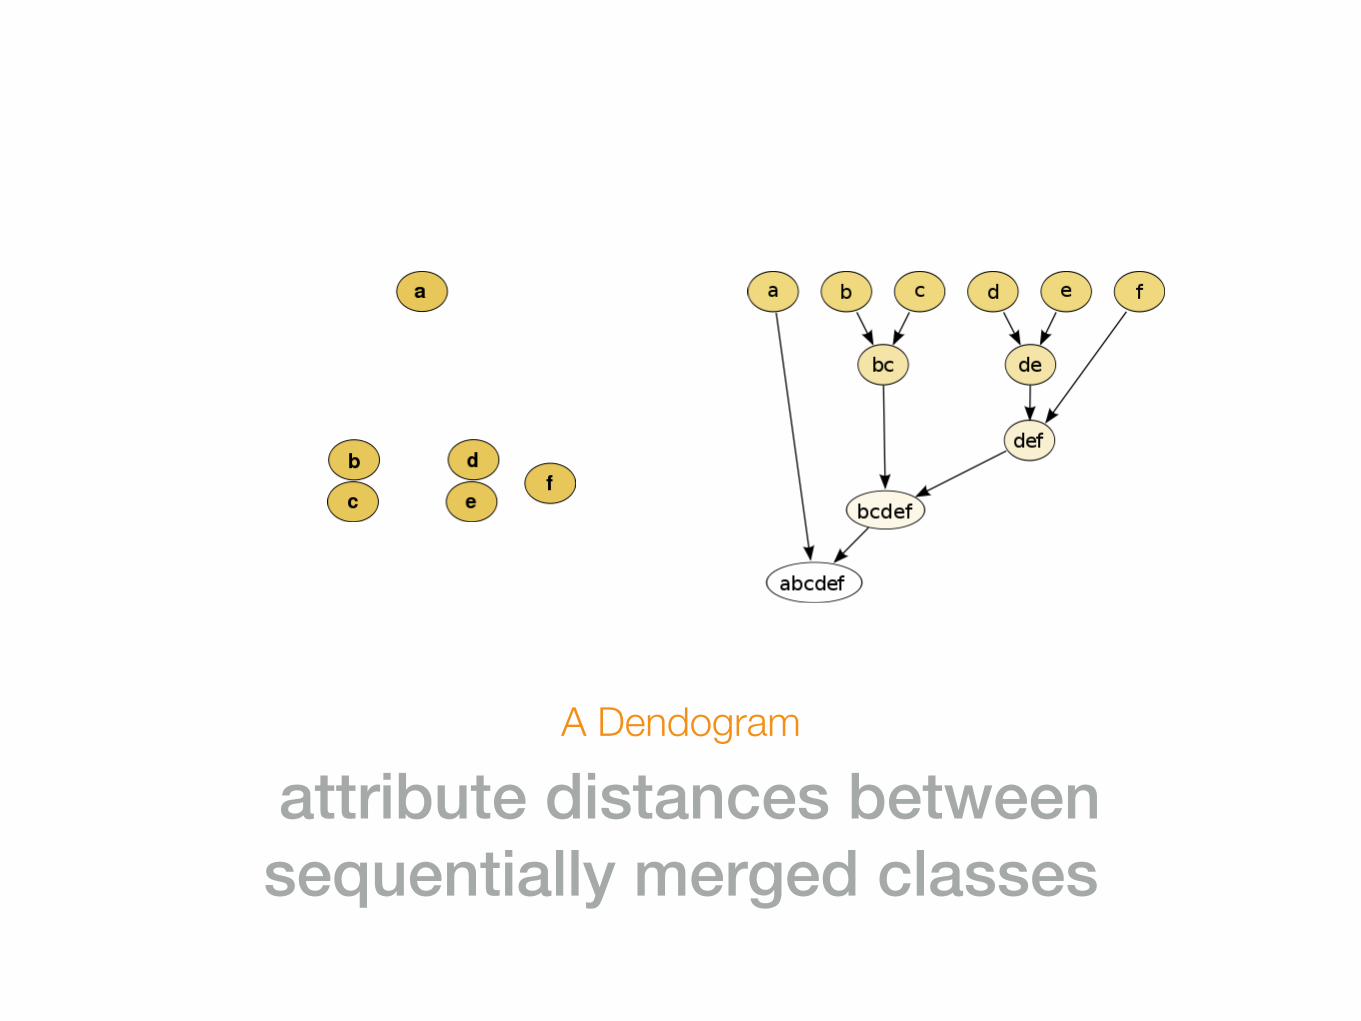
A Dendogram
attribute distances between sequentially merged classes
Iso Clusterclustering algorithm to determine
characteristics of the natural groupingsjust Grouping !
#04neighbourhood toolset
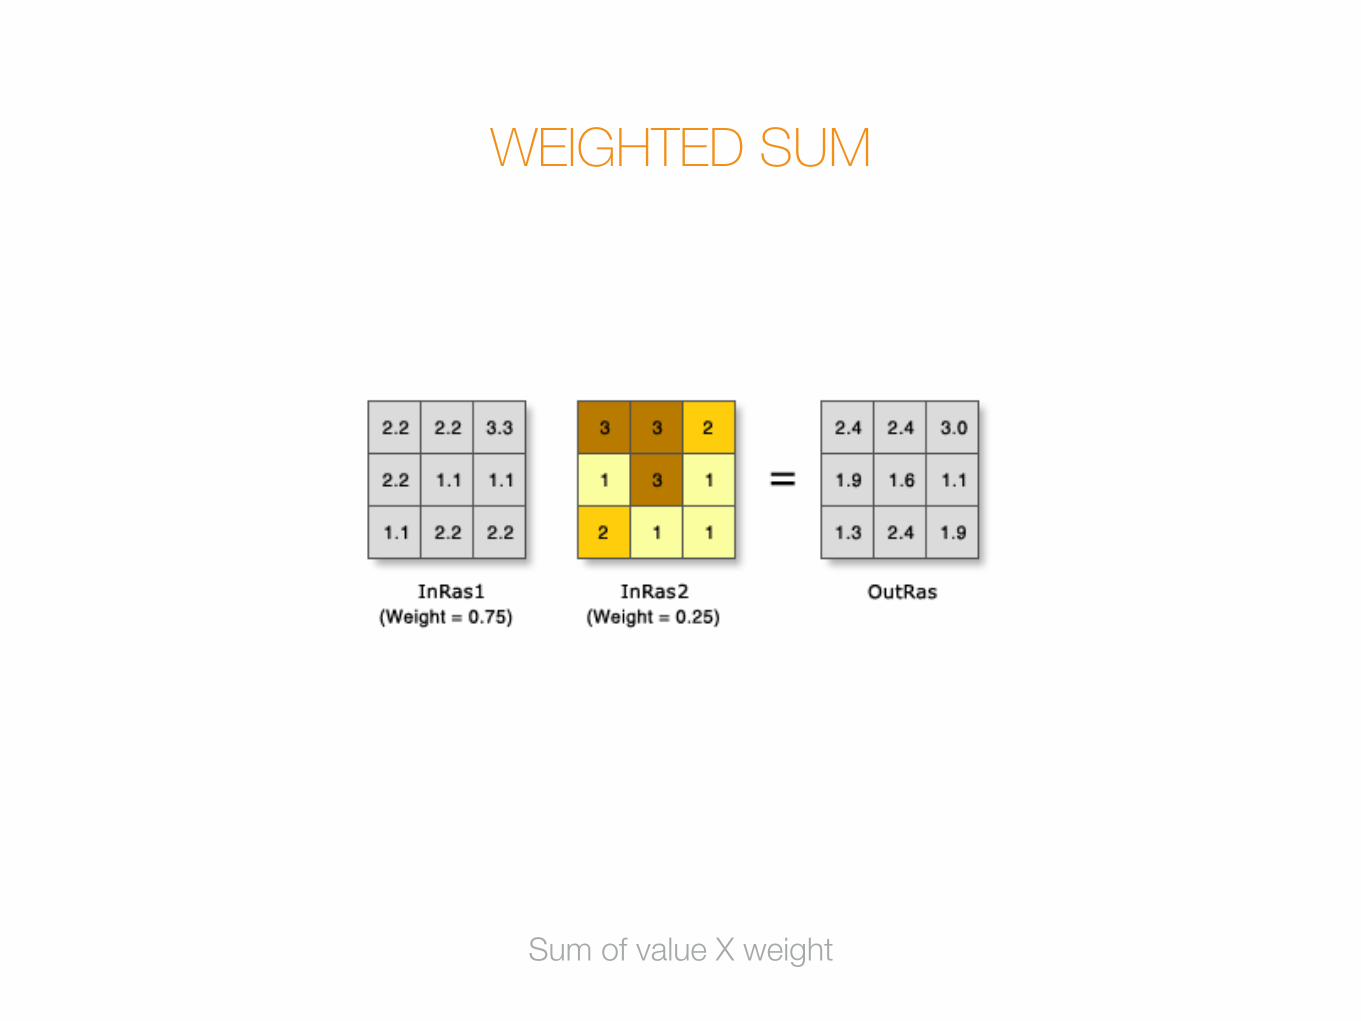
WEIGHTED SUM
Sum of value X weight
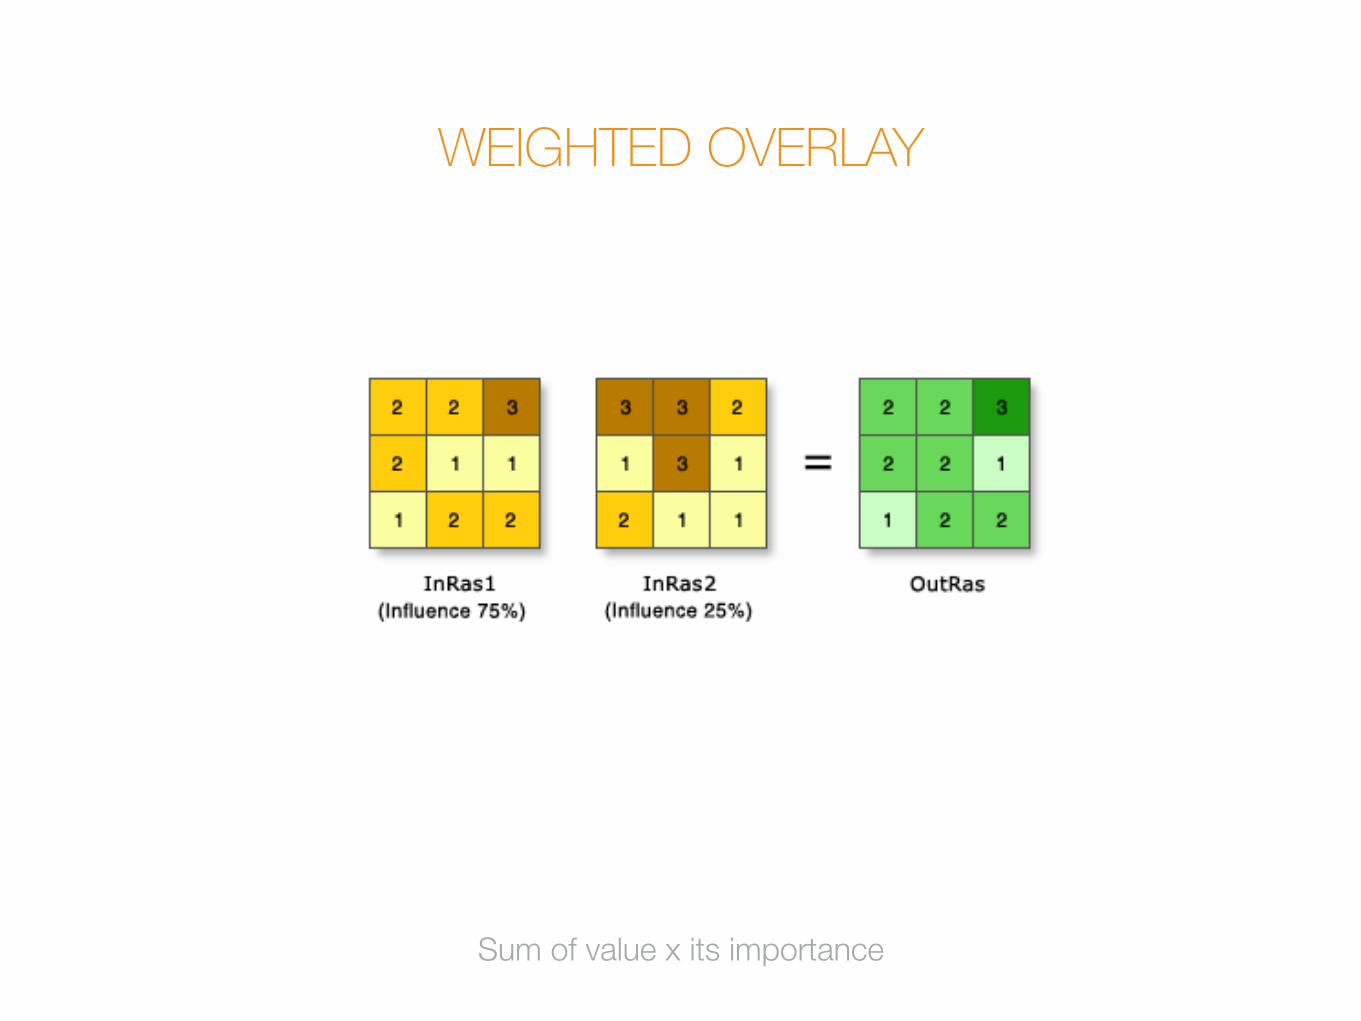
WEIGHTED OVERLAY
Sum of value x its importance
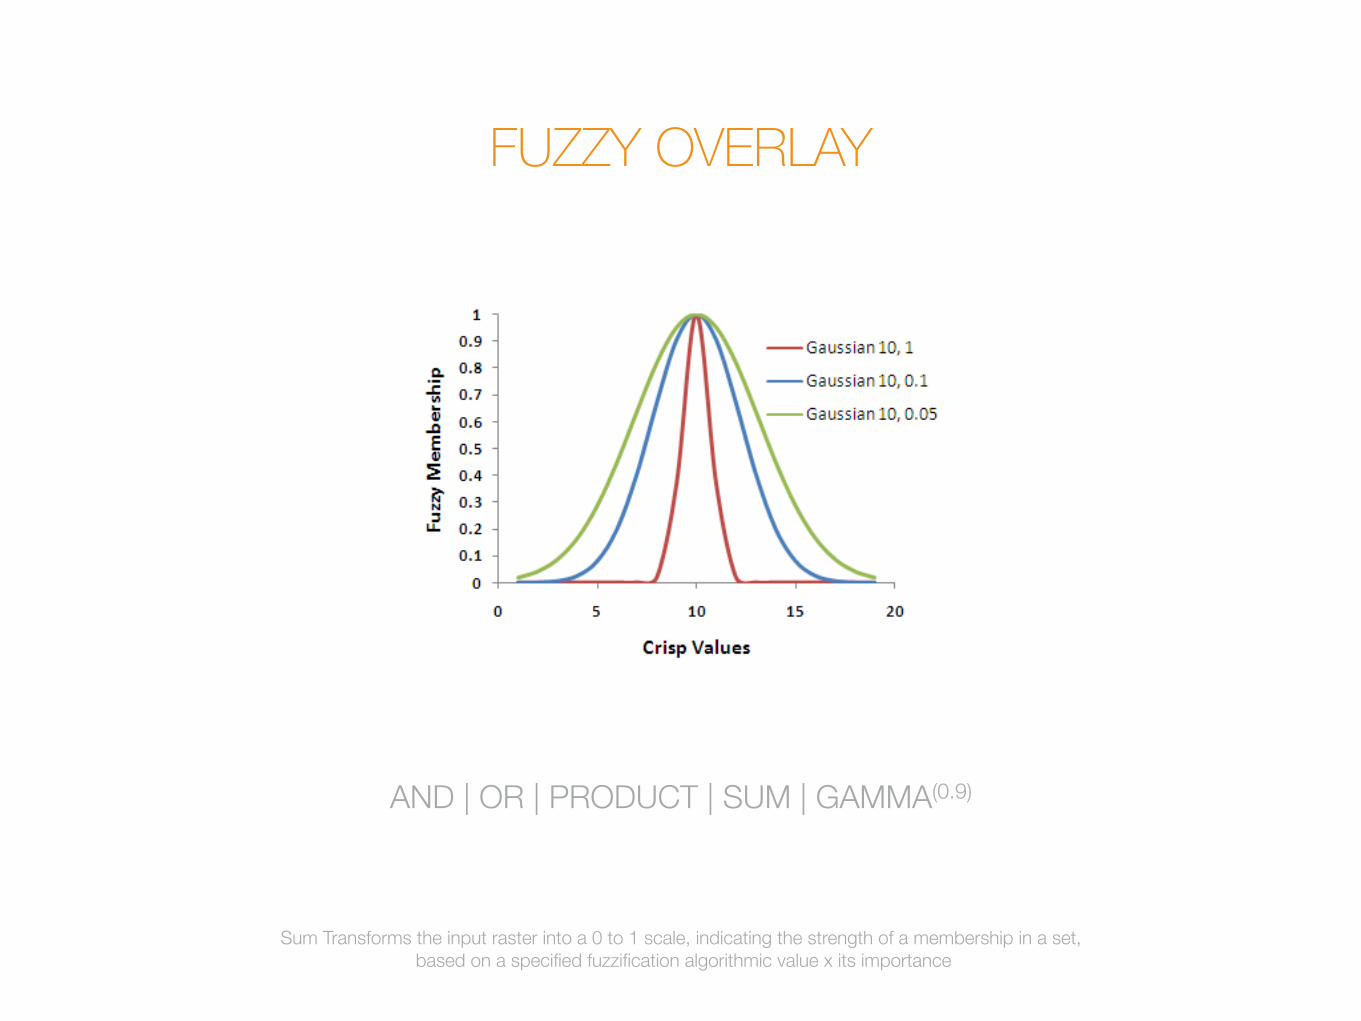
FUZZY OVERLAY
Sum Transforms the input raster into a 0 to 1 scale, indicating the strength of a membership in a set, based on a specified fuzzification algorithmic value x its importance
AND | OR | PRODUCT | SUM | GAMMA(0.9)

#05raster toolset
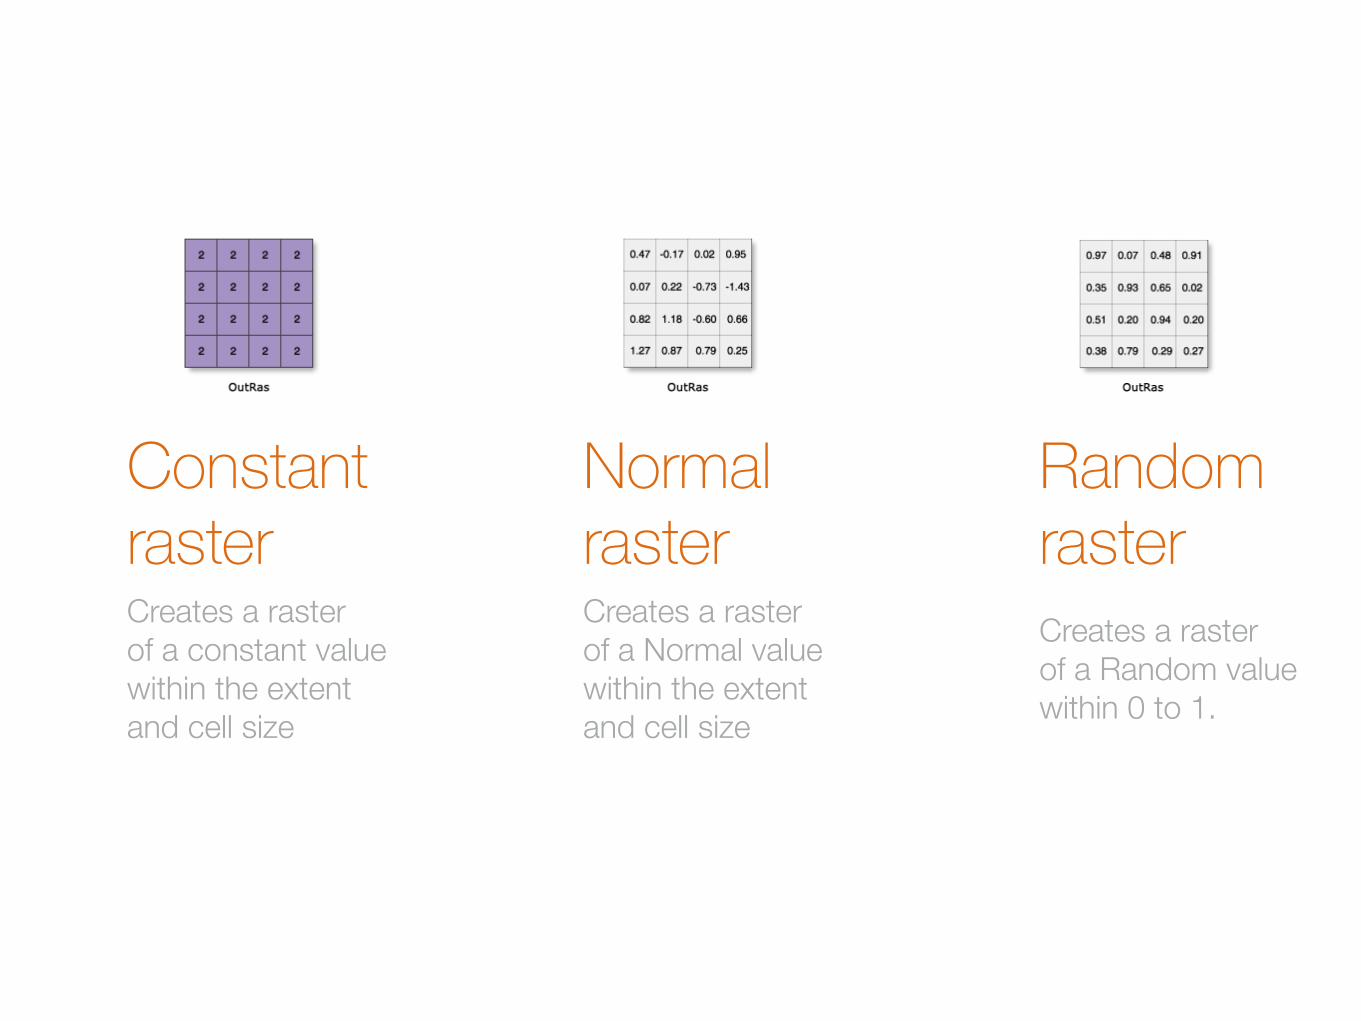
Creates a raster of a constant value within the extent and cell size
Constant
rasterNormal raster
Random
rasterCreates a raster of a Normal value within the extent and cell size
Creates a raster of a Random value within 0 to 1.

#06reclass toolset
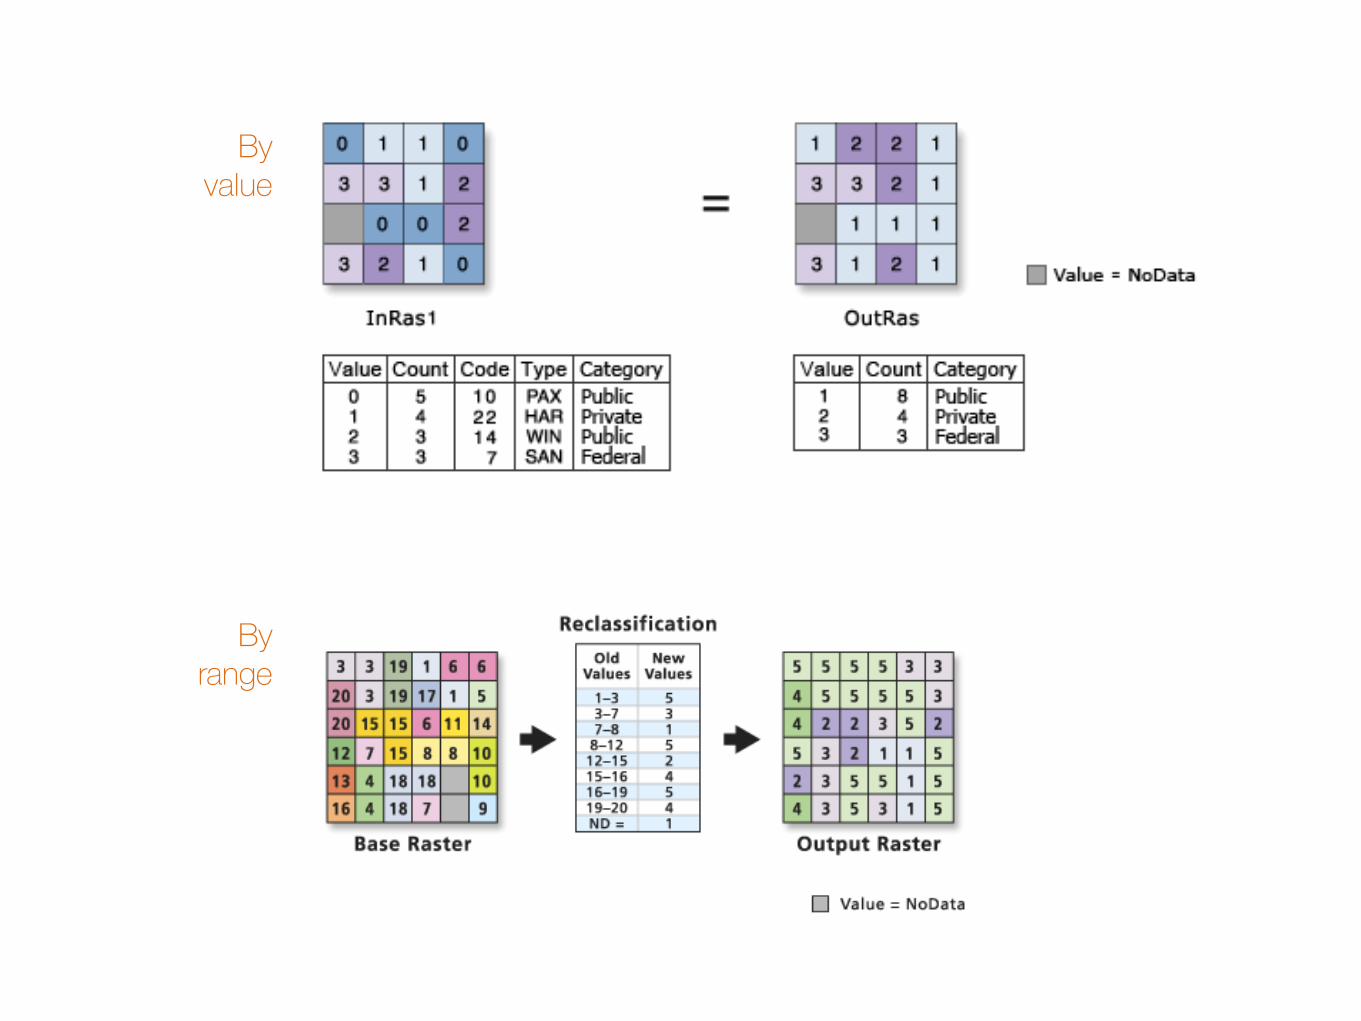
By range
By value
#07neighbourhood toolset
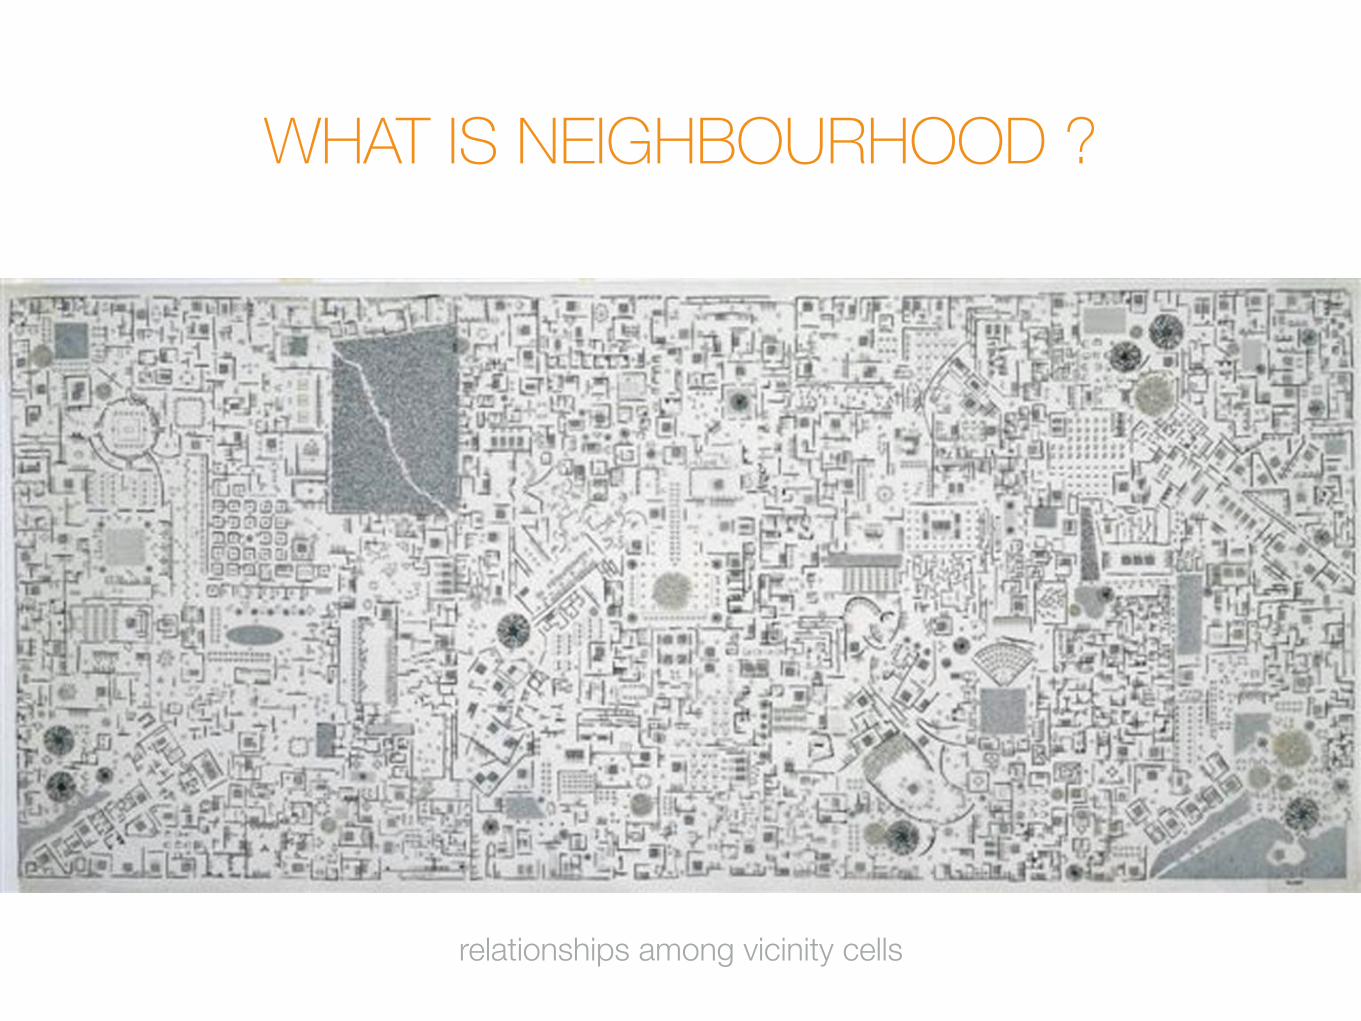
WHAT IS NEIGHBOURHOOD ?
relationships among vicinity cells
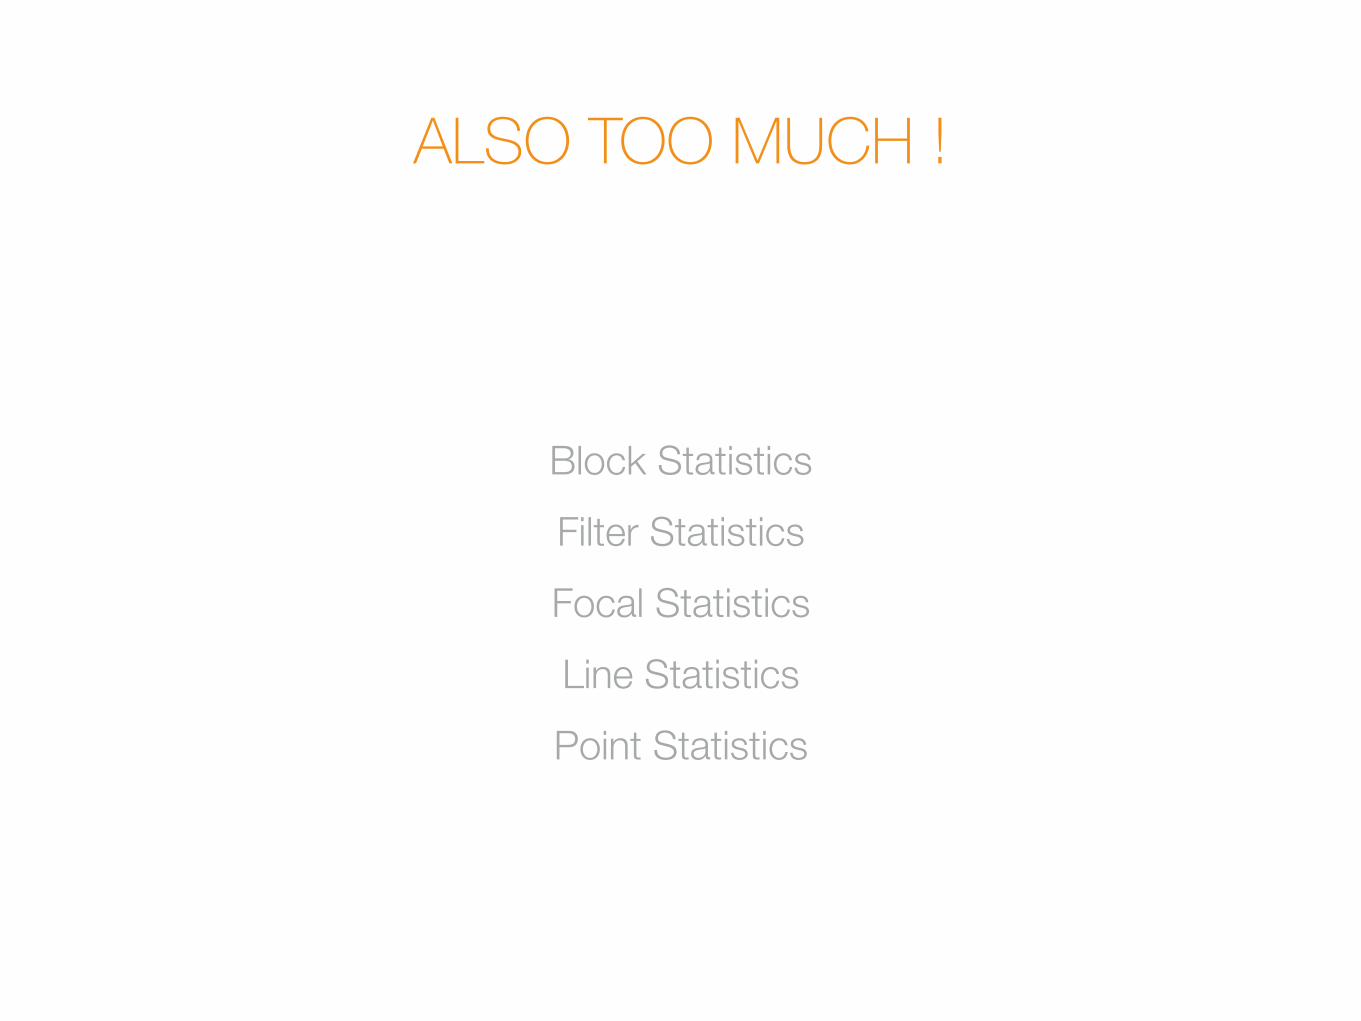
ALSO TOO MUCH !
Block Statistics
Filter Statistics Focal Statistics
Line Statistics
Point Statistics
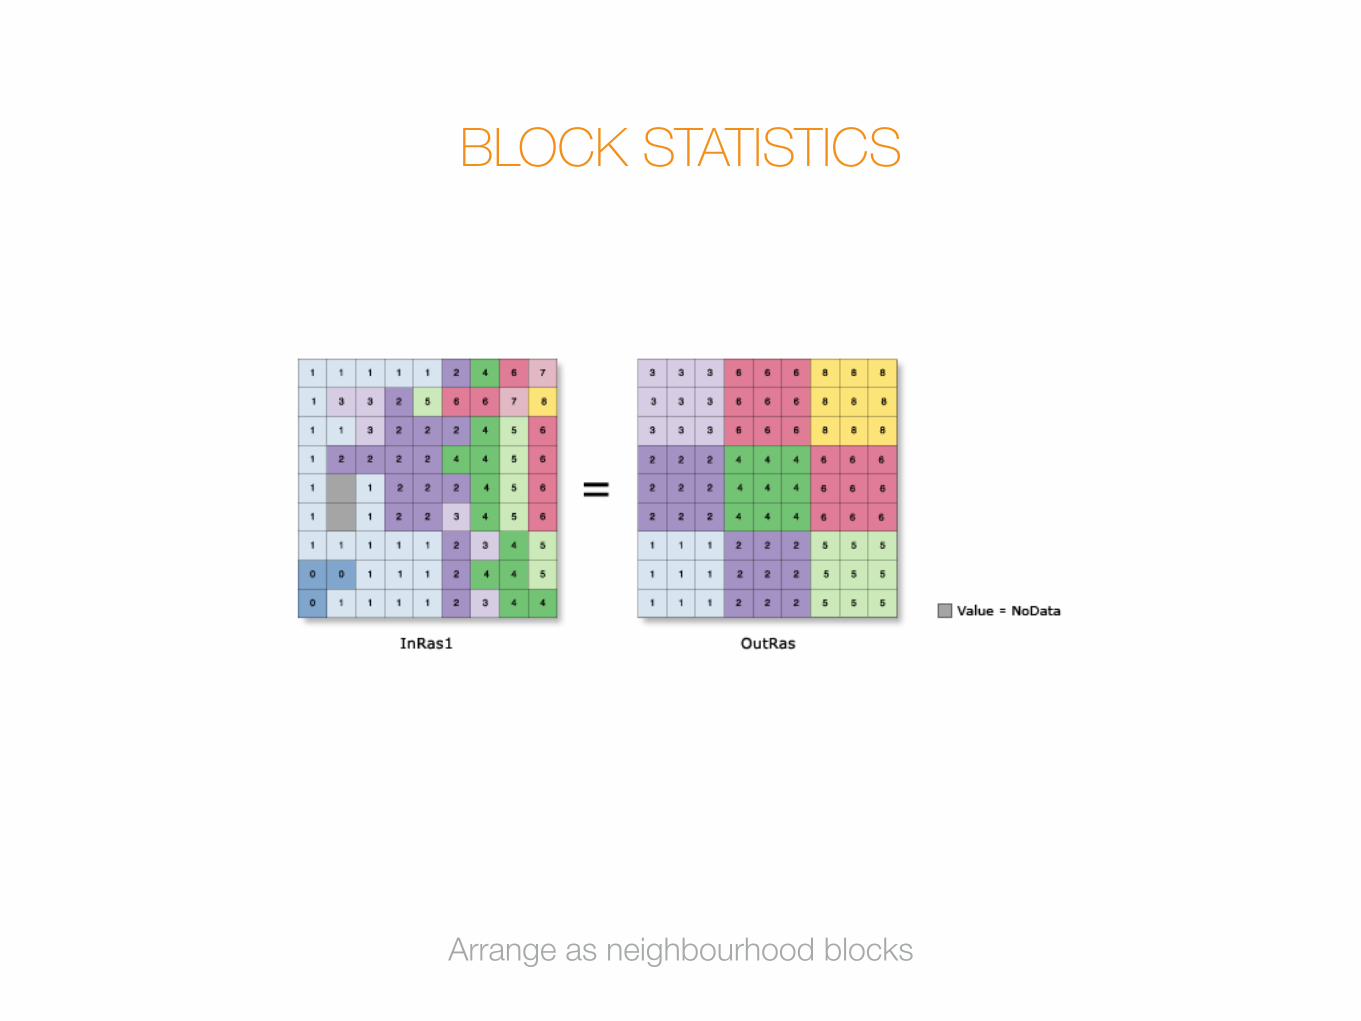
BLOCK STATISTICS
Arrange as neighbourhood blocks
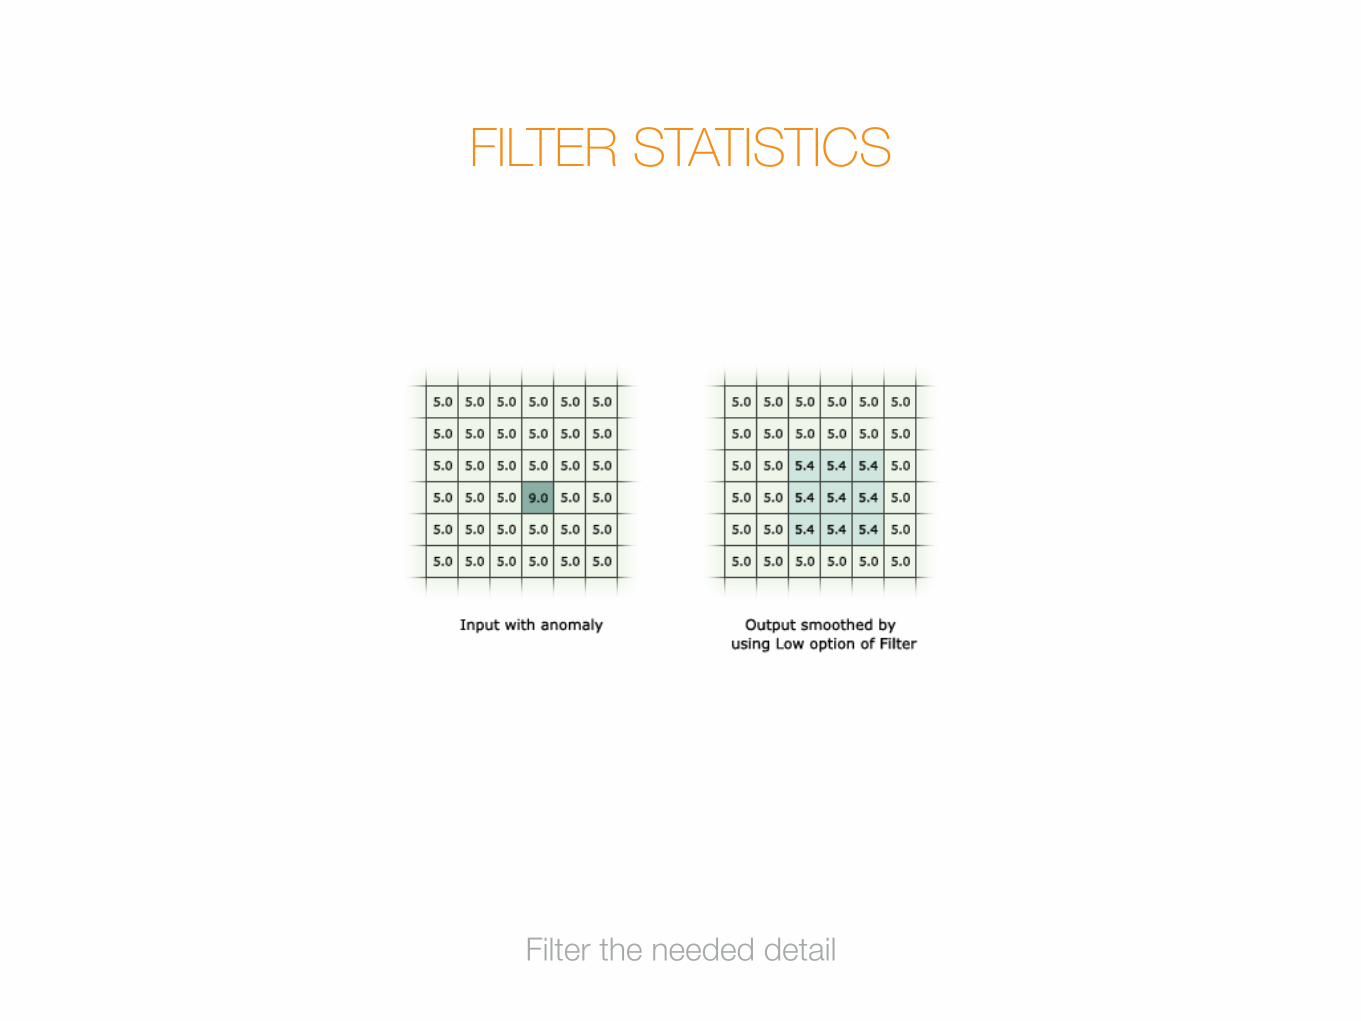
FILTER STATISTICS
Filter the needed detail
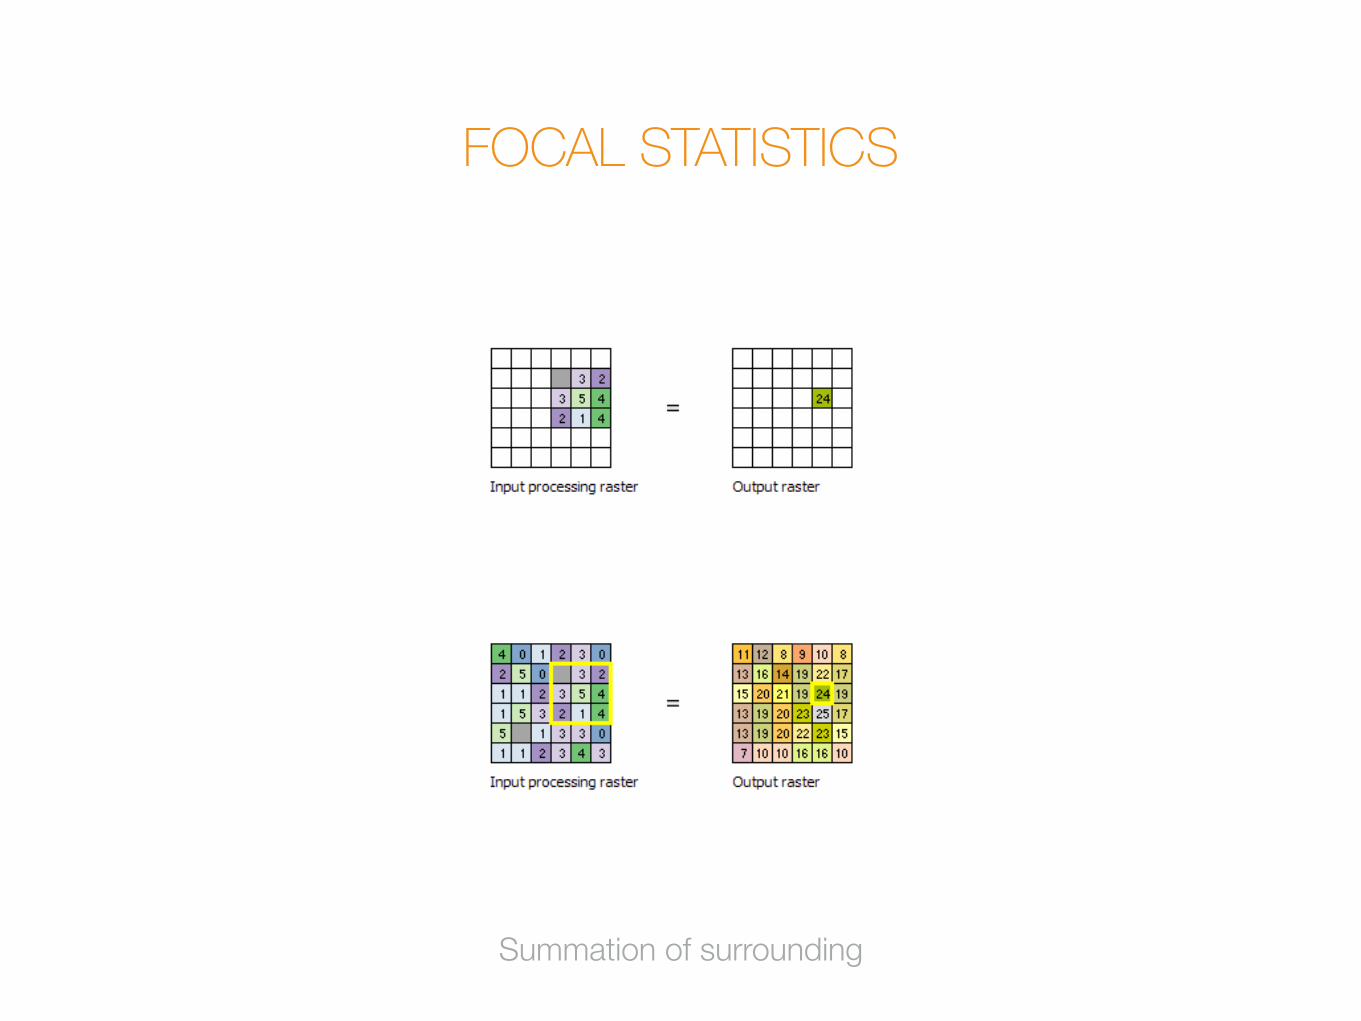
FOCAL STATISTICS
Summation of surrounding
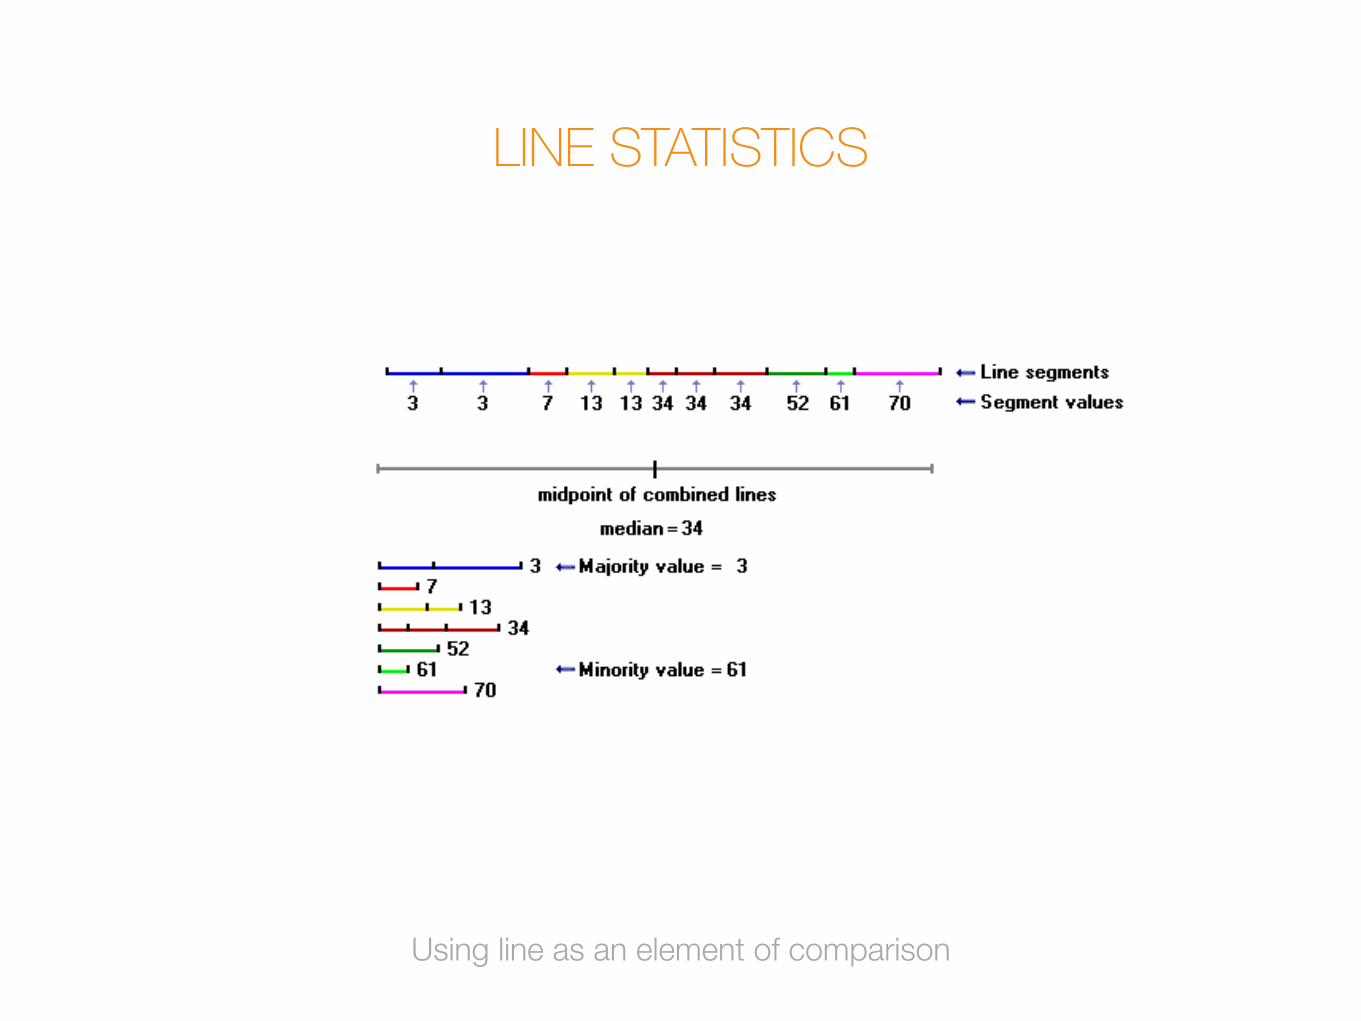
LINE STATISTICS
Using line as an element of comparison
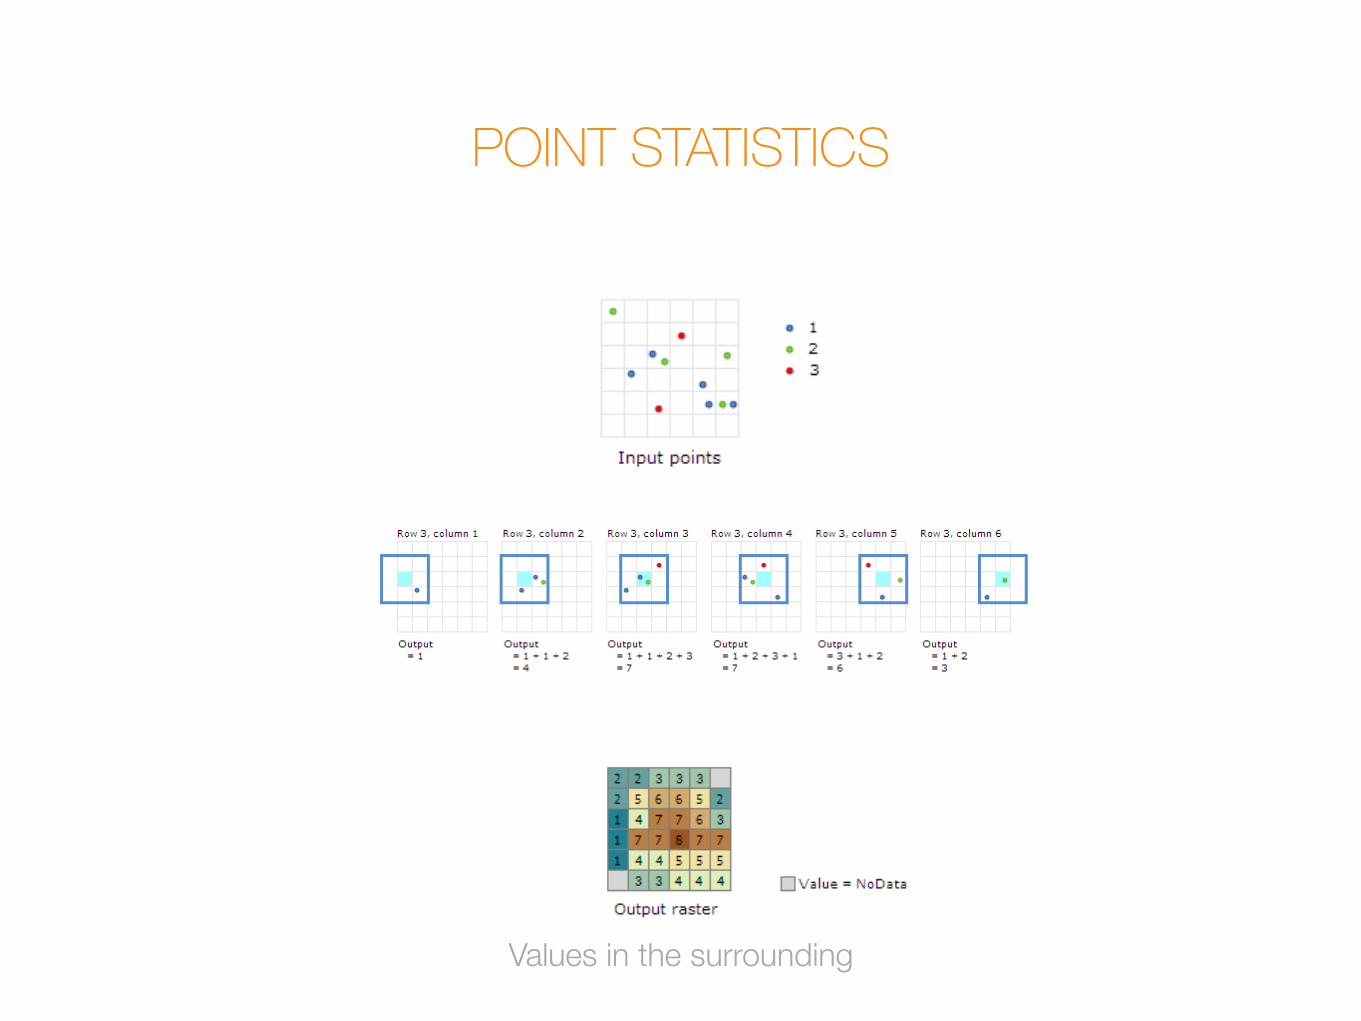
POINT STATISTICS
Values in the surrounding
SAME FEELING THOUGH !

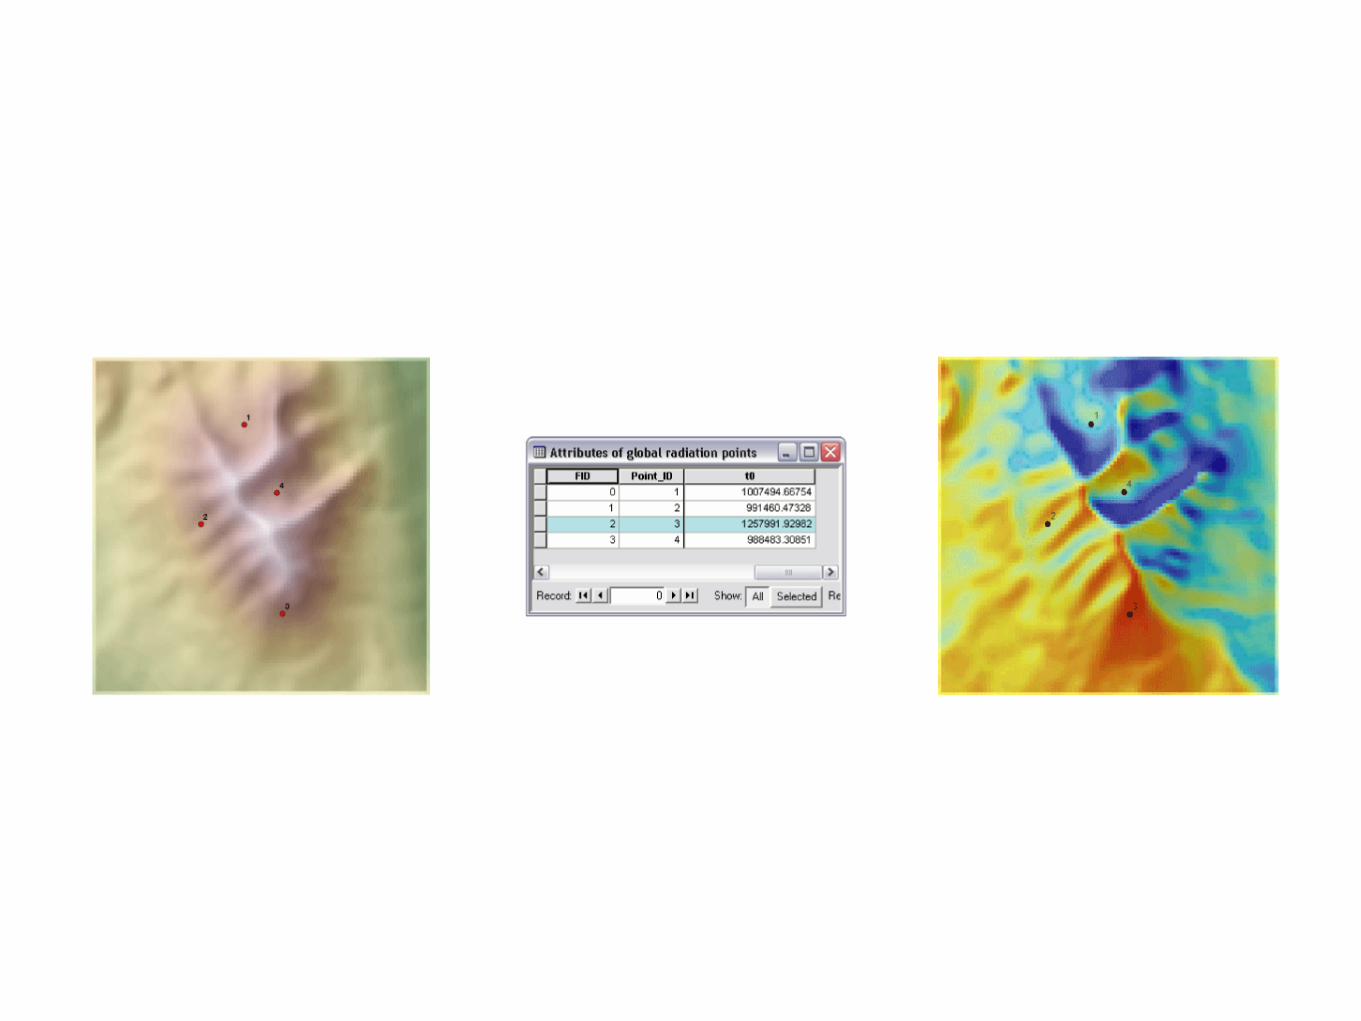
#08solar radiation toolset
#09surface toolset
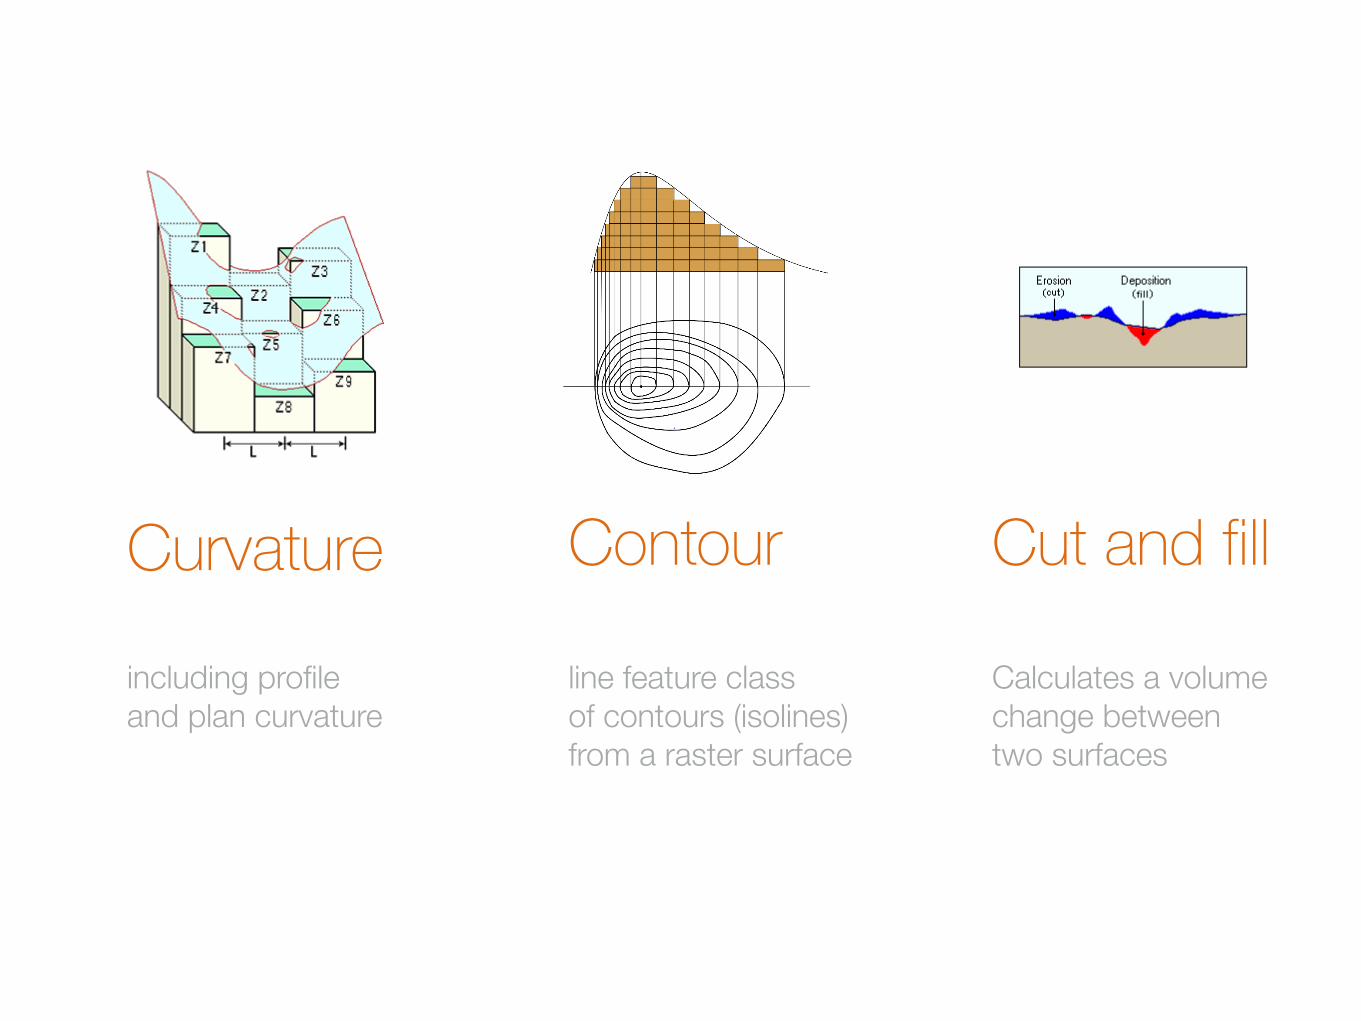
including profile and plan curvature
Curvature Contour Cut and fill
line feature class of contours (isolines) from a raster surface
Calculates a volume change between two surfaces
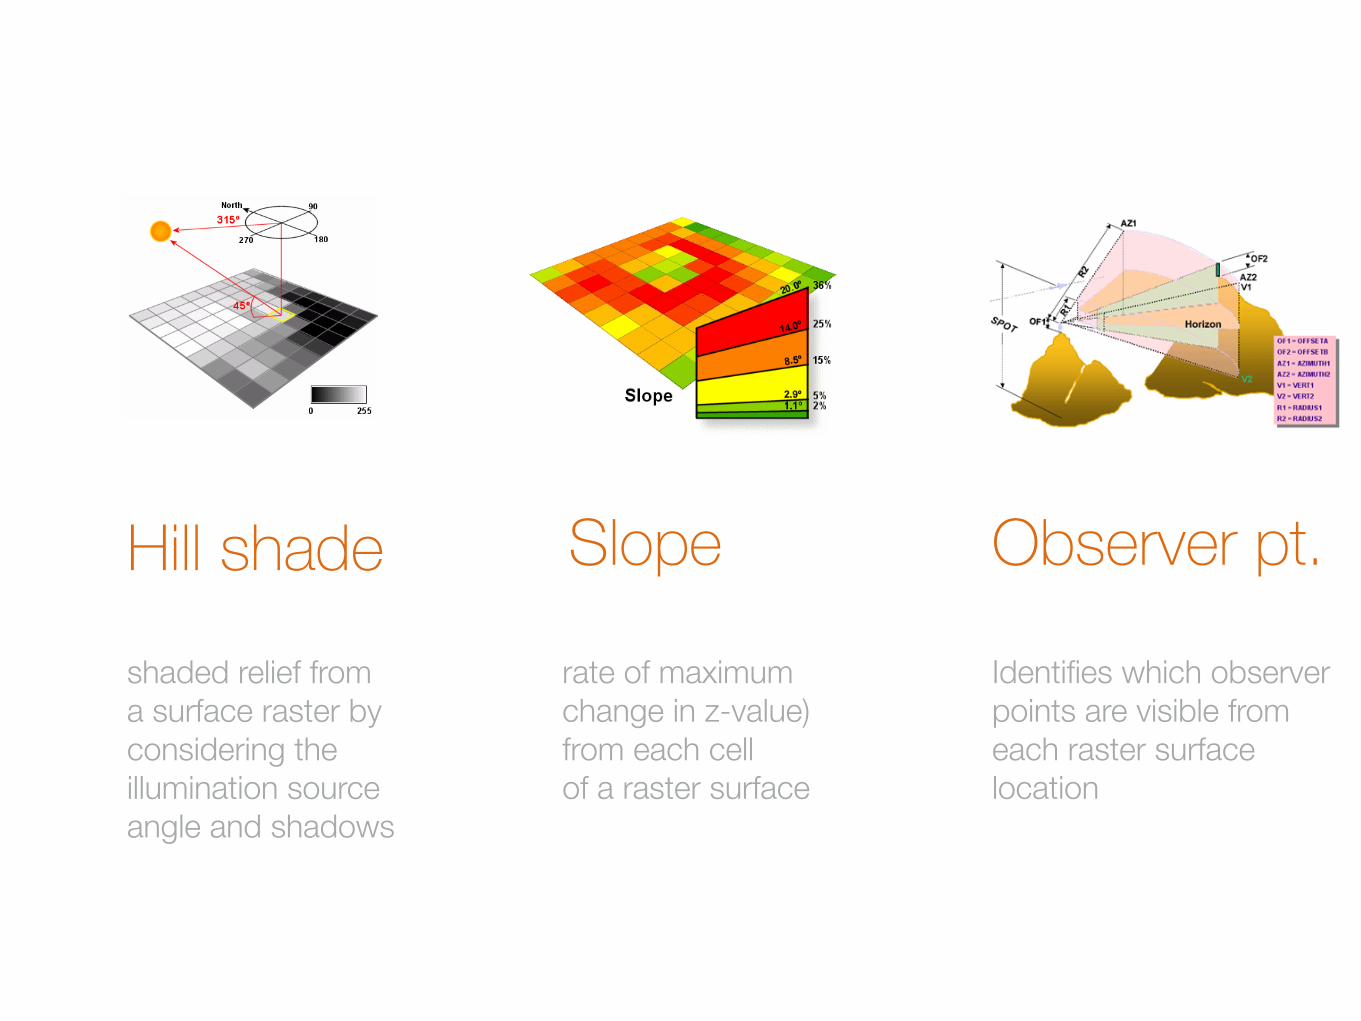
shaded relief from a surface raster by considering the illumination source angle and shadows
Hill shade Slope Observer pt.
rate of maximum change in z-value) from each cell of a raster surface
Identifies which observer points are visible from each raster surface location

Congratulations, now you get to see the
BONUS
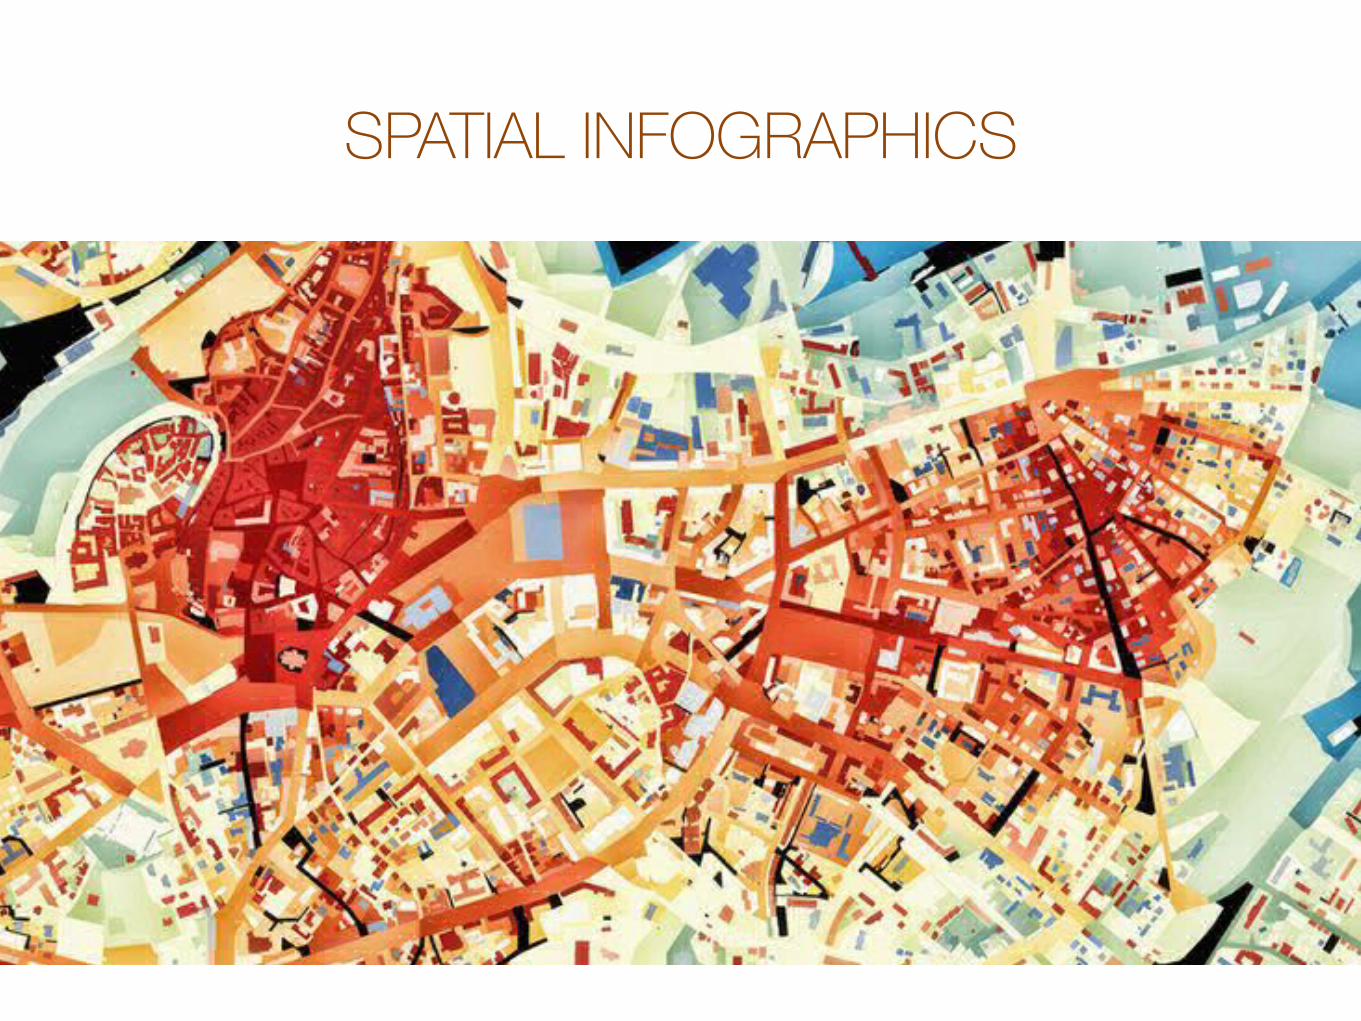
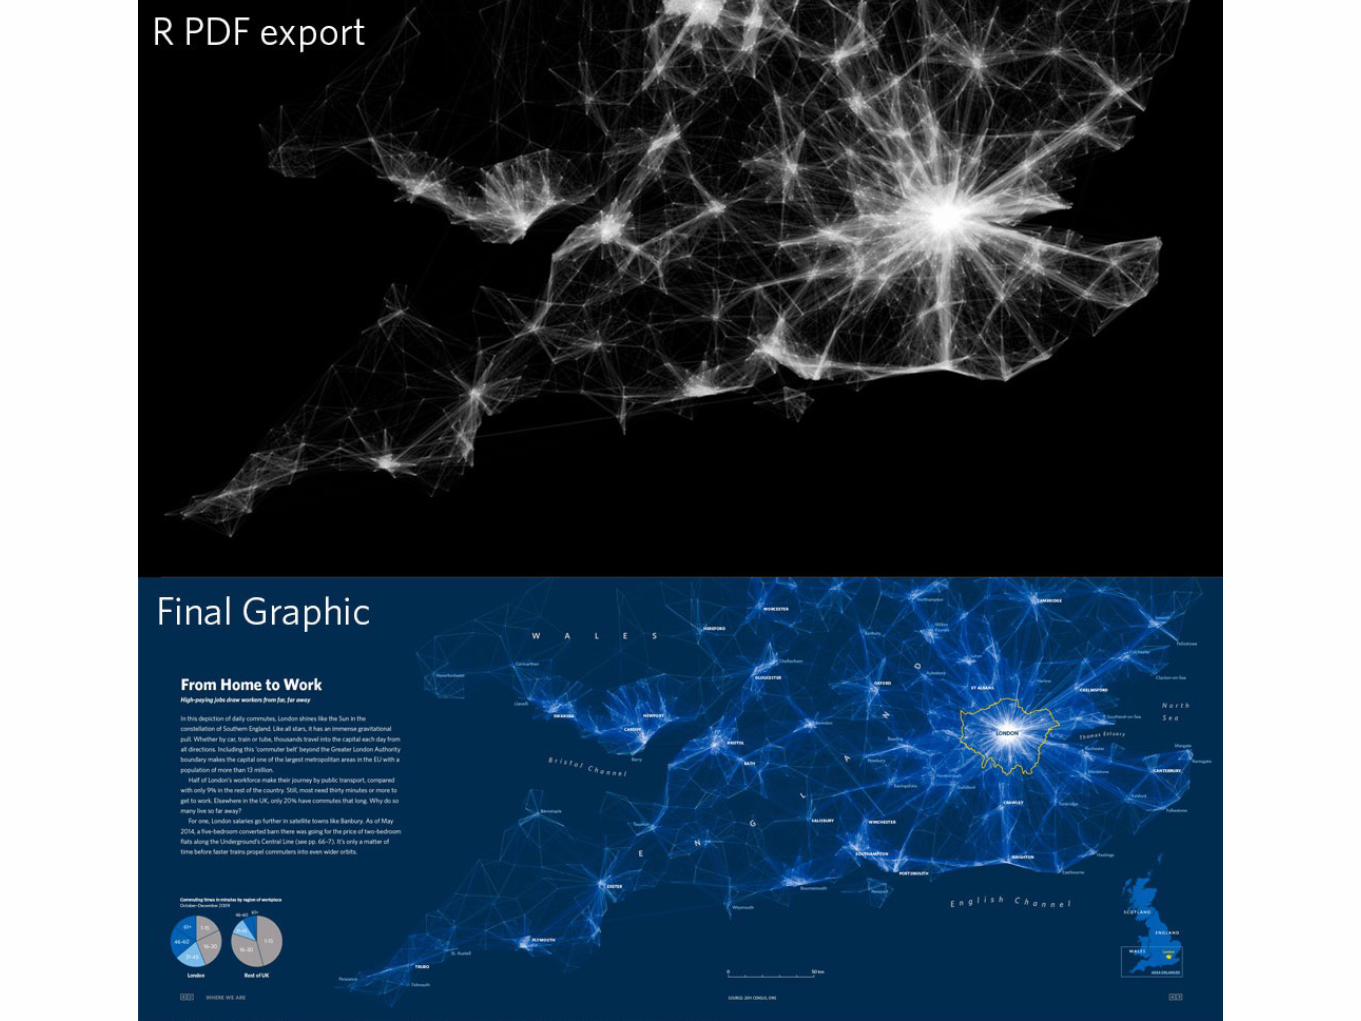
SPATIAL INFOGRAPHICS
Spatial analysis not represented/visualised properly is
USELESS!
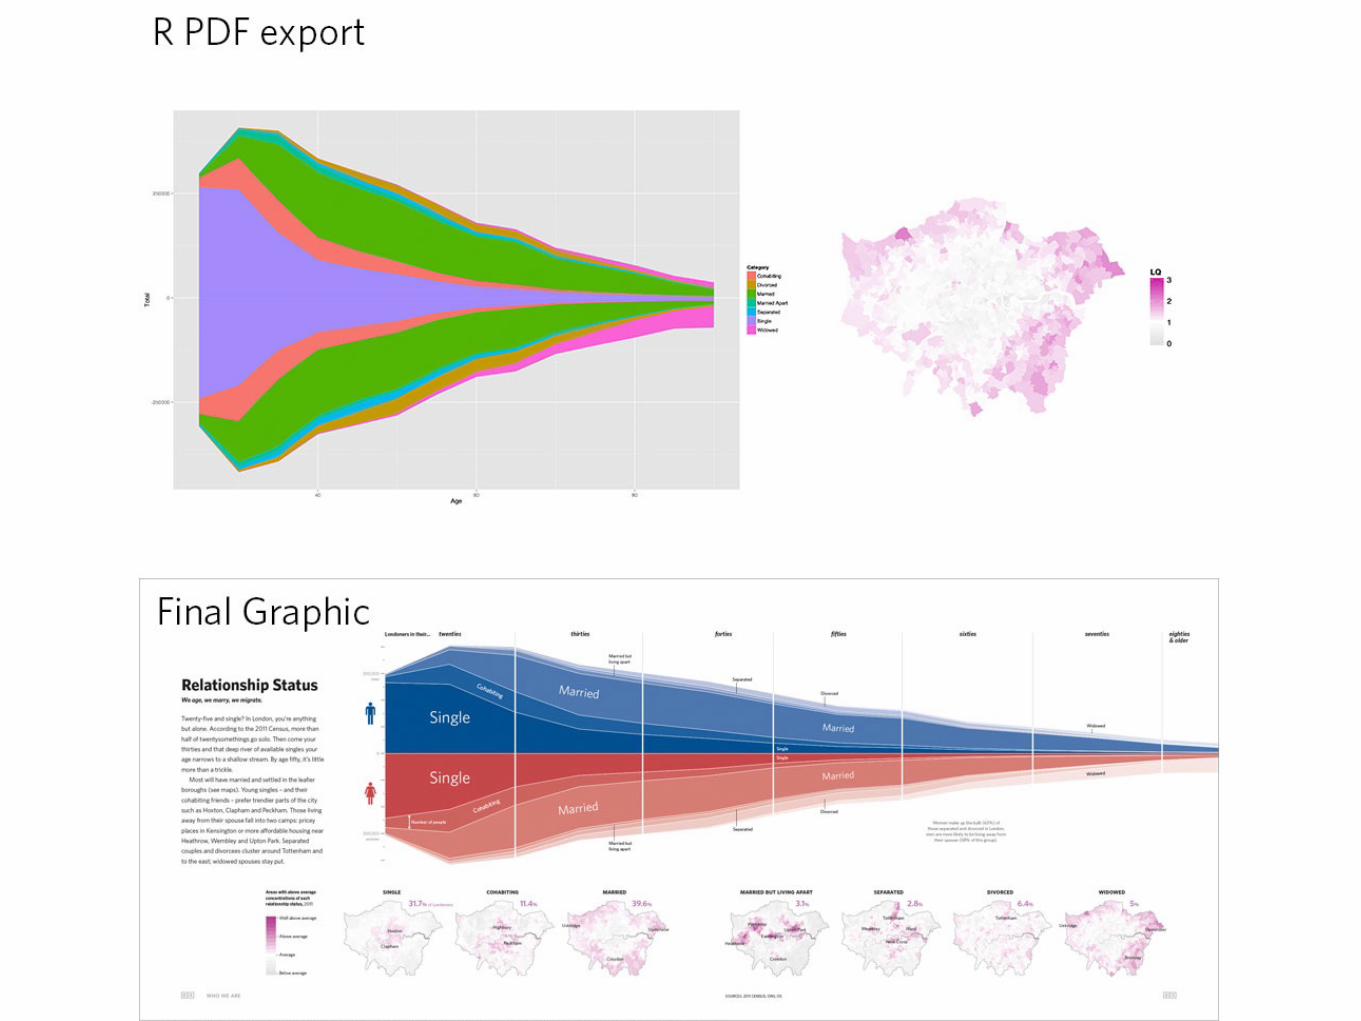
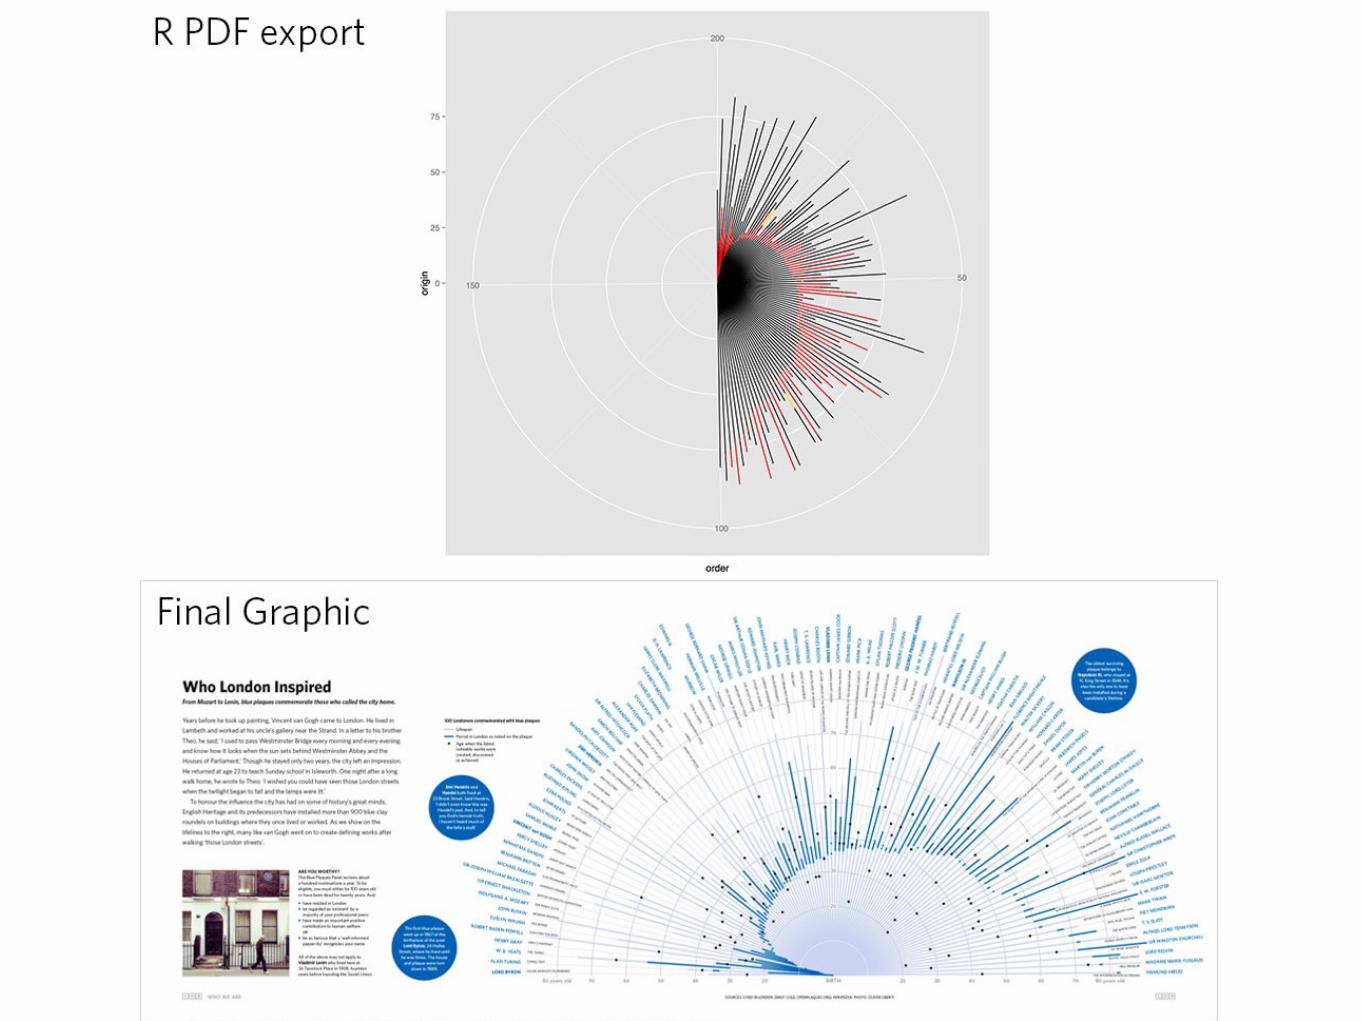
An amazing language for data analysis and visualisation
THE ‘R’ language
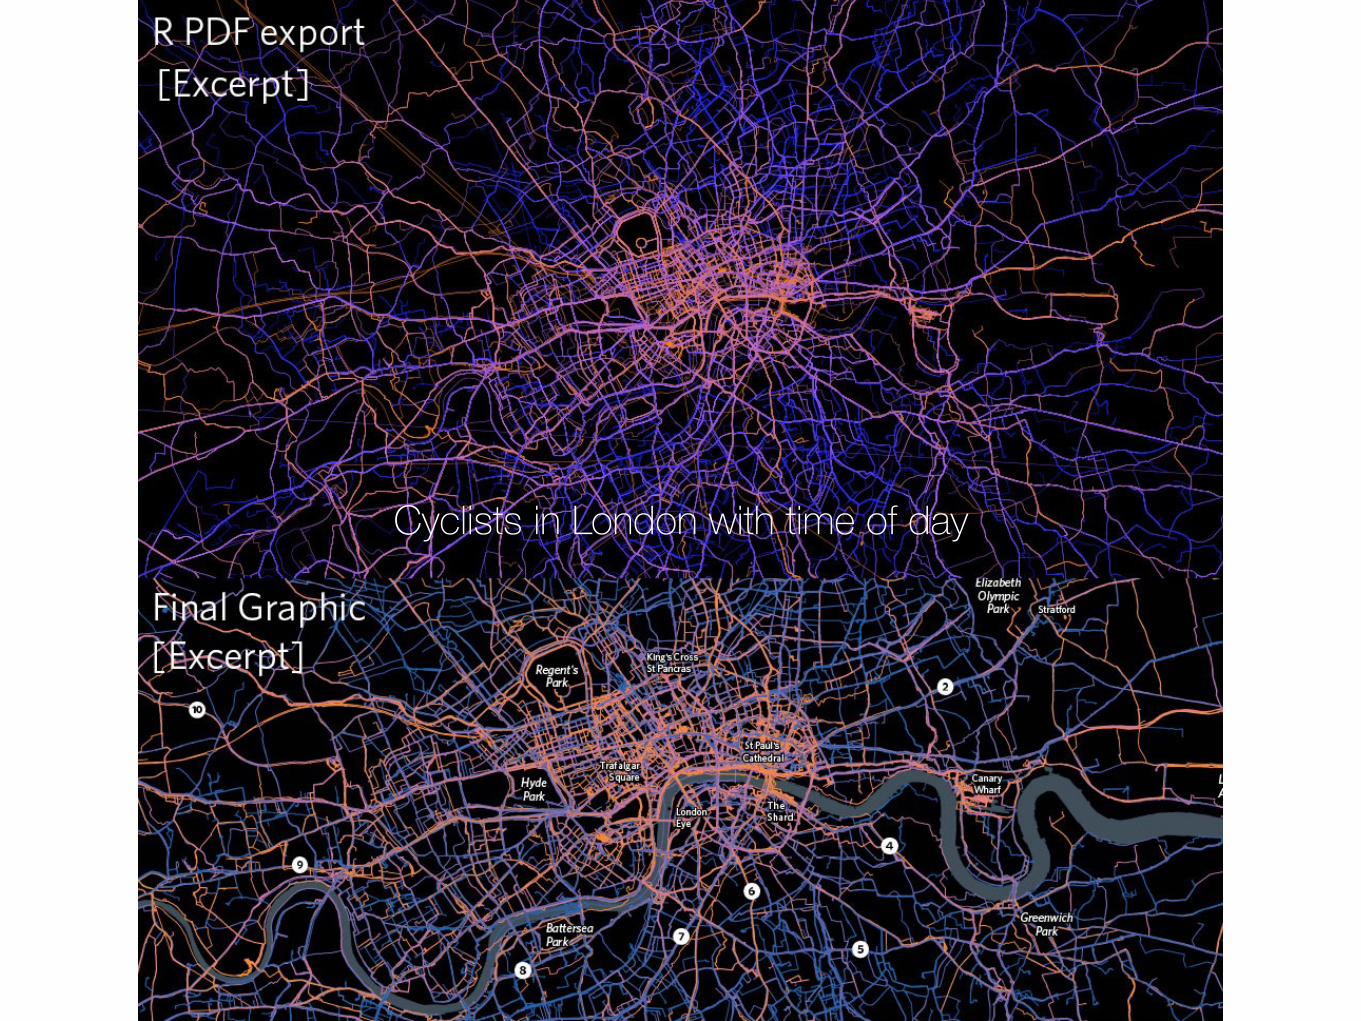
Cyclists in London with time of day

The future demands of us to be
DATA DESIGNERS

We hope you were inspired!
THANK YOU
REFERENCES
http://spatial.ly/
http://www.spatialanalysisonline.com
http://en.wikipedia.org/wiki/Spatial_analysis
![Applying advanced spatial tools for landscape analysis and climate change adaptation in asian highlands [read only]](https://static.documents.pub/doc/80x56/55588675d8b42aad358b4dca/applying-advanced-spatial-tools-for-landscape-analysis-and-climate-change-adaptationin-asian-highlands-read-only.jpg)


