Date post: | 11-Apr-2019 |
Category: |
Documents |
Upload: | hoangduong |
View: | 214 times |
Download: | 0 times |
Universität Heidelberg Institut für Umweltphysik
Spatial Distribution of Halogen Oxides in the Dead Sea Basin
Ulrich Platt and Jutta Zingler
Institut für Umweltphysik, University of Heidelberg
Many thanks to:
The Group at HUJI
Dead Sea Works
The Massada Team
Ein Gedi Field School
Ein Gedi Kibbutz
My Students at IUP
Universität Heidelberg Institut für Umweltphysik
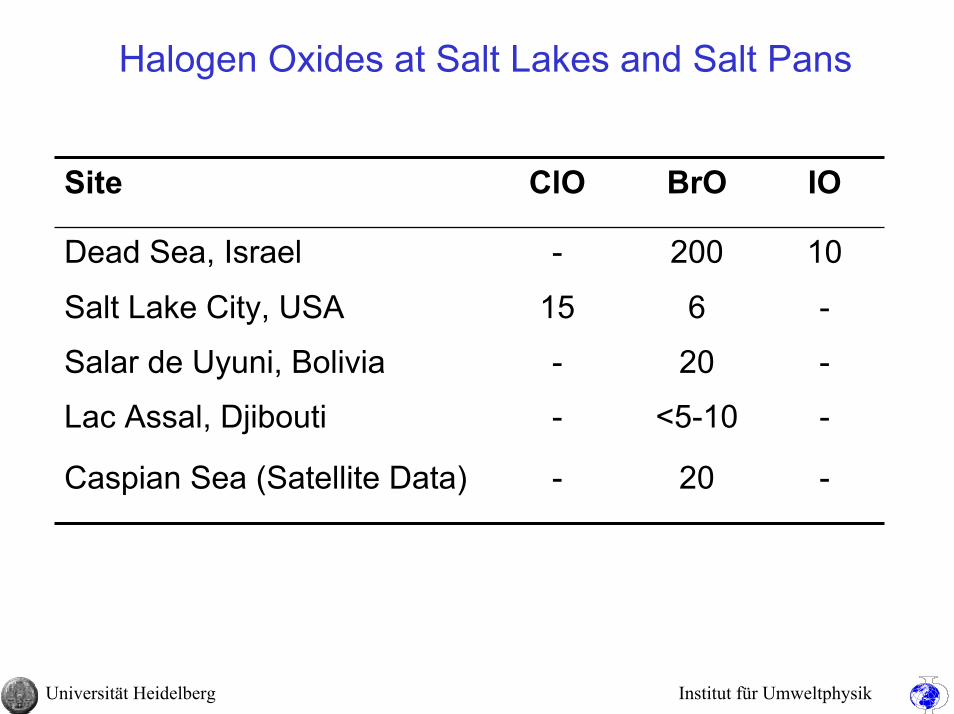
Halogen Oxides at Salt Lakes and Salt Pans
-20-Caspian Sea (Satellite Data)
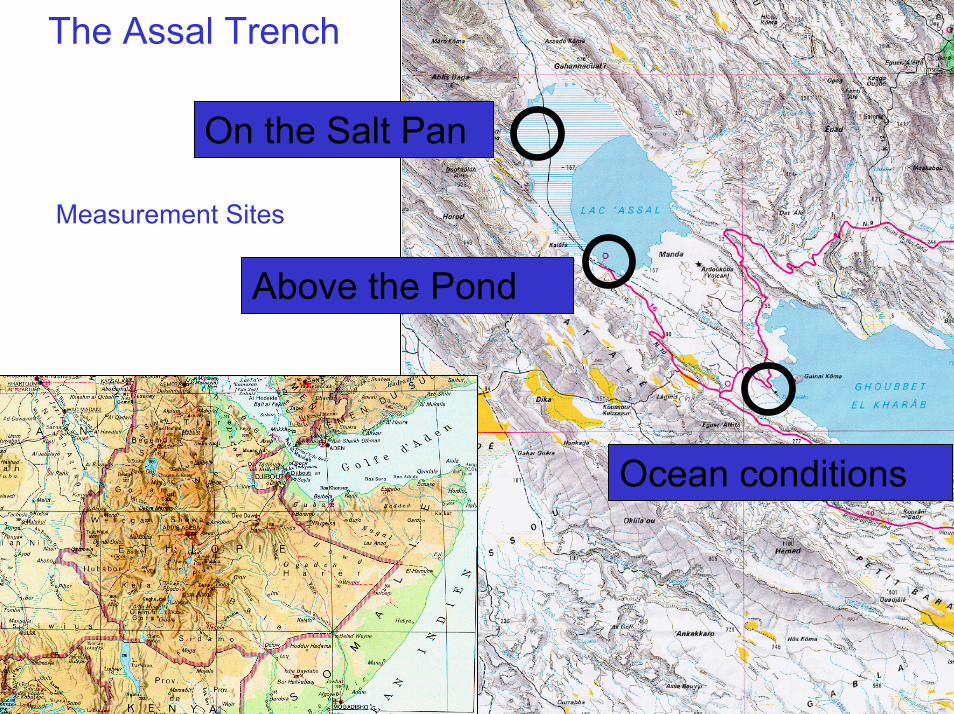
-<5-10-Lac Assal, Djibouti
-20-Salar de Uyuni, Bolivia
-615Salt Lake City, USA
10200-Dead Sea, Israel
IOBrOClOSite
Universität Heidelberg Institut für Umweltphysik
Why are we interested in Halogens in the Troposphere?
Stratosphere:Ozone destruction ...
Troposphere:• Ozone destruction• Reduction of Ozone formation• Modification of the oxidation capacity (radical cycles)• Change of DMS - cycle• Particle Formation• ...
Universität Heidelberg Institut für Umweltphysik
Boundary Layer Ozone Depletion - The first direct Evidencefor Reactive Halogens in the Troposphere
April 19860 5 10 15 20
Br (
ng m
-3),
O3 (
ppbv
)
0
20
40
60
80
100O3Br Barrie et al., 1988
O3, ppb
Alert 2000,Bottenheim et al., 2002
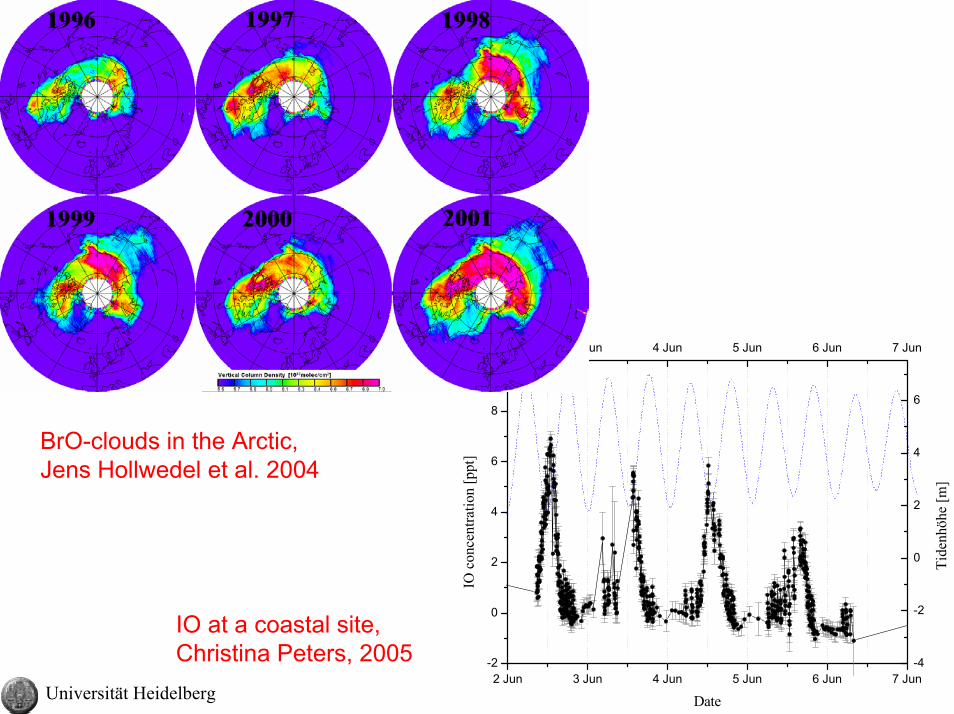
• Occur in the Arctic and Antarctic
• Are associated with halogens (especially Br)
• Probably related to events over Dead Sea and salt lakes
Universität Heidelberg Institut für Umweltphysik
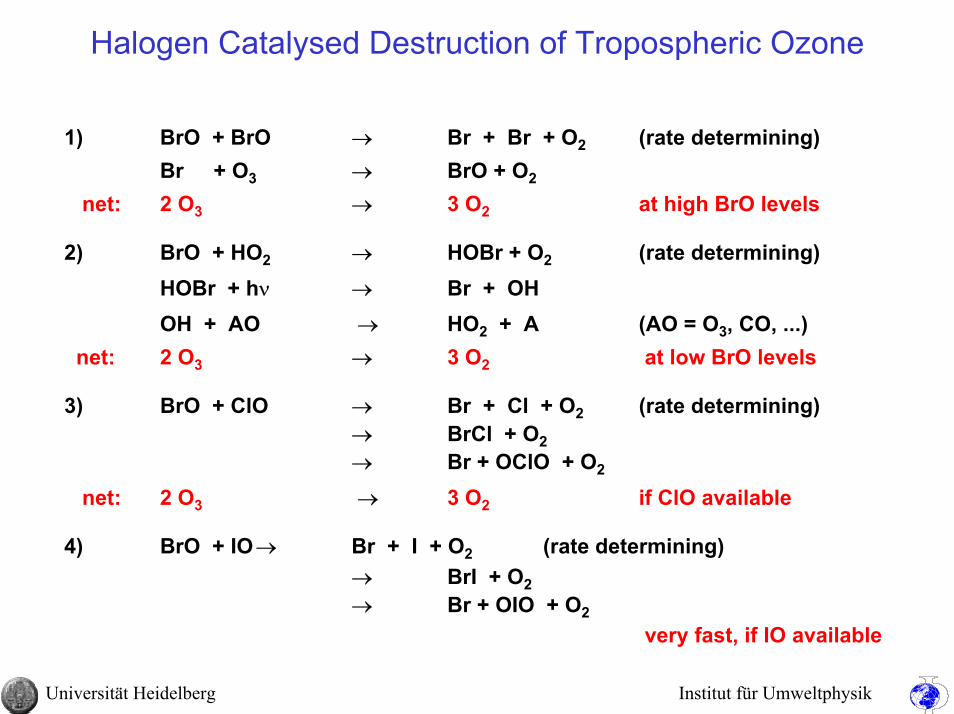
Halogen Catalysed Destruction of Tropospheric Ozone
1) BrO + BrO → Br + Br + O2 (rate determining) Br + O3 → BrO + O2
net: 2 O3 → 3 O2 at high BrO levels
2) BrO + HO2 → HOBr + O2 (rate determining) HOBr + hν → Br + OHOH + AO → HO2 + A (AO = O3, CO, ...)
net: 2 O3 → 3 O2 at low BrO levels
3) BrO + ClO → Br + Cl + O2 (rate determining)→ BrCl + O2→ Br + OClO + O2
net: 2 O3 → 3 O2 if ClO available
4) BrO + IO→ Br + I + O2 (rate determining)→ BrI + O2→ Br + OIO + O2
very fast, if IO available
Universität Heidelberg Institut für Umweltphysik
Observation of Reactive Halogens in the Troposphere
up to 10up to 200up to 15Salt Lakes/Pans
?up to 1000several100 ppb Volcanic Plumes
?20 ... 40several10?
Polar Regions (springtime)
up to 10<2 ... 6?Coastal Regions
?1-2?Free Troposphere
IOppt
BrOppt
ClOpptDomain
Reactive halogen species: Cl, Br, I, ClO, BrO, IO, OClO,OBrO, OIO, I2O2, ...
Universität Heidelberg Institut für Umweltphysik2 Jun 3 Jun 4 Jun 5 Jun 6 Jun 7 Jun
-2
0
2
4
6
8
10
IO c
once
ntra
tion
[ppt
]
Date
2 Jun 3 Jun 4 Jun 5 Jun 6 Jun 7 Jun
-4
-2
0
2
4
6
Tide
nhöh
e [m
]
BrO-clouds in the Arctic, Jens Hollwedel et al. 2004
IO at a coastal site, Christina Peters, 2005
Universität Heidelberg Institut für Umweltphysik
Simplified Outline of the XOX (=X + XO, X = I, Br, Cl) Cycles
XX
XOXO OXO
X2XNO2
XY
X2O2XONO2
HX
CH3XCHX3
etc.Na+ X-
Y -
N2O5 , etc.
heterogeneous
hν,∆
hνhν
hν
hν
hν,∆
OH, hν
RH,HO2
HO YO O3
NO2
YO
HO2
hν
HOX
(X2O2)ads(XONO2)ads (HOX)ads
(HX)ads
Sea-Salt (Snow Pack or Aerosol Surface)H+ + X-
[ ][ ] ( ) ( ) ( )XO
1000 X Cl , 100 X Br , 10 X IX
≈ = = = Daytime, rule of thumb
Universität Heidelberg Institut für Umweltphysik
A Chemical Instability: The "Bromine Explosion"
Br2 + hν → 2 BrBr + O3 → BrO + O2BrO + HO2 → HOBr + O2
Salt Surface or Aerosol: HOBr + Br- + H+ → Br2 + H2O
net: BrO --> 2 BrO(Bromine – Explosion Mechanism)
InversionWell mixed Boundary Layer (up to ≈1000m)
Universität Heidelberg Institut für Umweltphysik
What is the Evidence for Halogen Radicals in the Troposphere ? Indirect • „Hydrocarbon - Clock“ observations (X-atoms)
[Jobson et al. 1994, Solberg et al. 1996, Ramacher et al. 1997, 1999, Wingenter et al. 1996]
• ‘Unexplained’ loss of tropospheric Ozone [Oltmanns et al. 1986, Barrie et al. 1988, … Reichardt et al. 1996, Davies et al. 1998, ... Bottenheim et al. 2000, ...]
Semi-direct • Atomic Fluorescence after titration by NO
[Toohey et al. 1996, Avallone et al. 2002] • Chemical Amplifier (ROX-Box) Measurements
[Perner et al. 2001]
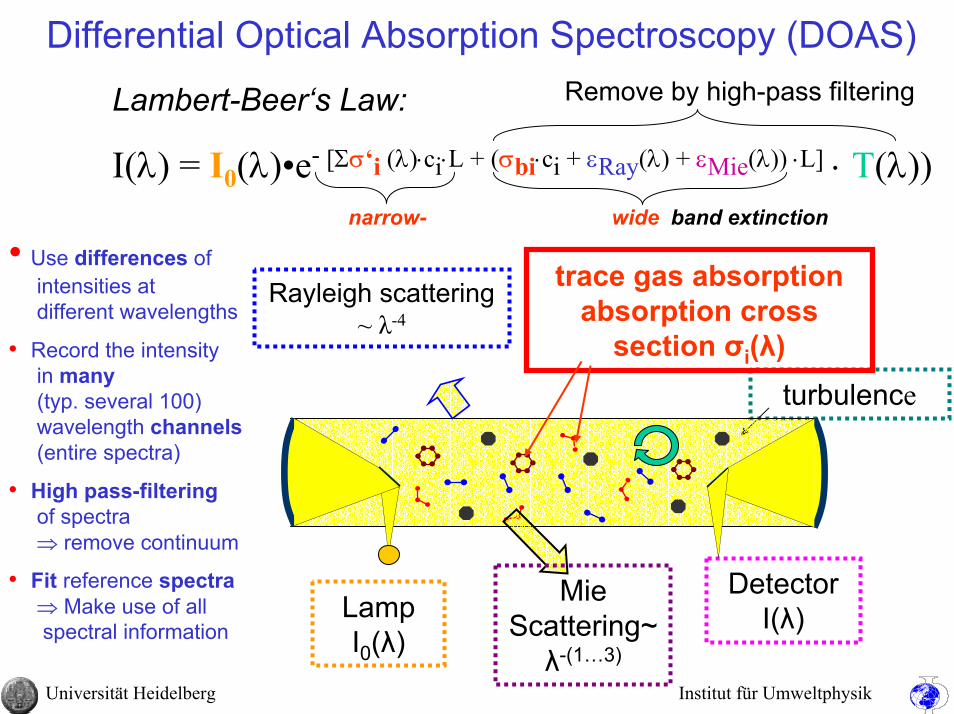
Direct • Differential Long-Path Absorption Spectroscopy (LP-DOAS)
[Hausmann & Platt 1994, Unold 1995, Tuckermann 1996, Richter et al. 1998, Wagner & Platt 1998, McElroy et al. 1999, Hebestreit et al. 1999, Alicke et al. 1999, Wittrock et al. 2000, Allan et al. 2000, 2001, Frieß et al. 2001, Matveev et al. 2001, Hönninger & Platt 2002, … ]
Universität Heidelberg Institut für Umweltphysik
Joint Measurement Campaigns at the Dead Sea IUP Heidelberg – HUJI, Jerusalem
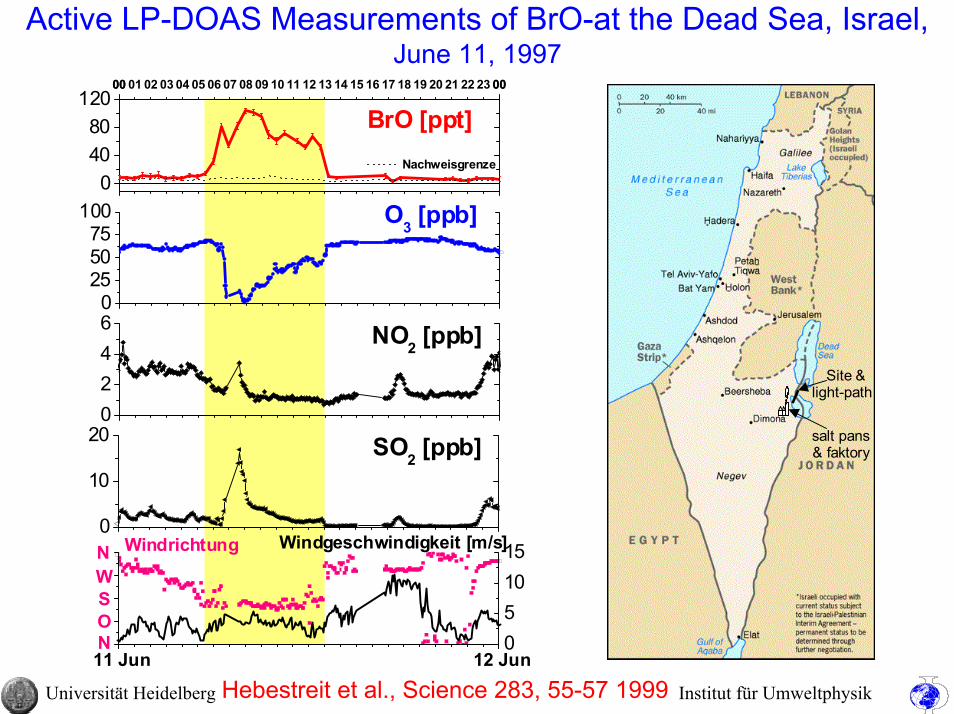
• 1997: First observation of BrO at a Salt LakeOzone destruction too fast?Br must come from the salt pans south of the Dead Sea
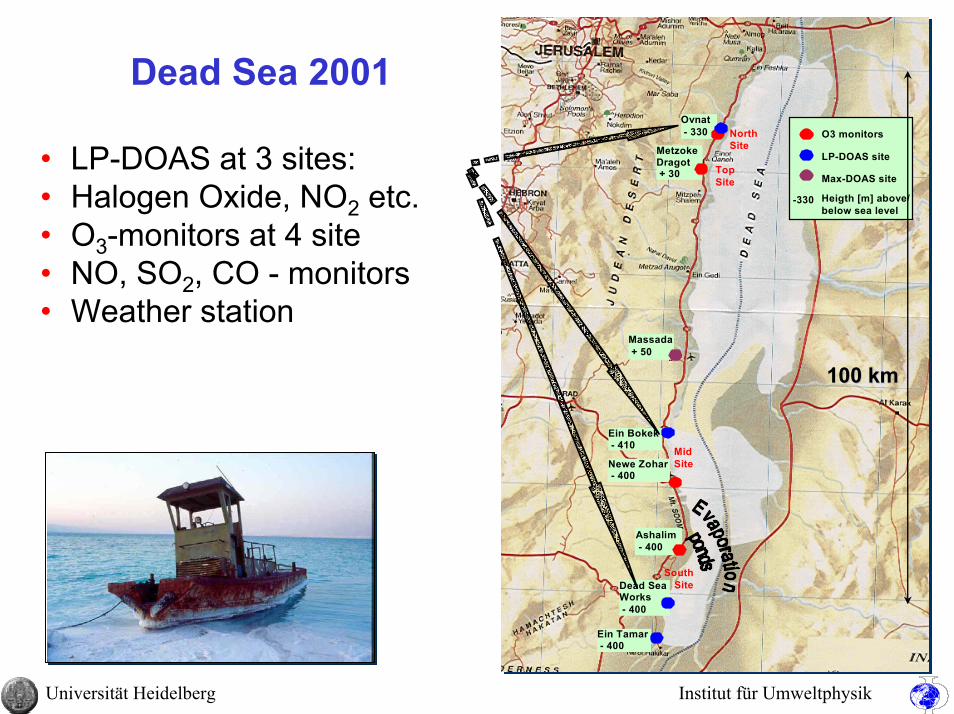
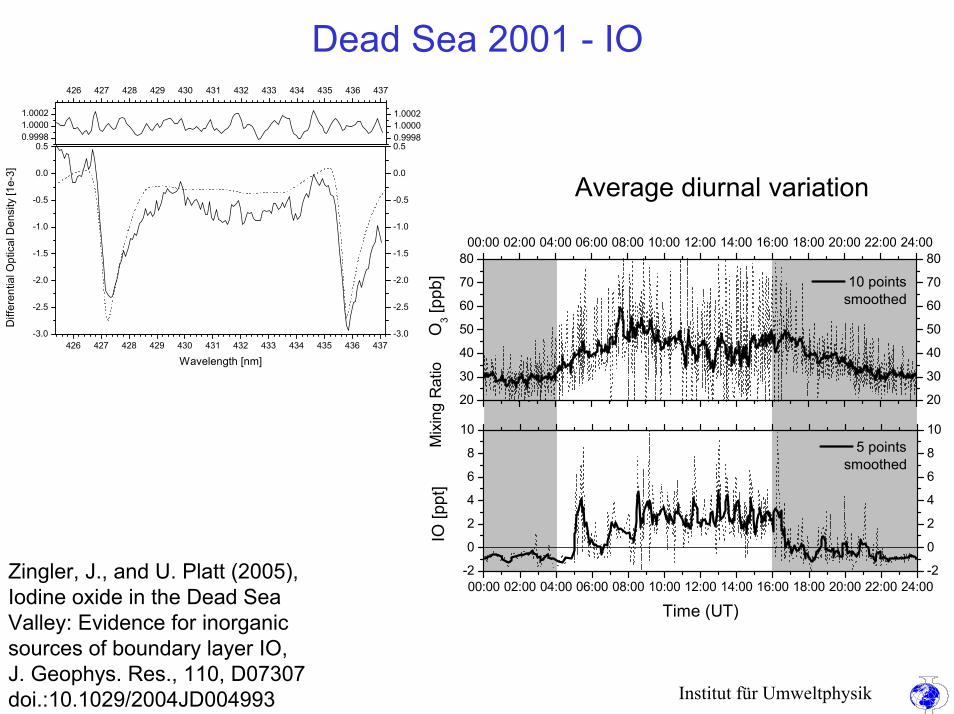
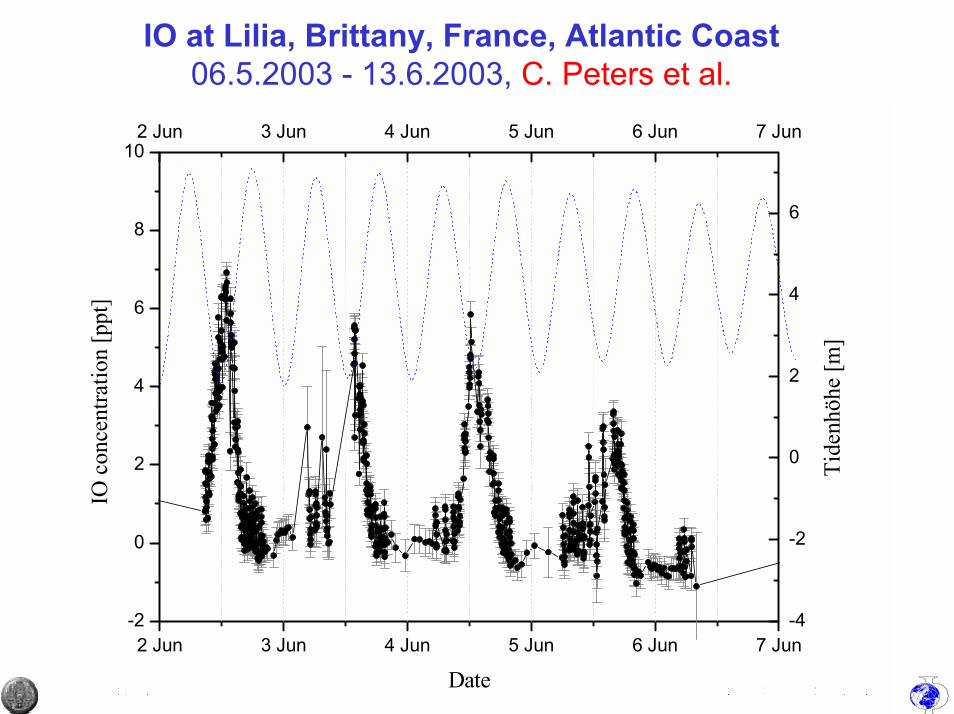
• 2001: 3 active LP-DOAS instruments along the Dead Sea valleyfirst observation of IOBr-source other than salt pans?
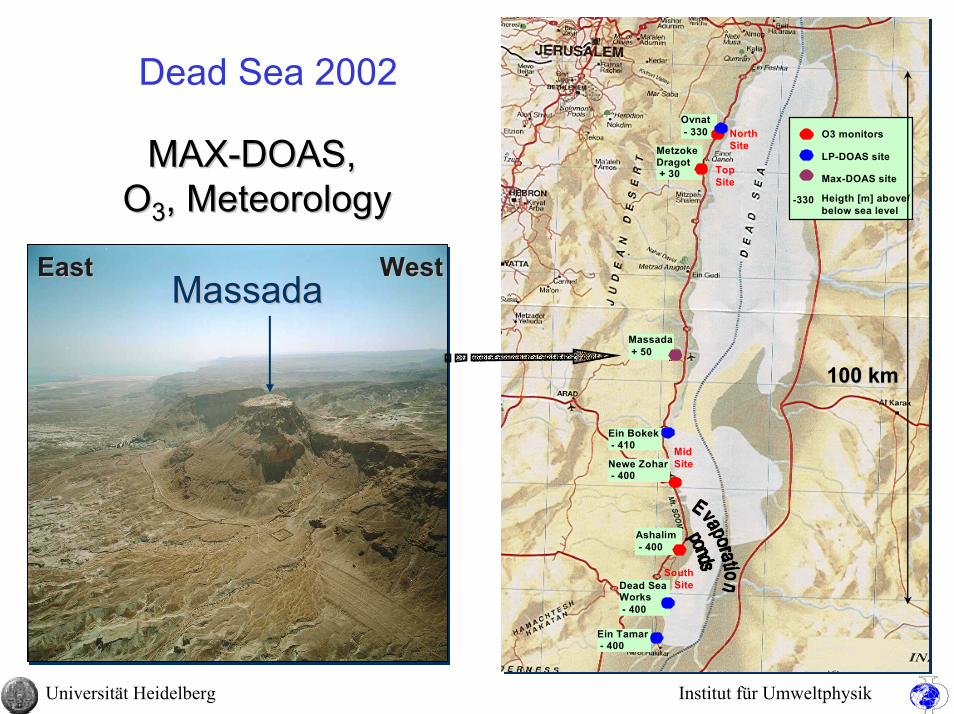
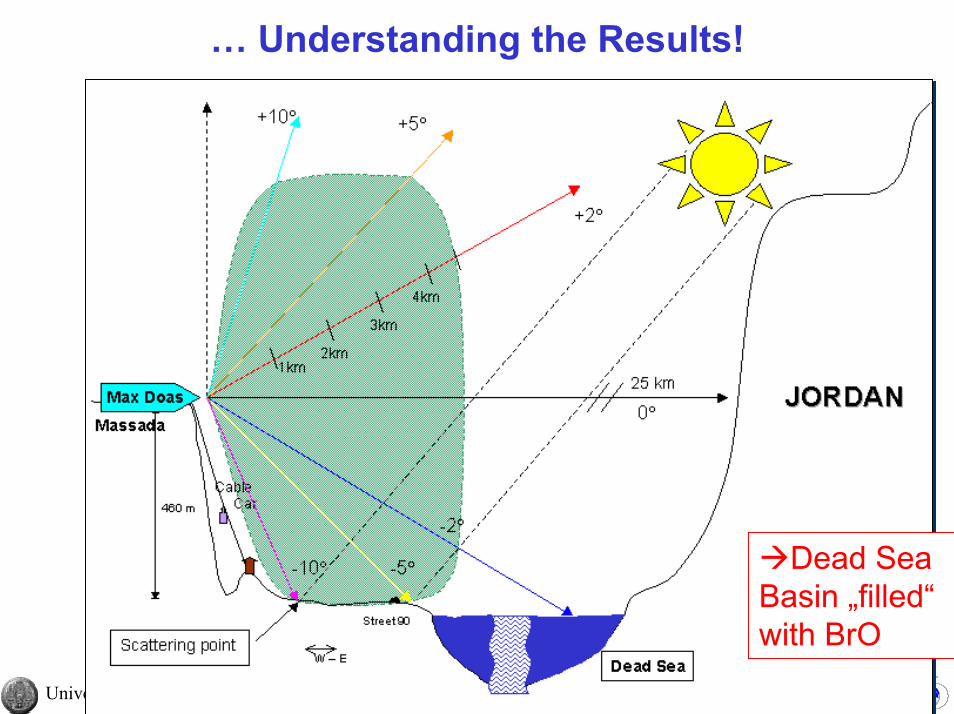
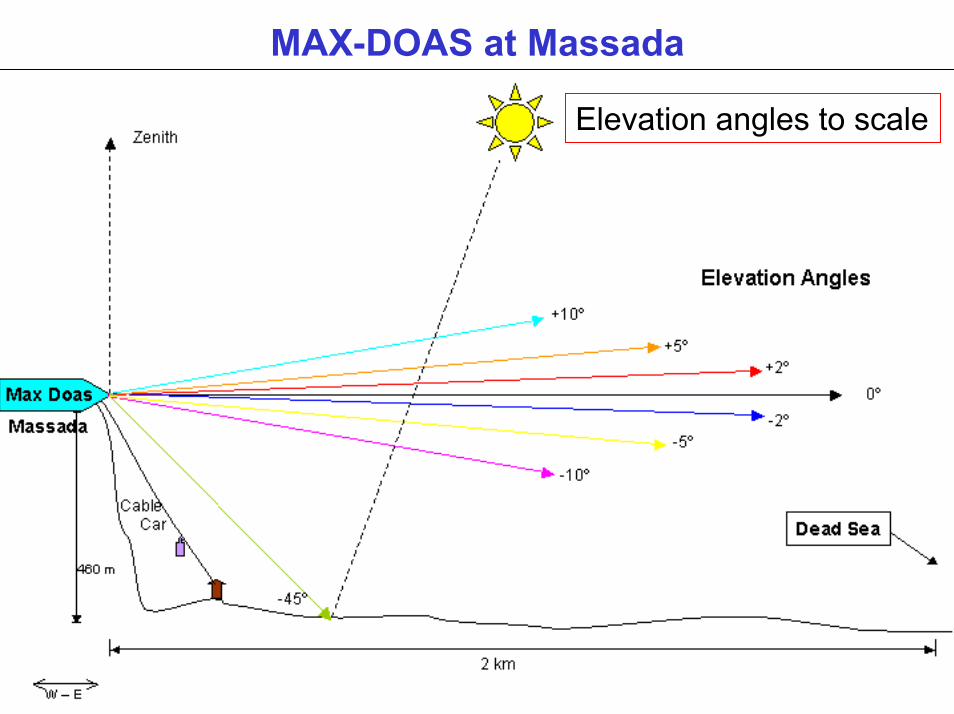
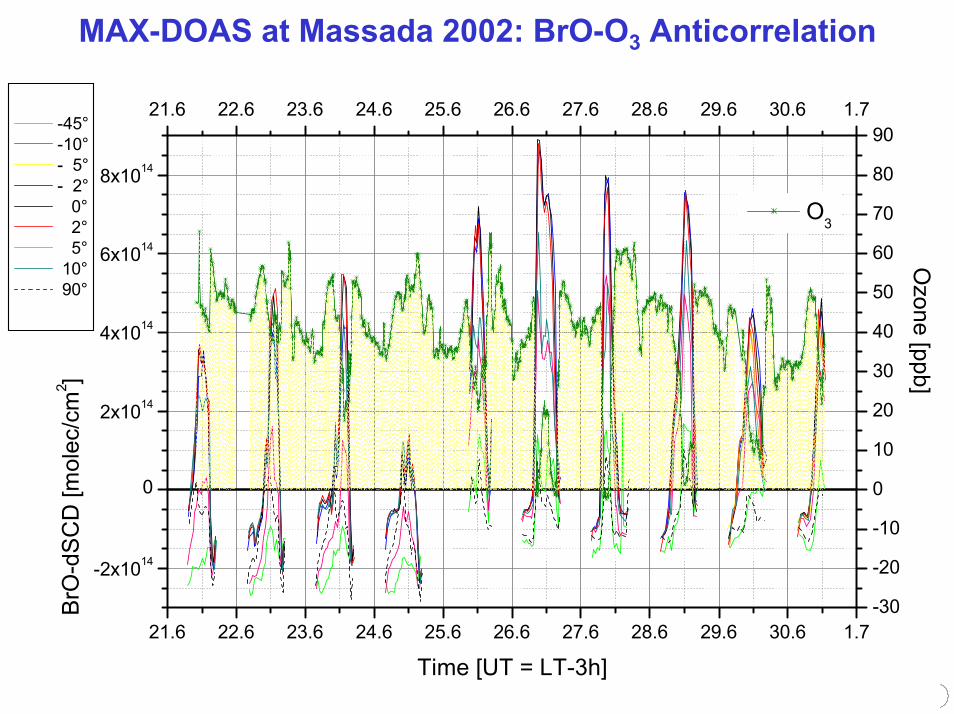
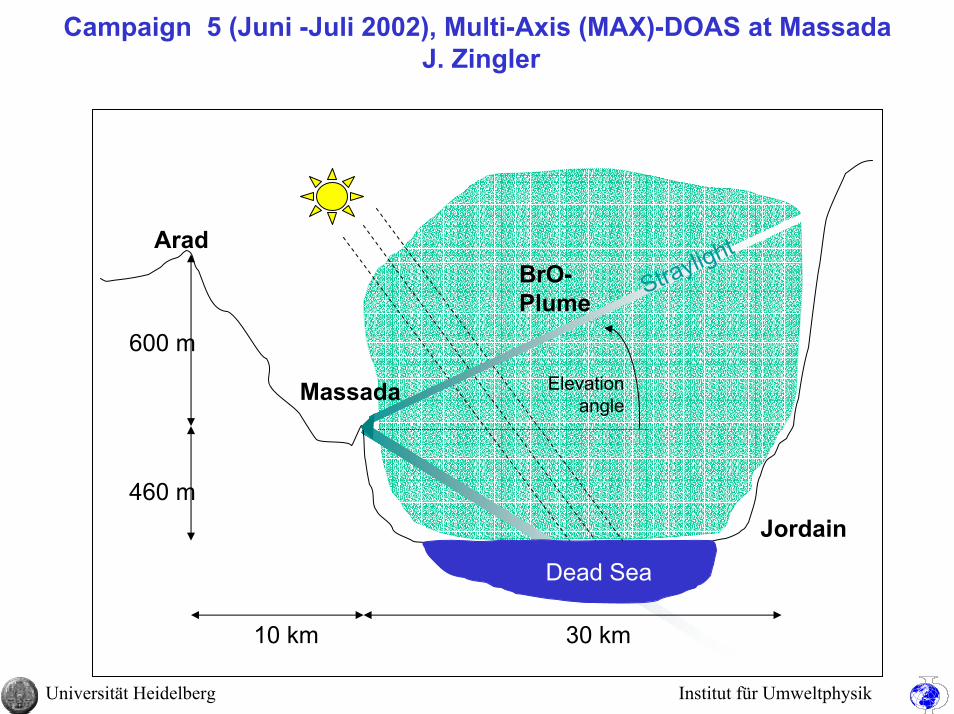
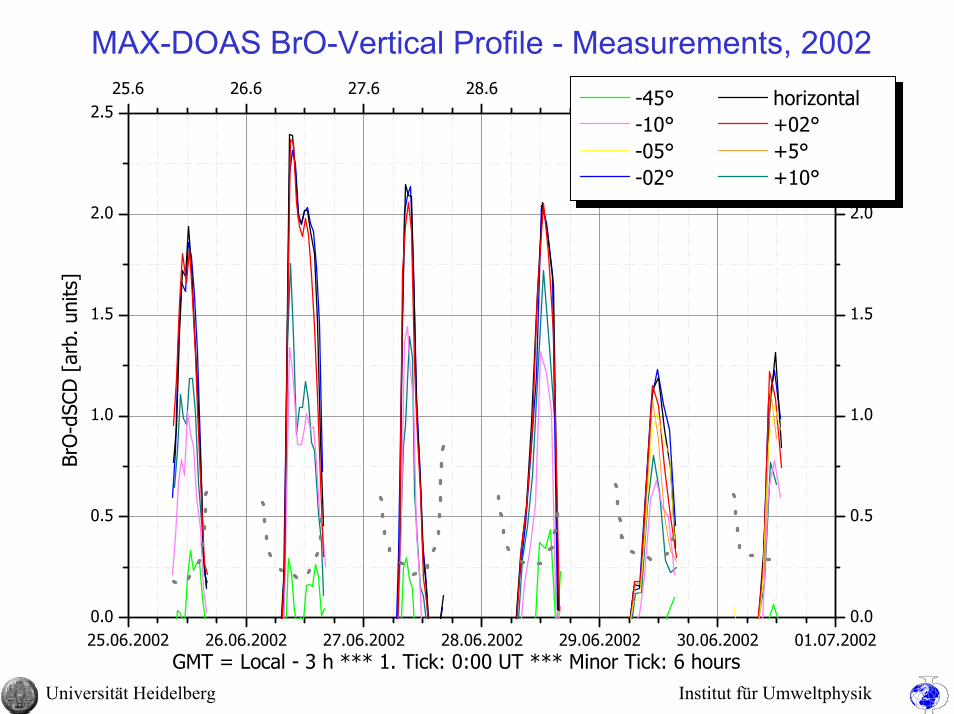
• 2002: 1 active LP-DOAS + 1 passive MAX-DOAS (Massada)Probed vertical extension of the BrO „cloud“
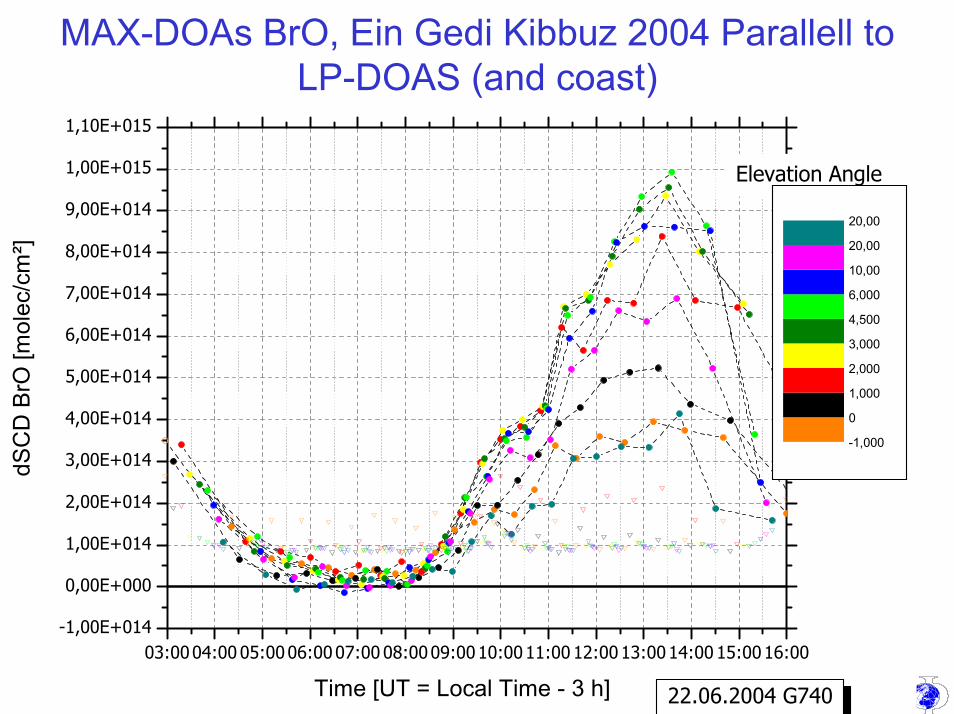
• 2004: 1 active LP-DOAS + (indirect)BrONO2 measurements+ 6 Mini-MAX DOAS along the Dead Sea shore
Vertical extension of IO (as well as BrO)Test of the Reservoir gas-theorySimultaneous observation of horizontal and vertical BrO distribution
Universität Heidelberg Institut für Umweltphysik
Differential Optical Absorption Spectroscopy (DOAS)
turbulence
LampI0(λ)
DetectorI(λ)
trace gas absorptionabsorption cross
section σi(λ)
Rayleigh scattering~ λ-4
MieScattering~
λ-(1…3)
Lambert-Beer‘s Law:
I(λ) = I0(λ)•e- [Σσ‘i (λ)⋅ci⋅L + (σbi⋅ci + εRay(λ) + εMie(λ)) ⋅L] ⋅ T(λ))narrow- wide band extinction
Remove by high-pass filtering
• Use differences ofintensities atdifferent wavelengths
• Record the intensityin many(typ. several 100)wavelength channels(entire spectra)
• High pass-filteringof spectra⇒ remove continuum
• Fit reference spectra⇒ Make use of allspectral information
Universität Heidelberg Institut für Umweltphysik
Example of a DOAS Evaluation (Fitting Procedure)A: Sample atmospheric spectrum
from April 16, 2001
B: Ozone absorption spectrum
C: BrO absorption spectrum
D: Residual (noise+unknown absorbers)
Black lines: measurementRed lines: fit result
[O3] = 6.6*1011 molec/cm³ [24 ppb][BrO] = 3.8*108 molec/cm³ [13 ppt]
300 350 400 450 500 550 600300 350 400 450 500 550 600
BrO
IO
OIO
I2
wavelength [nm]
Cro
ss S
ectio
ns [a
rb.u
nits
]
Universität Heidelberg Institut für Umweltphysik
Multi-Axis DOAS the Idea
α
ϑ
z
c(z)
dzds
scattering process
trace gas profile
Sun
Va ⋅
Va ⋅− )1( Stratospheric Trace Gas Layer
Tropospheric Trace Gas Layer
Tropopause
Total Slant Column: ( )
−+⋅=+=
ϑαϑα cos11
sin1
cos1
sin1 aaVSSS StratTrop
Universität Heidelberg Institut für Umweltphysik
BrO and ClO at theGreat Salt Lake
(Salt Lake City, USA)
J. Stutz UCLA
Stutz et al. 2002
Universität Heidelberg Institut für Umweltphysik
Measurement Sites
Ocean conditions
On the Salt Pan
Above the Pond
The Assal Trench
Universität Heidelberg Institut für Umweltphysik
Mini - MAX-DOAS Measurements of BrO at the
Salar de Uyuni (Bolivia), Oct./Nov. 2002
(N. Bobrowski, G. Hönninger)
Universität Heidelberg Institut für Umweltphysik
Active LP-DOAS Measurements of BrO-at the Dead Sea, Israel, June 11, 1997
Site &light-path
salt pans& faktory
0
10
20
0255075
1000
4080
1200000 01 02 03 04 05 06 07 08 09 10 11 12 13 14 15 16 17 18 19 20 21 22 23 0000
NOSWN Windrichtung
SO2 [ppb]0246
NO2 [ppb]
O3 [ppb]
Nachweisgrenze
BrO [ppt]
11 Jun 12 Jun051015Windgeschwindigkeit [m/s]
Hebestreit et al., Science 283, 55-57 1999
Universität Heidelberg Institut für Umweltphysik
Netanya
Ashdod
Beer-Sheva
Jerusalem
Tel-Aviv
100 120 140 160 180 200
60
80
100
120
140
160
180
200
220
0
20
40
60
80
100
3/8/9714:00-16:00
Netanya
Ashdod
Beer-Sheva
Jerusalem
Tel-Aviv
100 120 140 160 180 200
60
80
100
120
140
160
180
200
220
20
40
60
80
100
120
31/7/9714:40-17:00
Netanya
Ashdod
Beer-Sheva
Jerusalem
Tel-Aviv
100 120 140 160 180 200
60
80
100
120
140
160
180
200
220
60
80
100
120
140
160
180
200
220
Netanya
Ashdod
Beer-Sheva
Jerusalem
Tel-Aviv
100 120 140 160 180 200
60
80
100
120
140
160
180
200
220
0
20
40
60
80
100
120
8/8/9714:00-16:20
28/8/9715:15-17:45
0 10 20 km
N
Dea
d Se
aD
e ad
Sea
Dea
d Se
aD
ead
S ea
Ozone Destruction in the Dead-Sea
Basin
Matveiv et al., JGR 106, 10375-10378, 2001
Universität Heidelberg Institut für Umweltphysik
Dead Sea 2001Ein Bokek Ein Bokek
Evaporation ponds
Ovnat - 330 O3 monitors
LP-DOAS site
Ashalim - 400
North Site
Mid Site
South Site
Metzoke Dragot + 30
Ein Bokek- 410
Dead Sea Works - 400
Newe Zohar - 400
Massada + 50
Max-DOAS site Top Site
Ein Tamar - 400
-330 Heigth [m] above/ below sea level
Ein Bokek Ein Bokek
Evaporation ponds
Ovnat - 330 O3 monitors
LP-DOAS site
Ashalim - 400
North Site
Mid Site
South Site
Metzoke Dragot + 30
Ein Bokek- 410
Dead Sea Works - 400
Newe Zohar - 400
Massada + 50
Max-DOAS siteTop Site
Ein Tamar - 400
-330 Heigth [m] above/ below sea level
100 km100 km
• LP-DOAS at 3 sites:• Halogen Oxide, NO2 etc.• O3-monitors at 4 site• NO, SO2, CO - monitors• Weather station
Universität Heidelberg Institut für Umweltphysik
Dead Sea 2001 - IO
426 427 428 429 430 431 432 433 434 435 436 437-3.0
-2.5
-2.0
-1.5
-1.0
-0.5
0.0
0.5
-3.0
-2.5
-2.0
-1.5
-1.0
-0.5
0.0
0.5
Diff
eren
tial O
ptic
al D
ensi
ty [1
e-3]
Wavelength [nm]
0.99981.00001.0002
426 427 428 429 430 431 432 433 434 435 436 437
0.99981.00001.0002
00:00 02:00 04:00 06:00 08:00 10:00 12:00 14:00 16:00 18:00 20:00 22:00 24:00-2
0
2
4
6
8
10
-2
0
2
4
6
8
10M
ixin
g R
atio
5 points smoothed
IO [p
pt]
Time (UT)
20
30
40
50
60
70
8000:00 02:00 04:00 06:00 08:00 10:00 12:00 14:00 16:00 18:00 20:00 22:00 24:00
20
30
40
50
60
70
80
10 points smoothed
O
3 [pp
b]
Average diurnal variation
Zingler, J., and U. Platt (2005),Iodine oxide in the Dead SeaValley: Evidence for inorganic sources of boundary layer IO, J. Geophys. Res., 110, D07307doi.:10.1029/2004JD004993
Universität Heidelberg Institut für Umweltphysik
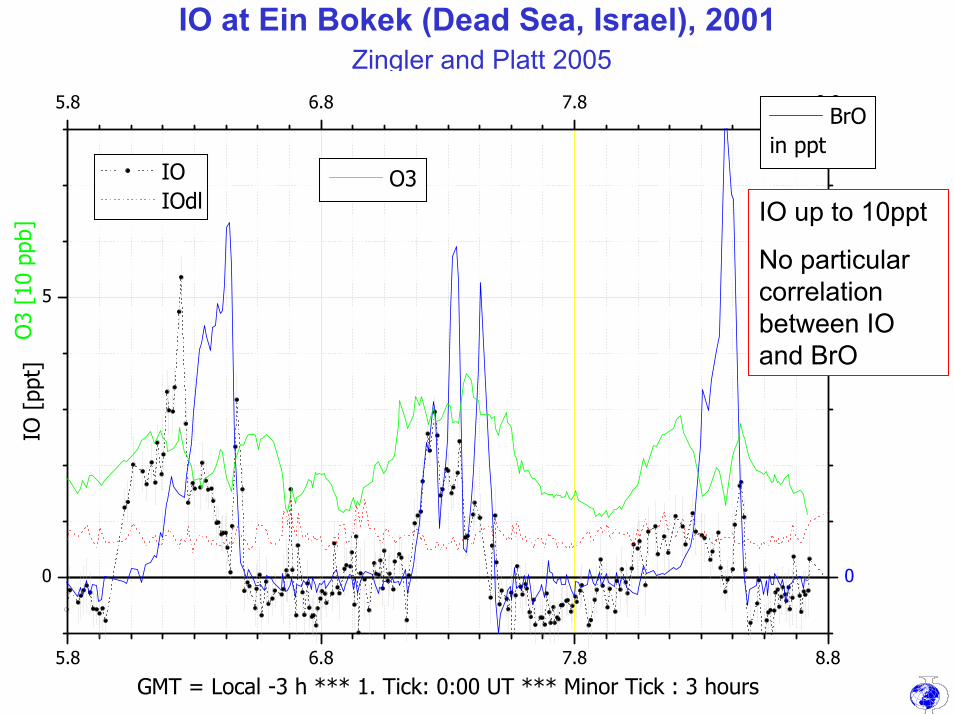
IO at Ein Bokek (Dead Sea, Israel), 2001Zingler and Platt 2005
5.8 6.8 7.8 8.8
0
5
5.8 6.8 7.8 8.8
0
50
IO [
ppt]
GMT = Local -3 h *** 1. Tick: 0:00 UT *** Minor Tick : 3 hours
IO IOdl
BrOin ppt
O3
O3
[10
ppb]
IO up to 10ppt
No particular correlation between IO and BrO
Universität Heidelberg Institut für Umweltphysik
Sources of IO at the Dead Sea
• No Macroalgae!• Microalgae (Phytoplankton): Mainly Dunaliella parva, but no
regular bloom (none since 1995).⇒ The Dead Seas is an excellent pplace to study inorganic
sources of IO.
Possible iodine source mechanisms:1) Direct surface reactions at sea water (photochemistry or
O3)(„Leaching“)2) Release from inorganic Reservoir gases (HOI, INO2, INO3,
I2, etc.)3) Release by heterogeneous reactions on salt surfaces
Universität Heidelberg Institut für Umweltphysik
Dead Sea 2001: BrO – NO2 Anticorrelation
05.08.2001 06.08.2001 07.08.2001 08.08.2001
-20
0
20
40
60
80
100
-2
0
2
4
BrO
GMT = Local - 3 h *** 1. Tick: 0:00 UT *** Minor Tick: 3 hours
Date
Mix
ing
Ratio
BrO
[pp
t]
NOS
WN5 Aug 6 Aug 7 Aug 8 Aug
NOSWN
Win
d D
irIO
[ppt]
NO2
NO
2 [0
.1 p
pb]
IO
Universität Heidelberg Institut für Umweltphysik
Dead Sea 2001 – BrO coming from the South?
05.08.2001 06.08.2001 07.08.2001 08.08.2001
0
25
50
75
100
125
150
0
25
50
75
100
125
150 DSW
Ein Bokek East Ovnat
GMT = Local - 3 h *** 1. Tick: 0:00 UT *** Minor Tick: 3 hours
Date
Mix
ing
Ratio
BrO
[pp
t]
NOS
WN5 Aug 6 Aug 7 Aug 8 Aug
NOSWN
Win
d D
ir
Universität Heidelberg Institut für Umweltphysik
Ein Bokek Ein Bokek
Evaporation ponds
Ovnat - 330 O3 monitors
LP-DOAS site
Ashalim - 400
North Site
Mid Site
South Site
Metzoke Dragot + 30
Ein Bokek- 410
Dead Sea Works - 400
Newe Zohar - 400
Massada + 50
Max-DOAS site Top Site
Ein Tamar - 400
-330 Heigth [m] above/ below sea level
Ein Bokek Ein Bokek
Evaporation ponds
Ovnat - 330 O3 monitors
LP-DOAS site
Ashalim - 400
North Site
Mid Site
South Site
Metzoke Dragot + 30
Ein Bokek- 410
Dead Sea Works - 400
Newe Zohar - 400
Massada + 50
Max-DOAS siteTop Site
Ein Tamar - 400
-330 Heigth [m] above/ below sea level
MassadaMassada
100 km100 km
EastEast WestWest
Dead Sea 2002
MAXMAX--DOAS, DOAS, OO33, , MeteorologyMeteorology
Universität Heidelberg Institut für Umweltphysik
BrO Slant Column Density Profile
25.6 26.6 27.6 28.6 29.6 30.6 1.7
-2x10¹⁴
0
2x10¹⁴
4x10¹⁴
6x10¹⁴
8x10¹⁴
25.6 26.6 27.6 28.6 29.6 30.6 1.7
-2x10¹⁴
0
2x10¹⁴
4x10¹⁴
6x10¹⁴
8x10¹⁴
-45° -10° - 5° - 2° 0° 2° 5° 10° 90°
BrO
-dS
CD
[mol
ec/c
m2 ]
Time [UT = LT-3h]
Universität Heidelberg Institut für Umweltphysik
… Understanding the Results!
Dead Sea Basin „filled“ with BrO
Universität Heidelberg Institut für Umweltphysik
MAX-DOAS at Massada 2002: BrO-O3 Anticorrelation
21.6 22.6 23.6 24.6 25.6 26.6 27.6 28.6 29.6 30.6 1.7
-2x10¹⁴
0
2x10¹⁴
4x10¹⁴
6x10¹⁴
8x10¹⁴
21.6 22.6 23.6 24.6 25.6 26.6 27.6 28.6 29.6 30.6 1.7
-30
-20
-10
0
10
20
30
40
50
60
70
80
90 -45° -10° - 5° - 2° 0° 2° 5° 10° 90°
BrO
-dS
CD
[mol
ec/c
m2 ]
Time [UT = LT-3h]
O3
Ozone [ppb]
Universität Heidelberg Institut für Umweltphysik
Ein Bokek Ein Bokek
Evaporation ponds
Ovnat - 330 Monitors
LP-DOAS site
Ashalim - 400
Metzoke Dragot + 30
Ein Bokek- 410
Dead Sea Works - 400
Newe Zohar - 400
Massada + 50
Max-DOAS site
Ein Tamar - 400
-330 Heigth [m] above/ below sea level
Ein Gedi- 300
Ein Bokek Ein Bokek
Evaporation ponds
Ovnat - 330 Monitors
LP-DOAS site
Ashalim - 400
Metzoke Dragot + 30
Ein Bokek- 410
Dead Sea Works - 400
Newe Zohar - 400
Massada + 50
Max-DOAS site
Ein Tamar - 400
-330 Heigth [m] above/ below sea level
Ein Gedi- 300
Dead Sea 2004
6 Mini6 Mini--MAX MAX DOAS DOAS Instruments Instruments along the Dead along the Dead Sea shoreSea shore
Universität Heidelberg Institut für Umweltphysik
Dead Sea 2004 – IO MAX-DOAS
04 05 06 07 08 09 10 11 12 13 14 15 160.00E+000
1.00E+013
2.00E+013
3.00E+013
4.00E+013
5.00E+013
6.00E+013
7.00E+013
8.00E+013
21.06.2004 G746
Elevation AngledS
CD
IO [m
olec
/cm
²]
Time [UT = Local Time - 3 h]
0
1.000
2.000
3.000
4.500
6.000
10.00
20.00
20.00
415 420 425 430 435 4400.9985
0.9990
0.9995
1.0000
1.0005
1.0010
File #3281 - 21.06.04 11:25UT Elev 2°
Fit Fit + ResiduumO
ptic
al d
ensi
ty IO
W avelength [nm]
Universität Heidelberg Institut für Umweltphysik
MAX-DOAs BrO, Ein Gedi Kibbuz 2004 Parallell to LP-DOAS (and coast)
03:0004:00 05:0006:0007:00 08:0009:0010:0011:00 12:0013:0014:00 15:0016:00-1,00E+014
0,00E+000
1,00E+014
2,00E+014
3,00E+014
4,00E+014
5,00E+014
6,00E+014
7,00E+014
8,00E+014
9,00E+014
1,00E+015
1,10E+015
22.06.2004 G740
Elevation Angle
dSC
D B
rO [m
olec
/cm
²]
Time [UT = Local Time - 3 h]
-1,000
0
1,000
2,000
3,000
4,500
6,000
10,00
20,00
20,00
Universität Heidelberg Institut für Umweltphysik
MAX-DOAs BrO, Ein Gedi Kibbuz 2004 Orthogonal to LP-DOAS (and coast)
03:0004:00 05:0006:0007:00 08:0009:0010:0011:00 12:0013:0014:00 15:0016:00-3,00E+014
-2,00E+014
-1,00E+014
0,00E+000
1,00E+014
2,00E+014
3,00E+014
4,00E+014
5,00E+014
6,00E+014
7,00E+014
8,00E+014
22.06.2004 G745
Elevation Angle
dSC
D B
rO [m
olec
/cm
²]
Time [UT = Local Time - 3 h]
0
1,000
2,000
3,000
4,500
6,000
10,00
20,00
20,00
Universität Heidelberg Institut für Umweltphysik
BrONO2 = NO2(Monitor) – NO2(DOAS) ?
16.6 17.6 18.6 19.6 20.60
3
6
916.6 17.6 18.6 19.6 20.6
0
1
2
3 NO2 Monitor
NO
2 [pp
b]
Time [UT *** 1 minor tick = 4 hours]
NO
[ppb]
NO Monitor NO2 DOAS
?
Universität Heidelberg Institut für Umweltphysik
What we learned ...• Large amounts of reactive Br is released by salt pans or
(possible) salt sea surfaces.• At the Dead Sea IO is likely to be released by inorganic
processes (elsewhere it appears to be released by biological precursors).
• Vertical distribution of halogen oxides.
Open questions ...• Abundance of reactive Cl?• Release mechanism(s)• Release from salt pans, aerosol, or also from sea surface?• Importance on global scale?• Particle formation?• Mercury?
Universität Heidelberg Institut für Umweltphysik
BrONO2 = NO2(Monitor) – NO2(DOAS) ?
16.6 17.6 18.6 19.6 20.60
3
6
916.6 17.6 18.6 19.6 20.6
0
30
60
90
NO2 Monitor
NO
2 [ppb
]
Time [UT *** 1 minor tick = 4 hours]
NO2 DOAS
BrO [ppt]
3. Lichtweg 3. Lichtweg ––Nicht benutztNicht benutzt
0.5 km0.5 km
Active LP-DOAS measurements at Ein Bokek2001
•Sonic Anemometer•LP-DOAS mit 2 Light Paths:
–East: 8477 m–Mountain 1966 m
Universität Heidelberg Institut für Umweltphysik
IO at Lilia, Brittany, France, Atlantic Coast 06.5.2003 - 13.6.2003, C. Peters et al.
2 Jun 3 Jun 4 Jun 5 Jun 6 Jun 7 Jun-2
0
2
4
6
8
10
IO c
once
ntra
tion
[ppt
]
Date
2 Jun 3 Jun 4 Jun 5 Jun 6 Jun 7 Jun
-4
-2
0
2
4
6
Tide
nhöh
e [m
]
Universität Heidelberg Institut für Umweltphysik
Multi-Axis DOAS (MAX-DOAS) for Detection of Plumesfrom Urban Areas, Stacks, Volcanoes, Biomass Burning:
Static Scanning Instruments
B
A
Viewing geometries using static scanning MAX-DOAS instruments.
In a combination of two or more systems (A, B) the vertical distribution of the plume can be determined by triangulation.
Universität Heidelberg Institut für Umweltphysik
MAX - DOAS BrO from Soufriere Hills Volcano on Montserrat, Caribean, May 25, 2002
BrO
Optical D
ensity [%]B
rO S
CD
[mol
ec/c
m2 ]
elevation angle [°]330 340 350 360
330 340 350 360
-4
-3
-2
-1
0
1
2
3
4
511
0 10 20 30 40 50 60 70 80 90
0.0
2.0x10¹⁴
4.0x10¹⁴
6.0x10¹⁴
8.0x10¹⁴
1.0x10¹⁵
1.2x10¹⁵
1.4x10¹⁵
0 10 20 30 40 50 60 70 80 90
1098765
1
2
3
4
109
5
7
8
2
3
4
6
1
α α1
α2
hp
d≈1kmLL
View from west
β
σ
x
Bobrowski et al., Nature 423, 15 May, 273-276, 2003.
Universität Heidelberg Institut für Umweltphysik
BrO : SO2 ≈ 1 : 1000 (Molar Ratio)
Global SO2Emission fromVolcanoes:
≈ 14 Mio. t/year
assuming sameBr:S ratio as Monserrat for all Volcanoes:
→ 30 000 t Br/year
possibly up to 150 Kt Br/year
Universität Heidelberg Institut für Umweltphysik
Vertical Resolution of MAX-DOAS --> ‘Poor Man’s LIDAR’∆SCD’s Measured on May 4, 2000 (15:15 UT – 15:40 UT), Alert 2000 PSE
0.0
0.5
1.0
1.5
2.0
2.5
0.0 0.1 0.2 0.3 0.4 0.5
0.0
0.5
1.0
1.5
2.0
2.5
25102090
α -1 [deg-1]
elevation angle α [°]
∆SC
D B
rO [1
014cm
-2]
measuredmodelled
P1 (0-1km) P2 (0-2km) P3 (0-1km+1-2km) P4 (1-2km) P5 (O4) P6 (strat.)
Hönninger and Platt, 2000
Universität Heidelberg Institut für Umweltphysik
Campaign 5 (Juni -Juli 2002), Multi-Axis (MAX)-DOAS at MassadaJ. Zingler
Arad
Jordain
Massada
Dead Sea
BrO-Plume
600 m
460 m
30 km10 km
Elevationangle
Straylight
Universität Heidelberg Institut für Umweltphysik
25.06.2002 26.06.2002 27.06.2002 28.06.2002 29.06.2002 30.06.2002 01.07.20020.0
0.5
1.0
1.5
2.0
2.525.6 26.6 27.6 28.6 29.6 30.6 1.7
0.0
0.5
1.0
1.5
2.0
2.5
-45° horizontal -10° +02° -05° +5° -02° +10°
BrO
-dSC
D [
arb.
uni
ts]
GMT = Local - 3 h *** 1. Tick: 0:00 UT *** Minor Tick: 6 hours
MAX-DOAS BrO-Vertical Profile - Measurements, 2002
Universität Heidelberg Institut für Umweltphysik
Conclusions
• Reactive Bromine species (e.g. BrO) are found in the polar boundary layer during spring, at salt lakes, and in volcanic emissions
• BrO could have a profound effect on tropospheric ozone
• Reactive Iodine (IO, OIO) species are found in practicallyall coastal areas, BrO was found in one case.
• Source mechanisms of reactive halogen species in the troposphere are not well understood