Spatiotemporal variability and assessment ofdrought in the Wei River basin of China
Siyang Cai1,2, Depeng Zuo1,2, Zongxue Xu1,2, Xianming Han1,2, and Xiaoxi Gao1,2
1College of Water Sciences, Beijing Normal University, Beijing 100875, China2Beijing Key Laboratory of Urban Hydrological Cycle and Sponge City Technology, Beijing 100875, China
Received: 31 December 2017 – Revised: 14 March 2018 – Accepted: 27 March 2018 – Published: 5 June 2018
Abstract. The temporal and spatial variations of drought in the Wei River basin (WRB) were investigated bycalculating the meteorological drought Index (Standardized Precipitation Index, SPI) and the agricultural droughtindex (Vegetation Health Index, VHI). Monthly precipitation and air temperature were from 22 meteorologicalstations over the region from 1960 to 2015. Monthly Normalized Difference Vegetation Index (NDVI) and 8-days Land Surface Temperature (LST) were provided from the National Aeronautics and Space Administration(NASA) for the period 2000–2015 were also adopted. The results showed that the drought initially increased andthen decreased, reaching at the maximum value in 1990s. The spatial pattern of meteorological drought showedthat the drought in northern WRB was heavier than that in southern WRB before 1990s, after that, the situationhad the opposite. By comparing the agricultural drought index (VHI) with crop yield, it was proved that VHIwas applicable in the WRB and could well reflect the fluctuation of agricultural drought. The WRB sufferedfrom serious agricultural drought in 2000, 2001, 2007 and 2008. Through analysis of the historical precipitationand temperature data, it was found that precipitation had a greater contribution to creating agricultural droughtconditions than temperature in the Wei River basin.
1 Introduction
Drought is a natural and recurring feature of climate; oc-curring in virtually all climatic regimes (Mishra and Singh,2010) and frequent drought have been concerned for manyyears (Lei et al., 2016). On a global scale, the frequency,duration and severity of droughts have increased substan-tially in recent decades (Dai, 2011), especially in the re-gions of arid and semi-arid (Solomon, 2007). Furthermore,drought directly or indirectly affect social and economic sus-tainability (Alam et al., 2012). Generally divided droughtinto four categories, meteorological drought, hydrologicaldrought, agricultural drought, as well as socio-economicdrought (Wilhite and Glantz, 1985).
Drought severity or magnitude can be illustrated bydrought indices (Steinemann, 2003). Numerous indices havebeen developed for identifying the characteristic of droughtover the past few decades. Standardized Precipitation Index(McKee et al., 1993) is a commonly used drought monitor-ing index, which is calculated based on precipitation data and
could have multiple time scales. The SPI has been widelyused for drought assessment all over the world (Karavitis etal., 2011; Moreira et al., 2015; Zarch et al., 2015; Olorun-tade et al., 2017). Palmer Drought Severity Index (PDSI)is a drought index for drought assessment, which basedon precipitation and air temperature to calculating mois-ture supply and demand by a two-layer soil moisture model(Palmer, 1965). Rayne and Forest (2016) found that therewas a substantial increase in drought variability at shorttime scales based on the PDSI in the United States since1895. Liu et al. (2013) employed the PDSI for analyzing thespatiotemporal characteristics of dryness conditions acrossQinghai Province, Northwest China. The Standardized Pre-cipitation Evapotranspiration Index (SPEI) (Vicente-Serranoet al., 2010) is also based on the supply and demand conceptof the water balance equation. Zuo et al. (2016) showed thatthe applicability of the SPEI in Shandong Province were ver-ified by comparing the SPEI, crop yield and drought-affectedcrop area.
Published by Copernicus Publications on behalf of the International Association of Hydrological Sciences.
74 S. Cai et al.: Spatiotemporal variability and assessment of drought
In addition, remote sensing technology has made it possi-ble to monitor the condition of vegetation across large areas(Lei et al., 2015; Zhang et al., 2017). Thus, remote sensing,which can be used to extract meteorological or biophysicalcharacteristics of terrestrial surfaces, has gained more atten-tion for drought monitoring (Rhee et al., 2010). The widelyused vegetation indices include VCI (Vegetation ConditionIndex) (Kogan, 1995), Temperature Condition Index (TCI)(Kogan, 1995), Soil Moisture Condition Index (SMCI) andPrecipitation Condition Index (PCI) (Zhang and Jia, 2013).Furthermore, Martinez-Fernandez et al. (2016) proved thatSMOS Soil Water Deficit Index (SWDI) well reproduces thesoil water balance dynamics and was able to appropriatelytrack agricultural drought. Unganai and Kogan (1998) clearlyshowed that temporal and spatial characteristics of drought inAfrica could be detected, tracked and mapped from AVHRRdata based on Vegetation Health Index (VHI). The Normal-ized Vegetation Supply Water Index (NVSWI) registered cor-relation coefficients with the AMSR-E soil moisture data atthe values of 0.53 in September and indicated its applicabil-ity in monitoring drought in Northeast China (Cong et al.,2017).
China is one of the major crop production countries aroundthe world, which accounted for 20 % of global cereal pro-duction in 2011 (FAO, 2014). However, Yu et al. (2014)also revealed that dry areas were reported to increase by3.72 % per decade in the past five decades. Since the late1990s, droughts have become more frequent and severeacross China (Chen and Sun, 2015). Both the frequency andseverity of droughts over the Yun–Gui Plateau in SouthwestChina were intensified during the recent decades from totalwater storage anomalies (TWSA) generated using GRACEsatellite data and ANN models (Long et al., 2014). The WeiRiver is of great importance in social and economic devel-opment of Shan’xi, Gausu and Ningxia Provinces in China.Zou et al. (2017) showed that the whole Wei River basin ex-hibited a dry trend, with more significant trends in the north-ern, southeastern and western WRB than the remaining re-gions based on PDSI_SWAT. Zhai and Feng (2009) showedthat short time drought had affected the Yellow River Basinand Yangtze River Basin more than the Inland River Basin.However, there is no comprehensive research on spatiotem-poral variability of drought based on remote sensing datasetin the Wei River basin. Hence, the main process of the studyare as follows: (1) to analysis temporal trends of annual totalprecipitation and average air temperature during the period1960–2015; (2) to calculate frequency occurrence of differ-ent degree of drought at various time scales and the variationof drought intensity for the recent six decades based on theSPI; (3) to identify spatial variations of drought and droughtrating based on the SPI; (4) to estimate the spatiotemporalvariability of agricultural drought based on the VHI; (5) toevaluate the capability of the VHI; (6) to analysis the rela-tionship between the VHI and meteorological factors. Theresults gained in this study could provide useful information
for drought assessment in the Wei River basin and other re-gions in China.
2 Study Area and Data Description
2.1 Study Area
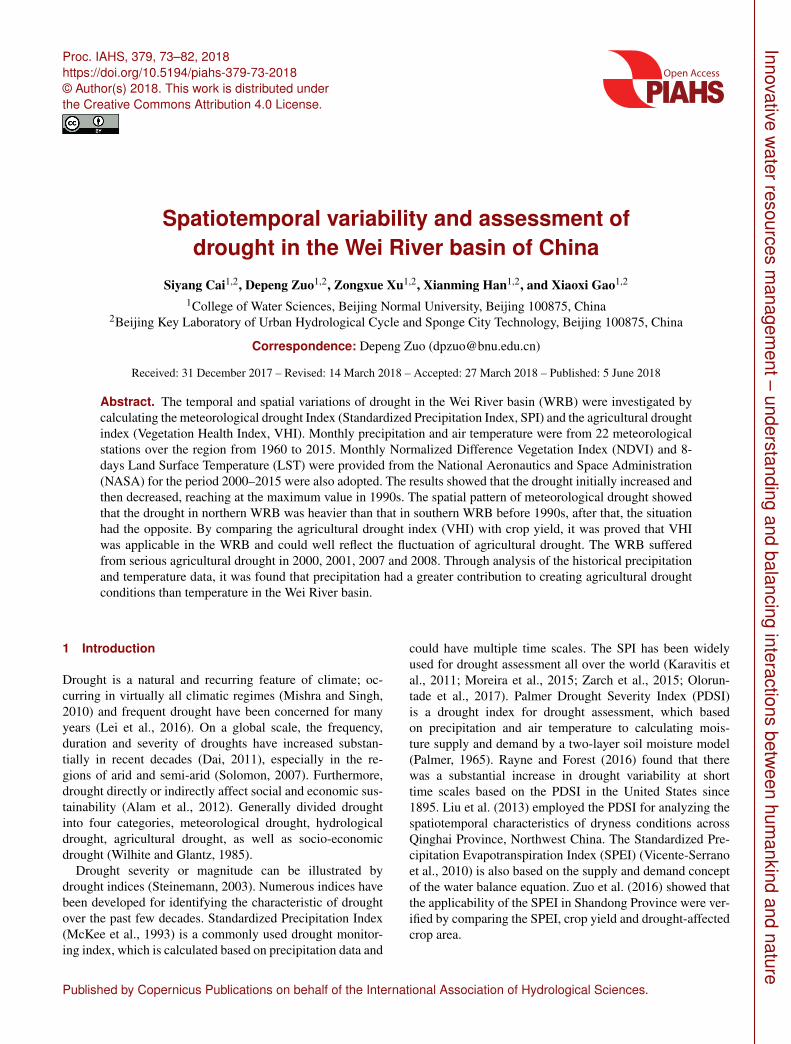
Wei River is the largest tributary of the Yellow River in NorthChina, with a drainage area of 1348× 105 km2 and orig-inate from the Gansu Province and flows into the YellowRiver at the Tongguan port with its length of approximately818 km (Fig. 1). It lies between latitude 33.5 to 37.5◦ Nand 103.5 to 110.5◦ E. The mean annual temperature in theWRB is between 7.8 and 13.5◦, mean annual precipitationis 400–800 mm−1 and potential evapotranspiration is 800–1000 mm yr−1. In winter the climate is cold, dry and rain-less, controlled by the Mongolia high pressure system, andit is hot and rainy in summer due to the effects of the WestPacific subtropical high pressure system.
2.2 Data Description
The monthly precipitation and average air temperature dataat 22 national meteorological stations analyzed in this papercollected from the Chinese Meteorological Data Sharing Ser-vice System, China Meteorological Administration over theWei River Basin from 1960 to 2015, twelve of them were inShanxi Province, seven of them were in Gansu Province andothers in Ningxia Province. The spatial distribution and de-tail information of the 22 gauging stations are shown in Fig. 1and Table 1.
All the products of the remote sensing dataset are pro-vided by the Moderate Resolution Imaging Spectroradiome-ter (MODIS), which are acquired from the National Aero-nautics and Space Administration (NASA). Monthly Nor-malized Difference Vegetation Index (NDVI) information areobtained from MODIS13A3 NDVI product and eight-daysLand Surface Temperature (LST) information are providedby MOD11A2 during 2000–2015. All the MODIS datasetshave a spatial resolution of 1 km× 1 km. To remove noisefrom the remote sensing data caused by clouds or weather,the maximum value composite (MVC) method is used fordata processing. The selected MODIS data products arepreprocessed using the MODIS Reprojection Tools (MRT)(Yang et al., 2012).
3 Methodology
3.1 Calculation of the SPI
Computation of the SPI involves fitting a gamma probabil-ity density function to a given time series of precipitation.This is performed separately for each month (or any othertemporal basis of the raw precipitation time series) and for
Proc. IAHS, 379, 73–82, 2018 proc-iahs.net/379/73/2018/
S. Cai et al.: Spatiotemporal variability and assessment of drought 75
Table 1. The meteorological gauging stations in the Wei River Basin.
Precipitation Air temperature
Station Longitude Latitude Altitude Average Trend Average TrendName (◦ E) (◦ N) (m) (mm) (mm yr−1) (mm) (mm yr−1)
Figure 1. Distribution of meteorological stations in the Wei RiverBasin, China.
each location in space (McKee et al., 1993). The SPI can becalculated as the following:
It is firstly fitted with an incomplete gamma probabilitydensity function to a given frequency distribution of precipi-tation at a station.
p (x)=1
βα0 (α)xα−1e−x/β , x > 0 (1)
where x is the precipitation amount, αis the shape parameter,β is the scale parameter, and the gamma function is expressedas:
0 (α)=
∞∫0
xα−1e−xdx (2)
The maximum likelihood method is used to estimate the op-timal values of αand β (Thom, 1966).
α̂ =1
4A
(1+
√1+
4A3
)(3)
β̂ =x
α̂(4)
A= ln (x)−∑
ln (x)n
(5)
where n is the number of precipitation records.The cumulative probability for a given month then can be
obtained by the following equation:
G (x)=
x∫0
g (x)dx =1
β̂ α̂0(α̂) x∫
0
xα̂−1e−x/β̂dx (6)
proc-iahs.net/379/73/2018/ Proc. IAHS, 379, 73–82, 2018
76 S. Cai et al.: Spatiotemporal variability and assessment of drought
Setting t = x/β̂, the incomplete gamma function can be ob-tained:
G (x)=1
0(α̂) x∫
0
t α̂−1e−tdt (7)
Parameters of the gamma distribution are estimated for everyindividual station in each month of the year. Considering theprobability for a precipitation amount of zero (x= 0) whichis not defined in the gamma function, the cumulative proba-bility becomes:
H (x)= q + (1− q)G (x) (8)
where q is the probability of a zero and is estimated by m/n,m is the number of zeros in precipitation records, and n is thelength of precipitation records.
The cumulative probability of the distribution for eachvalue of precipitation is then transformed using equal proba-bility to a normal distribution with a mean of zero and stan-dard deviation of one, which is the value of the SPI. For agiven cumulative probability H (x), the corresponding nor-mal distribution probability can be estimated by using fol-lowing equation (Abramowitz and Stegun, 1964):
1.432788, d2 = 0.189269, d3 = 0.001308. Table 2 shows thecategorization of drought and wet classified based on the SPI.
3.2 Calculation of the VHI
The Vegetation Index was defined as combination of VCIand TCI. It has been widely used to detect drought in manyplaces, such as Africa, China, America, etc. The VHI wasdefined by the following formulae:
VCI=NDVI−NDVImin
NDVImax−NDVImin× 100 (10)
TCI=Tmax− T
Tmax− Tmin× 100 (11)
VHI= α∗VCI+ (1−α)∗TCI (12)
where NDVImax and NDVImin are the multi-year absolutemaximum and minimum of NDVI, respectively; Tmax andTmin are the multi-year absolute maximum and minimum ofT , respectively; and α is the weight to measure the contri-bution of VCI and TCI for assessing the status of drought.Generally, α is set as 0.5 because it is difficult distinguish
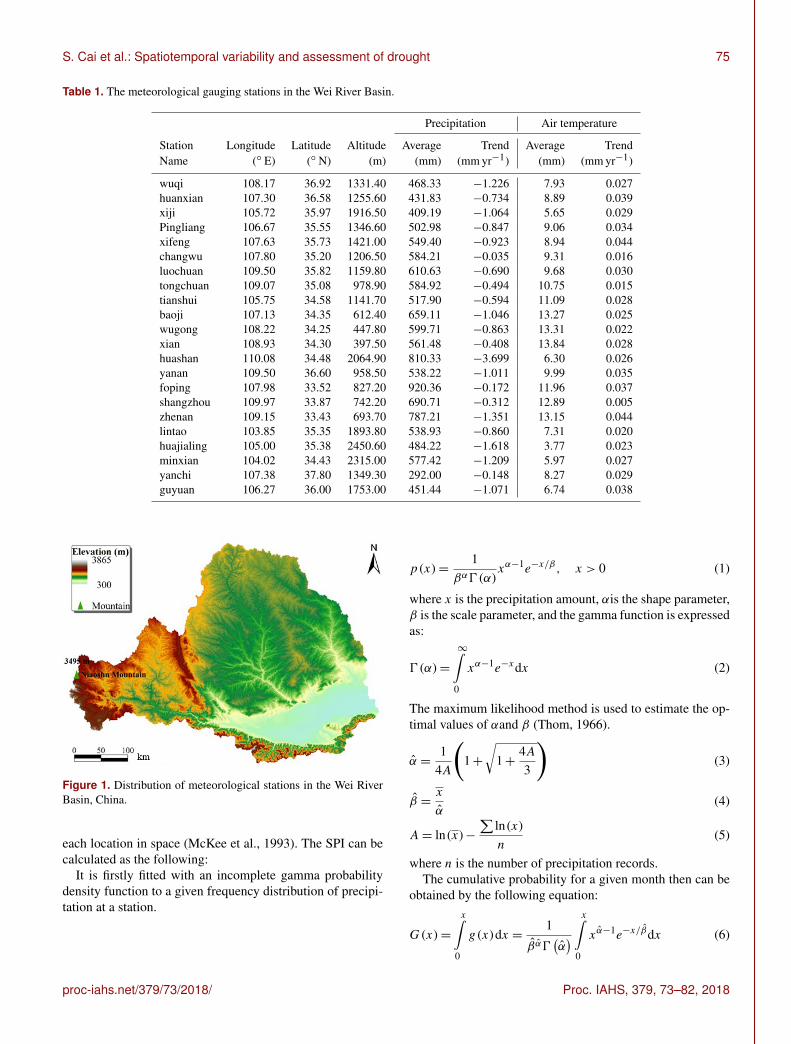
Table 2. Classification of drought calculated by the SPI.
Figure 2. Temporal variations of annual average air temperatureand total precipitation in the Wei River Basin.
the contribution of crop surface temperature and NDVI whenmeasuring drought stress. VHI was proposed to address thelimitations of VCI in areas with excessive soil wetness and/orlong periods of cloudiness (Kogan, 1995), under which con-ditions NDVI is normally very depressed and VCI has lowvalues, which can be interpreted as drought in error. TCI isexpected to correct low values because of the variation in re-sponse of vegetation to temperature as compared with NDVI.Table 3 shows the categorization of drought based on theVHI.
4 Results and Discussion
4.1 Trend analysis of precipitation and air temperature
The temporal trends of annual total precipitation and av-erage air temperature over the Wei River Basin WRB at22 meteorological stations during the period 1960–2015 areshown in Table 1. The results shows that all stations showeda decreasing trend in annual total precipitation, rangingfrom −3.7 to −0.15 mm yr−1. The largest decreasing trend(−3.7 mm yr−1) was identified at Huashan station, which islocated in the southeastern area.
For annual average air temperature, an increasing trendwas found at all the 22 stations, ranging from 0.005 to0.044 ◦C yr−1. The highest increase was observed at Zhen’anstation, located in the south area, while the lowest increasewas detected at Shangzhou station, located in the southeast-ern area.
Proc. IAHS, 379, 73–82, 2018 proc-iahs.net/379/73/2018/
S. Cai et al.: Spatiotemporal variability and assessment of drought 77
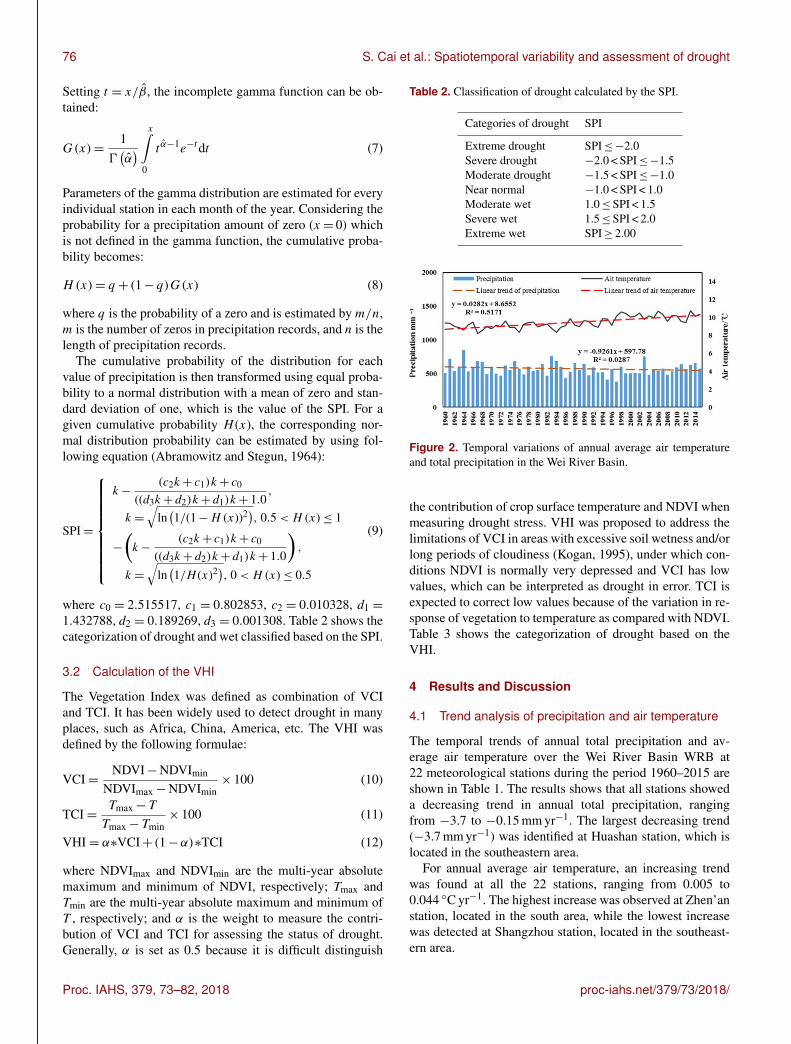
Figure 3. Drought frequency in different decades at different time scales in the Wei River Basin.
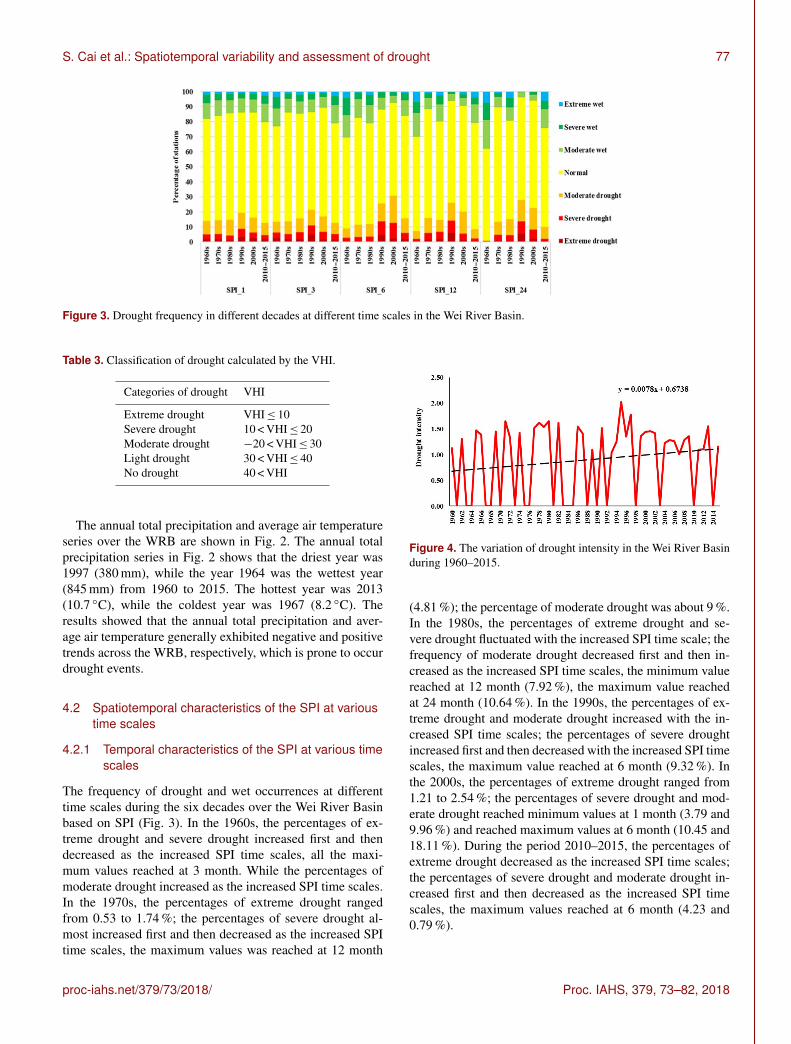
Table 3. Classification of drought calculated by the VHI.
The annual total precipitation and average air temperatureseries over the WRB are shown in Fig. 2. The annual totalprecipitation series in Fig. 2 shows that the driest year was1997 (380 mm), while the year 1964 was the wettest year(845 mm) from 1960 to 2015. The hottest year was 2013(10.7 ◦C), while the coldest year was 1967 (8.2 ◦C). Theresults showed that the annual total precipitation and aver-age air temperature generally exhibited negative and positivetrends across the WRB, respectively, which is prone to occurdrought events.
4.2 Spatiotemporal characteristics of the SPI at varioustime scales
4.2.1 Temporal characteristics of the SPI at various timescales
The frequency of drought and wet occurrences at differenttime scales during the six decades over the Wei River Basinbased on SPI (Fig. 3). In the 1960s, the percentages of ex-treme drought and severe drought increased first and thendecreased as the increased SPI time scales, all the maxi-mum values reached at 3 month. While the percentages ofmoderate drought increased as the increased SPI time scales.In the 1970s, the percentages of extreme drought rangedfrom 0.53 to 1.74 %; the percentages of severe drought al-most increased first and then decreased as the increased SPItime scales, the maximum values was reached at 12 month
Figure 4. The variation of drought intensity in the Wei River Basinduring 1960–2015.
(4.81 %); the percentage of moderate drought was about 9 %.In the 1980s, the percentages of extreme drought and se-vere drought fluctuated with the increased SPI time scale; thefrequency of moderate drought decreased first and then in-creased as the increased SPI time scales, the minimum valuereached at 12 month (7.92 %), the maximum value reachedat 24 month (10.64 %). In the 1990s, the percentages of ex-treme drought and moderate drought increased with the in-creased SPI time scales; the percentages of severe droughtincreased first and then decreased with the increased SPI timescales, the maximum value reached at 6 month (9.32 %). Inthe 2000s, the percentages of extreme drought ranged from1.21 to 2.54 %; the percentages of severe drought and mod-erate drought reached minimum values at 1 month (3.79 and9.96 %) and reached maximum values at 6 month (10.45 and18.11 %). During the period 2010–2015, the percentages ofextreme drought decreased as the increased SPI time scales;the percentages of severe drought and moderate drought in-creased first and then decreased as the increased SPI timescales, the maximum values reached at 6 month (4.23 and0.79 %).
proc-iahs.net/379/73/2018/ Proc. IAHS, 379, 73–82, 2018
78 S. Cai et al.: Spatiotemporal variability and assessment of drought
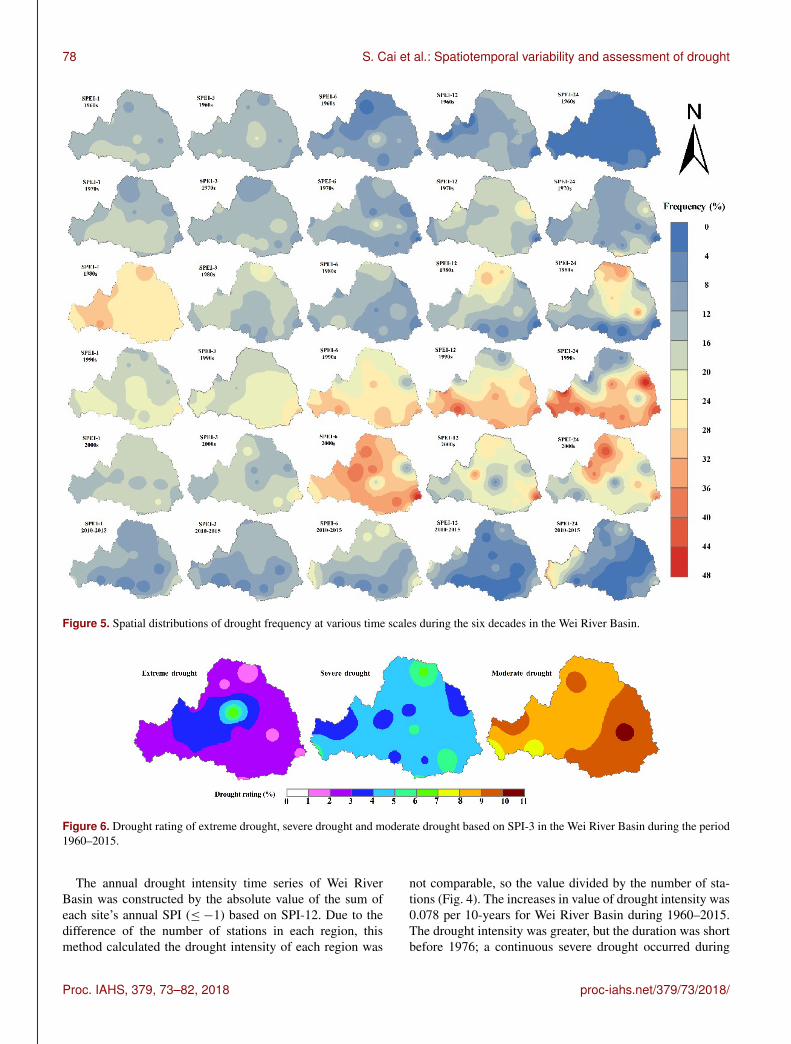
Figure 5. Spatial distributions of drought frequency at various time scales during the six decades in the Wei River Basin.
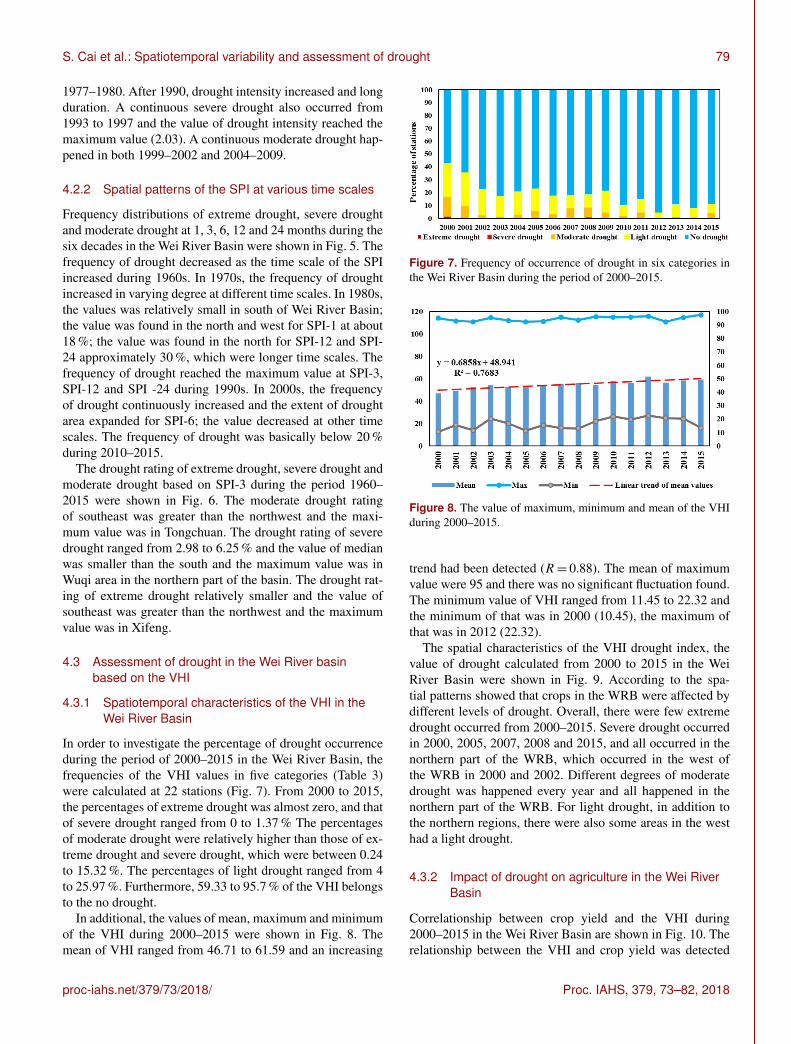
Figure 6. Drought rating of extreme drought, severe drought and moderate drought based on SPI-3 in the Wei River Basin during the period1960–2015.
The annual drought intensity time series of Wei RiverBasin was constructed by the absolute value of the sum ofeach site’s annual SPI (≤−1) based on SPI-12. Due to thedifference of the number of stations in each region, thismethod calculated the drought intensity of each region was
not comparable, so the value divided by the number of sta-tions (Fig. 4). The increases in value of drought intensity was0.078 per 10-years for Wei River Basin during 1960–2015.The drought intensity was greater, but the duration was shortbefore 1976; a continuous severe drought occurred during
Proc. IAHS, 379, 73–82, 2018 proc-iahs.net/379/73/2018/
S. Cai et al.: Spatiotemporal variability and assessment of drought 79
1977–1980. After 1990, drought intensity increased and longduration. A continuous severe drought also occurred from1993 to 1997 and the value of drought intensity reached themaximum value (2.03). A continuous moderate drought hap-pened in both 1999–2002 and 2004–2009.
4.2.2 Spatial patterns of the SPI at various time scales
Frequency distributions of extreme drought, severe droughtand moderate drought at 1, 3, 6, 12 and 24 months during thesix decades in the Wei River Basin were shown in Fig. 5. Thefrequency of drought decreased as the time scale of the SPIincreased during 1960s. In 1970s, the frequency of droughtincreased in varying degree at different time scales. In 1980s,the values was relatively small in south of Wei River Basin;the value was found in the north and west for SPI-1 at about18 %; the value was found in the north for SPI-12 and SPI-24 approximately 30 %, which were longer time scales. Thefrequency of drought reached the maximum value at SPI-3,SPI-12 and SPI -24 during 1990s. In 2000s, the frequencyof drought continuously increased and the extent of droughtarea expanded for SPI-6; the value decreased at other timescales. The frequency of drought was basically below 20 %during 2010–2015.
The drought rating of extreme drought, severe drought andmoderate drought based on SPI-3 during the period 1960–2015 were shown in Fig. 6. The moderate drought ratingof southeast was greater than the northwest and the maxi-mum value was in Tongchuan. The drought rating of severedrought ranged from 2.98 to 6.25 % and the value of medianwas smaller than the south and the maximum value was inWuqi area in the northern part of the basin. The drought rat-ing of extreme drought relatively smaller and the value ofsoutheast was greater than the northwest and the maximumvalue was in Xifeng.
4.3 Assessment of drought in the Wei River basinbased on the VHI
4.3.1 Spatiotemporal characteristics of the VHI in theWei River Basin
In order to investigate the percentage of drought occurrenceduring the period of 2000–2015 in the Wei River Basin, thefrequencies of the VHI values in five categories (Table 3)were calculated at 22 stations (Fig. 7). From 2000 to 2015,the percentages of extreme drought was almost zero, and thatof severe drought ranged from 0 to 1.37 % The percentagesof moderate drought were relatively higher than those of ex-treme drought and severe drought, which were between 0.24to 15.32 %. The percentages of light drought ranged from 4to 25.97 %. Furthermore, 59.33 to 95.7 % of the VHI belongsto the no drought.
In additional, the values of mean, maximum and minimumof the VHI during 2000–2015 were shown in Fig. 8. Themean of VHI ranged from 46.71 to 61.59 and an increasing
Figure 7. Frequency of occurrence of drought in six categories inthe Wei River Basin during the period of 2000–2015.
Figure 8. The value of maximum, minimum and mean of the VHIduring 2000–2015.
trend had been detected (R= 0.88). The mean of maximumvalue were 95 and there was no significant fluctuation found.The minimum value of VHI ranged from 11.45 to 22.32 andthe minimum of that was in 2000 (10.45), the maximum ofthat was in 2012 (22.32).
The spatial characteristics of the VHI drought index, thevalue of drought calculated from 2000 to 2015 in the WeiRiver Basin were shown in Fig. 9. According to the spa-tial patterns showed that crops in the WRB were affected bydifferent levels of drought. Overall, there were few extremedrought occurred from 2000–2015. Severe drought occurredin 2000, 2005, 2007, 2008 and 2015, and all occurred in thenorthern part of the WRB, which occurred in the west ofthe WRB in 2000 and 2002. Different degrees of moderatedrought was happened every year and all happened in thenorthern part of the WRB. For light drought, in addition tothe northern regions, there were also some areas in the westhad a light drought.
4.3.2 Impact of drought on agriculture in the Wei RiverBasin
Correlationship between crop yield and the VHI during2000–2015 in the Wei River Basin are shown in Fig. 10. Therelationship between the VHI and crop yield was detected
proc-iahs.net/379/73/2018/ Proc. IAHS, 379, 73–82, 2018
80 S. Cai et al.: Spatiotemporal variability and assessment of drought
Figure 9. Spatial distributions of drought from 2000 to 2015 based on the VHI in the Wei River Basin.
Figure 10. Correlationship between crop yield and the VHI during2000–2015 in the Wei River Basin.
with R value of 0.78. The result showed that the VHI had apromising potential of quantifying the agricultural yield re-duction caused by agricultural drought in the WRB.
4.3.3 Comparison with the meteorological factors
The correlationship between VHI and precipitation and aver-age air temperature are shown in Figs. 11 and 12. The VHIshowed a relationship with the precipitation and the R valueof the linear regression equation reached at R= 0.4 during2000–2015. While the correlation between VHI and aver-
Figure 11. Correlationship between precipitation and the VHI dur-ing 2000–2015 in the Wei River Basin.
age air temperature showed a polynomial correlation with theR= 0.37. In a word, the effect of precipitation on agriculturaldrought was greater than that of air temperature.
5 Conclusion
This study detected the temporal and spatial pattern ofdrought in the Wei Rvier Basin from 1960–2015. The SPIdrought index at different time scales were calculating usingmonthly precipitation and air temperature. The VHI was cal-culating based on monthly NDVI and 8-days LST. A regres-
Proc. IAHS, 379, 73–82, 2018 proc-iahs.net/379/73/2018/
S. Cai et al.: Spatiotemporal variability and assessment of drought 81
Figure 12. Correlationship between air temperature and the VHIduring 2000–2015 in the Wei River Basin.
sion was employed to identify the capability of VHI to eval-uating the drought events. Major conclusions can be summa-rized as follows:
1. The total precipitation had a decreasing trend with0.9261 mm yr−1 and average air temperature had an in-creasing trend with 0.0282◦ yr−1 and the situation wasprone to occur drought events,
2. The percentages of severe drought initially increasedand then decreased with decades in 1970s and 1990swhile those of moderate drought increased with decadesin 1960s and 1990s. Based on drought intensity, acontinuous moderate drought occurred in both 1992–2002 and 2004–2009. The drought rating of moderatedrought was greater than that of severe drought andextreme drought. Meanwhile, the drought rating wasgreater in southern than that in northern. Before 1990s,the degree of drought in southern was heavier than thatin northern, however, the degree of drought was the op-posite.
3. The average had showed an increasing trend withR= 0.88. Based on the VHI, the degree of northern washeavier than that in southern, the degree of western washeavier than in eastern. The heaviest drought was oc-curred in 2000, 2007 and 2008.
4. Compared to crop yield, VHI had a well capability toevaluating agricultural drought in the Wei River Basin.And precipitation had greater effect on agriculturaldrought than temperature
Data availability. Meoteological data were obtained from ChinaMeteorological Data Sharing Services System Network (http://data.cma.cn/; CMDC, 2018). Modis datasets (MODIS 13A3 andMODIS 11A2) were obtained from https://modis.gsfc.nasa.gov/(last access: 30 October 2017). Crop yield datasets were obtainedfrom National Bureau of Statistics of China (http://data.stats.gov.cn,last access: 10 January 2018).
Competing interests. The authors declare that they have no con-flict of interest.
Special issue statement. This article is part of the special issue“Innovative water resources management – understanding and bal-ancing interactions between humankind and nature”. It is a result ofthe 8th International Water Resources Management Conference ofICWRS, Beijing, China, 13–15 June 2018
Acknowledgements. This study is jointly supported by theNational Key Research and Development Program of China (GrantNo. 2017YFC1502703), the National Natural Science Foundationof China (Grant No. 91647202), and the Major Science andTechnology Program for Water Pollution Control and Treatment(Grant No. 2017ZX07302-04).
Edited by: Andreas SchumannReviewed by: two anonymous referees
References
Abramowitz, M. and Stegun, A. I.: Handbook of mathematical func-tions with formulas, graphs, and mathematical tables, CourierDover Publications, New York, USA, 1964.
Alam, M. M., Siwar, C., Toriman, M. E., and Molla, R. I.: Climatechange induced adaptation by paddy farmers in Malaysia, Mitig.Adapt. Strat. Gl., 17, 173–186, 2012.
Chen, H. and Sun, J.: Changes in Drought Characteristics overChina Using the Standardized Precipitation EvapotranspirationIndex, J. Climate, 28, 5430–5447, https://doi.org/10.1175/JCLI-D-14-00707.1, 2015.
CMDC (China Meteorological Data Service Center): Dataset ofdaily climate data from China Ground Climate Data MonthlyDataset, available at: http://data.cma.cn/, last access: 1 May2018.
Cong, D., Zhao, S., Chen, C., and Duan, Z.: Characterizationof droughts during 2001-2014 based on remote sensing: Acase study of Northeast China, Ecol. Inform., 39, 56–67,https://doi.org/10.1016/j.ecoinf.2017.03.005, 2017.
Dai, A.: Drought under global warming: a review, Wires Clim.Change, 2, 45–65, https://doi.org/10.1002/wcc.81, 2011.
Food and Agriculture Organization of the United Nations: FAO-STAT, The Statistics Division of FAO, Rome, Italy, 2014.
Karavitis, C. A., Alexandris, S., Tsesmelis, D. E., andAthanasopoulos, G.: Application of the Standardized Pre-cipitation Index (SPI) in Greece, WATER, 3, 87–805,https://doi.org/10.3390/w3030787, 2011.
Kogan, F. N.: Droughts of the late 1980s in the United States as de-rived from NOAA polar-orbiting satellite data, B. Am. Meteorol.Soc., 76, 655–668, 1995.
Lei, T., Wu, J., Li, X., Geng, G., Shao, C., Zhou, K., Wang, Q., andLiu, L.: A new framework for evaluating the impacts of droughton net primary productivity of grassland, Sci. Total Environ.,536, 161–172, https://doi.org/10.1016/j.scitotenv.2015.06.138,2015.
proc-iahs.net/379/73/2018/ Proc. IAHS, 379, 73–82, 2018
82 S. Cai et al.: Spatiotemporal variability and assessment of drought
Lei, Y., Zhang, H., Chen, F., and Zhang, L.: How rural land use man-agement facilitates drought risk adaptation in a changing climate– A case study in arid northern China, Sci. Total Environ., 550,192–199, https://doi.org/10.1016/j.scitotenv.2016.01.098, 2016.
Liu, Z., Zhou, P., Zhang, F., Liu, X., and Chen, G.: Spatiotempo-ral characteristics of dryness/wetness conditions across Qing-hai Province, Northwest China, Agr. Forest Meteorol., 182–183, 101–108, https://doi.org/10.1016/j.agrformet.2013.05.013,2013.
Long, D., Shen, Y., Sun, A., Hong, Y., Longuevergne, L.,Yang, Y., Li, B., and Chen, L.: Drought and flood monitor-ing for a large karst plateau in Southwest China using ex-tended GRACE data, Remote Sens. Environ., 155, 145–160,https://doi.org/10.1016/j.rse.2014.08.006, 2014.
Martinez-Fernandez, J., Gonzalez-Zamora, A., Sanchez, N., Gu-muzzio, A., and Herrero-Jimenez, C. M.: Satellite soil moisturefor agricultural drought monitoring: Assessment of the SMOSderived Soil Water Deficit Index, Remote Sens. Environ., 177,277–286, https://doi.org/10.1016/j.rse.2016.02.064, 2016.
McKee, T. B., Doedken, N. J., and Kleist, J.: The relationship ofdrought frequency and duration to time scales, Proceeding of the8th Conference on Applied Climatology, Anaheim, Calif., USA,17–22 January 1993, Am. Meteorol. Soc., 17, 179–182, 1993.
Mishra, A. K. and Singh, V. P.: A review of drought concepts, J.Hydrol., 391, 202–216, 2010.
Moreira, E. E., Martins, D. S., and Pereira, L. S.: Assessing droughtcycles in SPI time series using a Fourier analysis, Nat. HazardsEarth Syst. Sci., 15, 571–585, https://doi.org/10.5194/nhess-15-571-2015, 2015.
Oloruntade, A. J., Mohammad, T. A., Ghazali, A. H., and Wayayok,A.: Analysis of meteorological and hydrological droughts in theNiger-South Basin, Nigeria, Glob. Planet. Change, 155, 225–233, https://doi.org/10.1016/j.gloplacha.2017.05.002, 2017.
Palmer, W. C.: Meteorological drought, US Department of Com-merce, Weather Bureau, Washington, DC, USA, 1965.
Rayne, S. and Forest, K.: Evidence for increasingly vari-able Palmer Drought Severity Index in the UnitedStates since 1895, Sci. Total Environ., 544, 792–796,https://doi.org/10.1016/j.scitotenv.2015.11.167, 2016.
Rhee, J., Im, J., and Carbone, G. J.: Monitoring agricultural droughtfor arid and humid regions using multi-sensor remote sensingdata, Remote Sens. Environ., 114, 2875–2887, 2010.
Solomon, S.: The Physical Science Basis. Working Group I Con-tribution to the Fourth Assessment Report of the IPCC[J], editedby: Chang, I. C., 17 November 2007, Comp. Geom., 18, 95–123,2007.
Steinemann, A.: Drought indicators and triggers: A stochastic ap-proach to evaluation, J. Am. Water Resour. As., 39, 1217–1233,https://doi.org/10.1111/j.1752-1688.2003.tb03704.x, 2003.
Thom, H. C. S.: Some methods of climatological analysis, WorldMeteorological Organization (WMO), Technical Note no. 82,Geneva, Switzerland, 20–22, 1966.
Unganai, L. S. and Kogan, F. N.: Drought monitoring and cornyield estimation in Southern Africa from AVHRR data, RemoteSens. Environ., 63, 219–232, https://doi.org/10.1016/S0034-4257(97)00132-6, 1998.
Vicente-Serrano, S. M., Begueria, S., and Lopez-Moreno J. I.: AMulti-scalar Drought Index Sensitive to Global Warming: TheStandardized Precipitation Evapotranspiration Index, J. Climate,23, 1696–1718, https://doi.org/10.1175/2009JCLI2909.1, 2010.
Wilhite, D. A. and Glantz, M. H.: Understanding: the DroughtPhenomenon: The Role of Definitions, Water Int., 10, 111–120,https://doi.org/10.1080/02508068508686328, 1985.
Yang, B., Ma, S., Li, J., Liao, Y., Zhao, B., and Claudia, K.: Agricul-ture drought monitoring in Dongting lake basin by MODIS data,1st International Conference on Agro-Geoinformatics, 2–4 Au-gust 2012, Shanghai, China, 2012.
Yu, M., Li, Q., Hayes, M. J., Svoboda, M. D., and Heim,R. R.: Are droughts becoming more frequent or severe inChina based on the Standardized Precipitation Evapotranspi-ration Index: 1951–2010?, Int. J. Climatol., 34, 545–558,https://doi.org/10.1002/joc.3701, 2014.
Zarch, M. A. A., Sivakumar, B., and Sharma, A.: Droughtsin a warming climate: A global assessment of Stan-dardized precipitation index (SPI) and Reconnais-sance drought index (RDI), J. Hydrol., 526, 183–195,https://doi.org/10.1016/j.jhydrol.2014.09.071, 2015.
Zhai, L. and Feng, Q.: Spatial and temporal pattern of precipitationand drought in Gansu Province, Northwest China, Nat. Hazards,49, 1–24, https://doi.org/10.1007/s11069-008-9274-y, 2009.
Zhang, A. and Jia, G.: Monitoring meteorological drought in semi-arid regions using multi-sensor microwave remote sensing data,Remote Sens. Environ., 134, 12–23, 2013.
Zhang, L., Jiao, W., Zhang, H., Huang, C., and Tong, Q.: Studyingdrought phenomena in the Continental United States in 2011 and2012 using various drought indices, Remote Sens. Environ., 190,96–106, https://doi.org/10.1016/j.rse.2016.12.010, 2017.
Zuo, D., Cai, S., Xu, Z., Yang, X., and Li, F.: Spatiotempo-ral patterns of drought at various time scales in ShandongProvince of Eastern China, Theor. Appl. Climatol., 2016, 1–14,https://doi.org/10.1007/s00704-016-1969-5, 2016.
Zou, L., Xia, J., and She, D.: Drought Characteristic Analysis Basedon an Improved PDSI in the Wei River Basin of China, WATER,9, 1783, https://doi.org/10.3390/w9030178, 2017.
Proc. IAHS, 379, 73–82, 2018 proc-iahs.net/379/73/2018/