Specific absorption spectra of hemoglobin at different PO 2 levels: potential noninvasive method to detect PO 2 in tissues Peipei Liu Zhirong Zhu Changchun Zeng Guang Nie Downloaded From: http://biomedicaloptics.spiedigitallibrary.org/ on 09/05/2013 Terms of Use: http://spiedl.org/terms
Transcript
Specific absorption spectra ofhemoglobin at different PO2 levels:potential noninvasive method to detectPO2 in tissues
Peipei LiuZhirong ZhuChangchun ZengGuang Nie
Downloaded From: http://biomedicaloptics.spiedigitallibrary.org/ on 09/05/2013 Terms of Use: http://spiedl.org/terms
Specific absorption spectra of hemoglobin at differentPO2 levels: potential noninvasive method to detect PO2in tissues
Peipei Liu,a Zhirong Zhu,a Changchun Zeng,a,b and Guang NiebaSouth China Normal University, College of Biophotonics, MOE Key Laboratory of Laser Life Science & Laboratory of Photonic Chinese Medicine,Guangzhou 510631, Guangdong, ChinabShenzhen Third People’s Hospital, Department of Internal Medicine, Shenzhen 518000, Guangdong, China
Paper 12389 received Jun. 22, 2012; revised manuscript received Oct. 7, 2012; accepted for publication Oct. 29, 2012; published onlineDec. 3, 2012.
1 IntroductionHemoglobin (Hb) is an important biomolecule that transportsO2
and CO2 in vertebrates. Human Hb (HbA), which has an α2 − β2tetramer structure and exhibits positive cooperativity in oxygenbinding, has been extensively investigated using various meth-ods.1 X-ray crystallographic studies have demonstrated the pre-sence of two quaternary structures of Hb, namely, the T (tense)and R (relaxed) states, which correspond to low- and high-affinity states, respectively,2,3 and whose typical structures areknown as deoxy-Hb and oxy-Hb. As the main conformationof deoxy-Hb, the T state has a lower affinity with oxygen com-pared with the R state. The oxygen binding of Hb is cooperative—in terms of a reversible transition between the two quaternarystructures, the switching of which takes place at a certain num-ber of bound ligands.4–6 Hb is a type of allosteric protein that canregulate its biological activity through interactions between sub-units, making binding easier when oxygen molecules havealready combined.7–14 The positive cooperativity in oxygenbinding makes it possible to transport oxygen effectively in vivo.
The state of Hb is determined by oxygen partial pressure(PO2: the tension force that is caused by the dissolved oxygen)levels. The fractional saturation of the hemoglobin (Y) isapproximately 0.97 in the pulmonary alveoli, whose PO2 is100 mm Hg, while the Y is approximately 0.25 in the capillaries
of working muscles, whose PO2 is 20 mm Hg.15 The combina-tion of the first oxygen molecule with a subunit triggers a struc-tural change in the globin, which makes it easier to select thenext oxygen molecule. When blood flows to organs with lowlevels of PO2, Hbs with high levels of oxygen saturation (thevolume ratio between the oxy-hemoglobin and the effectivehemoglobin, which is mainly decided by the oxygen partialpressure) begin to release oxygen molecules. The release ofthe first oxygen molecule alters the structure of the tetramers,thereby easily setting the other oxygen molecules free,16 whichresults in an increase in the concentration of deoxy-Hb.
The clinical manifestation of the tissue hypoxia (whichmainly refers to the hypotonic hypoxia and circulatory hypoxia)is an increase in deoxy-Hb concentration and induces a series ofphysiological and pathological phenomena, in which cyanosis isone of the most common forms. When the deoxy-Hb concen-tration of the human blood capillary is more than 50 g∕L, abluish discoloration of the skin and mucous membranes mayappear because of the inadequate oxygenation of the blood,17
which could be observed in areas that have thinner skin, lesspigmentation, and sufficient blood capillaries, such as the lips,apex nasi, genal region, auricle, and tips of the fingers or toes.Cyanosis is dependent on an absolute amount of reduced Hbpresent in the capillary bed.
Factors that can lead to the low binding rate of oxygen mole-cules to Hb in the blood may cause cyanosis. Apart from these,many other accompanying symptoms could also be monitored.Among these are expiratory dyspnea, which occurs
predominantly in cardiopulmonary diseases; acropachy, whichis always seen in congenital heart diseases of the cyanotictypes; and disturbance of consciousness, which always occursin drug or chemical poisoning, shock, respiratory failure, andsevere cardiac dysfunction.18,19
Venous blood and arterial blood differ essentially in theirPO2 levels, with the PO2 values being approximately 37 to40 mm Hg and 80 to 110 mm Hg, respectively. The Hb oxygensaturation levels of venous blood and arterial blood correspondto approximately 64% and 96%, respectively.20 Normally,because arterial blood is bright red and venous blood is darkred, differences between them can be identified by a variationin color that is observable by the naked eye.
The methods used to detect the level of oxygen supply in theclinical treatment could fall into two major categories: the elec-trochemistry method and the optical method. Although they usedifferent principles, the measuring results of the two methodsrepresent the oxygen saturation of the arterial blood. The mea-surement procedure of the electrochemical method is arterialblood sampling by artery puncturing or intubation and then elec-trochemical analysis with the blood gas analyzer. Though themeasuring results are relatively accurate, the patient must be suf-fering and can’t realize the continuous monitoring. Comparedwith the electrochemistry method, the optical method is muchmore widely used for its continuous nondestructive measuringfeatures, and finger cot oxygen saturation is one of the mosttypical examples. The measuring principle of it is based onthe fact that the light absorption amount of the arterial bloodchanges along with the arteriopalmus. It regards the light of660 and 940 nm as the incident light and calculates theblood oxygen saturation by measuring the light transmissionintensity of the organization. In addition to these, there aremany other near-infrared tissue oximeters being researched,such as spatially resolved spectroscopy and time-resolved spec-troscopy. Because of the strong tissue-penetrating ability ofnear-infrared spectroscopy, these methods are always used inthe deep tissue, such as the detection of the oxygen supply levelsof the brain and muscles.21–25 The current techniques for PO2
measurement include the oxygen electrode method (such asthe oxygen surface electrode and the polarographic needle oxy-gen electrode) and the fiber optic oxygen sensor. The oxygenelectrode method has been widely used in the industry and agri-culture, and it could realize the PO2 detection of multi-layer tis-sues in scientific experiments by changing the penetrationdepth,26 but it has not been used in clinical PO2 detection,because the results are obtained by inserting the electrodeinto the tissue. The fiber optic oxygen sensor could detectthe PO2 by using the fluorescence of the ruthenium complex,because the degree of the fluorescence quenching is associatedwith the oxygen concentration or the PO2 level in the film. Thismethod could detect the dissolved oxygen and the PO2 of theatmosphere, but it has not been used in clinical tissue PO2 detec-tion, because of its high traumatic feature.
In summary, variations in PO2 in organs will ultimately bereflected by specific color changes, even though they are some-times not observable by the naked eye. Based on this, the rela-tionship between specific spectral changes in tissue and therelated PO2 levels warrants detection, which makes it possibleto estimate the PO2 simply by measuring spectroscopic altera-tions in the tissue. This study would provide a strong foundationfor further investigation of the proposed method for painless andharmless early detection of oxygen deficiency diseases.
2 Materials and Methods
2.1 Separation and Purification of Hb
Blood was extracted from volunteers with HbA1 via anticoagu-lant treatment with Liquaemin Sodium (Xin Rui BiologicalTechnology Company, Shanghai, China). Samples were centri-fuged at 1,500 rpm and 4°C for 10 min to remove upper whiteblood cells and soterocyte, and then washed with 0.145 mol∕Lnormal saline at the rate of 1∶1 three times. Hb was obtained bymixing with tetrachloride and double distilled water at the pro-portion of 1∶0.4∶1 and centrifugation at 3,000 rpm for 10 minafter 30 min of shaking. The upper liquid was specificallysampled. The hemoglobin was extracted to reduce the interfer-ence from the scattering effects of the red cell suspension duringthe experiment. The concentration of the Hb solution was mea-sured using the HiCN method.
2.2 Control of PO2
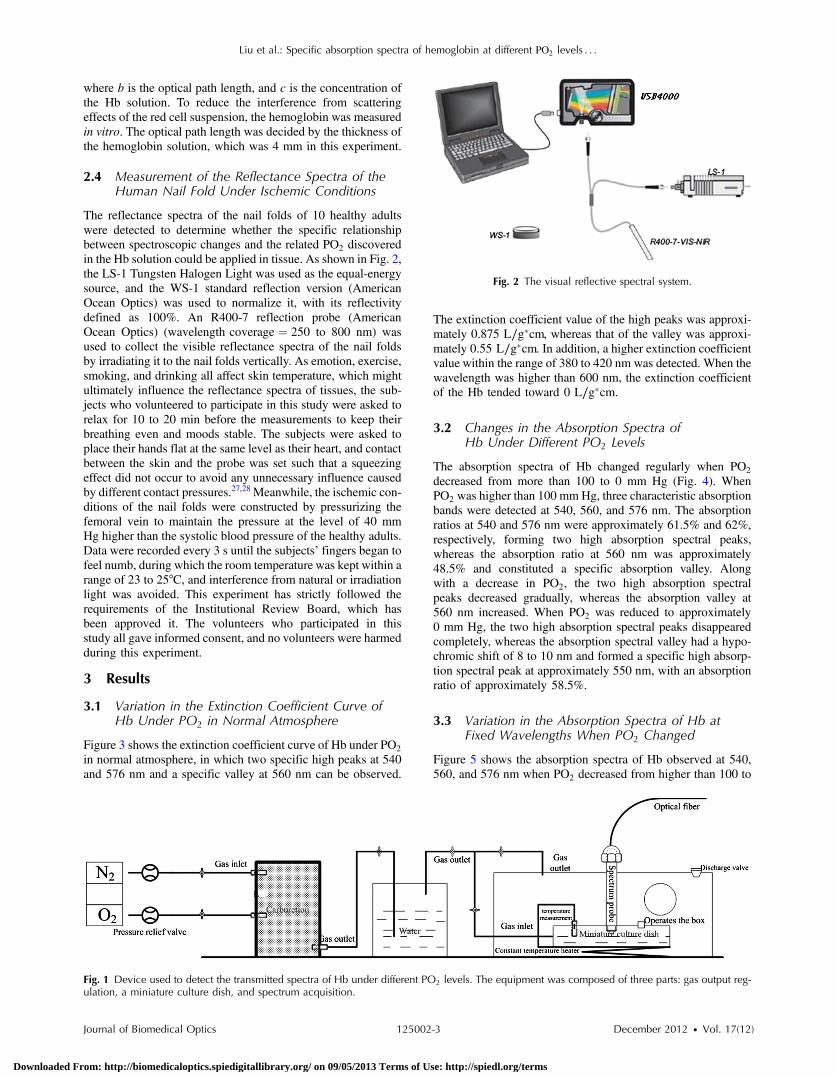
PO2 was controlled by stabilizing the fluid flow of N2 in500 ml∕min and regulating the flow of O2 after the internalair of the whole container was replaced with N2 as shown inFig. 1. The PO2 value of the Hb solution was measured with anOxi3310 dissolved oxygen meter (WTW Company, Germany)(measurement range ¼ 0 − 199.9 mbar). The data could beread automatically, which made it easier to read the PO2
value when the O2 flow changed.
2.3 Measurement of the Absorption Spectra andExtinction Coefficients
The transmitted spectra of Hb under different PO2 levels weremeasured by setting the transmissivity of PBS (0.01 mol∕L) at100%, and Hb samples were prepared by diluting the extractedHb with 0.01 mol∕L PBS (pH 7.4) at the rate of 1∶199. The pri-mary equipment used to detect the transmitted spectra of Hb wasa USB4000 UV/VIS fiber optic spectrometer and a T300-RT-UV-VIS transmission dip probe (American Ocean Optics). LS-1Tungsten Halogen Light Source (American Ocean Optics)(wavelength 360 to 2,000 nm) was used as the excitation lightsource, and it was switched on approximately 1 min beforethe detection step to guarantee the stability of the spectra. Theplatform and accessories were connected by optic fiber. The para-meters for the detection step were set as follows: integration time(the time required for the optic spectrometer to complete a fullscanning), 3.7 ms; average times, 10; and flatness, 5. The gastightness of the equipment was checked before the experiment,and the natural light was shielded.
When the solution is irradiated by a cluster of monochromeincident light with known strength, some light is absorbed,whereas other light goes through the solution. The relationshipbetween the absorption ratio (A) and transmissivity (T) can bedescribed as
A ¼ − lgT.
Extinction coefficients represent the degree of attenuation ofelectromagnetic waves that is equal to the relative attenuationvalue caused by absorption and scattering when the electromag-netic waves spread in the medium for unit distance. The extinc-tion coefficient (ε) of Hb solution can be expressed as
ε ¼ A∕ðbcÞ;
Journal of Biomedical Optics 125002-2 December 2012 • Vol. 17(12)
Liu et al.: Specific absorption spectra of hemoglobin at different PO2 levels . . .
Downloaded From: http://biomedicaloptics.spiedigitallibrary.org/ on 09/05/2013 Terms of Use: http://spiedl.org/terms
where b is the optical path length, and c is the concentration ofthe Hb solution. To reduce the interference from scatteringeffects of the red cell suspension, the hemoglobin was measuredin vitro. The optical path length was decided by the thickness ofthe hemoglobin solution, which was 4 mm in this experiment.
2.4 Measurement of the Reflectance Spectra of theHuman Nail Fold Under Ischemic Conditions
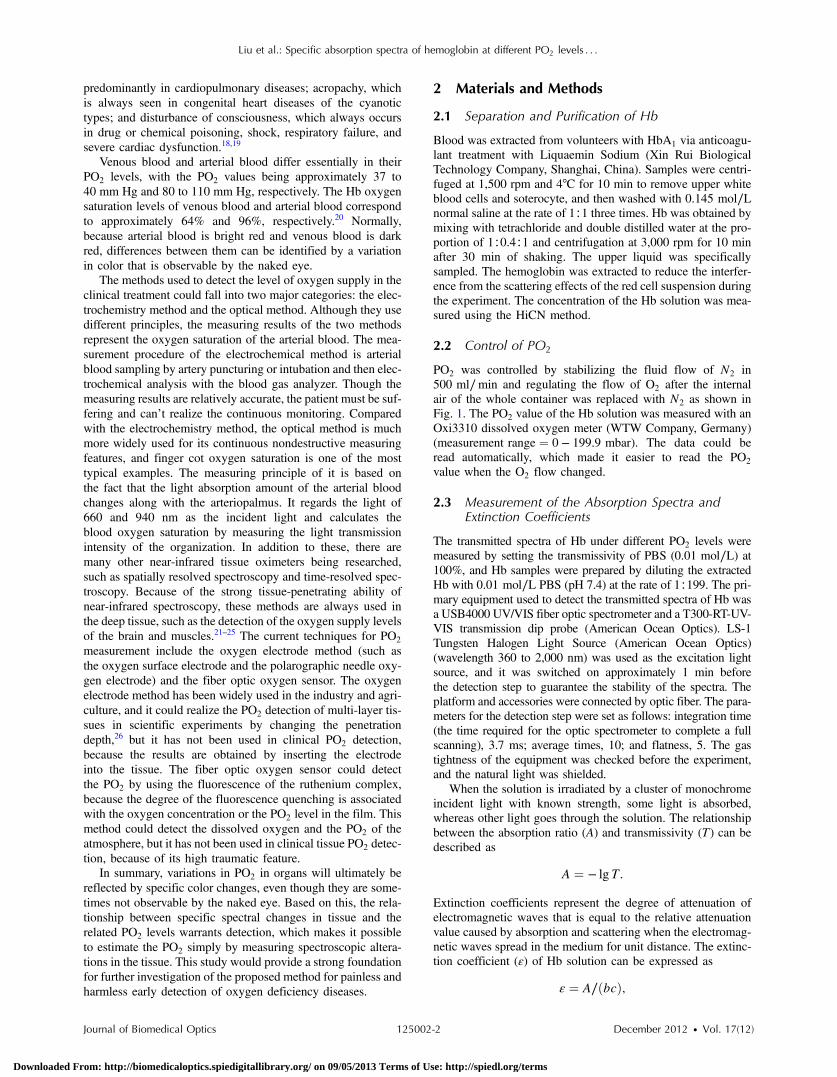
The reflectance spectra of the nail folds of 10 healthy adultswere detected to determine whether the specific relationshipbetween spectroscopic changes and the related PO2 discoveredin the Hb solution could be applied in tissue. As shown in Fig. 2,the LS-1 Tungsten Halogen Light was used as the equal-energysource, and the WS-1 standard reflection version (AmericanOcean Optics) was used to normalize it, with its reflectivitydefined as 100%. An R400-7 reflection probe (AmericanOcean Optics) (wavelength coverage ¼ 250 to 800 nm) wasused to collect the visible reflectance spectra of the nail foldsby irradiating it to the nail folds vertically. As emotion, exercise,smoking, and drinking all affect skin temperature, which mightultimately influence the reflectance spectra of tissues, the sub-jects who volunteered to participate in this study were asked torelax for 10 to 20 min before the measurements to keep theirbreathing even and moods stable. The subjects were asked toplace their hands flat at the same level as their heart, and contactbetween the skin and the probe was set such that a squeezingeffect did not occur to avoid any unnecessary influence causedby different contact pressures.27,28 Meanwhile, the ischemic con-ditions of the nail folds were constructed by pressurizing thefemoral vein to maintain the pressure at the level of 40 mmHg higher than the systolic blood pressure of the healthy adults.Data were recorded every 3 s until the subjects’ fingers began tofeel numb, during which the room temperature was kept within arange of 23 to 25°C, and interference from natural or irradiationlight was avoided. This experiment has strictly followed therequirements of the Institutional Review Board, which hasbeen approved it. The volunteers who participated in thisstudy all gave informed consent, and no volunteers were harmedduring this experiment.
3 Results
3.1 Variation in the Extinction Coefficient Curve ofHb Under PO2 in Normal Atmosphere
Figure 3 shows the extinction coefficient curve of Hb under PO2
in normal atmosphere, in which two specific high peaks at 540and 576 nm and a specific valley at 560 nm can be observed.
The extinction coefficient value of the high peaks was approxi-mately 0.875 L∕g�cm, whereas that of the valley was approxi-mately 0.55 L∕g�cm. In addition, a higher extinction coefficientvalue within the range of 380 to 420 nm was detected. When thewavelength was higher than 600 nm, the extinction coefficientof the Hb tended toward 0 L∕g�cm.
3.2 Changes in the Absorption Spectra ofHb Under Different PO2 Levels
The absorption spectra of Hb changed regularly when PO2
decreased from more than 100 to 0 mm Hg (Fig. 4). WhenPO2 was higher than 100 mm Hg, three characteristic absorptionbands were detected at 540, 560, and 576 nm. The absorptionratios at 540 and 576 nm were approximately 61.5% and 62%,respectively, forming two high absorption spectral peaks,whereas the absorption ratio at 560 nm was approximately48.5% and constituted a specific absorption valley. Alongwith a decrease in PO2, the two high absorption spectralpeaks decreased gradually, whereas the absorption valley at560 nm increased. When PO2 was reduced to approximately0 mm Hg, the two high absorption spectral peaks disappearedcompletely, whereas the absorption spectral valley had a hypo-chromic shift of 8 to 10 nm and formed a specific high absorp-tion spectral peak at approximately 550 nm, with an absorptionratio of approximately 58.5%.
3.3 Variation in the Absorption Spectra of Hb atFixed Wavelengths When PO2 Changed
Figure 5 shows the absorption spectra of Hb observed at 540,560, and 576 nm when PO2 decreased from higher than 100 to
Fig. 1 Device used to detect the transmitted spectra of Hb under different PO2 levels. The equipment was composed of three parts: gas output reg-ulation, a miniature culture dish, and spectrum acquisition.
Fig. 2 The visual reflective spectral system.
Journal of Biomedical Optics 125002-3 December 2012 • Vol. 17(12)
Liu et al.: Specific absorption spectra of hemoglobin at different PO2 levels . . .
Downloaded From: http://biomedicaloptics.spiedigitallibrary.org/ on 09/05/2013 Terms of Use: http://spiedl.org/terms
0 mm Hg. The maximum absorption ratios at 540 and 576 nmwere approximately 61% and 61.9%, respectively, whereas theminimum value at 560 nm was approximately 48%. The varia-tion in the absorption spectrum of Hb at 560 nm was much smal-ler when PO2 was within the range of 60 to more than 100 mmHg, whereas the absorption spectra at 540 and 576 nm decreasedslowly when PO2 decreased from higher than 100 to 55 mm Hg.With a further decrease in PO2, the absorption spectra at 540 and576 nm began to descend, whereas that at 560 nm began toascend. When PO2 was reduced to approximately 0 mm Hg,the minimum values of the absorption ratios at 540 and576 nm appeared, which were approximately 54% and 52%,respectively, whereas the absorption ratio at 560 nm achievedits maximum value of approximately 57.5%. In the processof PO2 decreasing from higher than 100 to 0 mm Hg, the varia-tion range of the absorption spectrum at 576 nm was much lar-ger than that of the absorption spectra at 540 and 560 nm,indicating that the absorption spectrum at 576 nm was muchmore sensitive to alterations in PO2. The curve-fitting resultsbetween the absorption ratios of hemoglobin at 540, 560, and576 nm and their related PO2 levels are shown in Fig. 6. Thecoefficients of determination (R2 ) of the three were 0.9952,
0.9949, and 0.9928, respectively, indicating that the curvehad a good fit to the data, which could testify to the feasibilityof PO2 detection by measuring its absorption spectra.
3.4 Variation in the Reflectance Spectra of theNail Fold Under Ischemic Conditions
Specific changes in the reflectance spectra of the microcircula-tion under ischemic conditions were observed by detecting thereflectance spectra of the nail fold. Because all subjects demon-strated the same characteristics of spectra during ischemia andonly�2.5% deviation in the reflection spectra, the spectra curve(Fig. 7) was plotted with the median of the 10 sets. Two specificreflectance valleys at 540 and 576 nm and a high reflectancespectral peak at 560 nm were detected. With an increase inthe ischemia time, the PO2 of the nail fold began to decrease,and the reflectance spectra at 540, 560, and 576 nm completelyincreased, during which the rising degrees at 540 and 576 nmwere much larger than that at 560 nm. At approximately 100 s,the specific reflectance valleys at 540 and 576 nm disappearedcompletely, whereas the high reflectance spectral peak at560 nm had a hypochromic shift of 8 to 10 nm, which resultedin the appearance of a reflectance spectral valley at approxi-mately 550 nm.
The �2.5% deviation in the reflection spectra and the �10 sdeviation in the tolerant times can be attributed to the differentcharacteristics of the subjects.
4 DiscussionResearch on non-invasive continuous monitoring methods forvascular oxygen supply dates to before World War II and hasdeveloped rapidly because of the demands of military aviation.Whatever the cause of diseases, the death of patients is ulti-mately caused by the lack of oxygen transported to the brainand heart. Thus, continuous monitoring of tissue oxygen supplyis a terrifying race against time, which is also why oxygen sup-ply should be measured during clinical treatments. In recentyears, with the development of clinical care, the importanceof tissue oxygen supply monitoring has been increasingly recog-nized, and finger cot oxygen saturation testing is one of the most
Fig. 3 Extinction coefficient curve of Hb under PO2 in normalatmosphere.
Fig. 4 Changes in the absorption spectra of Hb when the PO2 decreasesfrom higher than 100 mm Hg to approximately 0 mm Hg.
Fig. 5 Variation in the absorption spectra of Hb at fixed wavelengths(540, 560, and 576 nm) when PO2 decreases from higher than100 mm Hg to approximately 0 mm Hg.
Journal of Biomedical Optics 125002-4 December 2012 • Vol. 17(12)
Liu et al.: Specific absorption spectra of hemoglobin at different PO2 levels . . .
Downloaded From: http://biomedicaloptics.spiedigitallibrary.org/ on 09/05/2013 Terms of Use: http://spiedl.org/terms
widely used methods for continuous monitoring of tissue oxy-gen supply in clinical applications.
As we have expected, a specific relationship between thecolor appearance and PO2 of the Hb solution in vitro exists.The absorption spectra of Hb under different PO2 levels showeda specific variation tendency of absorption spectra of Hb whenPO2 decreased from higher than 100 to 0 mm Hg, in which the
absorption ratio of Hb at given wavelengths changed regularlyas the PO2 changed. At particular wavelengths, such as 540 or576 nm, when PO2 decreased from higher than 100 to 0 mm Hg,exactly one spectral absorption coefficient value correspondedwith the PO2 of Hb (Figs. 4 and 5), which made it possible todetect the PO2 of Hb by simply measuring its absorption ratio atgiven wavelengths. When tissue was irradiated by equal-energylight, some light went through or was absorbed by the object,whereas the rest was scatter-reflected by it. As some tissues arenon-transparent bodies and the light intensity that goes throughtissues is too weak to be taken into account, the variation ten-dency of the reflectance spectra is opposite that of the absorptionspectra of the tissues. Therefore, the validation experiment per-formed by measuring the reflectance spectra of the nail foldsconfirmed the feasibility of this corollary on the other side:With an increase in the ischemia time (corresponding to adecrease in tissue PO2), the reflectance ratios at 540 and576 nm for the microcirculation system increased regularly(Fig. 7) and corresponded to the reductions in the absorptionratio of Hb (Figs. 4 and 5).
The absorption spectra of Hb under different PO2 levelsshowed that the absorption spectral valley at approximately560 nm had a hypochromic shift of 8 to 10 nm when PO2
decreased from higher than 100 to 0 mm Hg, which accountsfor the colorimetric difference between arterial blood andvenous blood.
The dominating research objects of the specific extinctioncoefficient peaks were the two within the range of 492 to577 nm, in spite of the existence of a more apparent peak within380 to 420 nm. This can be primarily explained by the fact thatthe weighting coefficient of the range of 492 to 577 nm washundreds of times larger than that of the other range, althoughthe extinction coefficient values of the former range wereapproximately one-third as large as that of the latter range, asshown in the weighting tables of CIE tristimulus values.When the light source is standard illuminant D65, the weightingefficiencies of X10 and Y10 at 400 nm are 0.136 and 0.014,respectively, whereas the corresponding values at 560 nm are6.069 and 8.583,29 indicating that the range of 492-577-nm(green wave) light significantly contributes to the color of theblood compared with the 380-420-nm (violet) light based onthe colorimetric theories.
Fig. 6 The curve-fitting results between the absorption ratios of thehemoglobin and their related PO2 levels. (a), (b), (c) indicate thecurve-fitting results between the absorption ratios of hemoglobin at540, 560, and 576 nm and their related PO2 levels.
Fig. 7 Variation in the reflectance spectra of the nail fold underischemic conditions, in which the decrease of the PO2 is representedby the increasing of the pressurization time.
Journal of Biomedical Optics 125002-5 December 2012 • Vol. 17(12)
Liu et al.: Specific absorption spectra of hemoglobin at different PO2 levels . . .
Downloaded From: http://biomedicaloptics.spiedigitallibrary.org/ on 09/05/2013 Terms of Use: http://spiedl.org/terms
In addition, the new detection method could be used toexplain some physiological and pathological phenomena,with the appearance of cyanosis given as an example. The nor-mal concentrations of Hb are 110 to 150 g∕L in adult femalesand 120 to 160 g∕L in adult males. Cyanopathy appears whenthe concentration of deoxy-Hb in the human capillary is inexcess of 50 g∕L and PO2 is approximately 40 mm Hg by esti-mating the oxygen dissociation curve of Hb. The absorptionratios of Hb at 540, 560, and 576 nm change greatly whenPO2 is lower than 40 mm Hg, indicating alterations in quatern-ary structure, which makes it easier for the oxygen molecules todissociate from the Hb subunits. The specific relationshipbetween the absorption spectra and the PO2 of Hb (Fig. 5) sug-gests that patients might have cyanopathy when the absorptionratio of Hb at 576 nm is lower than approximately 61%.
Recently, the finger cot oxygen saturation technique has beenincreasingly used in clinical tissue oxygen supply monitoring,the principle of which is fixing the probe on the finger verticallyand regarding the finger as a medium for transparent storage ofHb, using 660 and 940 nm near-infrared as incident light sourcesto measure the light transmission of the organ. Although itmakes it easier to realize clinical tissue oxygen supply monitor-ing, the finger cot oxygen saturation technique has imperfec-tions. As blood oxygen saturation is obtained using theunshrinking artery as the background and the shrinking arteryas the foreground, the measurement results of this methodare nothing but the Hb oxygen saturation of the small arterieswhen the vessel constricts. The results of the clinical measure-ment can show that the finger cot oxygen saturation techniquecan only detect oxygen saturation of the arterial blood.30 Thishas fatal flaws, such as relative result lags that make it difficultto evaluate and reflect organ blood oxygen saturation in time.The principle of the new PO2 detection method described inthis study significantly differs from the finger cot oxygen satura-tion technique, for the changes in tissue PO2 during the constric-tion and dilation of blood vessels could actually be reflectedthrough the alterations in the specific absorption spectra ofHb in the capillary bed, which could be realized by detectingthe reflectance spectra of tissue at the Hb-specific absorptionwavelengths.
Because of the strong penetrability of the near infrared light,the near infrared tissue oximeters (including spatially-resolvedspectroscopy and time-resolved spectroscopy) are always usedto detect the oxygen supply level of the deep tissue (such asbrain and muscles) and could not be used in the detection ofthe shallow blood vessels. Both the oxygen electrode methodand the fiber optic oxygen sensor could detect the dissolved oxy-gen and the PO2 of the atmosphere, and the oxygen electrodemethod could even realize the tissue PO2 detection in scientificexperiments, but neither has been used in clinical PO2 detection,because of their high traumatic feature. For the selection of thetarget wavelength (500 to 600 nm), which could arrive at thecapillary layer of the dermis, the new detection method hasits advantage in the PO2 detection of the capillary bed in theshallow organizations, such as lips and nail folds, the detectionof which has certain clinical values in the diagnosis of hypoxiacaused by cardiovascular diseases.
The level of oxygen supply could be determined by detect-ing the PO2 of a particular point in tissue. This would be usedto evaluate cardiovascular disease and other oxygen deficiencydiseases indirectly. In addition, the scope of applicability of thenew method is considerably wider than that of the cot oxygen
saturation technique, because it could be used in such tissues aslips, tongue tip, and apex nasi, among others, not only in thefinger.
5 ConclusionWe have plotted the absorption spectra of Hb when the PO2
decreases, and we have analyzed the specific absorption spectraof the Hb at a given wavelength. The specific relationshipbetween the absorption ratio of Hb at a given wavelengthand its related PO2 has been found, which has established afoundation for a new method to detect tissue PO2 during theconstriction and dilation of blood vessels by detecting the reflec-tance spectra of tissue. This method has no relative result lagswhen compared with the finger cot oxygen saturation. Due tothe conditional restrictions of the experiment, more accurateabsorption ratios when disease occurs could not be obtainedtemporarily. Further research should be carried out, includingspecific spectral measurements of lip cyanosis for patientswith cardiopulmonary insufficiency.
AcknowledgmentsThis work was supported in part by the National Natural ScienceFoundation of China (Grant No. 30873238) and the KeyScience and Technology Project of Guangdong Provinceof China (Grant No. 2007B031401010 and GrantNo. 2011B031700056).
References1. J. Monod, J. Wyman, and J. P. Changeux, “On the nature of allosteric
transition: a plausible model,” J. Mol. Biol. 12, 88–118 (1965).2. M. F. Perutz, “Stereochemistry of cooperative effects in haemoglobin:
Haem–Haem interaction and the problem of allostery,” Nature 228(5273), 726–734 (1970).
3. M. F. Perutz, “Regulation of oxygen affinity of hemoglobin: influenceof structure of the globin on the heme iron,” Annu. Rev. Biochem. 48,327–386 (1979).
4. M. F. Perutz et al., “Stereochemistry of cooperative mechanisms inhemoglobin,” Cold Spring Harb Symp. Quant. Biol. 52, 555–565(1987).
5. M. F. Perutz, “Mechanisms regulating the reactions of human hemoglo-bin with oxygen and carbon monoxide,” Annu. Rev. Physiol. 52, 1–25(1990).
6. R. G. Shulman, J. J. Hopfield, and S. Ogawa, “Allosteric interpretationof haemoglobin properties,” Q. Rev. Biophys. 8(3), 325–420 (1975).
7. K. Kanaori et al., “T-quaternary structure of oxy human adult hemoglo-bin in the presence of two allosteric effectors, L35 and IHP,” Biochimicaet Biophysica Acta. 1807(10), 1253–1261 (2011).
8. M. F. Perutz, “Stereochemistry of cooperative effects in haemoglobin.The Bohr effect and combination with organic phosphates,” Nature228(5273), 734–739 (1970).
9. J. Kister, C. Poyart, and S. J. Edelstein, “An expanded two-state allos-teric model for interactions of human hemoglobin Awith nonsaturatingconcentrations of 2, 3-diphosphoglycerate,” J. Biol. Chem. 262(25),12085–12091 (1987).
10. J. Kister, C. Poyart, and S. J. Edelstein, “Oxygen-organophosphatelinkage in hemoglobin A. The double hump effect,” Biophys. J.52(4), 527–535 (1987).
11. M. C. Marden et al., “Effectors of hemoglobin. Separation of allostericand affinity factors,” Biophys. J. 57(3), 397–403 (1990).
12. I. Lalezari et al., “New effectors of human hemoglobin: structure andfunction,” Biochemistry 29(6), 1515–1523 (1990).
13. A. Tsuneshige, S. Park, and T. Yonetani, “Heterotropic effectors controlthe hemoglobin function by interacting with its T and R states-a newview on the principle of allostery,” Biophys. Chem. 98(1–2), 49–63(2002).
Journal of Biomedical Optics 125002-6 December 2012 • Vol. 17(12)
Liu et al.: Specific absorption spectra of hemoglobin at different PO2 levels . . .
Downloaded From: http://biomedicaloptics.spiedigitallibrary.org/ on 09/05/2013 Terms of Use: http://spiedl.org/terms
14. T. Yonetani et al., “Global allostery model of hemoglobin: modulationof O2-affinity, cooperativity, Bohr effect by heterotropic allosteric effec-tors,” J. Biol. Chem. 277(37), 34508–34520 (2002).
15. J. Wang, S. Zhu, and C. Xu, Biochemistry, p. 263, High Education Press,Beijing (2002).
16. J. M. Holt and G. K. Ackers, “The hill coefficient: inadequate resolutionof cooperativity in human hemoglobin,” Meth. Enzymol. 455, 193–212(2009).
17. H. Hecht, “Heart failure and lung disease,” Circulation 14, 265–290(1956).
18. C. Lundsgaard and D. D. Van Slyke, “Cyanosis,” Medicine 2, 1–76(1923).
19. K. D. Carpenter, “A comprehensive review of cyanosis,” Crit CareNurse 13(4), 66–72 (1993).
20. S. Ogoh, “The effect of phenylephrine on arterial and venous cerebralblood flow in healthy subject,” Clin. Physiol. Funct. Imaging 31(6),445–451 (2011).
21. M. Diop et al., “Comparison of time-resolved and continuous-wavenear-infrared techniques for measuring cerebral blood flow in piglets,”J. Biomed. Opt. 15(5), 057004 (2010).
22. L. C. Sorensen, T. S. Leung, and G. Greisen, “Comparison of cerebraloxygen saturation in premature infants by near-infrared spatiallyresolved spectroscopy: observations on probe-dependent bias,”J. Biomed. Opt. 13(6), 064013 (2008).
23. M. Kacprzak et al., “Time-resolved optical imager for assessment ofcerebral oxygenation,” J. Biomed. Opt. 12(3), 034019 (2007).
24. S. Ijichi et al., “Quantification of cerebral hemoglobin as a function ofoxygenation using near-infrared time-resolved spectroscopy in a pigletmodel of hypoxia,” J. Biomed. Opt. 10(2), 024026 (2005).
25. T. Hamaoka et al., “Quantification of ischemic muscle deoxygenationby near infrared time-resolved spectroscopy,” J. Biomed. Opt. 5(1),102–105 (2000).
26. B. Yu, C. Feng, and W. B. Hong, “Characteristics and application ofpolarographic needle oxygen electrode,” Journal of Zhejiang University25(3), 266–271 (1991).
27. J. Chaiken and J. Goodisman, “On probing human fingertips in vivousing near-infrared light: model calculations,” J. Biomed. Opt. 15(3),037007 (2010).
28. N. S. Eikje et al., “Fiber optic near-infrared Raman spectroscopy forclinical noninvasive determination of water content in diseased skin andassessment of cutaneous edema,” J. Biomed. Opt. 10(1), 14013 (2005).
29. Japanese Industrial Standards, “Colour specification-The CIE 1931standard colorimetric system and the CIE 1964 supplementary standardcolorimetric system” JIS Z8701-1999, http://www.jsa.or.jp/default_english.asp (2012).
30. Zhang Faping, “The application of the finger cot oxygen saturation tech-nique in the clinical care,” Occupation and Health 16(3), 64–65(2000).
Journal of Biomedical Optics 125002-7 December 2012 • Vol. 17(12)
Liu et al.: Specific absorption spectra of hemoglobin at different PO2 levels . . .
Downloaded From: http://biomedicaloptics.spiedigitallibrary.org/ on 09/05/2013 Terms of Use: http://spiedl.org/terms