Spectrophone measurements of isotopets of water vaporand nitric oxide and of phosgene at
selected wavelengths in the CO and CO2 laser region
Walter Schnell and Gaston Fischer
Observatoire Cantonal, CH-2000 Neuchdtel, SwitzerlandReceived November 8, 1977
Absorption coefficients are measured at CO and CO2 laser wavelengths for the poison gas phosgene, CC120, and the
isotopic species H2160, H 2180, HD 16 0, D2
16 0, 14 N' 60, and l5Nl 6 0. The laser lines selected are those in near coinci-
dence with absorption lines of the gases and vapors studied. These data should prove useful in analytical applica-
tions relating to pollution monitoring and control of phosgene or D2 0 leaks. They also demonstrate the feasibility
of determining certain important isotope abundances or ratios by simple and rapid infrared spectroscopicmethods.
Recent publications1' 2 have revealed many coinciden-ces between CO laser emission lines and H2
1 60 and14N160 absorption lines. The purpose of these publi-cations was to provide data for pollution monitoringwith CO lasers, either over long pathways 2 or by meansof opto-acoustic detectors, also called spectro-phones.1" 3
This Letter extends the list of coincident lines ofthese gases and of some of their stable isotopes. Thepoison gas phosgene (CC12O) is also investigated in theCO laser region in the hope that this may yield a meansof monitoring and controlling this highly toxic gas. Inchemical plants the limit of tolerance for this gas isgenerally set at 0.1 part in 106. As a continuation ofreports on isotope analysis by infrared laser spectros-copy,4 ' 5 we tested the feasibility of detecting smallabundances of certain isotopic species of H20 and NOwith regard to the importance of these measurementsin atmospheric physics, hydrology, and geophysics.The detection of heavy water in the atmosphere may beof interest for the control of leaks in certain kinds ofatomic-energy installations.
Our measurements were performed with a nonreso-nant spectrophone, 3 the gas cell of which was a Pyrextube (0i = 9 mm; L = 85 mm) fitted with CdTe Brew-ster windows. The pressure transducer, a miniaturecondenser microphone, was placed in a side tube. Thelaser beam was chopped at 70 Hz, and the responsivitywas 3.7 V/W cm-'. The sealed 12 C160 and 12Cl 6 0 2 la-sers were of the type of Seguin et al.
6 The CO laser,cooled to -80°C, gave us about 100 lines in the 5.2- to6.3-,um range, with powers from 50 to 500 mW. The 70C0 2 laser lines between 9 and 11 um had an averagepower of 1 W.
The samples were prepared in two steps. Watervapor or nitric oxide was introduced into the detectorcell first, and a pressure of 0.1 to 100 Torr was allowedto reach equilibrium with respect to wall adsorption.
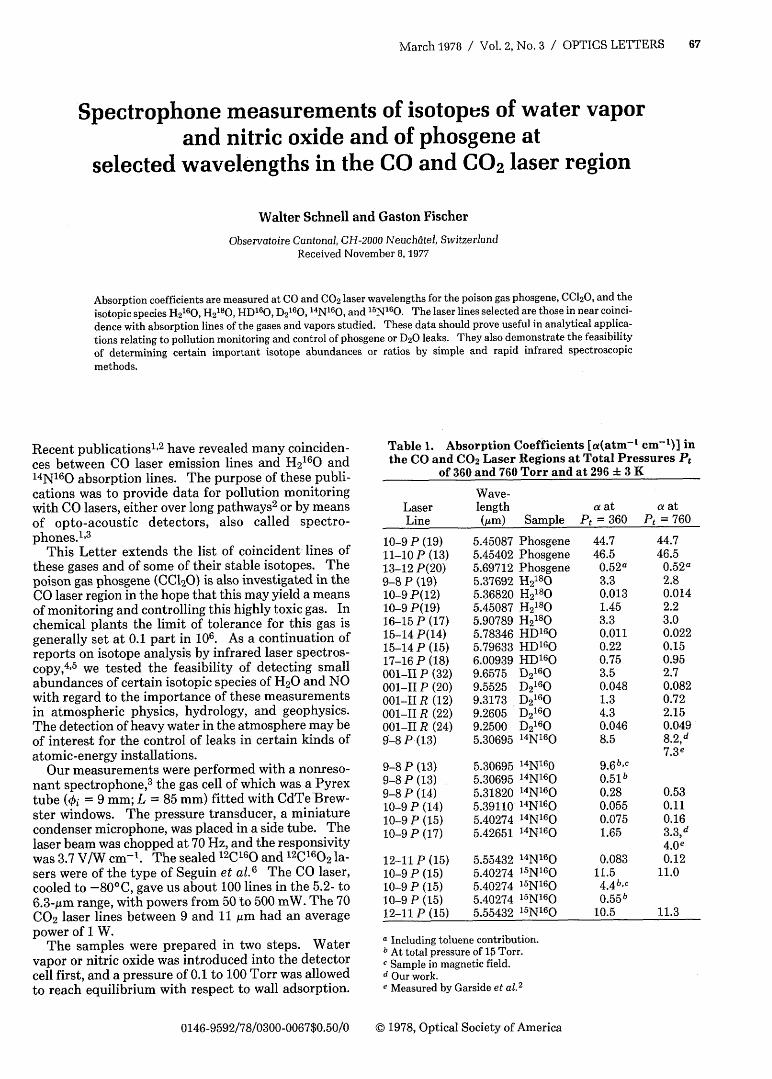
Table 1. Absorption Coefficients [c(atmnr cm-1 )] inthe CO and CO2 Laser Regions at Total Pressures Pt
of 360 and 760 Torr and at 296 ± 3 K
Wave-Laser length a at a atLine (gLm) Sample Pt = 360 Pt = 760
10-9 P (19) 5.45087 Phosgene 44.7 44.711-10 P (13) 5.45402 Phosgene 46.5 46.513-12 P(20) 5.69712 Phosgene 0.52a 0.52a9-8 P (19) 5.37692 H2
18 0 3.3 2.810-9 P(12) 5.36820 H2
180 0.013 0.01410-9 P(19) 5.45087 H2
180 1.45 2.216-15 P (17) 5.90789 H2
180 3.3 3.015-14 P(14) 5.78346 HD160 0.011 0.02215-14 P (15) 5.79633 HD160 0.22 0.1517-16 P (18) 6.00939 HD160 0.75 0.95001-1I P (32) 9.6575 D 2
1 60 3.5 2.7
001-II P (20) 9.5525 D21 6O 0.048 0.082
001-II R (12) 9.3173 D 2160 1.3 0.72
001-II R (22) 9.2605 D 216 0 4.3 2.15
001-II R (24) 9.2500 D21 60 0.046 0.049
9-8 P (13) 5.30695 14N' 6 0 8.5 8.2,d7.3e
9-8 P (13) 5.30695 14N160 9.6 ,c9-8 P (13) 5.30695 14N16 0 0.51b9-8 P (14) 5.31820 A4N160 0.28 0.5310-9 P (14) 5.39110 14 N'6 0 0.055 0.1110-9 P (15) 5.40274 ' 4N160 0.075 0.1610-9 P (17) 5.42651 14N16 0 1.65 3.3,d
4.0e12-11 P (15) 5.55432 14N16 0 0.083 0.1210-9 P (15) 5.40274 ' 5N160 11.5 11.010-9 P (15) 5.40274 15N160 4.4bc10-9 P (15) 5.40274 15N16 0 0.55b12-11 P (15) 5.55432 15N' 60 10.5 11.3
a Including toluene contribution.b At total pressure of 15 Torr.c Sample in magnetic field.d Our work.e Measured by Garside et al.
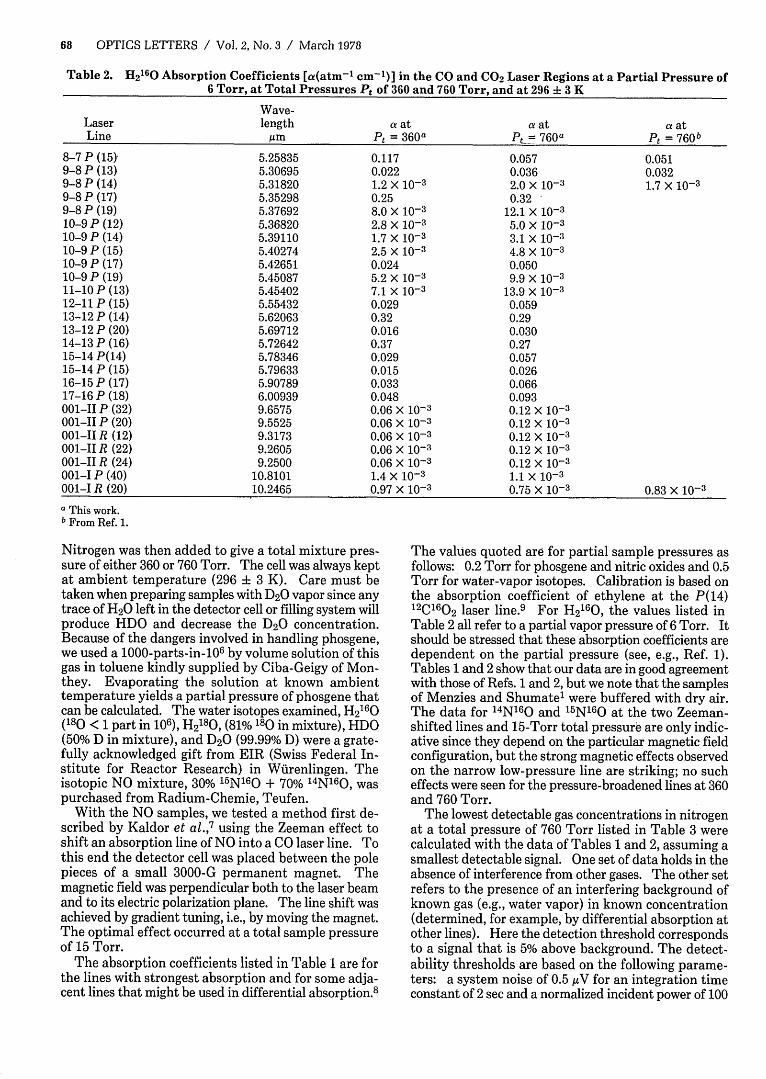
Table 2. H216 0 Absorption Coefficients [a(atm-1 cm- 1)] in the CO and CO2 Laser Regions at a Partial Pressure of
6 Torr, at Total Pressures Pt of 360 and 760 Torr, and at 296 i 3 K
Wave-Laser length a at a at a atLine Am Pt = 360a Pt = 760a Pt = 760b
8-7 P (15) 5.25835 0.117 0.057 0.0519-8 P (13) 5.30695 0.022 0.036 0.0329-8 P (14) 5.31820 1.2 X 10⁻³ 2.0 X 10⁻³ 1.7 X 10⁻³
9-8 P (17) 5.35298 0.25 0.329-8 P (19) 5.37692 8.0 X 10⁻³ 12.1 X 10-310-9 P (12) 5.36820 2.8 X 10⁻³ 5.0 X 10-310-9 P (14) 5.39110 1.7 X 10⁻³ 3.1 X 10-310-9 P (15) 5.40274 2.5 X 10⁻³ 4.8 X 10⁻³
10-9 P (17) 5.42651 0.024 0.05010-9 P (19) 5.45087 5.2 X 10⁻³ 9.9 X 10-311-10 P (13) 5.45402 7.1 X 10⁻³ 13.9 X 10-312-11 P (15) 5.55432 0.029 0.05913-12 P (14) 5.62063 0.32 0.2913-12 P (20) 5.69712 0.016 0.03014-13 P (16) 5.72642 0.37 0.2715-14 P(14) 5.78346 0.029 0.05715-14 P (15) 5.79633 0.015 0.02616-15 P (17) 5.90789 0.033 0.06617-16 P (18) 6.00939 0.048 0.093001-II P (32) 9.6575 0.06 X 10⁻³ 0.12 X 10-3001-II P (20) 9.5525 0.06 X 10⁻³ 0.12 X 10-3001-II R (12) 9.3173 0.06 X 10⁻³ 0.12 X 10-3001-II R (22) 9.2605 0.06 X 10⁻³ 0.12 X 10⁻³
001-II R (24) 9.2500 0.06 X 10⁻³ 0.12 X 10⁻³
001-I P (40) 10.8101 1.4 X 10⁻³ 1.1 X 10-3001-I R (20) 10.2465 0.97 X 10⁻³ 0.75 X 10⁻³ 0.83 X 10⁻³
a This work.b From Ref. 1.
Nitrogen was then added to give a total mixture pres-sure of either 360 or 760 Torr. The cell was always keptat ambient temperature (296 ± 3 K). Care must betaken when preparing samples with D20 vapor since anytrace of H20 left in the detector cell or filling system willproduce HDO and decrease the D20 concentration.Because of the dangers involved in handling phosgene,we used a 1000-parts-in-10 6 by volume solution of thisgas in toluene kindly supplied by Ciba-Geigy of Mon-they. Evaporating the solution at known ambienttemperature yields a partial pressure of phosgene thatcan be calculated. The water isotopes examined, H2
1 60(180 < 1 part in 106), H2
1 80, (81% 180 in mixture), HDO(50% D in mixture), and D2 0 (99.99% D) were a grate-fully acknowledged gift from EIR (Swiss Federal In-stitute for Reactor Research) in Wilrenlingen. Theisotopic NO mixture, 30% 15 N1 60 + 70% 14N160, waspurchased from Radium-Chemie, Teufen.
With the NO samples, we tested a method first de-scribed by Kaldor et al.,
7 using the Zeeman effect toshift an absorption line of NO into a CO laser line. Tothis end the detector cell was placed between the polepieces of a small 3000-G permanent magnet. Themagnetic field was perpendicular both to the laser-beamand to its electric polarization plane. The line shift wasachieved by gradient tuning, i.e., by moving the magnet.The optimal effect occurred at a total sample pressureof 15 Torr.
The absorption coefficients listed in Table I are forthe lines with strongest absorption and for some adja-cent lines that might be used in differential absorption. 8
The values quoted are for partial sample pressures asfollows: 0.2 Torr for phosgene and nitric oxides and 0.5Torr for water-vapor isotopes. Calibration is based onthe absorption coefficient of ethylene at the P(14)12C160 2 laser line.9 For H2
160, the values listed inTable 2 all refer to a partial vapor pressure of 6 Torr. Itshould be stressed that these absorption coefficients aredependent on the partial pressure (see, e.g., Ref. 1).Tables 1 and 2 show that our data are in good agreementwith those of Refs. 1 and 2, but we note that the samplesof Menzies and Shumate1 were buffered with dry air.The data for 14N 16 0 and 1 5 N16O at the two Zeeman-shifted lines and 15-Torr total pressure are only indic-ative since they depend on the particular magnetic fieldconfiguration, but the strong magnetic effects observedon the narrow low-pressure line are striking; no sucheffects were seen for the pressure-broadened lines at 360and 760 Torr.
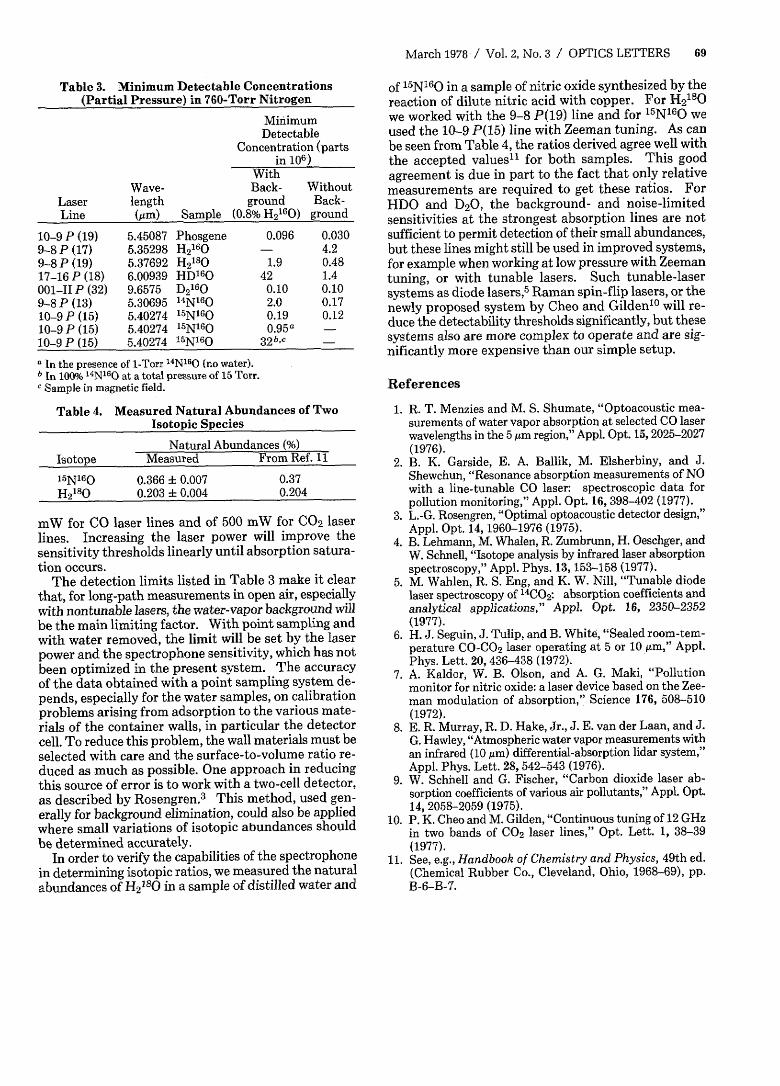
The lowest detectable gas concentrations in nitrogenat a total pressure of 760 Torr listed in Table 3 werecalculated with the data of Tables 1 and 2, assuming asmallest detectable signal. One set of data holds in theabsence of interference from other gases. The other setrefers to the presence of an interfering background ofknown gas (e.g., water vapor) in known concentration(determined, for example, by differential absorption atother lines). Here the detection threshold correspondsto a signal that is 5% above background. The detect-ability thresholds are based on the following parame-ters: a system noise of 0.5 ,V for an integration timeconstant of 2 sec and a normalized incident power of 100
March 1978 / Vol. 2, No. 3 / OPTICS LETTERS 69
Table 3. Minimum Detectable Concentrations(Partial Pressure) in 760-Torr Nitrogen
10-9 P (19) 5.45087 Phosgene 0.096 0.0309-8 P (17) 5.35298 H12160 - 4.29-8 P (19) 5.37692 H2180 1.9 0.4817-16 P (18) 6.00939 HD1D6 0 42 1.4001-II P (32) 9.6575 D2
16 0 0.10 0.109-8 P (13) 5.30695 1 4N' 6 0 2.0 0.1710-9 P (15) 5.40274 '5N160 0.19 0.1210-9 P (15) 5.40274 15 N' 60 0.95 a -
10-9 P (15) 5.40274 ' 5N160 32-c _
I In the presence of 1-Torr 4N16 0 (no water).b In 1o0% ' 4N16 0 at a total pressure of 15 Torr.c Sample in magnetic field.
Table 4. Measured Natural Abundances of TwoIsotopic Species
Natural Abundances (%)Isotope Measured From Ref. 11
15N160 0.366 ± 0.007 0.37H218O 0.203 ±0.004 0.204
mW for CO laser lines and of 500 mW for CO2 laserlines. Increasing the laser power will improve thesensitivity thresholds linearly until absorption satura-tion occurs.
The detection limits listed in Table 3 make it clearthat, for long-path measurements in open air, especiallywith nontunable lasers, the water-vapor background willbe the main limiting factor. With point sampling andwith water removed, the limit will be set by the laserpower and the spectrophone sensitivity, which has notbeen optimized in the present system. The accuracyof the data obtained with a point sampling system de-pends, especially for the water samples, on calibrationproblems arising from adsorption to the various mate-rials of the container walls, in particular the detectorcell. To reduce this problem, the wall materials must beselected with care and the surface-to-volume ratio re-duced as much as possible. One approach in reducingthis source of error is to work with a two-cell detector,as described by Rosengren.3 This method, used gen-erally for background elimination, could also be appliedwhere small variations of isotopic abundances shouldbe determined accurately.
In order to verify the capabilities of the spectrophonein determining isotopic ratios, we measured the naturalabundances of H2
18 0 in a sample of distilled water and
of 1 5 NI60 in a sample of nitric oxide synthesized by thereaction of dilute nitric acid with copper. For H2
180we worked with the 9-8 P(19) line and for 15N' 60 weused the 10-9 P(15) line with Zeeman tuning. As canbe seen from Table 4, the ratios derived agree well withthe accepted values'1 for both samples. This goodagreement is due in part to the fact that only relativemeasurements are required to get these ratios. ForHDO and 020, the background- and noise-limitedsensitivities at the strongest absorption lines are notsufficient to permit detection of their small abundances,but these lines might still be used in improved systems,for example when working at low pressure with Zeemantuning, or with tunable lasers. Such tunable-lasersystems as diode lasers,5 Raman spin-flip lasers, or thenewly proposed system by Cheo and Gilden1 0 will re-duce the detectability thresholds significantly, but thesesystems also are more complex to operate and are sig-nificantly more expensive than our simple setup.
References
1. R. T. Menzies and M. S. Shumate, "Optoacoustic mea-surements of water vapor absorption at selected CO laserwavelengths in the 5,pm region," Appl. Opt. 15,2025-2027(1976).
2. B. K. Garside, E. A. Ballik, M. Elsherbiny, and J.Shewchun, "Resonance absorption measurements of NOwith a line-tunable CO laser: spectroscopic data forpollution monitoring," Appl. Opt. 16, 398-402 (1977).
4. B. Lehmann, M. Whalen, R. Zumbrunn, H. Oeschger, andW. Schnell, "Isotope analysis by infrared laser absorptionspectroscopy," Appl. Phys. 13, 153-158 (1977).
5. M. Wahlen, R. S. Eng, and K. W. Nill, "Tunable diodelaser spectroscopy of 14CO2: absorption coefficients andanalytical applications," Appl. Opt. 16, 2350-2352(1977).
6. H. J. Seguin, J. Tulip, and B. White, "Sealed room-tem-perature CO-CO 2 laser operating at 5 or 10 pm," Appl.Phys. Lett. 20, 436-438 (1972).
7. A. Kaldor, W. B. Olson, and A. G. Maki, "Pollutionmonitor for nitric oxide: a laser device based on the Zee-man modulation of absorption," Science 176, 508-510(1972).
8. E. R. Murray, R. D. Hake, Jr., J. E. van der Laan, and J.G. Hawley, "Atmospheric water vapor measurements withan infrared (10 pm) differential-absorption lidar system,"Appl. Phys. Lett. 28, 542-543 (1976).
9. W. Schhell and G. Fischer, "Carbon dioxide laser ab-sorption coefficients of various air pollutants," Appl. Opt.14, 2058-2059 (1975).
10. P. K. Cheo and M. Gilden, "Continuous tuning of 12 GHzin two bands of CO2 laser lines," Opt. Lett. 1, 38-39(1977).
11. See, e.g., Handbook of Chemistry and Physics, 49th ed.(Chemical Rubber Co., Cleveland, Ohio, 1968-69), pp.B-6-B-7.