25
Copyright © Monash University 2009 Signal Processing First Lecture 4 Spectrum Representation 1
Copyright © Monash University 2009
Signal Processing
First
Lecture 4Spectrum
Representation
1
Copyright © Monash University 2009
READING ASSIGNMENTS
• This Lecture:– Chapter 3, Section 3‐1
• Other Reading:– Appendix A: Complex Numbers
– Next Lecture: Ch 3, Sects 3‐2, 3‐3, 3‐7 & 3‐8
2
Copyright © Monash University 2009
LECTURE OBJECTIVES
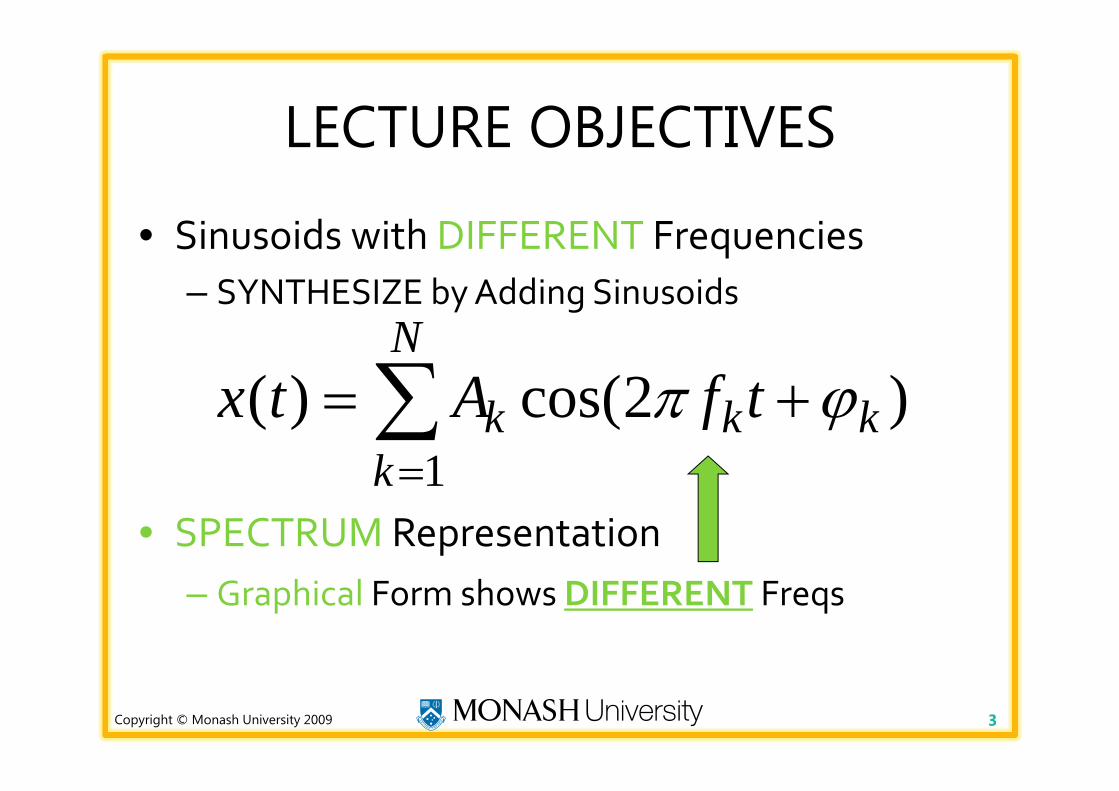
• Sinusoids with DIFFERENT Frequencies– SYNTHESIZE by Adding Sinusoids
• SPECTRUM Representation– Graphical Form shows DIFFERENT Freqs
3
N
kkkk tfAtx
1)2cos()(
Copyright © Monash University 2009
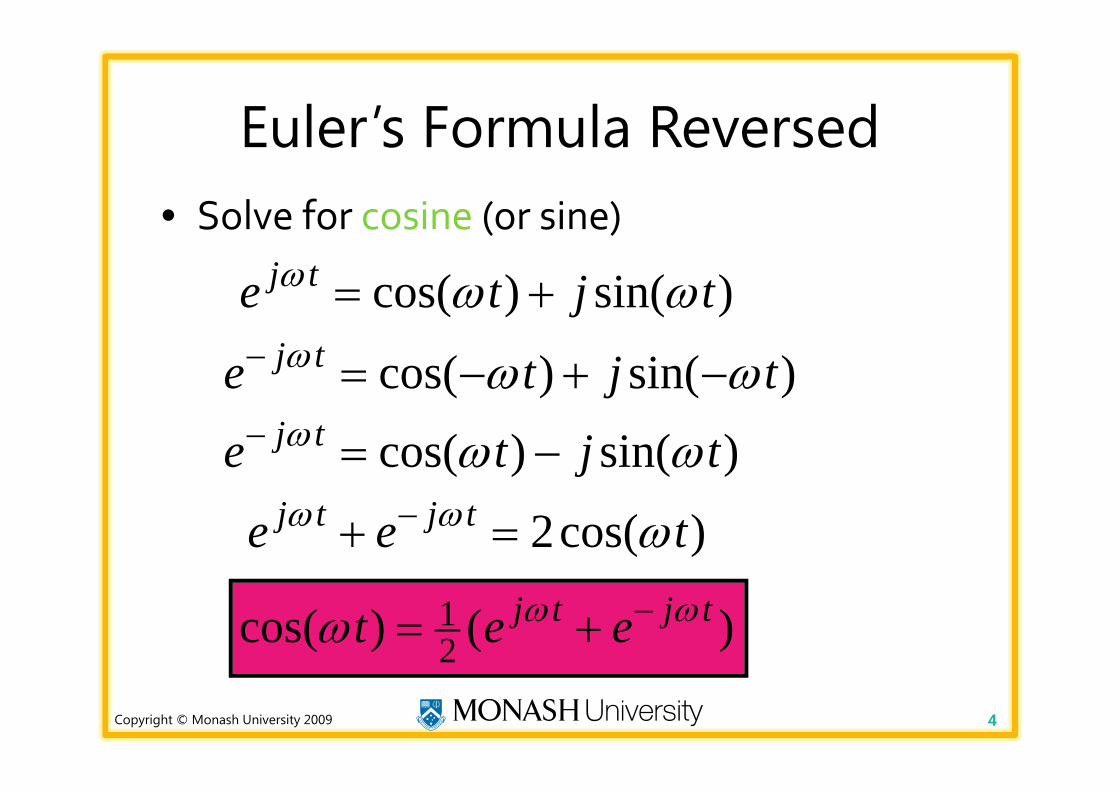
Euler’s Formula Reversed• Solve for cosine (or sine)
4
)sin()cos( tjte tj
)sin()cos( tjte tj
)sin()cos( tjte tj
)cos(2 tee tjtj
)()cos( 21 tjtj eet
Copyright © Monash University 2009
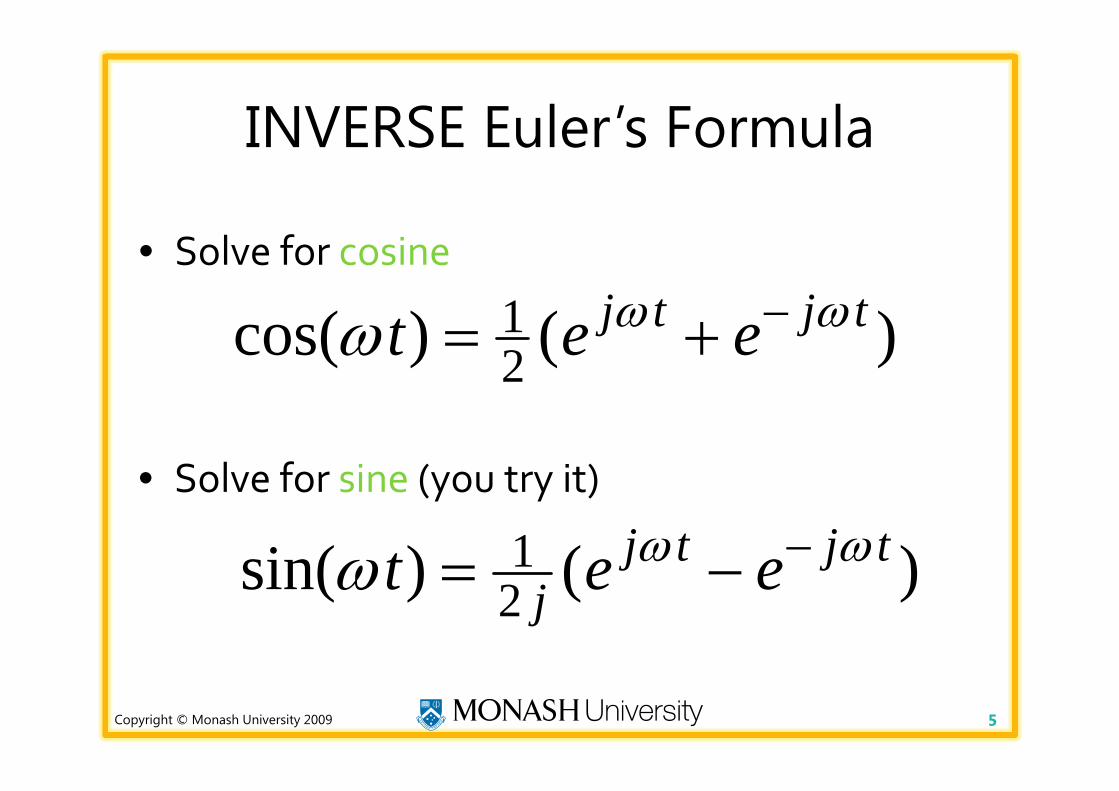
INVERSE Euler’s Formula
• Solve for cosine
5
)()cos( 21 tjtj eet
)()sin( 21 tjtjj eet
• Solve for sine (you try it)
Copyright © Monash University 2009
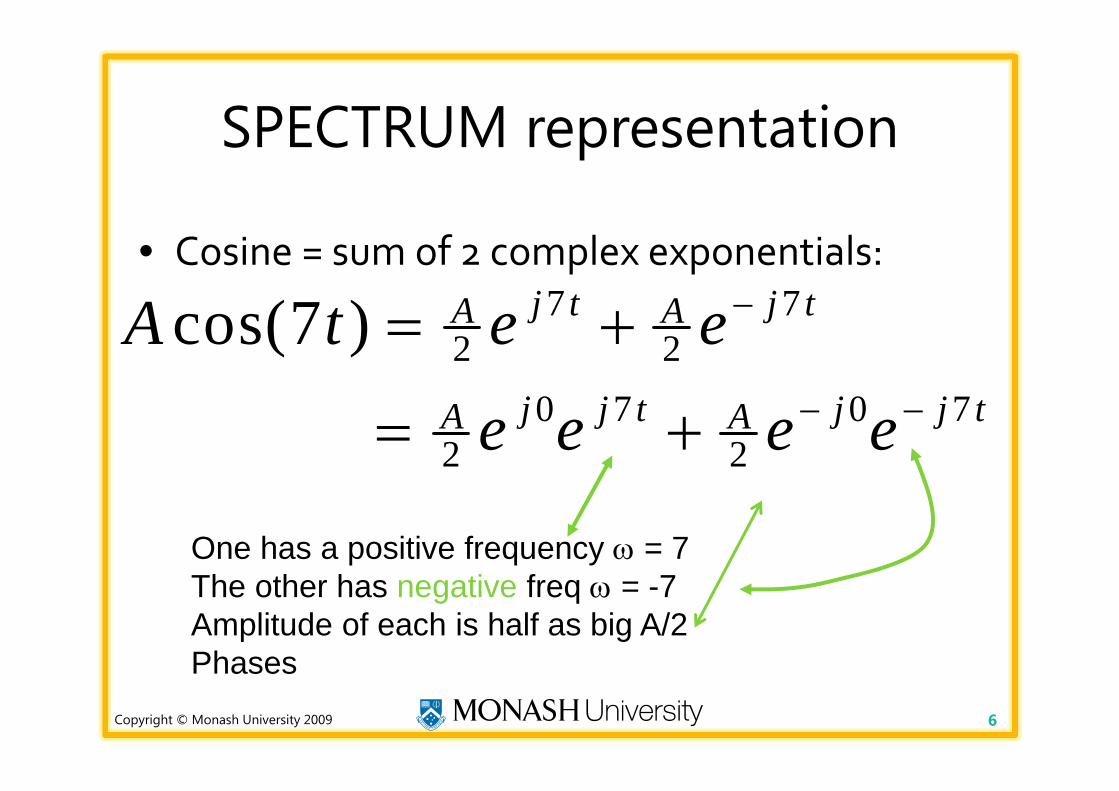
SPECTRUM representation
• Cosine = sum of 2 complex exponentials:
6
7 72 2
0 7 0 72 2
cos(7 ) j t j tA A
j j t j j tA A
A t e e
e e e e
One has a positive frequency = 7The other has negative freq = -7Amplitude of each is half as big A/2Phases
Copyright © Monash University 2009
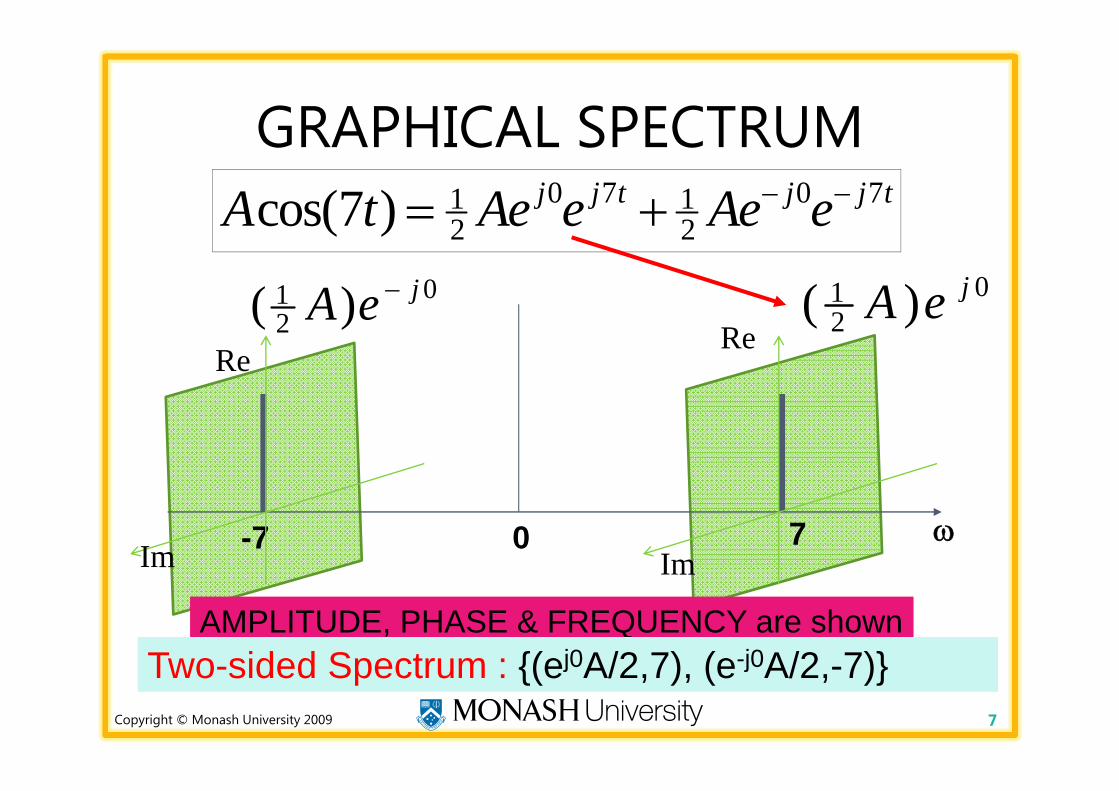
GRAPHICAL SPECTRUM
7
AMPLITUDE, PHASE & FREQUENCY are shown
7-7 0
0 7 0 71 12 2cos(7 ) j j t j j tA t Ae e Ae e
012( ) jA e 01
2( ) jA e
Two-sided Spectrum : {(ej0A/2,7), (e-j0A/2,-7)}
Im Im
ReRe
Copyright © Monash University 2009
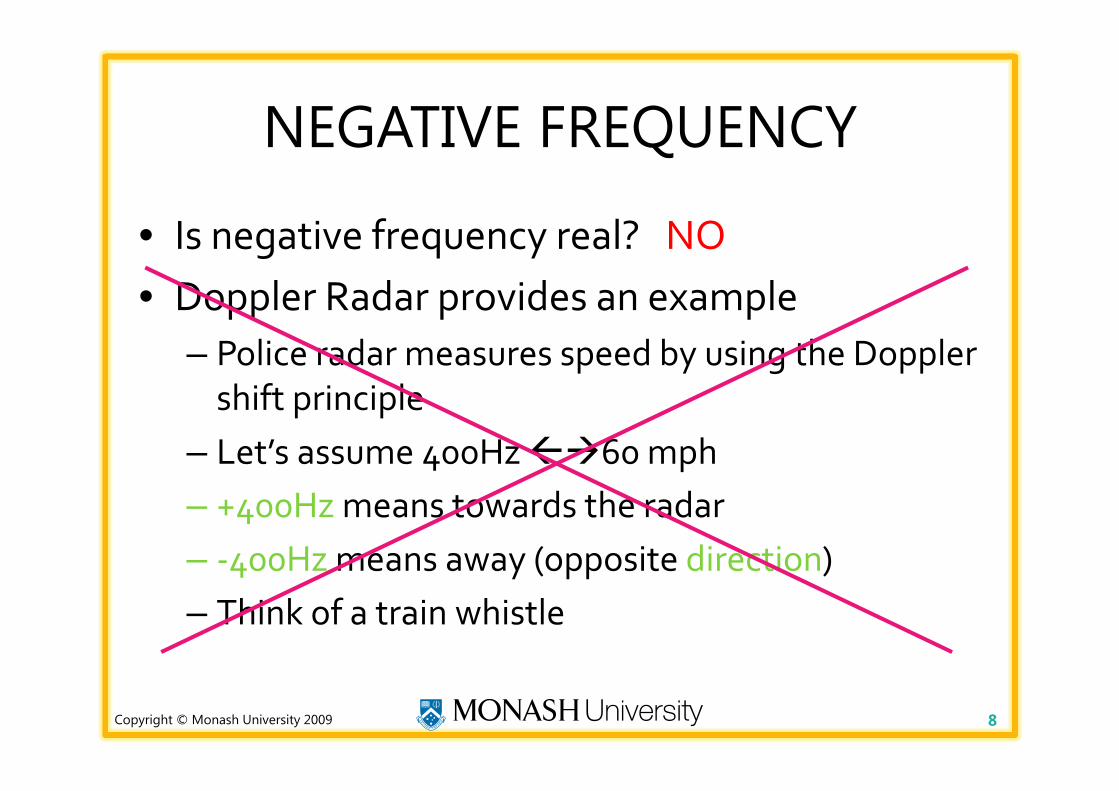
NEGATIVE FREQUENCY
• Is negative frequency real? NO• Doppler Radar provides an example
– Police radar measures speed by using the Doppler shift principle
– Let’s assume 400Hz 60 mph– +400Hz means towards the radar– ‐400Hz means away (opposite direction)– Think of a train whistle
8
Copyright © Monash University 2009
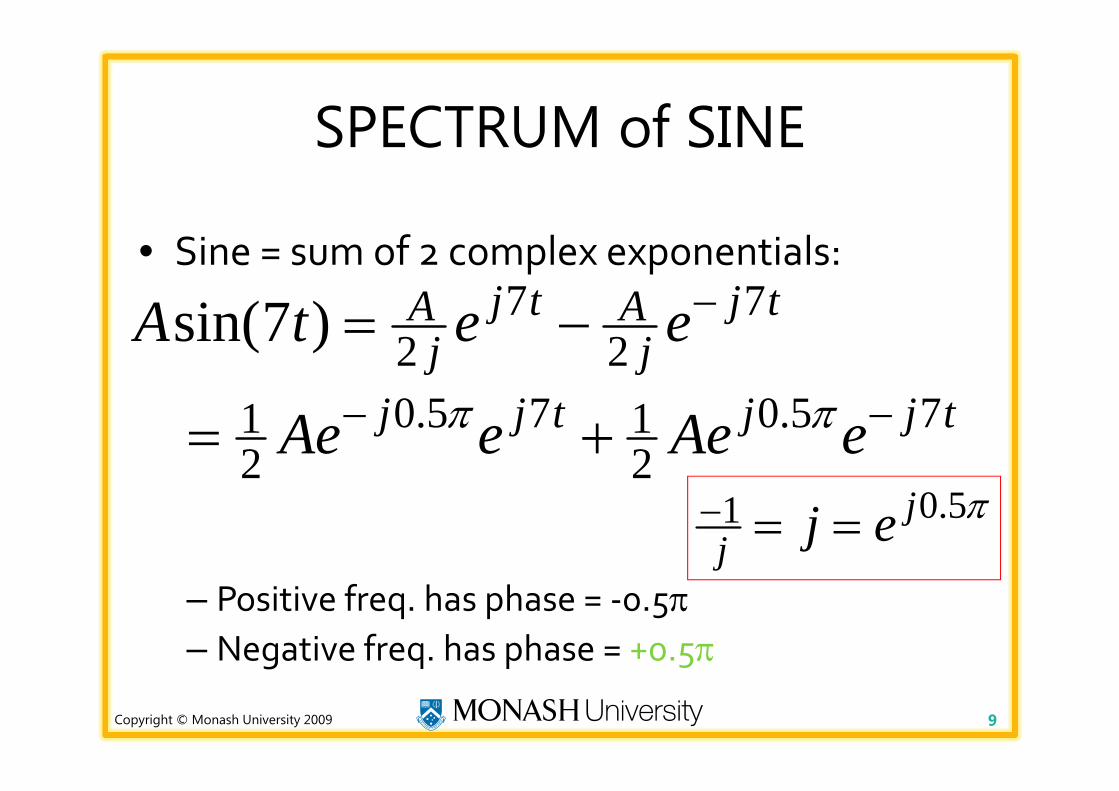
SPECTRUM of SINE
• Sine = sum of 2 complex exponentials:
– Positive freq. has phase = ‐0.5– Negative freq. has phase = +0.5
9
tjjtjj
tjj
Atjj
A
eAeeAe
eetA75.0
2175.0
21
72
72)7sin(
5.01 jj ej
Copyright © Monash University 2009
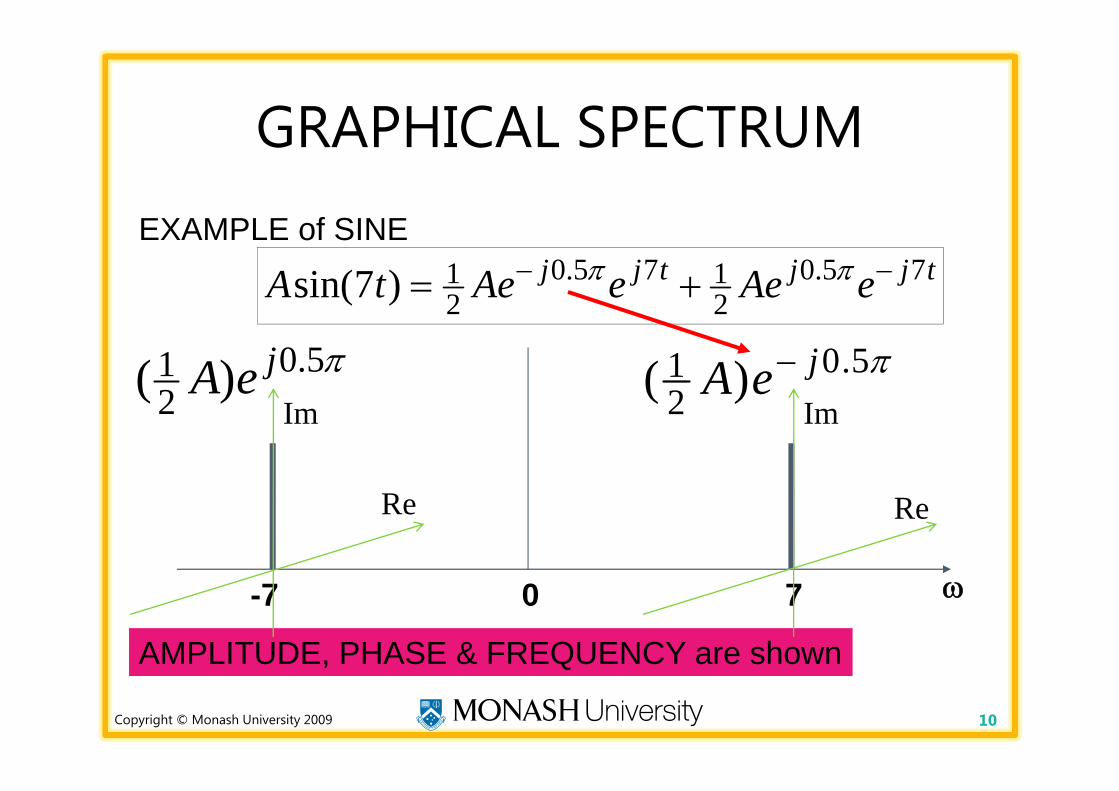
GRAPHICAL SPECTRUM
10
EXAMPLE of SINE
AMPLITUDE, PHASE & FREQUENCY are shown
7-7 0
tjjtjj eAeeAetA 75.02175.0
21)7sin(
5.021 )( jeA 5.0
21 )( jeA
Im
Re
Im
Re
Copyright © Monash University 2009
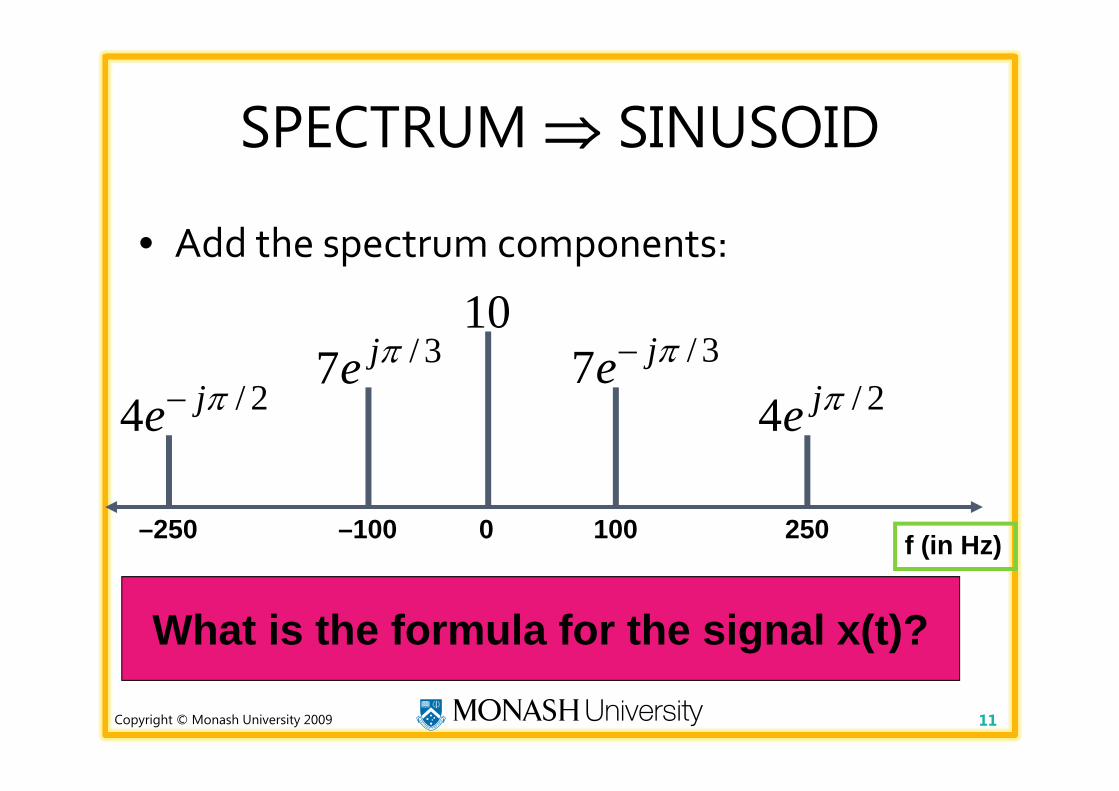
SPECTRUM SINUSOID
• Add the spectrum components:
11
What is the formula for the signal x(t)?
0 100 250–100–250 f (in Hz)
3/7 je 3/7 je2/4 je 2/4 je
10
Copyright © Monash University 2009
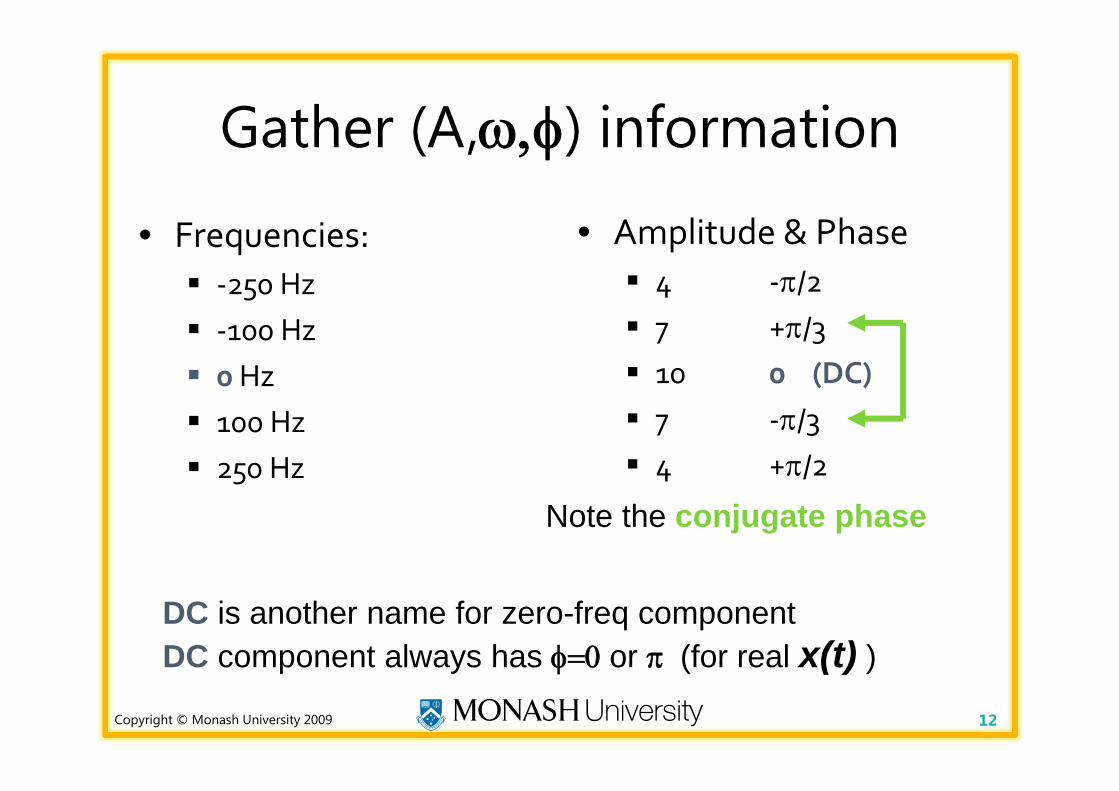
Gather (A,) information
• Frequencies: ‐250 Hz ‐100 Hz 0Hz 100 Hz 250 Hz
• Amplitude & Phase 4 ‐/2 7 +/3 10 0 (DC) 7 ‐/3 4 +/2
12
DC is another name for zero-freq componentDC component always has or (for real x(t) )
Note the conjugate phase
Copyright © Monash University 2009
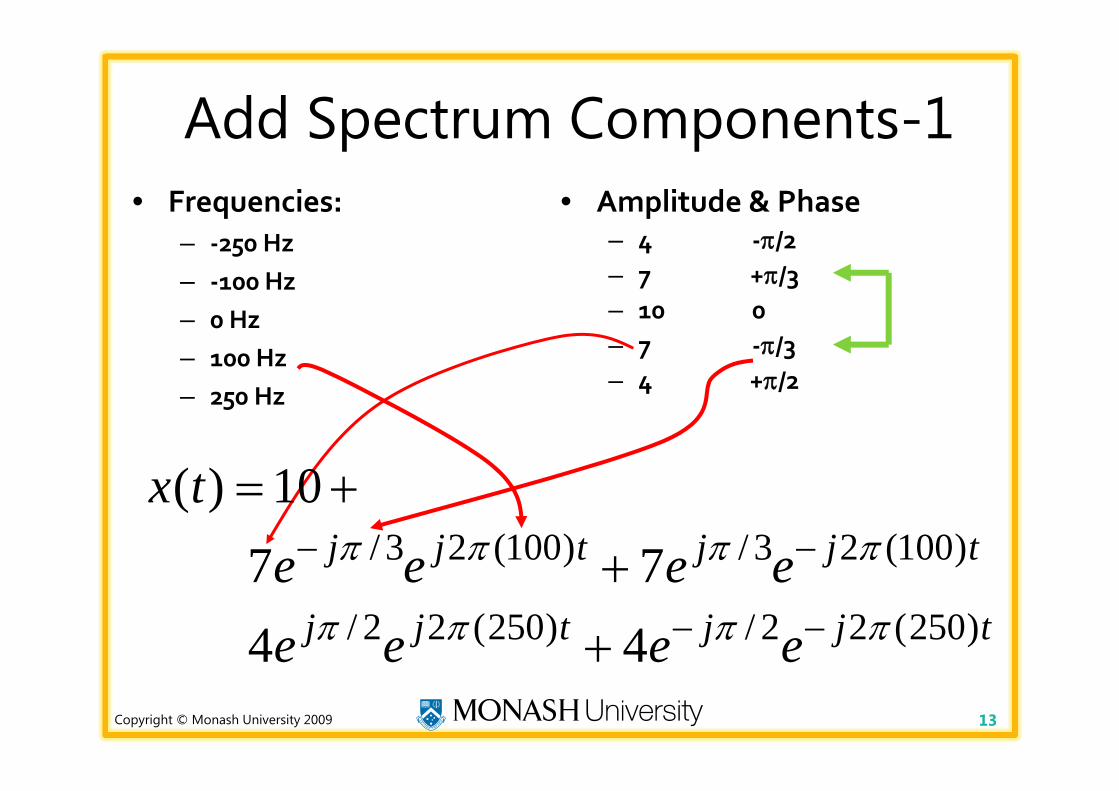
Add Spectrum Components-1• Frequencies:
– ‐250 Hz– ‐100 Hz– 0 Hz– 100 Hz– 250 Hz
• Amplitude & Phase– 4 ‐/2– 7 +/3– 10 0– 7 ‐/3– 4 +/2
13
tjjtjj
tjjtjj
eeeeeeee
tx
)250(22/)250(22/
)100(23/)100(23/
4477
10)(
Copyright © Monash University 2009
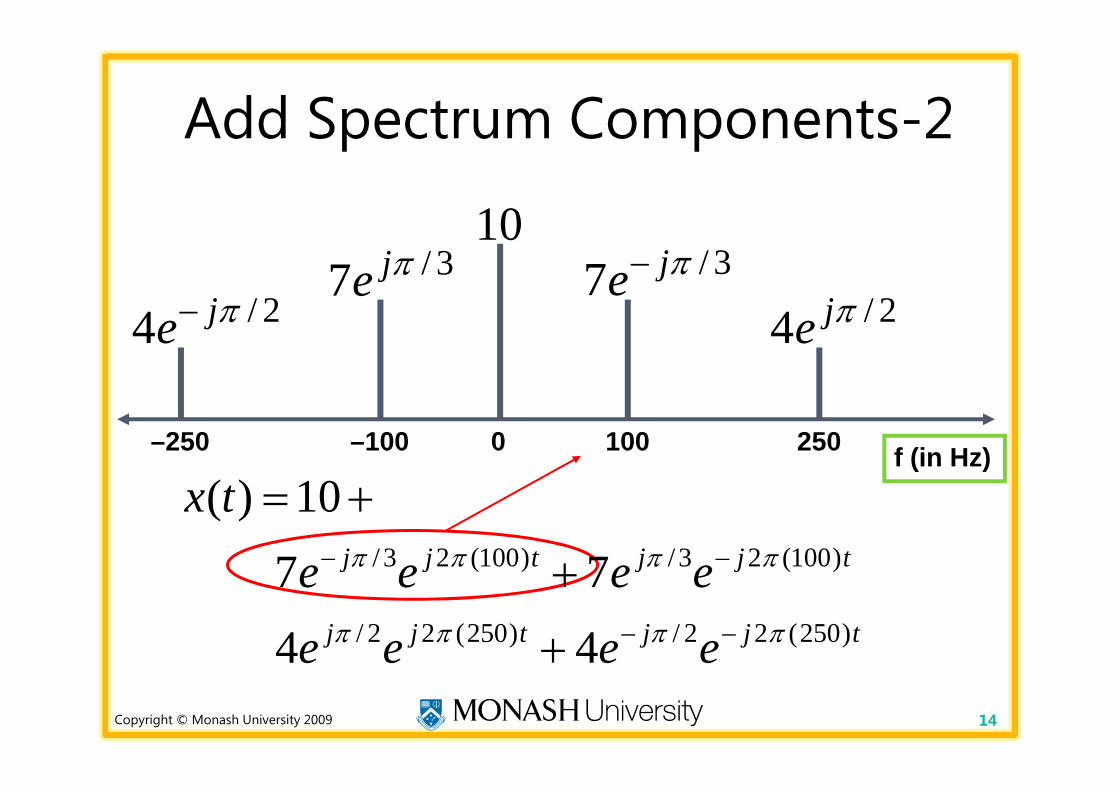
Add Spectrum Components-2
14
tjjtjj
tjjtjj
eeeeeeee
tx
)250(22/)250(22/
)100(23/)100(23/
4477
10)(
0 100 250–100–250 f (in Hz)
3/7 je 3/7 je2/4 je 2/4 je
10
Copyright © Monash University 2009
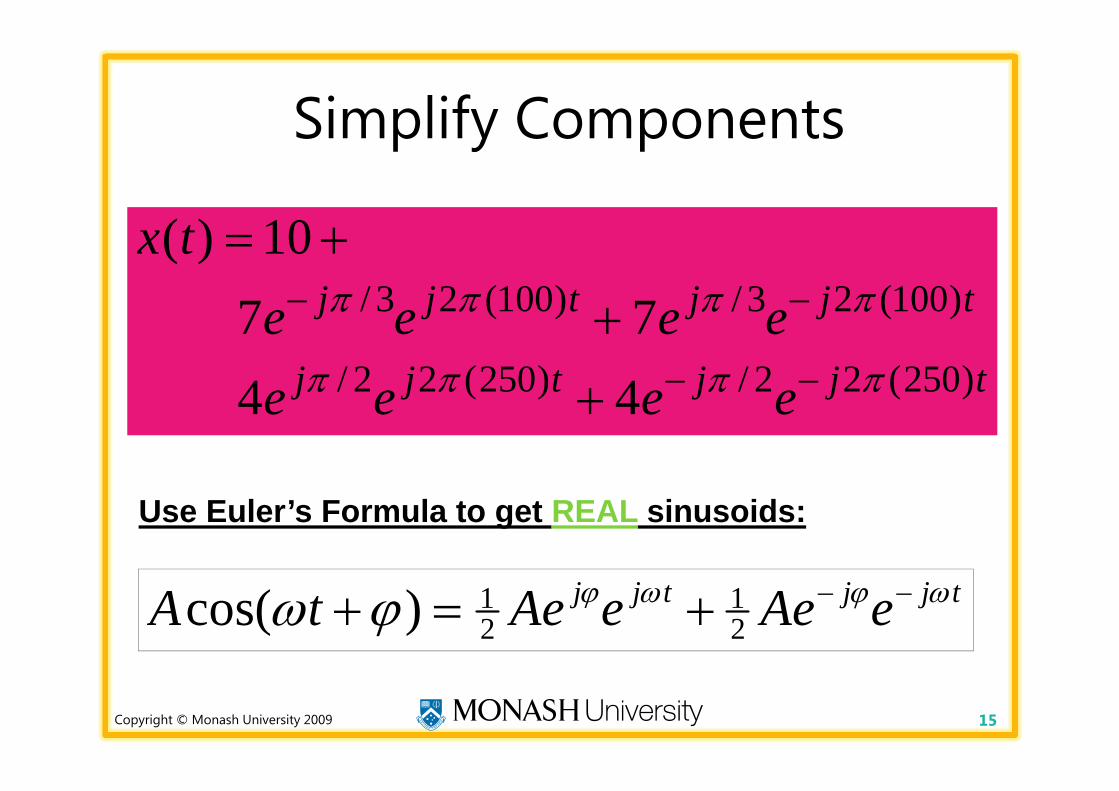
Simplify Components
15
Use Euler’s Formula to get REAL sinusoids:
tjjtjj
tjjtjj
eeeeeeee
tx
)250(22/)250(22/
)100(23/)100(23/
4477
10)(
1 12 2cos( ) j j t j j tA t Ae e Ae e
Copyright © Monash University 2009
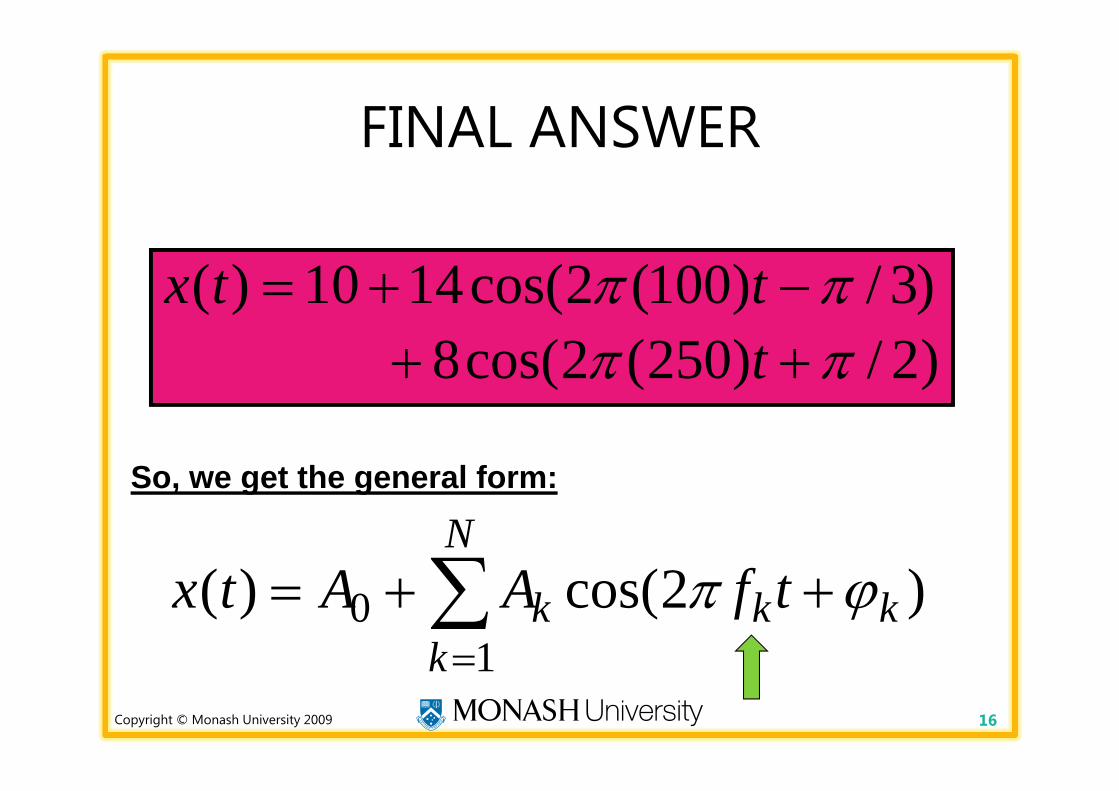
FINAL ANSWER
16
So, we get the general form:
N
kkkk tfAAtx
10 )2cos()(
)2/)250(2cos(8)3/)100(2cos(1410)(
tttx
Copyright © Monash University 2009
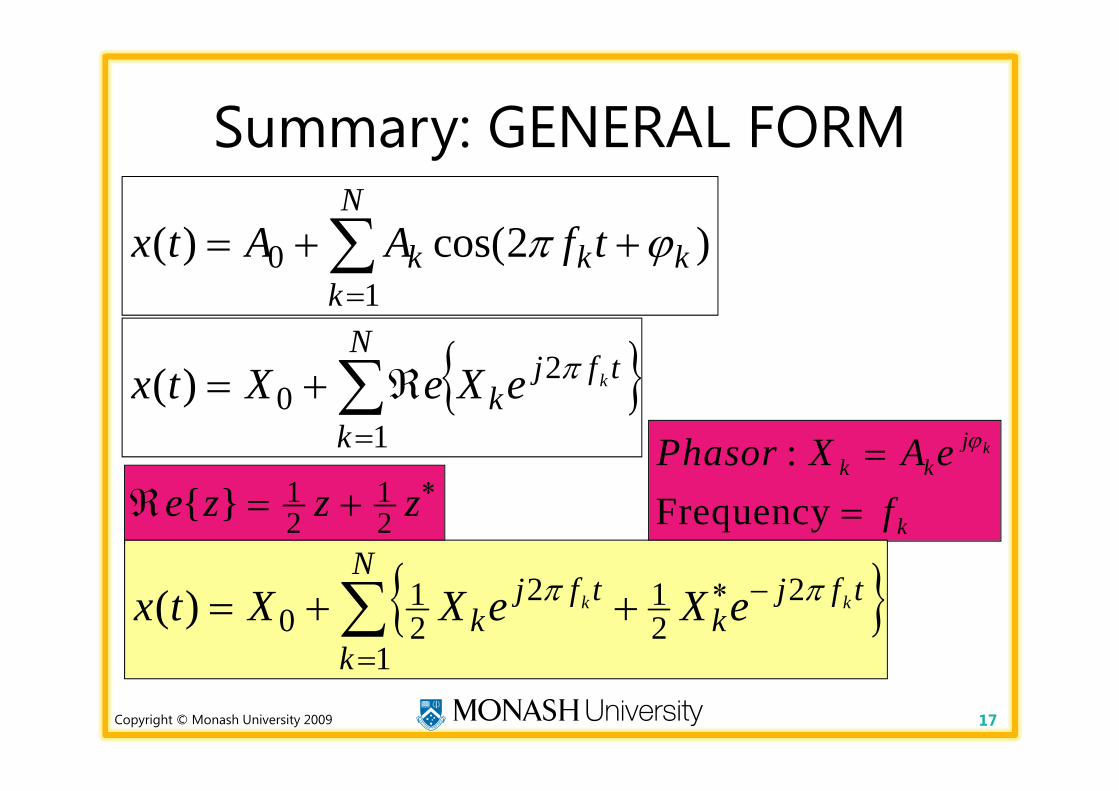
Summary: GENERAL FORM
17
zzze 21
21}{
:Frequency
kjk k
k
Phasor X A ef
N
k
tfjk
keXeXtx1
20)(
N
k
tfjk
tfjk
kk eXeXXtx1
2212
21
0)(
N
kkkk tfAAtx
10 )2cos()(
Copyright © Monash University 2009
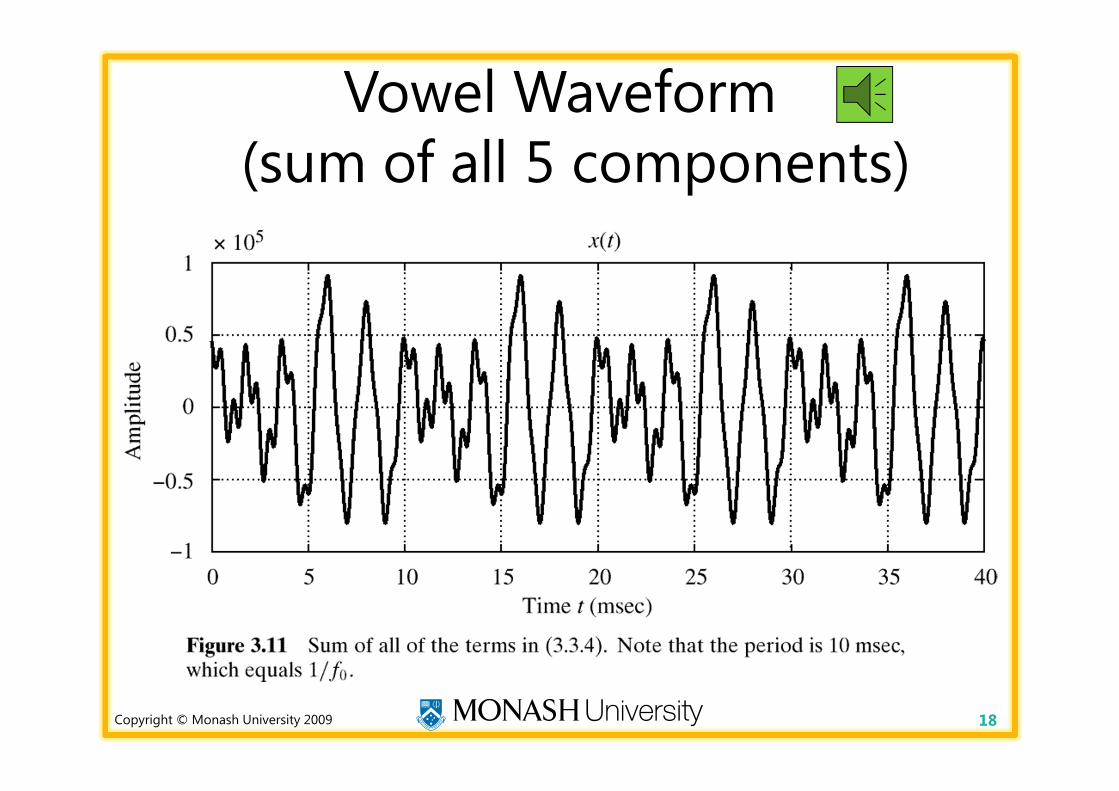
Vowel Waveform(sum of all 5 components)
18
Copyright © Monash University 2009
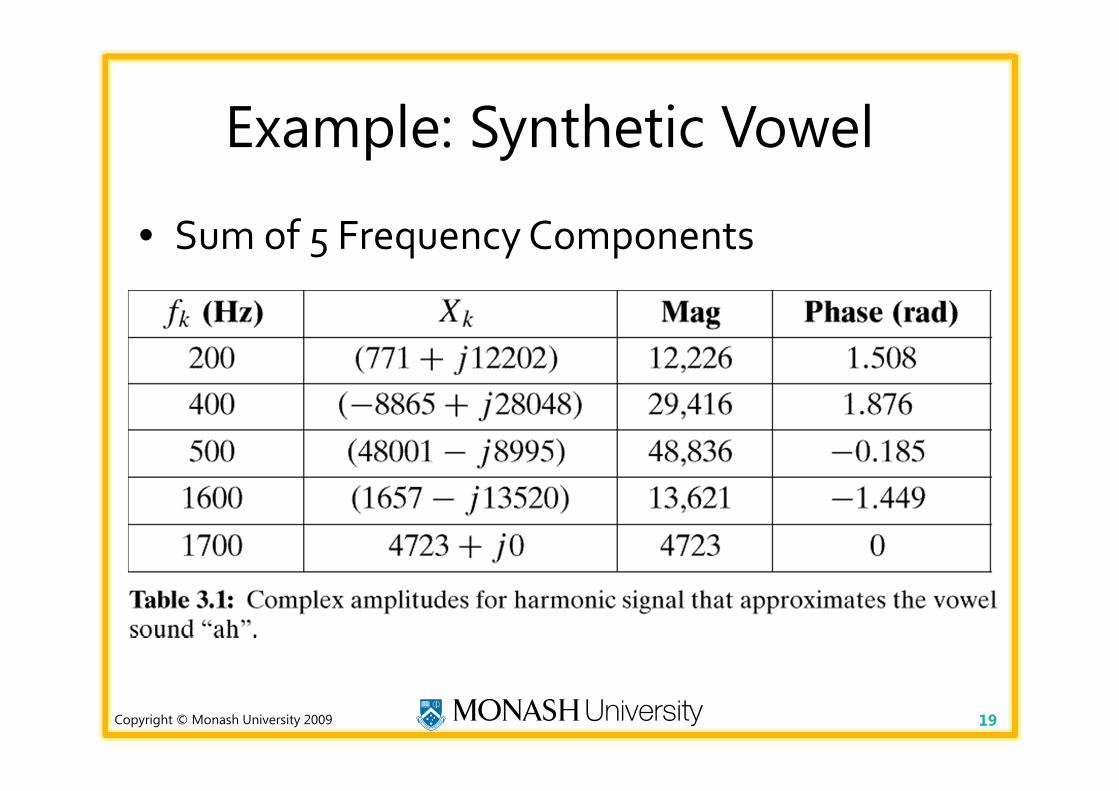
Example: Synthetic Vowel
• Sum of 5 Frequency Components
19
Copyright © Monash University 2009
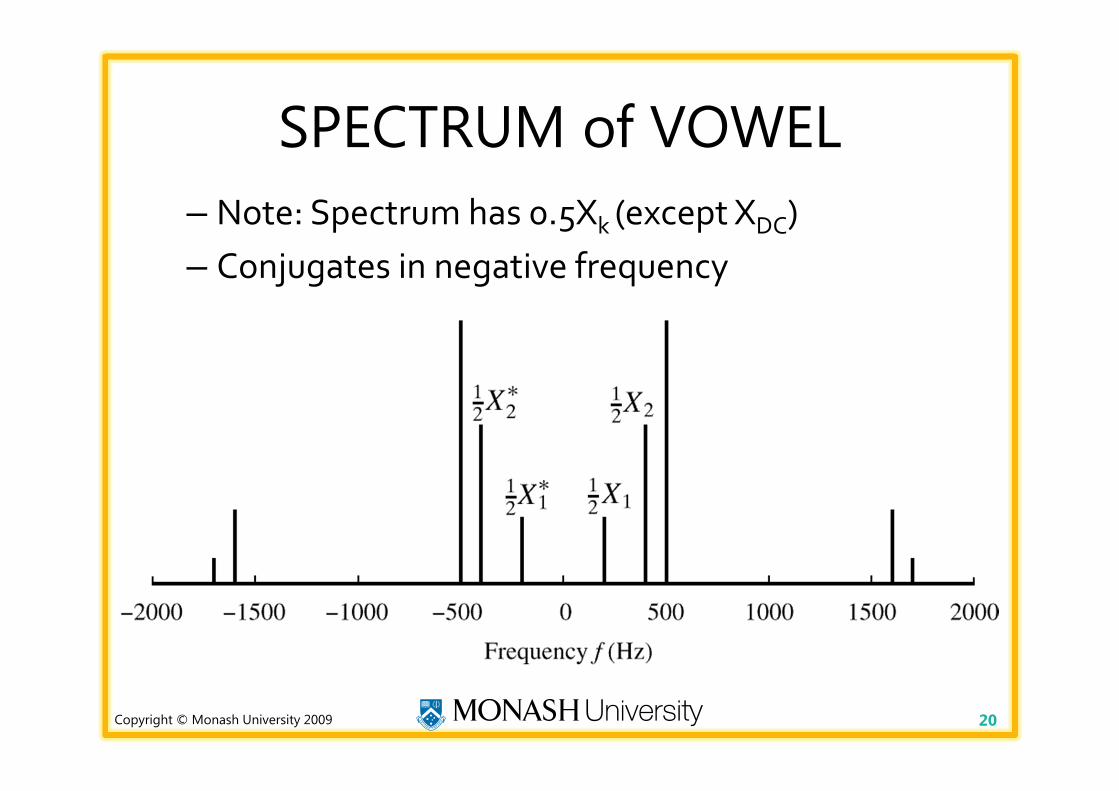
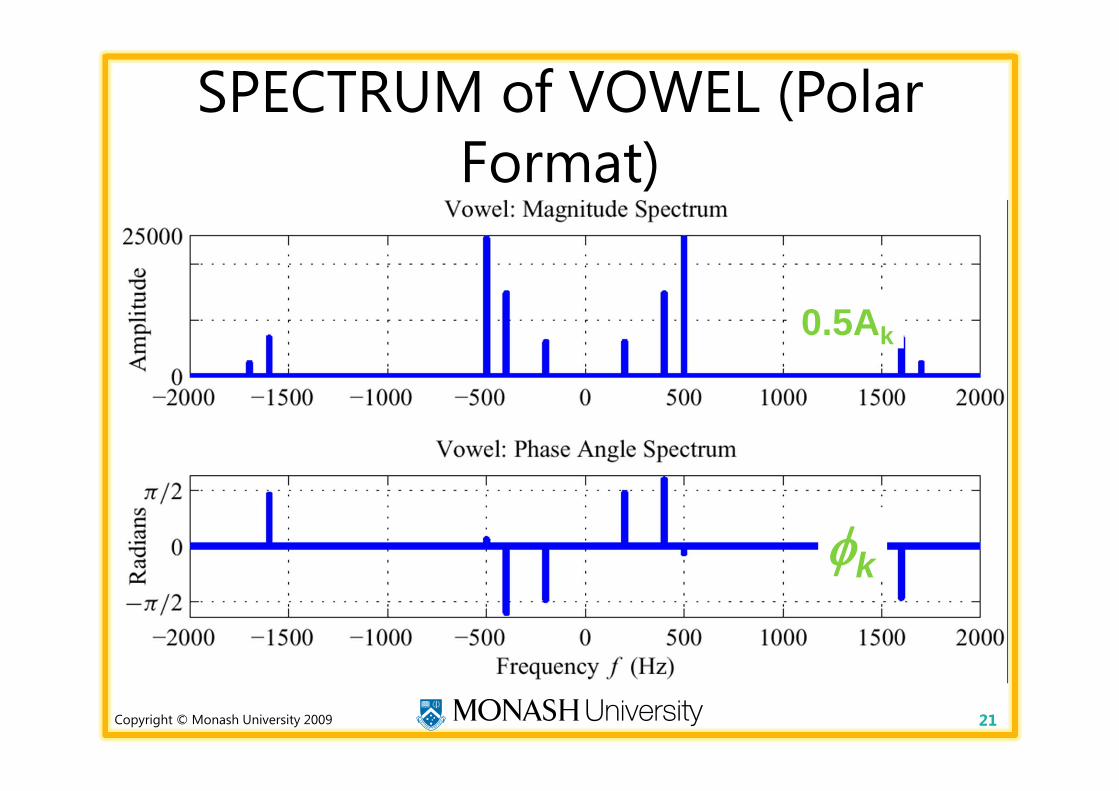
SPECTRUM of VOWEL– Note: Spectrum has 0.5Xk (except XDC)– Conjugates in negative frequency
20
Copyright © Monash University 2009
SPECTRUM of VOWEL (Polar Format)
21
k
0.5Ak
Copyright © Monash University 2009
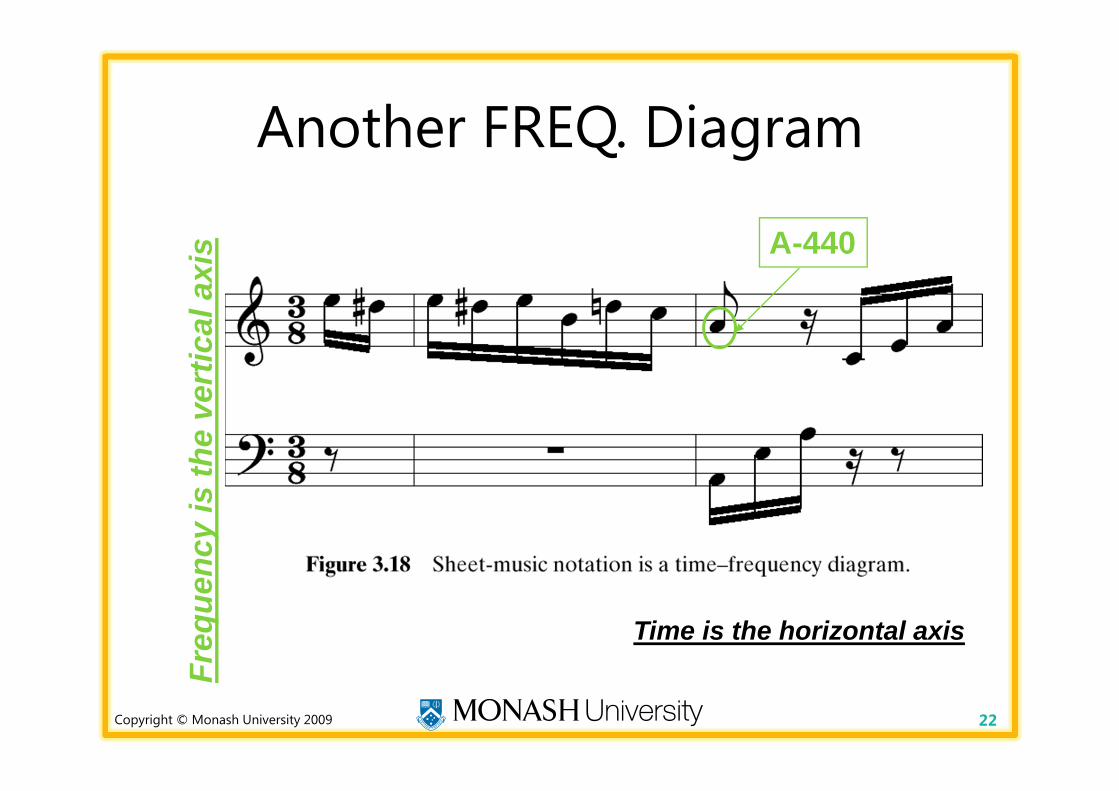
Another FREQ. Diagram
22
Freq
uenc
y is
the
vert
ical
axi
s
Time is the horizontal axis
A-440
Copyright © Monash University 2009
Synthesize Complicated Signals
• Synthesize Complicated Signals– Musical Notes
• Piano uses 3 strings for many notes• Chords: play several notes simultaneously
– Human Speech• Vowels have dominant frequencies• Application: computer generated speech
– Can all signals be generated this way?• Sum of sinusoids?
23
Copyright © Monash University 2009
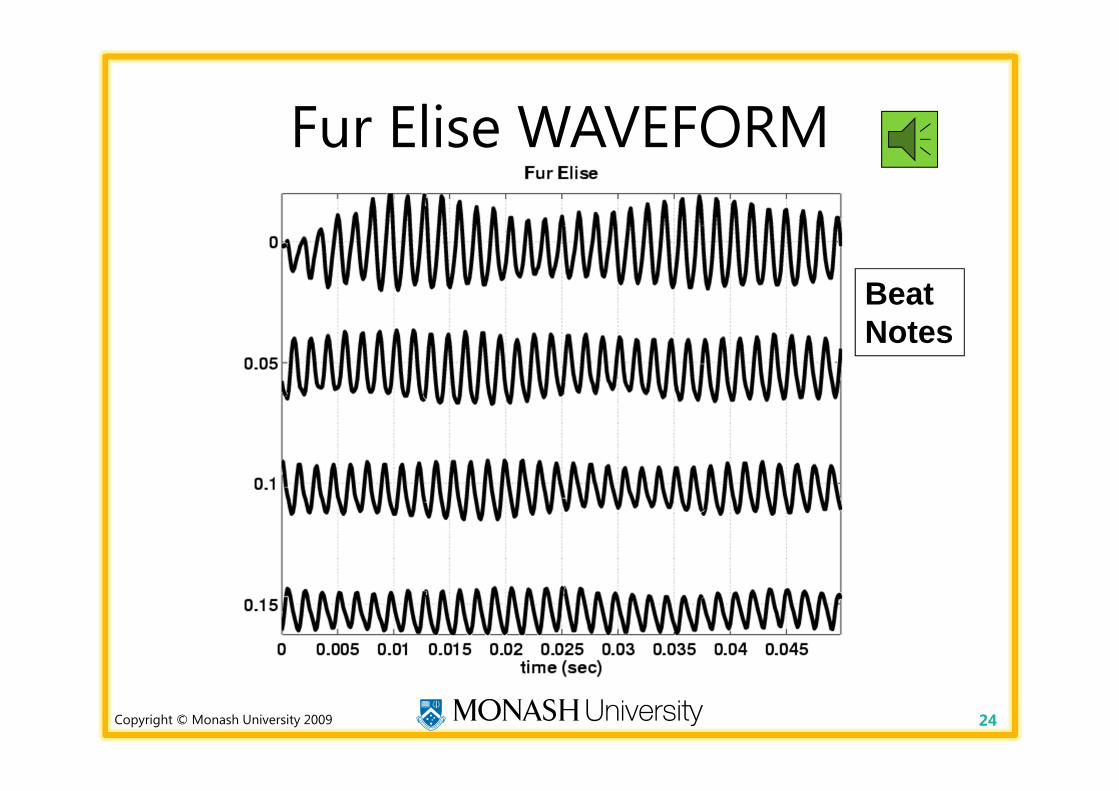
Fur Elise WAVEFORM
24
BeatNotes
Copyright © Monash University 2009
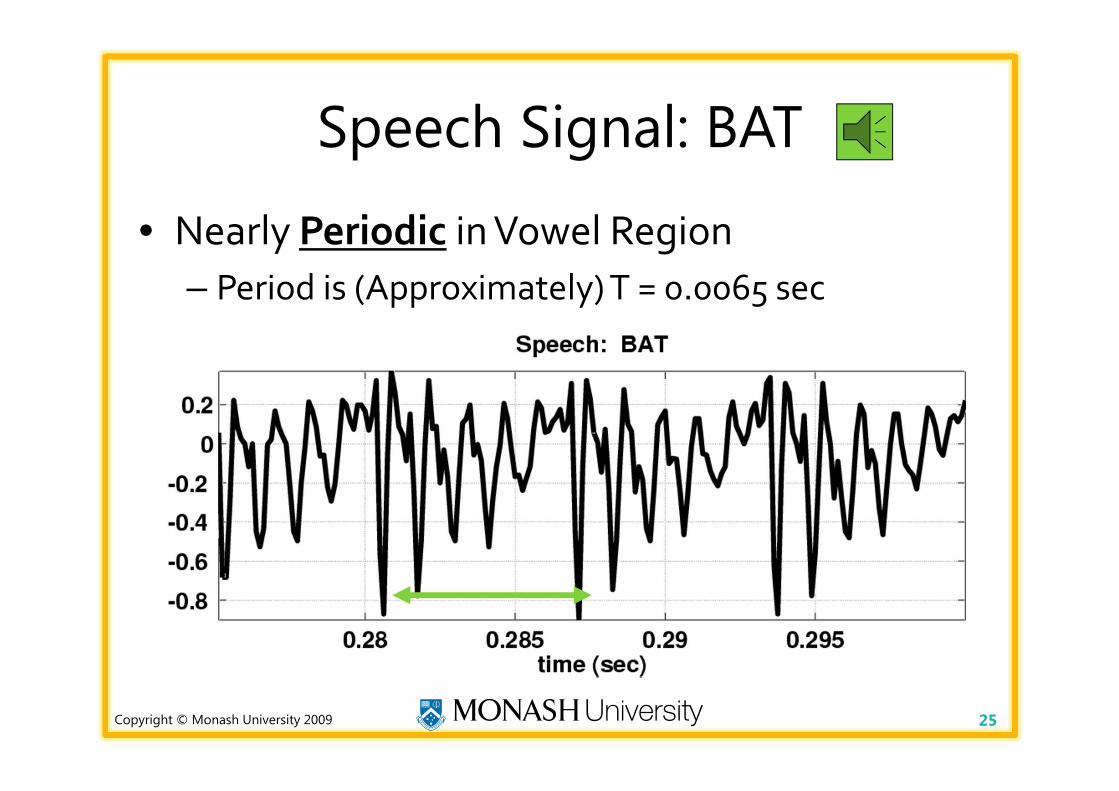
Speech Signal: BAT
• Nearly Periodic in Vowel Region– Period is (Approximately) T = 0.0065 sec
25


