Spill Related Properties of IF0380 Fuel Oil for Minerals Management Service 381 Elden Street Herndon, VA by SL Ross Environmental Research Ltd. September 2004 Table of Contents I. Introduction .................................................................................................................................. I 2. Physical Property Tests: Methods and Results ............................................................................ 1 2.1 Results ................................................................................................................................... 2 2.1.1 Evaporation ....................................................................................................................... 2 2.1.2 Density ............................................................................................................................... 5 2.1.3 Viscosity ............................................................................................................................ 5 2.1.4 Interfacial Tension ............................................................................................................. 6 2.1.4 Pour Point .......................................................................................................................... 6 2.1.5 Flash Point ......................................................................................................................... 6 2.1.6 Emulsification Tendency and Stability ............................................................................. 6 4. References .................................................................................................................................... 6 Appendix A. Oil Property Test Methodology and Relationship to Spill Behavior ......................... ? Appendix B. Oil Property Analysis Results for IF0380 Fuel Oil ................................................. 11
Transcript
Spill Related Properties of IF0380 Fuel Oil
for
Minerals Management Service 381 Elden Street
Herndon VA
by
SL Ross Environmental Research Ltd
September 2004
Table of Contents I Introduction I 2 Physical Property Tests Methods and Results 1
21 Results 2 211 Evaporation 2 212 Density 5 213 Viscosity 5 214 Interfacial Tension 6 214 Pour Point 6 215 Flash Point 6 216 Emulsification Tendency and Stability 6
4 References 6 Appendix A Oil Property Test Methodology and Relationship to Spill Behavior Appendix B Oil Property Analysis Results for IF0380 Fuel Oil 11
1 INTRODUCTION
When oil is spilled in the marine environment its physical and chemical properties will change over time through the processes of evaporation and emulsification These changes will affect both the fate and behavior of the spill and the opportunities for using countermeasures effectively For example an oil may be relatively fluid and non-viscous when initially spilled but may become viscous within a short time It is important to know whether this will happen and how long it will take defining the so-called Window of Opportunity for countermeasures
The objective of this study was to complete simulated oil spill weathering experiments on IF0380 Fuel oil The quantitative results of the tests (involving both fresh and weathered oil) can be used as input to most oil spill models that are used internationally to predict the fate and behavior of spills of specific oils
2 PHYSICAL PROPERTY TESTS METHODS AND RESULTS
The laboratory testing described used approximately 3 liters of the fuel oil The oil was subjected to the analyses outlined in Table 2-1 Test temperatures of 15degC and 25degC were used in the analyses
A discussion of the methodology of each of these tests is presented in Appendix A along with an explanation of the effect that each oil property has on spill behavior
The results of the weathering and analyses of the fuel oil are presented separately in the following section Complete test results can be found in Appendix B
Table 2-1 Test Procedures for Spill-Related Analysis of IF0380 Fuel Oil Property Test
Temperature(s) Equipment Procedure
Evaporation 25 Wind Tunnel and ASTM Distillation Aooaratus ASTM D86-90
Density 15 to 25 Anton Paar Densitometer ASTM D4052-9 I
Viscosity 15 to 25 Brookfield Viscometer ASTM D2983-87
Interfacial Tension 25 CSC DuNouy Ring Tensiometer
ASTM D97 I-82
Pour Point NIA ASTM Test Jars and Thermometers
ASTM D97-87
Flash Point NIA Pensky-Martens Closed Cup Flash Tester
ASTM D93-90
Emulsion Formation-Tendency and Stability
15 Rotating Flask Apparatus (Mackay and Zagorski 1982)
-]shy
21 RESULTS
The results of the property analyses on IF0380 are summarized in Table 2-2 The complete test results can be found in Appendix B The two levels of evaporation noted in the table represent the amounts evaporated from a two cm-thick slick in the wind tunnel after two days and two weeks of continuous airflow respectively
211 Evaporation
IF0380 Fuel Oil is dense black and viscous Approximately 07 of the oil by volume evaporated after two days in the wind tunnel and about 33 evaporated after two weeks of exposure
Figure 2-1 is a predicted evaporation curve for a spill involving a I-mm thick slick in a I 0 knot wind at 25degC Please note that the curve only applies at a water temperature of 25degC If other temperatures (or slick thicknesses and wind speeds) are of interest these curves can be generated using the equations in Appendix A and data in Appendix B 1bull Computerized oil spill models automatically do these calculations
Figure 2-1 Evaporation of IF0380
00600
c 0 +
Ca C 00400u u -
Clgt ~ E amp_ 2 Ca 0 gt 00200 ~w Water Terrp (degC ) 25 gt Wind Speed (knots) 10
LL Thickness (mm) 1
00000
0 24 48 72 96 120 144 168 192 216 240
Elapsed Time (hr)
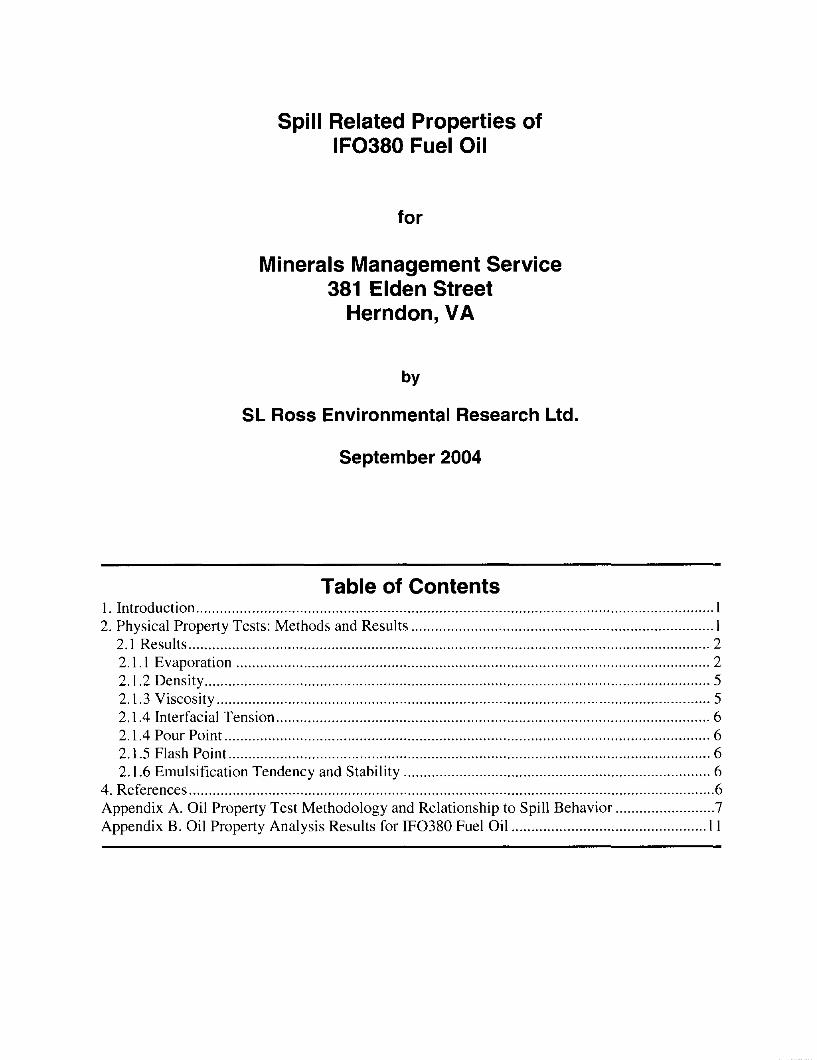
1 The evaporation curve of the oil in the wind tunnel is shown in Appendix B plotting the volume fraction of oil evaporated Fv on the y-axis versus evaporative exposure 8 on the x-axis where 8 is the unit of time expressed in dimensionless form Equations described in Appendix A and data in Table 2-2 of Appendix B can be used to convert this curve into a more usable form for estimating oil evaporation under various spill conditions of temperature elapsed time and wind speed
-2shy
T a bl e 2 2 S pl middot11 -R e I ate d P ropert1es o f IF0380 F ueI 0-1I -Evaporation (Volume) 066 330
Emulsion Formation-Tendency and Stability 139 degC Tendency Index Not likely Not likely Not likely Stability Index Unstable Unstable Unstable Water Content 0 0 0
ASTM Modified Distillation Liquid Vapour
Evaporation Temperature Temperature (volume) (degC) (degC)
Figures 2-2 2-3 and 2-4 show the effect of evaporation on the properties of oil viscosity density and pour point
Figure 2-2 Effect of Evaporation on Oil Viscosity
100000 -shyI
~ Ill middot- UgtIll
8~ $ ~ ~ 10000 middote gtlt ca e c c gt- c C ca
ca shy1000
0 05 3 35
~middot
_---------i----------Egt Qi ------(~ - -~ ~ - ---
Lu
i
n
I I I
1 15 2 25
Percent Loss to Evaporation (volume)
ii
[ o Viscosity 15degC o Viscosity 25degC
Figure 2-3 Effect of Evaporation on Oil Density
Percent Loss to Evaporation (volume)
-4shy
---- ----
Figure 2-4 Effect of Evaporation on Pour Point
10
-- -ltZgt
-0-shy0shy --ltIgt- -- -o-shy
c 0 5 a _ I 0 a
I0
0 1 2 3 4
Percent Loss to Evaporation (volume)
212 Density
IF0380 is a dense black viscous oil with a density of 0979 gcm3 at I 5degC (API gravity of 13deg)
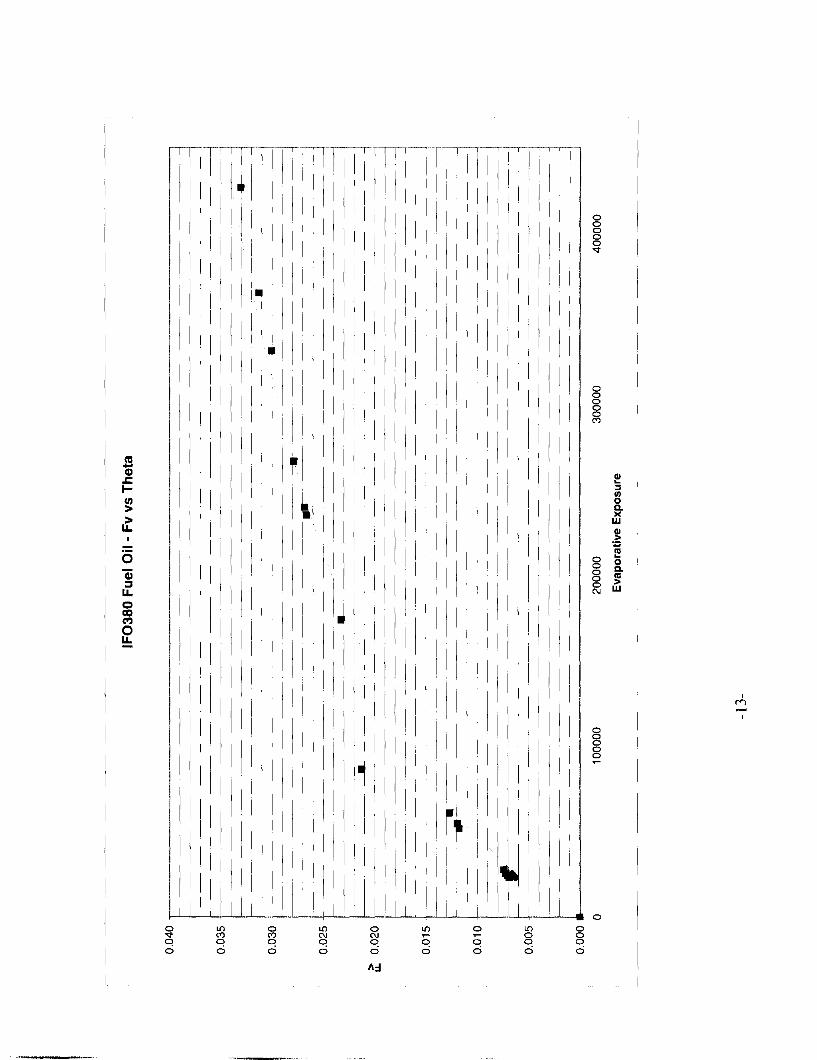
213 Viscosity
At I 5degC the viscosity of the fresh IFO 380 is about 9400 cP (mPas) The viscosity increases to I 0890 cP after 0 7 evaporation and to 13980 cP after 33 evaporation
Note The viscosity of this fuel oil was measured by SL Ross and MAR in October of 2003 In both cases the viscosity of the fresh IFO 380 was measured to be about 7200 cP at I 6degC which is considerably lower than the viscosity measured in this study (9400 cP at 15degC or 8300 cP at I 6degC) The following is provided as a possible explanation for the differences in measured viscosities The standard method for viscosity measurement calls for the sample to be heated in a sealed container to 45degC prior to the measurement to ensure that all waxes and other components are uniformly incorporated in the sample This step was followed for all viscosity measurements in this study When a small sample of this fuel oil is heated a small amount of the diluent agent used to blend the fuel oil to meet its viscosity specification evaporates from the sample Since only small amounts of these diluents are used in these fuel oil blends the loss of even a small fraction of them may change the viscosity of the oil significantly We feel that this is the most likely reason for the higher viscosities measured for the fresh fuel oil in this study when compared to previous measurements
-5shy
214 lnterfacial Tension
The oilwater interfacial tension of IFO 380 Fuel Oil measured against standard laboratory water with 35 ppt of salt was 221 dynescm
214 Pour Point
IF0380 fuel oil has a pour point of 6degC when fresh This remains the same at 0 7 percent evaporation and goes to 9degC at 33 percent evaporation
215 Flash Point
The flash point of IF0380 is 90degC when fresh and rises to 95degC after 33 evaporation
216 Emulsification Tendency and Stability
From the viewpoint of spill countermeasures and slick persistence emulsification is a very negative process because strongly emulsified oils are highly viscous - they can have ten to 100 times the viscosity of the parent oil It is general believed that oils that have relatively high concentrations of asphaltenes are the most likely to form stable water-in-oil emulsions Some oil spills do not form emulsion immediately but once evaporation occurs and the asphaltene concentration increases the emulsification process begins and usually proceeds quickly thereafter
Based on the laboratory tests fresh and weathered IF0380 oil has a very weak tendency to form stable water-in oil emulsions when mixed with seawater While this heavy fuel oil likely has significant concentrations of asphaltenes the oils high viscosity is likely preventing the formation of water-in-oil emulsions
4REFERENCES
Mackay D W Stiver and PA Tebeau 1983 Testing of crude oils and petroleum products for environmental purposes In Proceedings of the 1983 Oil Spill Conference American Petroleum Institute Washington DC pp 331-337
Mackay D and W Zagorski 1982 Water in oil emulsions a stability hypothesis in Proceedings of the 5th Arctic and Marine Oilspill Program Technical Seminar Environment Canada Ottawa ON pp 61-74
-6shy
APPENDIX A OIL PROPERTY TEST METHODOLOGY AND RELATIONSHIP TO SPILL BEHAVIOR
A1 Evaporation
Evaporation is one of the most significant processes that affects an oil when it is spilled Evaporation removes the volatile light hydrocarbons from the oil and leaves behind the heavier fractions
A wind tunnel was used to determine the evaporative characteristics of selected oils and to prepare weathered samples for physical property analysis Three 900-mL samples of oil were withdrawn from the shipping container One of these was reserved while the remaining two were poured into shallow metal trays and placed in a wind tunnel operating at a wind speed of approximately 3 mis and an air temperature of approximately 20degC The initial thickness of oil in the trays was 20 cm One sample was removed from the tunnel after two days and the second after two weeks Depending on the conditions at a spill site these durations are typically equivalent to three or four hours and about one day at sea respectively
The fresh oil and the weathered samples were then analyzed for the selected physical properties according to the procedures listed in Tables 2-1 in the main text In addition the fresh oil was subjected to a modified ASTM distillation (ASTM 086-90 modified in that both liquid and vapor temperature were measured) in order to obtain two oil-specific constants for evaporation prediction purposes The distillation information was used in conjunction with the wind tunnel data to predict evaporation rates for oil spills at sea
While in the wind tunnel the mass of oil remaining in the trays was measured and recorded regularly - hourly during the initial rapid evaporation phase reducing to daily after the two-day sample was removed The elapsed time at each measurement the initial thickness of oil in the tray and the wind tunnel conditions were used to determine the evaporative exposure (Mackay et al 1983) according to
(I)
Where e is evaporative exposure K is the mass transfer coefficient (mis) t is elapsed time (s) x0 is initial slick thickness (m)
Evaporative exposure provides a means of correlating the rate of evaporation of an oil under the conditions in the wind tunnel (ie slick thickness and wind speed) to other environmental conditions at a spill site The wind tunnel mass transfer coefficient K from equation I was determined by calibrating the wind tunnel with a tray of pure toluene during use For a spill situation the mass transfer coefficient can be estimated from
K = 00015U 078 (2) Where U is wind speed [mis]
x
-7shy
For spills at sea it is difficult to obtain a slick thickness As such an average initial thickness defined as the volume spilled divided by the area of the slick is substituted for x0 in equation 2 A plot of volume fraction evaporated versus evaporative exposure was prepared for both crude oils using the data from the wind tunnel Included in the plots was the evaporation predicted by the Mackay equation under the conditions in the wind tunnel The equation is given at the bottom of table 3-1 and is of the form
Fv =In[ +eexp(C2 -JJ (3)
c1 T
is volume fraction evaporated are oil-specific constants is environmental temperature (K)
Where
The constants C C2 and C3 were calculated from the wind tunnel evaporation data and from the ASTM distillation curve of the fresh oil The slope and intercept of the distillation curve are used as a measure of the oils volatility which allows evaporation rates at temperatures other than that in the wind tunnel to be predicted Equations I 2 and 3 can be used to estimate oil evaporation under various spill conditions of temperature elapsed time and wind speed
A2 Density
Density the mass per unit volume of the oil (or emulsion) determines how buoyant an oil is in water The common unit of density is grams per cubic centimeter (gcm3) The density of an oil increases with weathering and decreases with increasing temperature Density affects the following processes
bull sinking - if the density of the oil exceeds that of the water it will sink bull spreading - in the early stages of a spill more dense oils spread faster bull natural dispersion - more dense oils disperse more easily and bull emulsification stability - dense oils form more stable emulsions
A3 Viscosity
Viscosity is a measure of the resistance of an oil to flowing once it is in motion The common unit of viscosity is the centiPoise (cP) the SI unit is the milliPascal second (mPamiddots) which is numerically equivalent to the centiPoise The viscosity of an oil increases as weathering progresses and decreases with increasing temperature Viscosity is one of the most important properties from the perspective of spill behavior and affects the following processes
bull spreading - viscous oils spread more slowly bull natural and chemical dispersion - highly viscous oils are difficult to disperse
-8shy
bull emulsification tendency and stability - viscous oils form more stable emulsions and bull recovery and transfer operations - more viscous oils are generally harder to skim and
more difficult to pump
A4 lnterfacial Tension
Interfacial tension is a measure of the surface forces that exist between the interfaces of the oil and water and the oil and air Chemical dispersants work by reducing the oilwater interfacial tension to allow a given mixing energy (ie sea state) to produce smaller oil droplets Interfacial tensions (oilair and oilwater) are insensitive to temperature but are affected by evaporation Interfacial tension affects the following processes
bull spreading - interfacial tensions determine how fast an oil will spread and whether the oil will form a sheen
bull natural and chemical dispersion - oils with high interfacial tensions are more difficult to disperse
bull emulsification rates and stability and bull mechanical recovery - oleophilic skimmers (eg rope-mop and belt skimmers) work best
on oils with moderate to high interfacial tensions
A5 Pour Point
The pour point is the lowest temperature (to the nearest multiple of 3degC) at which an oil will still flow Below this temperature the oil develops an internal yield stress and in essence solidifies The pour point of an oil increases with weathering Pour point affects the following processes
bull spreading - oils at temperatures below their pour points will not spread bull viscosity - an oils viscosity increases dramatically at temperatures below its pour point bull dispersion - an oil below its pour point is more difficult to disperse and bull recovery transfer and storage - an oil below its pour point will resist flowing towards
skimmers or down inclined surfaces in skimmers and presents storage and transfer problems
A6 Flash Point
The flash point of an oil is the temperature (in degC) at which the oil produces sufficient vapors to ignite when exposed to an open flame or other ignition source Flash point increases with increasing evaporation It is an important safety-related spill property
A7 Emulsion Formation-Tendency and Stability
A water-in-oil emulsion (colloquially named chocolate mousse) is a stable emulsion of small droplets of water incorporated in oil Oil spills on a water surface may form stable water-in-oil emulsions which can have very different characteristics than the parent oil
-9shy
The tendency of an oil to form water-in-oil emulsions (or mousse) and the stability of the emulsion formed are measured by two indices the Emulsification Tendency Index and the Emulsion Stability Index The Emulsion Formation-Tendency Index can have a value of low indicating that the oil will not form an emulsion or high indicating that the oil will form an emulsion The Emulsion Stability Index can be low which indicates the emulsion is unstable and will break quickly once it is removed from the mixing environment moderate which means the emulsion will break within a few hours and high which means the oil forms a very stable emulsion that is unlikely to break even after standing for 24 hours
Both the Tendency Index and Stability Index generally increase with increased degree of evaporation Colder temperatures generally increase both the Tendency Index and Stability Index (ie promote emulsification) Emulsion formation results in large increases in the spills volume enormous viscosity increases (which can reduce dispersant effectiveness) and increased water content
The test procedure for emulsion tendency and stability follows the method now called the Mackay and Zagorski Test (Mackay I 982a Mackay 1984 ) Three hundred milliliters of artificial seawater and 30 mL of oil are placed in a 500 mL Fleaker (oil to water ratio of I 10) and the Fleaker is sealed The Fleaker is rotated for one hour at a rotation speed of 65 rpm and then allowed to settle for 30 minutes The fraction of oil that forms an emulsion f is determined by measuring the height of the emulsion and the height of the unemulsified oil Three additional mixingsettling cycles are performed with measurements off taken at each rotation interval The tendency of an oil to form an emulsion is given by fnitial which is obtained by plotting f versus time and by extrapolating f to time zero
The following criteria are used to classify the tendency of an oil to form a stable emulsion
Range of finitial Emulsion Formation Tendency
00 to 025 Not likely
025 to 075 Fairly likely
075 to 10 Very likely
The stability of a water-in-oil emulsion is obtained by allowing the emulsion to settle for an additional 24 hours and then measuring the fraction of oil in the emulsion (frmai) visually The stability of the water-in-oil emulsion is classified as follows
Range of frnal Emulsion Stability
00 to 025 Unstable
025 to 075 Fairly stable
075 to 10 Very Stable
The calculated water content of stable water-in-oil emulsions is also provided
-10shy
APPENDIX 8 OIL PROPERTY ANALYSIS RESULTS FOR IF0380 FUEL OIL
IF0380 Fuel Oil Modelinq Inputs 2 Dav I 2 Week I Averaoe Air Temp I (Volume Weathered( ml) I 9001 T 29821K TemoldegCl 25 Travx I Travv I oc I I I Volume for 2cm thick I 900 Kl 00052641 ms Wind Soeed (knots 10 1885 I 1879 I 282 I I I Tray thickness (m)I 002 xi 0001 Im Thickness (mm) 1
Automated Mass of Oil + Tray Mass of Oil Fm Oil Fv Evaporative Model Model Elaosed Evaoorative Model Travx Travv Travx Travv Trav x Travv Densitv Trav x Travv Exoosure Evaoorate Evaoorate Time2 Exoosure 2 Evaooration 2
(q) la In (q) (gcm 3 (Corrected) (Fv) (Fv (hr) (Fv)
When oil is spilled in the marine environment its physical and chemical properties will change over time through the processes of evaporation and emulsification These changes will affect both the fate and behavior of the spill and the opportunities for using countermeasures effectively For example an oil may be relatively fluid and non-viscous when initially spilled but may become viscous within a short time It is important to know whether this will happen and how long it will take defining the so-called Window of Opportunity for countermeasures
The objective of this study was to complete simulated oil spill weathering experiments on IF0380 Fuel oil The quantitative results of the tests (involving both fresh and weathered oil) can be used as input to most oil spill models that are used internationally to predict the fate and behavior of spills of specific oils
2 PHYSICAL PROPERTY TESTS METHODS AND RESULTS
The laboratory testing described used approximately 3 liters of the fuel oil The oil was subjected to the analyses outlined in Table 2-1 Test temperatures of 15degC and 25degC were used in the analyses
A discussion of the methodology of each of these tests is presented in Appendix A along with an explanation of the effect that each oil property has on spill behavior
The results of the weathering and analyses of the fuel oil are presented separately in the following section Complete test results can be found in Appendix B
Table 2-1 Test Procedures for Spill-Related Analysis of IF0380 Fuel Oil Property Test
Temperature(s) Equipment Procedure
Evaporation 25 Wind Tunnel and ASTM Distillation Aooaratus ASTM D86-90
Density 15 to 25 Anton Paar Densitometer ASTM D4052-9 I
Viscosity 15 to 25 Brookfield Viscometer ASTM D2983-87
Interfacial Tension 25 CSC DuNouy Ring Tensiometer
ASTM D97 I-82
Pour Point NIA ASTM Test Jars and Thermometers
ASTM D97-87
Flash Point NIA Pensky-Martens Closed Cup Flash Tester
ASTM D93-90
Emulsion Formation-Tendency and Stability
15 Rotating Flask Apparatus (Mackay and Zagorski 1982)
-]shy
21 RESULTS
The results of the property analyses on IF0380 are summarized in Table 2-2 The complete test results can be found in Appendix B The two levels of evaporation noted in the table represent the amounts evaporated from a two cm-thick slick in the wind tunnel after two days and two weeks of continuous airflow respectively
211 Evaporation
IF0380 Fuel Oil is dense black and viscous Approximately 07 of the oil by volume evaporated after two days in the wind tunnel and about 33 evaporated after two weeks of exposure
Figure 2-1 is a predicted evaporation curve for a spill involving a I-mm thick slick in a I 0 knot wind at 25degC Please note that the curve only applies at a water temperature of 25degC If other temperatures (or slick thicknesses and wind speeds) are of interest these curves can be generated using the equations in Appendix A and data in Appendix B 1bull Computerized oil spill models automatically do these calculations
Figure 2-1 Evaporation of IF0380
00600
c 0 +
Ca C 00400u u -
Clgt ~ E amp_ 2 Ca 0 gt 00200 ~w Water Terrp (degC ) 25 gt Wind Speed (knots) 10
LL Thickness (mm) 1
00000
0 24 48 72 96 120 144 168 192 216 240
Elapsed Time (hr)
1 The evaporation curve of the oil in the wind tunnel is shown in Appendix B plotting the volume fraction of oil evaporated Fv on the y-axis versus evaporative exposure 8 on the x-axis where 8 is the unit of time expressed in dimensionless form Equations described in Appendix A and data in Table 2-2 of Appendix B can be used to convert this curve into a more usable form for estimating oil evaporation under various spill conditions of temperature elapsed time and wind speed
-2shy
T a bl e 2 2 S pl middot11 -R e I ate d P ropert1es o f IF0380 F ueI 0-1I -Evaporation (Volume) 066 330
Emulsion Formation-Tendency and Stability 139 degC Tendency Index Not likely Not likely Not likely Stability Index Unstable Unstable Unstable Water Content 0 0 0
ASTM Modified Distillation Liquid Vapour
Evaporation Temperature Temperature (volume) (degC) (degC)
Figures 2-2 2-3 and 2-4 show the effect of evaporation on the properties of oil viscosity density and pour point
Figure 2-2 Effect of Evaporation on Oil Viscosity
100000 -shyI
~ Ill middot- UgtIll
8~ $ ~ ~ 10000 middote gtlt ca e c c gt- c C ca
ca shy1000
0 05 3 35
~middot
_---------i----------Egt Qi ------(~ - -~ ~ - ---
Lu
i
n
I I I
1 15 2 25
Percent Loss to Evaporation (volume)
ii
[ o Viscosity 15degC o Viscosity 25degC
Figure 2-3 Effect of Evaporation on Oil Density
Percent Loss to Evaporation (volume)
-4shy
---- ----
Figure 2-4 Effect of Evaporation on Pour Point
10
-- -ltZgt
-0-shy0shy --ltIgt- -- -o-shy
c 0 5 a _ I 0 a
I0
0 1 2 3 4
Percent Loss to Evaporation (volume)
212 Density
IF0380 is a dense black viscous oil with a density of 0979 gcm3 at I 5degC (API gravity of 13deg)
213 Viscosity
At I 5degC the viscosity of the fresh IFO 380 is about 9400 cP (mPas) The viscosity increases to I 0890 cP after 0 7 evaporation and to 13980 cP after 33 evaporation
Note The viscosity of this fuel oil was measured by SL Ross and MAR in October of 2003 In both cases the viscosity of the fresh IFO 380 was measured to be about 7200 cP at I 6degC which is considerably lower than the viscosity measured in this study (9400 cP at 15degC or 8300 cP at I 6degC) The following is provided as a possible explanation for the differences in measured viscosities The standard method for viscosity measurement calls for the sample to be heated in a sealed container to 45degC prior to the measurement to ensure that all waxes and other components are uniformly incorporated in the sample This step was followed for all viscosity measurements in this study When a small sample of this fuel oil is heated a small amount of the diluent agent used to blend the fuel oil to meet its viscosity specification evaporates from the sample Since only small amounts of these diluents are used in these fuel oil blends the loss of even a small fraction of them may change the viscosity of the oil significantly We feel that this is the most likely reason for the higher viscosities measured for the fresh fuel oil in this study when compared to previous measurements
-5shy
214 lnterfacial Tension
The oilwater interfacial tension of IFO 380 Fuel Oil measured against standard laboratory water with 35 ppt of salt was 221 dynescm
214 Pour Point
IF0380 fuel oil has a pour point of 6degC when fresh This remains the same at 0 7 percent evaporation and goes to 9degC at 33 percent evaporation
215 Flash Point
The flash point of IF0380 is 90degC when fresh and rises to 95degC after 33 evaporation
216 Emulsification Tendency and Stability
From the viewpoint of spill countermeasures and slick persistence emulsification is a very negative process because strongly emulsified oils are highly viscous - they can have ten to 100 times the viscosity of the parent oil It is general believed that oils that have relatively high concentrations of asphaltenes are the most likely to form stable water-in-oil emulsions Some oil spills do not form emulsion immediately but once evaporation occurs and the asphaltene concentration increases the emulsification process begins and usually proceeds quickly thereafter
Based on the laboratory tests fresh and weathered IF0380 oil has a very weak tendency to form stable water-in oil emulsions when mixed with seawater While this heavy fuel oil likely has significant concentrations of asphaltenes the oils high viscosity is likely preventing the formation of water-in-oil emulsions
4REFERENCES
Mackay D W Stiver and PA Tebeau 1983 Testing of crude oils and petroleum products for environmental purposes In Proceedings of the 1983 Oil Spill Conference American Petroleum Institute Washington DC pp 331-337
Mackay D and W Zagorski 1982 Water in oil emulsions a stability hypothesis in Proceedings of the 5th Arctic and Marine Oilspill Program Technical Seminar Environment Canada Ottawa ON pp 61-74
-6shy
APPENDIX A OIL PROPERTY TEST METHODOLOGY AND RELATIONSHIP TO SPILL BEHAVIOR
A1 Evaporation
Evaporation is one of the most significant processes that affects an oil when it is spilled Evaporation removes the volatile light hydrocarbons from the oil and leaves behind the heavier fractions
A wind tunnel was used to determine the evaporative characteristics of selected oils and to prepare weathered samples for physical property analysis Three 900-mL samples of oil were withdrawn from the shipping container One of these was reserved while the remaining two were poured into shallow metal trays and placed in a wind tunnel operating at a wind speed of approximately 3 mis and an air temperature of approximately 20degC The initial thickness of oil in the trays was 20 cm One sample was removed from the tunnel after two days and the second after two weeks Depending on the conditions at a spill site these durations are typically equivalent to three or four hours and about one day at sea respectively
The fresh oil and the weathered samples were then analyzed for the selected physical properties according to the procedures listed in Tables 2-1 in the main text In addition the fresh oil was subjected to a modified ASTM distillation (ASTM 086-90 modified in that both liquid and vapor temperature were measured) in order to obtain two oil-specific constants for evaporation prediction purposes The distillation information was used in conjunction with the wind tunnel data to predict evaporation rates for oil spills at sea
While in the wind tunnel the mass of oil remaining in the trays was measured and recorded regularly - hourly during the initial rapid evaporation phase reducing to daily after the two-day sample was removed The elapsed time at each measurement the initial thickness of oil in the tray and the wind tunnel conditions were used to determine the evaporative exposure (Mackay et al 1983) according to
(I)
Where e is evaporative exposure K is the mass transfer coefficient (mis) t is elapsed time (s) x0 is initial slick thickness (m)
Evaporative exposure provides a means of correlating the rate of evaporation of an oil under the conditions in the wind tunnel (ie slick thickness and wind speed) to other environmental conditions at a spill site The wind tunnel mass transfer coefficient K from equation I was determined by calibrating the wind tunnel with a tray of pure toluene during use For a spill situation the mass transfer coefficient can be estimated from
K = 00015U 078 (2) Where U is wind speed [mis]
x
-7shy
For spills at sea it is difficult to obtain a slick thickness As such an average initial thickness defined as the volume spilled divided by the area of the slick is substituted for x0 in equation 2 A plot of volume fraction evaporated versus evaporative exposure was prepared for both crude oils using the data from the wind tunnel Included in the plots was the evaporation predicted by the Mackay equation under the conditions in the wind tunnel The equation is given at the bottom of table 3-1 and is of the form
Fv =In[ +eexp(C2 -JJ (3)
c1 T
is volume fraction evaporated are oil-specific constants is environmental temperature (K)
Where
The constants C C2 and C3 were calculated from the wind tunnel evaporation data and from the ASTM distillation curve of the fresh oil The slope and intercept of the distillation curve are used as a measure of the oils volatility which allows evaporation rates at temperatures other than that in the wind tunnel to be predicted Equations I 2 and 3 can be used to estimate oil evaporation under various spill conditions of temperature elapsed time and wind speed
A2 Density
Density the mass per unit volume of the oil (or emulsion) determines how buoyant an oil is in water The common unit of density is grams per cubic centimeter (gcm3) The density of an oil increases with weathering and decreases with increasing temperature Density affects the following processes
bull sinking - if the density of the oil exceeds that of the water it will sink bull spreading - in the early stages of a spill more dense oils spread faster bull natural dispersion - more dense oils disperse more easily and bull emulsification stability - dense oils form more stable emulsions
A3 Viscosity
Viscosity is a measure of the resistance of an oil to flowing once it is in motion The common unit of viscosity is the centiPoise (cP) the SI unit is the milliPascal second (mPamiddots) which is numerically equivalent to the centiPoise The viscosity of an oil increases as weathering progresses and decreases with increasing temperature Viscosity is one of the most important properties from the perspective of spill behavior and affects the following processes
bull spreading - viscous oils spread more slowly bull natural and chemical dispersion - highly viscous oils are difficult to disperse
-8shy
bull emulsification tendency and stability - viscous oils form more stable emulsions and bull recovery and transfer operations - more viscous oils are generally harder to skim and
more difficult to pump
A4 lnterfacial Tension
Interfacial tension is a measure of the surface forces that exist between the interfaces of the oil and water and the oil and air Chemical dispersants work by reducing the oilwater interfacial tension to allow a given mixing energy (ie sea state) to produce smaller oil droplets Interfacial tensions (oilair and oilwater) are insensitive to temperature but are affected by evaporation Interfacial tension affects the following processes
bull spreading - interfacial tensions determine how fast an oil will spread and whether the oil will form a sheen
bull natural and chemical dispersion - oils with high interfacial tensions are more difficult to disperse
bull emulsification rates and stability and bull mechanical recovery - oleophilic skimmers (eg rope-mop and belt skimmers) work best
on oils with moderate to high interfacial tensions
A5 Pour Point
The pour point is the lowest temperature (to the nearest multiple of 3degC) at which an oil will still flow Below this temperature the oil develops an internal yield stress and in essence solidifies The pour point of an oil increases with weathering Pour point affects the following processes
bull spreading - oils at temperatures below their pour points will not spread bull viscosity - an oils viscosity increases dramatically at temperatures below its pour point bull dispersion - an oil below its pour point is more difficult to disperse and bull recovery transfer and storage - an oil below its pour point will resist flowing towards
skimmers or down inclined surfaces in skimmers and presents storage and transfer problems
A6 Flash Point
The flash point of an oil is the temperature (in degC) at which the oil produces sufficient vapors to ignite when exposed to an open flame or other ignition source Flash point increases with increasing evaporation It is an important safety-related spill property
A7 Emulsion Formation-Tendency and Stability
A water-in-oil emulsion (colloquially named chocolate mousse) is a stable emulsion of small droplets of water incorporated in oil Oil spills on a water surface may form stable water-in-oil emulsions which can have very different characteristics than the parent oil
-9shy
The tendency of an oil to form water-in-oil emulsions (or mousse) and the stability of the emulsion formed are measured by two indices the Emulsification Tendency Index and the Emulsion Stability Index The Emulsion Formation-Tendency Index can have a value of low indicating that the oil will not form an emulsion or high indicating that the oil will form an emulsion The Emulsion Stability Index can be low which indicates the emulsion is unstable and will break quickly once it is removed from the mixing environment moderate which means the emulsion will break within a few hours and high which means the oil forms a very stable emulsion that is unlikely to break even after standing for 24 hours
Both the Tendency Index and Stability Index generally increase with increased degree of evaporation Colder temperatures generally increase both the Tendency Index and Stability Index (ie promote emulsification) Emulsion formation results in large increases in the spills volume enormous viscosity increases (which can reduce dispersant effectiveness) and increased water content
The test procedure for emulsion tendency and stability follows the method now called the Mackay and Zagorski Test (Mackay I 982a Mackay 1984 ) Three hundred milliliters of artificial seawater and 30 mL of oil are placed in a 500 mL Fleaker (oil to water ratio of I 10) and the Fleaker is sealed The Fleaker is rotated for one hour at a rotation speed of 65 rpm and then allowed to settle for 30 minutes The fraction of oil that forms an emulsion f is determined by measuring the height of the emulsion and the height of the unemulsified oil Three additional mixingsettling cycles are performed with measurements off taken at each rotation interval The tendency of an oil to form an emulsion is given by fnitial which is obtained by plotting f versus time and by extrapolating f to time zero
The following criteria are used to classify the tendency of an oil to form a stable emulsion
Range of finitial Emulsion Formation Tendency
00 to 025 Not likely
025 to 075 Fairly likely
075 to 10 Very likely
The stability of a water-in-oil emulsion is obtained by allowing the emulsion to settle for an additional 24 hours and then measuring the fraction of oil in the emulsion (frmai) visually The stability of the water-in-oil emulsion is classified as follows
Range of frnal Emulsion Stability
00 to 025 Unstable
025 to 075 Fairly stable
075 to 10 Very Stable
The calculated water content of stable water-in-oil emulsions is also provided
-10shy
APPENDIX 8 OIL PROPERTY ANALYSIS RESULTS FOR IF0380 FUEL OIL
IF0380 Fuel Oil Modelinq Inputs 2 Dav I 2 Week I Averaoe Air Temp I (Volume Weathered( ml) I 9001 T 29821K TemoldegCl 25 Travx I Travv I oc I I I Volume for 2cm thick I 900 Kl 00052641 ms Wind Soeed (knots 10 1885 I 1879 I 282 I I I Tray thickness (m)I 002 xi 0001 Im Thickness (mm) 1
Automated Mass of Oil + Tray Mass of Oil Fm Oil Fv Evaporative Model Model Elaosed Evaoorative Model Travx Travv Travx Travv Trav x Travv Densitv Trav x Travv Exoosure Evaoorate Evaoorate Time2 Exoosure 2 Evaooration 2
(q) la In (q) (gcm 3 (Corrected) (Fv) (Fv (hr) (Fv)