Return on Investment for the Florida Sports Foundation Grants and Related Programs Florida Sports Foundation Grant Program Professional Sports Franchise Incentive Spring Training Baseball Franchise Facility Incentive Professional Golf Hall of Fame Facility Incentive Submitted: January 2021
Transcript
Return on Investment for the Florida Sports Foundation Grants and Related Programs
Florida Sports Foundation Grant Program Professional Sports Franchise Incentive
Spring Training Baseball Franchise Facility Incentive Professional Golf Hall of Fame Facility Incentive
PROGRAM FINDINGS ................................................................................................................................... 10
FLORIDA SPORTS FOUNDATION GRANT PROGRAM ............................................................................... 10
PROFESSIONAL SPORTS FRANCHISE INCENTIVE ..................................................................................... 15
SPRING TRAINING BASEBALL FRANCHISE INCENTIVE ............................................................................. 19
PROFESSIONAL GOLF HALL OF FAME FACILITY INCENTIVE ..................................................................... 22
EXECUTIVE SUMMARY Background and Purpose Legislation enacted in 2013 and revised in 2014 directs the Office of Economic and Demographic Research (EDR) and the Office of Program Policy Analysis and Government Accountability (OPPAGA) to analyze and evaluate specific state economic development incentive programs on a recurring three‐year schedule.1 EDR is required to evaluate the economic benefits of each program, using project data from the most recent three‐year period, and to provide an explanation of the model used in its analysis and the model’s key assumptions. Economic Benefit is defined as “the direct, indirect, and induced gains in state revenues as a percentage of the state’s investment” – which includes “state grants, tax exemptions, tax refunds, tax credits, and other state incentives.”2 EDR’s evaluation also requires identification of jobs created, the increase or decrease in personal income, and the impact on state Gross Domestic Product (GDP) for each program. This is EDR’s third evaluation of sports‐related programs.3 Four programs are addressed by this analysis:
Florida Sports Foundation (FSF) Grant Program;
Professional Sports Franchise Incentive;
Spring Training Baseball Franchise Incentive; and
Professional Golf Hall of Fame Facility Incentive. While other sports‐related programs exist, they are not evaluated in this report.4 The review period
covers Fiscal Years 2016‐17, 2017‐18, and 2018‐19.
Explanation of Return on Investment In this report, the term “Return on Investment” (ROI) is synonymous with economic benefit, and is used in lieu of the statutory term. This measure does not address issues of overall effectiveness or societal benefit; instead, it focuses on tangible financial gains or losses to state revenues, and is ultimately conditioned by the state’s tax policy. The ROI is developed by summing state revenues generated by a program less state expenditures invested in the program, and dividing that calculation by the state’s investment. It is most often used
1Section 288.0001, F.S. As of 2020, twenty programs are specified. 2Section 288.005(1), F.S. 3 The previous reports can be found at EDR’s website: http://edr.state.fl.us/Content/returnoninvestment/ 4 Five additional programs were technically scheduled for review, but are not included. Four of the five have never been evaluated. The first two, the Food and Beverage Concession and Contract Awards to Minority Business Enterprises (s. 288.1167, F.S.) and the Homeless Shelter Designation of Sports Facilities (s. 288.11666, F.S), have not been reviewed because they do not generate distinctive tax revenues for the state that are unique to those programs. The third program, the Motorsports Entertainment Complex, has never been reviewed because it has had no recipients or costs during any of the review periods. The fourth program, Sports Development as enacted in 2014 (s. 4, ch. 2014‐167, L.O.F.; codified in s. 288.11625, F.S.), has not been reviewed because no projects have qualified. While included previously, the fifth program, the International Game Fish Association (IGFA) World Center, received its last payment in February 2014 and is no longer in operation as a Florida facility. Also of note, the Retention of Spring Training Baseball Franchises incentive enacted in 2013 (s. 24, ch. 2013‐42; amended by s. 5, ch. 2014‐167, L.O.F.; and codified in s. 288.11631, F.S.), is not required to be evaluated. This program provides up to $20 million over 20 years to fund single‐franchise facilities, and $50 million over 25 years to fund facilities housing more than one franchise.
2
when a project is to be evaluated strictly on a monetary basis, and externalities and social costs and benefits—to the extent they exist—are excluded from the evaluation. The basic formula is:
(Increase in State Revenue – State Investment) State Investment
Since EDR’s Statewide Model5 is used to develop these computations and to model the induced and indirect effects, EDR is able to simultaneously generate State Revenue and State Investment from the model so all feedback effects mirror reality. The result (a net number) is used in the final ROI calculation. As used by EDR for this analysis, the returns can be categorized as follows:
Greater Than One (>1.0)…the program more than breaks even; the return to the state produces more revenues than the total cost of the incentives.
Equal To One (=1.0)…the program breaks even; the return to the state in additional revenues equals the total cost of the incentives.
Less Than One, But Positive (+, <1)…the program does not break even; however, the state generates enough revenues to recover a portion of its cost for the incentives.
Less Than Zero (‐, <0)…the program does not recover any portion of the incentive cost, and state revenues are less than they would have been in the absence of the program. This typically occurs because taxable activity is shifted to non‐taxable activity.
The numerical ROI can be interpreted as return in tax revenues for each dollar spent by the state. For example, an ROI of 2.5 would mean that $2.50 in tax revenues is received back from each dollar spent by the state. The basic formula for ROI is always calculated in the same manner, but the inputs used in the calculation can differ depending on the needs of the investor. Florida law requires the return to be measured from the state’s perspective as the investor, in the form of state tax revenues. In this regard, the ROI is ultimately shaped by the state’s tax code. Overall Results and Conclusions As the graph below shows, the ROI for the various sports‐related programs ranged from 4.27 to 0.15. The only program with a ROI of greater than one was the Florida Sports Foundation (FSF) Grant Program. [See Table below.] There are a number of distinguishing traits between the FSF Grant Program and the other programs that account for this difference.
Program 2020 ROI
2018 ROI
2015 ROI
FSF Grant Program 4.27 4.77 4.72*
Professional Sports Incentive 0.75 0.32 0.30
Spring Training Incentive 0.54 0.22 0.11
Golf Hall of Fame Incentive 0.15 0.12 ‐0.08 *Formerly reported as 5.61; revised to 4.72 after applying new methodology to the prior inputs.
5 See the Methodology section for more details.
3
First, FSF grants fund sporting events rather than finance facilities, and the grants are relatively small in comparison to the facility subsidies. The average FSF grant award within the review period was approximately $24,000, with an estimated 656,666 out‐of‐state visitors attributed to the subsidized sporting events held during the three affected years. While events held in facilities funded by the Professional Sports Franchise Incentive brought in a larger number of out‐of‐state visitors, the higher costs of that program adversely impacted its ROI. As an example, the latest professional sports arena built in Florida cost upwards of $450 million, and the state incentive committed $2 million a year for the next 30 years to help subsidize its construction cost. In total, the incentives cost $16 million per year. In contrast, the FSF grant program spent approximately $9 million for all three fiscal years in the review period. The lower awards of FSF compared to the other programs is a significant factor in its higher ROI. Second, events funded through the FSF program attract more out‐of‐state participants and visitors than in‐state participants and visitors by design. The FSF grant program was one of two programs in the review period to have more out‐of‐state visitors than in‐state visitors. This contributed to its higher ROI. The other is the Golf Hall of Fame, where perhaps 70 percent of visitors are from out‐of‐state.6 The Professional Sports Franchise Incentive has a much smaller percentage—13.9 percent was used in this analysis. Third, the FSF grant program funds single sporting events that will occur in the near future. This allows the FSF to more accurately estimate the economic impact of these sporting events, as well as to adjust the grant amount accordingly. For the other incentive programs, the state commits itself for 10, 15 or 30 years. This is problematic, because the long‐term economic impacts of these sport teams or museums are far from clear when the initial evaluation is made. Additional details are provided in the remainder of the report.
6 The ROI did not take into account any intangible benefits associated with these programs, which may include an increase in community pride and media exposure of Florida areas from televised sporting events.
4
METHODOLOGY Statewide Model EDR is tasked with evaluating the economic benefits of economic development incentive programs. Economic Benefit is defined as “the direct, indirect, and induced gains in state revenues as a percentage of the state’s investment” – which includes “state grants, tax exemptions, tax refunds, tax credits, and other state incentives.”7 This measure does not address issues of overall effectiveness or societal benefit; instead, it focuses on tangible financial gains or losses to state revenues, and is ultimately conditioned by the state’s tax policy. EDR used the Statewide Model to estimate the Return on Investment for the programs under review. The Statewide Model is a dynamic computable general equilibrium (CGE) model that simulates Florida’s economy and government finances.8 The Statewide Model is enhanced and adjusted each year to reliably and accurately model Florida’s economy. These enhancements include updating the base year the model uses as well as adjustments to how the model estimates tax collections and distributions.9 Among other things, the Statewide Model captures the indirect and induced economic activity resulting from the direct program effects. This is accomplished by using large amounts of data specific to the Florida economy and fiscal structure. Mathematical equations10 are used to account for the relationships (linkages and interactions) between the various economic agents, as well as likely responses by businesses and households to changes in the economy.11 The model also has the ability to estimate the impact of economic changes on state revenue collections and state expenditures in order to maintain a balanced budget by fiscal year. When using the Statewide Model to evaluate economic programs, the model is “shocked”12 using static analysis estimates of the initial or direct effects attributable to the projects funded by the incentives. In this analysis, direct effects are essentially the changes experienced by the businesses receiving the grants. Generally, the combined annual direct effects (“shocks”) took the form of:
Removal of the incentive payments from the state budget, with a corresponding award to businesses as subsidies to production.
Capital investments related to the program.
Increased demand based on out‐of‐state visitor expenditures.
7 Section 288.0001, F.S., as created by s. 1, ch. 2013‐39, Laws of Florida, and s. 1, ch. 2013‐42, Laws of Florida. 8 The statewide economic model was developed using GEMPACK software with the assistance of the Centre of Policy Studies (CoPS) at Victoria University (Melbourne, Australia). 9 Reports prior to January 1, 2017 have 2009 as the base year. Reports as of January 1, 2017 have 2011 as the base year. 10 These equations represent the behavioral responses to economic stimuli to changes in economic variables. 11 The business reactions simulate the supply‐side responses to the new activity (e.g., changes in investment and labor demand). 12 In economics, a shock typically refers to an unexpected or unpredictable event that affects the economy, either positive or negative. In this regard, a shock refers to some action that affects the current equilibrium or baseline path of the economy. It can be something that affects demand, such as a shift in the export demand equation; or, it could be something that affects the price of a commodity or factor of production, such as a change in tax rates. In the current analyses, a counter‐factual shock is introduced to remove the impact of the incentives on the economy.
5
After the direct effects are developed and estimated, the model is then used to estimate the additional—indirect and induced—economic effects generated by the programs, as well as the supply‐side responses to the new activity, where the supply‐side responses are changes in investment and the demand for labor arising from the new activity. Indirect effects are the changes in employment, income, and output by local supplier industries that provide goods and services to support the direct economic activity. Induced effects are the changes in spending by households whose income is affected by the direct and indirect activity. All of these effects can be measured by changes (relative to the baseline) in the following outcomes:
State government revenues and expenditures
Jobs
Personal income
Florida Gross Domestic Product
Gross output
Household consumption
Investment
Population EDR’s calculation of the Return on Investment (ROI) used the model’s estimate of net state revenues and expenditures. Other required measures for this report include the number of jobs created, the increase or decrease in personal income, and the impact on gross state product, all of which are included in the model results. As with previous evaluations, EDR’s calculation of ROI is based on the net economic impact rather than the gross economic activity generated by or attributed to program projects. The impact is due to new economic activity induced by a state subsidy after taking account of what would have occurred in the absence of this particular investment. EDR employs a number of approaches to isolate the new economic activity, including an assessment of the “but‐for” assertion and accounting for any “Substitution Effect” on consumer spending induced by incentives or investments. Incentive proponents assert that “but for” economic incentives, new business activities would not have otherwise occurred – in effect, the incentive is the primary or the determining factor in those business decisions. Similarly, some site selection and economic development professionals believe that incentives tip the scales between competing sites when all other factors are relatively equal. EDR’s analysis of the four programs under review generally assumes that state incentives were the determining factor in the location decision of the sports program, sporting event, or museum, provided the program was designed to attract or retain sports‐related activity to the state. Regarding the Substitution Effect, there is consensus among economists that the only tangible economic benefits to the area economy from subsidies for professional and amateur sporting events, or a unique sports‐destination facility, are the result of new spending associated with the events.13 This new spending is primarily by visitors from out‐of‐area, to the extent that such spending would not have otherwise occurred absent attending the event; however, it can also include capital expenditures.
13 For a discussion of these issues, see Appendix Two: Assessing the Economic Benefits of Public Subsidies for Professional Sports Facilities: A Literature Review, in “Return on Investment for The Florida Sports Foundation Grants and Related Programs, January 1, 2015: http://edr.state.fl.us/Content/returnoninvestment/SportsGrantsandPrograms.pdf
6
New spending specifically excludes “substitute” spending by in‐area residents and “casual visitors” or “time‐switchers” whose primary purpose for visiting is unrelated to the event. In these cases, the same amount would have been spent elsewhere, and the spending related to the sports event is simply redirected from what would have occurred absent the event. This “substitution effect” is best described as the expenditure of limited disposable entertainment income in or about the sports facility, rather than in other areas of the local economy. Because disposable personal income is fixed in the short run, this expenditure results in increases in discretionary spending in one area of the economy at the expense of another. Out‐of‐State expenditures were calculated from estimates of the out‐of‐state visitors associated with the various programs, the daily expenditure amounts from those visitors, and the expected duration of each visit. If not otherwise stated in the Program Findings, VISIT FLORIDA average daily expenditures for domestic visitors and average duration of stay were used. To distribute the daily expenditures into the model, the analysis used VISIT FLORIDA’s expenditure categories for domestic visitors. This distributed the expenditures into six categories: Retail, Lodging, Food & Beverage, Transportation, Entertainment and other expenses. Taxable ticket sales to the sporting events were not separately estimated as ticket sales are captured in the overall Entertainment expenditure category. The resulting net economic benefit may then be proportionately attributed to all contributors or contributing public programs. As for proportional attribution, in all but one of the facility construction programs, local governments contributed to the project funding. Further, these local sources financed a majority of the construction of the sport facilities that the state programs also helped fund. Similarly, sporting events that received grants from the Florida Sports Foundation also received grants from local sport commissions. For the purposes of this analysis, EDR proportionately attributed the out‐of‐state visitors between the state and the local funding sources. Accounting for the “Substitution Effect” and proportionately attributing economic benefit are two of the strategies used to derive a credible estimate of program ROI to the state. Data Sources and Development of the Universe There were two primary sources of information for the four programs under review: The Florida Sports Foundation for program data and the Florida Department of Revenue for sales and use tax distributions. Surveys, impact studies and documents related to bonding of sports facilities supplemented this information. Detailed information is provided in the Program Findings; however, only data related to the review period, Fiscal Years 2016‐17, 2017‐18, and 2018‐19, is considered in the evaluation.
7
Key Assumptions The following key assumptions are used in the Statewide Model to determine the outcomes of the programs under review. Some of the assumptions are used to resolve ambiguities in the literature, while others conform to the protocols and procedures adopted for the Statewide Model.
1. The analysis assumes that state incentives were the determining factor in the sports program,
sporting event, or museum’s location decision, provided the program was designed to attract or retain sports‐related activity to the state.
2. The analysis assumes all data provided by Florida Sports Foundation, Department of Revenue and
other entities was complete and accurate. The data was not independently audited or verified by EDR.
3. The analysis assumes that given the time span under review, applying discount rates would not
prove material to the outcome.
4. The analysis treats all grants, distributions or license plate revenues as a loss to the state’s General Revenue Fund.
5. The analysis assumes that any expenditure made for incentives is a redirection from the general
market basket of goods and services purchased by the state. Similarly, any revenue gains from increased business activities are fully spent by the state.
6. The analysis assumes the relevant geographic region is the whole state, not individual counties or
regions. The Statewide Model does not recognize that any economic benefit arises from intrastate relocation. However, the model accounts and makes adjustments for the fact that industries within the state cannot supply all of the goods, services, capital, and labor needed to produce the state’s output.
7. The analysis assumes that businesses treated the incentives as subsidies. The subsidies lowered the
cost of operation for each individual firm.
8. The analysis assumes distribution of capital purchases by each business was the same as the industry in which it operates. This assumption was made because data was not available regarding the specific capital purchases associated with each project. It is also assumed that the businesses benefiting from a particular program were not large enough to affect the rate of return on capital within the industries in which the businesses operated.
9. The analysis assumes that the demand created by the sport or sports‐related event from out‐of‐
state visitors did not displace the demand for goods and services of existing Florida businesses. To do this, demand associated with the events was assumed to be from the rest of the world. The “rest of the world” is defined as other states or the international market.
10. The analysis assumes that ticket sales to the sporting events and museum are captured by the VISIT
FLORIDA visitor expenditure breakdown for out‐of‐state visitors. For in‐state attendees, the analysis assumes that the tax associated with ticket purchases would have been collected from alternative or substitute purchases, and there is no net gain to the state.
8
11. The analysis assumes that all events not associated with the professional sports team, spring
training team or bowl games that were hosted in those facilities could have been hosted elsewhere in the region. Therefore, these events were not included in the analysis.
12. The analysis assumes that when the financing responsibilities for facilities or events are shared, the
economic benefit should be proportionately attributed among the public contributors based on the amount that each source contributes (see Appendix).
13. The analysis did not take into account costs other than stadium financing or grant assistance. These
costs include long‐term maintenance and operation costs, infrastructure and land costs, or foregone property taxes usually borne by the local authorities for stadiums, arenas and ballparks. This cost burden usually falls on local governments or other publicly subsidized entities. For example, at the amateur level, local sports commissions host or help host the events. These costs were not included because of the lack of available data or the non‐monetary nature of the assistance. For this reason, it is likely that the split overestimates the state share of these sporting events.
9
Key Terms In the pages that follow, the analysis for each program includes diagnostic tables describing the composition and statistics of the projects under review. Key terms used in the tables are described below: Actual State Payments Used in Analysis – Represents the amount of state payments made to the program in each fiscal year.
Total Net State Revenues $ (M) – Represents the amount of new state revenue generated by the program in each fiscal year.
Personal Income (Nominal $(M)) – Reflects income received by persons from all sources. It includes income received from participation in production as well as from government and business transfer payments. It is the sum of compensation of employees (received), supplements to wages and salaries, proprietors' income with inventory valuation adjustment (IVA) and capital consumption adjustment (CCAdj), rental income of persons with CCAdj, personal income receipts on assets, and personal current transfer receipts, less contributions for government social insurance.
Real Disposable Personal Income (Fixed 2019‐20 $(M)) – Reflects total after‐tax income received by persons; it is the income available to persons for spending or saving. Real Gross Domestic Product (Fixed 2019‐20 $(M)) – Measures the state's output; it is the sum of value added from all industries in the state. GDP by state is the state counterpart to the Nation's gross domestic product. Consumption by Households and Government (Fixed 2019‐20 $(M)) – Reflects the goods and services purchased by persons plus the expenditures by governments consisting of compensation of general government employees, consumption of fixed capital (CFC), and intermediate purchases of goods and services less sales to other sectors and own‐account production of structures and software. It excludes current transactions of government enterprises, interest paid or received by government, and subsidies. Real Output (Fixed 2019‐20 $(M)) – Consists of sales or receipts and other operating income, plus commodity taxes and changes in inventories. Total Employment (Jobs) – Provides estimates of the number of jobs, full time plus part time, by place of work. Full time and part time jobs are counted at equal weight. Employees, sole proprietors and active partners are included, but unpaid family workers and volunteers are not included. Population (Persons) – Reflects first of year estimates of people, includes survivors from the previous year, births, special populations, and three types of migrants (economic, international, and retired).
10
PROGRAM FINDINGS
FLORIDASPORTSFOUNDATIONGRANTPROGRAM Program Description The Florida Sports Foundation, Inc. (FSF) is a 501(c)(3) non‐profit corporation, serving as the Sports Industry Development Division of Enterprise Florida, Inc.14 In 1989, the Legislature authorized the designation of a direct support organization to assist in the promotion and development of the sports industry in the state.15 In 1995, the Legislature authorized the sale of professional sport team license plates, the proceeds of which were allocated to the FSF to:
Fund major sporting events;
Promote the economic development of the sports industry;
Distribute licensing and royalty fees to participating pro sports teams;
Institute a grant program for communities bidding on minor sporting events that create an economic impact for the state;
Distribute funds to Florida‐based charities designated by the FSF and the participating pro sports teams; and
Fulfill sports‐promotion responsibilities of the Department required by statute.16 Following the abolishment of the Department of Commerce in 1996,17 the FSF was assigned to the Office of Tourism, Trade and Economic Development (OTTED) in the Executive Office of the Governor, with specific statutory powers and duties.18 In 1999, the Legislature transferred many of the responsibilities of the Governor’s Council on Physical Fitness and Amateur Sports to the FSF, which included the operation of the “Sunshine State Games.”19 The statutory responsibilities were expanded in 2010 to include assisting OTTED in retention of professional sports franchises and the spring training operations of Major League Baseball.20 When OTTED was abolished in 2011, FSF was merged into Enterprise Florida, Inc. (EFI), the state’s principal economic development organization under contract with the newly created Department of Economic Opportunity.21 FSF operates as a separate corporation with EFI as its sole member, and FSF retained the assets, liabilities and responsibilities of the original corporation. EFI is responsible for appointing FSF’s officers, with the Governor appointing the board of directors. The President is
14 Section 288.92(1)(e), F.S. 15 When created by statute, Direct‐Service Organizations are typically non‐profit corporations, authorized to carry out specific tasks in support of public entities or public causes. Section 1, ch. 88‐226, L.O.F., created the Sports Advisory Council within the Florida Department of Commerce. Section 1, ch. 89‐263, L.O.F., authorized the creation of a DSO to assist the Sports Advisory Council. Section 1, ch. 92‐111, L.O.F., transferred the DSO to the Department of Commerce, and OPPAGA Report 96‐31 states that FSF was established as a DSO of the Department of Commerce in 1992. The Council was ultimately abolished by s. 22, ch. 93‐187, L.O.F. 16 Section 3, ch. 95‐282, L.O.F., which created s. 320.08058(9), F.S. 17 Section 3, ch. 96‐320, L.O.F. 18 Section 56, ch. 96‐320, L.O.F. 19 Section 7, ch. 99‐251, L.O.F. 20 Section 6, ch. 2010‐140, L.O.F. 21 Section 30, ch. 2011‐142, L.O.F.
11
responsible for the active management of FSF “consistent with its organizational documents and the purposes set forth in Section 288.1229, Florida Statutes (2010).”22 Today, the duties of the Florida Sports Foundation are to:
With funding from the sale of nine Professional Sports and various Specialty License Plates, administer the Major, Regional and Small Market grant programs, which assist Florida communities with securing, hosting and retaining sporting events, as well as assist in the marketing of the Specialty License Plates;
Promote, organize and provide funding for the Sunshine State Games and the Florida Senior Games;
Through publications and the FSF website, promote sports tourism in Florida;
Through publications and the FSF website, promote the Florida Grapefruit League as a sports tourism destination, and promote Florida as a golfing and fishing destination;
Assist the Florida Department of Economic Opportunity in certifying new and retained professional sports franchise and baseball spring‐training facilities in the state; and
With other state agencies or private entities, assist or sponsor sport or fitness related activities. Funding for the FSF is provided through a variety of sources. Much of the funding is from the sale of Florida professional sports team license plates.23 In addition, the FSF receives a portion of the proceeds from the US Olympic Committee,24 Florida NASCAR25 and Florida Tennis license plates.26 The total annual appropriation for the FSF in Fiscal Years 2016‐17, 2017‐18 and 2018‐19 was $4.7 million. The FSF also received annual private contributions that ran between $475,000 and $498,100 during the review period. Major program expenditures include funding the FSF Major Grant Program, the Small Market Grant Program, Sports Industry Conference Assistance Grants, and the Amateur Sports Programs (Sunshine State Games and Florida Senior Games). Grant requests are submitted through regional sports commissions and are evaluated based on need and the economic impact related to the number out‐of‐state participants and spectators. These estimates are provided in grant applications and validated after the event. As noted above, the FSF has varied administrative responsibilities in support of the state’s sports‐tourism industry. Both the Sunshine State Games and the Senior Games primarily serve Florida residents. While it is possible that non‐Florida residents participated, it is likely that the economic benefits from these participants are negligible. Florida Sports Foundation’s main contribution to the Florida economy is through the grant programs, which are the focus of this analysis.
22 Sections 1 and 2 of Article VI, and Section I (d), Bylaws of the Florida Sports Foundation, Incorporated, April 2, 2019. https://playinflorida.com/wp‐content/uploads/2019/05/j1.Amended‐and‐Restated‐Bylaws‐of‐FSF‐April‐2019.pdf Section 288.1229, Florida Statutes (2010) was repealed by s. 485, ch. 2011‐142, L.O.F. 23 Section 320.08058(9)(b), F.S. Major sport events include pro sport events, NCAA Final Four basketball events, or a horseracing or dog racing Breeders’ Cup. 24 Section 320.08058(6)(b)1.a., F.S. 25 Section 320.08058(60), F.S. 26 Section 320.08058(64), F.S.
12
FSF Grant Programs The FSF Major and Small Market grant programs assist the 30 regional sports commissions27 in securing and hosting professional and amateur sporting events from recognised host organizations. These programs have specific qualifying criteria, designed “to assist communities and host organizations in attracting sports events” with an “emphasis on out‐of‐state economic impact, return on investment, community support and image value to the state.”28 Attempting to attract a somewhat different segment of the trade, the Sports Industry Conference Assistance Grants aid communities in attracting sports industry tradeshows, conferences or association meetings.29 All grants are subjected to pre‐award evaluation and post‐event verification of economic impact. To measure the estimated economic impact of events, applications are required to include an estimate of the number of adults and youth from out‐of‐state attending or participating in the event, the length of their stay, and the number of rooms estimated to be let. Completed applications are considered quarterly by the FSF Board of Directors. After the event, the regional sports authority submits a “Post Event Report” showing the actual economic impact of out‐of‐state event attendees in order to secure the approved grant from the FSF. Regional grants may be reduced if the event failed to meet required qualifying thresholds. Description of the Data EDR examined the post‐event reports of all sporting events receiving FSF grants, which show the total number of out‐of‐state participants and spectators (both adult and children), as well as visiting media; the length of stay and room rates; and matching funds (cash) secured for the event. The analysis only included events that occurred within the study review period. Events that qualified for the grant but occurred outside the study review period were excluded from the study.
27 https://playinflorida.com/industry‐partners/ 28 See Grant Program Policies & Procedures at https://playinflorida.com/wp‐content/uploads/2019/06/FSF‐Policies‐and‐Procedures‐Major‐Grant‐Application‐Program‐2020.pdf & https://playinflorida.com/wp‐content/uploads/2019/06/FSF‐Policies‐and‐Procedures‐Small‐Market‐Grant‐Application‐Program‐2020.pdf last accessed on 9/22/20. 29 See Sports Industry Conference Assistance Grant Policies and Procedures at https://playinflorida.com/wp‐content/uploads/2019/06/FSF‐Policies‐and‐Procedures‐SICA‐Grant‐Application‐Program‐2020.pdf
13
Analysis and Findings
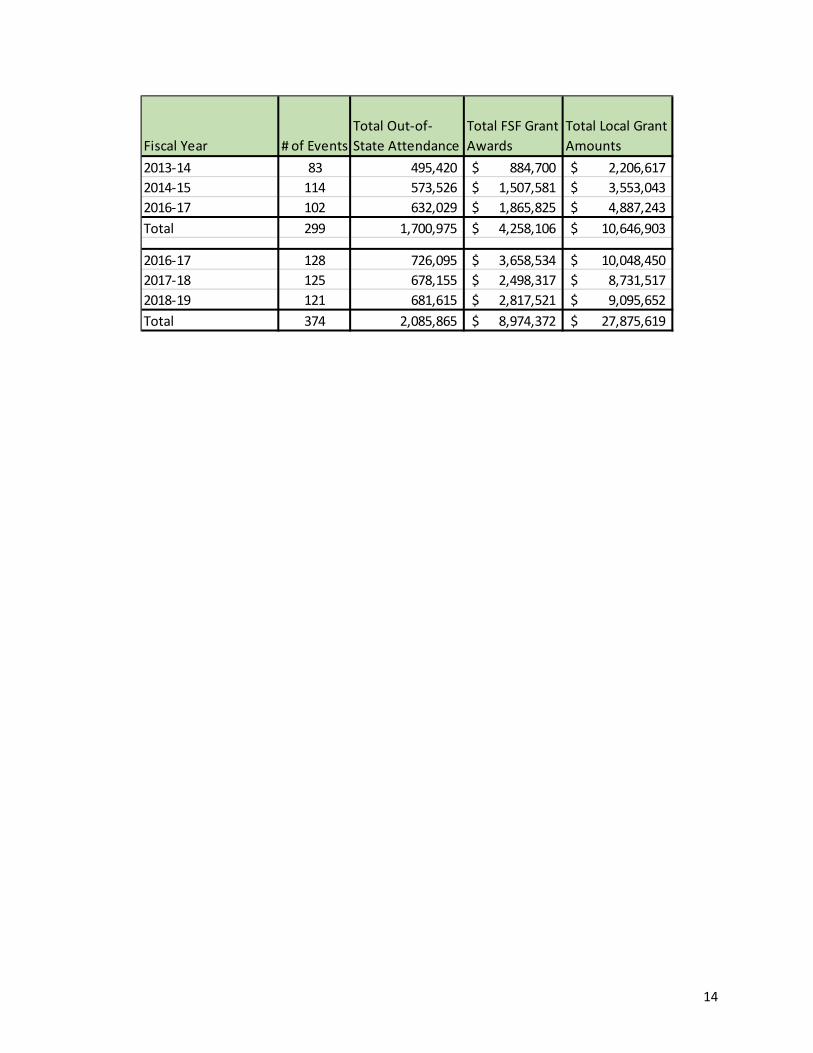
The analysis addressed the impact of 374 sporting events that occurred within the three‐year review period, attracting 2,085,865 out‐of‐state visitors. In those instances where the funding responsibility for an event was shared, the economic benefit was proportionately attributed among the public contributors based on their respective contributions. Per event, the subsequent assignment of visitors to FSF ranged from just under 10 percent to 100 percent. Derived from this calculation for each event, a total of 654,666 out‐of‐state visitors was attributed to the FSF Grants. Based on an analysis of the post‐event reports, each visitor stayed an average of 5.5 days in Florida, directly adding $624 million to the state’s economy. The Florida Sports Foundation Grant Program has a projected ROI of 4.27. For every dollar spent on the grant program, the State of Florida received $4.27 in tax revenue. In addition, the grant program increased Florida’s Real GDP by about $847 million and caused Real Disposable Personal Income to grow by $680 million in the study review period. Even after apportioning some of the benefit to local governments, the FSF grant program had a ROI higher than the other sports‐related programs. This is due to its ability to attract large national events with significant out‐of‐state visitors for, on average, a small state share of the cost. The state share of the cost runs about $24,000 per event. The visiting participants and spectators to these events stayed longer on average, and consequently spent more money, than a typical Florida visitor – contributing to the higher ROI. The ROI in this analysis review period is 4.27, which is lower than the ROI of 4.77 in 2018 (and 4.72 in 2015, using revised methodology30). The lower ROI is primarily due to an increase in state payments relative to the attendance figures, as shown in the table below.31 Of note, the average three‐year per event award reported in 2018 was $15,000 where now it is $24,000, an increase of 60 percent.
30 See EDR’s 2018 Report, page 15, for more information. http://edr.state.fl.us/Content/returnoninvestment/SportsGrantsandPrograms2018.pdf 31 The ROI also reflects, in part, updated base data in the Statewide Model.
Statewide Economic Model Impact Projections of the Florida Sports Foundation Grant Program
FY2016 FY2017 FY2018 Total
State Payments in the Window Nominal $ (M) 3.66 2.50 2.82 8.97
Total Net State Revenues Nominal $ (M) 13.98 9.71 14.69 38.33
Return‐on‐Investment by Year 3.82 3.89 5.21
Return‐on‐Investment for the 3 year period 4.27
FY2016 FY2017 FY2018 TotalAverage
per Year
Personal Income Nominal $ (M) 257.0 189.5 289.2 735.7 245.2
Real Disposable Personal Income Fixed 2019‐20 $ (M) 241.7 175.4 263.2 680.4 226.8
Total Employment Jobs 2,006 978 1,451 978 2,006 1,478.3
Population Persons 0 312 488 0 488 266.7
14
Fiscal Year # of Events
Total Out‐of‐
State Attendance
Total FSF Grant
Awards
Total Local Grant
Amounts
2013‐14 83 495,420 884,700$ 2,206,617$
2014‐15 114 573,526 1,507,581$ 3,553,043$
2016‐17 102 632,029 1,865,825$ 4,887,243$
Total 299 1,700,975 4,258,106$ 10,646,903$
2016‐17 128 726,095 3,658,534$ 10,048,450$
2017‐18 125 678,155 2,498,317$ 8,731,517$
2018‐19 121 681,615 2,817,521$ 9,095,652$
Total 374 2,085,865 8,974,372$ 27,875,619$
15
PROFESSIONALSPORTSFRANCHISEINCENTIVE
Program Description The Professional Sports Franchise incentive is the state’s funding mechanism to attract and retain pro sport franchises in Florida. Qualified applicants are eligible for up to $2 million annually for 30 years. Along with local government resources, these dollars are pledged as security for bonds, the proceeds of which fund the acquisition, construction, reconstruction or renovation of pro sport facilities. In its initial effort to attract professional sports franchises to the state, the Legislature authorized three funding mechanisms for the construction of facilities. In 1988, local governments were authorized to levy a local option sports facility sales tax on stadium admissions, concessions and parking that was matched with an equal amount of state funds of up to $2 million per year and $15 million over the life of the facility.32 The law also authorized counties to levy a one‐percent tourist development tax to pay the debt service on any bonds issued to finance the construction, reconstruction, or renovation of a professional sports franchise facility. In 1991, the Legislature significantly revised the incentive to extend its duration, providing up to $2 million a year for up to 30 years to applicants certified by the Department of Commerce.33 Certification criteria include a commitment by the franchise to use the facility for five years; a declaration by the local government that the project serves a public purpose; projections for paid attendance showing at least 300,000 attendees annually; projections demonstrating that the facility will generate at least $2 million annually in sale taxes; and demonstration of financial capability to provide more than one‐half of the costs incurred or related to the improvement or development of the facility. This law also established an incentive for new spring training franchises, limited the total number of incentive awards to six, and prohibited facilities from receiving more than one award. The qualifying criteria were amended in 1994 to extend the use commitment from five to ten years for pro sports franchises.34 In addition, counties were authorized to levy an additional one‐percent tourist development tax to pay the debt service on bonds issued to finance the construction, reconstruction, or renovation of a professional sports franchise facility.35 The incentive was made available to fund facilities for “retained” pro franchise facilities in 1995,36 and the cap on the number of awards was increased from six to eight in 1996.37 The cap was increased again in 2000, with eight awards specifically reserved for pro facilities.38 To date, eight certified facilities for new or retained professional sports franchises have received funding distributions from DOR.39 Each facility receives $166,667 monthly ($2 million annually) for no more than
32 Section 288.1162, F.S., created in ch. 88‐226, L.O.F. Approval was contingent upon review and recommendation by the Florida Department of Commerce, and subsequent Legislative authorization. If a local government was successful in signing a franchise before January 1, 1989, they would also have received an additional $1,757,920 to assist in locating the franchise in Florida. This incentive was not awarded to any franchise. Also see s. 212.20(6)(d)6.b., F.S. 33 Chapter 91‐274, L.O.F. 34 Section 35, ch. 94‐338, L.O.F. 35 Section 37, ch. 94‐338 and s. 1, ch. 94‐275, L.O.F. 36 Chapter 95‐304, L.O.F. 37 Section 45, ch. 96‐320, L.O.F. 38 Section 2, ch. 2000‐186, L.O.F. Five awards were specifically authorized for retained Spring Training franchises. 39 The eighth pro sport certification was specifically designated by s. 4, ch. 2006‐262, L.O.F., for an NBA franchise located in Florida since 1997. In 2014, the Legislature established the Sports Development Program to provide an additional sales tax distribution to local governments for the purpose of constructing or renovating professional sports facilities; however, the
16
30 years, totaling a maximum of $60 million. These distributions fund a relatively small portion of the total debt financing for pro‐sport facilities, ranging from 6.0 to 17.4 percent. Finally, in some cases, the primary tenant financially contributes to the construction or reconstruction of the facility. Data To evaluate the program, EDR reviewed published attendance figures for the eight professional teams that use facilities financed, in part, by the Professional Sports Franchise incentive. This includes NCAA Football and Basketball special events. In addition, EDR reviewed an analysis entitled 2010‐11 Fiesta Bowl Festival of College Football: Economic Impact Study which provided estimates of out‐of‐state visitors to certain bowl games at sport facilities. The study included separate estimates for both Bowl Championship Series (BCS) games and non‐BCS games. Further, EDR examined the bond documents associated with the building or renovation of the qualified facilities. The bond documents helped in calculating the proportions of total financing provided by local sources and the state’s sales tax distributions. Finally, the Department of Revenue provided sales tax distribution data for each Professional Sports Franchise Incentive recipient.
qualifying and certification criteria are substantially different from the Professional Sports Franchise Facility incentive. (Section 4, ch. 2014‐167, L.O.F., creating s. 288.11625, F.S.). To date, no projects have qualified.
17
Analysis and Findings
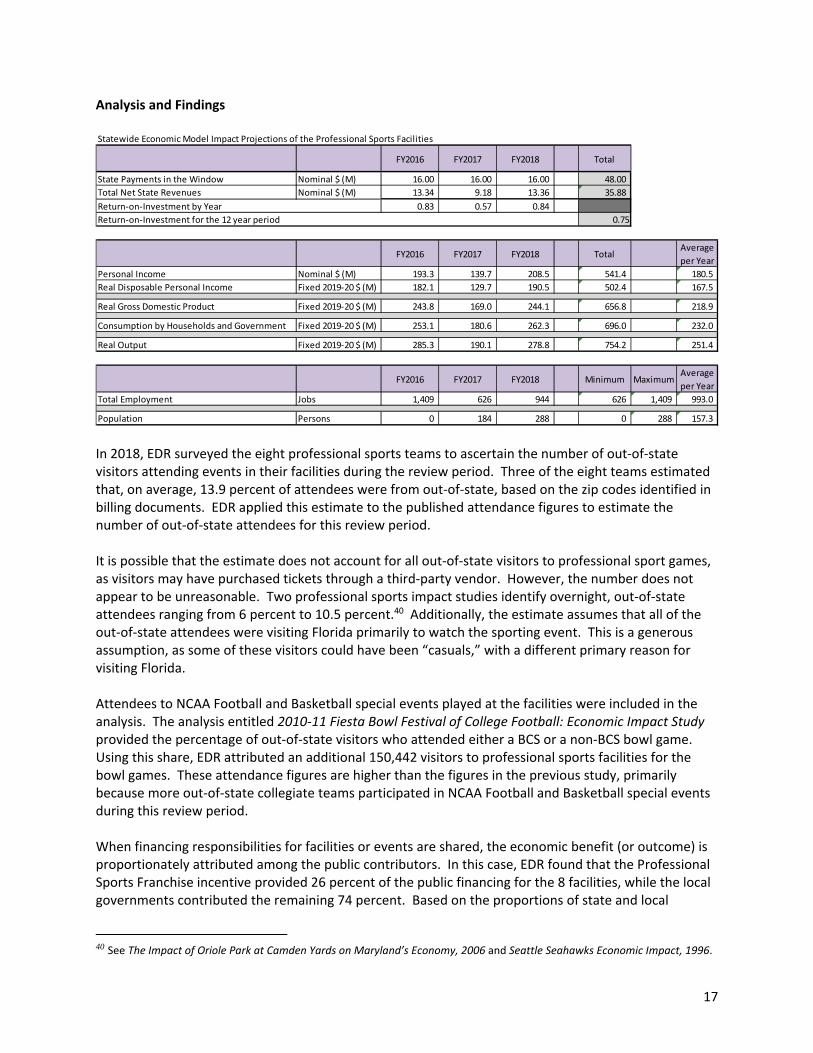
In 2018, EDR surveyed the eight professional sports teams to ascertain the number of out‐of‐state visitors attending events in their facilities during the review period. Three of the eight teams estimated that, on average, 13.9 percent of attendees were from out‐of‐state, based on the zip codes identified in billing documents. EDR applied this estimate to the published attendance figures to estimate the number of out‐of‐state attendees for this review period. It is possible that the estimate does not account for all out‐of‐state visitors to professional sport games, as visitors may have purchased tickets through a third‐party vendor. However, the number does not appear to be unreasonable. Two professional sports impact studies identify overnight, out‐of‐state attendees ranging from 6 percent to 10.5 percent.40 Additionally, the estimate assumes that all of the out‐of‐state attendees were visiting Florida primarily to watch the sporting event. This is a generous assumption, as some of these visitors could have been “casuals,” with a different primary reason for visiting Florida. Attendees to NCAA Football and Basketball special events played at the facilities were included in the analysis. The analysis entitled 2010‐11 Fiesta Bowl Festival of College Football: Economic Impact Study provided the percentage of out‐of‐state visitors who attended either a BCS or a non‐BCS bowl game. Using this share, EDR attributed an additional 150,442 visitors to professional sports facilities for the bowl games. These attendance figures are higher than the figures in the previous study, primarily because more out‐of‐state collegiate teams participated in NCAA Football and Basketball special events during this review period. When financing responsibilities for facilities or events are shared, the economic benefit (or outcome) is proportionately attributed among the public contributors. In this case, EDR found that the Professional Sports Franchise incentive provided 26 percent of the public financing for the 8 facilities, while the local governments contributed the remaining 74 percent. Based on the proportions of state and local
40 See The Impact of Oriole Park at Camden Yards on Maryland’s Economy, 2006 and Seattle Seahawks Economic Impact, 1996.
Statewide Economic Model Impact Projections of the Professional Sports Facilities
FY2016 FY2017 FY2018 Total
State Payments in the Window Nominal $ (M) 16.00 16.00 16.00 48.00
Total Net State Revenues Nominal $ (M) 13.34 9.18 13.36 35.88
Return‐on‐Investment by Year 0.83 0.57 0.84
Return‐on‐Investment for the 12 year period 0.75
FY2016 FY2017 FY2018 TotalAverage
per Year
Personal Income Nominal $ (M) 193.3 139.7 208.5 541.4 180.5
Real Disposable Personal Income Fixed 2019‐20 $ (M) 182.1 129.7 190.5 502.4 167.5
Total Employment Jobs 1,409 626 944 626 1,409 993.0
Population Persons 0 184 288 0 288 157.3
18
financing, the analysis attributes 506,662 out‐of‐state visitors to the state incentive. Including the bowl game attendees, total out‐of‐state visitors due to the state’s share increased to 598,485 which is 7.73 percent higher than seen in the 2018 analysis. The Professional Sports Facilities Incentive Program has a projected ROI of 0.75. For every dollar spent through the incentive, the state of Florida received 75 cents in tax revenue. In addition, the state incentive caused Florida’s Real GDP to increase by about $656.8 million and caused Real Disposable Personal Income to grow by $502.4 million during the review period. The program attracted the second highest number of out‐of‐state visitors in the study, and came in with the second highest ROI. Even so, the ROI is significantly lower than the 4.27 ROI for the Florida Sports Foundation Grant Program. This is largely due to the cost of the program. The State’s cost for the incentive program during the review period was $16 million per year. In contrast, the Florida Sports Foundation Grant program cost the State an average of nearly $3.0 million per year. The ROI during this review period is marginally higher than the previous analyses, 0.75 in this report versus 0.32 and 0.30 in the prior reports. This increase can be attributed to the higher number of out‐of‐state visitors, as well as the greater number of out‐of‐state collegiate teams participating in NCAA Football and Basketball special events in this review period.
19
SPRING TRAINING BASEBALL FRANCHISE INCENTIVE
Program Description The Spring Training Baseball Franchise Incentive is the state’s funding mechanism to attract and retain facilities for Major League Baseball (MLB) spring training in Florida. Qualified applicants are eligible for up to $500,000 annually for up to 30 years. These dollars are typically pledged with designated Tourist Development Tax revenue and other local government resources to secure bonds used to fund the acquisition, construction, reconstruction or renovation of spring training facilities. In 1988, the Florida Legislature established the first state incentive to attract professional franchises to the state. In 1991, the law was significantly revised and expanded to include an incentive for new spring training baseball franchises. Certification criteria for the spring training franchise incentive included a commitment by the franchise to use the facility for fifteen years; projections for paid attendance showing at least 50,000 attendees annually; demonstration of financial capability to provide more than one‐half of the costs incurred or related to the improvement or development of the facility; proof that the facility was located within 20 miles of an interstate or other limited‐access highway system; and a requirement that the county levy a four‐percent Tourist Development Tax, with 87.5 percent of the proceeds dedicated to the construction of the complex.41 This law also limited the total number of awards for both the professional sports franchises and new spring training franchises to six, and prohibited facilities from receiving more than one award. In 1999, the Legislature extended the use of the Professional Sports and Additional Professional Sports Tourist Development Taxes to fund debt service on spring training franchise facilities.42 At that point, no local governments had applied for the incentive. In 2000, the law was amended to provide the incentive to “retained” rather than “new” spring training franchises, to delete the requirement that the facility be located within 20 miles of an interstate or other limited‐access highway system, and to establish ranking criteria for awards. The awards were limited to publically‐owned facilities and were authorized for in‐state relocations provided certain conditions were met. The law also imposed a cap of five awards.43 In 2006, the number of authorized awards for spring training facilities was expanded from five to ten, with the imposition of additional certification criteria. Counties were also authorized to use up to $2 million of their local option half‐cent sales tax revenues annually to fund facilities for new or retained professional sports franchises and facilities for retained spring training franchises.44 The scope of the incentive was expanded in 2010, to include any spring training franchise rather than only “retained” spring training franchises.45 By August 2012, ten facilities were certified for the incentive.46
41 Ch. 91‐274, L.O.F. 42 Section 1, ch. 99‐287, L.O.F 43 Ch. 2000‐186, L.O.F. 44 Ch. 2006‐262, L.O.F. 45 Ch. 2010‐140, L.O.F. Also, provisions relating to the spring training incentive were transferred from s. 288.1162 to the newly created s. 288.11621, F.S. Also see s. 212.20(6)(d)6.b., F.S. 46 All totaled, eleven facilities have been certified since the inception of the program; however, only seven facilities currently receive distributions. Since 2015, six additional facilities have been certified under the Retention of Spring Training Baseball Franchises incentive enacted in 2013 (s. 24, ch. 2013‐42; amended by s. 5, ch. 2014‐167, L.O.F.; and codified in s. 288.11631, F.S.). This program provides up to $20 million over 20 years to fund single‐franchise facilities, and $50 million over 25 years to fund facilities housing more than one franchise. This program has not been reviewed as the Legislature has not required it be evaluated.
20
Data To analyze the program, EDR obtained attendance figures, by team, from the official Florida’s Grapefruit League website, which is maintained by the Florida Sports Foundation.47 EDR also reviewed the analysis entitled 2009 Major League Baseball Florida Spring Training Economic Impact Study, which provided an estimate of out‐of‐state visitors whose primary reason for visiting Florida was to attend Spring Training games.48 In addition, EDR reviewed the subsequent update entitled 2018 Major League Baseball Spring Training Economic Impact Study which provided an estimate of out‐of‐state visitors whose primary reason for visiting Florida was to attend Spring Training games in 2018.49 Both studies included information on average party size, average expenditure amount per party per day, and length of stay for these out‐of‐state visitors. Further, EDR examined the bond documents associated with the building or renovation of the qualified facilities. The bond documents helped in calculating the proportions of total financing provided by local sources and the state’s sales tax distributions. Finally, the Department of Revenue provided sales tax distribution data for each Spring Training Baseball Facilities recipient.
47 http://www.floridagrapefruitleague.com 48 The Bonn Marketing Research Group, Inc. Report on file. Available upon request. 49 http://playinflorida.com/wp‐content/uploads/2018/08/GFL‐IS‐Page‐by‐Page‐Booklet‐spread.pdf
21
Analysis and Findings
Using the 2009 and 2018 economic impact studies for MLB Spring Training activities, EDR estimated the percentage of out‐of‐state visitors whose primary reason for visiting Florida was to attend Spring Training events. In the three‐year review period, a projected 334,214 out‐of‐state visitors came to Florida for this purpose, an amount similar to (but slightly below) the 2018 study. The analysis attributes only 22 percent of these visitors to the state incentive. This is due to two reasons. First, only the attendance from facilities actually financed by the incentive was included in the analysis. Second, local contributions were the primary source of financing for these facilities, and that condition was reflected in the apportionment of attendance between state and local governments. The expenditure amount per party and average number of nights stayed were drawn from the impact studies and then used to measure the dollar amount that each visitor added to Florida’s economy. Construction expenditures benefit the state through additional tax revenue, personal income and GDP growth; however, no recipient facilities were under construction or renovation during the review period. Consequently, no construction expenditures were included in the analysis. The Spring Training Baseball Franchise Incentive program has a projected ROI of 0.54. For every dollar spent on the program, the state of Florida received 54 cents in tax revenue. In addition, the program increased Florida’s Real GDP by $107.7 million and caused Real Disposable Personal Income to grow by $81.7 million during the review period. The ROI during this review period is higher than the previous analyses, 0.54 in this report versus 0.22 and 0.11 in the prior reports. The increase from the first to the second review period (0.22 relative to 0.11) is primarily attributed to the increased construction expenditures during that period. The increase from the second to the third review period (0.54 relative to 0.22) is due to a 23.0 percent decline in state payments, as three facilities exhausted their eligibility for the incentive distributions.
Statewide Economic Model Impact Projections of the Spring Training Baseball Franchise Incentive
FY2016 FY2017 FY2018 Total
State Payments in the Window Nominal $ (M) 3.70 3.50 3.50 10.70
Total Net State Revenues Nominal $ (M) 1.94 1.86 1.91 5.74
Return‐on‐Investment by Year 0.52 0.53 0.54
Return‐on‐Investment for the 3 year period 0.54
FY2016 FY2017 FY2018 TotalAverage
per Year
Personal Income Nominal $ (M) 28.8 28.8 30.7 88.3 29.4
Real Disposable Personal Income Fixed 2019‐20 $ (M) 27.1 26.6 27.9 81.7 27.2
Program Description World Golf Foundation, Inc., was established in 1994 as a non‐profit with the purpose of constructing and operating the World Golf Hall of Fame facility in Northeast Florida. The $48.6 million facility was completed and opened to the public in May 1998. It was originally located in North Carolina and was owned and operated by the PGA of America.50 In 1993, the Legislature authorized a funding mechanism for financing this sports‐destination facility, which is part of the “World Golf Village” project, a “vacation destination with two championship golf courses, high‐end accommodations and several other amenities.”51 The project was initially financed by the St. Johns County Industrial Development Authority. In the enacting legislation, the Legislature determined the “facility would receive national and international media promotion and attention to the extent of promoting the quality of life in Florida, so as to attract national and international tourists and sports‐related industry…”52 In 1998, the Florida Department of Commerce certified the World Golf Foundation as eligible for $50 million in state sales tax revenue, to be distributed over 25 years for the purpose of covering the financed construction costs related to the Professional Golf Hall of Fame. The 75,000 sq. ft. facility contains a cafeteria, gift shop and IMAX Theater. Certification criteria included:
Projections that the professional golf hall of fame facility will attract a paid attendance of more than 300,000 annually.
An independent analysis or study which demonstrates that the sales and use taxes generated by the use and operation of the facility will equal or exceed $2 million annually.
An agreement by the applicant to provide $2 million annually in national and international media promotion of the professional golf hall of fame facility, Florida, and Florida tourism, through the PGA Tour, Inc., or its affiliates, at the then‐current commercial rate, during the period of time that the facility receives funding from the state.
Documentation that the applicant has provided, is capable of providing, or has financial or other commitments to provide more than one‐half of the costs incurred or related to the improvement and development of the facility.
Use of state funds was restricted to costs related to the construction, reconstruction, renovation, promotion, or operation of the facility. The last scheduled distribution to St. Johns County Industrial Development Authority is June 2023. The law also required the department to recertify every 10 years that the facility is open, continues to be the only professional golf hall of fame in the United States recognized by the PGA Tour, Inc., and is meeting the minimum projections for attendance or sales tax revenue as required at the time of original certification.
50 See http://www.worldgolfhalloffame.org 51 Chapter 93‐233, L.O.F., creating s. 288.1168, F.S. & s. 212.20(6)(d)6.c., F.S. See http://www.worldgolfhalloffame.org/about‐the‐museum/our‐history/ 52 Ch. 93‐233, L.O.F.
23
In 2017, the Legislature required the Department of Revenue (DOR) to audit the Professional Golf Hall of Fame facility by October 1, 2017, to verify that state payments have been expended to finance the construction or operation of the facility. It also required the owner or operator of the facility to certify by January 1, 2018, that all state payments have been used to pay debt service on bonds issued to finance the construction or renovation of the facility (and related costs).53 Data To analyze the program, EDR requested that the World of Golf Hall of Fame provide information on total tickets purchased to the Hall of Fame, total number of tickets purchased by Florida residents, and total number of youth tickets purchased to these events. The museum provided attendance numbers, as well the percentage of out‐of‐state visitors. Further, EDR examined the bond documents associated with the construction of the World Golf Village. The bond documents helped in calculating the proportions of total financing provided by local sources and the state’s sales tax distributions. Finally, the Department of Revenue provided sales tax distribution data for the World of Golf Foundation.
53 Section 16, ch. 2017‐233, L.O.F. The law also includes penalties for failure to comply.
24
Analysis and Findings
The World of Golf Hall of Fame reported 461,983 total visitors during the review period. EDR applied the previously reported ratio of in‐state to out‐of‐state visitors to estimate that 321,586 visitors (70 percent) were from out‐of‐state during the current review period. This number of visitors is 10.1 percent lower than the one used in the 2018 report. Further, unlike the other sports‐related programs under review, the analysis does not attribute all of a visitor’s stay in World Golf Village to the Hall of Fame. The Hall of Fame is just one of the attractions at the World Golf Village, which also includes golf courses, convention space and a luxury hotel. The analysis assumed that all of these attractions contributed to the visitor’s decision to go to the World Gold Village. Therefore, the analysis only attributed one‐half of a day to each estimated out‐of‐state visitor. This effectively reduces the percentage of out‐of‐state visitors to 35 percent (160,793) of the total. EDR also examined the bond documents associated with the construction of the World Golf Village. The bond documents showed that 53.82 percent of the facility was financed by the incentive. Accordingly, the analysis only attributes 53.82 percent of the out‐of‐state visitors to the state. This reduced the total to 86,539 out‐of‐state visitors within the review period. The World of Golf Facility Incentive has a projected ROI of 0.15. For every dollar spent on the program, the state of Florida received 15 cents in tax revenue. In addition, the program increased Florida’s Real GDP by $23.5 million and caused Real Disposable Personal Income to grow by $16.3 million during the review period. The ROI during this review period is only marginally higher than the previous analysis, 0.15 compared to 0.12. While there were fewer visitors in the current review period, this was offset by the higher daily expenditures attributed to their visit. Both results contrast with the negative ROI (‐0.08) from the 2015 analysis. That shift to a positive ROI can be attributed to the increase in the number of reported out‐of‐state visitors by the Hall of Fame after augmented steps to capture that information.
Statewide Economic Model Impact Projections of Statewide Economic Model Impact Projections of the Gold HOF
FY2016 FY2017 FY2018 Total
State Payments in the Window Nominal $ (M) 2.00 2.00 2.00 6.00
Total Net State Revenues Nominal $ (M) 0.29 0.29 0.30 0.88
Return‐on‐Investment by Year 0.15 0.15 0.15
Return‐on‐Investment for the 3 year period 0.15
FY2016 FY2017 FY2018 TotalAverage
per Year
Personal Income Nominal $ (M) 5.4 5.8 6.3 17.4 5.8
Real Disposable Personal Income Fixed 2019‐20 $ (M) 5.2 5.4 5.6 16.3 5.4
Appendix:FacilitiesFinancing Most stadiums and sports facilities are financed with tax‐exempt bonds, which are issued through state and local governments or other public entities such as regional sports authorities. Tax‐exempt bonds allow issuers to take on debt at a lower interest rate relative to taxable bonds. In turn, the underwriter is able to get a better return on their investment because their earnings are exempt from federal income tax. The bonds are secured by pledged revenues which are usually generated from a tax or fee. The most commonly pledged revenues for sports facilities bonds are tourist development taxes, ad valorem taxes, and sales taxes. In a few instances, the bonds have been issued as general obligation debt, which means that all revenues of the issuer, regardless of the source, may be used to pay debt service, if needed. In Florida, the annual state sales tax distributions for qualified sports facilities have also been used to secure tax‐exempt bonds. Issuing bonds provides a large amount of up‐front cash that can be used for capital investment. However, most of the bonds are issued with 30‐year maturity structures, which means that a large portion of the state funding is actually used to pay the interest cost of the debt. For example, a certified professional sports facility in Florida that receives $2 million a year for 30 years pledges this $60 million to pay debt service on $30 million of bonds. Therefore, the state’s $60 million long‐term investment results in $30 million of up‐front cash that can be used to construct or renovate a facility. The state’s investment for spring training facilities is significantly less. In most cases, certified spring training facilities receive $0.5 million each year for 30 years, which typically results in about $7.5 million of cash available for the state’s $15 million investment. In both programs, the amount of cash available varies up or down slightly by facility, depending on what interest rate was at the time bonds were issued. Most of these bonds were issued many years ago, and construction or renovations were completed well before the timeframe for analysis. This means that within this timeframe, the state’s expenditures have mostly been used to pay debt service. When calculating the ROI for these programs, it is assumed that all activity at the facility within the review period would not have occurred absent the initial construction or renovation of the facility. The return generated from the state’s initial investment in sports facilities is measured as tax revenues generated from spending by out‐of‐state visitors to sporting events at the publicly‐funded facilities minus the state’s ongoing financial obligation. In addition to state sales tax distributions, all of the certified entities in Florida used other funding sources to complete the sports facilities projects. Most of the additional funding was provided through bonds issued by counties, cities, or regional sports authorities. The most commonly used local government revenue sources are county tourist development taxes,54 followed by local option sales taxes.55 In a few cases, proceeds from land sales or other non‐ad‐valorem revenues were also used. Because local governments also invested in these projects, the state cannot claim all of the benefits. In order to determine what portion of the return to attribute to the state, EDR estimated the portion of
54 These include the original and additional Tourist Development Taxes, the Professional Sports Franchise Facility Tax, and the Additional Professional Sports Franchise Facility Tax. Also, five counties may levy the High Tourism Impact tax, the revenues from which may be used to fund publicly‐owned facilities. (s. 125.0104(3), F.S.) 55 Subject to referendum approval, local governments may use proceeds from the Local Government Infrastructure Surtax. (s. 212.55(2)(d)1.a., F.S.) Counties may also use up to $2 million annually of the local government half‐cent sales tax allocated to them by the state. (s. 218.64(3)(a), F.S.)
26
the investment that came from state funds. It is important to note that there is not one single source of comprehensive data about sports facilities financing that includes all associated costs and funding sources. In order to estimate the state’s share, EDR compiled information from many different sources, including the Florida Sports Foundation’s facility certification application files that included financing plans for the facilities, individual bond offering documents found in the Municipal Securities Rulemaking Board’s (MSRB) Electronic Municipal Market Access (EMMA) online database, and financial statements of local governments and regional sports authorities. EDR found that on average, the state funded 17.4 percent of pro sports facility projects and 37.4 percent of spring training facility projects. EDR also found that, in Florida, the average total cost (including interest) of a pro sports facility was $419.5 million, which is substantially higher than the average total cost of a spring training facility which was $42.1 million.