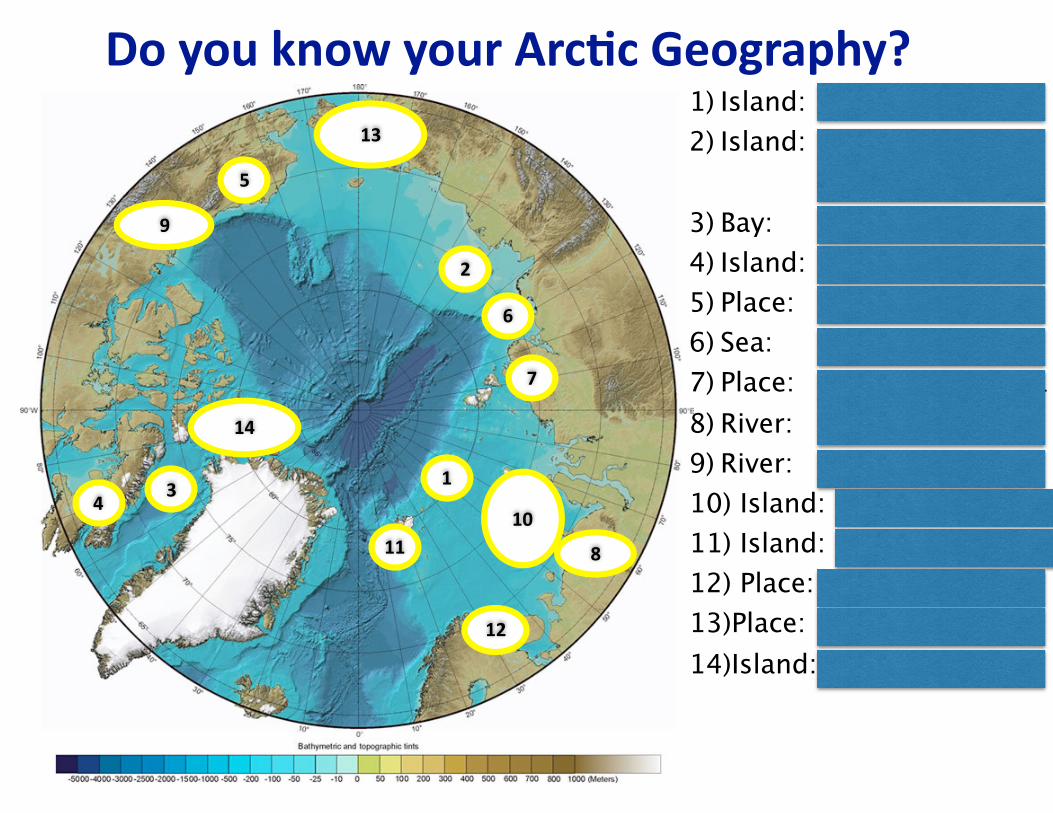
Calling undergraduates and graduate students interested in understanding and par/cipa/ng in the process of taking science from research to ac/onable informa/on. Learn the basics of Climate Science and Policy in this project= based course that covers theory and prac/cal applica/ons. ATM 493/693 Applied Arc/c Climate Problems Spring 2017 University of Alaska Fairbanks = Don’t be leO out! Important Informa/on Prerequisites: science fundamentals ATM 493/693 (3 credits) CRN:36359 for ATM493, CRN:36360 for ATM693 Tues=Thurs 2:00=3:30 PM in Room Murie 105 University of Alaska Fairbanks Spring 2017 (Jan.=May.) Instructors: Dr. Uma Bha*, Atmospheric Sciences, [email protected] and Dr. Kaja Brix, [email protected]. Details on web: h*p://www.gi.alaska.edu/~bha*/teaching Liz Labunski / AP USDA Project 1: Marine Mammals: from science to policy Project 2: Wildland Fire: from science to applicaHons
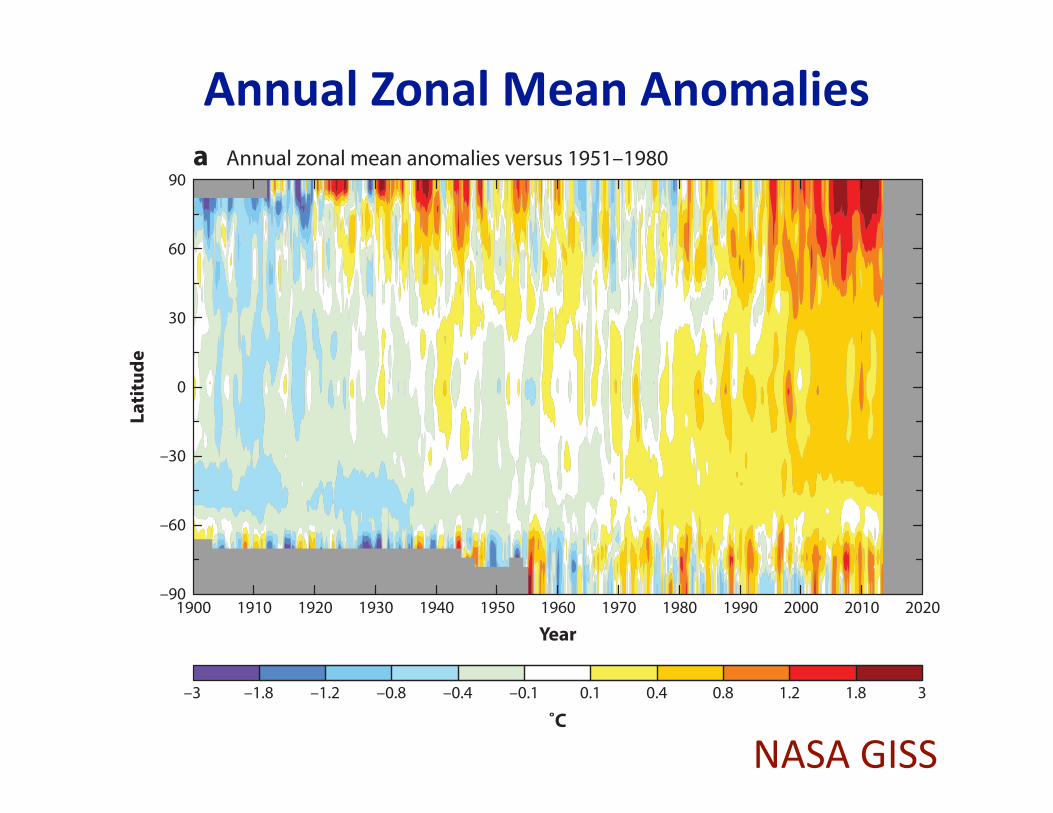
Figure 2(a) Zonal average temperature anomalies from 1900 to 2012 are based on meteorological station data andNOAA sea-surface temperatures. The plot was generated from the NASA Goddard Institute for SpaceStudies (NASA GISS) website, http://data.giss.nasa.gov/gistemp, and details of the data methods aredescribed in Reference 3. (b) Annual surface air temperature anomalies (◦C) poleward of 59◦N, where dottedlines show annual values and solid lines display a seven-year running mean from Bekryaev et al. (5).c⃝American Meteorological Society. Used with permission. Trend is for the period 1900–2008.
60 Bhatt et al.
Ann
u. R
ev. E
nviro
n. R
esou
rc. 2
014.
39:5
7-89
. Dow
nloa
ded
from
ww
w.a
nnua
lrevi
ews.o
rgby
Uni
vers
ity o
f Ala
ska
- Fai
rban
ks o
n 10
/20/
14. F
or p
erso
nal u
se o
nly.
NASAGISS
MeterologicalStaCondatavariesinlength
[Bekryaevetal.2010]
MulCdecadalVariabilityisLargeinArcCc
EG39CH03-Bhatt ARI 7 October 2014 12:33
a Annual zonal mean anomalies versus 1951–1980
b
90
60
30
0
–30
–60
–90
Latit
ude
Surf
ace
air t
empe
ratu
re a
nnua
l ano
mal
ies (
˚C)
Year
˚C
Year
1900 1910 1920 1930 1940 1950 1960
1880 1900 1920 1940 1960 1980 2000
1970 1980 1990 2000 2010
–3 –1.8 –1.2 –0.8 –0.4 –0.1 0.1 0.4 0.8 1.2 1.8 3
2020
Trend = 1.36±0.71˚C/100 years
–2
–1
0
1
2
Figure 2(a) Zonal average temperature anomalies from 1900 to 2012 are based on meteorological station data andNOAA sea-surface temperatures. The plot was generated from the NASA Goddard Institute for SpaceStudies (NASA GISS) website, http://data.giss.nasa.gov/gistemp, and details of the data methods aredescribed in Reference 3. (b) Annual surface air temperature anomalies (◦C) poleward of 59◦N, where dottedlines show annual values and solid lines display a seven-year running mean from Bekryaev et al. (5).c⃝American Meteorological Society. Used with permission. Trend is for the period 1900–2008.