55
sqlbi.com

sqlbi.com

sqlbi.com
presented by
Alberto Ferrari

Who’s Speaking?
BI Experts and Consultants Problem Solving Complex Project Assistance DataWarehouse Assesments and Development Courses, Trainings and Workshops Microsoft Business Intelligence Partners Book Writers
sqlbi.com
Our latest conferences
PASS Europe 2009 – Neuss – Germany PASS 2009 – Seattle – USA SQL Conference 2010 – Milan – Italy Teched 2010 – New Orleans – USA 24 Hours of PASS 2010 – Online PASS 2010 – Seattle – USA BI Conference 2011 – Lisbon - Portugal
Agenda
PowerPivot Data Models:
Recap of evaluation contexts
Non additive measures (Current account balance)
Banding (Discretization)
Simulations (Courier Simulations)
Many to Many Relationships (Audience)
Parent / Child hierarchies
sqlbi.com
RECAP OF EVALUATION CONTEXTS
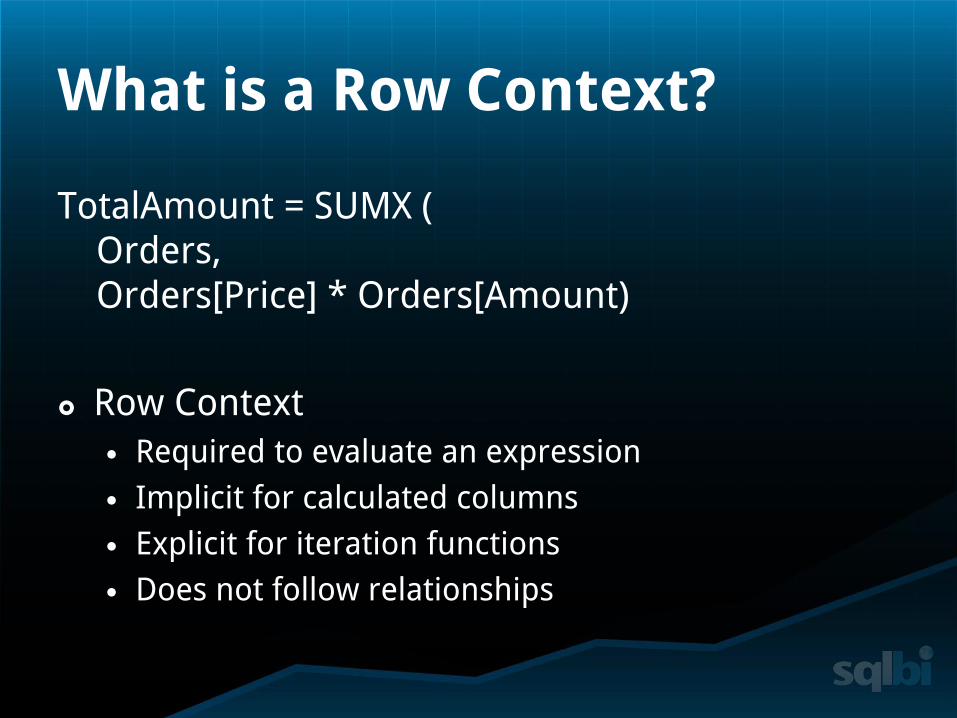
What is a Row Context?
TotalAmount = SUMX ( Orders, Orders[Price] * Orders[Amount)
Row Context
Required to evaluate an expression
Implicit for calculated columns
Explicit for iteration functions
Does not follow relationships

What is a filter context?
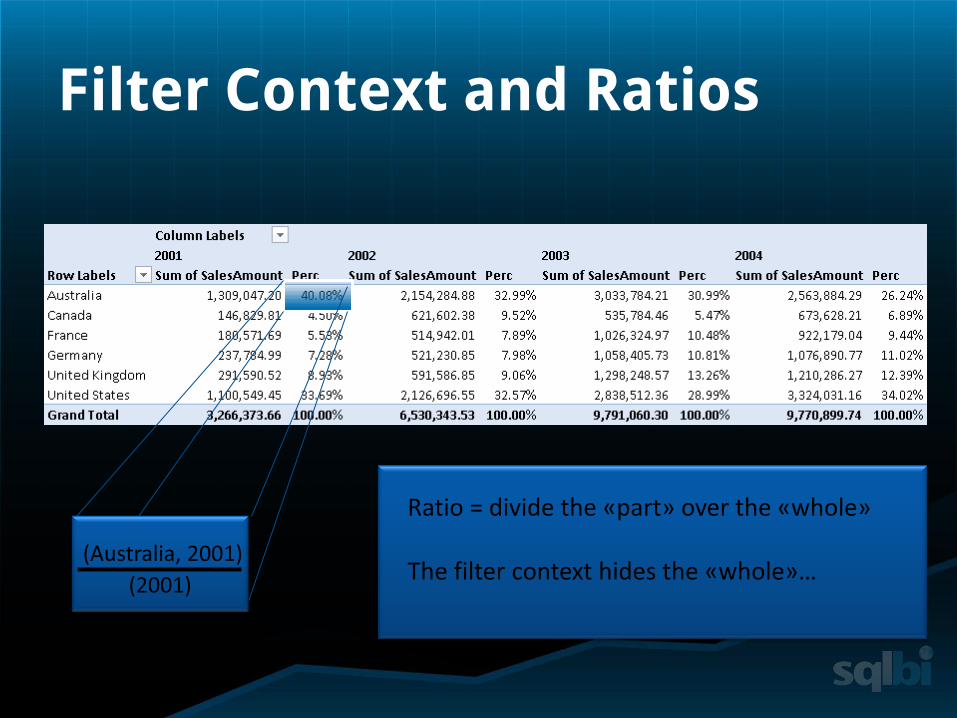
Filter Context and Ratios
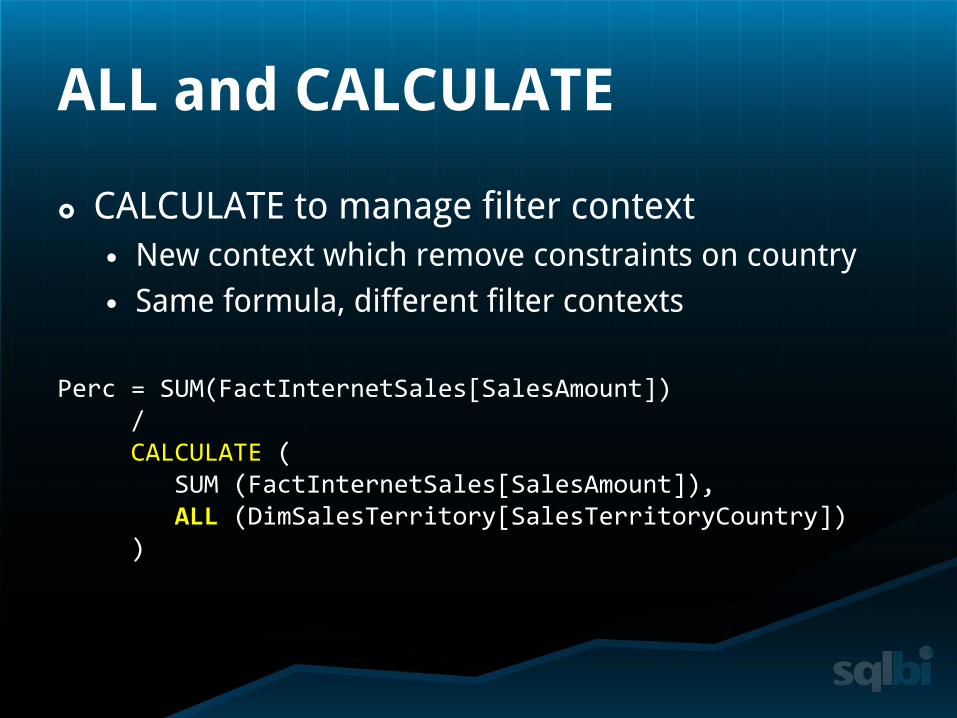
CALCULATE to manage filter context
New context which remove constraints on country
Same formula, different filter contexts
Perc = SUM(FactInternetSales[SalesAmount]) / CALCULATE ( SUM (FactInternetSales[SalesAmount]), ALL (DimSalesTerritory[SalesTerritoryCountry]) )
ALL and CALCULATE

sqlbi.com
A SMALL EXAMPLE OF HOW TO AGGREGATE DATA IN DAX

Semi Additive Measures
Additive Measure SUM over all dimensions
Non Additive Measure Different function over all dimensions
Example: average of the sale price
Semi Additive Measure SUM over some dimensions
Different function over other dimensions
Time is the standard exception for aggregations
Examples Warehouse stocking
Current account balance
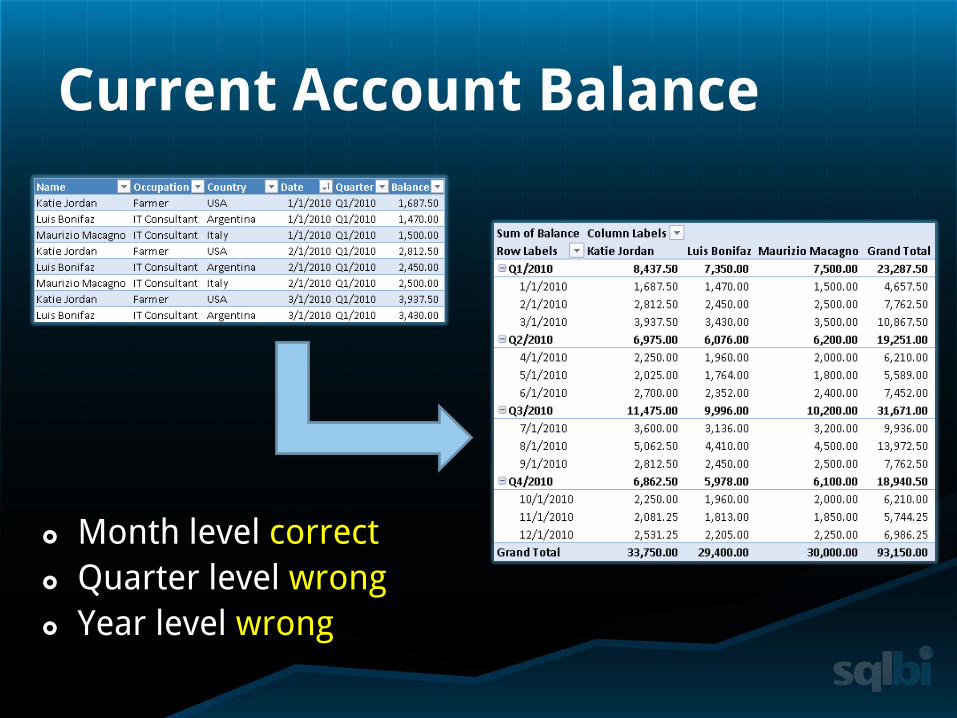
Current Account Balance
Month level correct
Quarter level wrong
Year level wrong
Semi Additive Measures in UDM
Aggregation function:
LastChild
LastNonEmpty
Performances not very impressive
Aggregations always needed
The aggregation is handled by the data model
In DAX, there is no default aggregation function. Thus, DAX is needed.

Semi Additive Measures
Create a calendar table
Add a new measure:
CALCULATE: to set the filter
LASTDATE: to find the last child
LastBalance = CALCULATE ( SUM( Balances[Balance] ), LASTDATE(Date[Date]) )

sqlbi.com
BANDING IN THE SELF SERVICE BI WORLD
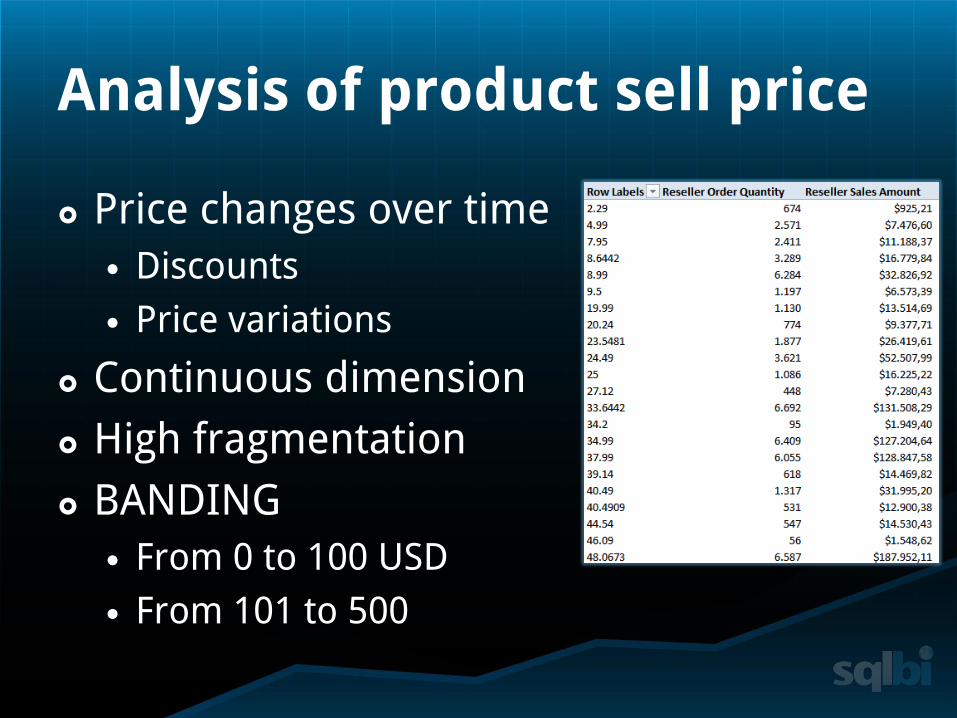
Analysis of product sell price
Price changes over time
Discounts
Price variations
Continuous dimension
High fragmentation
BANDING
From 0 to 100 USD
From 101 to 500
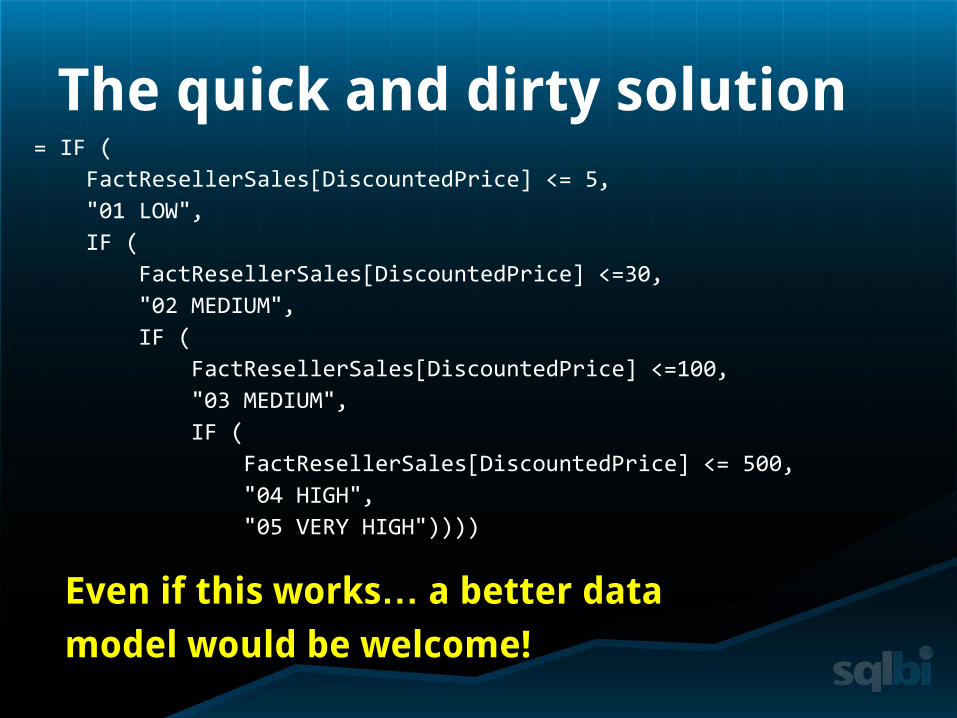
The quick and dirty solution
Even if this works… a better data
model would be welcome!
= IF (
FactResellerSales[DiscountedPrice] <= 5,
"01 LOW",
IF (
FactResellerSales[DiscountedPrice] <=30,
"02 MEDIUM",
IF (
FactResellerSales[DiscountedPrice] <=100,
"03 MEDIUM",
IF (
FactResellerSales[DiscountedPrice] <= 500,
"04 HIGH",
"05 VERY HIGH"))))
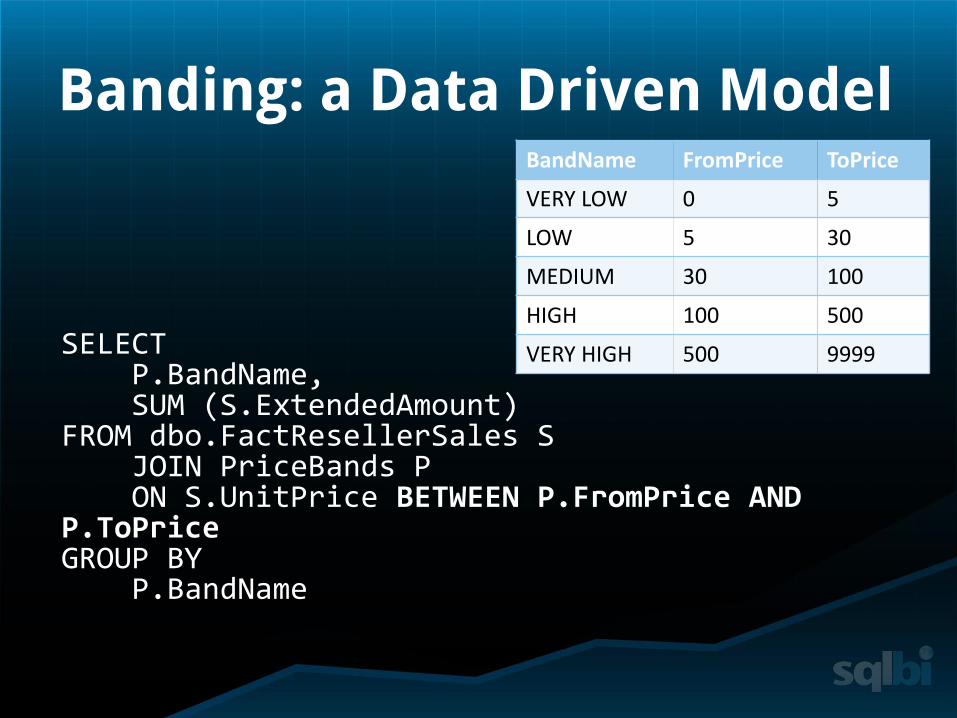
Banding: a Data Driven Model
SELECT P.BandName, SUM (S.ExtendedAmount) FROM dbo.FactResellerSales S JOIN PriceBands P ON S.UnitPrice BETWEEN P.FromPrice AND P.ToPrice GROUP BY P.BandName
BandName FromPrice ToPrice
VERY LOW 0 5
LOW 5 30
MEDIUM 30 100
HIGH 100 500
VERY HIGH 500 9999

Data Model with PowerPivot
SELECT P.BandName, SUM (S.ExtendedAmount) FROM dbo.FactResellerSales S JOIN PriceBands P ON S.UnitPrice = P.Price GROUP BY P.BandName
BandName Price
VERY LOW 1
VERY LOW 2
VERY LOW 3
VERY LOW 4
VERY LOW 5
LOW 6
LOW 7
… …

Band Expansion
Improve the Data Model
Cannot do this in PowerPivot
Write VBA code to transform data
Needs some VBA knowledge
BandName Price
VERY LOW 1
VERY LOW 2
VERY LOW 3
VERY LOW 4
VERY LOW 5
LOW 6
LOW 7
… …
BandName FromPrice ToPrice
VERY LOW 0 5
LOW 5 30
MEDIUM 30 100
HIGH 100 500
VERY HIGH 500 9999
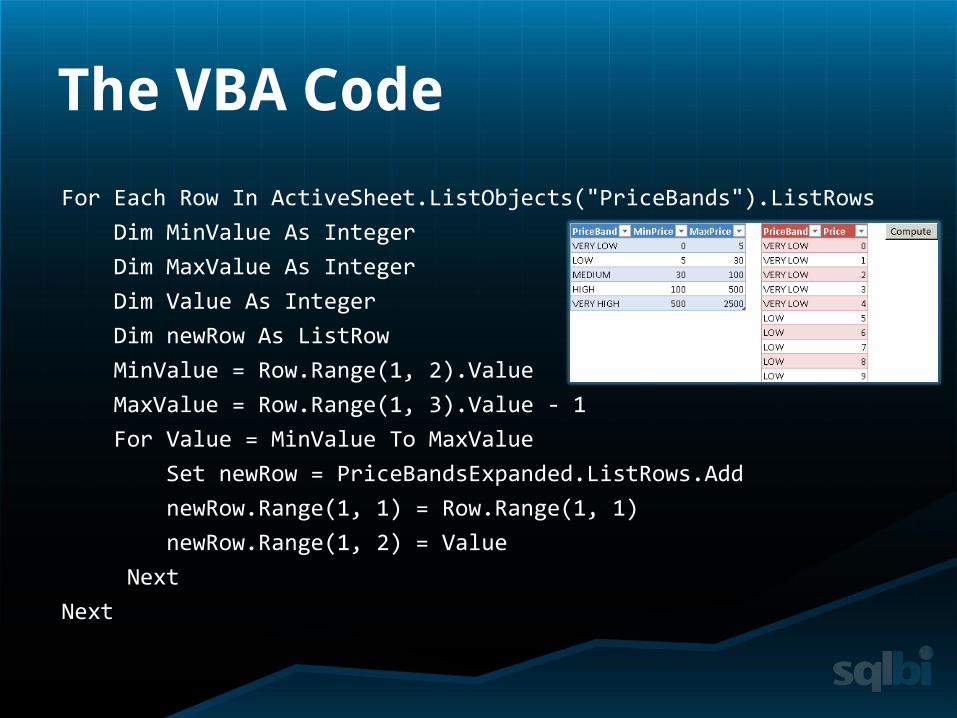
The VBA Code
For Each Row In ActiveSheet.ListObjects("PriceBands").ListRows
Dim MinValue As Integer
Dim MaxValue As Integer
Dim Value As Integer
Dim newRow As ListRow
MinValue = Row.Range(1, 2).Value
MaxValue = Row.Range(1, 3).Value - 1
For Value = MinValue To MaxValue
Set newRow = PriceBandsExpanded.ListRows.Add
newRow.Range(1, 1) = Row.Range(1, 1)
newRow.Range(1, 2) = Value
Next
Next
Issues With Band Expansion
Need to know Visual Basic for Application
Refresh needs two steps
Macro Enabled WorkBooks are not safe
Search for a new solution
Entirely based on DAX

Banding With DAX
Link only the configuration table
No need to perform expansion
The complexity moves to the expression
Again, DAX programming needed
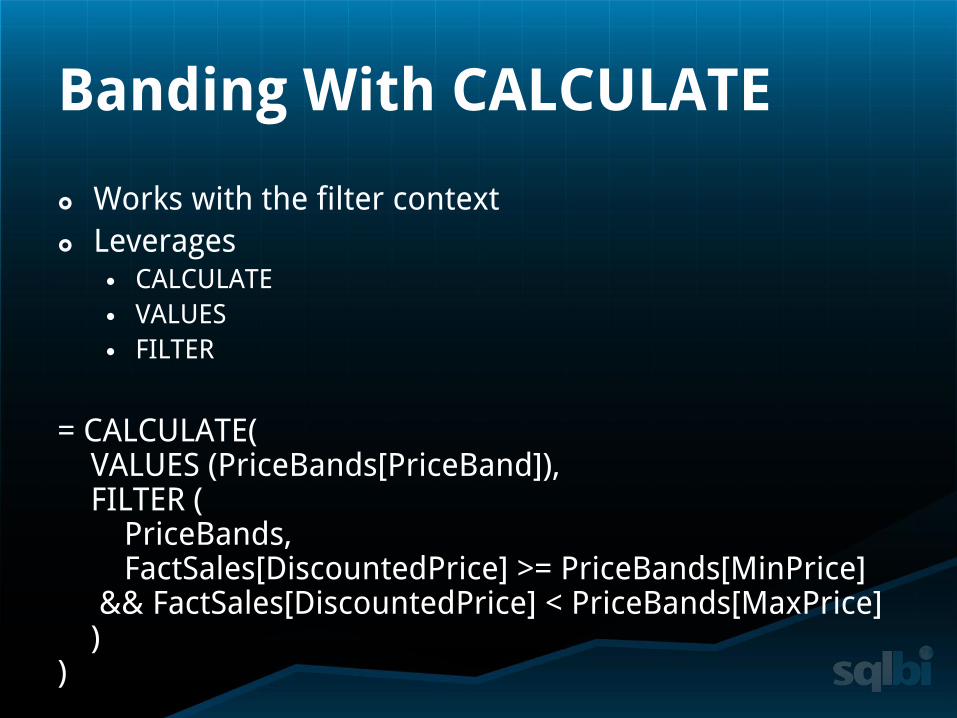
Banding With CALCULATE
Works with the filter context
Leverages CALCULATE
VALUES
FILTER
= CALCULATE( VALUES (PriceBands[PriceBand]), FILTER ( PriceBands, FactSales[DiscountedPrice] >= PriceBands[MinPrice] && FactSales[DiscountedPrice] < PriceBands[MaxPrice] ) )

sqlbi.com
WHAT IF WE WANT TO CHOOSE A NEW COURIER?

The background
We have some courier proposals, parameters are
Weight
Destination
Result is «Freight»
We need to choose the best one
Simulation based on the past shipments
Two problems
Determine the final weight of a shipment
Create a good simulation environment
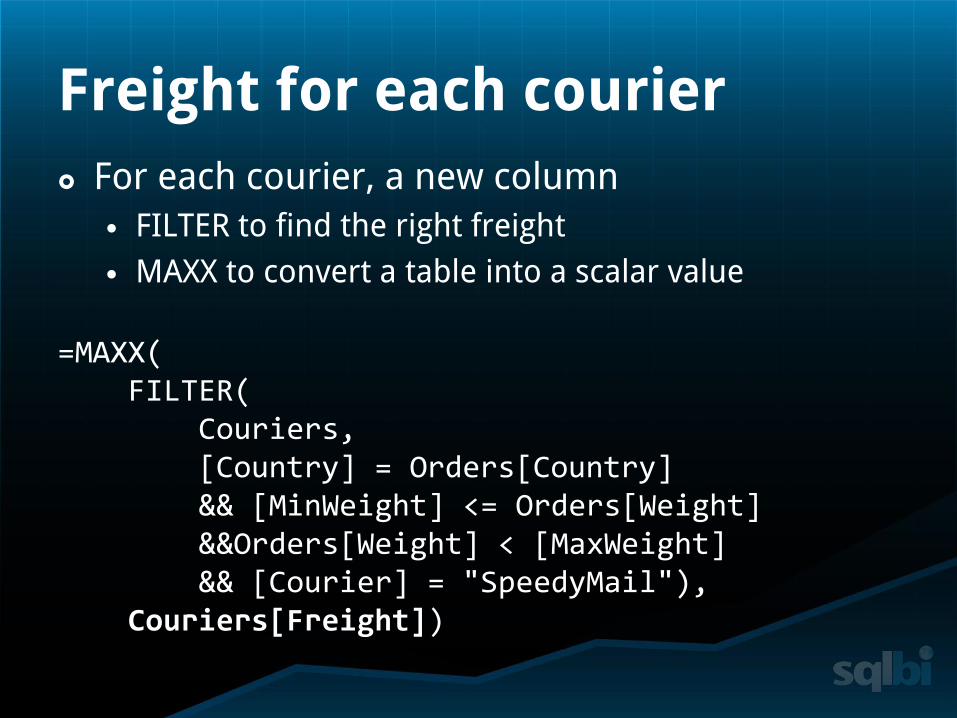
Freight for each courier
For each courier, a new column
FILTER to find the right freight
MAXX to convert a table into a scalar value
=MAXX( FILTER( Couriers, [Country] = Orders[Country] && [MinWeight] <= Orders[Weight] &&Orders[Weight] < [MaxWeight] && [Courier] = "SpeedyMail"), Couriers[Freight])
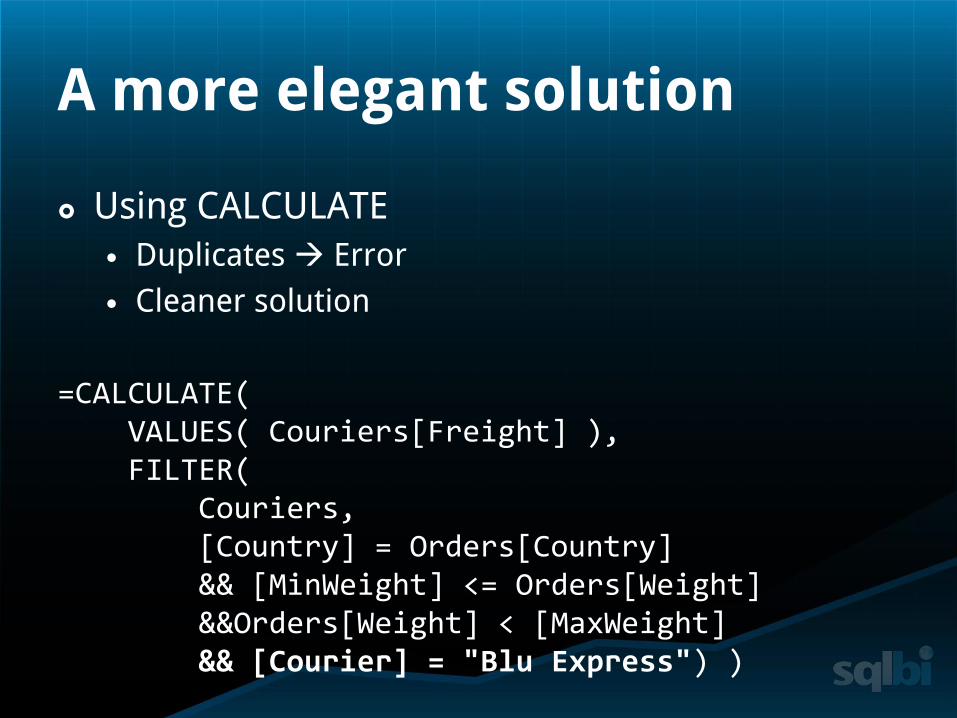
A more elegant solution
Using CALCULATE
Duplicates Error
Cleaner solution
=CALCULATE( VALUES( Couriers[Freight] ), FILTER( Couriers, [Country] = Orders[Country] && [MinWeight] <= Orders[Weight] &&Orders[Weight] < [MaxWeight] && [Courier] = "Blu Express") )
What if we have many couriers?
One calculated column for each courier Many columns
Data model needs to be updated based on data
Soon we will introduce mistakes
New solution New data model
Based on many to many relationship
Problems PowerPivot does not handle many to many
relationships
Less intuitive, yet very powerful
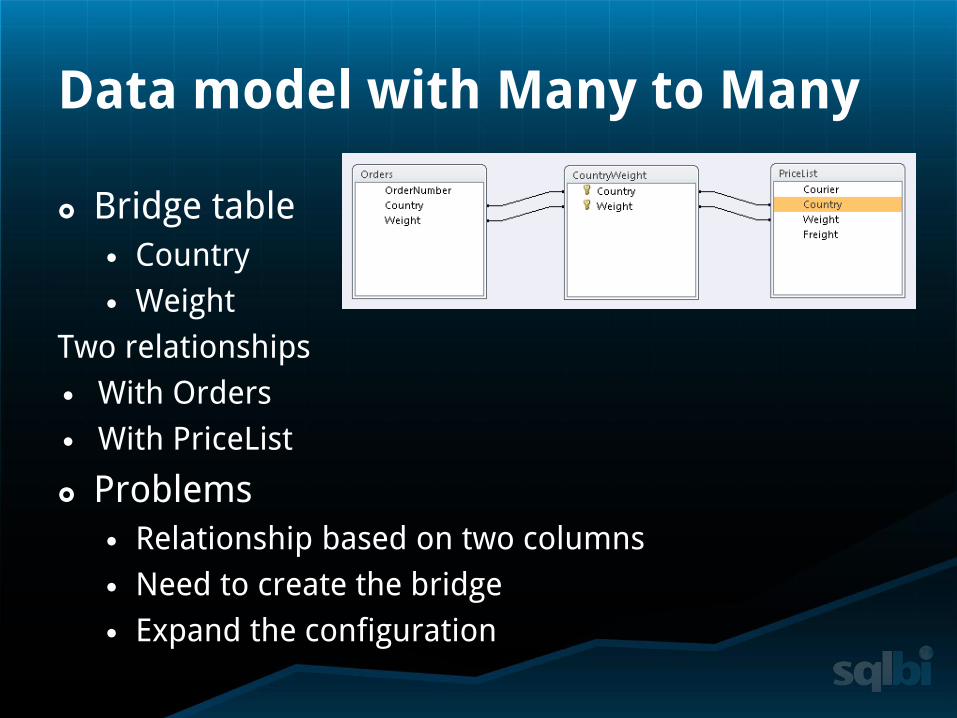
Data model with Many to Many
Bridge table
Country
Weight
Two relationships
With Orders
With PriceList
Problems
Relationship based on two columns
Need to create the bridge
Expand the configuration

Bridge creation and expansion
Similar to the banding solution
Easily solved with some VBA code
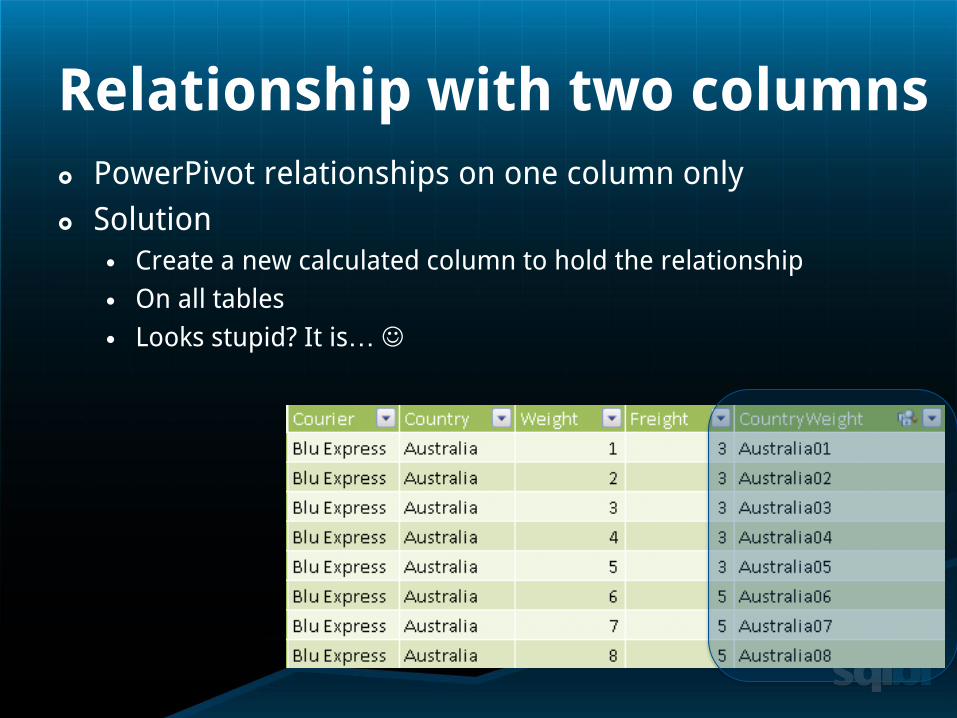
Relationship with two columns
PowerPivot relationships on one column only
Solution Create a new calculated column to hold the relationship
On all tables
Looks stupid? It is…
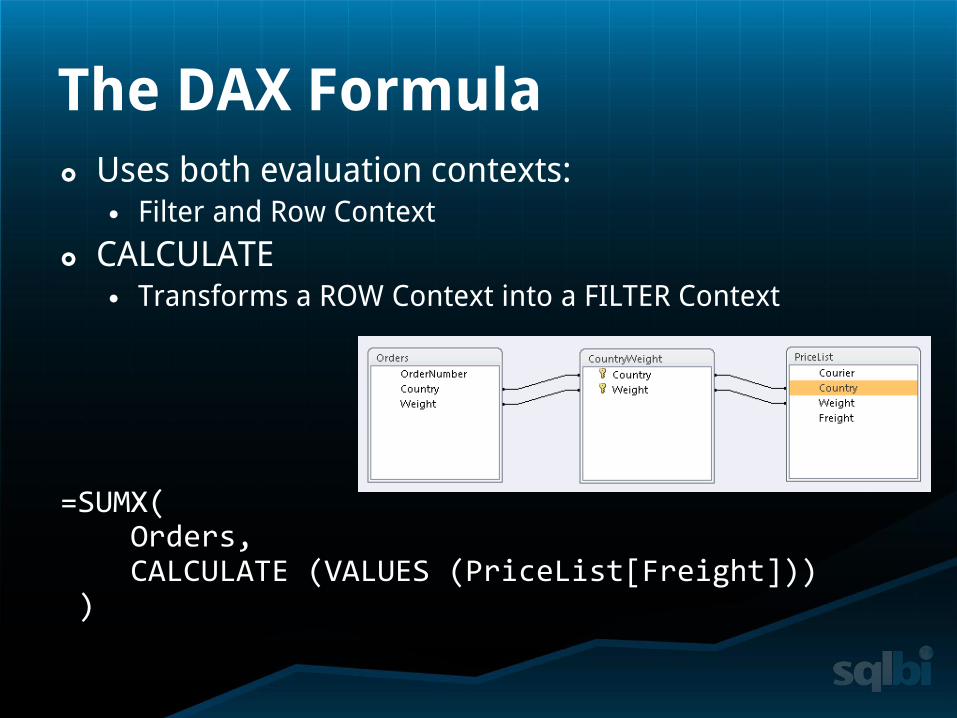
The DAX Formula Uses both evaluation contexts:
Filter and Row Context
CALCULATE Transforms a ROW Context into a FILTER Context
=SUMX( Orders, CALCULATE (VALUES (PriceList[Freight])) )

sqlbi.com
REAL-WORLD SCENARIO: AUDIENCE FOR TV BRODADCASTS
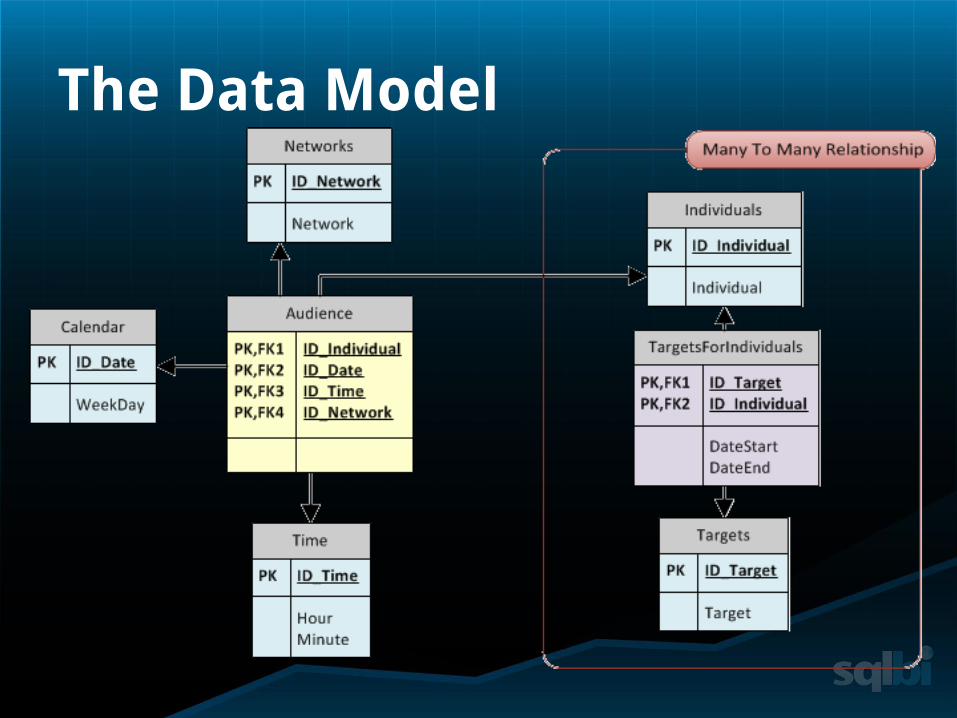
The Data Model
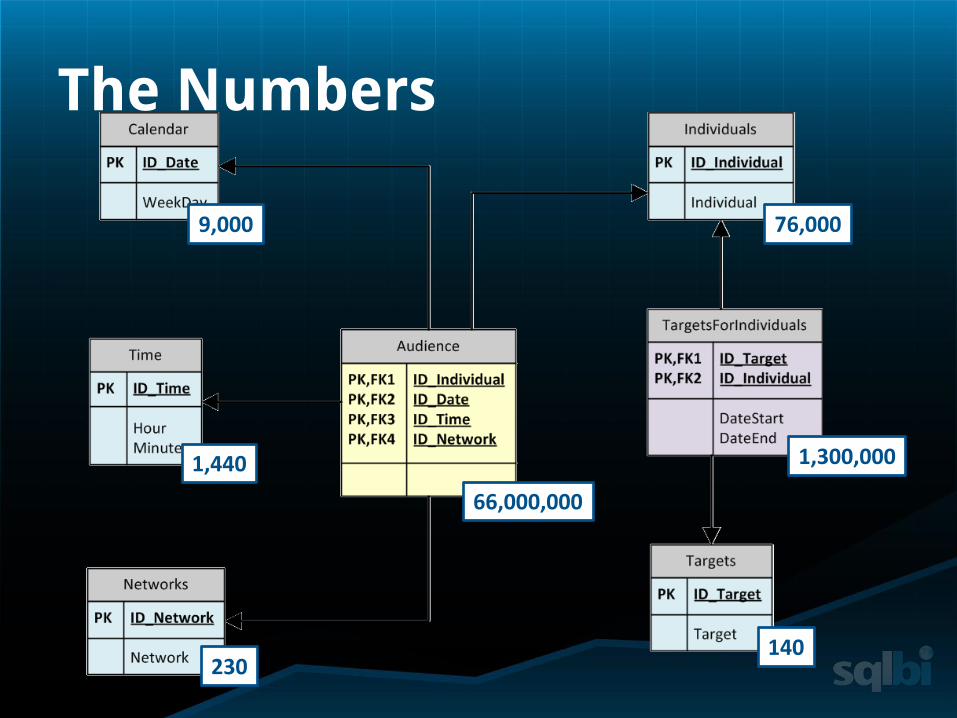
The Numbers
1,300,000
76,000
140 230
1,440
9,000
66,000,000

The Analysis
1,300,000
76,000
140
66,000,000
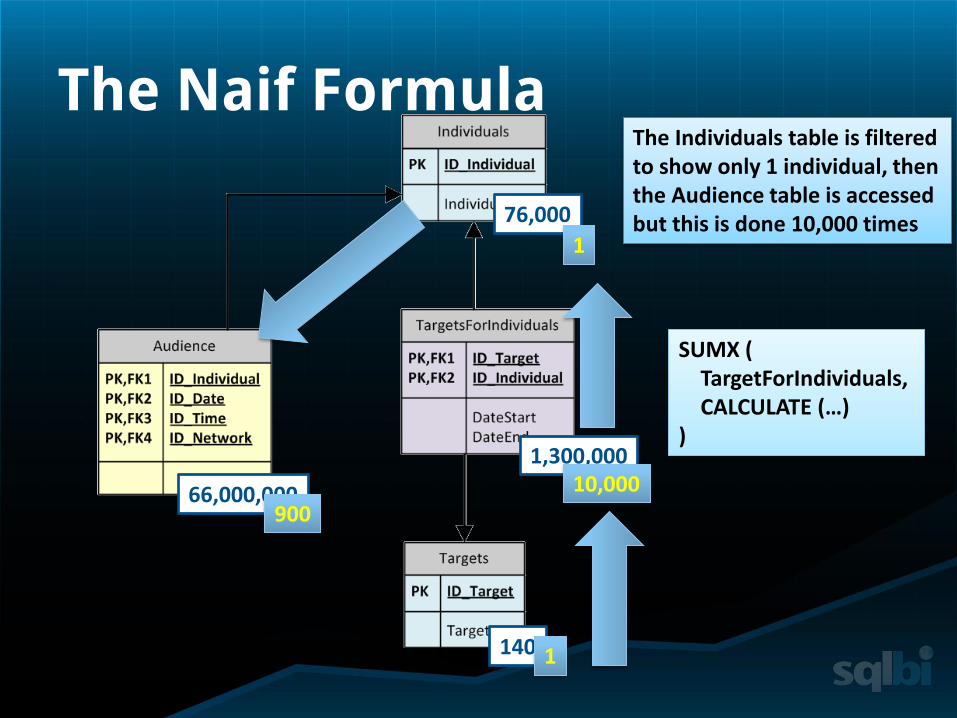
The Naif Formula
1,300,000
76,000
140
66,000,000
1
10,000
1
900
SUMX ( TargetForIndividuals, CALCULATE (…) )
The Individuals table is filtered to show only 1 individual, then the Audience table is accessed but this is done 10,000 times

A different approach
1,300,000
76,000
140
66,000,000
1
10,000
10,000
9,000,000
CALCULATE ( …, FILTER ( VALUES (Individuals), CALCULATE ( COUNTROWS ( TargetsForIndividuals ) > 0 … ) )
The Individuals table is filtered to show only 10,000 individuals, then the Audience table is read only once.
sqlbi.com
P/C HIERARCHIES IN POWERPIVOT, NOT VERY EASY, YET POSSIBLE.
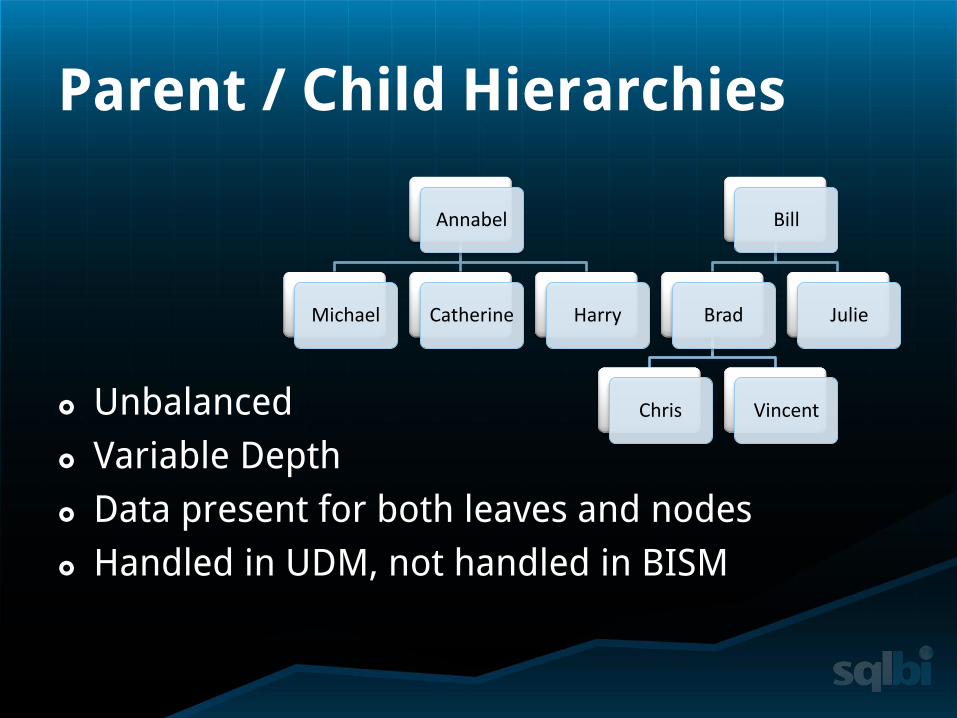
Parent / Child Hierarchies
Unbalanced
Variable Depth
Data present for both leaves and nodes
Handled in UDM, not handled in BISM
Annabel
Michael Catherine Harry
Bill
Brad
Chris Vincent
Julie
P/C Hierarchies in PowerPivot
Simply… not present in the modeling options
Naturalization is mandatory
But it is not enough
Naturalization should be done in SQL
Denali will have new functions to do that in DAX
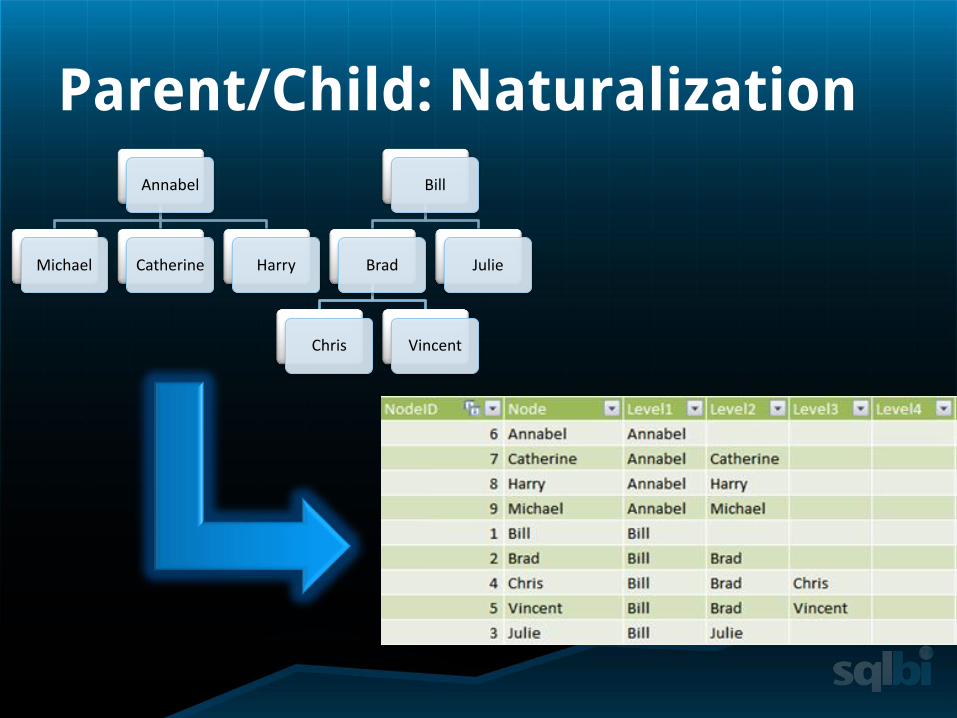
Parent/Child: Naturalization
Annabel
Michael Catherine Harry
Bill
Brad
Chris Vincent
Julie
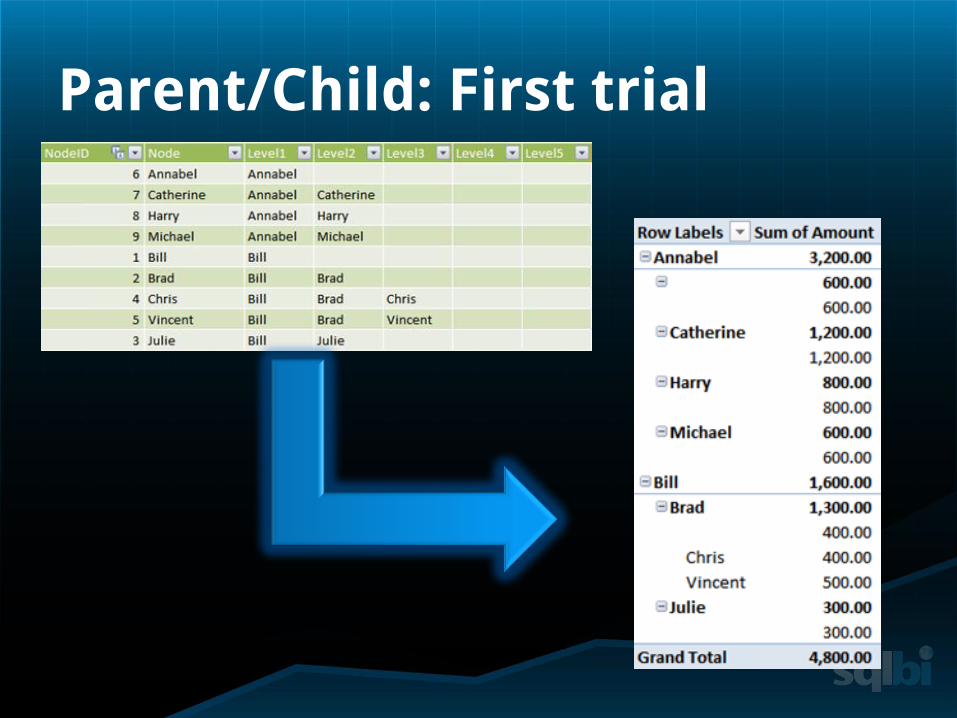
Parent/Child: First trial

Naturalization not NULL
Annabel
Michael Catherine Harry
Bill
Brad
Chris Vincent
Julie
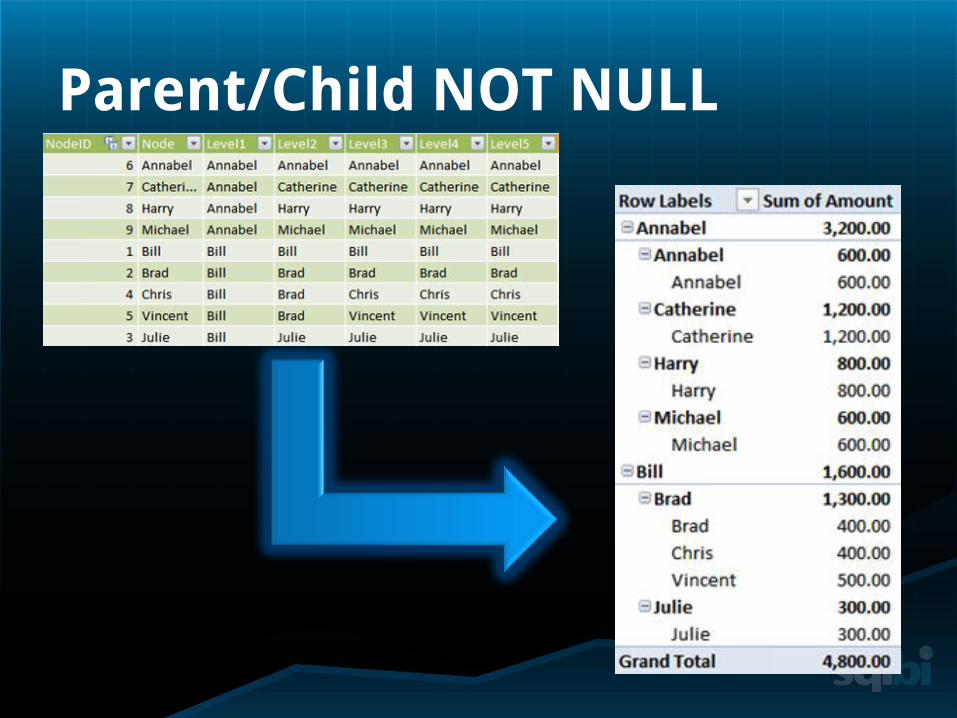
Parent/Child NOT NULL
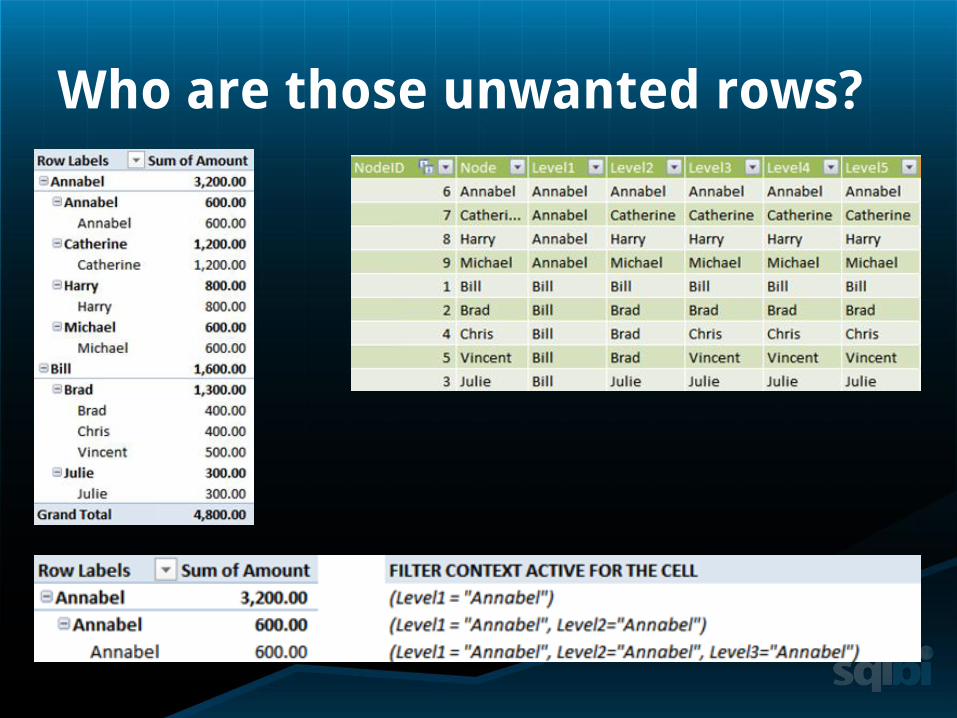
Who are those unwanted rows?
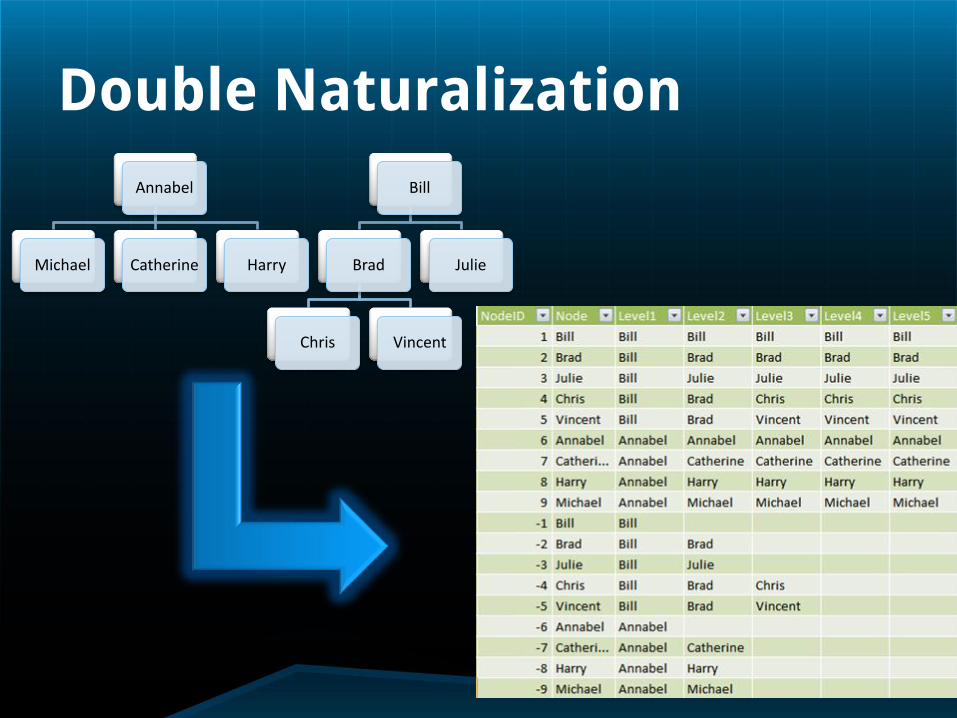
Double Naturalization
Annabel
Michael Catherine Harry
Bill
Brad
Chris Vincent
Julie
Double Naturalization

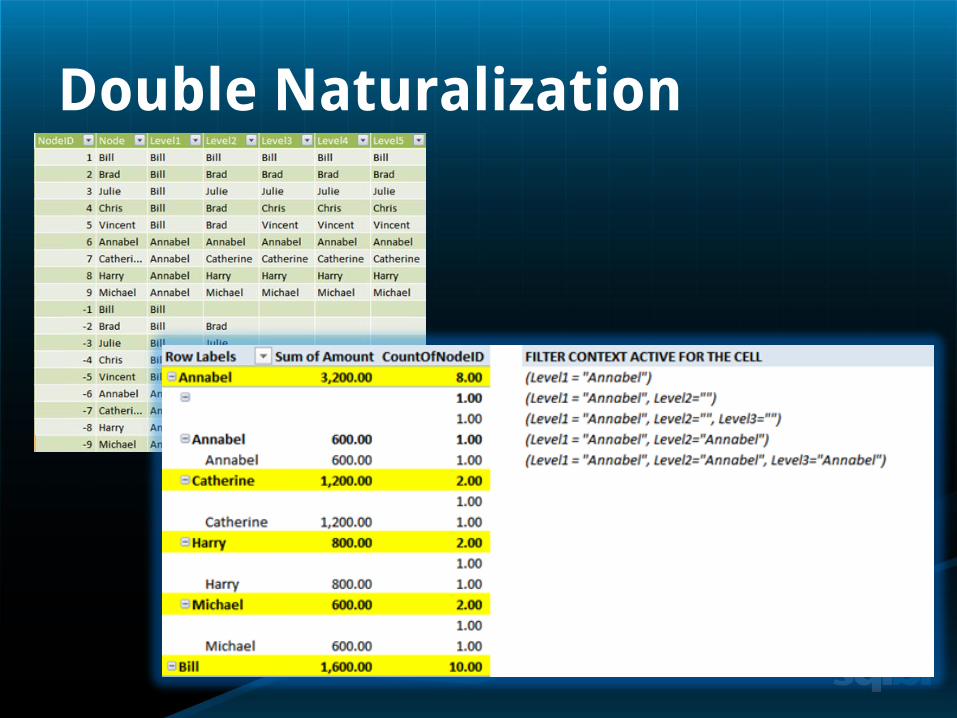
Double Naturalization
=IF(
[CountOfNodeID] > 1,
SUM (Invoices[Amount]),
BLANK ()
)
sqlbi.com
A NEW BOOK FROM SQLBI

sqlbi.com

Links
SQLBI Website www.sqlbi.com
PowerPivot Workshop www.powerpivotworkshop.com
Marco Russo blog www.sqlblog.com/blogs/marco_russo
Alberto Ferrari blog www.sqlblog.com/blogs/alberto_ferrari
For any question contact us at [email protected]

sqlbi.com


