47
Sealy Real Estate Services, LLC For Sale St. Jude Campus 3800 Viking Drive Bossier City, LA 71111 24 ± Acres | Partially Developed | 32,732 SF Under Roof
| Date post: | 24-Mar-2016 |
| Category: |
Documents |
| Upload: | sealy-company |
| View: | 218 times |
| Download: | 0 times |

Sealy Real Estate Services, LLC
For Sale
St. Jude Campus 3800 Viking Drive
Bossier City, LA 71111
24 ± Acres | Partially Developed | 32,732 SF Under Roof

St. Jude Campus
TABLE OF CONTENTS
I. Overview A. Opportunity B. Availability B. Local & Regional Market C. Location D. Property Description E. Demographics
II. Location Maps
A. Local B. Regional III. Aerial Photographs IV. The Property
A. Boundary Survey & Site Plan B. Improvements C. Photographs
V. Zoning
VI. Demographics & Traffic Count
VII. Market Information
Listed By:
Beth F. King, SIORDirect: 318.698.1103 Mobile: [email protected]
Sealy Real Estate Services, LLC333 Texas Street, Suite 1050Shreveport, LA 71101Phone: 318.222.8700 Fax: 318.222.4124
www.sealynet.com
All information set forth in this brochure has been obtained from the Owner and its representatives, personal observation and/or sources, which are deemed reliable. Sealy Real Estate Services, LLC has no reason to doubt its accuracy, but does not guarantee it, nor are there any representations or warranties, expressed or implied, in this brochure. This information is the property of Sealy Real Estate Services, LLC and is for the use of prospective buyers. Reproduction of the material contained herein is strictly prohibited. Information contained herein is subject to change or withdrawal without notice.
11

Overview
2

Opportunity
Sealy Real Estate Services, LLC is pleased to offer the opportunity to purchase a substantial commercial property that is partially developed and comprised of several buildings and structures situated on approximately 24 acres. The property is located on Viking Drive in Bossier City, Louisiana and this business corridor continues to be the preferred location for businesses expanding and locating in the Shreveport-Bossier City market.
Opportunity Drivers
Existing buildings and structures can services a wide variety of commercial uses.
Buildings and structures have been well maintained by a single user.
Approximately two-thirds of the land is available for further development.
Best location in the market. Enthusiastic municipality support (i.e., zoning, road
improvements, drainage, infrastructure). Bossier City is one of the fastest growing markets in
the south. The Bossier Parish population has seen an 18% increase in population in the last 10 years.
Availability
The St. Jude Campus is exclusively listed by Sealy Real Estate Services, LLC, with Beth F. King, SIOR, as the designated agent. Asking price for the entire tract and improvements is $2,600,000.00.
3

Local & Regional Market
North Louisiana and the state are consistently climbing the
national rankings for best business climate. In 2011,
Louisiana jumped to its highest-ever business climate
ranking by every leading publication that measures the
economic progress of states. Over the past four years, no
state has improved more than Louisiana. – North Louisiana
Economic Development Partnership
Multiple modes of transportation include the Port, I-49, I20,
major rail services and two airports. Our central location
for truck distribution exceeds capabilities of many major
markets. The Port offers advantages for importing and
exporting and international trade.
The area is a leader in healthcare and is home to Barksdale
Air Force Base, one of the preeminent air force bases in the
country. Casino gaming continues to draw activity to
Shreveport-Bossier and the movie industry’s draw to our
market has brought additional jobs and job diversification,
adding to what is already a very rich cultural history.
4

Location in the Market
The St. Jude Campus is situated in fast-growing north
Bossier and is just east of Airline Drive which is the major
thoroughfare through Bossier City. Airline Drive connects
the center of the city to South Bossier and Barksdale Air
Force Base on the south and the fast growing town of
Benton on the north. The Airline corridor is the home to
the predominant shopping venues, restaurants and
businesses. Intersecting Airline Drive is and I-20 which is
the primary connector to the east and west and are direct
routes to Dallas-Fort Worth and Jackson, Mississippi. Also
intersecting Airline Drive is I-220 which connects to I-49,
the major highway connecting north Louisiana to Little
Rock to the north and New Orleans and Baton Rouge to the
south.
The St. Jude Campus property’s location in the Viking Drive
corridor offers immediate access to premium retail,
restaurants, medical services, schools and well developed
neighborhoods. Other major commercial concerns and
investments will protect the area’s values for years to
come.
5
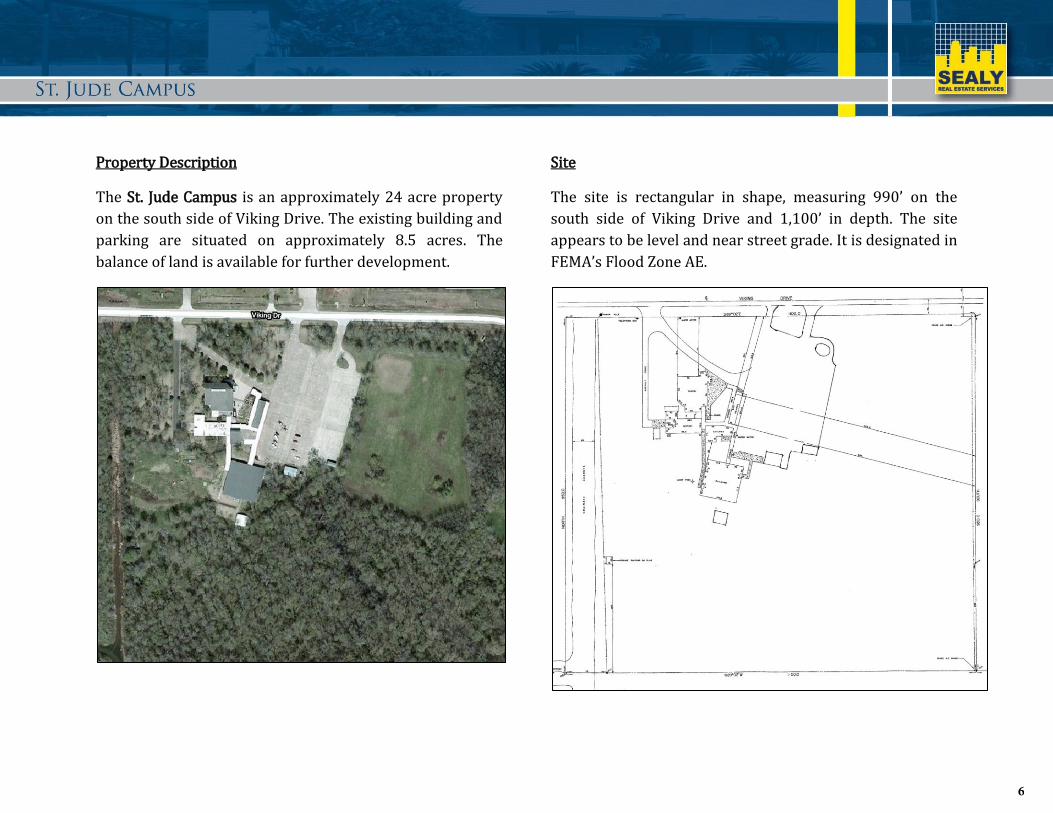
Property Description
The St. Jude Campus is an approximately 24 acre property
on the south side of Viking Drive. The existing building and
parking are situated on approximately 8.5 acres. The
balance of land is available for further development.
Site
The site is rectangular in shape, measuring 990’ on the
south side of Viking Drive and 1,100’ in depth. The site
appears to be level and near street grade. It is designated in
FEMA’s Flood Zone AE.
6

Improvements
Sanctuary 7,455 sf
Rectory/Offices 3,565 sf
Kitchen/Dining 2,333 sf
Office Building 1,650 sf
School Building 9,553 sf
Garage at Rectory 613 sf
Storage at Rectory 168 sf
Club House 770 sf
Rear Storage Building 750 sf
TOTAL 26,857 sf
Porches/Covered Walkways 5,875 sf
TOTAL UNDER ROOF 32,732 sf
Parking Approximately 2 acres of parking
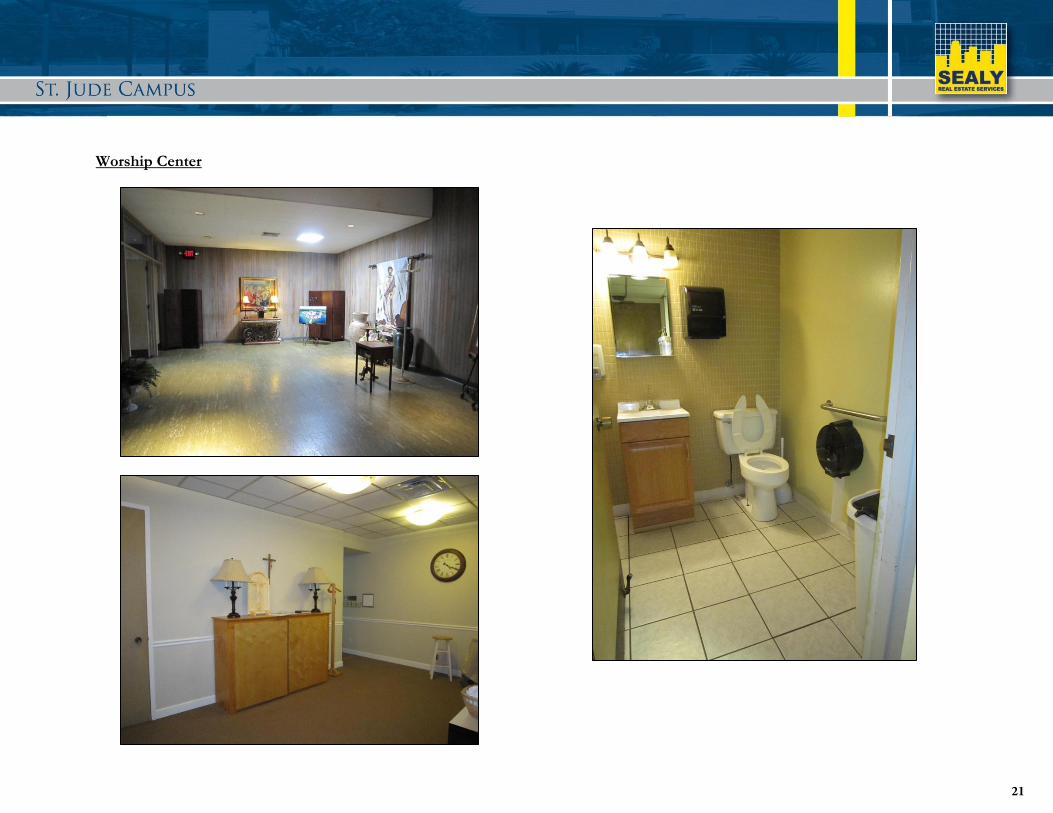
The Sanctuary measures 7,455 square feet and seats approximately 400. It was built in 1979 and has a concrete slab foundation with a wood frame and a brick veneer exterior. In addition to the foyer and open area, there are two restrooms, multiple storage closets and several rooms currently used for a chapel, a confessional and toddler room. Interior finishes are a mix of painted drywall and wood paneling, wood and tile flooring.
The Rectory was also built in 1979 and measures 3,565 square feet. It has a concrete slab foundation with wood frame and wood/brick veneer. Within the rectory is a full size apartment, secondary bedroom/bathroom/restroom, reception area, 4 offices with restroom, large meeting area, and various storage closets. The interior finishes are a mix of sheetrock and wood paneling and sheetrock ceilings.
The Kitchen/Dining (Fellowship Hall) is 2,333 square feet and has a commercial grade kitchen and pantry and large dining area. The walls are painted sheetrock and the floors are a commercial grade vinyl tile.
The Office Building measures 1,650 square feet and has 4 individual offices, each with an exterior entry. These offices would work equally well as class rooms. There is also a restroom and janitor’s closet. The interior finishes are carpeting and painted sheetrock walls with suspended ceilings.
The School Building is the largest of the structures and measures 9,553 square feet. It is a metal structure on a concrete slab with metal sidewalls and a metal roof. Interior finishes are commercial grade vinyl tile, painted sheetrock walls and acoustical ceiling tiles. The building has a large assembly room that comfortably seats 200, 10 classrooms, a supply room, two restrooms and various storage closets.
7

Demographics & Zoning
*Caddo and Bossier Parishes have a joint population of 371,948. With a population of 116,979 residents, Bossier Parish represents one of the fastest growing parishes in Louisiana. Unemployment in Bossier Parish stands at merely 5.3% (April 2012), much lower than the national unemployment rate of 7.7% (April 2012).
*Barksdale Air Force Base is the largest employer in northwest Louisiana and is located south of Bossier City. It employees more than 11,000 people and generates an annual economic impact of $753.8 million for the local community. In 2009, the Air Force’s newest command, Global Strike Command, was activated at Barksdale increasing the base’s importance as a military facility and economic engine.
*The median age in Bossier parish is 34.7 and the median age in Caddo is 36.4. 72% of Bossier’s population is white and 20.9% is African American. 49% of Caddo’s population is white and 47.2% is African American. Average household income in Bossier is $54,583. Average household income in Caddo is $49,550.
The property is currently zoned R-A and A-1. R-A (Residential Agricultural) zoning covers most of the improved portion of the property. A-1 (Airbase Buffer zone – North) zoning is designed to be compatible to air flight operations and activities that would not hamper flight operations.
* North Louisiana Economic Partnership
8
Location Maps
9

Regional Map
10

Local Map
11

Aerial Photographs
12

Aerial
13

24 ± Acres
14

The Property
15

Survey
16

Survey Close-Up
17

Exterior Photographs
18

Exterior Photographs
19

Worship Center
20
Worship Center
21

Assembly Building
22

School Building
23

School Building
Club House
24

Zoning
25

Red River
FlagLake
Swan LakeRange Blvd
Viking Dr
Shed Rd
Davis
Barksdale Blvd
Dogwood
E Texas St
Arthur Ray Teague Pky
Bobbi
Modica Lott
Swan Lake Rd
Stockwell Rd
Bodcau
Station
Modica
Benton Rd
Bayou Dr
Old Minden Rd
Hamilton Rd
Bodcau Spur
Hazel Jones Rd
Mayflower
Curtiss
Fox StRay Ave
Traffic St
Anita St
Industrial DrHoliday Pl
Tall Timber
Melrose Ave
Tilman Dr
Brownlee Rd
Jimmie Davis Hwy
Waller Ave
Crosscreek Dr
Foulois
Greenacres Blvd
Hollyhock Ln
Hollow Bluff
Old Shed Rd
Beckett St
Northside Dr
e-Linton
Mark Ave
Cove St
Gen. Ewell Dr
McDade St
Beverly St
Walker Pl
Garden St
Montgomery
Douglas DrBoone St
Smith
Bellevue Re
CaplisS
Shreveport Bellevue
E Texas St
Barksdale Blvd
Kansas City Southern RR
Union Pacific RR
Kansas City Southern RR
Kansas City Southern RR
Bossier Parish
Bossier Parish
Caddo Parish
Caddo Parish
ShreveportBarksdale Air Force Base
.-, 220.-, 220
.-, 220
.-, 20
(/ 79
"! 612
"! 612
Zoning CodesA-1A-2B-1B-2B-3B-4I-1I-2N-A
R-1R-2R-3R-4R-AR-MHPRDDRT-3
W I L B U R S M I T H A S S O C I A T E S
Bossier Comprehensive Land Use and Developm
ent Master Plan
Figure 5.6Bossier City Zoning
h:\planning\366890 - bossier comprehensive plan\gis\b_land use.apr (L5.6:Bossier City Zoning:8.5P)
26 APR 02 8:11
Bossier City-Parish MPC*Bossier City Corporate LimitsBarksdale Air Force Base
*Actual boundary not shown; boundary has been generalized for planning purposes
L E G E N D
N
0.50
0.51
Miles
26

Demographics &
Traffic Counts
27
Percent14.1%12.7%14.6%22.9%20.0%9.8%4.9%1.0%0.0%
Num
berPercent
548.2%
467.0%
507.6%
487.0%
578.8%
9815.9%
8011.8%
8211.5%
569.4%
397.7%
243.8%
91.4%
Num
berPercent
32448.6%
24336.7%
50.8%
111.7%
10.2%
429.1%
193.0%
7615.7%
Dem
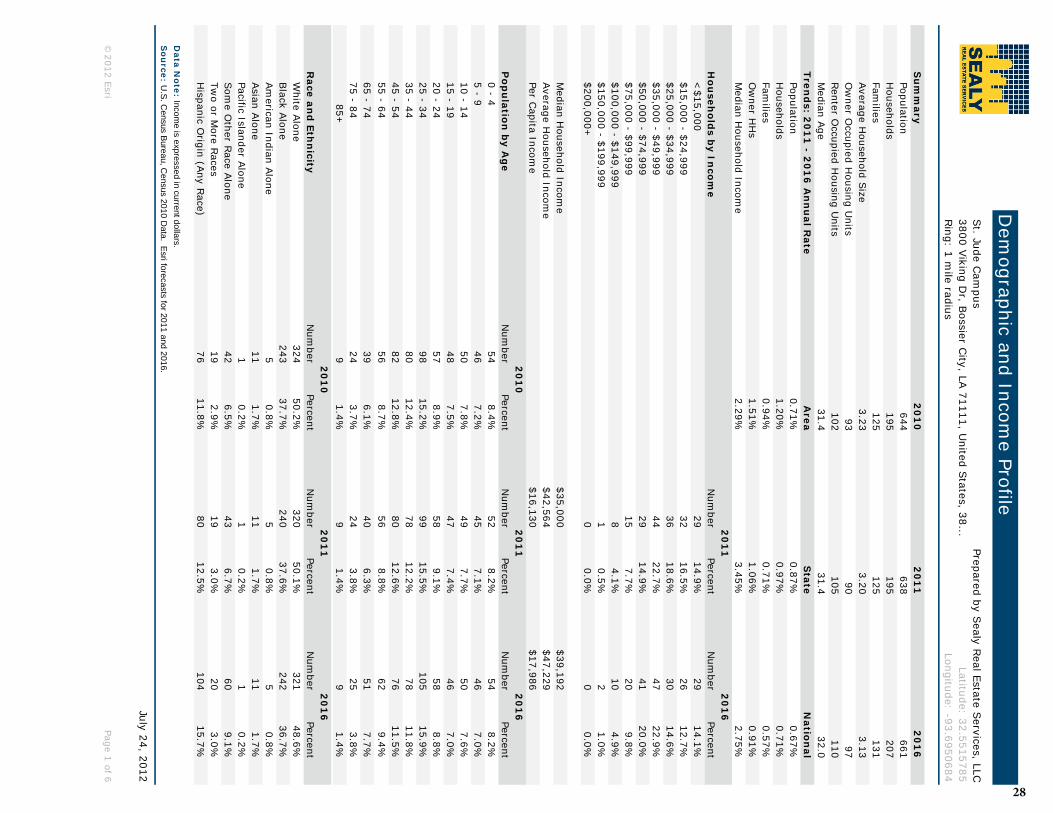
ographic and Income Profile
St. Jude C
ampus
Prepared by Sealy R
eal Estate Services, LLC
3800 Viking D
r, Bossier C
ity, LA 71111, U
nited States, 38...
Latitude: 32.5515785Ring: 1 m
ile radiusLongitude: -93.6950684
Su
mm
ary2
01
02
01
12
01
6Population
644638
661H
ouseholds195
195207
Families
125125
131Average H
ousehold Size
3.233.20
3.13O
wner O
ccupied Housing U
nits93
9097
Renter O
ccupied Housing U
nits102
105110
Median A
ge31.4
31.432.0
Trend
s: 20
11
- 20
16
An
nu
al Rate
Area
State
Natio
nal
Population0.71%
0.87%0.67%
Households
1.20%0.97%
0.71%Fam
ilies0.94%
0.71%0.57%
Ow
ner HH
s1.51%
1.06%0.91%
Median H
ousehold Income
2.29%3.45%
2.75%2
01
1
20
16
H
ou
seho
lds b
y Inco
me
Num
berPercent
Num
ber<
$15,00029
14.9%29
$15,000 - $24,99932
16.5%26
$25,000 - $34,99936
18.6%30
$35,000 - $49,99944
22.7%47
$50,000 - $74,99929
14.9%41
$75,000 - $99,99915
7.7%20
$100,000 - $149,9998
4.1%10
$150,000 - $199,9991
0.5%2
$200,000+0
0.0%0
Median H
ousehold Income
$35,000$39,192
Average Household Incom
e$42,564
$47,229Per C
apita Income
$16,130$17,986
20
10
2
01
1
20
16
P
op
ulatio
n b
y Ag
ePercent
Num
berPercent
Num
ber0 - 4
8.4%52
8.2%54
5 - 97.2%
457.1%
4610 - 14
7.8%49
7.7%50
15 - 197.5%
477.4%
4620 - 24
8.9%58
9.1%58
25 - 3415.2%
9915.5%
10535 - 44
12.4%78
12.2%78
45 - 5412.8%
8012.6%
7655 - 64
8.7%56
8.8%62
65 - 746.1%
406.3%
5175 - 84
3.7%24
3.8%25
85+1.4%
91.4%
92
01
0
20
11
2
01
6
Race an
d Eth
nicity
PercentN
umber
PercentN
umber
White Alone
50.2%320
50.1%321
Black Alone
37.7%240
37.6%242
American Indian Alone
0.8%5
0.8%5
Asian Alone
1.7%11
1.7%11
Pacific Islander Alone0.2%
10.2%
1Som
e Other R
ace Alone6.5%
436.7%
60Tw
o or More R
aces2.9%
193.0%
20H
ispanic Origin (Any R
ace)11.8%
8012.5%
104
Data N
ote: Income is expressed in current dollars.
Sou
rce: U.S
. Census B
ureau, Census 2010 D
ata. Esri forecasts for 2011 and 2016.
July 24, 2012
©2012 Esri
Page 1 of 6
28

Dem
ographic and Income Profile
St. Jude C
ampus
Prepared by Sealy R
eal Estate Services, LLC
3800 Viking D
r, Bossier C
ity, LA 71111, U
nited States, 38...
Latitude: 32.5515785Ring: 1 m
ile radiusLongitude: -93.6950684
2011 Percent Hispanic O
rigin: 12.5%
Sou
rce: U.S
. Census B
ureau, Census 2010 D
ata. Esri forecasts for 2011 and 2016.
July 24, 2012
©2012 Esri
Page 2 of 6
Area
StateU
SA
Trends 2011-2016
PopulationH
ouseholdsFam
iliesO
wner H
Hs
Median H
H Incom
e
Annual Rate (in percent)
3
2.52
1.51
0.50
20112016
Population by Age
0-45-9
10-1415-19
20-2425-34
35-4445-54
55-6465-74
75-8485+
Percent 14121086420
2011 Household Incom
e
<$15K
14.9%
$15K - $24K16.5%
$25K - $34K18.6%
$35K - $49K22.7%
$50K - $74K14.9%
$75K - $99K7.7%
$100K - $149K4.1%
$150K - $199K0.5%
2011 Population by Race
White
BlackAm
. Ind.Asian
PacificO
therTw
o+
Percent 50454035302520151050
29

Percent16.9%10.6%9.6%
14.1%19.6%13.3%10.2%3.4%2.3%
Num
berPercent
5,8617.9%
5,4607.4%
4,9596.7%
5,0176.2%
6,3258.0%
11,97316.4%
9,37912.0%
9,84311.8%
7,53910.7%
4,4537.4%
2,8913.9%
1,1541.6%
Num
berPercent
43,44657.8%
25,49632.7%
3490.5%
1,3291.9%
1060.2%
2,3834.3%
1,7442.6%
5,3689.4%
Dem
ographic and Income Profile
St. Jude C
ampus
Prepared by Sealy R
eal Estate Services, LLC
3800 Viking D
r, Bossier C
ity, LA 71111, U
nited States, 38...
Latitude: 32.5515785Ring: 5 m
ile radiusLongitude: -93.6950684
Su
mm
ary2
01
02
01
12
01
6Population
74,85375,769
81,050H
ouseholds29,797
30,06732,216
Families
18,16918,482
19,758Average H
ousehold Size
2.412.42
2.42O
wner O
ccupied Housing U
nits15,012
14,88116,267
Renter O
ccupied Housing U
nits14,785
15,18715,949
Median A
ge33.0
33.033.3
Trend
s: 20
11
- 20
16
An
nu
al Rate
Area
State
Natio
nal
Population1.36%
0.87%0.67%
Households
1.39%0.97%
0.71%Fam
ilies1.34%
0.71%0.57%
Ow
ner HH
s1.80%
1.06%0.91%
Median H
ousehold Income
3.87%3.45%
2.75%2
01
1
20
16
H
ou
seho
lds b
y Inco
me
Num
berPercent
Num
ber<
$15,0005,347
17.8%5,457
$15,000 - $24,9994,168
13.9%3,423
$25,000 - $34,9993,673
12.2%3,093
$35,000 - $49,9994,571
15.2%4,543
$50,000 - $74,9995,044
16.8%6,311
$75,000 - $99,9993,073
10.2%4,289
$100,000 - $149,9992,731
9.1%3,271
$150,000 - $199,999857
2.9%1,092
$200,000+604
2.0%736
Median H
ousehold Income
$39,891$48,230
Average Household Incom
e$56,043
$63,322Per C
apita Income
$23,475$26,373
20
10
2
01
1
20
16
P
op
ulatio
n b
y Ag
ePercent
Num
berPercent
Num
ber0 - 4
7.8%5,880
7.8%6,422
5 - 97.3%
5,5427.3%
5,96710 - 14
6.6%5,020
6.6%5,425
15 - 196.7%
5,0346.6%
5,00820 - 24
8.5%6,404
8.5%6,492
25 - 3416.0%
12,18816.1%
13,27235 - 44
12.5%9,446
12.5%9,747
45 - 5413.2%
9,85613.0%
9,59655 - 64
10.1%7,691
10.2%8,689
65 - 745.9%
4,6186.1%
5,95775 - 84
3.9%2,923
3.9%3,177
85+1.5%
1,1641.5%
1,2982
01
0
20
11
2
01
6
Race an
d Eth
nicity
PercentN
umber
PercentN
umber
White Alone
58.0%44,129
58.2%46,883
Black Alone
34.1%25,562
33.7%26,514
American Indian Alone
0.5%350
0.5%384
Asian Alone
1.8%1,341
1.8%1,526
Pacific Islander Alone0.1%
1070.1%
129Som
e Other R
ace Alone3.2%
2,5033.3%
3,525Tw
o or More R
aces2.3%
1,7772.3%
2,090H
ispanic Origin (Any R
ace)7.2%
5,6517.5%
7,652
Data N
ote: Income is expressed in current dollars.
Sou
rce: U.S
. Census B
ureau, Census 2010 D
ata. Esri forecasts for 2011 and 2016.
July 24, 2012
©2012 Esri
Page 3 of 6
30

Dem
ographic and Income Profile
St. Jude C
ampus
Prepared by Sealy R
eal Estate Services, LLC
3800 Viking D
r, Bossier C
ity, LA 71111, U
nited States, 38...
Latitude: 32.5515785Ring: 5 m
ile radiusLongitude: -93.6950684
2011 Percent Hispanic O
rigin: 7.5%
Sou
rce: U.S
. Census B
ureau, Census 2010 D
ata. Esri forecasts for 2011 and 2016.
July 24, 2012
©2012 Esri
Page 4 of 6
Area
StateU
SA
Trends 2011-2016
PopulationH
ouseholdsFam
iliesO
wner H
Hs
Median H
H Incom
e
Annual Rate (in percent)
3.53
2.52
1.51
0.50
20112016
Population by Age
0-45-9
10-1415-19
20-2425-34
35-4445-54
55-6465-74
75-8485+
Percent 1614121086420
2011 Household Incom
e
<$15K
17.8%
$15K - $24K13.9%
$25K - $34K12.2%
$35K - $49K15.2%
$50K - $74K16.8%
$75K - $99K10.2%
$100K - $149K9.1%
$150K - $199K2.9%
$200K+2.0%
2011 Population by Race
White
BlackAm
. Ind.Asian
PacificO
therTw
o+
Percent 5550454035302520151050
31

Percent16.9%10.6%9.3%
14.1%19.9%12.3%10.3%3.7%2.9%
Num
berPercent
18,0447.4%
17,1047.0%
16,1446.7%
16,9266.5%
19,0687.6%
36,09315.2%
28,46711.2%
32,29312.1%
27,18012.0%
15,8828.1%
10,5674.4%
4,2251.8%
Num
berPercent
123,74351.1%
105,37842.6%
1,0310.4%
3,4501.6%
2050.1%
3,8672.2%
4,3192.0%
9,8575.4%
Dem
ographic and Income Profile
St. Jude C
ampus
Prepared by Sealy R
eal Estate Services, LLC
3800 Viking D
r, Bossier C
ity, LA 71111, U
nited States, 38...
Latitude: 32.5515785Ring: 10 m
ile radiusLongitude: -93.6950684
Su
mm
ary2
01
02
01
12
01
6Population
241,993243,172
251,003H
ouseholds96,390
96,834100,591
Families
60,70461,194
62,958Average H
ousehold Size
2.452.45
2.43O
wner O
ccupied Housing U
nits55,320
54,43457,295
Renter O
ccupied Housing U
nits41,070
42,40043,295
Median A
ge34.3
34.334.8
Trend
s: 20
11
- 20
16
An
nu
al Rate
Area
State
Natio
nal
Population0.64%
0.87%0.67%
Households
0.76%0.97%
0.71%Fam
ilies0.57%
0.71%0.57%
Ow
ner HH
s1.03%
1.06%0.91%
Median H
ousehold Income
3.68%3.45%
2.75%2
01
1
20
16
H
ou
seho
lds b
y Inco
me
Num
berPercent
Num
ber<
$15,00017,137
17.7%17,025
$15,000 - $24,99913,307
13.7%10,680
$25,000 - $34,99911,426
11.8%9,356
$35,000 - $49,99914,280
14.7%14,136
$50,000 - $74,99915,921
16.4%20,029
$75,000 - $99,99910,144
10.5%12,388
$100,000 - $149,9998,995
9.3%10,336
$150,000 - $199,9992,930
3.0%3,716
$200,000+2,693
2.8%2,924
Median H
ousehold Income
$40,679$48,734
Average Household Incom
e$58,606
$65,544Per C
apita Income
$24,204$27,137
20
10
2
01
1
20
16
P
op
ulatio
n b
y Ag
ePercent
Num
berPercent
Num
ber0 - 4
7.5%17,878
7.4%18,603
5 - 97.1%
17,1337.0%
17,56110 - 14
6.7%16,202
6.7%16,760
15 - 197.0%
16,9057.0%
16,22920 - 24
7.9%19,212
7.9%18,957
25 - 3414.9%
36,40215.0%
38,10835 - 44
11.8%28,457
11.7%28,228
45 - 5413.3%
32,18013.2%
30,27855 - 64
11.2%27,609
11.4%30,167
65 - 746.6%
16,3376.7%
20,35375 - 84
4.4%10,620
4.4%11,151
85+1.7%
4,2381.7%
4,6082
01
0
20
11
2
01
6
Race an
d Eth
nicity
PercentN
umber
PercentN
umber
White Alone
51.1%124,705
51.3%128,187
Black Alone
43.5%105,353
43.3%106,937
American Indian Alone
0.4%1,033
0.4%1,106
Asian Alone
1.4%3,462
1.4%3,912
Pacific Islander Alone0.1%
2060.1%
242Som
e Other R
ace Alone1.6%
4,0471.7%
5,597Tw
o or More R
aces1.8%
4,3671.8%
5,022H
ispanic Origin (Any R
ace)4.1%
10,3094.2%
13,621
Data N
ote: Income is expressed in current dollars.
Sou
rce: U.S
. Census B
ureau, Census 2010 D
ata. Esri forecasts for 2011 and 2016.
July 24, 2012
©2012 Esri
Page 5 of 6
32

Dem
ographic and Income Profile
St. Jude C
ampus
Prepared by Sealy R
eal Estate Services, LLC
3800 Viking D
r, Bossier C
ity, LA 71111, U
nited States, 38...
Latitude: 32.5515785Ring: 10 m
ile radiusLongitude: -93.6950684
2011 Percent Hispanic O
rigin: 4.2%
Sou
rce: U.S
. Census B
ureau, Census 2010 D
ata. Esri forecasts for 2011 and 2016.
July 24, 2012
©2012 Esri
Page 6 of 6
Area
StateU
SA
Trends 2011-2016
PopulationH
ouseholdsFam
iliesO
wner H
Hs
Median H
H Incom
e
Annual Rate (in percent)
3.53
2.52
1.51
0.50
20112016
Population by Age
0-45-9
10-1415-19
20-2425-34
35-4445-54
55-6465-74
75-8485+
Percent 1514131211109876543210
2011 Household Incom
e
<$15K
17.7%
$15K - $24K13.7%
$25K - $34K11.8%
$35K - $49K14.7%
$50K - $74K16.4%
$75K - $99K10.5%
$100K - $149K9.3%
$150K - $199K3.0%
$200K+2.8%
2011 Population by Race
White
BlackAm
. Ind.Asian
PacificO
therTw
o+
Percent 50454035302520151050
33

Traffic Counts
LA. 3105 (Airline Dr.) @ Viking Dr. (074)
Date N/B S/B E/B W/B Total
09-Jun-2010 17423 16200 4260 4455 42338
LA. 3105 (Airline Dr.) @ Swan Lake Rd./Vanceville Rd.
(802)
Date N/B S/B E/B W/B Total
22-Jan-2009 6272 6299 380 1610 14561
LA. 3105 (Airline Dr.) @ I-220 (E/B) (084.1)
Date N/B S/B E/B W/B Total
03-Jun-2010 19327 18796 7233 0 45356
Swan Lake Rd. @ Viking Dr. (996)
Date N/B S/B E/B W/B Total
02-Oct-2009 5296 5335 2675 1753 15059
34
Information obtained from North Louisiana Economic Partnership – www.nlep.com
Market Information
35

Information obtained from North Louisiana Economic Partnership – www.nlep.com
Louisiana Ranked Among Top 5 States For Best Business Climate In The U.S.
Business Facilities magazine: Louisiana rises to No. 5 in 2012 – its highest position ever – 7/20/2012
BATON ROUGE, La. — Today, Gov. Bobby Jindal hailed Louisiana's highest-ever business climate ranking – No. 5 by Business Facilities – as a fresh signal of Louisiana's emergence as one of America's top climates for business investment and job creation.
Louisiana rose from No. 7 in 2011 to No. 5 in the magazine's 2012 State Rankings Report, after the state had climbed into the Top 10 at No. 8 in 2010, when Business Facilities also named Louisiana its State of the Year.
Gov. Jindal said, "This ranking speaks volumes about our work to eliminate burdensome business taxes, rein in excessive spending, reform our ethics system, and overhaul our workforce development system. Indeed, the ranking demonstrates that our efforts are paying off, but more importantly, it shows that the business world is taking notice of Louisiana and more and more companies are moving here to create jobs and opportunity for our people. Today's announcement is great news, but we are not stopping here. We will not be satisfied until Louisiana is the best place in the world for businesses to invest and create jobs so that all of our sons and daughters can pursue their dreams right here at home."
Louisiana's No. 5 Business Facilities ranking continues a trend of rising business climate rankings. Before its upswing began in 2008, Louisiana typically languished in the lower tier of state
business climate rankings. Today, Area Development ranks Louisiana No. 6 in the magazine's Top States for Doing Business report, while Site Selection magazine ranks Louisiana No. 7 among the best business climates in the U.S. Louisiana now stands at its highest-ever position in every major ranking of state business climates, including those published by Area Development, Business Facilities, CNBC, Forbes, Pollina Corporate Real Estate, Site Selection and Chief Executive.
In its 2012 Rankings Report, Business Facilities writes that Louisiana "has married an unmatched workforce training program with a bevy of new incentives that are spurring hot new growth sectors, including digital media."
Since 2008, Louisiana has secured economic development projects that are creating more than 51,500 new direct and indirect jobs, more than $12.6 billion in new capital investment and hundreds of millions in new sales for small businesses across the state. Diverse new investments from leading digital media/technology companies – including CenturyLink, GE Capital, Schumacher Group, Gameloft and EA – along with world-scale investments by such companies as Sasol Ltd., Cheniere Energy, Nucor and others have generated an unprecedented level of business investment interest in Louisiana.
Business Facilities has been a leading source of intelligence on corporate expansion and relocation projects since 1968. For more on the 2012 Rankings Report, visit www.businessfacilities.com.
36

Information obtained from North Louisiana Economic Partnership – www.nlep.com
North Louisiana: No. 1 Lowest Cost of Doing Business in the Nation and in North America
Forbes named North Louisiana the most cost competitive place to do business in the United States. Business Facilities magazine named North Louisiana No. 3 among Low Cost Manufacturing Centers. KPMG Competitive Alternatives recognized the region as the No.1 most cost competitive area in North America in 2008 and in 2010. These rankings all point to the fact that North Louisiana offers a competitive cost structure.
A COMBINATION OF FACTORS PROVIDE A LOW COST OF DOING BUSINESS IN LOUISIANA:
The state effectively provides a zero corporate income tax environment for items produced in Louisiana and shipped out of state (single sales tax apportionment).
As of July 2009, electricity, water, natural gas, machinery and equipment used by manufacturers are exempt from Louisiana sales tax.
Louisiana has a low percentage of unionized workers (4.3 percent reported by U.S. Bureau of Labor Statistics, 2010), and the ratio of worker skill-to-pay favors businesses.
Louisiana businesses have access to a competitive, comprehensive portfolio of state, local and federal incentives that can make a profound impact on a company’s bottom line.
37

Information obtained from North Louisiana Economic Partnership – www.nlep.com
Tax Structure: Cost of Doing Business
State Corporate Income Tax
4% on the first $25,000 of net income
5% on the next $25,000
6% on the next $50,000
7% on the next $100,000
8% on the excess of $200,000
Louisiana uses single sales factor
State Corporate Franchise Tax**
$1.50 per $1,000 or major fraction thereof up to $300,000
$3.00 per $1,000 or major fraction thereof in excess of $300,000
Unemployment Insurance Tax
Standard rate range is .10% - 6.2%
Rate for new employers is the average rate for the particular industry
Maximum unemployment weekly benefit is $258 for 26 weeks
Sales Taxes
4% sales tax with a local sale tax component, which combined ranges from 7%-10%
Check out local sale tax rates
As of July 2009, electricity, water, natural gas, machinery and equipment used by manufacturers are exempt from Louisiana sales tax
State Property Taxes (Mills*)
15% of assessed valuation
Up to 2% of taxable value
Industrial property and equipment can receive a ten year full abatement, depending on circumstances
Parishes Property Taxes
Ranges from 58.63 to 186.59 Mills*
Check out local rates
* To calculate property tax, multiply the assessed value of the property by the appropriate millage rate. The assessed value is the fair market value of the property times 10% for real property or 15% for personal property. **Assessed on the value of all real and personal property in the state, or the amount of issued and outstanding capital stock, surplus, undivided profits and borrowed capital.
38

Information obtained from North Louisiana Economic Partnership – www.nlep.com
Labor Costs
As a right-to-work state, Louisiana offers affordable labor costs with high productivity and retention rates. The following table shows salaries for various occupations in North Louisiana.
AVERAGE SALARIES BY OCCUPATION FOR REGION
AVERAGE SALARY BY SELECTED OCCUPATION--FOURTEEN PARISH REGION 2010
Occupation Entry Level
Salary
Mean Average Salary
Median Salary
Average Maximum
Salary
Professional
Accountants and Auditors $40,880 $53,760 $50,535 $64,435
Administrative Services Managers $45,730 $61,010 $57,400 $76,505
Budget Analysts $38,845 $51,460 $46,895 $63,770
Computer Programmers $39,605 $53,110 $52,590 $64,680
Electrical Engineers $69,890 $84,085 $80,095 $98,575
Financial Analysts $49,255 $74,540 $65,010 $91,980
Gaming Supervisors $17,500 $21,000 $21,555 $24,815
Pharmacists $89,990 $101,070 $102,600 $116,930
Registered Nurses $47,595 $59,680 $56,490 $66,760
Retail
Retail Salespersons $15,800 $23,160 $19,480 $25,700
Stock Clerks and Order Fillers $16,030 $20,190 $18,565 $22,820
Clerical
Computer Operators $28,200 $29,610 $34,370 $41,240
Customer Service Representatives $20,950 $26,380 $24,765 $29,925
Data Entry Keyers $19,565 $25,250 $22,340 $28,775
Executive Secretaries & Administrative Assistants $27,770 $34,305 $32,550 $39,160
File Clerks $16,885 $21,095 $19,365 $24,220
39

Information obtained from North Louisiana Economic Partnership – www.nlep.com
Office Clerks, General $15,515 $20,315 $18,360 $23,790
Payroll and Timekeeping Clerks $26,470 $33,485 $32,370 $40,880
Receptionists and Information Clerks $16,025 $20,420 $19,520 $23,535
Switchboard Operators $16,250 $20,155 $19,460 $22,795
Unskilled
Construction Laborers $19,700 $25,895 $23,965 $30,350
Couriers and Messengers $15,975 $18,560 $17,580 $20,450
Packers and Packagers, Hand $14,855 $19,920 $15,990 $22,720
Service Station Attendants $15,060 $17,455 $16,650 $19,390
Semi-Skilled
Cashiers $14,665 $16,580 $15,745 $18,010
Security Guards $16,000 $22,035 $19,460 $25,405
Sheet Metal Workers $29,775 $35,595 $36,795 $42,325
Skilled
Architectural and Civil Drafters $34,365 $42,675 $40,830 $50,855
Crane and Tower Operators $25,210 $39,595 $35,180 $49,890
Machinery Maintenance Workers $11,955 $16,085 $15,680 $19,430
Machinists $30,115 $37,775 $38,135 $45,290
Welders, Cutters, Solderers, and Brazers $29,145 $37,805 $34,325 $41,935
Technical
Automotive Service Technicians and Mechanics $21,875 $33,855 $31,705 $42,350
Medical and Clinical Laboratory Technicians $23,455 $32,175 $30,025 $39,050
Pharmacy Technicians $22,685 $26,685 $25,855 $30,455
Source: U.S. Bureau of Labor Statistics-Occupational Employment Statistics May 2010
40

Information obtained from North Louisiana Economic Partnership – www.nlep.com
North Louisiana’s Multimodal Transportation Infrastructure Allows Access to the World
Connected nationally and globally by a multimodal transportation infrastructure, companies looking for transportation and logistical advantages will find real savings and accessibility in North Louisiana. North Louisiana’s central location, system of interstates and federal highways, Class 1 rail, airports and four ports make the region a leader in logistics.
41

Information obtained from North Louisiana Economic Partnership – www.nlep.com
Intermodal & Multimodal Logistics INTERSTATES AND FEDERAL HIGHWAYS
North Louisiana's North-South and East-West interstates and highways connect your business to the rest of the world- all at a lower cost than many regions. Many area trucking companies offer competitive costs to ship your products to more than 30 million customers in some of America's largest markets.
NORTH LOUISIANA'S PORTS
The Louisiana port system is comprised of both deep water and shallow water ports, forming one of the largest port systems in the world. North Louisiana's four ports can access to deep water within 4-6 days and offer intermodal capabilities:
Port of Shreveport-Bossier
Natchitoches Port
Red River Port
Ouachita Terminals
RAILROADS
Class 1 Railroads and numerous short track railways can access many area ports and industrial sites to offer intermodal capabilities. All six of the major railroads converge in Louisiana.
AIRPORTS
Regional and reliever airports offer service to major U.S. cities and hubs with connections worldwide. North Louisiana's two regional airports and numerous reliever airports provide passenger and air freight service.
42

Information obtained from North Louisiana Economic Partnership – www.nlep.com
North Louisiana's Business Climate Climbs the National Rankings
North Louisiana and the state are consistently climbing the national rankings for best business climate. In 2011, Louisiana jumped to its highest-ever business climate ranking by every leading publication that measures the economic progress of states. Over the past four years, no state has improved more than Louisiana.
BEST NATIONAL BUSINESS CLIMATE RANKINGS:
Site Selection magazine ranks Louisiana No. 7 in the U.S. (November 2011)
Business Facilities has ranked Louisiana No. 2 in the U.S. (August 2011)
Area Development magazine ranked Louisiana No. 6 nationally. (September 2011)
Forbes ranked Louisiana No. 30, jumping 14 places from a year ago. (November 2011)
Pollina Corporate Real Estate Inc. ranked Louisiana No. 18, up 22 spots since 2008 (August 2011)
Chief Executive magazine ranked Louisiana No. 27th, moving up 14 places from 2010. (May 2011)
North Louisiana: Lowest Cost of Business
Our region offers the lowest cost of doing business in the nation and in North America, as ranked by Forbes magazine (2011) and KPMG Competitive Alternatives (2010). North Louisiana's cost competitive tax structure, utility rates, transportation and labor costs offer businesses a sustainable solution for competing nationally and globally.
43

Information obtained from North Louisiana Economic Partnership – www.nlep.com
A Business-Friendly Tax Environment
Louisiana encourages business development by eliminating several taxes and creating a more business-friendly tax structure.
In 2008, Louisiana ranked No. 6 for states with the lowest tax burden (Anderson Economic Group's State Business Tax Burden State Rankings)
Louisiana also ranked No. 6 on business taxes to state profits
Louisiana ranked No. 2 on business taxes to private GSP
Taxes consumed only 12.2 percent of Louisiana business profits, compared to the national average of 16.7 percent
TAXES ELIMINATED:
Sales tax on manufacturing machinery and equipment
Sales tax on natural gas and business utilities
Capital gains tax on the sale of privately held businesses
Phase out of the franchise tax on corporate debt by 2011
Minimum corporate franchise tax
Louisiana also deducts federal income tax from state corporate income tax. These pro-growth policies have strengthened Louisiana’s tax environment, making it a more competitive place to invest and develop a business. The state has also recently implemented the largest personal income tax cut in state history, putting more money back into the pockets of Louisiana’s taxpayers.
44

Information obtained from North Louisiana Economic Partnership – www.nlep.com
State, Regional & Local Incentives Reduce Tax Liability
Businesses in Louisiana have access to a competitive, comprehensive portfolio of state, federal and local incentives that can make a profound impact on a company’s bottom line. Incentives, such as Enterprise Zone, Quality Jobs, Research & Development Tax Credit, Industrial Tax Exemption and Louisiana FastStart™ are available to help companies compete and succeed.
NLEP can provide advocacy and assistance with applying with statutory incentive programs. We can also assist companies with requesting for discretionary state, regional or local incentives. Please contact our business development team for more information. (Qualifying for many of the incentive programs depends on job creation and capital investment.)
Good Deals for Manufacturers
Louisiana uses single-factor sales apportionment to calculate manufacturers’ corporate income taxes. This provides a significant cost advantage, because manufacturers are not taxed on earnings generated by sales to out-of-state entities. This is not the case in the majority of other states. As of July 1, 2009, electricity, water, natural gas, machinery and equipment used by manufacturers are exempt from Louisiana sales tax.
Inventory Tax Advantage
In Louisiana, when a business files its state income and franchise tax, it can simply claim the amount it paid to local authorities for inventory taxes as a refundable credit. If the inventory taxes paid to the local authorities exceed the company’s state income and franchise tax liabilities, the company gets the balance as a refund.
Combined with the state’s strong logistics and infrastructure, comprehensive workforce development network, innovative industry developments, and low cost of doing business, North Louisiana is the place for business investment.
45

Real Estate Strategies Delivered
Sealy Real Estate Services
333 Texas StreetSuite 1050
Shreveport, LA 71101318.222.8700
www.sealynet.com


