38
Standard Tables Report Census 2001 www.calderdale.gov.uk

Standard Tables Report
Census 2001
www.calderdale.gov.uk


Contents
Table Page
1. Introduction 4-5
2. Population, Families and Health 1 - 4 6-15
Age, Gender and Marital Status 6-7
Family Composition 2 8-10
Gender, Age and Ethnicity 3 11-13
General Health and Limiting Long Term Illness 4 14-15
3. Economic Activity 5 - 8 16-23
Economic Activity by Gender and Age 5 16-17
Occupation by Age 6 18-19
Industry of Employment by Gender 7 20-21
Industry of Employment by Age 8 22-23
4. Households 9 - 12 24-31
Dwelling and Accommodation Type by Tenure 9 24-25
Tenure & Household Size (Rooms and People) 10 26-27
Household Composition and Amenities 11 28-29
Tenure and Lack of Amenities 12 30-31
5. Guidance Notes and Definitions 32-33
Page 3

1. Introduction
Purpose of the Report The Standard Tables Report is the first 2001 Census Report to present cross-tabulated information. This enables more aspects of each topic to be included, providing for an in-depth analysis of the characteristics of the population. The Report provides a selection from the very large number of Standard Tables available. They are selected on the basis of experience of key topics of greatest interest. The data provided is summarised and, as far as possible, simplified from the complex set of tables released by the Office for National Statistics (ONS). The Report is intended to provide Councillors, Council staff, the public, partner agencies, businesses and other users with a more detailed profile of Calderdale to complement the Key Statistics Report and Ward Profiles. Standard Tables are also available for the Ward boundaries in force at the time of the 2001 Census. However, these are currently only available in their original form, and are substantially larger and more complex than those provided in this Report. Any enquiries about other topics for the District, or about Ward-level Standard Tables, should be made to the Chief Executive’s Office – contact details below. Structure of the Report The topics covered in this report are broadly similar to those in the Key Statistics and Ward Profiles Report and include: Economic Activity, Health, Family Composition, Ethnicity and Household Amenities. The tables presented in the report are in the same basic format as is used in the Key Statistics Report, though in this case the information is solely for Calderdale. Page 4
Table Format
The format of the tables has been standardised for each topic where possible.
Each topic has two tables; the initial table presents the number of people in each category whilst the second shows the same information in a percentage
format. Some topics, namely Ethnicity and Family Composition, have additional tables to enable more detailed statistics to be included.
Where appropriate, the initial column of data provides the overall population, number of families or number of households. This is followed by the total
numbers for the group of people, families or households and subsequently the smaller groups that make up the total.
Help Desk
Further assistance and explanation, as well as help in accessing more
detailed Census information, can be obtained from the Chief Executive’s Office – contact Jenny Eaglestone (01422 393129) or Yvette Fisher (01422
393154), or e-mail [email protected]
For more information or assistance about Census publications generally visit the websites: www.statistics.gov.uk/census or
www.neighbourhood.statistics.gov.uk
All Census data is © Crown Copyright and this report is Copyright © Calderdale Metropolitan Borough Council.
Source: 2001 Census, [Standard Tables for Local Authorities]. Crown
Copyright 2003. Crown copyright material is reproduced with the permission of the Controller of HMSO.
Every care has been taken in the production of the report but Calderdale
Council cannot be held responsible for any inaccuracies.
Chief Executive’s Office
September 2003
Page 5

Table 1a - Age, Gender and Marital StatusMales Females
All People TotalSingle (never
married)Married
Separated or
DivorcedWidowed Total
Single (never
married)Married
Separated or
DivorcedWidowed
All People 192,403 93,012 42,923 39,454 7,951 2,684 99,391 38,899 39,051 10,735 10,7060-15 40,992 20,983 20,983 - - - 20,009 20,009 - -16-24 18,178 9,053 8,645 366 33 9 9,125 8,225 784 110 625-29 11,692 5,665 3,971 1,498 190 6 6,027 3,471 2,063 480 1330-34 14,616 6,974 2,963 3,358 644 9 7,642 2,479 3,936 1,201 2635-39 15,523 7,658 2,173 4,373 1,091 21 7,865 1,532 4,655 1,631 4740-44 13,878 6,825 1,214 4,344 1,234 33 7,053 781 4,550 1,644 7845-49 12,839 6,375 815 4,283 1,224 53 6,464 507 4,275 1,543 13950-54 14,293 7,081 686 5,030 1,264 101 7,212 364 5,101 1,477 27055-59 11,145 5,691 432 4,258 870 131 5,454 212 3,920 894 42860-64 9,244 4,674 306 3,611 578 179 4,570 211 3,007 660 69265-69 7,930 3,663 232 2,794 384 253 4,267 199 2,531 451 1,08670-74 7,390 3,207 197 2,376 226 408 4,183 219 1,973 299 1,69275-79 6,398 2,602 153 1,768 123 558 3,796 229 1,332 169 2,06680-84 4,444 1,567 97 953 63 454 2,877 192 612 123 1,95085-89 2,620 732 43 346 20 323 1,888 149 268 38 1,43390 and over 1,221 262 13 96 7 146 959 120 44 15 780
Source: 2001 Census Standard Table S002, Age by Sex and Marital Status
Crown copyright material is reproduced with the permission of the Controller of HMSO.
Page 6

Table 1b - Age, Gender and Marital Status Figures here refer to the Marital status as a percentage of the total in each age and gender group
Males Females
All People
Total% of all males
Single (never
married)Married
Separated or
DivorcedWidowed Total
% of all females
Single (never
married)Married
Separated or
DivorcedWidowed
No. No. % % % % % No. % % % % %
All People 192,403 93,012 100 46.1 42.4 8.5 2.9 99,391 100 39.1 39.3 10.8 10.80-15 40,992 20,983 22.6 100.0 - - - 20,009 20.1 100.0 - - -16-24 18,178 9,053 9.7 95.5 4.0 0.4 0.1 9,125 9.2 90.1 8.6 1.2 0.125-29 11,692 5,665 6.1 70.1 26.4 3.4 0.1 6,027 6.1 57.6 34.2 8.0 0.230-34 14,616 6,974 7.5 42.5 48.2 9.2 0.1 7,642 7.7 32.4 51.5 15.7 0.335-39 15,523 7,658 8.2 28.4 57.1 14.2 0.3 7,865 7.9 19.5 59.2 20.7 0.640-44 13,878 6,825 7.3 17.8 63.6 18.1 0.5 7,053 7.1 11.1 64.5 23.3 1.145-49 12,839 6,375 6.9 12.8 67.2 19.2 0.8 6,464 6.5 7.8 66.1 23.9 2.250-54 14,293 7,081 7.6 9.7 71.0 17.9 1.4 7,212 7.3 5.0 70.7 20.5 3.755-59 11,145 5,691 6.1 7.6 74.8 15.3 2.3 5,454 5.5 3.9 71.9 16.4 7.860-64 9,244 4,674 5.0 6.5 77.3 12.4 3.8 4,570 4.6 4.6 65.8 14.4 15.165-69 7,930 3,663 3.9 6.3 76.3 10.5 6.9 4,267 4.3 4.7 59.3 10.6 25.570-74 7,390 3,207 3.4 6.1 74.1 7.0 12.7 4,183 4.2 5.2 47.2 7.1 40.475-79 6,398 2,602 2.8 5.9 67.9 4.7 21.4 3,796 3.8 6.0 35.1 4.5 54.480-84 4,444 1,567 1.7 6.2 60.8 4.0 28.9 2,877 2.9 6.7 21.3 4.3 67.885-89 2,620 732 0.8 5.9 47.3 2.7 44.1 1,888 1.9 7.9 14.2 2.0 75.990 and over 1,221 262 0.3 5.0 36.6 2.7 55.7 959 1.0 12.5 4.6 1.6 81.3
Source: 2001 Census Standard Table S006, Age of Family Reference Person (FRP) and Age of Dependent Children by Family Type
Crown copyright material is reproduced with the permission of the Controller of HMSO.
Page 7

Table 2a - Family Composition
Age of Family Reference Person
All Families
Couples Lone Parents
Total Couples
Married Cohabiting Total Lone
Parents
Single Never
Married
Married/ Separated/
DivorcedWidowed
All Families 55,680 46,719 37,860 8,859 8,961 2,861 4,529 1,571
Age of "Family Reference Person":
24 or Under 1,777 956 260 696 821 761 57 325 to 34 9,675 7,451 4,416 3,035 2,224 1,308 901 1535 to 49 19,384 15,961 12,709 3,252 3,423 674 2,581 168
50 and Over 24,844 22,351 20,475 1,876 2,493 118 990 1,385
Families and Children All Families
Couples Lone Parents
Total Couples
Married Cohabiting Total Lone
Parents
Single Never
Married
Married/ Separated/
DivorcedWidowed
Families with No Children 23,098 23,098 18,214 4,884 - - - -
Families where All Children are Non-Dependent
7,743 5,231 4,869 362 2,512 131 1,114 1,267
Families with Dependent Children - Total
24,839 18,390 14,777 3,613 6,449 2,730 3,415 304
Youngest aged 0 to 4 9,471 7,312 5,395 1,917 2,159 1,444 665 50Youngest aged 5 to 11 8,959 6,406 5,286 1,120 2,553 951 1,496 106
Youngest aged 12 to 15 4,413 3,178 2,734 444 1,235 275 869 91Youngest aged 16 to 18 1,996 1,494 1,362 132 502 44 401 57
Source: 2001 Census Standard Table S006, Age of Family Reference Person (FRP) and Age of Dependent Children by Family Type
Crown copyright material is reproduced with the permission of the Controller of HMSO.
Page 8

Table 2b - Family Composition
All figures in this table show each "family type" as a percentage of all families in CalderdaleAll Families Couples Lone Parents
Total CouplesAll Lone Parents
Married CohabitingNever
MarriedSeparated or
Divorced
Widowed
Age of "Family Reference Person":
No. % % % % % % %
All Families 100.0 83.9 16.1 68.0 15.9 5.1 8.1 2.824 or Under 3.2 1.7 1.5 0.5 1.3 1.4 0.1 a
25 to 34 17.3 13.4 4.0 7.9 5.5 2.3 1.6 a35 to 49 34.8 28.7 6.1 22.8 5.8 1.2 4.6 0.3
50 and Over 44.6 40.1 4.5 36.8 3.4 0.2 1.8 2.5
Figures in the table below show each "family type" as a percentage of families with Household Reference Person in that age-group
All Families Couples Lone Parents
Total CouplesAll Lone Parents
Married CohabitingNever
MarriedSeparated or
Divorced
Widowed
Age of "Family Reference Person":
No. % % % % % % %
24 or Under 1,777 53.8 46.2 14.6 39.2 42.8 3.2 0.225 to 34 9,675 77.0 23.0 45.6 31.4 13.5 9.3 0.235 to 49 19,384 82.3 17.7 65.6 16.8 3.5 13.3 0.9
50 and Over 24,844 90.0 10.0 82.4 7.6 0.5 4.0 5.6
Source: 2001 Census Standard Table S006, Age of Family Reference Person (FRP) and Age of Dependent Children by Family Type
Crown copyright material is reproduced with the permission of the Controller of HMSO.
Notes. Figures may not total 100.0% due to rounding. "a" indicates less than 0.05%
Page 9
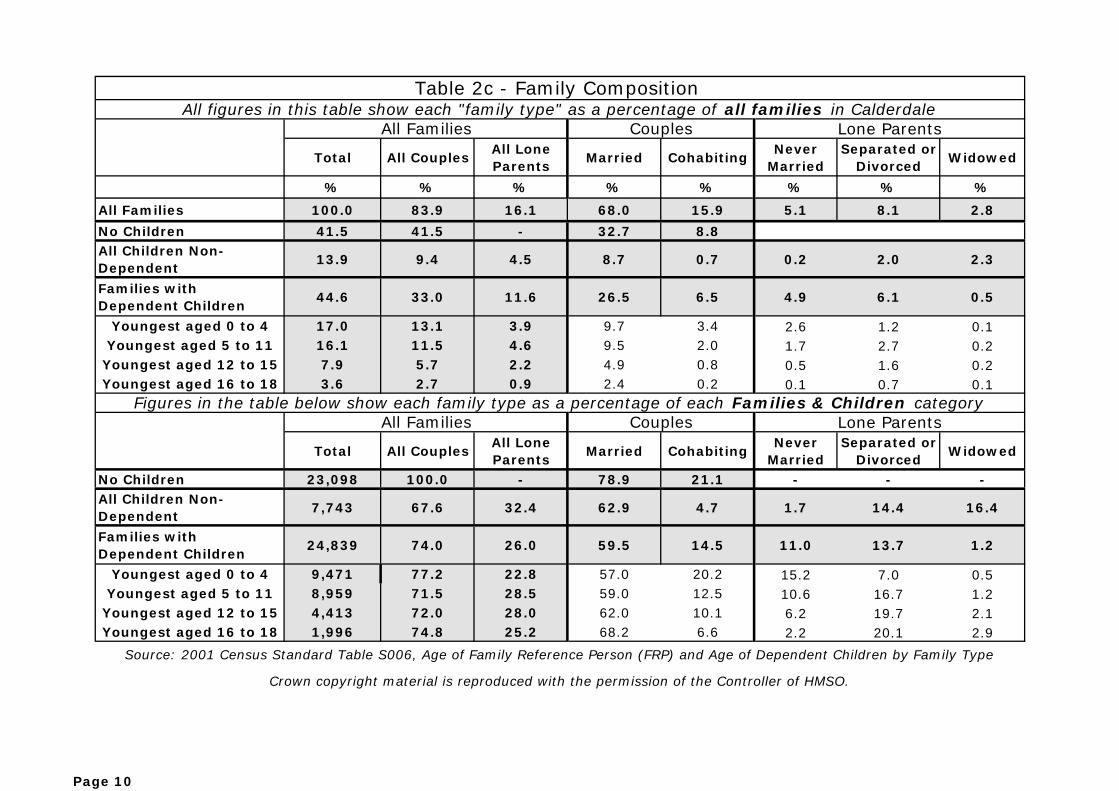
Table 2c - Family Composition All figures in this table show each "family type" as a percentage of all families in Calderdale
All Families Couples Lone Parents
Total All CouplesAll Lone Parents
Married CohabitingNever
MarriedSeparated or
Divorced
Widowed
% % % % % % % %
All Families 100.0 83.9 16.1 68.0 15.9 5.1 8.1 2.8
No Children 41.5 41.5 - 32.7 8.8All Children Non-Dependent
13.9 9.4 4.5 8.7 0.7 0.2 2.0 2.3
Families with Dependent Children
44.6 33.0 11.6 26.5 6.5 4.9 6.1 0.5
Youngest aged 0 to 4 17.0 13.1 3.9 9.7 3.4 2.6 1.2 0.1Youngest aged 5 to 11 16.1 11.5 4.6 9.5 2.0 1.7 2.7 0.2
Youngest aged 12 to 15 7.9 5.7 2.2 4.9 0.8 0.5 1.6 0.2Youngest aged 16 to 18 3.6 2.7 0.9 2.4 0.2 0.1 0.7 0.1
Figures in the table below show each family type as a percentage of each Families & Children category All Families Couples Lone Parents
Total All CouplesAll Lone Parents
Married CohabitingNever
MarriedSeparated or
Divorced
Widowed
No Children 23,098 100.0 - 78.9 21.1 - - -All Children Non-Dependent
7,743 67.6 32.4 62.9 4.7 1.7 14.4 16.4
Families with Dependent Children
24,839 74.0 26.0 59.5 14.5 11.0 13.7 1.2
Youngest aged 0 to 4 9,471 77.2 22.8 57.0 20.2 15.2 7.0 0.5Youngest aged 5 to 11 8,959 71.5 28.5 59.0 12.5 10.6 16.7 1.2
Youngest aged 12 to 15 4,413 72.0 28.0 62.0 10.1 6.2 19.7 2.1Youngest aged 16 to 18 1,996 74.8 25.2 68.2 6.6 2.2 20.1 2.9
Source: 2001 Census Standard Table S006, Age of Family Reference Person (FRP) and Age of Dependent Children by Family Type
Crown copyright material is reproduced with the permission of the Controller of HMSO.
Page 10
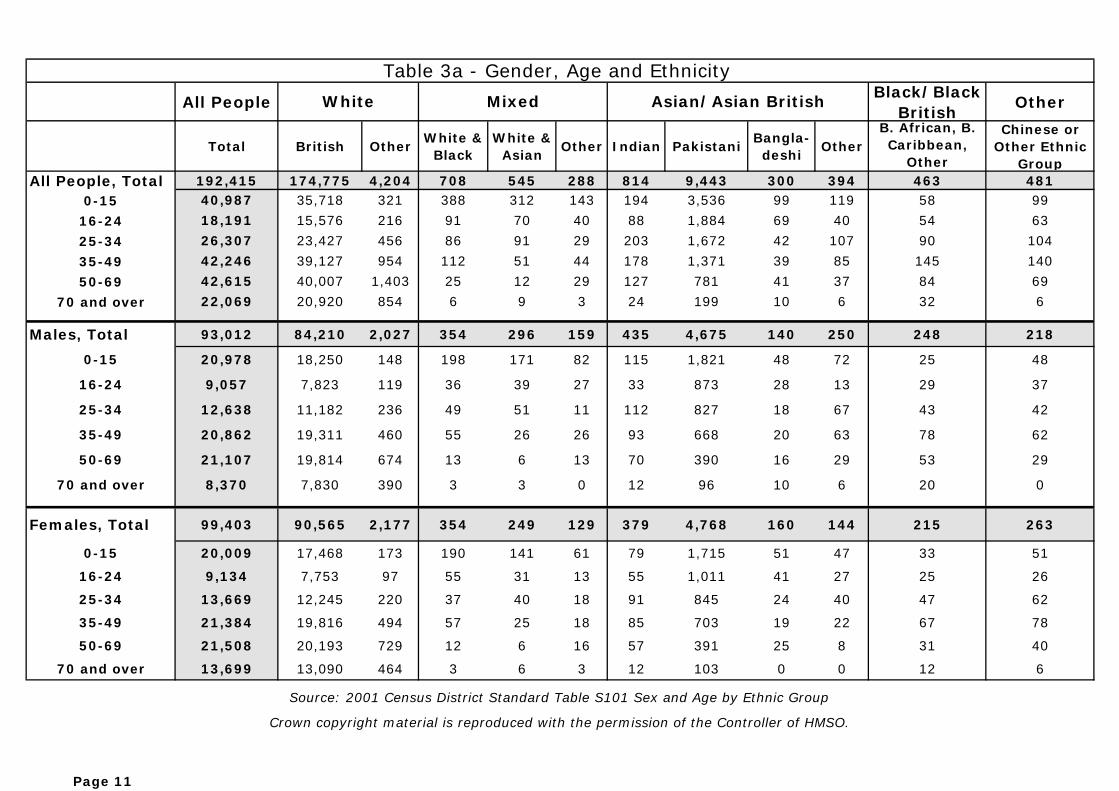
Table 3a - Gender, Age and Ethnicity
All People White Mixed Asian/Asian British Black/Black British
Other
Total British OtherWhite &
BlackWhite &
AsianOther Indian Pakistani
Bangla-deshi
OtherB. African, B. Caribbean,
Other
Chinese or Other Ethnic
GroupAll People, Total 192,415 174,775 4,204 708 545 288 814 9,443 300 394 463 481
0-15 40,987 35,718 321 388 312 143 194 3,536 99 119 58 99
16-24 18,191 15,576 216 91 70 40 88 1,884 69 40 54 63
25-34 26,307 23,427 456 86 91 29 203 1,672 42 107 90 104
35-49 42,246 39,127 954 112 51 44 178 1,371 39 85 145 140
50-69 42,615 40,007 1,403 25 12 29 127 781 41 37 84 69
70 and over 22,069 20,920 854 6 9 3 24 199 10 6 32 6
Males, Total 93,012 84,210 2,027 354 296 159 435 4,675 140 250 248 218
0-15 20,978 18,250 148 198 171 82 115 1,821 48 72 25 48
16-24 9,057 7,823 119 36 39 27 33 873 28 13 29 37
25-34 12,638 11,182 236 49 51 11 112 827 18 67 43 42
35-49 20,862 19,311 460 55 26 26 93 668 20 63 78 62
50-69 21,107 19,814 674 13 6 13 70 390 16 29 53 29
70 and over 8,370 7,830 390 3 3 0 12 96 10 6 20 0
Females, Total 99,403 90,565 2,177 354 249 129 379 4,768 160 144 215 263
0-15 20,009 17,468 173 190 141 61 79 1,715 51 47 33 51
16-24 9,134 7,753 97 55 31 13 55 1,011 41 27 25 26
25-34 13,669 12,245 220 37 40 18 91 845 24 40 47 62
35-49 21,384 19,816 494 57 25 18 85 703 19 22 67 78
50-69 21,508 20,193 729 12 6 16 57 391 25 8 31 40
70 and over 13,699 13,090 464 3 6 3 12 103 0 0 12 6
Source: 2001 Census District Standard Table S101 Sex and Age by Ethnic Group
Crown copyright material is reproduced with the permission of the Controller of HMSO.
Page 11

Table 3b - Age, by Ethnicity Figures show percentage of each age-group belonging to different Ethnic Groups
All People 0-15 16-24 25-34 35-49 50-6970 and over
Total Population 192,415 40,987 18,191 26,307 42,246 42,615 22,069
No. % % % % % %
WhiteBritish 90.8 87.1 85.6 89.1 92.6 93.9 94.8
Other 2.2 0.8 1.2 1.7 2.3 3.3 3.9
Mixed
White and Black 0.4 0.9 0.5 0.3 0.3 0.1 <0.1
White and Asian 0.3 0.8 0.4 0.3 0.1 0.0 <0.1
Other 0.1 0.3 0.2 0.1 0.1 0.1 <0.1
Asian/ Asian British
Indian 0.4 0.5 0.5 0.8 0.4 0.3 0.1
Pakistani 4.9 8.6 10.4 6.4 3.2 1.8 0.9
Bangladeshi 0.2 0.2 0.4 0.2 0.1 0.1 <0.1
Other 0.2 0.3 0.2 0.4 0.2 0.1 <0.1
Black/ Black British
Black African, BlackCaribbean, Black Other
0.2 0.1 0.3 0.3 0.3 0.2 0.1
Chinese/ Other
Chinese or Other EthnicGroup
0.2 0.2 0.3 0.4 0.3 0.2 <0.1
Source: 2001 Census District Standard Table S101 Sex and Age by Ethnic Group
Crown copyright material is reproduced with the permission of the Controller of HMSO.
Page 12
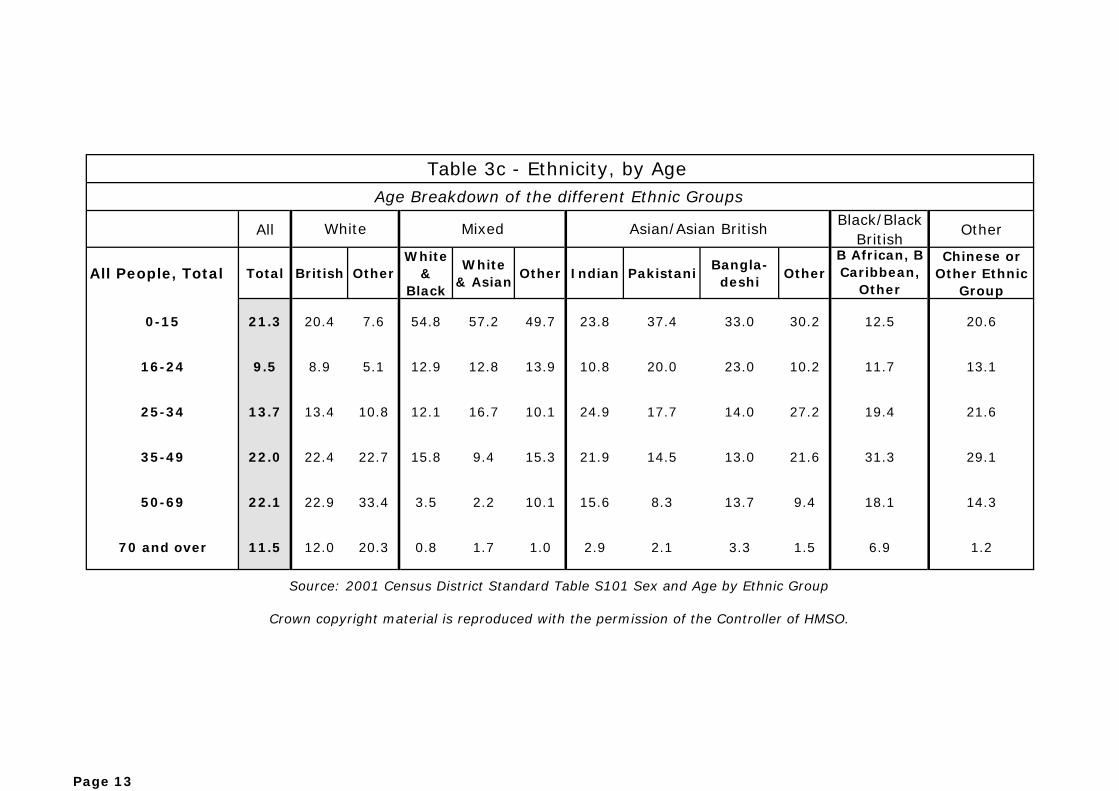
Table 3c - Ethnicity, by Age Age Breakdown of the different Ethnic Groups
All White Mixed Asian/Asian BritishBlack/Black
BritishOther
All People, Total Total British OtherWhite
& Black
White & Asian
Other Indian PakistaniBangla-deshi
OtherB African, B Caribbean,
Other
Chinese or Other Ethnic
Group
0-15 21.3 20.4 7.6 54.8 57.2 49.7 23.8 37.4 33.0 30.2 12.5 20.6
16-24 9.5 8.9 5.1 12.9 12.8 13.9 10.8 20.0 23.0 10.2 11.7 13.1
25-34 13.7 13.4 10.8 12.1 16.7 10.1 24.9 17.7 14.0 27.2 19.4 21.6
35-49 22.0 22.4 22.7 15.8 9.4 15.3 21.9 14.5 13.0 21.6 31.3 29.1
50-69 22.1 22.9 33.4 3.5 2.2 10.1 15.6 8.3 13.7 9.4 18.1 14.3
70 and over 11.5 12.0 20.3 0.8 1.7 1.0 2.9 2.1 3.3 1.5 6.9 1.2
Source: 2001 Census District Standard Table S101 Sex and Age by Ethnic Group
Crown copyright material is reproduced with the permission of the Controller of HMSO.
Page 13

Table 4a - General Health and Limiting Long-Term Illness
All People People with "Good Health"People with "Fairly Good
Health"People with "Not Good
Health"
Total Household Population
Total with Limiting Long-Term Illness
Total with Good Health
with Good Health but with Limiting Long-Term Illness
Total with Fairly Good
Health
with Fairly Good Health but with Limiting Long-Term Illness
Total with Not Good
Health
with Not Good Health and with Limiting Long-Term Illness
All People, Total 190,879 34,035 129,706 5,174 42,861 13,601 18,312 15,260
0-14 38,428 1,543 35,054 791 2,950 487 424 265
15-24 20,604 1,150 17,266 437 2,802 388 536 325
25-44 55,583 5,204 41,151 1,033 11,138 1,911 3,294 2,260
45-59 38,177 7,886 22,612 1,006 10,508 2,709 5,057 4,171
Males 60+, Total 16,447 7,770 6,261 837 6,250 3,344 3,936 3,589
60-74 11,481 4,862 4,836 529 4,129 2,073 2,516 2,260
75-84 4,060 2,285 1,230 248 1,764 1,043 1,066 994
85+ 906 623 195 60 357 228 354 335
Females 60+, Total 21,640 10,482 7,362 1,070 9,213 4,762 5,065 4,650
60-74 12,952 4,998 5,175 441 5,378 2,411 2,399 2,14675-84 6,393 3,804 1,740 449 2,803 1,631 1,850 1,72485+ 2,295 1,680 447 180 1,032 720 816 780
Source: 2001 Census Standard Table S016, Sex and Age by general health and limiting long-term illness
Crown copyright material is reproduced with the permission of the Controller of HMSO.
Page 14
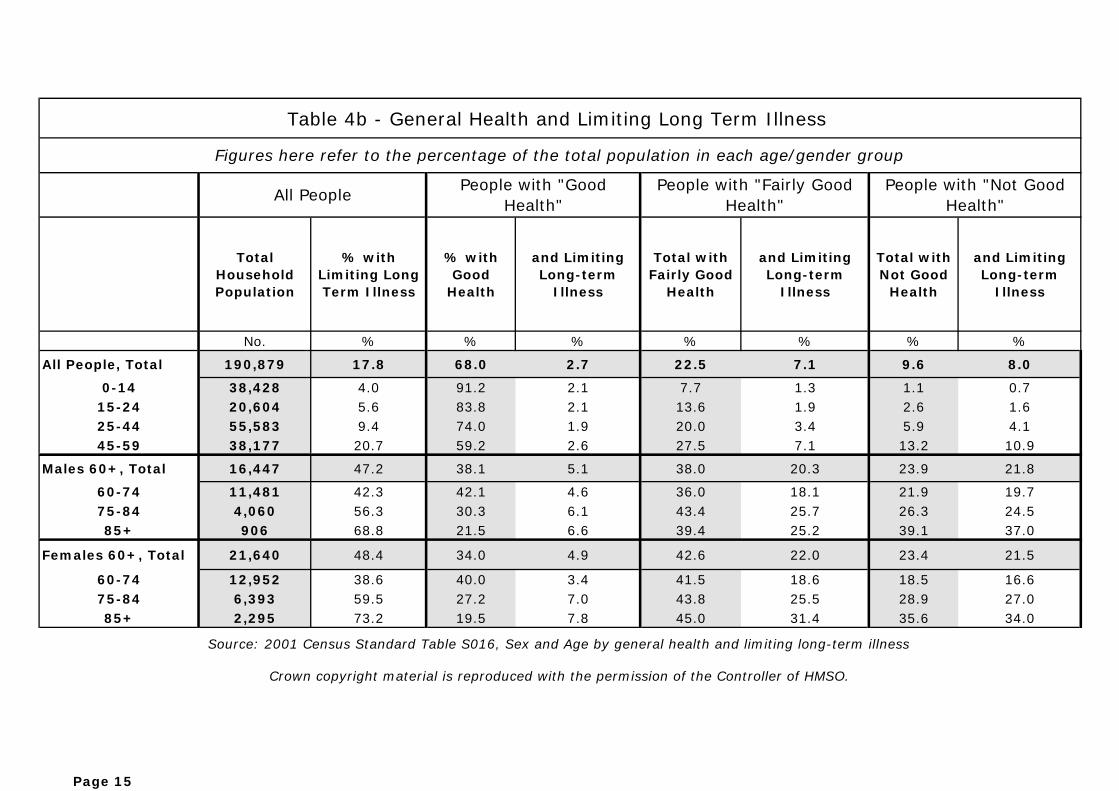
Table 4b - General Health and Limiting Long Term Illness
Figures here refer to the percentage of the total population in each age/gender group
All People People with "Good
Health"People with "Fairly Good
Health"People with "Not Good
Health"
Total Household Population
% with Limiting Long Term Illness
% with Good
Health
and Limiting Long-term
Illness
Total with Fairly Good
Health
and Limiting Long-term
Illness
Total with Not Good
Health
and Limiting Long-term
Illness
No. % % % % % % %
All People, Total 190,879 17.8 68.0 2.7 22.5 7.1 9.6 8.0
0-14 38,428 4.0 91.2 2.1 7.7 1.3 1.1 0.715-24 20,604 5.6 83.8 2.1 13.6 1.9 2.6 1.625-44 55,583 9.4 74.0 1.9 20.0 3.4 5.9 4.145-59 38,177 20.7 59.2 2.6 27.5 7.1 13.2 10.9
Males 60+, Total 16,447 47.2 38.1 5.1 38.0 20.3 23.9 21.8
60-74 11,481 42.3 42.1 4.6 36.0 18.1 21.9 19.775-84 4,060 56.3 30.3 6.1 43.4 25.7 26.3 24.585+ 906 68.8 21.5 6.6 39.4 25.2 39.1 37.0
Females 60+, Total 21,640 48.4 34.0 4.9 42.6 22.0 23.4 21.5
60-74 12,952 38.6 40.0 3.4 41.5 18.6 18.5 16.675-84 6,393 59.5 27.2 7.0 43.8 25.5 28.9 27.085+ 2,295 73.2 19.5 7.8 45.0 31.4 35.6 34.0
Source: 2001 Census Standard Table S016, Sex and Age by general health and limiting long-term illness
Crown copyright material is reproduced with the permission of the Controller of HMSO.
Page 15

Table 5a - Economic Activity, by Gender and Age
All People 16-74
EmployedSelf
EmployedFull-time Students
in Employ-ment
Not in Paid Employment
TotalPart-Time
Full-Time
Part-Time
Full-Time
Unem-ployed
Students Not
WorkingRetired
Looking after home
/ family
Perman-ent sick/ disabled
Other
All 16-74, Total 136,716 17,895 56,820 2,509 8,481 2,335 5,156 5,141 18,543 7,862 7,719 4,255
16-19 9,055 462 2,114 12 31 1,638 578 3,741 9 196 42 232
20-24 9,124 802 5,086 39 170 335 693 617 7 749 159 467
25-39 41,829 6,567 22,684 602 2,704 252 1,933 564 24 3,770 1,331 1,398
40-59 52,155 8,702 25,023 1,407 4,869 97 1,750 194 1,448 2,907 4,231 1,527
60-64 9,240 915 1,674 245 517 14 172 2 3,994 154 1,244 309
65-74 15,313 447 239 204 190 0 30 22 13,061 86 712 322
Males 16-74, Total 66,859 2,226 35,740 1,155 6,777 1,034 3,414 2,547 7,345 650 4,183 1,788
16-19 4,601 157 1,249 9 27 744 334 1,957 3 5 19 97
20-24 4,454 191 2,909 22 129 138 474 291 4 31 75 190
25-39 20,297 570 14,303 239 2,134 109 1,206 225 13 259 681 558
40-59 25,972 835 15,711 585 3,868 40 1,213 70 624 316 2,060 650
60-64 4,670 268 1,406 151 460 3 163 0 1,017 39 968 198
65-74 6,865 205 162 149 159 0 24 7 5,684 0 380 95Females 16-74, Total
69,857 15,669 21,080 1,354 1,704 1,301 1,742 2,594 11,198 7,212 3,536 2,467
16-19 4,454 305 865 3 4 894 244 1,784 6 191 23 135
20-24 4,670 611 2,177 17 41 197 219 326 3 718 84 277
25-39 21,532 5,997 8,381 363 570 143 727 339 11 3,511 650 840
40-59 26,183 7,867 9,312 822 1,001 57 537 124 824 2,591 2,171 877
60-64 4,570 647 268 94 57 11 9 5 2,977 115 276 111
65-74 8,448 242 77 55 31 0 6 15 7,377 86 332 227
Source: 2001 Census District Standard Table S028 Sex and Age by Economic Activity
Crown copyright material is reproduced with the permission of the Controller of HMSO.
NOTE: Totals for rows and columns may differ from the sum of the cell numbers by 1 to 3, due to the Census "adjustment" process
Page 16

Table 5b - Economic Activity, by Gender and Age
Figures refer to the percentage of the total population/age-group in each category
All People 16-74
Employed Self Employed Full-time Students in
Employ-ment
Not in Paid Employment
TotalPart-Time
Full-Time
Part-Time
Full-Time
Unem-ployed
Students Not
WorkingRetired
Looking after home/
family
Permanent sick/
disabledOther
No. % % % % % % % % % % %
All 16-74 136,716 13.1 41.6 1.8 6.2 1.7 3.8 3.8 13.6 5.8 5.6 3.1
16-19 9,055 5.1 23.3 0.1 0.3 18.1 6.4 41.3 0.1 2.2 0.5 2.620-24 9,124 8.8 55.7 0.4 1.9 3.7 7.6 6.8 0.1 8.2 1.7 5.125-39 55,707 15.7 54.2 1.4 6.5 0.6 4.6 1.3 0.1 9.0 3.2 3.340-59 38,277 16.7 48.0 2.7 9.3 0.2 3.4 0.4 2.8 5.6 8.1 2.960-64 9,240 9.9 18.1 2.7 5.6 0.2 1.9 0.0 43.2 1.7 13.5 3.365-74 15,313 2.9 1.6 1.3 1.2 0.0 0.2 0.1 85.3 0.6 4.6 2.1
Males 16-74 66,859 3.3 53.5 1.7 10.1 1.5 5.1 3.8 11.0 1.0 6.3 2.7
16-19 4,601 3.4 27.1 0.2 0.6 16.2 7.3 42.5 0.1 0.1 0.4 2.120-24 4,454 4.3 65.3 0.5 2.9 3.1 10.6 6.5 0.1 0.7 1.7 4.325-39 27,122 2.8 70.5 1.2 10.5 0.5 5.9 1.1 0.1 1.3 3.4 2.740-59 19,147 3.2 60.5 2.3 14.9 0.2 4.7 0.3 2.4 1.2 7.9 2.560-64 4,670 5.7 30.1 3.2 9.9 0.1 3.5 0.0 21.8 0.8 20.7 4.265-74 6,865 3.0 2.4 2.2 2.3 0.0 0.3 0.1 82.8 0.0 5.5 1.4
Females 16-74
69,857 22.4 30.2 1.9 2.4 1.9 2.5 3.7 16.0 10.3 5.1 3.5
16-19 4,454 6.8 19.4 0.1 0.1 20.1 5.5 40.1 0.1 4.3 0.5 3.020-24 4,670 13.1 46.6 0.4 0.9 4.2 4.7 7.0 0.1 15.4 1.8 5.925-39 28,585 27.9 38.9 1.7 2.6 0.7 3.4 1.6 0.1 16.3 3.0 3.940-59 19,130 30.0 35.6 3.1 3.8 0.2 2.1 0.5 3.1 9.9 8.3 3.360-64 4,570 14.2 5.9 2.1 1.2 0.2 0.2 0.1 65.1 2.5 6.0 2.465-74 8,448 2.9 0.9 0.7 0.4 0.0 0.1 0.2 87.3 1.0 3.9 2.7
Source: 2001 Census District Standard Table S028 Sex and Age by Economic Activity
Crown copyright material is reproduced with the permission of the Controller of HMSO.
Page 17

Table 6a - Occupation (Residents aged 16-74)
TotalAged 16-
24Aged 25-
29Aged 30-
39Aged 40-
49Aged 50-
59Aged 60-
64Aged 65-
74
Males - Total: 46,932 5,575 4,724 12,631 11,235 9,804 2,288 675
Managers and Senior Officials 8,409 284 590 2,467 2,496 2,075 359 138
Professional 5,083 227 609 1,439 1,320 1,215 190 83
Associate Professional and Technical 5,571 613 704 1,676 1,351 964 189 74
Administrative and Secretarial 2,273 415 307 506 461 434 114 36
Skilled Trades 9,917 1,316 1,026 2,670 2,276 2,034 459 136
Personal Service 860 135 69 189 169 233 55 10
Sales and Customer Service 1,643 665 204 302 216 190 50 16
Process, Plant and Machine Operatives 8,082 709 739 2,260 2,019 1,754 519 82
Elementary 5,094 1,211 476 1,122 927 905 353 100
Females - Total: 41,108 5,114 4,120 11,334 10,557 8,502 1,077 404
Managers and Senior Officials 4,353 222 453 1,403 1,256 858 108 53
Professional 4,116 187 486 1,109 1,284 947 74 29
Associate Professional and Technical 5,744 550 763 1,924 1,611 780 83 33
Administrative and Secretarial 8,736 1,018 890 2,310 2,198 1,992 250 78
Skilled Trades 1,105 116 99 296 252 292 31 19
Personal Service 5,634 906 540 1,508 1,377 1,143 123 37
Sales and Customer Service 4,278 1,078 432 1,076 817 728 101 46
Process, Plant and Machine Operatives 2,098 127 130 552 588 627 59 15
Elementary 5,044 910 327 1,156 1,174 1,135 248 94
Source: 2001 Census Table S033, Sex and Occupation of people aged 16 to 74 in employment
Crown copyright material is reproduced with the permission of the Controller of HMSO.
Page 18

Table 6b - Occupation (Residents aged 16-74)
Percentages show the age breakdown of each occupational category
TotalAged 16-
24Aged 25-
29Aged 30-
39Aged 40-
49Aged 50-
59Aged 60-
64Aged 65-
74No. % % % % % % %
Males aged 16-74, Total 46,932 11.9 10.1 26.9 23.9 20.9 4.9 1.4
Managers and Senior Officials 8,409 3.4 7.0 29.3 29.7 24.7 4.3 1.6
Professional 5,083 4.5 12.0 28.3 26.0 23.9 3.7 1.6
Associate Professional and Technical 5,571 11.0 12.6 30.1 24.3 17.3 3.4 1.3
Administrative and Secretarial 2,273 18.3 13.5 22.3 20.3 19.1 5.0 1.6
Skilled Trades 9,917 13.3 10.3 26.9 23.0 20.5 4.6 1.4
Personal Service 860 15.7 8.0 22.0 19.7 27.1 6.4 1.2
Sales and Customer Service 1,643 40.5 12.4 18.4 13.1 11.6 3.0 1.0
Process, Plant and Machine Operatives 8,082 8.8 9.1 28.0 25.0 21.7 6.4 1.0
Elementary Occupations 5,094 23.8 9.3 22.0 18.2 17.8 6.9 2.0
Females aged 16-74, Total 41,108 12.4 10.0 27.6 25.7 20.7 2.6 1.0
Managers and Senior Officials 4,353 5.1 10.4 32.2 28.9 19.7 2.5 1.2
Professional 4,116 4.5 11.8 26.9 31.2 23.0 1.8 0.7
Associate Professional and Technical 5,744 9.6 13.3 33.5 28.0 13.6 1.4 0.6
Administrative and Secretarial 8,736 11.7 10.2 26.4 25.2 22.8 2.9 0.9
Skilled Trades 1,105 10.5 9.0 26.8 22.8 26.4 2.8 1.7
Personal Service 5,634 16.1 9.6 26.8 24.4 20.3 2.2 0.7
Sales and Customer Service 4,278 25.2 10.1 25.2 19.1 17.0 2.4 1.1
Process, Plant and Machine Operatives 2,098 6.1 6.2 26.3 28.0 29.9 2.8 0.7
Elementary Occupations 5,044 18.0 6.5 22.9 23.3 22.5 4.9 1.9
Source: 2001 Census Table S033, Sex and Occupation of people aged 16 to 74 in employment
Crown copyright material is reproduced with the permission of the Controller of HMSO.
Page 19

Table 7a - Industry of Employment, by Gender (Residents aged 16 to 74)
All People Males FemalesTotal 88,037 46,927 41,110
Primary Industry 787 622 165
Manufacturing 19,828 14,564 5,264
Electricity, Gas and Water Supply 555 393 162
Construction 5,426 4,856 570
Wholesale and Retail Trade; Repair of Motor Vehicles 13,608 7,108 6,500
Hotels and Restaurants 3,467 1,342 2,125
Transport, Storage and Communications 4,445 3,348 1,097
Financial Intermediation 7,045 2,823 4,222
Financial and Business Services 8,632 4,612 4,020
Public Administration and Defence; Social Security 3,604 1,848 1,756
Education 7,254 1,939 5,315
Health and Social Work 9,678 1,784 7,894
Other 3,708 1,688 2,020
Source: 2001 Census District Standard Table S036, Gender and Industry by Age
Crown copyright material is reproduced with the permission of the Controller of HMSO.
Page 20

Table 7b - Industry of Employment by Gender (Residents aged 16 to 74)
All People
Percentage of employment in each industry accounted for by males and
females
Percentage of total employment of males, females accounted for by different
industrial sector
Males Females % of all Males % of all Females
Total 88,037 46,927 41,110 46,927 41,110
Primary Industry 787 79.0 21.0 1.3 0.4
Manufacturing 19,828 73.5 26.5 31.0 12.8
Electricity, Gas and Water Supply
555 70.8 29.2 0.8 0.4
Construction 5,426 89.5 10.5 10.3 1.4
Wholesale and Retail Trade; Repair of Motor Vehicles
13,608 52.2 47.8 15.1 15.8
Hotels and Restaurants 3,467 38.7 61.3 2.9 5.2
Transport, Storage and Communications
4,445 75.3 24.7 7.1 2.7
Financial Intermediation 7,045 40.1 59.9 6.0 10.3
Financial and Business Services 8,632 53.4 46.6 9.8 9.8
Public Administration and Defence; Social Security
3,604 51.3 48.7 3.9 4.3
Education 7,254 26.7 73.3 4.1 12.9
Health and Social Work 9,678 18.4 81.6 3.8 19.2
Other 3,708 45.5 54.5 3.6 4.9
Source: 2001 Census District Standard Table S036, Gender and Industry by Age
Crown copyright material is reproduced with the permission of the Controller of HMSO.
Page 21

Table 8a - Industry of Employment, by Age (Residents aged 16-74)
All People 16-24 25-29 30-39 40-49 50-59 60-64 65-74
All Employment aged 16-74, Total 88,037 10,686 8,844 23,967 21,792 18,302 3,363 1,083
Primary Industry 787 84 63 208 182 176 40 34
Manufacturing 19,828 1,872 1,881 5,302 4,961 4,586 957 269
Electricity, Gas and Water Supply 555 46 81 146 156 105 18 3
Construction 5,426 721 548 1,547 1,203 1,094 248 65
Wholesale and Retail Trade; Repair of Motor Vehicles
13,608 2,501 1,329 3,445 2,984 2,610 556 183
Hotels and Restaurants 3,467 1,018 304 744 663 551 128 59
Transport, Storage and Communications 4,445 449 450 1,242 1,076 978 208 42
Financial Intermediation 7,045 1,120 1,246 2,351 1,457 750 95 26
Financial and Business Services 8,632 911 956 2,413 2,066 1,749 372 165
Public Administration and Defence; Social Security
3,604 247 290 1,117 1,090 748 84 28
Education 7,254 334 526 1,764 2,342 2,000 233 55
Health and Social Work 9,678 782 809 2,725 2,777 2,212 285 88
Other 3,708 601 361 963 835 743 139 66
Source: 2001 Census District Standard Table S036 Gender and Industry by Age
Crown copyright material is reproduced with the permission of the Controller of HMSO.
Page 22

Table 8b - Industry of Employment, by Age (Residents aged 16-74)
Figures show the percentage of employment in each industrial sector accounted for by the different age-groups
All PeopleAged 16-
24Aged 25-
29Aged 30-
39Aged 40-
49Aged 50-
59Aged 60-
64Aged 65-
74No. % % % % % % %
All Employment aged 16-74, Total 88,037 12.1 10.0 27.2 24.8 20.8 3.8 1.2
Primary Industry 787 10.7 8.0 26.4 23.1 22.4 5.1 4.3
Manufacturing 19,828 9.4 9.5 26.7 25.0 23.1 4.8 1.4
Electricity, Gas and Water Supply 555 8.3 14.6 26.3 28.1 18.9 3.2 0.5
Construction 5,426 13.3 10.1 28.5 22.2 20.2 4.6 1.2
Wholesale and Retail Trade; Repair of Motor Vehicles
13,608 18.4 9.8 25.3 21.9 19.2 4.1 1.3
Hotels and Restaurants 3,467 29.4 8.8 21.5 19.1 15.9 3.7 1.7
Transport, Storage and Communications 4,445 10.1 10.1 27.9 24.2 22.0 4.7 0.9
Financial Intermediation 7,045 15.9 17.7 33.4 20.7 10.6 1.3 0.4
Financial and Business Services 8,632 10.6 11.1 28.0 23.9 20.3 4.3 1.9
Public Administration and Defence; Social Security
3,604 6.9 8.0 31.0 30.2 20.8 2.3 0.8
Education 7,254 4.6 7.3 24.3 32.3 27.6 3.2 0.8
Health and Social Work 9,678 8.1 8.4 28.2 28.7 22.9 2.9 0.9
Other 3,708 16.2 9.7 26.0 22.5 20.0 3.7 1.8
Source: 2001 Census District Standard Table S036 Gender and Industry by Age
Crown copyright material is reproduced with the permission of the Controller of HMSO.
Page 23

r
Table 9a - Dwelling and Accommodation Type by Tenure
All Households
Owner Occupied Rented
TotalWith
Mortgage/ Loan
Owned Outright
Shared Ownership
Social Housing
Privately Rented
Rent Free
All Occupied Household Spaces 80,940 32,831 24,725 350 13,664 7,608 1,762
Unshared Dwellings, Total 80,756 32,827 24,721 347 13,554 7,550 1,757
Detached House 11,464 5,705 4,717 14 422 419 187
Semi-Detached House 23,175 10,411 8,584 123 2,678 1,004 375
Terraced House 35,633 16,201 10,753 159 3,502 4,470 548
Flat; maisonette or apartment 10,356 496 582 51 6,944 1,641 642
Caravan or othemobile/temporary structure
128 14 85 0 8 16 5
Shared Dwellings, Total 184 4 4 3 110 58 5
Source: 2001 Census District Standard Table S049 Dwelling Type and Accommodation Type by Tenure (Households and Dwellings)
Crown copyright material is reproduced with the permission of the Controller of HMSO.
Page 24

Table 9b - Dwelling and Accommodation Type by Tenure (Unshared Dwellings only)
The table below shows the percentage of each tenure group in different accommodation types.
All Owner Occupied Rented
% of tenure group TotalWith
Mortgage/LoanOwned
OutrightShared
OwnershipSocial
HousingPrivately Rented
Rent Free
Occupied Household Spaces - Total 80,756 32,831 24,725 350 13,664 7,608 1,762
Detached House 14.2 17.4 19.1 4.0 3.1 5.5 10.6
Semi-Detached House 28.7 31.7 34.7 35.4 19.8 13.3 21.3
Terraced House 44.1 49.4 43.5 45.8 25.8 59.2 31.2
Flat; maisonette or apartment 12.8 1.5 2.4 14.7 51.2 21.7 36.5
Caravan or other mobile/temporary structure 0.2 <0.1 0.3 0.0 0.1 0.2 0.3
The table below shows the percentage of each accommodation type in the different tenure groups.
All Owner Occupied Rented
% of all households TotalWith Mortgage/
LoanOwned
OutrightShared
OwnershipSocial
HousingPrivate Rented
Rent Free
Occupied Household Spaces 80,756 40.6 30.6 0.4 16.8 9.3 2.2
Detached House 11,464 49.8 41.1 0.1 3.7 3.7 1.6
Semi-Detached House 23,175 44.9 37.0 0.5 11.6 4.3 1.6
Terraced House 35,633 45.5 30.2 0.4 9.8 12.5 1.5
Flat; maisonette or apartment 10,356 4.8 5.6 0.5 67.1 15.8 6.2
Caravan or other mobile/temporary structure 128 10.9 66.4 0.0 6.3 12.5 3.9
Source: 2001 Census District Standard Table S049 Dwelling Type and Accommodation Type by Tenure (Households and Dwellings)
Crown copyright material is reproduced with the permission of the Controller of HMSO.
Page 25

Table 10a - Tenure and Household Size (Rooms and People)
All Households
Number of Rooms Number of People
Total 1 2 or 3 4 or 5 6 or 78 or more
1 2 or 3 4 or 5 6 or 78 or more
All Households, Total 80,945 472 10,222 41,458 21,404 7,389 24,661 40,043 14,022 1,967 252
Owner-occupied 57,910 69 2,565 29,484 18,886 6906 13,926 30,930 11,502 1,368 184
Social Housing 13,668 189 5,372 6,658 1,257 192 6,683 5,093 1,445 408 39
Privately Rented/Rent Free 9,367 214 2,285 5,316 1,261 291 4,052 4,020 1,075 191 29
Source: 2001 Census District Standard Table S051 Tenure and Household Size by Number of Rooms
Crown copyright material is reproduced with the permission of the Controller of HMSO.
Page 26

Table 10b - Tenure and Household Size (Rooms and People)
Figures show, for each household size, the percentage accounted for by the different types of tenure
All Households
Number of Rooms Number of People
Total 1 2/3 4/5 6/7 8+ 1 2/3 4/5 6/7 8+
All Households 80,945 472 10,222 41,458 21,404 7,389 24,661 40,043 14,022 1,967 252
Breakdown by Tenure No. % % % % % % % % % %
Owner-Occupied 57,910 14.6 25.1 71.1 88.2 93.5 56.5 77.2 82.0 69.5 73.0
Social Housing 13,668 40.0 52.6 16.1 5.9 2.6 27.1 12.7 10.3 20.7 15.5
Privately Rented/Rent Free
9,367 45.4 22.4 12.8 5.9 3.9 16.4 10.0 7.7 9.7 11.5
Source: 2001 Census District Standard Table S051 Tenure and Household Size by Number of Rooms
Crown copyright material is reproduced with the permission of the Controller of HMSO.
Page 27

Table 11a - Household Composition and Lack of Amenities
All HouseholdsPensioner-only
HouseholdsHouseholds with Dependent
ChildrenOther Households
TotalSingle
Pensioner2+, All
PensionersCouples
Lone Parents
OtherSingle-person
(non-pensioner)
Other
All Households, Total 80,939 12,113 6,854 17,313 5,319 2,185 12,548 24,339
lacking central heating and sole use of bathroom facilities
111 19 3 10 - 5 68 6
lacking central heating 15,509 2,791 1,227 2,506 1,009 483 3,253 4,240
lacking sole use of bathroom facilities
212 100 6 14 7 9 53 23
Without a car or van 25,111 9,045 2,215 1,611 2,877 635 5,292 3,436
Source: 2001 Census District Standard Table S056 Tenure and Amenities by Household Composition, S062 Household Composition by number of cars available
Crown copyright material is reproduced with the permission of the Controller of HMSO.
Page 28
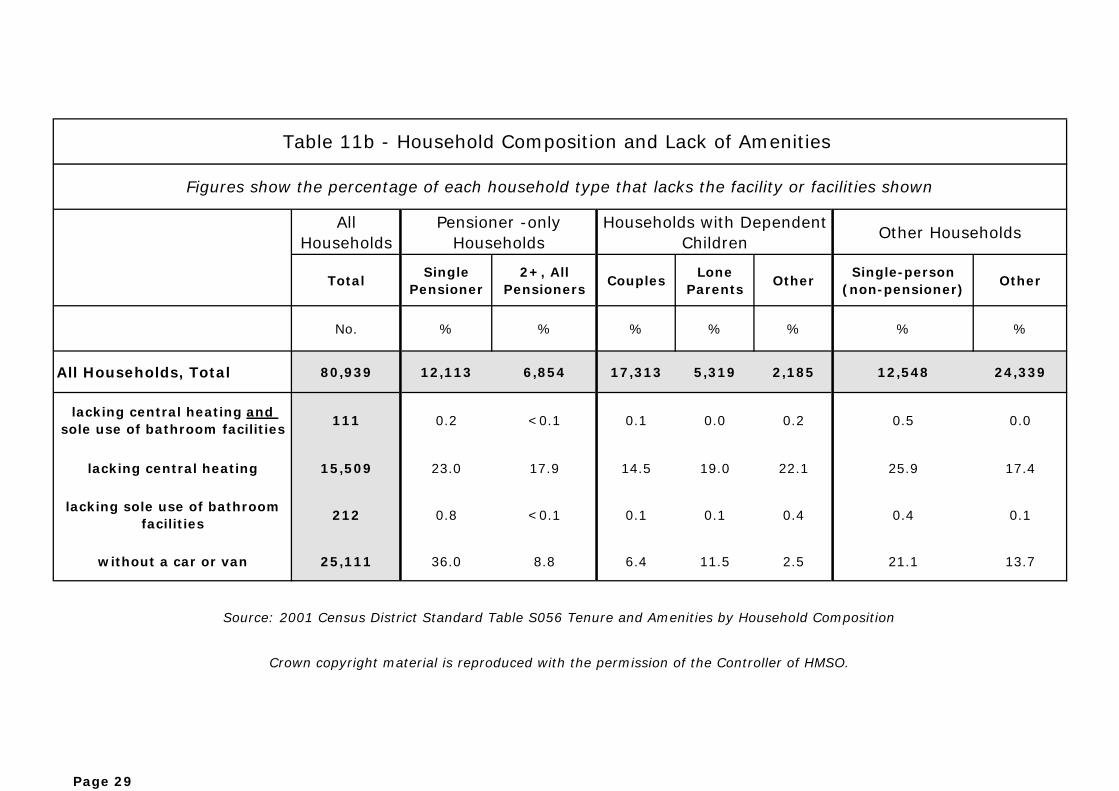
Table 11b - Household Composition and Lack of Amenities
Figures show the percentage of each household type that lacks the facility or facilities shown
All Households
Pensioner -only Households
Households with Dependent Children
Other Households
TotalSingle
Pensioner2+, All
PensionersCouples
Lone Parents
OtherSingle-person
(non-pensioner)Other
No. % % % % % % %
All Households, Total 80,939 12,113 6,854 17,313 5,319 2,185 12,548 24,339
lacking central heating and sole use of bathroom facilities
111 0.2 <0.1 0.1 0.0 0.2 0.5 0.0
lacking central heating 15,509 23.0 17.9 14.5 19.0 22.1 25.9 17.4
lacking sole use of bathroom facilities
212 0.8 <0.1 0.1 0.1 0.4 0.4 0.1
without a car or van 25,111 36.0 8.8 6.4 11.5 2.5 21.1 13.7
Source: 2001 Census District Standard Table S056 Tenure and Amenities by Household Composition
Crown copyright material is reproduced with the permission of the Controller of HMSO.
Page 29

Table 12a - Tenure and Lack of Amenities
Households lacking . . .
All HouseholdsCentral heating and sole use of bathroom facilities
Central heatingSole use of bathroom facilities
A car or van
All Households, Total 80,939 111 15,509 212 25,111
Owner-Occupied 57,906 40 11,741 37 10,645
Social Housing 13,668 0 661 120 9,596
Privately Rented/Rent Free
9,365 71 3,107 55 4,871
Source: 2001 Census District Standard Table S056 Tenure and Amenities by Household Composition, S060 Tenure and Car Availability
Crown copyright material is reproduced with the permission of the Controller of HMSO.
Page 30
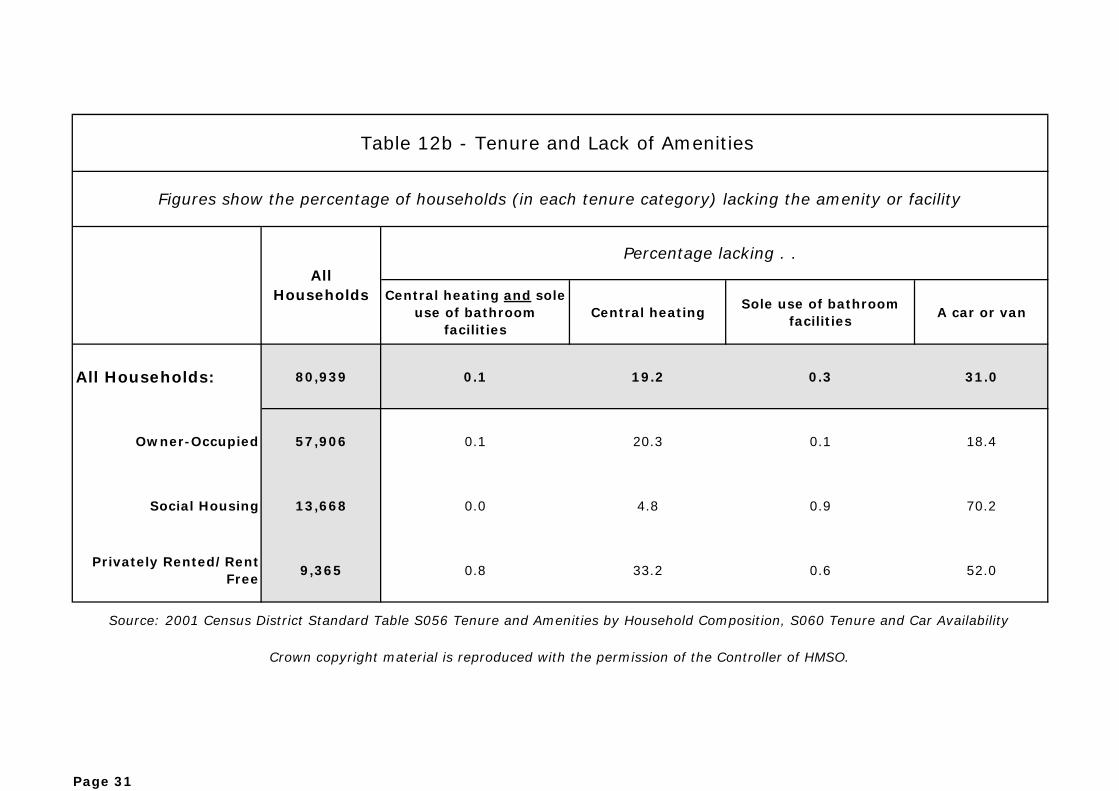
Table 12b - Tenure and Lack of Amenities
Figures show the percentage of households (in each tenure category) lacking the amenity or facility
All Households
Percentage lacking . .
Central heating and sole use of bathroom
facilitiesCentral heating
Sole use of bathroom facilities
A car or van
All Households: 80,939 0.1 19.2 0.3 31.0
Owner-Occupied 57,906 0.1 20.3 0.1 18.4
Social Housing 13,668 0.0 4.8 0.9 70.2
Privately Rented/Rent Free
9,365 0.8 33.2 0.6 52.0
Source: 2001 Census District Standard Table S056 Tenure and Amenities by Household Composition, S060 Tenure and Car Availability
Crown copyright material is reproduced with the permission of the Controller of HMSO.
Page 31

Standard Tables - Definitions and Explanation A. General Points In this set of tables, figures are presented on a topic, first in actual numbers and then in percentages. Columns shaded and in bold show totals or sub-totals. Heavy lines distinguish different sections, or different ways of analysing the data. The percentages shown are usually presented so as to total 100 either across the row or down the column; sometimes, they refer only to the percentage of overall total (of population, households etc). A brief description is provided above each table which explains this. B. Definitions and Explanation Table 1: “Married” includes re-married
Table 2: A “family” is a group of people consisting of a married or cohabiting couple (with or without children) or a lone parent with child(ren). It can include same-sex couples. (Note: A ”household“ comprises one or more families and/or one or more individuals. Households with only one person, or where the occupants are not related in the ways defined above, do not contain any families. Consequently, the number of families is different to the number of households.) A ”dependent child“ is a person in a household aged 0 to 15 (whether or not in a family) or a person aged 16 to 18 who is a full time student in a family with parent(s). An adult in a household is defined as a person who is not a dependent child. “Lone parents” are classified as married if they denote their marital status as married but have no spouse or partner identified in the relationship matrix. The “Family Reference Person” (FRP) is a description allocated by the Census Office. In a lone parent family, it is the lone parent. In a couple family, it is the person with the “highest level” of economic activity, so that if one parent worked full-time and one worked part-time, the full-time worker would be defined as the Family Reference Person. If both have the same “level” of economic activity, the older is the Family Reference Person. If both also are the same age, the Family Reference Person is the first named on the returned Census Form.
Table 3: This table only includes “household residents“; therefore the population figures are lower due to the exclusion of residents in communal establishments (such as residential homes, hospitals) “Limiting Long-term Illness“ is defined on the Census Form as “any long-term illness, health problem or disability which limits your daily activities or the work you can do”.
Table 4: “Part-time” is defined as working 30 hours per week or less. “Students” are categorised in the 2001 Census as economically active or inactive, and the economically active can be broken down into those in paid employment and those actively seeking, and available for, paid employment.
Page 32
Table 5: The Census Form asked people to write in the title and description of their main job (and that of others in the household). These were then coded in line with the Standard Occupation Classification 2000 to produce the categories shown.
Tables 6 & 7: The Census Form asked people to describe the business of their employer at the place they worked. This was then coded in line with the Standard Industrial Classification 1992 to produce the categories shown. “Other” includes other, social and personal services, private households with employed persons and extra-territorial organisations and bodies
Tables 8 & 9: “Shared Ownership” means paying part rent, part mortgage. “Social Housing” includes rented from the Council, or rented from a Registered Social Landlord or Housing Association. “Privately Rented” includes renting from a private landlord or letting agency, from an employer of someone in the household, or from a friend or relative.
Table 10: “Without a car or van”. The Census definition of having a car or van includes have a company vehicle available for private use. “Households with Dependent Children Household, Other” includes two adults (not a couple) with dependent children, or 3+ adults with dependent children. “Other Households, Other” includes all households with 2 or more adults (at least one of whom is a non-pensioner) with no dependent children; and lone parents with only non-dependent children.
Table 11: See notes for Tables 8 & 9 and Table 10
Table 12: “White, Other” includes “White, Irish” and “White, Any Other”. “Mixed, Black” includes “Mixed, White and Black Caribbean” and “Mixed, White and Black African”.
Page 33
Standard Tables – Guidance Notes and Definitions
A. General Points In this set of tables, figures are presented on a topic, first in actual numbers and then in percentages. Columns shaded and in bold show totals or sub-totals. Heavy lines distinguish different sections, or different ways of analysing the data. The percentages shown are usually presented so as to total 100 either across the row or down the column; sometimes, they refer only to the percentage of overall total (of population, households etc). A brief description is provided above each table, which explains this. Page 32
B. Definitions and Explanation Table 1:
“Married” includes re-married
Table 2:
A “family” is a group of people consisting of a married or cohabiting couple (with or without children) or a lone parent with child(ren). It can include same-sex couples.
A ”household“ comprises one or more families and/or one or more individuals. Households with only one person, or where the occupants are not related in the ways defined above, do not contain any families. Consequently, the number of families is different to the number of households.
A ”dependent child“ is a person in a household aged 0 to 15 (whether or not in a family) or a person aged 16 to 18 who is a full time student in a family with parent(s). An adult in a household is defined as a person who is not a dependent child.
“Lone parents” are classified as married if they denote their
marital status as married but have no spouse or partner identified in the relationship matrix.
The “Family Reference Person” (FRP) is a description allocated
by the Census Office.
♦ In a lone parent family, it is the lone parent.
♦ In couple families, it is the person with the “highest level” of economic activity, so that if one parent worked full-time and one worked part-time, the full-time worker would be defined as the Family Reference Person. If both have the same “level” of economic activity, the older is the Family Reference Person. If both also are the same age, the Family Reference Person is the first named on the returned Census Form.
Page 33
Table 3:
“White, Other” includes “White, Irish” and “White, Any Other”.
“Mixed, Black” includes “Mixed, White and Black Caribbean” and “Mixed, White and Black African”.
Table 4:
This table only includes “household residents“; therefore the population figures are lower due to the exclusion of residents in communal establishments (such as residential homes, hospitals).
“Limiting Long-term Illness“ is defined on the Census Form as
“any long-term illness, health problem or disability, which limits your daily activities or the work you can do”.
Table 5:
“Part-time” is defined as working 30 hours per week or less.
“Students” are categorised in the 2001 Census as economically active or inactive, and the economically active can be broken down into those in paid employment and those actively seeking, and available for, paid employment.
Table 6:
The Census Form asked people to write in the title and description of their main job (and that of others in the household). These were then coded in line with the Standard Occupation Classification 2000 to produce the categories shown.
Percentages for All, Males and Females totals relate to the
population aged 16-74 years. Unemployment rates therefore cannot be compared with the usual definition which measures unemployment as a proportion of the economically active population aged up to pensionable age.
Page 34

Tables 7 & 8:
The Census Form asked people to describe the business of their employer at the place they worked. This was then coded in line with the Standard Industrial Classification 1992 to produce the categories shown.
“Other” includes other, social and personal services, private
households with employed persons and extra-territorial organisations and bodies
Tables 9 & 10:
“Shared Ownership” means paying part rent, part mortgage.
“Social Housing” includes rented from the Council, or rented from a Registered Social Landlord or Housing Association.
“Privately Rented” includes renting from a private landlord or
letting agency, from an employer of someone in the household, or from a friend or relative.
Table 11:
“Without a car or van”. The Census definition of having a car or van includes having a company vehicle available for private use.
“Households with Dependent Children Household, Other”
includes two adults (not a couple) with dependent children, or 3+ adults with dependent children.
“Other Households, Other” includes all households with 2 or
more adults (at least one of whom is a non-pensioner) with no dependent children; and lone parents with only non-dependent children.
Table 12:
See notes for Tables 9 & 10 and Table 11
Page 35

manual was established during 2003/04 and should be used as a guide by all staff to
Town Hall Halifax HX1 1UJ Telephone: 01422 393087 Fax: 01422 393136 Email: [email protected]
www.calderdale.gov.uk


