Standardization of RQ Standardization of RQ - - PCR for BCR PCR for BCR - - ABL ABL Nick Cross Wessex Regional Genetics Laboratory, Salisbury Human Genetics Division, University of Southampton
Transcript
Standardization of RQStandardization of RQ--PCR for BCRPCR for BCR--ABLABL
Nick Cross
Wessex Regional Genetics Laboratory, SalisburyHuman Genetics Division, University of Southampton
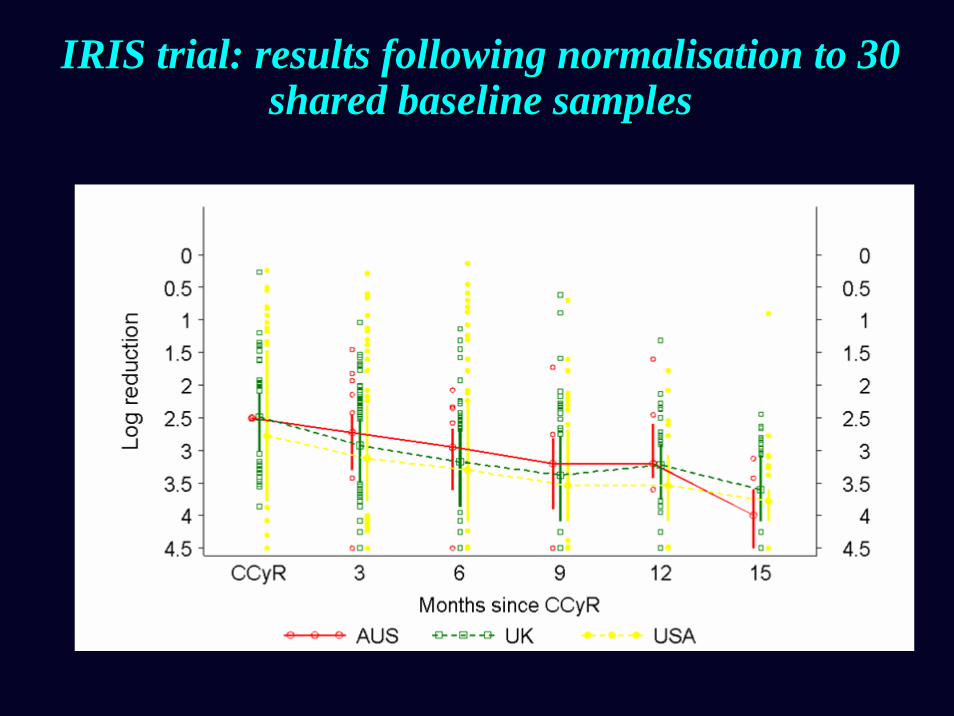
IRIS trial: variation in the three reference centresIRIS trial: variation in the three reference centres
IRIS trial: results following normalisation to 30 IRIS trial: results following normalisation to 30 shared baseline samplesshared baseline samples
Realising the international scale for Realising the international scale for BCRBCR--ABL RQABL RQ--PCRPCR
• BCR-ABL/ABL• BCR-ABL/BCR• BCR-ABL/GUS• (other control genes?)
• Different primers/probes
• TaqMan• LightCycler• Corbett• Others
International standardisation of BCRInternational standardisation of BCR--ABL ABL measurementsmeasurements
0.1% [IRIS MMR; 3 log reduction]
Reference samples:lab-specificconversion
factor1%
0.01%
10%
0.001%
100% [IRIS baseline]
cf. International Normalized Ratio (INR) for Prothrombin time
The Adelaide reference lab has maintained consistency The Adelaide reference lab has maintained consistency of data since the MMR value was established for the of data since the MMR value was established for the
IRIS trial in 2001IRIS trial in 2001-- BCRBCR--ABL/BCR 0.08%ABL/BCR 0.08%
52524242
0.070.070.060.06
93939494
0.090.090.080.08
50506969
0.080.080.090.09
69699393
0.060.060.080.08
53534848
0.070.070.070.07
77778282
0.060.060.070.07
3636 3434217217147147111111 156156
ControlControl
Yearly quality control mean valuesYearly quality control mean values
International standardisation of BCRInternational standardisation of BCR--ABL ABL measurementsmeasurements
BC
RB
CR
-- AB
L le
vel
AB
L le
vel
0.01
0.1
10
1
0.001
0CML cell dilutionCML cell dilution
International standardisation of BCRInternational standardisation of BCR--ABL ABL measurementsmeasurements
BC
RB
CR
-- AB
L le
vel
AB
L le
vel
0.01
0.1
10
1
0.001
0CML cell dilutionCML cell dilution
International standardisation of BCRInternational standardisation of BCR--ABL ABL measurementsmeasurements
BC
RB
CR
-- AB
L le
vel
AB
L le
vel
0.01
0.1
10
1
0.001
0CML cell dilutionCML cell dilution
Conversion factors: current statusConversion factors: current status
International reference labsAdelaide, Mannheim
Lab 1 Lab 2 Lab 3 Lab 4 Lab 5 Lab 6 Lab n……………
EQA schemes
Derivation of conversion factors: current statusDerivation of conversion factors: current status
• Sample exchange:– Either sends 20+ samples to each test lab; K562 or primary CML cells in normal
leucocytes– Or receives 20+ patient samples from test lab
• Derivation of conversion factor:– Samples analysed in both centres; different operators, different days– conversion factor calculated from Bland-Altman bias plots
• Validation:– Samples (20-30) from test lab covering minimum 3 log range sent back to reference lab
for analysis and results compared.
Example of CF CalculationExample of CF Calculation
The CF is the antilog of the Bias = The CF is the antilog of the Bias = 0.230.23
The lab 5 BCRThe lab 5 BCR--ABL values were on ABL values were on average 4.4average 4.4--fold higher than the reference fold higher than the reference
lab values lab values
Mean bias from zero = Mean bias from zero = --0.6440.644
Identity line Identity line X=YX=Y
--22--1.51.5
--11--0.50.5
000.50.5
111.51.5
222.52.5
--22 00 22log1
0 R
efer
ence
Lab
ISlo
g10
Ref
eren
ce L
ab IS
log10 Lab 5log10 Lab 5
Zero bias lineZero bias line
--2.02.0
--1.01.0
00
1.01.0
2.02.0
--22 00 22Mean of both methodsMean of both methods
Diff
eren
ce b
etw
een
met
hods
Diff
eren
ce b
etw
een
met
hodsn=16n=16
Lab 5Lab 5 BCRBCR--ABL/ABL% ABL/ABL% x x 0.230.23 to convert to the to convert to the
international scaleinternational scale
Branford & Hughes
Identity line Identity line X=YX=Y
--22--1.51.5
--11--0.50.5
000.50.5
111.51.5
222.52.5
--22 00 22log1
0 R
efer
ence
Lab
ISlo
g10
Ref
eren
ce L
ab IS
log10 Lab 5log10 Lab 5
Zero bias lineZero bias line
--2.02.0
--1.01.0
00
1.01.0
2.02.0
--22 00 22Mean of both methodsMean of both methods
Diff
eren
ce b
etw
een
met
hods
Diff
eren
ce b
etw
een
met
hodsn=16n=16
--2.52.5 --1.51.5 --0.50.5 0.50.5 1.51.5
Mean of both methodsMean of both methods
Zero bias lineZero bias line
--2.52.5--22
--1.51.5--11
--0.50.500
0.50.511
1.51.5
--2.52.5 --1.51.5 --0.50.5 0.50.5 1.51.5log1
0 R
efer
ence
Lab
ISlo
g10
Ref
eren
ce L
ab IS
log10 Lab 5 ISlog10 Lab 5 IS
Identity line Identity line X=YX=Yn=33n=33
Converted Converted data data
--2.02.0
--1.01.0
00
1.01.0
2.02.0
Validation of Conversion FactorValidation of Conversion Factor
Branford & Hughes
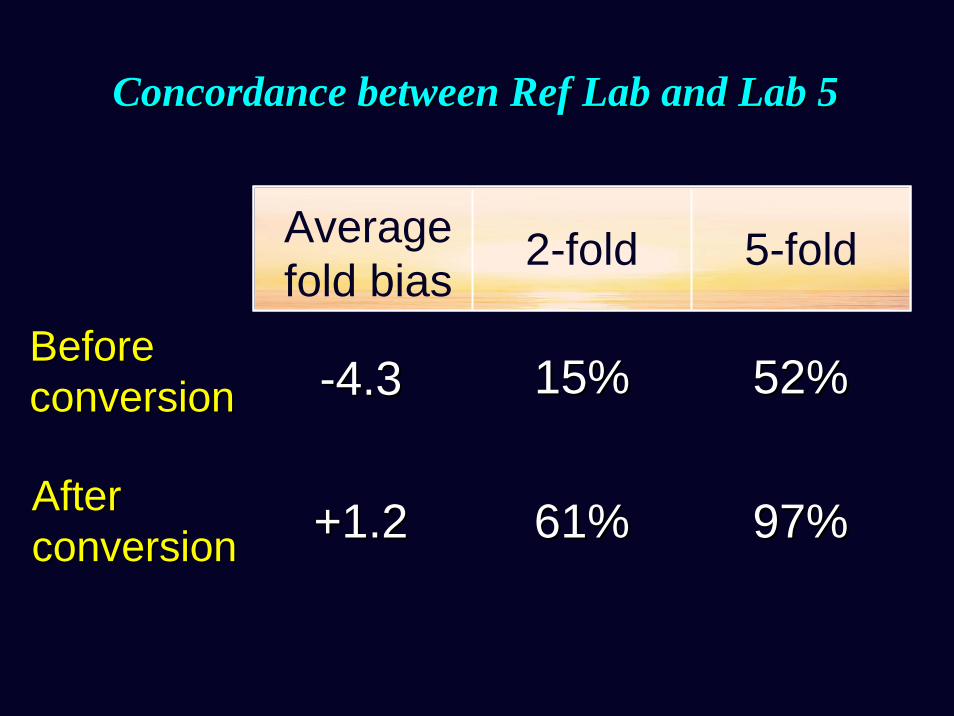
After After conversion conversion +1.2+1.2 61%61% 97%97%
Before Before conversion conversion --4.3 4.3 15%15% 52%52%
Average fold bias
2-fold 5-fold
Concordance between Ref Lab and Lab 5 Concordance between Ref Lab and Lab 5
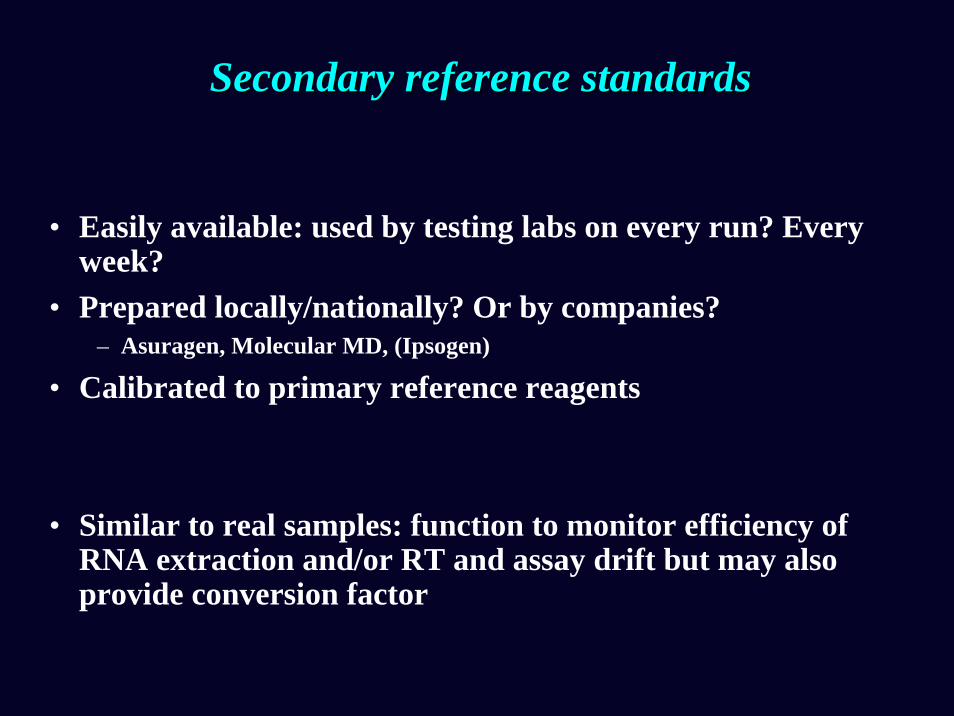
• Easily available: used by testing labs on every run? Every week?
• Prepared locally/nationally? Or by companies?– Asuragen, Molecular MD, (Ipsogen)
• Calibrated to primary reference reagents
• Similar to real samples: function to monitor efficiency of RNA extraction and/or RT and assay drift but may also provide conversion factor
Formulation for primary and/or secondary Formulation for primary and/or secondary reagentsreagents
• [CML cells (primary or K562) diluted in normal leucocytes]
• Cell line mixtures
• Armored RNAs
Cell lines: current statusCell lines: current status
Aim to find cell line or cell line mixture for which the ratio of BCR:ABL:GUS in the same as median of normal leucocytes
1%
0.1% [MMR; 3 log reduction]
0.01%
10%
0.001%
International scale
If successful, dilution standards will define points on IS independent of control gene used (BCR, GUS or ABL)
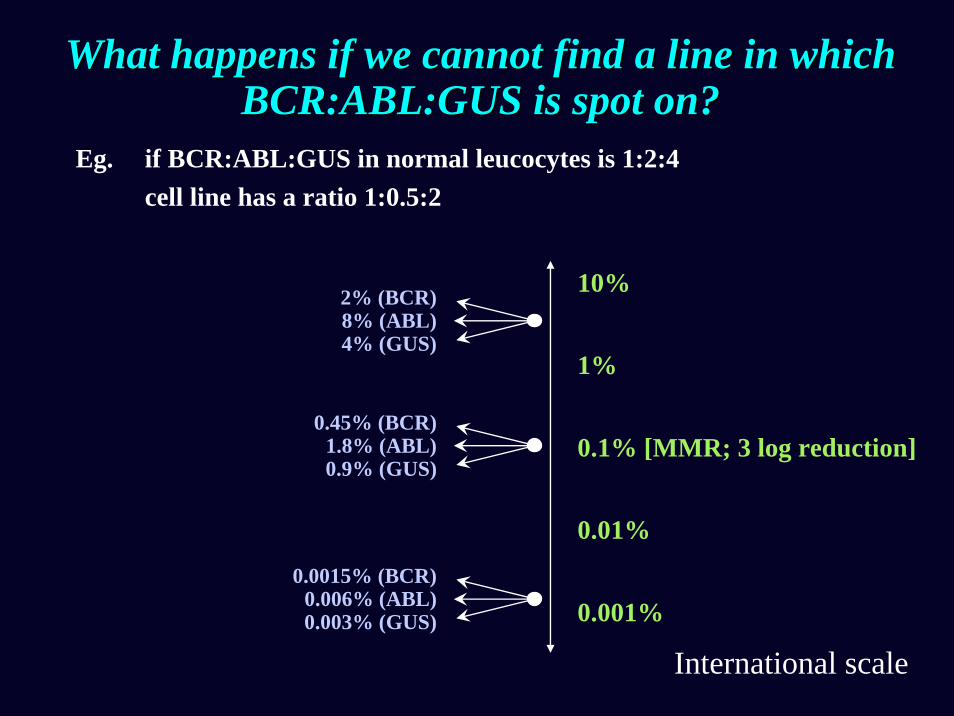
What happens if we cannot find a line in which What happens if we cannot find a line in which BCR:ABL:GUS is spot on?BCR:ABL:GUS is spot on?
Eg. if BCR:ABL:GUS in normal leucocytes is 1:2:4 cell line has a ratio 1:0.5:2
1%
0.1% [MMR; 3 log reduction]
0.01%
10%
0.001%
International scale
2% (BCR)8% (ABL)4% (GUS)
0.45% (BCR)1.8% (ABL)0.9% (GUS)
0.0015% (BCR)0.006% (ABL)0.003% (GUS)
Evaluation of cell linesEvaluation of cell lines
• K562 is fine for BCR-ABL• Non BCR-ABL: Control genes (BCR, ABL and GUS) need to be
expressed at levels comparable to normal leukocytes: KG1 and HL60 (at least the subclones we have tested).
• Pilot batch of freeze dried samples:– Cells grown and mixtures made in Salisbury – 4 dilutions of K562 in both KG1 and HL60; 10%-0.01%; 3x10⁶ cells/vial (109 cells total)– Freeze dried at NIBSC (April 2007)– Initial tests at Salisbury, Mannheim and Marseilles – Full performance evaluation involving 14 labs worldwide July-October 2007
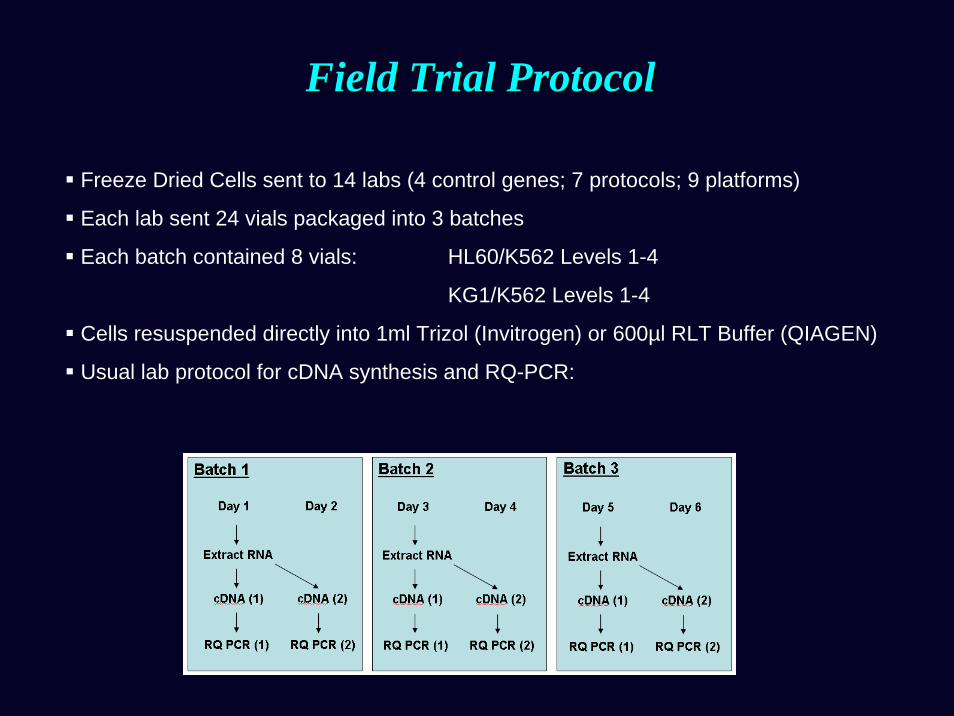
Field Trial ProtocolField Trial Protocol
Freeze Dried Cells sent to 14 labs (4 control genes; 7 protocols; 9 platforms)
Each lab sent 24 vials packaged into 3 batches
Each batch contained 8 vials: HL60/K562 Levels 1-4
KG1/K562 Levels 1-4
Cells resuspended directly into 1ml Trizol (Invitrogen) or 600µl RLT Buffer (QIAGEN)
Usual lab protocol for cDNA synthesis and RQ-PCR:
Freeze dried cells: yields of RNAFreeze dried cells: yields of RNA
Median 30ug RNA/vial
Stability studies ongoing
Stability of freeze dried cellsStability of freeze dried cells
KG1/K562HL60/K562
Trial summaryTrial summary
• Majority of labs obtained linear results with expected slope
• CVs were comparable to those described in other trials with patient samples
• Both HL60 and KG1 performed well
Next stepsNext steps
• Current trial: report to be circulated to participants for comments, then published/circulated more widely
• Selection of cell line combination and levels (HL60/K562?)• Large scale grow ups and freeze drying• Performance evaluation and certification
• 1.5x10⁶ cells/vial• 4 levels: Spanning range 10% - 0.01%• Values assigned to dilutions by reference labs
How will vials be used?How will vials be used?
• Vials should not be simply be available for any testing lab on demand: risk of depleting stock too quickly
• Essential to promote production and widespread availability of secondary reference reagents
ArmoredArmored RNAsRNAs
– Easily available in large quantities– Stable– Good track record for calibration of RNA virus detection assays– Easy to adjust BCR:ABL:GUS ratio– Flexible: can use directly for reverse transcription after heat lysis, put
through RNA extraction or negative sample spike-ins.
ArmoredArmored RNAsRNAs: current status: current status
• Survey of primer sets performed July 2006• Plasmids made (BCR, ABL, GUS, b2a2, b3a2) that cover the regions
targeted by all members of the international group • Sequence verified; sent (essentially gifted) to Asuragen Nov 2006• Armored RNAs arrived in Salisbury May 2007• Copy numbers estimated by NIST-traceable phosphate assay (except
ABL)– Due to lack of sufficient ABL product yield, target was quantified through a standard
OD260 conversion used for estimating copy numbers for Armored RNA non-quantitative products.
• Preliminary in house evaluation successful• International evaluation round
October – November 2007
Initial stability testsInitial stability tests
GUS
BCR
ABL
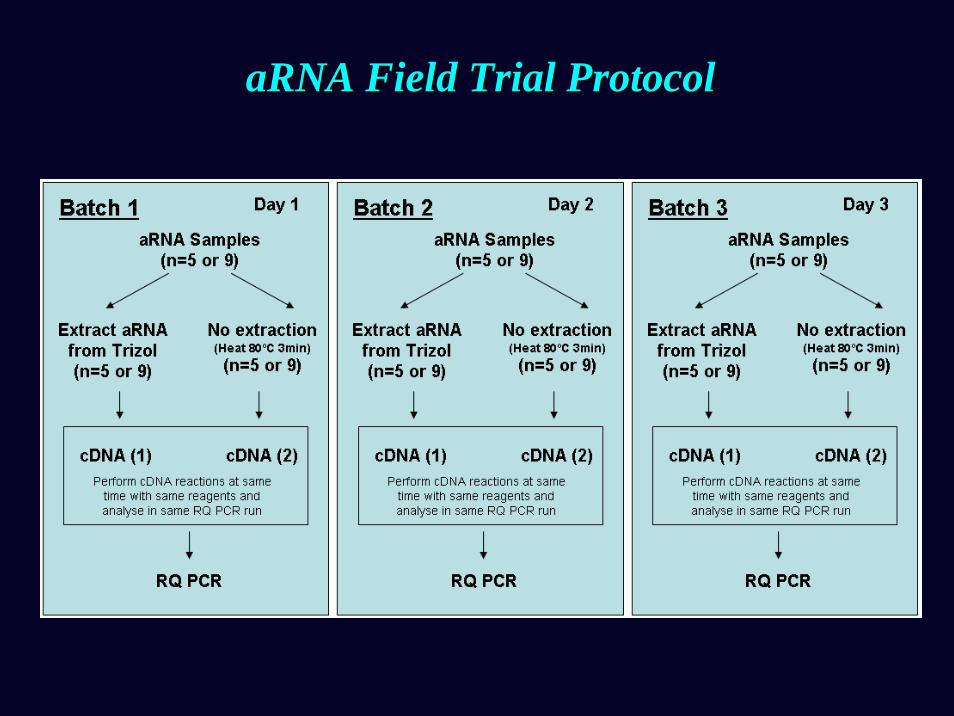
ArmoredArmored RNA Field TrialRNA Field Trial
Evaluation round
aRNA mixes prepared in Salisbury
4 levels of BCR-ABL (in background of BCR+ ABL+ GUS) armored RNA mixtures tested before and after ‘RNA’extraction protocol
Samples sent at ambient temperature
data return by 30th Nov 2007
aRNA sent to 29 labs (19 returned data so far: 18 ABL; 4 BCR; 11 GUS)
22 European: UK (5), France (4), Italy (3), Czech Republic (2), Germany (2), Spain (2), Austria (1), Finland (1), Greece (1), Sweden (1)
USA (3), Australia (1), Korea (1), Singapore (1), Japan (1)
Expected = 3x10⁴; Median unextracted = 1.60x10⁵ ; median extracted = 8.5x10³ ; n=18
Median ABL target values as formulated based on OD260 conversion and not NIST-traceable phosphate assay show an approximately 1 log difference from the expected value.
aRNAaRNA losses during extraction: losses during extraction: trizoltrizol vsvs QiagenQiagen
ABL BCR GUSExpected
Trizol
Trizol
Trizol
QIAGEN
QIAGEN
Med
ian
Cop
y N
umbe
r
SummarySummary
• aRNAs survived ambient temperature transportation• aRNAs worked very well when heat lysed and directly converted to cDNA• Variable losses on RNA extraction (particularly Trizol)• Comparability between normalised values was good
• Next steps– Need to explore addition of carrier to improve Trizol extractions– Need to send out more concentrated aRNAs– Further trial?
» Adjustment of BCR/GUS/ABL ratios to those seen in leucocytes» Provide test samples (and plasmid dilutions)» Test ability of aRNAs to provide comparable results for test samples» Test utility of spiking BCR-ABL RNAs into normal leucocytes
AcknowledgementsAcknowledgements
• Adelaide– Tim Hughes, Sue Branford
• Mannheim– Andreas Hochhaus, Martin Muller
• Salisbury– Helen White
• NIBSC• Asuragen• International BCR-ABL Standardization Group