62
State Intervention into Renting: Making sense of the impact of policy changes Tom Simcock Residential Landlords Association November 2017

State Intervention into Renting: Making sense of the impact of policy changes Tom Simcock
Residential Landlords Association
November 2017

1 RLA PEARL | State Intervention into Renting: Making sense of the impact of policy changes
About the Residential Landlords Association The Residential Landlords Association (RLA) represents the interests of landlords in the private rented sector (PRS) across England and Wales. With over 30,000 members, and an additional 20,000 registered guests who engage regularly with the association, the RLA is the leading voice of private landlords.
The RLA provides support and advice to members, and seeks to raise standards in the PRS through our code of conduct, training and accreditation and the provision of guidance and updates on legislation affecting the sector. Many of the RLA’s resources are available free to non-member landlords and tenants.
The association campaigns to improve the PRS for both landlords and tenants, engaging with policymakers at all levels of Government, to support our mission of making renting better.
For more information about the RLA please visit www.rla.org.uk
You can also call us on 0161 962 0010, email [email protected] or tweet us @RLA_News
About the RLA Private Renting Evidence, Analysis and Research Lab
The Residential Landlords Association’s (RLA) Private renting Evidence, Analysis & Research Lab (PEARL) is a research-based policy exchange for the private rented sector. We provide analysis and research on the economic, social, and political issues facing the private rented sector (PRS). Through this the RLA aims to inform, develop and promote policies that help to make renting better for all.
We provide high-quality research and through our reports, briefings, and events, the RLA’s PEARL provides the opportunity for evidence led policy making in the PRS.
The RLA aims to make an important contribution to the policies that affect the PRS. We believe it is important that policy makers consider the evidence and the potential consequences in their decision making. We seek to influence decision makers in order to translate our research findings into an improved renting experience for landlords and tenants.
For more information about the RLA’s Private renting Evidence, Analysis & Research Lab (PEARL) please visit research.rla.org.uk
You can also call us on 0161 495 9317, email [email protected] or tweet us @RLA_PEARL
2 RLA PEARL | State Intervention into Renting: Making sense of the impact of policy changes
About the Author This report is written and researched by Tom Simcock of the Residential Landlords Association.
Tom Simcock MBPsS is the Senior Researcher for the RLA. Tom’s expertise lies in researching change in society, quantitative and qualitative research methodologies, and behavioural and psychological change approaches. His research on the private rented sector and housing has received national media coverage and has been cited by the House of Commons, House of Lords and the London Mayor. For the past 4 years, he has been researching the changing roles of Fire and Rescue Employees as part of his PhD research. Tom holds an M.Sc. degree from the University of Manchester, and a B.Sc. degree from the University of Chester.
Disclaimer This research report has been written to inform and stimulate policy debate. While effort has been made to ensure that the data and other information are accurate, some errors may remain. The purpose of the report is to provide information, analysis and background regarding the issues effecting landlords and the private rented sector. It is neither intended for use in advertising and promotions nor for market forecasting and no liability is accepted in either regard.
Copyright Intellectual copyright resides with the Residential Landlords Association. However, we want to encourage the circulation of our work as widely as possible while retaining the copyright. We therefore have an open access policy which enables anyone to access this report online for free. Anyone can download, save, and distribute our work. Extracts may be quoted by the media with appropriate credit to the author and the RLA. All copyright and registered trademarks remain the property of their owners.
Preferred citation To cite this report, we would prefer that you use the following:
Simcock, T.J., (2017). State Intervention into Renting: Making sense of the impact of policy changes. Manchester: UK. Residential Landlords Association. Available from: https://research.rla.org.uk/wp-content/uploads/state-intervention-into-renting-2017-report.pdf

3 RLA PEARL | State Intervention into Renting: Making sense of the impact of policy changes
Contents Executive Summary ................................................................................................................. 4
1. Introduction ........................................................................................................................... 6
2. Right to Rent Checks and the impact on Renting.......................................................... 8
3. Landlord Licensing and Enforcing Regulations .......................................................... 11
4. Tenancy Deposits .............................................................................................................. 16
5. Using a Letting Agent and the proposed fee ban ....................................................... 22
6. Key trends in the Private Rented Sector ....................................................................... 28
7. Who are Landlords? .......................................................................................................... 38
8. Who are Tenants? ............................................................................................................. 43
9. Landlord Property Portfolios ........................................................................................... 50
10. Conclusions and Recommendations .......................................................................... 53
11. References ....................................................................................................................... 59
4 RLA PEARL | State Intervention into Renting: Making sense of the impact of policy changes
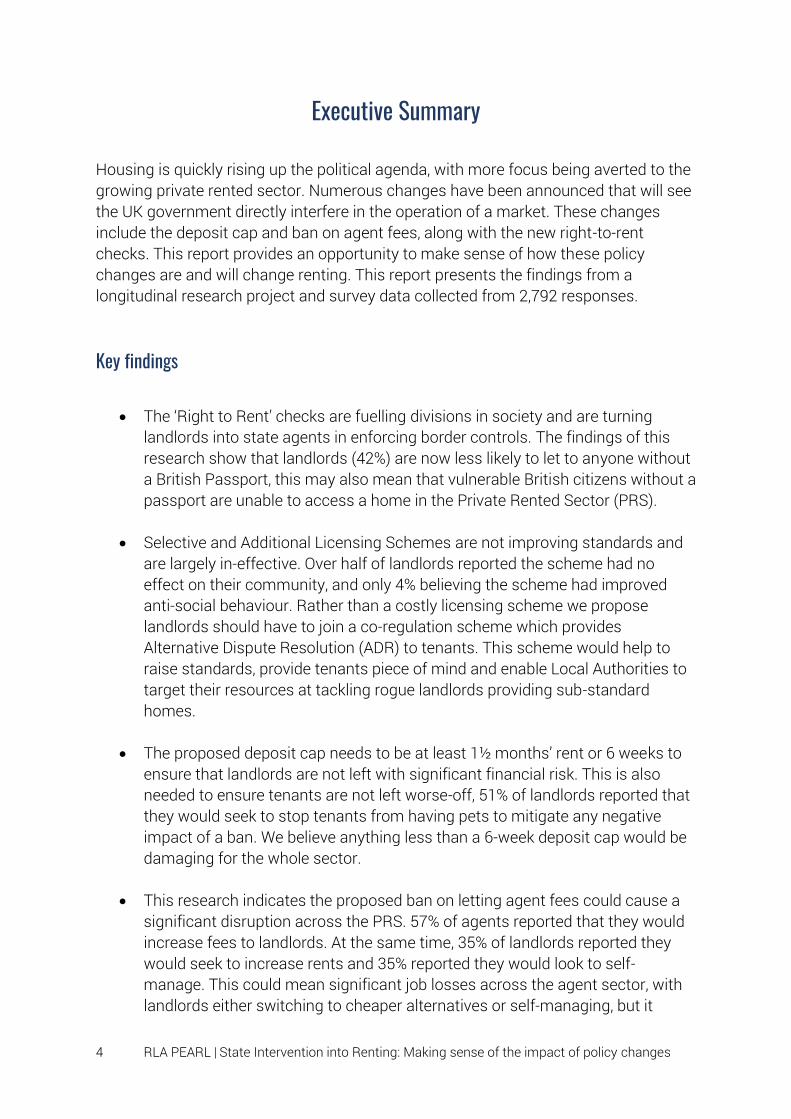
Executive Summary
Housing is quickly rising up the political agenda, with more focus being averted to the growing private rented sector. Numerous changes have been announced that will see the UK government directly interfere in the operation of a market. These changes include the deposit cap and ban on agent fees, along with the new right-to-rent checks. This report provides an opportunity to make sense of how these policy changes are and will change renting. This report presents the findings from a longitudinal research project and survey data collected from 2,792 responses.
Key findings
• The ‘Right to Rent’ checks are fuelling divisions in society and are turning landlords into state agents in enforcing border controls. The findings of this research show that landlords (42%) are now less likely to let to anyone without a British Passport, this may also mean that vulnerable British citizens without a passport are unable to access a home in the Private Rented Sector (PRS).
• Selective and Additional Licensing Schemes are not improving standards and are largely in-effective. Over half of landlords reported the scheme had no effect on their community, and only 4% believing the scheme had improved anti-social behaviour. Rather than a costly licensing scheme we propose landlords should have to join a co-regulation scheme which provides Alternative Dispute Resolution (ADR) to tenants. This scheme would help to raise standards, provide tenants piece of mind and enable Local Authorities to target their resources at tackling rogue landlords providing sub-standard homes.
• The proposed deposit cap needs to be at least 1½ months’ rent or 6 weeks to ensure that landlords are not left with significant financial risk. This is also needed to ensure tenants are not left worse-off, 51% of landlords reported that they would seek to stop tenants from having pets to mitigate any negative impact of a ban. We believe anything less than a 6-week deposit cap would be damaging for the whole sector.
• This research indicates the proposed ban on letting agent fees could cause a significant disruption across the PRS. 57% of agents reported that they would increase fees to landlords. At the same time, 35% of landlords reported they would seek to increase rents and 35% reported they would look to self-manage. This could mean significant job losses across the agent sector, with landlords either switching to cheaper alternatives or self-managing, but it

5 RLA PEARL | State Intervention into Renting: Making sense of the impact of policy changes
would also be irresponsible to expect the landlord to absorb the full increases without this being passed down to the consumer in increased rents.
• Rent arrears is still a significant issue across the Private Rented Sector, with mean average rent arrears standing at £874 million across the whole sector. Our previous research has identified the impact of Universal Credit on rent arrears, the government in light of these findings should take action to reduce the waiting time for UC payments for claimants to ensure tenants can pay their rent on time.
• Looking out across the wider sector, 39% of landlords currently lack confidence in the sector, and that on a whole some landlords are undertaking efforts to promote stability across their property portfolios as they attempt to battle the storm of new regulations, tax changes and economic uncertainty. However, while the proportion of landlords planning to keep their portfolios the same size has remained flat, there are more landlords looking to reduce the size than those who plan to invest, indicating the possibility of a net loss of properties.
• When it comes to rents, the proportion of landlords who plan to keep rents at the same level is up by 12 percentage points on the past 9 months to 55%. In comparison to 42% of landlords who plan to increase rents in the next 12 months. It is likely that the economic and political instability is causing concern for landlords, with many taking steps to minimise risk. This is especially evident with 68% of landlords planning to keep the rent the same to keep their tenant in the property for the long term. However, as nearly 1-in-3 landlords reported they were increasing rents due to the changes in Mortgage Interest Relief, this indicates that change maybe on the horizon and over the next 3 years there could be significant rent changes coming.
6 RLA PEARL | State Intervention into Renting: Making sense of the impact of policy changes
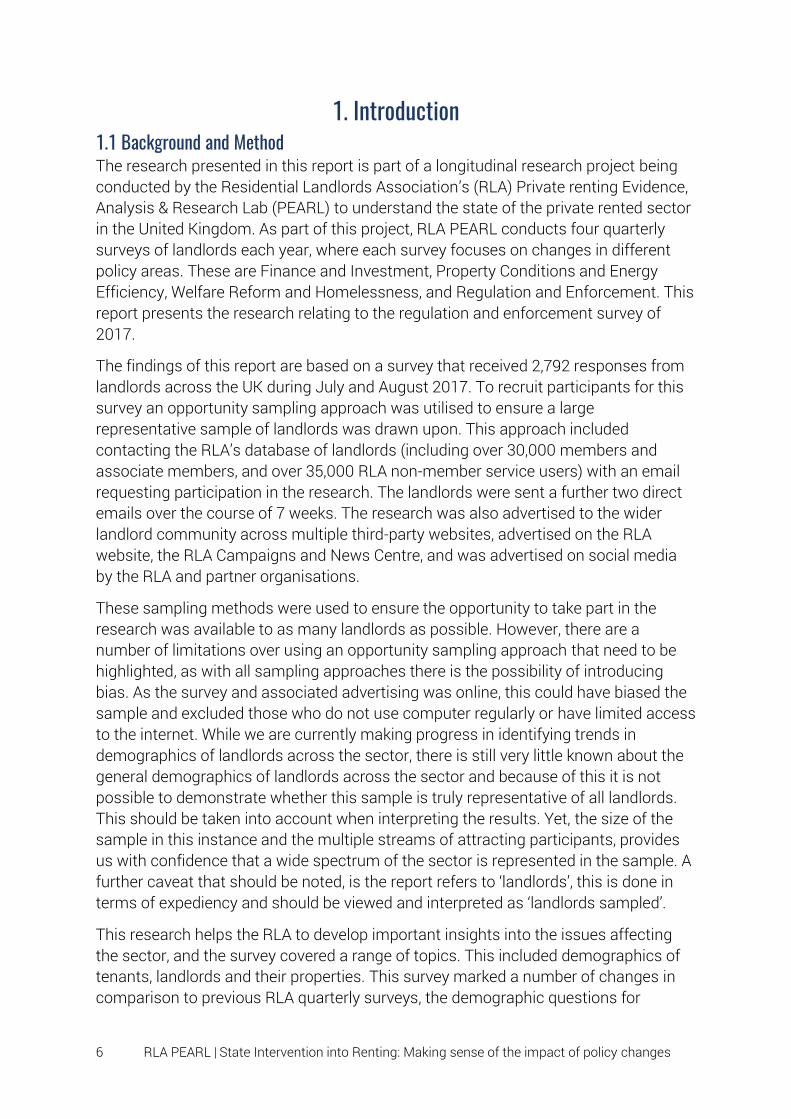
1. Introduction 1.1 Background and Method The research presented in this report is part of a longitudinal research project being conducted by the Residential Landlords Association’s (RLA) Private renting Evidence, Analysis & Research Lab (PEARL) to understand the state of the private rented sector in the United Kingdom. As part of this project, RLA PEARL conducts four quarterly surveys of landlords each year, where each survey focuses on changes in different policy areas. These are Finance and Investment, Property Conditions and Energy Efficiency, Welfare Reform and Homelessness, and Regulation and Enforcement. This report presents the research relating to the regulation and enforcement survey of 2017.
The findings of this report are based on a survey that received 2,792 responses from landlords across the UK during July and August 2017. To recruit participants for this survey an opportunity sampling approach was utilised to ensure a large representative sample of landlords was drawn upon. This approach included contacting the RLA’s database of landlords (including over 30,000 members and associate members, and over 35,000 RLA non-member service users) with an email requesting participation in the research. The landlords were sent a further two direct emails over the course of 7 weeks. The research was also advertised to the wider landlord community across multiple third-party websites, advertised on the RLA website, the RLA Campaigns and News Centre, and was advertised on social media by the RLA and partner organisations.
These sampling methods were used to ensure the opportunity to take part in the research was available to as many landlords as possible. However, there are a number of limitations over using an opportunity sampling approach that need to be highlighted, as with all sampling approaches there is the possibility of introducing bias. As the survey and associated advertising was online, this could have biased the sample and excluded those who do not use computer regularly or have limited access to the internet. While we are currently making progress in identifying trends in demographics of landlords across the sector, there is still very little known about the general demographics of landlords across the sector and because of this it is not possible to demonstrate whether this sample is truly representative of all landlords. This should be taken into account when interpreting the results. Yet, the size of the sample in this instance and the multiple streams of attracting participants, provides us with confidence that a wide spectrum of the sector is represented in the sample. A further caveat that should be noted, is the report refers to ‘landlords’, this is done in terms of expediency and should be viewed and interpreted as ‘landlords sampled’.
This research helps the RLA to develop important insights into the issues affecting the sector, and the survey covered a range of topics. This included demographics of tenants, landlords and their properties. This survey marked a number of changes in comparison to previous RLA quarterly surveys, the demographic questions for
7 RLA PEARL | State Intervention into Renting: Making sense of the impact of policy changes
properties and types of tenants have undergone changes. In this survey, landlords were asked to tick all type of property/tenant for multiple questions rather than asking for the most common type of property/tenant across their portfolio. It is anticipated that this will improve survey responses, make the survey easier for participants to complete and provide a more dynamic view of sector that will enable us to identify wider trends more easily. This report includes questions on a number of legislative and policy changes regarding enforcement of standards in the sector. These include the right to rent checks, local authority licensing, tenancy deposit schemes, and the letting agent fee ban.
The findings of this research help to provide foundations for the RLA’s campaigning to make renting better for all. We also anticipate that this research will provide the opportunity for evidence based decisions by policy-makers and a more in-depth understanding of landlords, tenants and the private rented sector in general by journalists, academics, and the wider public.
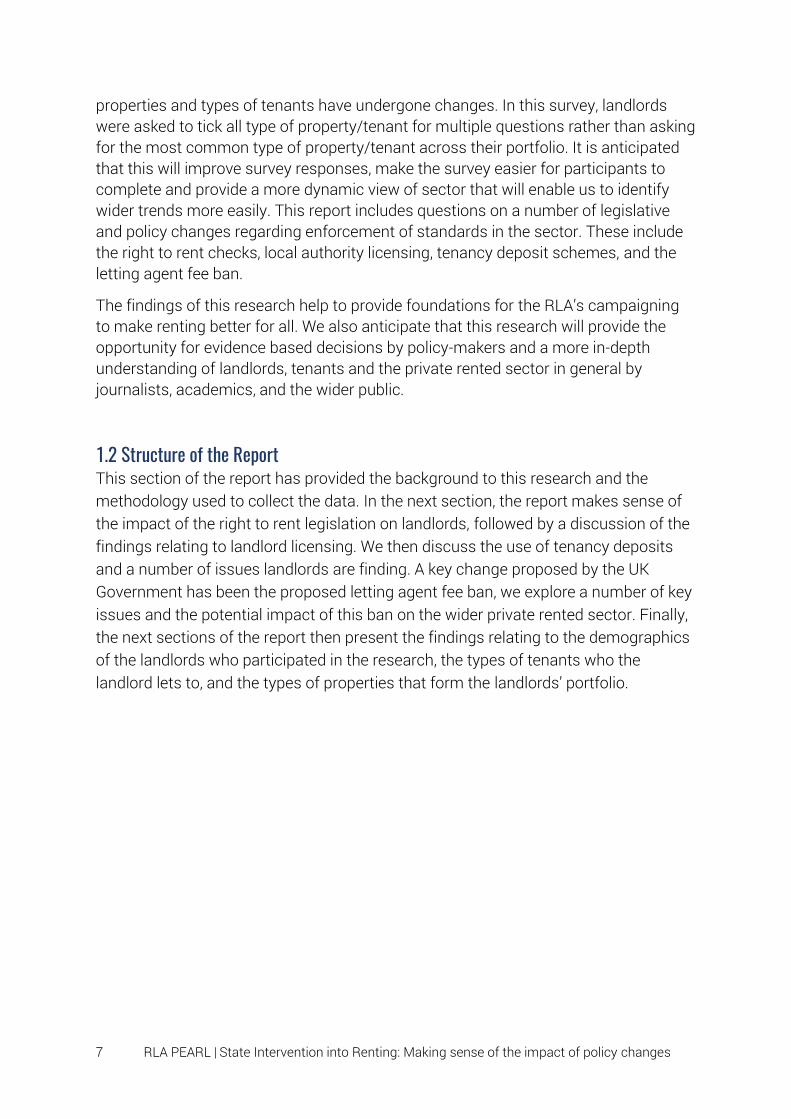
1.2 Structure of the Report This section of the report has provided the background to this research and the methodology used to collect the data. In the next section, the report makes sense of the impact of the right to rent legislation on landlords, followed by a discussion of the findings relating to landlord licensing. We then discuss the use of tenancy deposits and a number of issues landlords are finding. A key change proposed by the UK Government has been the proposed letting agent fee ban, we explore a number of key issues and the potential impact of this ban on the wider private rented sector. Finally, the next sections of the report then present the findings relating to the demographics of the landlords who participated in the research, the types of tenants who the landlord lets to, and the types of properties that form the landlords’ portfolio.
8 RLA PEARL | State Intervention into Renting: Making sense of the impact of policy changes
2. Right to Rent Checks and the impact on Renting
Section 22 of the Immigration Act 2014 placed a duty upon Landlords in England to not let their properties to those without permission to live in the UK. Under this duty, landlords have had to check that their tenants have permission to rent their property if the tenancy started on or after 1st February 2016.
From December 1st 2016, the government introduced additional penalties and offences for landlords who fail to carry out this duty properly. Over the past 12 months, the RLA has been conducting research to monitor the impact of this legislation on landlord behaviour and a landlord’s willingness to let to different groups. This report provides the opportunity to further explore the impact of this legislation.
Key findings:
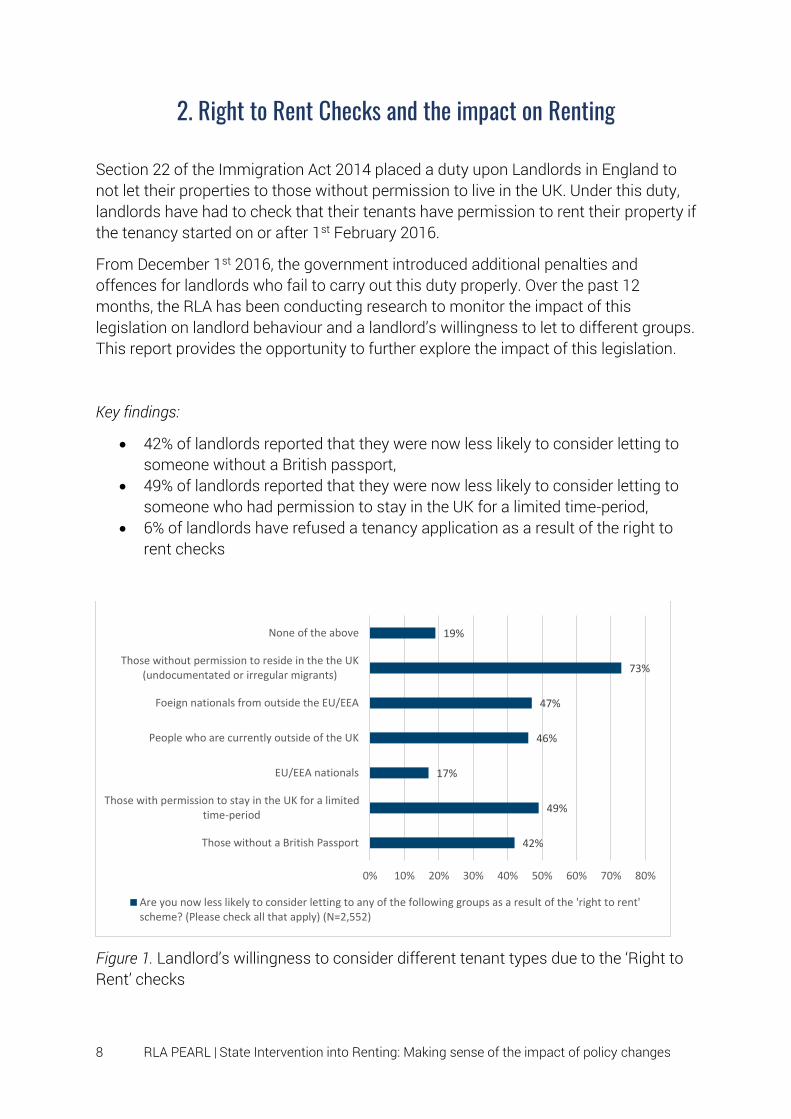
• 42% of landlords reported that they were now less likely to consider letting to someone without a British passport,
• 49% of landlords reported that they were now less likely to consider letting to someone who had permission to stay in the UK for a limited time-period,
• 6% of landlords have refused a tenancy application as a result of the right to rent checks
Figure 1. Landlord’s willingness to consider different tenant types due to the ‘Right to Rent’ checks
42%
49%
17%
46%
47%
73%
19%
0% 10% 20% 30% 40% 50% 60% 70% 80%
Those without a British Passport
Those with permission to stay in the UK for a limitedtime-period
EU/EEA nationals
People who are currently outside of the UK
Foeign nationals from outside the EU/EEA
Those without permission to reside in the the UK(undocumentated or irregular migrants)
None of the above
Are you now less likely to consider letting to any of the following groups as a result of the 'right to rent'scheme? (Please check all that apply) (N=2,552)
9 RLA PEARL | State Intervention into Renting: Making sense of the impact of policy changes
The findings of this survey indicate that the ‘Right to Rent’ checks are having a considerable impact on landlord behaviour, with a majority of landlords now less likely to consider letting to different groups of tenants. 42% of landlords reported that they were now less likely to let to prospective tenants without a British passport. This is particularly concerning for those UK nationals without a passport, many of them potentially the most vulnerable in society1. Therefore, it is possible that this policy is having an unintended consequence of restricting access to the private rented sector for vulnerable individuals.
Moreover, 49% of landlords reported that they were now less likely to consider letting to those who have a right to rent that is for a limited time-period. This therefore suggests that landlords are now more cautious regarding letting to migrants, and this policy could be having an unintended consequence of preventing access to the PRS for those with a genuine right to rent but are not British passport holders. If migrants are unable to find a home this could have a negative economic impact and a loss of skilled workers.
Based on these findings, it is clear that the right to rent policy is having unintended consequences and it is possible that it is preventing individuals from accessing a home. We are calling on the UK Government to review this policy to ensure it does not unfairly prevent individuals who have a genuine ‘right to rent’ from accessing a home in the PRS.
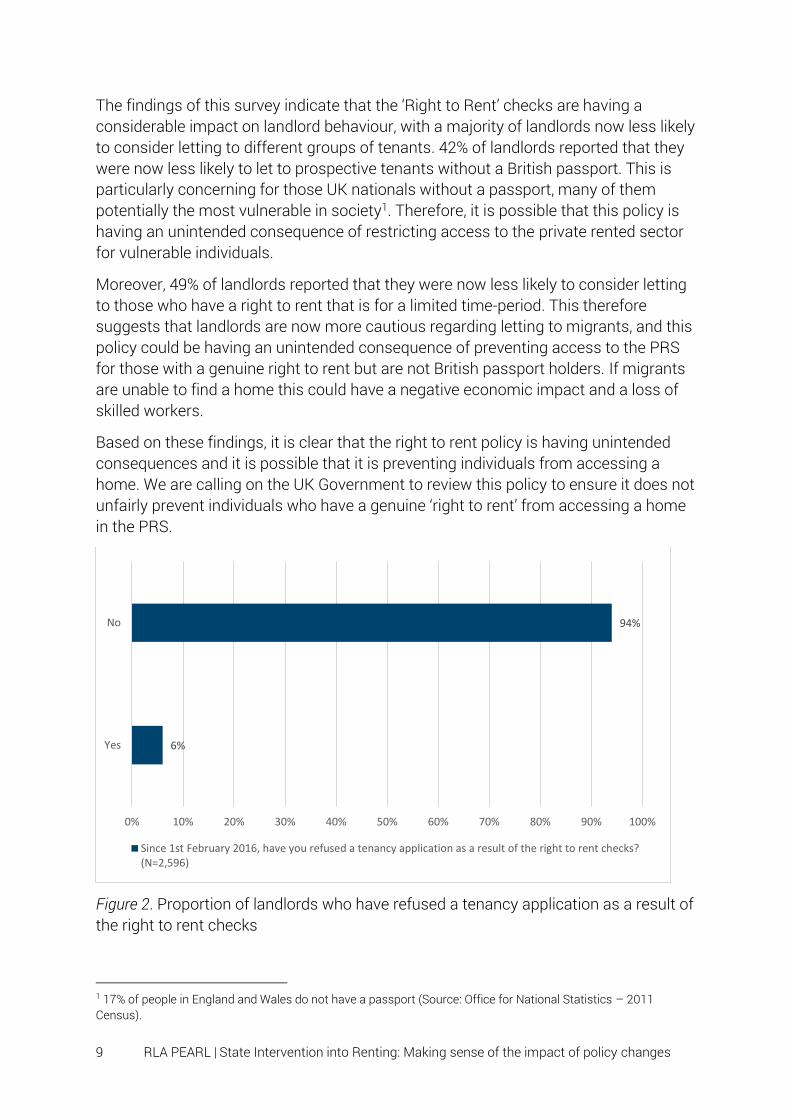
Figure 2. Proportion of landlords who have refused a tenancy application as a result of the right to rent checks
1 17% of people in England and Wales do not have a passport (Source: Office for National Statistics – 2011 Census).
6%
94%
0% 10% 20% 30% 40% 50% 60% 70% 80% 90% 100%
Yes
No
Since 1st February 2016, have you refused a tenancy application as a result of the right to rent checks?(N=2,596)

10 RLA PEARL | State Intervention into Renting: Making sense of the impact of policy changes
The findings in figure 2 above show that 6% of landlords reported they had a refused a tenancy application due to the right to rent checks since February 2016. We can estimate this is, at a minimum, potentially 114,000 tenancy applications that have been refused since February 2016.
Figure 3. Proportion of landlords who are aware of the criminal sanctions for landlords/agents that were introduced on 1st December 2016
One positive finding is that nearly 9 in 10 landlords are aware of the new criminal sanctions for landlords that were introduced on the 1st December 2016. This is positive in regards that the majority of landlords are aware of their responsibilities, however, as 1-in-10 landlords are unaware of the criminal sanctions then further work is required to communicate the legislative updates to landlords and agents across the wider sector.
89%
11%
0% 10% 20% 30% 40% 50% 60% 70% 80% 90% 100%
Yes
No
Are you aware of the introduction of criminal sanctions for landlords/agents who are found to haveknowingly rented a property to someone who does not have a 'right to rent'? (N=2,653)

11 RLA PEARL | State Intervention into Renting: Making sense of the impact of policy changes
3. Landlord Licensing and Enforcing Regulations
This section of the report investigates the implementation of licensing schemes by Local Authorities, landlord perceptions of the impact, and landlord willingness to join a self-regulation scheme.
Key findings:
• 34% of landlords have properties that are affected by a form of licensing scheme
• 60% of landlords reported that the licensing scheme had no impact on the area where their properties are let
• Only 4% of landlords believed that the licensing scheme had reduce anti-social behaviour
• 24% of landlords have increased the rents they charge due to the licensing fees • In Wales, 14% of landlords have now deferred the management of their
properties to a Rent Smart Wales Licensed Agent • 92% of landlords supported the principle of a self-regulation scheme over a
local authority licensing scheme • 79% of landlords reported that they would pay a fee to join a self-regulation
scheme
The survey respondents were first presented with a filter question, designed to identify if the landlord had properties covered by licensing schemes. Overall, 66% of the sample reported they did not have properties in areas covered by licensing, the respondents who reported they did not have properties affected were excluded from the next set of questions on licensing.
12 RLA PEARL | State Intervention into Renting: Making sense of the impact of policy changes
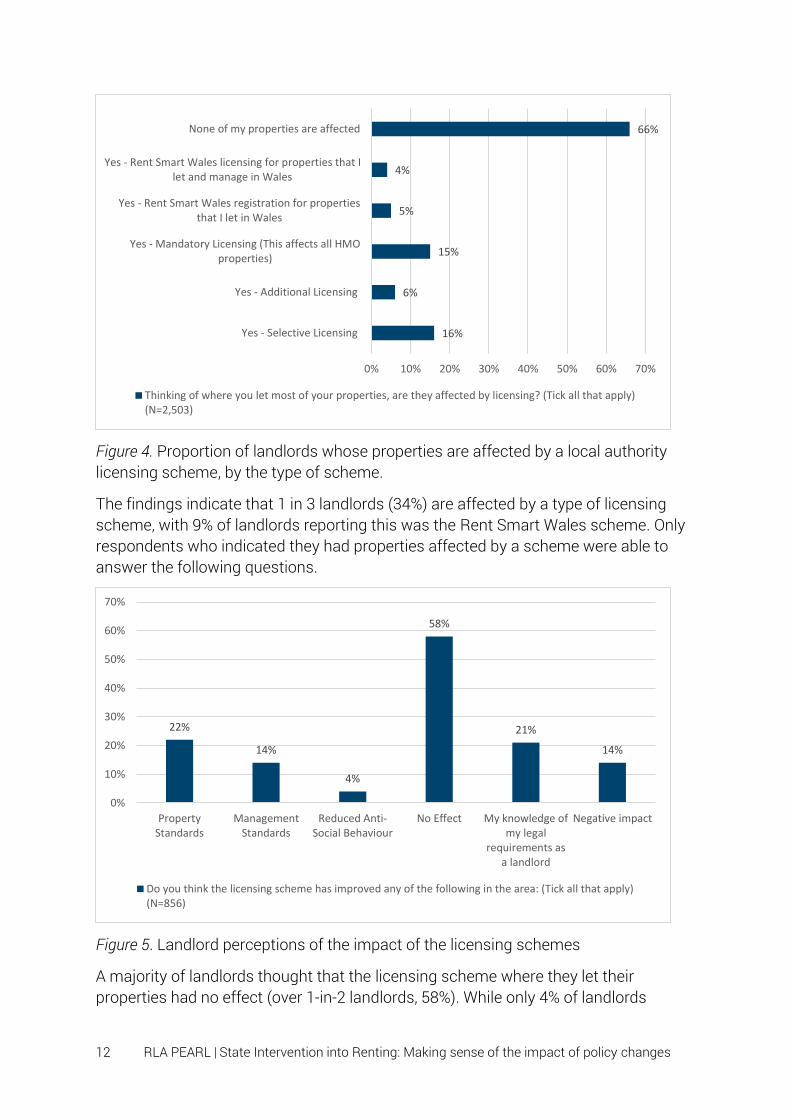
Figure 4. Proportion of landlords whose properties are affected by a local authority licensing scheme, by the type of scheme.
The findings indicate that 1 in 3 landlords (34%) are affected by a type of licensing scheme, with 9% of landlords reporting this was the Rent Smart Wales scheme. Only respondents who indicated they had properties affected by a scheme were able to answer the following questions.
Figure 5. Landlord perceptions of the impact of the licensing schemes
A majority of landlords thought that the licensing scheme where they let their properties had no effect (over 1-in-2 landlords, 58%). While only 4% of landlords
16%
6%
15%
5%
4%
66%
0% 10% 20% 30% 40% 50% 60% 70%
Yes - Selective Licensing
Yes - Additional Licensing
Yes - Mandatory Licensing (This affects all HMOproperties)
Yes - Rent Smart Wales registration for propertiesthat I let in Wales
Yes - Rent Smart Wales licensing for properties that Ilet and manage in Wales
None of my properties are affected
Thinking of where you let most of your properties, are they affected by licensing? (Tick all that apply)(N=2,503)
22%
14%
4%
58%
21%
14%
0%
10%
20%
30%
40%
50%
60%
70%
PropertyStandards
ManagementStandards
Reduced Anti-Social Behaviour
No Effect My knowledge ofmy legal
requirements asa landlord
Negative impact
Do you think the licensing scheme has improved any of the following in the area: (Tick all that apply)(N=856)

13 RLA PEARL | State Intervention into Renting: Making sense of the impact of policy changes
reported that the scheme had reduced anti-social behaviour, in contrast however 21% of landlords (just over 1-in-5 landlords) reported the licensing schemes as improving property standards and improving their knowledge of the legal requirements of being a landlord. The findings indicate that on the whole licensing does not seem to be widely improving standards across the private rented sector, however, in some circumstances licensing has been found to be beneficial for some landlords.
Figure 6. Proportion of landlords that have increased the rent due to licensing fees
Overall, the findings of this survey show that nearly 1-in-4 landlords have increased the rents they charge due to introduction of the licensing scheme and the resultant fees to become licensed.
On average (median), landlords reported they had increased rents by £20 a month (M=£36.25, N=155). When comparing this to the England median average rent for all property types (£675 per month)2, this is equivalent to a 2.96% increase per month. This rental increase is higher than the March 2017 Index of Private Housing Rental Prices (IRHRP) of 2.1% for England3.
2 Valuation Office Agency (2017). Private Rental Market Summary Statistics – April 2016 to March 2017. Available here: https://www.gov.uk/government/uploads/system/uploads/attachment_data/file/620661/PRMS_Statistical_Release_22062017.pdf 3 Office for National Statistics (2017). Index of private housing rental prices (IPHRP) in Great Britain: Mar 2017. Available here: https://www.ons.gov.uk/economy/inflationandpriceindices/bulletins/indexofprivatehousingrentalprices/mar2017
24%
76%
Have you increased rents due to licensing fees? (N=880)
Yes No

14 RLA PEARL | State Intervention into Renting: Making sense of the impact of policy changes
Figure 7. Proportion of landlords who have registered with Rent Smart Wales
The findings of the survey show that 13% of landlords in this sample have yet to register with the Rent Smart Wales, and 6% of landlords have yet to defer management to an agent or apply for a licence to manage their properties. These landlords are leaving themselves open to enforcement action from their local authorities, including a fine up to £5000.
Figure 8. Landlord perceptions of self-regulation schemes
In a separate section of the survey, landlords were asked about their views on self-regulation schemes. The Residential Landlords Association has proposed a self-
87%
80%
14%
2%
1%
1%
0% 10% 20% 30% 40% 50% 60% 70% 80% 90% 100%
I have registered with Rent Smart Wales
I have licensed with Rent Smart Wales
I have deferred management of my properties to aRent Smart Wales Licensed Agent
I haven't taken any steps to comply yet
I haven't taken any steps to comply yet AND I havebeen sanctioned by Rent Smart Wales
I have taken steps to comply AND I have beensanctioned by Rent Smart Wales
If you are a landlord of properties in Wales, how have you complied with Rent Smart Wales? (Tick allthat apply) (N=171)
92%
8%
79%
21%
0% 10% 20% 30% 40% 50% 60% 70% 80% 90% 100%
Yes
No
Would you pay a fee to join a self-regulation scheme that exempts you from local authority licensing andenforcement in the first instance? (N=2,464)
Do you support the principles of a self-regulation scheme rather than a local authority licensing scheme? (N=2,525)

15 RLA PEARL | State Intervention into Renting: Making sense of the impact of policy changes
regulation scheme rather than local authority licensing, where briefly compliant landlords can join an approved scheme with a code of practice and alternative dispute resolution for tenants with complaints about their homes or landlords. This survey provided an opportunity to gather information on landlords’ perceptions of this policy suggestion. The findings are overwhelmingly positive, with over 9-in-10 landlords supporting the principle of a self-regulation scheme and nearly 8-in-10 landlords were willing to pay a fee to join a scheme. This demonstrates that landlords want to ensure high standards across the sector and provide safe and secure homes for their tenants.
When asked about the Housing and Planning Act 2016 and the new powers provided to Local Authorities to tackle rogue landlords, 69% reported they were aware of these changes (N=2,572).
Figure 9. Landlord awareness of new enforcement powers provided by the Housing and Planning Act 2016
Yet, the awareness of the individual new enforcement powers is mixed, more landlords were unaware of the new powers relating to Rent Repayment Orders, Banning Orders, and the Database of Rogue Landlords (all at 54%) than the civil penalties (44%). This finding indicated that current efforts by the government to inform the wider sector on new legislation and enforcement action is limited, but it also suggests the RLA could do more to educate and inform members about the incoming changes.
56%
46% 46% 46%44%
54% 54% 54%
0%
10%
20%
30%
40%
50%
60%
Civil Penalties (N=2,488) Rent Repayment Orders(N=2,471)
Banning Orders (N=2,459) Database of RogueLandlords and Letting
Agents (N=2,480)
Aware Unaware
16 RLA PEARL | State Intervention into Renting: Making sense of the impact of policy changes
4. Tenancy Deposits
Upfront costs for tenants, including letting agent fees and the deposit for securing a home to rent have received significant political attention over the past 12 months. Moreover, they form part of the government’s focus on the affordability of homes in the private rented sector. This research provides a unique opportunity to explore current issues around deposits and the upfront costs to renting for tenants.
Key findings:
• 49% of landlords take a holding deposit • 89% of landlords take a deposit when letting their properties • 99% of landlords protect the deposit in an approved scheme • 49% of landlords ask for a higher deposit if the tenant would like a pet • 51% reported they would stop tenants from having pets to mitigate any
negative impact on the proposed deposit cap • 41% of landlords have made a claim against a tenant’s deposit in the past 12
months • The main reason for making a claim was the lack of sufficient
hygiene/cleanliness at the end of the tenancy (62%)
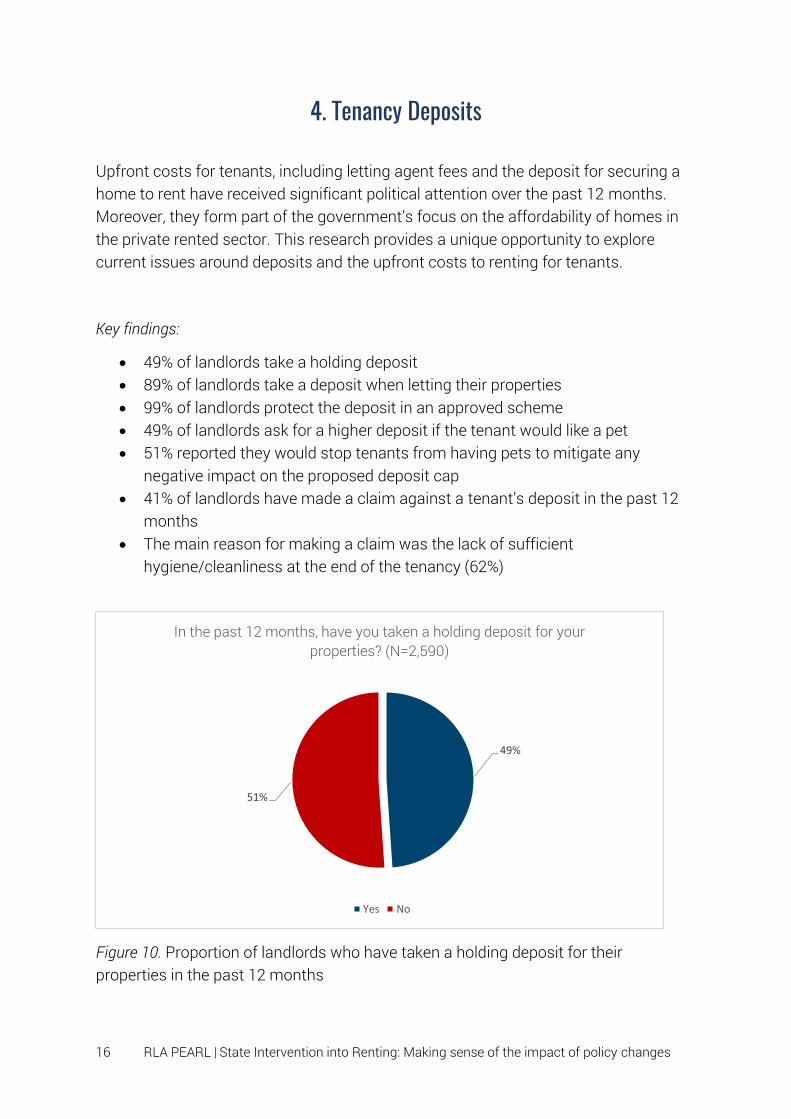
Figure 10. Proportion of landlords who have taken a holding deposit for their properties in the past 12 months
49%
51%
In the past 12 months, have you taken a holding deposit for your properties? (N=2,590)
Yes No

17 RLA PEARL | State Intervention into Renting: Making sense of the impact of policy changes
49% of landlords reported taking a holding deposit from tenants for the property. With the proposed letting agent fee ban, where upfront charges for referencing will be banned, landlords may increasingly take a holding deposit to deter tenants who may fail the referencing or ensure after the landlord pays for referencing that the tenant commits to the property. Nearly 1-in-9 landlords reported that themselves (or their agent) took a deposit from tenants when letting their property.
Figure 11. Proportion of landlords that take a deposit when letting their property
Overall, 99% of landlords reported that they protected the deposit with an approved scheme. Landlords have been required to protect the deposit they take with an approved scheme by law since 2007, and if they have not protected the deposit, can lose the ability to serve a Section 21 notice and face a Court Order for three times the amount of the deposit to be paid to the tenant.
Figure 12. Proportion of landlords that protect the deposit with an approved scheme.
89%
11%
0%
10%
20%
30%
40%
50%
60%
70%
80%
90%
100%
Yes No
Do you (or your agent) take a deposit when letting your properties? (N=2,635)
99%
1%0%
20%
40%
60%
80%
100%
120%
Yes No
If you take a deposit, do you protect it with an approved scheme? (N=2,317)

18 RLA PEARL | State Intervention into Renting: Making sense of the impact of policy changes
On average landlords reported taking 5 weeks deposit (N=2,311), this indicates that on average landlords take more than 1 months’ worth of rent as deposit. This is likely due to landlords’ attempts to minimise risk of a tenant leaving without paying the final month’s rent and leaving damage to the property. This is supported by further analysis of the data, which identifies that 53% of landlords took 1 month’s rent, while 22% of landlords took 6 weeks rent as a deposit.
Figure 13. Proportion of landlords’ that ask tenants for a higher deposit if they would like a pet
We asked whether landlords took a higher deposit from tenants if they would like to have a pet. Overall, slightly more landlords responded that they did over those that did not, with 51% of landlords reporting they did in comparison to 49% who did not.
49%
51%
48% 49% 49% 50% 50% 51% 51% 52%
Yes
No
Do you ask for a higher deposit if the tenant would like to have a pet? (N=2,201)

19 RLA PEARL | State Intervention into Renting: Making sense of the impact of policy changes
Figure 14. Landlord mitigation strategies to any potential negative impact of the deposit cap
The proposed deposit fee cap is a significant intervention by the government into the private rented sector. This survey provided an ideal opportunity to examine the potential future impact on the sector and how landlords may mitigate any negative effects. The results of the survey identify the primary strategy will be for landlords to stop tenants from having pets (51%), followed by increasing rents (44%). Though, only 1-in-5 landlords reported they would stop taking deposits and use a deposit replacement insurance product instead. This suggests that there is the potential for the growth of these products across the sector, however, this will also be affected by consumer preferences as well. Nonetheless, it appears that the use of deposits in the private rented sector will continue for the short to medium term.
In the next question, landlords were asked about making claims against a tenant’s deposit and the reasons why. Overall, 41% of landlords reported they needed to make a claim against a tenant’s deposit (N=2,326). The most common reasons for the claims were:
1) Direct damage to the property (45% of landlords) 2) Indirect damage due to negligence or lack of maintenance/cleaning (44% of
landlords) 3) Rent arrears (43% of landlords)
These findings present a number of issues for the implementation of a cap on deposits. In a situation where there is damage to the property and rent arrears, a cap on deposits could mean that the landlord is left with substantial costs as the deposit
44%
51%
19%
0%
10%
20%
30%
40%
50%
60%
Increase rents Stop tenants from having pets Stop taking deposits and use adeposit replacement insurance
product instead
The government is proposing to cap the amount a landlord can take in a deposit to the equivalent to 1months rent. What will you do to mitigate any negative impact? (Select all that apply) (N=1,948)

20 RLA PEARL | State Intervention into Renting: Making sense of the impact of policy changes
may not cover the total costs. The impact of this policy may mean that landlords change their letting strategy away from riskier tenants and this may make it more difficult for vulnerable tenants or tenants with poor rental history to access homes in the sector. While we understand the need to ensure that the access to a private rented sector home remains affordable, we hope that the government considers the potential unintended consequences of a cap on deposits to 1 month’s rent. It would be more practical to put in place a cap of 1 ½ month’s rent to minimise any potential negative impacts. However, a truly disruptive solution for the sector would be to develop a deposit passport system where the deposit can be transferred between properties in the sector while an insurance product (for a small fee) covers the switch-over period and any potential damages. This system could then be linked with a financial savings product (such as an ISA) to support tenants in their efforts to save for their own first property and could be used as part of the deposit for a home.
Figure 15. Reasons provided by landlords for making a claim against a tenant’s deposit
43%
10%
12%
45%
30%
37%
44%
32%
0% 5% 10% 15% 20% 25% 30% 35% 40% 45% 50%
Rent Arrears
Unpaid bills at the end of the tenancy
Stolen or missing items from the property
Direct damage to the property
Damage to items/furniture in the property
Unwanted belongings left in the property by thetenant
Indirect damage due to negligence or lack ofmaintenance/cleaning
Lack of sufficient hygiene/cleanluness at the end ofthe tenancy
If you answered yes to the above question, what were the reasons for making a claim? (Select all thatapply) (N=993)

21 RLA PEARL | State Intervention into Renting: Making sense of the impact of policy changes
Figure 16. Landlord satisfaction with handling of the deposit complaints and usage of property inventories
The final questions on deposits examined whether landlords undertook property inventories and whether they were happy with the Deposit Scheme’s handling of the complaint. Overall, 88% of landlords reported completed a property inventory at the start of a new tenancy. This is welcome news and indicates that a majority of landlords are undertaking good practices that help to protect both themselves and their tenant when things go wrong. Finally, a majority of landlords reported they were happy with the deposit scheme’s handling of the complaints regarding the deposit, this suggests that the deposit schemes are providing good customer service and helping to support both landlords and tenants.
82%
88%
18%
12%
0% 10% 20% 30% 40% 50% 60% 70% 80% 90% 100%
Were you happy with the Deposit Scheme's handlingof your or your tenant's complaint? (N=1,044)
Did you complete a property inventory at the start ofany new tenancy in the past 3 years? (N=2,278)
No Yes

22 RLA PEARL | State Intervention into Renting: Making sense of the impact of policy changes
5. Using a Letting Agent and the proposed fee ban
In the Autumn Statement of 2016, the UK Government announced that letting agents would be prevented from charging fees to tenants4. In the government’s announcement it was reported that this would save tenants from excessive fees and ensure access to the sector for tenants was affordable. The government in the period between this announcement and this report have undertaken a consultation5, however, it has at this time yet to deliver its findings. As part of this report we have chosen to dedicate a chapter to examining the potential impact of the changes on landlords and letting agents. It is anticipated that the findings of this research can be used to influence evidence-based policies and help to shape the academic, political and public discourse around the private rented sector.
Our key findings are:
• 62% of letting agents charge fees to both tenants and landlords • 57% of letting agents reported they will increase fees to landlords after the
introduction of the proposed fee ban • 63% of landlords use a letting agent for some part of their letting activities • 11% of landlords have experienced fee increases in anticipation of the fee ban • 1 in 5 landlords are now less likely to use an agent due to the fee ban • 35% of landlords will be looking to self-manage their properties due to the
letting agent fee ban
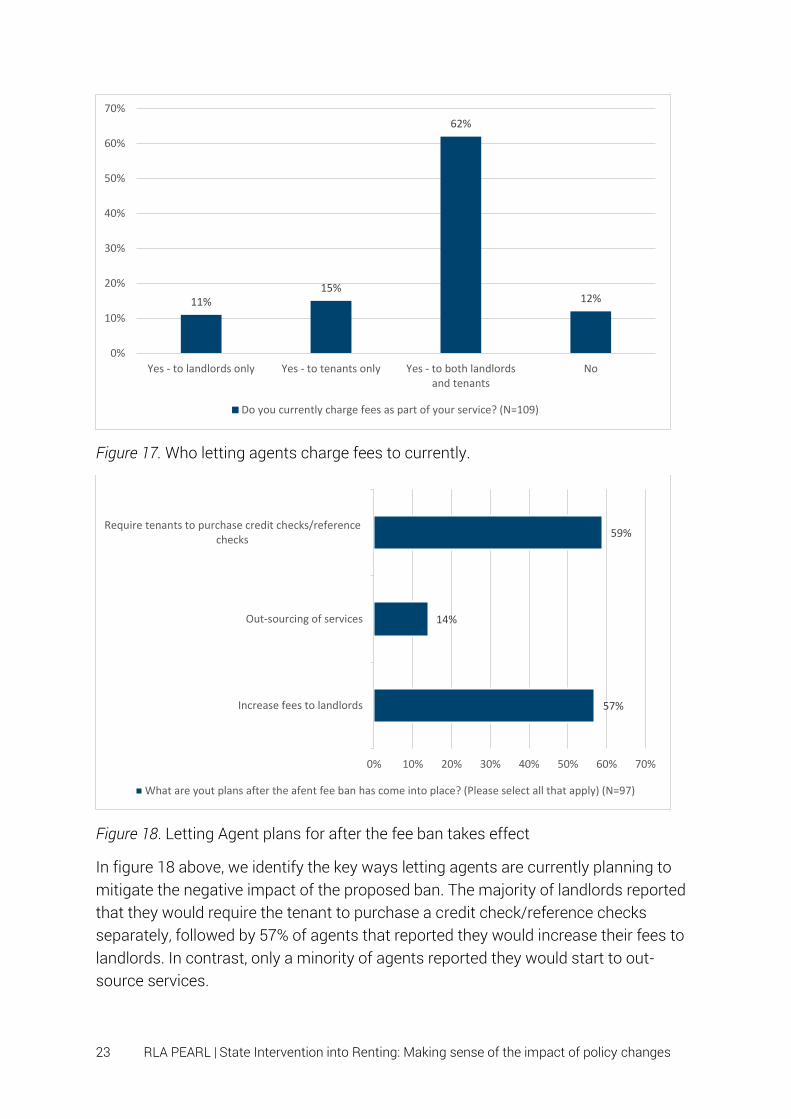
5.1 A view from Letting Agents As part of this survey we put in a filter question to split the sample between those respondents who viewed themselves as letting agents, and those who saw themselves as landlords. Overall, 4% of the sample reported that they were a letting agent. The following questions were only shown to the letting agents. As displayed in figure 17 below, 62% of letting agents charged fees to both tenants and landlords, in contrast only 12% of agents reported charging no fees.
4 HM Treasury (2016) Autumn Statement 2016: some of the things we’ve announced. Available here: https://www.gov.uk/government/news/autumn-statement-2016-some-of-the-things-weve-announced 5 DCLG (2017) Banning letting agent fees paid by tenants. Available here: https://www.gov.uk/government/consultations/banning-letting-agent-fees-paid-by-tenants
23 RLA PEARL | State Intervention into Renting: Making sense of the impact of policy changes
Figure 17. Who letting agents charge fees to currently.
Figure 18. Letting Agent plans for after the fee ban takes effect
In figure 18 above, we identify the key ways letting agents are currently planning to mitigate the negative impact of the proposed ban. The majority of landlords reported that they would require the tenant to purchase a credit check/reference checks separately, followed by 57% of agents that reported they would increase their fees to landlords. In contrast, only a minority of agents reported they would start to out-source services.
11%15%
62%
12%
0%
10%
20%
30%
40%
50%
60%
70%
Yes - to landlords only Yes - to tenants only Yes - to both landlordsand tenants
No
Do you currently charge fees as part of your service? (N=109)
57%
14%
59%
Increase fees to landlords
Out-sourcing of services
Require tenants to purchase credit checks/referencechecks
0% 10% 20% 30% 40% 50% 60% 70%
What are yout plans after the afent fee ban has come into place? (Please select all that apply) (N=97)

24 RLA PEARL | State Intervention into Renting: Making sense of the impact of policy changes
5.2 Landlords and using Letting Agents 96% of the sample identified themselves as a landlord, and this sub-section of the sample were presented with the following questions on the proposed fee ban. 63% of the sample reported that they use a letting agent for part of their letting process for some of their properties. The most common type of usage was Tenant Find Only, with 29% of landlords, followed by 25% of landlords who use an agent for full management of their property. This generally includes maintenance, tenant checks, protecting the deposit, check-in and check-out, and usually is charged as a percentage of the rent on a monthly basis to the landlord.
Figure 19. Proportion of landlords that use a letting agent
25%
4%
29%
5%
37%
0%
5%
10%
15%
20%
25%
30%
35%
40%
Yes - FullManagement
Yes - Non-repair Yes - Tenant FindOnly
Yes - Let Only No
Do you use a Letting Agent for any of your properties? (N=2,427)
25 RLA PEARL | State Intervention into Renting: Making sense of the impact of policy changes
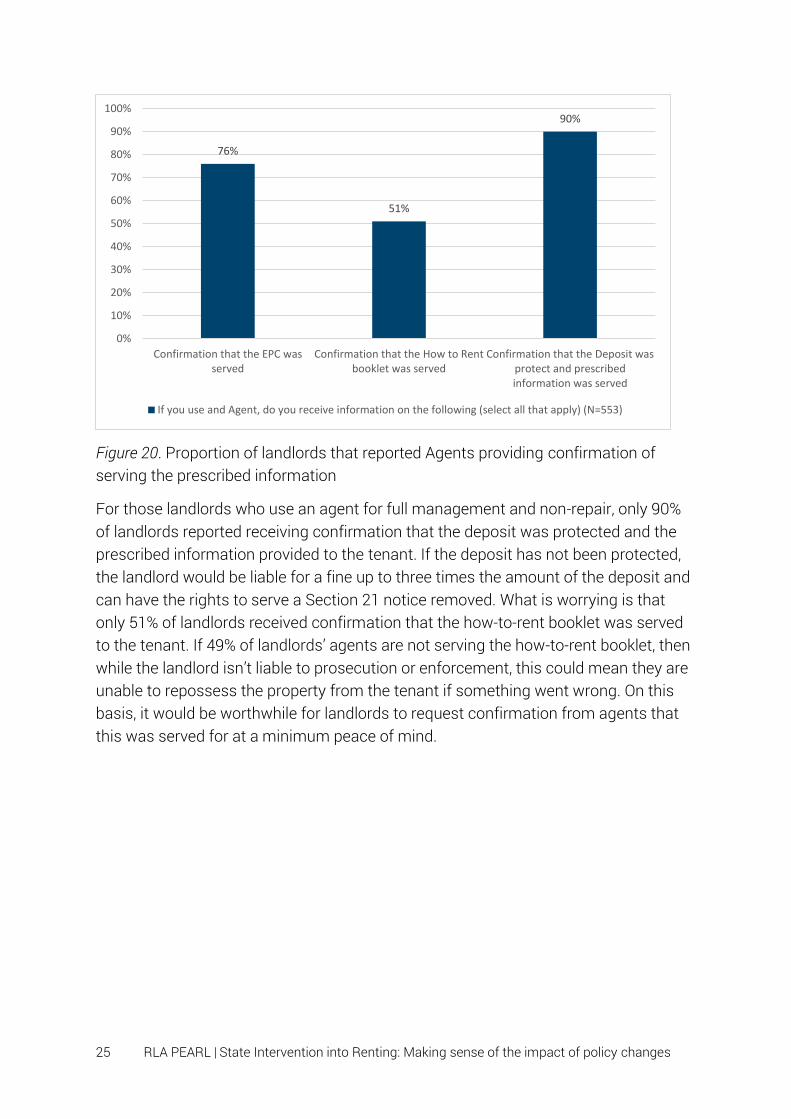
Figure 20. Proportion of landlords that reported Agents providing confirmation of serving the prescribed information
For those landlords who use an agent for full management and non-repair, only 90% of landlords reported receiving confirmation that the deposit was protected and the prescribed information provided to the tenant. If the deposit has not been protected, the landlord would be liable for a fine up to three times the amount of the deposit and can have the rights to serve a Section 21 notice removed. What is worrying is that only 51% of landlords received confirmation that the how-to-rent booklet was served to the tenant. If 49% of landlords’ agents are not serving the how-to-rent booklet, then while the landlord isn’t liable to prosecution or enforcement, this could mean they are unable to repossess the property from the tenant if something went wrong. On this basis, it would be worthwhile for landlords to request confirmation from agents that this was served for at a minimum peace of mind.
76%
51%
90%
0%
10%
20%
30%
40%
50%
60%
70%
80%
90%
100%
Confirmation that the EPC wasserved
Confirmation that the How to Rentbooklet was served
Confirmation that the Deposit wasprotect and prescribedinformation was served
If you use and Agent, do you receive information on the following (select all that apply) (N=553)

26 RLA PEARL | State Intervention into Renting: Making sense of the impact of policy changes
Figure 21. Impact of the proposed letting agent fee ban on current fees to landlords
As part of the monitoring of the introduction of the fee ban, we will be identifying if landlords are seeing their fees to agents increase. From this survey, only a minority 11% of landlords have seen increased fees since the announcement. In figure 22, we explore whether landlords are more or less likely to consider using an agent. Overall, the majority of landlords reported no change to their use of an agent, while 1-in-5 landlords reported they would be less likely to choose an agent. This could mean some landlords are seeking to self-manage more properties.
Figure 22. Impact of proposed Letting Agent Fee Ban on use of letting agents by landlords
11%
89%
0% 10% 20% 30% 40% 50% 60% 70% 80% 90% 100%
Yes
No
Since the announcment of the Letting Agent Fee Ban, have you seen increased fees? (N=1,744)
19%
79%
2%
0%
10%
20%
30%
40%
50%
60%
70%
80%
90%
Less likely No change More likely
Since the announcment of the Letting Agent Fee Ban, how likely are you now to consider using aletting agent? (N=2,147)
27 RLA PEARL | State Intervention into Renting: Making sense of the impact of policy changes
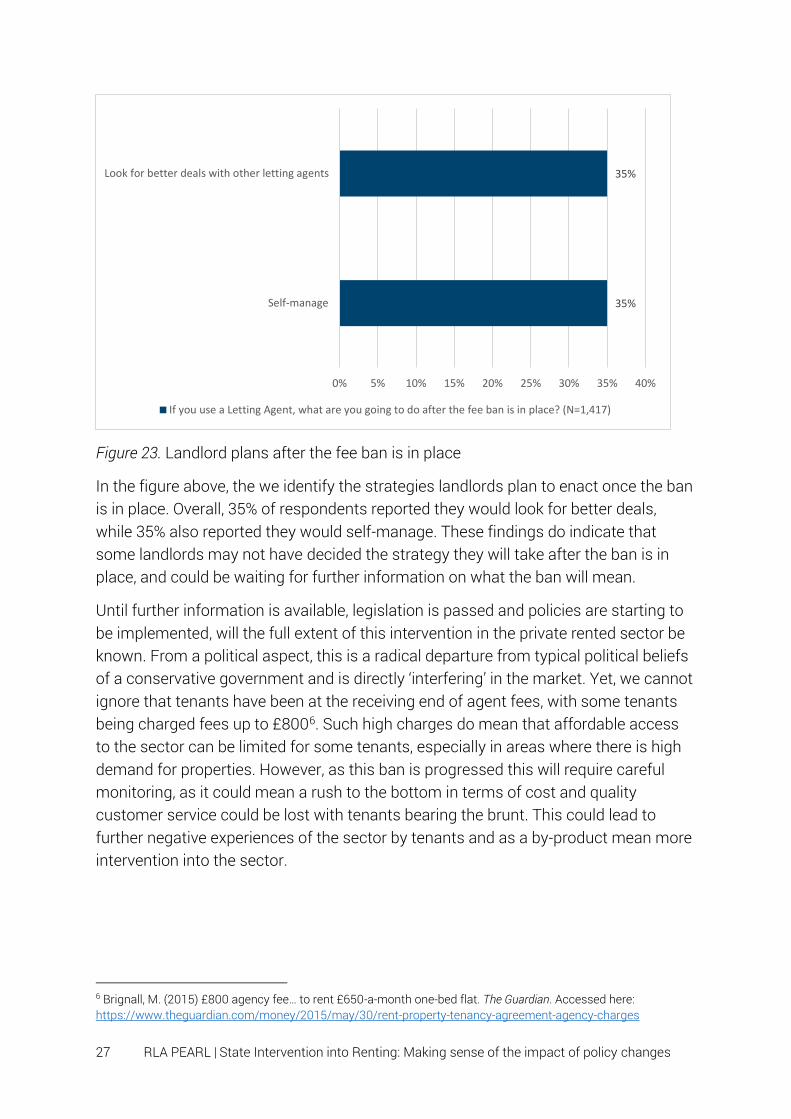
Figure 23. Landlord plans after the fee ban is in place
In the figure above, the we identify the strategies landlords plan to enact once the ban is in place. Overall, 35% of respondents reported they would look for better deals, while 35% also reported they would self-manage. These findings do indicate that some landlords may not have decided the strategy they will take after the ban is in place, and could be waiting for further information on what the ban will mean.
Until further information is available, legislation is passed and policies are starting to be implemented, will the full extent of this intervention in the private rented sector be known. From a political aspect, this is a radical departure from typical political beliefs of a conservative government and is directly ‘interfering’ in the market. Yet, we cannot ignore that tenants have been at the receiving end of agent fees, with some tenants being charged fees up to £8006. Such high charges do mean that affordable access to the sector can be limited for some tenants, especially in areas where there is high demand for properties. However, as this ban is progressed this will require careful monitoring, as it could mean a rush to the bottom in terms of cost and quality customer service could be lost with tenants bearing the brunt. This could lead to further negative experiences of the sector by tenants and as a by-product mean more intervention into the sector.
6 Brignall, M. (2015) £800 agency fee… to rent £650-a-month one-bed flat. The Guardian. Accessed here: https://www.theguardian.com/money/2015/may/30/rent-property-tenancy-agreement-agency-charges
35%
35%
0% 5% 10% 15% 20% 25% 30% 35% 40%
Self-manage
Look for better deals with other letting agents
If you use a Letting Agent, what are you going to do after the fee ban is in place? (N=1,417)
28 RLA PEARL | State Intervention into Renting: Making sense of the impact of policy changes
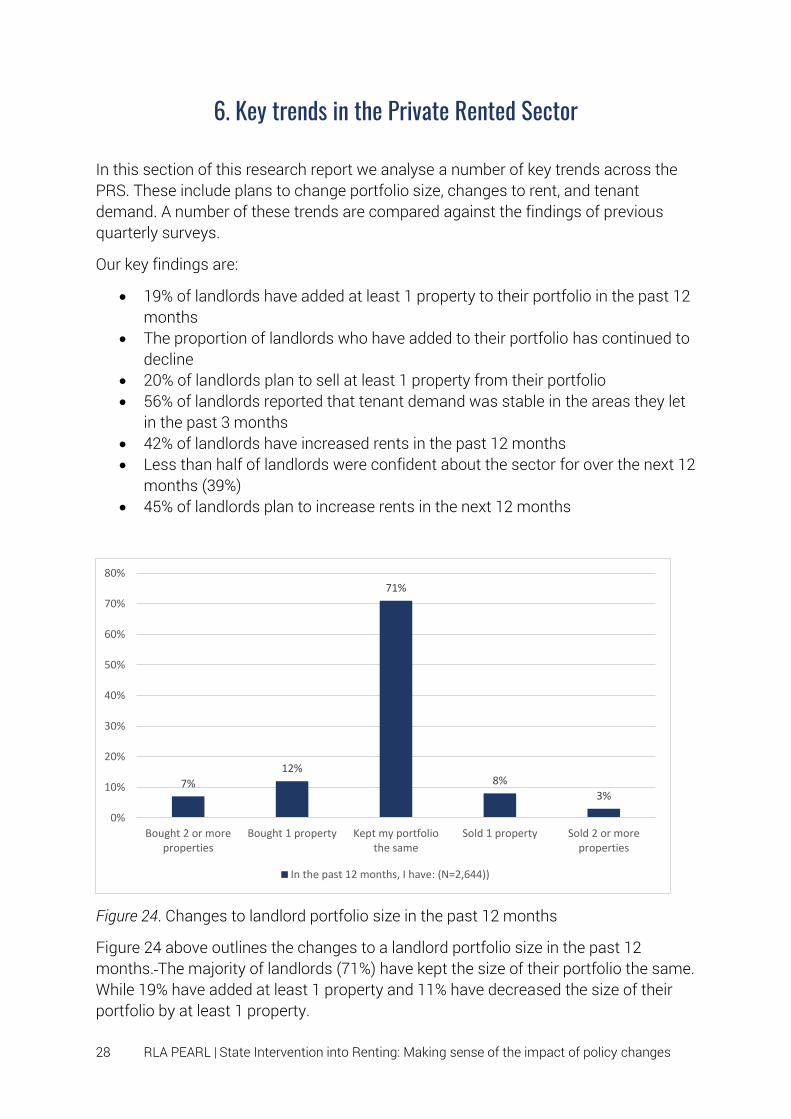
6. Key trends in the Private Rented Sector
In this section of this research report we analyse a number of key trends across the PRS. These include plans to change portfolio size, changes to rent, and tenant demand. A number of these trends are compared against the findings of previous quarterly surveys.
Our key findings are:
• 19% of landlords have added at least 1 property to their portfolio in the past 12 months
• The proportion of landlords who have added to their portfolio has continued to decline
• 20% of landlords plan to sell at least 1 property from their portfolio • 56% of landlords reported that tenant demand was stable in the areas they let
in the past 3 months • 42% of landlords have increased rents in the past 12 months • Less than half of landlords were confident about the sector for over the next 12
months (39%) • 45% of landlords plan to increase rents in the next 12 months
Figure 24. Changes to landlord portfolio size in the past 12 months
Figure 24 above outlines the changes to a landlord portfolio size in the past 12 months. The majority of landlords (71%) have kept the size of their portfolio the same. While 19% have added at least 1 property and 11% have decreased the size of their portfolio by at least 1 property.
7%
12%
71%
8%
3%
0%
10%
20%
30%
40%
50%
60%
70%
80%
Bought 2 or moreproperties
Bought 1 property Kept my portfoliothe same
Sold 1 property Sold 2 or moreproperties
In the past 12 months, I have: (N=2,644))

29 RLA PEARL | State Intervention into Renting: Making sense of the impact of policy changes
Figure 25. Changes to landlord portfolios by quarterly survey
This is the third quarterly survey report where we are able to compare key trend data on investment plans, and in comparison to the data for Q3 20167, the proportion of landlords who have added to their portfolios is down by 8%. While those who plan on keeping their portfolio the same has increased by 7%. While in comparison to the previous Q1 2017 data8, the proportion of landlords that have sold properties has remained stable while the proportion that have purchased additional properties has dropped by 1%.
7 Simcock, T.J. (2016). Landlord Investment, Finance and Tax Report 2016. Manchester, UK: Residential Landlords Association. Available here: https://research.rla.org.uk/wp-content/uploads/Finance-and-Tax-Review-of-the-PRS-Report.pdf 8 Simcock, T.J. (2017). Welfare Reform and Universal Credit: The Impact of Welfare Reform on the Private Rented Sector. Manchester, UK: Residential Landlords Association. Available here: https://research.rla.org.uk/wp-content/uploads/Welfare-Reform-and-Universal-Credit-The-impact-on-the-private-rented-sector-2017.pdf
27%
20% 19%
64%69%
71%
9%11% 11%
0%
10%
20%
30%
40%
50%
60%
70%
80%
Q3 2016 (N=2,695) Q1 2017 (N=2,749) Q2 2017 (N=2,644)
Bought at least 1 property Kept portfolio the same Sold at least one property

30 RLA PEARL | State Intervention into Renting: Making sense of the impact of policy changes
Figure 26. Landlord portfolio investment plans for the next 12 months
Over the next 12 months, 20% of landlords plan to sell at least 1 property, and 19% plan to buy at least 1 property. While 61% of landlords’ plan to keep their portfolio the same. In contrast to the data in figure 24, this is 10 percentage points lower than the proportion that reported they had kept their portfolio the same. This indicates that there could be significant changes to property portfolio sizes over the next 12 months.
6%
13%
61%
14%
6%
0%
10%
20%
30%
40%
50%
60%
70%
Buy 2 or moreproperties
Buy 1 more property Keep my portfoliothe same
Sell 1 property Sell 2 or moreproperties
In the next 12 months, I plan to: (N=2,641)

31 RLA PEARL | State Intervention into Renting: Making sense of the impact of policy changes
Figure 27. Quarterly changes in landlord portfolio plans
Over the past 9 months, the proportion of landlords who plan to keep their portfolio the same has remained stable at 61%. However, while in Q3 slightly more landlords were planning to buy properties than landlords selling properties, this has now changed, with more landlords planning to sell at least 1 property. This has fluctuated between Q1 and Q2, with a decrease in the number of landlords planning on selling property by 2 percentage points.
There are a number of potential reasons for this change, firstly, there is the possibility of slight sampling differences that influence the findings. However, as the proportion of landlords that plan to keep their portfolio the same has remained constant, we can be confident that this only has had a minor effect on this. It could be that economic and political changes in the intervening period have impacted on the landlords’ investment or disinvestment plans for their portfolio. Furthermore, some landlords may have already sold some of their properties, or may have put some plans on hold until there is less economic and political uncertainty due to Brexit and policy changes affecting the sector.
19%
22%20%
61% 61% 61%
20%
18% 19%
0%
10%
20%
30%
40%
50%
60%
70%
Q3 2016 (N=2,883) Q1 2017 (N=2,750) Q2 2017 (N=2,641)
Plan to sell at least 1 property Plan to keep their portfolio the same
Plan to buy at least one property

32 RLA PEARL | State Intervention into Renting: Making sense of the impact of policy changes
Figure 28. Changes in tenant demand Q1 vs Q2 2017
The majority of landlords reported that tenant demand was stable in their area for the past 3 months, and was up 1 percentage point in comparison to the previous quarter. In contrast the number of landlords that reported tenant demand had increased was down 5 percentage points.
Figure 29. Changes to rent levels in the past 12 months
2%
10%
55%
20%
13%
3%
12%
56%
19%
9%
0%
10%
20%
30%
40%
50%
60%
Decreasedsignificantly
Decreased slightly Stable Increased slightly Increased significantly
How would you describe demand from tenants for properties in the areas you let in the past 3 months?
Q1 2017 (N=2,670) Q2 2017 (N=2,530)
20%22%
54%
2% 2%
0%
10%
20%
30%
40%
50%
60%
Increased rents bymore than 2%
Increased rents bybetween 0% and 2%
Kept the rents thesame
Decreased rents bybetween 0% and 2%
Decreased rents bymore than 2%
In the past 12 months, I have: (N=2,671)

33 RLA PEARL | State Intervention into Renting: Making sense of the impact of policy changes
In the past 12 months, 54% of landlords reported they had kept the rent the same, and 42% had increased rents. In comparison to the previous quarter, the proportion that had reported they had increased their rents was down by 1%. When asked for the reasons behind this change, the most common reason was for keeping the rent in line with market rents (24%), and 17% reported this was due to the changes in Mortgage Interest Relief. The full findings are displayed in figure 30 below.
Figure 30. Reasons for changing the rent in the past 12 months
Landlords were also asked about their confidence in the private rented sector for the next 12 months. Overall, more landlords were confident about the sector (39%) in comparison to those who were not confident (26%). Overall, confidence in the sector was up 1 percentage point in comparison to the previous quarter, while lack of confidence in the sector was down by 2%. The full findings can be found in figure 31 below.
24%
5%
2%
11%
2%
13%
11%
17%
3%
0% 5% 10% 15% 20% 25% 30%
To keep the rent in line with market rents
To keep my rents competitive
I was advised to do so
So I can meet increasing costs
So I can make improvements to the property
Because it is a new tenancy
Because it has been a while since I increased rents
Because of the changes to Mortgage Interest Relief
To help my tenants
In the past 12 months, what is your main reason for doing this? (N=1,562)

34 RLA PEARL | State Intervention into Renting: Making sense of the impact of policy changes
Figure 31. Quarterly comparison of landlord confidence in the private rented sector for the next 12 months
Figure 32. Landlord plans for the rent over the next 12 months.
The final part of this section of the report examines landlord plans for the rents they charge over the next 12 months. The majority of respondents (55%) to this survey indicated that they plan to keep the rent the same over the next 12 months. This has continued its upwards trajectory over the past 9 months, with the proportion of landlords being higher by 12 percentage points in comparison to Q3 2016. In contrast the proportion of landlords that plan to increase the rent over the next 12 months has
8%
20%
34%
27%
11%
7%
19%
36%
29%
10%
0%
5%
10%
15%
20%
25%
30%
35%
40%
Not all all confident Not very confident Neutral Somewhat confident Very confident
Q1 2017 (N=2,771) Q2 2017 (N=2,693)
56%
47% 45%
43%
53%55%
1% 1% 1%
0%
10%
20%
30%
40%
50%
60%
Q3 2016 (N= 2,483) Q1 2017 (N= 2,736) Q2 2017 (N= 2,514)
Increase the rent Keep the rent the same Decrease the rent

35 RLA PEARL | State Intervention into Renting: Making sense of the impact of policy changes
decreased to 45%, down 9 percentage points over the 9 months. The full findings and comparison can be seen in figure 32 above.
There are a number of potential explanations to this finding, 42% of landlords have already reported that they have increased rents and therefore, may not need to increase rents again in the next 12 months. This reason is particularly likely when taken into account with figure 34, which indicates that landlords are increasingly keeping the rent the same in order to keep the tenant in the property for the long-term. This finding demonstrates that landlords are looking for stability with their tenant, rather than excessive rents. An additional explanation could be the political and economic uncertainty due to Brexit. A number of landlords may have decided that due to this uncertainty it would be better to keep a good tenant who pay’s their rent on time, rather than risking an attempt to increase rents.
Figure 33. Primary reasons for increasing rents in the next 12 months
Landlords were then asked why they were planning on changing the rent, and were presented with different answers dependent to the answer provided in figure 32. Figure 33 above identifies the primary reasons for why a landlord would increase the rents. The most common reason was the changes to Mortgage Interest Relief (32% of landlords), followed by the need to keep the rent in line with market rents (24% of landlords, and then so the landlord can meet increasing costs (17% of landlords).
24%
2%
1%
17%
2%
3%
15%
32%
0% 5% 10% 15% 20% 25% 30% 35%
To keep the rent in line with market rent
To keep my rents competitive
I was advised to do so
So I can meet increasing costs
So I can make improvements to the property
Because it is a new tenancy
Because it has been a while since I increased rents
Because of the changes to Mortgage Interest Relief
If you plan to increase rents in the next 12 months, what is your main reason for doing this? (N=1,096)
36 RLA PEARL | State Intervention into Renting: Making sense of the impact of policy changes
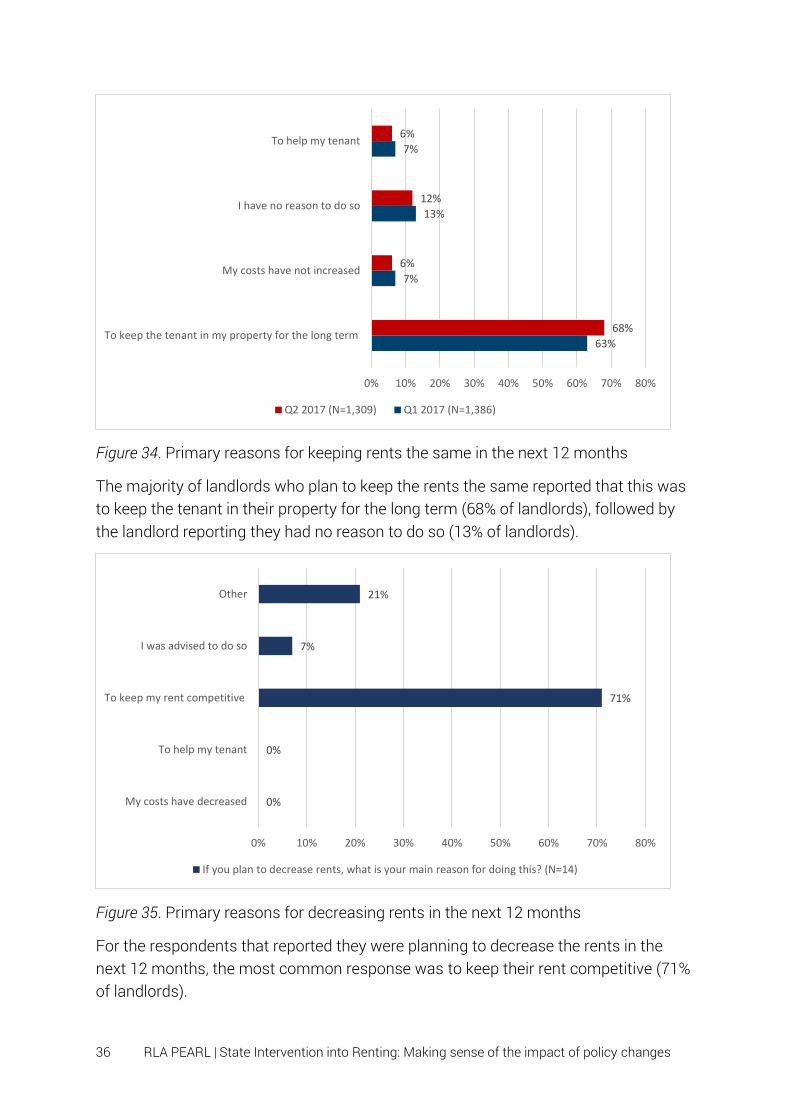
Figure 34. Primary reasons for keeping rents the same in the next 12 months
The majority of landlords who plan to keep the rents the same reported that this was to keep the tenant in their property for the long term (68% of landlords), followed by the landlord reporting they had no reason to do so (13% of landlords).
Figure 35. Primary reasons for decreasing rents in the next 12 months
For the respondents that reported they were planning to decrease the rents in the next 12 months, the most common response was to keep their rent competitive (71% of landlords).
63%
7%
13%
7%
68%
6%
12%
6%
0% 10% 20% 30% 40% 50% 60% 70% 80%
To keep the tenant in my property for the long term
My costs have not increased
I have no reason to do so
To help my tenant
Q2 2017 (N=1,309) Q1 2017 (N=1,386)
0%
0%
71%
7%
21%
0% 10% 20% 30% 40% 50% 60% 70% 80%
My costs have decreased
To help my tenant
To keep my rent competitive
I was advised to do so
Other
If you plan to decrease rents, what is your main reason for doing this? (N=14)

37 RLA PEARL | State Intervention into Renting: Making sense of the impact of policy changes
Overall, the data from this quarterly survey indicates that landlords are looking for stability and certainty from across their portfolios, especially at a time when there is greater political, regulative and economic uncertainty. The proportion of landlords that have kept their portfolio the same over the past 12 months has increased, while the proportion of landlords planning to sell has decreased slightly. In addition, the proportion of landlords who are planning to keep the rent the same has increased. These findings suggest that the private rented sector is set to remain relatively flat over the short-to-medium term, with limited PRS household growth and limited rental price growth. This limited price growth is already being felt, with the Index for Private Housing Rental Prices9 showing a slow-down across England, with prices down 0.9 percentage points between September 2016 (2.5% growth) and September 2017 (1.6% growth).
9 Office for National Statistics (2017). Index of Private Housing Rental Prices, Great Britain: September 2017. Available here: https://www.ons.gov.uk/economy/inflationandpriceindices/bulletins/indexofprivatehousingrentalprices/september2017

38 RLA PEARL | State Intervention into Renting: Making sense of the impact of policy changes
7. Who are Landlords?
In this section of this research report we analyse the types of landlords present in the private rented sector. We examine the demographics of landlords, such as age, gender, but also, how the landlord first entered the PRS, how long they have been a landlord, and the size of portfolios across the sector.
Our key findings are:
• Most landlords are between the ages of 55 to 64 (39%), followed by 45 to 54 (24%) and 65 to 74 (24%)
• Most landlords owned their home outright (50%), while 45% of landlords had a mortgage on their own home
• The most common employment status of landlords was retired (31%) followed by working full-time (24%) and self-employed (17%)
• Only 16% of landlords classified themselves as full-time landlords • The most common reason for becoming a landlord was their own choice
through borrowing money, such as buy-to-let (31% of landlords) • A large proportion of landlords described themselves as specialising in letting
to families (44% of landlords) • Most landlords had been providing homes for over 10 years (62%)
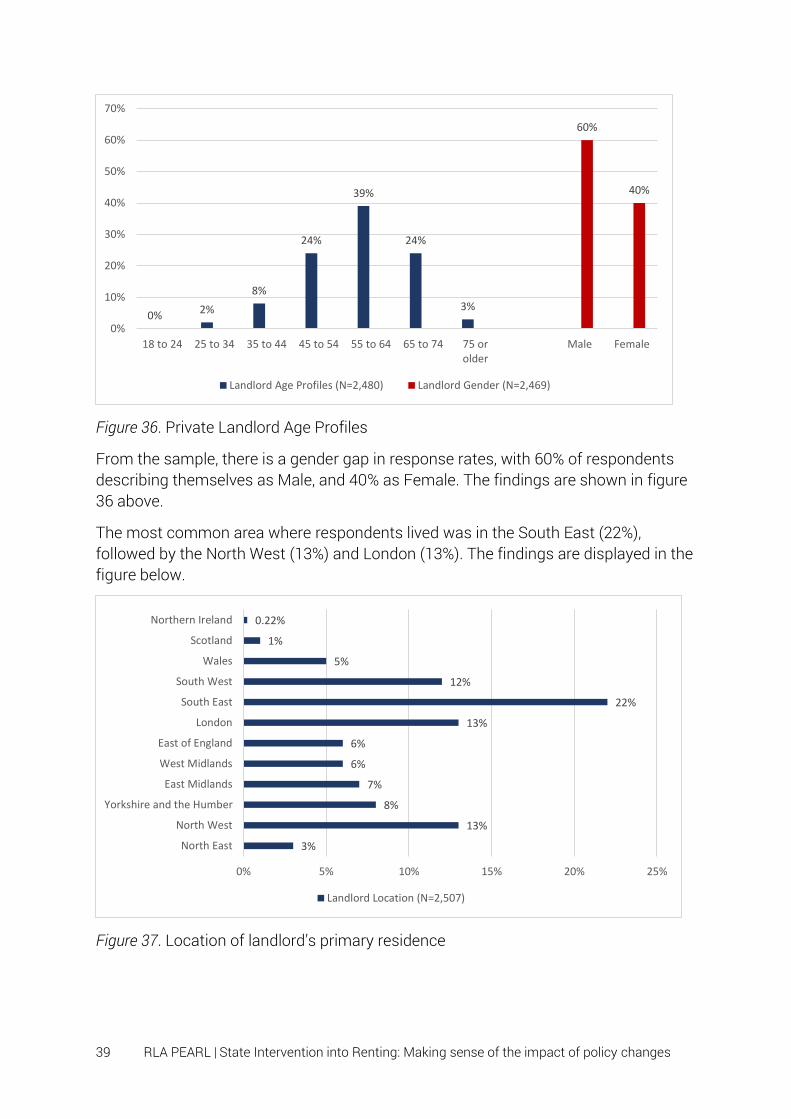
The following figure shows the age profile of the landlords who responded to the survey. The largest age group are landlords between the ages of 55 to 64 (39% of the sample), while the smallest age group are landlords aged between 25 to 34 (2% of the sample).
39 RLA PEARL | State Intervention into Renting: Making sense of the impact of policy changes
Figure 36. Private Landlord Age Profiles
From the sample, there is a gender gap in response rates, with 60% of respondents describing themselves as Male, and 40% as Female. The findings are shown in figure 36 above.
The most common area where respondents lived was in the South East (22%), followed by the North West (13%) and London (13%). The findings are displayed in the figure below.
Figure 37. Location of landlord’s primary residence
0% 2%
8%
24%
39%
24%
3%
60%
40%
0%
10%
20%
30%
40%
50%
60%
70%
18 to 24 25 to 34 35 to 44 45 to 54 55 to 64 65 to 74 75 orolder
Male Female
Landlord Age Profiles (N=2,480) Landlord Gender (N=2,469)
3%
13%
8%
7%
6%
6%
13%
22%
12%
5%
1%
0.22%
0% 5% 10% 15% 20% 25%
North East
North West
Yorkshire and the Humber
East Midlands
West Midlands
East of England
London
South East
South West
Wales
Scotland
Northern Ireland
Landlord Location (N=2,507)
40 RLA PEARL | State Intervention into Renting: Making sense of the impact of policy changes
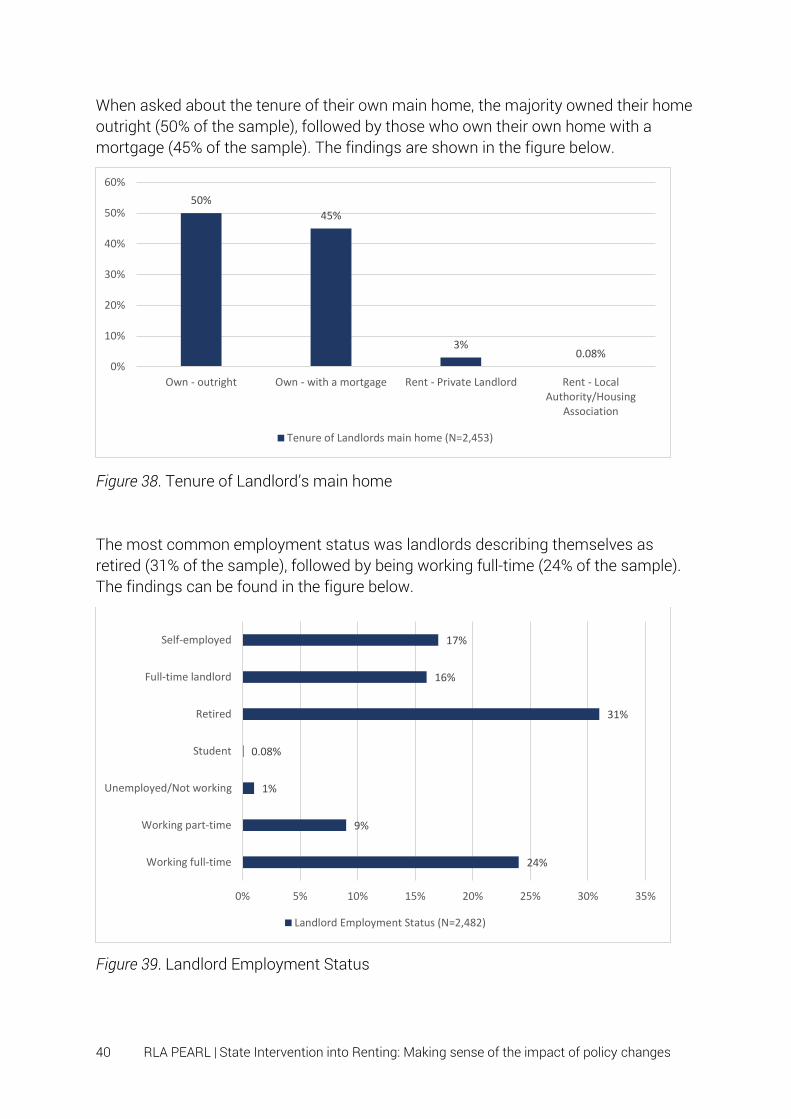
When asked about the tenure of their own main home, the majority owned their home outright (50% of the sample), followed by those who own their own home with a mortgage (45% of the sample). The findings are shown in the figure below.
Figure 38. Tenure of Landlord’s main home
The most common employment status was landlords describing themselves as retired (31% of the sample), followed by being working full-time (24% of the sample). The findings can be found in the figure below.
Figure 39. Landlord Employment Status
50%
45%
3%0.08%
0%
10%
20%
30%
40%
50%
60%
Own - outright Own - with a mortgage Rent - Private Landlord Rent - LocalAuthority/Housing
Association
Tenure of Landlords main home (N=2,453)
24%
9%
1%
0.08%
31%
16%
17%
0% 5% 10% 15% 20% 25% 30% 35%
Working full-time
Working part-time
Unemployed/Not working
Student
Retired
Full-time landlord
Self-employed
Landlord Employment Status (N=2,482)
41 RLA PEARL | State Intervention into Renting: Making sense of the impact of policy changes
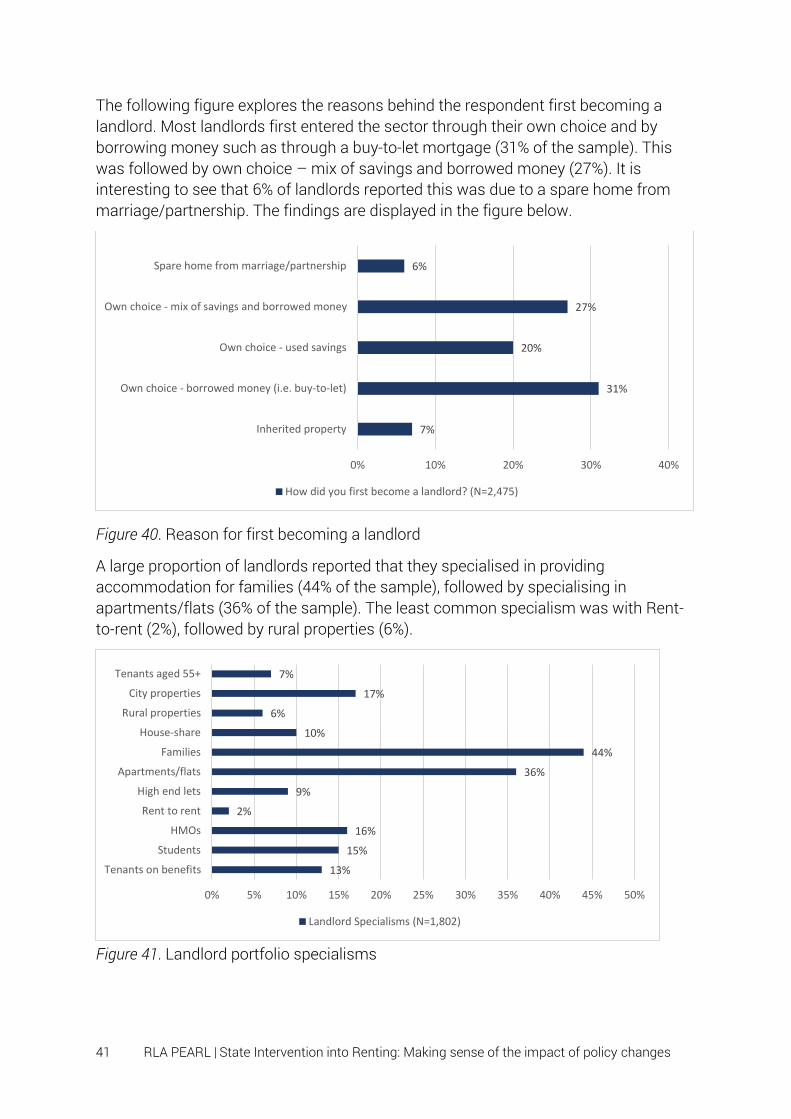
The following figure explores the reasons behind the respondent first becoming a landlord. Most landlords first entered the sector through their own choice and by borrowing money such as through a buy-to-let mortgage (31% of the sample). This was followed by own choice – mix of savings and borrowed money (27%). It is interesting to see that 6% of landlords reported this was due to a spare home from marriage/partnership. The findings are displayed in the figure below.
Figure 40. Reason for first becoming a landlord
A large proportion of landlords reported that they specialised in providing accommodation for families (44% of the sample), followed by specialising in apartments/flats (36% of the sample). The least common specialism was with Rent-to-rent (2%), followed by rural properties (6%).
Figure 41. Landlord portfolio specialisms
7%
31%
20%
27%
6%
0% 10% 20% 30% 40%
Inherited property
Own choice - borrowed money (i.e. buy-to-let)
Own choice - used savings
Own choice - mix of savings and borrowed money
Spare home from marriage/partnership
How did you first become a landlord? (N=2,475)
13%
15%
16%
2%
9%
36%
44%
10%
6%
17%
7%
0% 5% 10% 15% 20% 25% 30% 35% 40% 45% 50%
Tenants on benefits
Students
HMOs
Rent to rent
High end lets
Apartments/flats
Families
House-share
Rural properties
City properties
Tenants aged 55+
Landlord Specialisms (N=1,802)
42 RLA PEARL | State Intervention into Renting: Making sense of the impact of policy changes
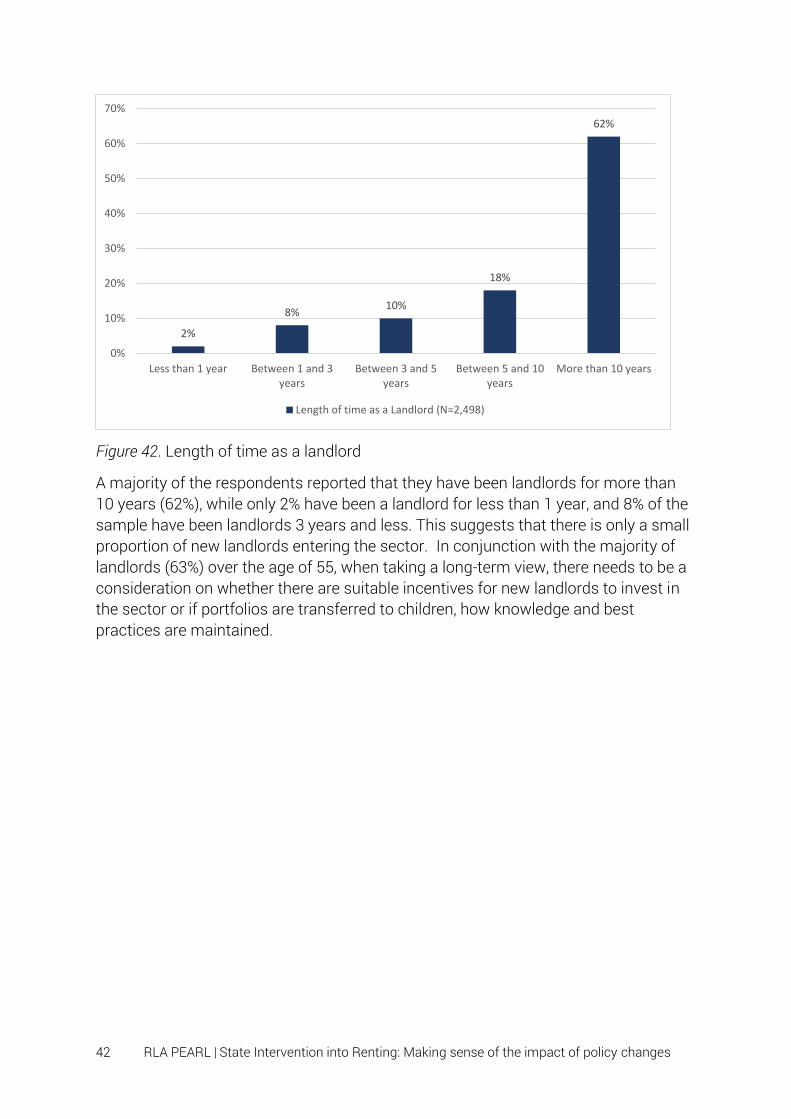
Figure 42. Length of time as a landlord
A majority of the respondents reported that they have been landlords for more than 10 years (62%), while only 2% have been a landlord for less than 1 year, and 8% of the sample have been landlords 3 years and less. This suggests that there is only a small proportion of new landlords entering the sector. In conjunction with the majority of landlords (63%) over the age of 55, when taking a long-term view, there needs to be a consideration on whether there are suitable incentives for new landlords to invest in the sector or if portfolios are transferred to children, how knowledge and best practices are maintained.
2%
8%10%
18%
62%
0%
10%
20%
30%
40%
50%
60%
70%
Less than 1 year Between 1 and 3years
Between 3 and 5years
Between 5 and 10years
More than 10 years
Length of time as a Landlord (N=2,498)
43 RLA PEARL | State Intervention into Renting: Making sense of the impact of policy changes
8. Who are Tenants?
In this section of this research report we analyse the types of tenant landlords are renting their properties out to. We focus on the demographics of tenants, including age, employment status, and also the relationship between the landlord and tenant and any tenant issues landlords have.
Our key findings are:
• The majority of landlords reported letting to tenants aged between 25 and 34 (67%), followed by 35 to 44 (57%). While 21% of landlords reported letting to tenants over the age of 65
• A majority of landlords reported letting to tenants who were in full time employment (87%), while 1-in-4 landlords also reported to letting to tenants on benefits
• 68% of landlords let to tenants with at least one child • Over one quarter of landlords (30%) have experienced tenants going into 2 or
more months of rent arrears in the past 12 months • Just over 1 in 4 landlords (29%) have needed to start the eviction process • Out of those attempting to remove a tenant, 60% of landlords reported that this
was because of rent arrears • On average, per property, landlords are currently owed £1534.95 in rent arrears
When asking for the demographics of tenants, we have made a significant change in this quarterly survey in comparison to previous surveys. In previous surveys we asked the landlord, what the majority of their tenants were like, this was to provide an overall average of tenants across their properties. However, after reviewing comments from respondents and the previous analysis, we decided that it would be more suited to allow a select-all-that-apply procedure to the majority of these questions. This would hopefully encourage greater responses and we anticipate this will provide a more in-depth and dynamic image of the wider tenant groups landlords let to.
From figure 43 below, we can identify the most common tenant age profile for the sample as aged between 25 and 34 (67% of landlords). The second largest tenant age profile was 35 to 44-year olds, with 57% of landlords reporting they let to this group of tenants. In the previous quarterly survey, we found that 2.9% of reported the age of their tenants to be above 65, however, in this survey we have now identified 21% of landlords let to this age group.

44 RLA PEARL | State Intervention into Renting: Making sense of the impact of policy changes
Figure 43. Age profiles of tenants
The most common tenant employment status was employed full-time (87% of landlords), followed by employed part-time (31%) and then not working claiming benefits (25%). The figure below shows the proportion of landlords who let to different tenant groups split by employment status.
Figure 44. Employment status of tenants
Landlords were asked if they let to tenants with at least one child, the majority of landlords responded that they did (68% Yes, 32% No, N=2,751). In the following question, the respondents were asked if they had experienced any issues with their
27%
67%
57%
40%
26%
15%
6%
0%
10%
20%
30%
40%
50%
60%
70%
80%
18 to 24 25 to 34 35 to 44 45 to 54 55 to 64 65 to 74 75 or older
Age of tenants (N=2,774)
87%
31%
16%19%
8%
25%
0%
10%
20%
30%
40%
50%
60%
70%
80%
90%
100%
Employed - Full-time
Employed - Part-time
Student Retired Not working Not working -claiming benefits
Employment status of tenants (N=2,776)
45 RLA PEARL | State Intervention into Renting: Making sense of the impact of policy changes
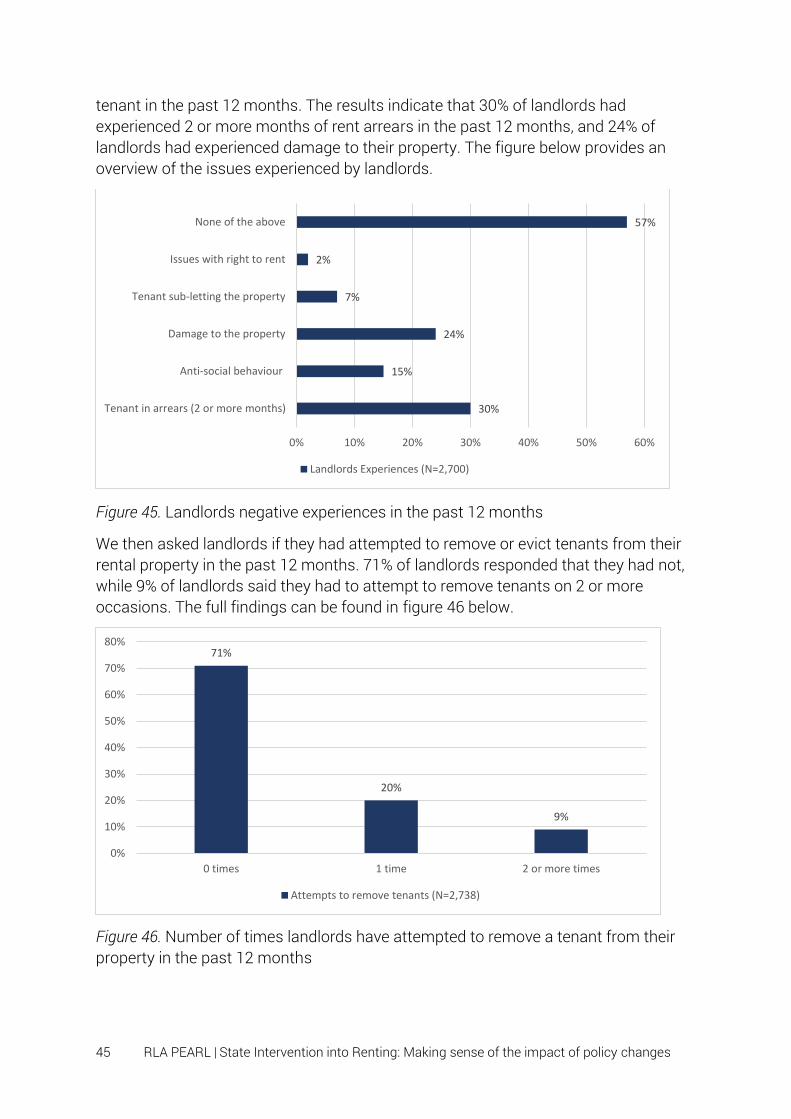
tenant in the past 12 months. The results indicate that 30% of landlords had experienced 2 or more months of rent arrears in the past 12 months, and 24% of landlords had experienced damage to their property. The figure below provides an overview of the issues experienced by landlords.
Figure 45. Landlords negative experiences in the past 12 months
We then asked landlords if they had attempted to remove or evict tenants from their rental property in the past 12 months. 71% of landlords responded that they had not, while 9% of landlords said they had to attempt to remove tenants on 2 or more occasions. The full findings can be found in figure 46 below.
Figure 46. Number of times landlords have attempted to remove a tenant from their property in the past 12 months
30%
15%
24%
7%
2%
57%
0% 10% 20% 30% 40% 50% 60%
Tenant in arrears (2 or more months)
Anti-social behaviour
Damage to the property
Tenant sub-letting the property
Issues with right to rent
None of the above
Landlords Experiences (N=2,700)
71%
20%
9%
0%
10%
20%
30%
40%
50%
60%
70%
80%
0 times 1 time 2 or more times
Attempts to remove tenants (N=2,738)

46 RLA PEARL | State Intervention into Renting: Making sense of the impact of policy changes
We then explored the different routes landlords were taking to start the process of reclaiming their property back from the tenant. In the past 12 months, 46% of landlords reported starting this process by serving the Section 21 (no fault eviction), while 24% reported they served a written notice in the first instance. The complete findings are shown in the figure below.
Figure 47. How landlords initiated the removal process
A further question asked landlords for the primary reason for attempting to remove the tenant from the property. The majority of landlords (60%) reported the primary reason as rent arrears, followed by anti-social behaviour by the tenants (11%). The proportion of landlords reporting rent arrears as the main reason has remained flat in comparison with the previous quarter, while anti-social behaviour has decreased by one percentage point. The full findings for each reason can be found in figure 48 below.
24%
46%
8%
22%
0%
5%
10%
15%
20%
25%
30%
35%
40%
45%
50%
Provided the tenants witha written warning
Section 21 Section 8 Other
How did you start the removal process? (N=1045)

47 RLA PEARL | State Intervention into Renting: Making sense of the impact of policy changes
Figure 48. Reasons for attempting to remove a tenant in the past 12 months.
This research has identified that rent arrears is a significant issue for the private rented sector, and especially for landlords with finance attached to properties. The non-payment of rent could put the landlord in a vicarious situation in meeting the finance costs, including mortgages or loans, and risk losing the property. The findings above highlight that 30% of landlords have experienced rent arrears in the past 12 months, and 60% of evictions were due to rent arrears. This finding does challenge the notion that landlords evict their tenant for no-reason10 and that Section 21 notices are the biggest cause of homelessness. This data suggests a different story altogether, it is rather rent arrears by the tenant that is the biggest cause of homelessness. We have identified in our previous research that the roll-out of Universal Credit has been a major factor in causing tenants to enter into rent arrears11. This is also making landlords unwilling to let to tenants on HB/UC over fears of financial risk and the lack of direct payment to the landlord12.
We asked landlords on average, per property, how much they are currently owed by tenants in rent arrears. On average landlords reported being owed £1534.95 (median = £1000, SD = 2299.375), this is an increase of £15.70 in comparison to the previous
10 Craw. D. W., (2017). Landlords are turfing people out of their homes without reason – and its completely legal. The Guardian. Retrieved from: https://www.theguardian.com/housing-network/2017/jul/25/no-fault-evictions-landlords-tenants 11 Simcock. T.J. (2017). Welfare Reform and Universal Credit: The Impact of Welfare Reform on the Private Rented Sector. Manchester, UK: Residential Landlords Association. Available here: https://research.rla.org.uk/wp-content/uploads/Welfare-Reform-and-Universal-Credit-The-impact-on-the-private-rented-sector-2017.pdf 12 Pattison, B. & Reeve, K., (2017). Access to homes for the under-35s: The impact of Welfare Reform on Private Renting. Sheffield Hallam University. Available here: https://research.rla.org.uk/report/access-homes-under-35s-impact-welfare-reform-renting/
2%
11%
4%
60%
8%
0.40%
4%
10%
0% 10% 20% 30% 40% 50% 60% 70%
I want to increase rents and the tenants refused topay a higher rate
Anti-social behaviour by the tenants
Illegal behaviour by the tenants
Rent arrears
Damage to the property
The tenants asked me to make repairs
I want to maked substantial renovations to theproperty
I am selling the property
Primary reason for removing a tenant (N=775)

48 RLA PEARL | State Intervention into Renting: Making sense of the impact of policy changes
quarter. If we extrapolate this against wider landlord figures this identifies a significant issue in the sector. When we extrapolate this to the wider landlord population (approximately 1.9 million landlords according to HMRC data13), this could represent approximately £874 million that is owed to landlords by tenants in rent arrears. In comparison to the previous quarter, while the total amount owed in rent arrears has increased, the proportion of landlords reporting rent arrears has decreased, and this equates to a decrease of £19.9 million owed in rent arrears to landlords across the whole sector.
Figure 49. Landlord relationships with their tenants
The penultimate questions in this section explore the relationship between the landlord and the tenant. Overall a majority of landlords reported that they had a good relationship with their tenants (84% of the sample), while 81% of landlords reported that their tenants pay the rent on time. In comparison to the previous quarter, the proportion of landlords reporting a good relationship is now up two percentage points, while the proportion reporting their tenants pay their rent on time has also increased by one percentage point.
13 Walmsley. S (2017). Challenging the myth: Two thirds of landlords pay basic rate tax. Residential Landlords Association. Retrieved from: https://news.rla.org.uk/two-thirds-landlords-pay-basic-rate-income-tax/
4%1%
9%
45%
41%
5% 4%
9%
42%40%
0%
5%
10%
15%
20%
25%
30%
35%
40%
45%
50%
Strongly disagree Disagree Neither agree nordisagree
Agree Strongly agree
I have a good relationship with my tenants (N=2,763) My tenants pay their rent on time (N=2,678)

49 RLA PEARL | State Intervention into Renting: Making sense of the impact of policy changes
Figure 50. Proportion of landlords checking prospective tenant’s social media
The final question of this section explores whether landlords are turning to social media when checking their tenant’s social media. Overall, 1-in-4 landlords reported looking at the prospective tenant’s social media profiles before letting to them.
25%
75%
In the last 3 years, for any new tenancis, did you check the social media profiles of your tenants before letting to them? (N=2,700)
Yes No
50 RLA PEARL | State Intervention into Renting: Making sense of the impact of policy changes
9. Landlord Property Portfolios
In this penultimate section of the report, we examine and investigate the types of households’ landlords typically let to, typical property locations, and whether property is typically furnished or unfurnished.
Our key findings are:
• While portfolio size across landlords is widely spread from 1 property to more than 21 properties, the majority of landlords have 2-3 properties (27%) followed by 6-10 properties (20%).
• The most popular property/household type for landlords is a 2-bedroom property to 1 family (62% of landlords).
• The South East is the most popular geographical region for landlords, with 24% letting property in this region.
• The majority of landlords (70%) let out on average unfurnished properties. • The median average rent collected by landlords was £700. • The average tenancy length was calculated as 3 years.
Landlords were asked for the average rent they charge across their property portfolios. The median average rent charged by landlords was £700 (M = £984.91, SD = 1048.19, N = 2267). This has increased by 3.7% since the previous quarterly survey, where the median rent was £675, in comparison there was a 3.2% increase between the mean average rents from the previous quarter to this survey. The next question asked landlords for the average tenancy length across their portfolios, from the analysis of their responses we can identify the average length of current tenancy as 3 years.
In the following figure, we explore the different portfolio sizes of landlords. The majority of landlords (27%) have 2 to 3 properties in their portfolio, and this was then followed by those with 6-10 properties at 20% of landlords. 10% of landlords identified as having more than 21 properties in their portfolio. The findings are displayed in figure 51 below.

51 RLA PEARL | State Intervention into Renting: Making sense of the impact of policy changes
Figure 51. Landlord Property Portfolio Size
In the figure below, we investigate the types of properties landlords are currently letting out. This question was changed from prior quarterly surveys to enable landlords to tick all that apply. Overall, the most common property types were 2-bedroom properties (62% of landlords) followed by 3-bedroom properties (50% of landlords).
Figure 52. Types of properties across a Landlords portfolio (N=2,499)
The most common geographical regions to let out property was the South East (24% of landlords), followed by London (19%) and then the North West (18%). The least
16%
27%
17%
20%
10% 10%
0%
5%
10%
15%
20%
25%
30%
1 property 2-3 properties 4-5 properties 6-10 properties 11-20 properties 21+ properties
Landlord Property Portfolio Size (N=2,485)
10%
36%
62%
13%
50%
12%
14%
11%
15%
0% 10% 20% 30% 40% 50% 60% 70%
Studio
1 Bedroom Property
2 Bedroom Property - 1 Family
2 Bedroom Property - Shared
3 Bedroom Property - 1 Family
3 Bedroom Property - Shared
4+ Bedroom Property - 1 Family
4+ Bedroom Property - Shared
HMO
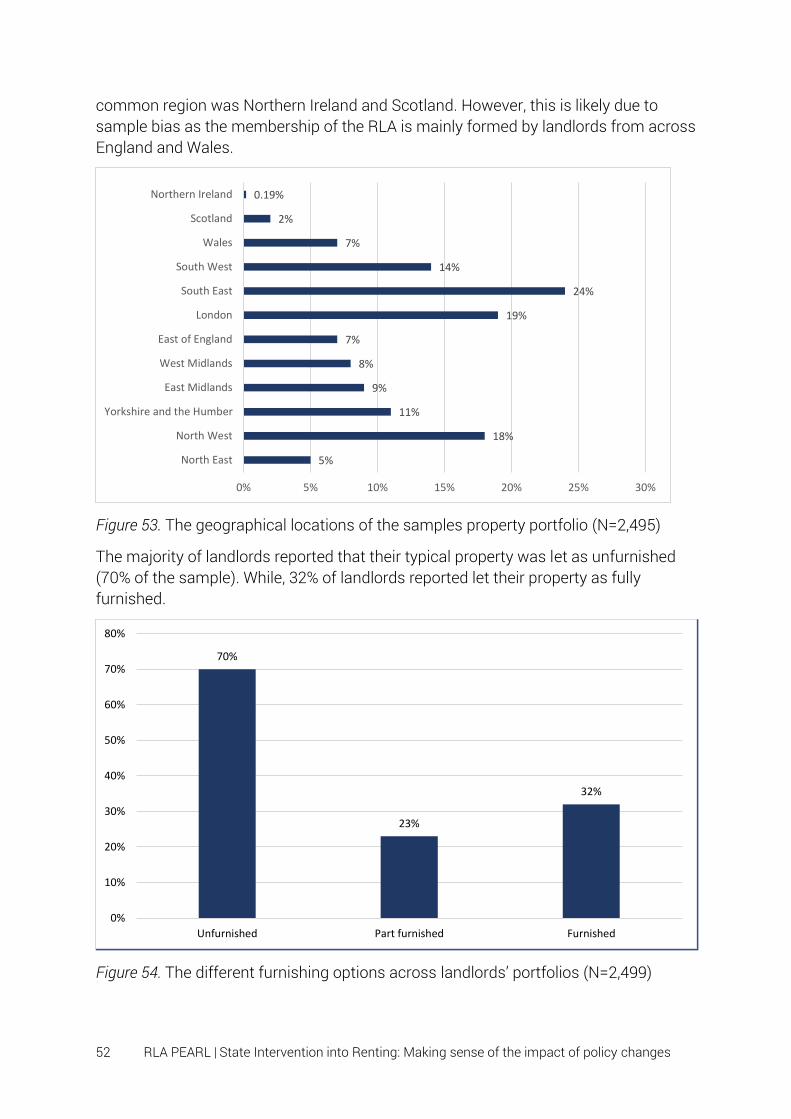
52 RLA PEARL | State Intervention into Renting: Making sense of the impact of policy changes
common region was Northern Ireland and Scotland. However, this is likely due to sample bias as the membership of the RLA is mainly formed by landlords from across England and Wales.
Figure 53. The geographical locations of the samples property portfolio (N=2,495)
The majority of landlords reported that their typical property was let as unfurnished (70% of the sample). While, 32% of landlords reported let their property as fully furnished.
Figure 54. The different furnishing options across landlords’ portfolios (N=2,499)
5%
18%
11%
9%
8%
7%
19%
24%
14%
7%
2%
0.19%
0% 5% 10% 15% 20% 25% 30%
North East
North West
Yorkshire and the Humber
East Midlands
West Midlands
East of England
London
South East
South West
Wales
Scotland
Northern Ireland
70%
23%
32%
0%
10%
20%
30%
40%
50%
60%
70%
80%
Unfurnished Part furnished Furnished

53 RLA PEARL | State Intervention into Renting: Making sense of the impact of policy changes
10. Conclusions and Recommendations
Our research has examined a number of different enacted and proposed policy changes. Some of these policy changes, such as the ‘Right to Rent’ checks have been found in this research to be fuelling divisions in society. The Immigration Act has essentially made landlords state agents to enforce border controls14 and previous research has found that the introduction of these checks is preventing migrants from accessing private rented sector homes due to their nationality15. This research provides further evidence to support these claims. Due to the introduction of these checks and the potential for prosecution in failing to do the checks is causing landlords to be less willing to let to migrants and undocumented prospective tenants. 42% of landlords reported that they were now less likely to consider letting to someone without a British passport. Furthermore, this could be having a negative unintended consequence on vulnerable British citizens who don’t have a passport. At the last census16, 17% of the population of England and Wales reported they didn’t have a passport. This equates to 9.5 million residents that may have trouble accessing a home in the private rented sector due to these checks.
Selective and additional licensing schemes have been used by Local Authorities across the country to attempt to increase standards of private rented homes. This report provides evidence to suggest that these schemes are largely ineffective at increasing standards or reducing anti-social behaviour. 58% of landlords reported that the licensing scheme had no effect on the community, while only 4% reported that it had improved anti-social behaviour. This indicates that 96% of landlords don’t think that licensing is effective at improving anti-social behaviour. We propose that rather than costly licensing schemes, it would be more effective for landlords to join a self-regulation/co-regulation scheme that is managed by the sector and provides Alternative Dispute Resolution (ADR) to tenants who have problems. This then would enable tenants who have repair issues to raise this to ADR if the landlord does not satisfactorily provide a solution to their issue. Then through this ADR process, it would be possible to refer landlords who do not provide a good quality of housing to the Local Authority (LA) for enforcement. This would enable the LA to focus its
14 Crawford, J., Leahy, S., & McKee, K., (2016). 'The Immigration Act and the ‘Right to Rent’: exploring governing tensions within and beyond the state'. People Place and Policy Online, 10(2),114-125. DOI: 10.3351/ppp.0010.0002.0001 15 Patel, C., & Peel, C., (2017). Passport Please: The impact of Right to Rent checks on migrants and ethnic minorities in England. London: UK. Joint Council for the Welfare of Immigrants. 16 ONS. (2012). 2011 Census: Key Statistics for England and Wales, March 2011. Available here: https://www.ons.gov.uk/peoplepopulationandcommunity/populationandmigration/populationestimates/bulletins/2011censuskeystatisticsforenglandandwales/2012-12-11

54 RLA PEARL | State Intervention into Renting: Making sense of the impact of policy changes
resources on enforcing standards on rogue landlords, rather than focussing on good landlords providing high-quality homes.
In terms of the proposed deposit cap as part of the letting agent fee ban, this research provides a unique opportunity to explore the potential impact of this policy on the sector. While no cap has been confirmed due to the 2017 General Election putting a hold on the consultation processes within DCLG, we are assuming that a one-month cap will be sought by the Government. Nearly 9 out of 10 landlords (89%) reported taking a deposit when they let their properties, and nearly half of landlords (49%) reported that they asked for a higher deposit if the tenant would like to have a pet. When we asked the steps they might take, 51% of landlords reported that they would stop tenants from having pets to mitigate any negative impact of the proposed policy. Based on this finding, we believe that implementing and enforcing a 1-month cap on deposits would be bad for the sector and would end up having devastating consequences for tenants. Previous research has identified the positive long-term relationship pets can have on psychological well-being17. It would therefore be a mistake for the government not to take caution in the design of this policy to ensure that tenants and landlords are not left worse-off in the end. This could also have a negative impact on the wider economy
The government must also take notice that the proposed deposit cap could have significant financial implications for landlords. A one-month fee ban could lead to financial risk, especially in circumstances when tenants have caused damage to the property and leave with rent arrears. From the sample, 41% of landlords reported they made a claim against a deposit in the past 12 months. The primary reason for claims was damage to the property (whether direct (45% of landlords) or indirect (44% of landlords)), followed by rent arrears (43% of landlords). This could mean landlords increase rents to mitigate any potential increased costs (44% of landlords).
Due to the high proportion of landlords reporting issues with tenants in terms of hygiene and cleanliness (32%), indirect damage due to negligence (44%) and unwanted belongings left in the property (37%). It would therefore be worthwhile the Government in conjunction with the Deposit Protection Schemes such as TDS to improve the ‘How to Rent’ booklet with key practical guidance on how to look after their home and ensure that they receive their deposit at the end of a tenancy. We at the RLA will be looking to provide free resources for tenants to help them keep their home in a good condition.
17 See: Serpell, J., (1991). Beneficial effects of pet ownership on some aspects of human health and behaviour. Journal of the Royal Society of Medicine. 84. 717-720; Sable, P., (1995). Pets, Attachment, and Well-Being across the Life Cycle. Social Work. 40(3). 334-341; Wells, D. L., (2009). The Effects of Animals on Human Health and Well-Being. Journal of Social Issues, 65(3), 523-543; Wells, D. L., (2007). Domestic dogs and human health: An overview. British Journal of Health Psychology. 12. 145-156.

55 RLA PEARL | State Intervention into Renting: Making sense of the impact of policy changes
Our research also explored the potential impact of the proposed ban on letting agent fees on the sector. From the sample that identified as a letting agent, 57% of agents reported that they would increase fees to landlords due to this ban. At the same time, 35% of landlords reported that they would look for better deals after the ban, and 35% also reported they were looking to self-manage their properties. These findings indicate that the state intervention in the private rented sector is going to cause a significant transformational change. If landlords do start to move between agents, this could potentially mean job losses across the agent sector, which would reduce competition amongst agents and could lead to increased costs to landlords. It would also be irresponsible to expect that the landlord would absorb extra additional costs and not to attempt to pass at least a proportion of this increased costs to consumers (i.e. tenants).
Our research continues to show that rent arrears is a significant issue across the private rented sector. 30% of landlords reported they had experienced a tenant fall into rent arrears in the past 12 months, owing on average £1534.95 (median £1000). If we extrapolate this across the wider sector, this is £874 million (median: £589 million) owed to landlords from rent arrears. Not only does this impact on tenants and landlords, but this is approximately £117.8 million18 in lost tax revenue to the government. Our previous research19 identified that the roll-out of Universal Credit (UC) was a significant cause for rent arrears, specifically the 7-weeks before payment of UC to the claimant and the difficulties in arranging direct payments. The government needs to review the current implementation of UC to ensure tenants are able to pay their rent on time. These changes would increase the confidence of landlords in letting out to tenants on UC going forward. Nevertheless, these findings do counter a widely used claim that landlords are the major cause of homelessness with the serving of a Section 21 notice20. The findings of this research indicate that nearly 2 in 3 landlords are attempting to regain possession of their property due to rent arrears, suggesting that it is rather the rent arrears that is the underlying cause.
Looking at the wider sector, our findings are showing that some landlords are lacking confidence in the sector (39%) and that landlords on a whole are undertaking efforts to promote stability across their portfolios at this time of political and economic uncertainty. The proportion of landlords who have kept the size of their portfolio the same in the past 12 months has continued to rise to 71%, 7 percentage points higher than 9 months ago. While plans for future investment has remained relatively 18 Estimated using all landlords paying basic rate and the median amount owed for rent arrears for simplicity 19 Simcock, T.J. (2017). Welfare Reform and Universal Credit: The Impact of Welfare Reform on the Private Rented Sector. Manchester, UK: Residential Landlords Association. Available here: https://research.rla.org.uk/wp-content/uploads/Welfare-Reform-and-Universal-Credit-The-impact-on-the-private-rented-sector-2017.pdf 20 Craw. D. W., (2017). Landlords are turfing people out of their homes without reason – and its completely legal. The Guardian. Retrieved from: https://www.theguardian.com/housing-network/2017/jul/25/no-fault-evictions-landlords-tenants

56 RLA PEARL | State Intervention into Renting: Making sense of the impact of policy changes
consistent over the past quarter, with 61% of landlords planning to keep their portfolio the same. However, at the same time more landlords are looking to reduce the size of their portfolio than looking to increase the size of their portfolio.
When it comes to rent changes over the past 12 months, 54% of landlords reported that they had kept the rent the same, while 42% had reported increases. The most common reason for this was to keep rents in line with market rates (24%), followed by the changes to Mortgage Interest Relief (17%). In the 12-month outlook on rents, the proportion of landlords planning to keep rents the same has increased over the past 9 months, from 43% to 55%, an increase of 12 percentage points. This is accompanied by a 9-percentage point decrease in the number of landlords who plan to increase rents. It is likely that the economic and political uncertainty is having an impact on the sector, but as some landlords have already increased their rents it is likely that these landlords may not increase rents again within the next 12 months. 68% of landlords said they were planning on keeping the rents the same in order to keep the tenant in the property for the long-term. This finding indicates that landlords are looking for long term stability across their portfolios and wish to minimise the possibility of void periods and additional costs. This is a benefit to tenants who will welcome the long-term stability in rental costs over the next few years. However, nearly 1-in-3 landlords reported the reason for future rent increases as the changes to mortgage interest relief, this indicates that these changes will continue to increase costs right across the sector over the next 3 years. We could also see a potential rise in the proportion seeking to increases rents occurring next January when tax returns are being submitted to HMRC.
10.1 Key recommendations The findings of this research have identified a number of key issues involved in the implementation of policy right across the sector, and has also identified potential unintended consequences of proposed policies. To address these issues and unintended consequences we have put forward the following key recommendations that we believe will help to make renting better for all:
1. Based on the research findings we believe the government needs to review the ‘Right to Rent’ legislation and to ensure potential enforcement action is not causing undue fear for landlords. We believe that the implementation of this policy is reducing housing to some of the most vulnerable across society and needs to be changed.
2. The government needs to review local authorities licensing schemes to ensure they are effective and provide good value for money. The findings of this research show that landlords have lost faith in the potential impact of schemes. We believe that a co-regulation/self-regulation scheme would be more beneficial in improving standards

57 RLA PEARL | State Intervention into Renting: Making sense of the impact of policy changes
and providing piece of mind to tenants. Not only would this scheme save local authorities resources, they would be able to target their resources at the truly criminal landlords who provide sub-standard housing. A self-regulation scheme would enable Alternative Dispute Resolution (ADR) to be introduced across the whole sector, and would empower tenants if they have a serious issue with their landlord and home. We call on the government to work with the Residential Landlords Association and other stakeholders to implement this scheme across the whole sector and make renting better for all.
3. The proposed deposit cap should be 1 1/2 months’ rent or 6 weeks if paid weekly. This will ensure that landlords are able to claim back costs from tenants due to rent arrears and damages at the end of a tenancy. We also recommend that landlords and tenants should conduct an inventory at the start of a tenancy to ensure a quick resolution to any problems.
4. To ensure the continued affordability of access to the private rented sector, there needs to be a tenancy deposit passport system. This system would enable tenants to switch deposits between properties and would help to reduce the up-front cost of moving between PRS properties. To cover any potential cost between moving, an insurance product could be purchased by the tenant. Furthermore, the conservative government has shown its commitment to helping young people onto the housing ladder in the recent housing white paper, therefore, as there is currently £4.1billion21 covered in the schemes, we could revolutionise the deposit system with a ‘deposit bank’ that merges the current deposit with a help-to-buy ISA. This would then allow the deposit to be used to secure a home and this could help the government support a wider number of individuals to buy their own property if they wish.
4. The agent fee ban needs to be monitored as it is implemented to ensure there is no detriment to tenants or landlords. The RLA will work hard to ensure that any landlords who wish to self-manage can join and receive expert advice, education and guidance to help them offer the best rental experience to tenants possible.
5. Our analysis of trend data over our quarterly surveys is showing a market slow-down with landlords taking decisions that minimise risk to their portfolio. The majority of landlords are not planning to increase the number of homes across the sector, and while the Royal Institution of Chartered Surveyors (RICS) report the need for 1.8
21 Renshaw, R., (2017). Tenants’ deposits covered by protection schemes spiral to over £4bn. Property Industry Eye. Available here: http://www.propertyindustryeye.com/tenants-deposits-covered-by-protection-schemes-spiral-to-over-4bn/
58 RLA PEARL | State Intervention into Renting: Making sense of the impact of policy changes
million rented homes are needed to meet demand22. It is unlikely that this will be met without reinvigorating the housing market. To prevent the sector from losing homes that are needed, we recommend the government to introduce positive taxation policies to encourage new homes of all tenures to be built. The government needs to encourage small landlords to add properties to their local areas, without this the sector will not continue to grow and some landlords will leave the sector and start to provide short-term holiday lets on Airbnb23.
22 Royal Institution of Chartered Surveyors, Get out your hard hat Theresa: UK facing a 1.8m shortage of rental properties, 4th October 2016, available at http://www.rics.org/uk/news/news-insight/press-releases/get-out-your-hard-hat-theresa/ 23 Simcock, T.J., (2017). From Long-Term Lets to Short-Term Lets: Is Airbnb becoming the new buy-to-let? Manchester, UK: Residential Landlords Association. Available here: https://research.rla.org.uk/wp-content/uploads/Is-Airbnb-becoming-the-new-buy-to-let-Residential-Landlords-Association-August-2017.pdf

59 RLA PEARL | State Intervention into Renting: Making sense of the impact of policy changes
11. References
Brignall, M. (2015). £800 agency fee… to rent £650-a-month one-bed flat. The Guardian. Accessed here: https://www.theguardian.com/money/2015/may/30/rent-property-tenancy-agreement-agency-charges
Craw, D. W., (2017). Landlords are turfing people out of their homes without reason – and its completely legal. The Guardian. Retrieved from: https://www.theguardian.com/housing-network/2017/jul/25/no-fault-evictions-landlords-tenants
Crawford, J., Leahy, S., & McKee, K., (2016). 'The Immigration Act and the ‘Right to Rent’: exploring governing tensions within and beyond the state'. People Place and Policy Online, 10(2),114-125. DOI: 10.3351/ppp.0010.0002.0001
DCLG (2017) Banning letting agent fees paid by tenants. Available here: https://www.gov.uk/government/consultations/banning-letting-agent-fees-paid-by-tenants
Office for National Statistics (2017). Index of Private Housing Rental Prices, Great Britain: September 2017. Available here: https://www.ons.gov.uk/economy/inflationandpriceindices/bulletins/indexofprivatehousingrentalprices/september2017
Office for National Statistics (2017). Index of private housing rental prices (IPHRP) in Great Britain: Mar 2017. Available here: https://www.ons.gov.uk/economy/inflationandpriceindices/bulletins/indexofprivatehousingrentalprices/mar2017
Office for National Statistics (2012). 2011 Census: Key Statistics for England and Wales, March 2011. Available here: https://www.ons.gov.uk/peoplepopulationandcommunity/populationandmigration/populationestimates/bulletins/2011censuskeystatisticsforenglandandwales/2012-12-11
HM Treasury (2016) Autumn Statement 2016: some of the things we’ve announced. Available here: https://www.gov.uk/government/news/autumn-statement-2016-some-of-the-things-weve-announced
Patel, C., & Peel, C., (2017). Passport Please: The impact of Right to Rent checks on migrants and ethnic minorities in England. London: UK. Joint Council for the Welfare of Immigrants.
Pattison, B. & Reeve, K., (2017). Access to homes for the under-35s: The impact of Welfare Reform on Private Renting. Sheffield Hallam University. Available here: https://research.rla.org.uk/wp-content/uploads/SHU-Access-to-homes-for-under35s.pdf

60 RLA PEARL | State Intervention into Renting: Making sense of the impact of policy changes
Renshaw, R., (2017). Tenants’ deposits covered by protection schemes spiral to over £4bn. Property Industry Eye. Available here: http://www.propertyindustryeye.com/tenants-deposits-covered-by-protection-schemes-spiral-to-over-4bn/
Royal Institution of Chartered Surveyors. (2016). Get out your hard hat Theresa: UK facing a 1.8m shortage of rental properties, 4th October 2016, available at http://www.rics.org/uk/news/news-insight/press-releases/get-out-your-hard-hat-theresa/
Sable, P., (1995). Pets, Attachment, and Well-Being across the Life Cycle. Social Work. 40(3). 334-341
Serpell, J., (1991). Beneficial effects of pet ownership on some aspects of human health and behaviour. Journal of the Royal Society of Medicine. 84. 717-720
Simcock, T.J., (2017). From Long-Term Lets to Short-Term Lets: Is Airbnb becoming the new buy-to-let? Manchester, UK: Residential Landlords Association. Available here: https://research.rla.org.uk/wp-content/uploads/Is-Airbnb-becoming-the-new-buy-to-let-Residential-Landlords-Association-August-2017.pdf
Simcock, T.J. (2017). Welfare Reform and Universal Credit: The Impact of Welfare Reform on the Private Rented Sector. Manchester, UK: Residential Landlords Association. Available here: https://research.rla.org.uk/wp-content/uploads/Welfare-Reform-and-Universal-Credit-The-impact-on-the-private-rented-sector-2017.pdf
Simcock, T.J. (2016). Landlord Investment, Finance and Tax Report 2016. Manchester, UK: Residential Landlords Association. Available here: https://research.rla.org.uk/wp-content/uploads/Finance-and-Tax-Review-of-the-PRS-Report.pdf
Valuation Office Agency (2017). Private Rental Market Summary Statistics – April 2016 to March 2017. Available here: https://www.gov.uk/government/uploads/system/uploads/attachment_data/file/620661/PRMS_Statistical_Release_22062017.pdf
Wells, D. L., (2009). The Effects of Animals on Human Health and Well-Being. Journal of Social Issues, 65(3), 523-543
Wells, D. L., (2007). Domestic dogs and human health: An overview. British Journal of Health Psychology. 12. 145-156.
Walmsley. S (2017). Challenging the myth: Two thirds of landlords pay basic rate tax. Residential Landlords Association. Retrieved from: https://news.rla.org.uk/two-thirds-landlords-pay-basic-rate-income-tax/