STATE OF CALIFORNIA• DEPARTMENT OF TRANSPORTATION ADA Notice TECHNICAL REPORT DOCUMENTATION PAGE For individuals with sensory disabilities, this document is available in alternate formats. For information call (916) 654-641 o or TDD (916) TR0003 (REV 10/98) 654-3880 or write Records and Forms Management, 1120 N Street, MS-89, Sacramento, CA 95814. 1. REPORT NUMBER CA16-3244 2. GOVERNMENT ASSOCIATION NUMBER 3. RECIPIENT'S CATALOG NUMBER 4. TITLE AND SUBTITLE Economic Competitiveness, Definitions and Metrics 5. REPORT DATE 10/01/2018 6. PERFORMING ORGANIZATION CODE 7. AUTHOR(S) Genevieve Giuliano 8. PERFORMING ORGANIZATION REPORT NO. 9. PERFORMING ORGANIZATION NAME AND ADDRESS METRANS University of Southern California (USC) 3500 S. Figueroa St./Ste 102, Los Angeles, CA 90089-8001 10. WORK UNIT NUMBER 11. CONTRACT OR GRANT NUMBER 65A0533 TO 020 13. TYPE OF REPORT AND PERIOD COVERED Final Report - October 2018 12. SPONSORING AGENCY AND ADDRESS California Department of Transportation Division of Research, Innovation and Systems Information (DRISI) MS-83, PO Box 942873 Sacramento, CA 94273-0001 14. SPONSORING AGENCY CODE 15. SUPPLEMENTARY NOTES 16. ABSTRACT This Task Order continues earlier work aimed at establishing performance measures for monitoring the economic competitiveness of the freight sector as part of the implementation of the California Sustainable Freight Action Plan (CSFAP). The purpose of this task order is to defme competitiveness in California's freight sector, and work with industry, public and state and local government stakeholders to establish performance measures and targets relative to the implementation of the CSFAP. The task order is in support of the Governor's Office of Business and Economic Development (GO-Biz), which is taking the lead role in establishing these new defmitions and metrics in relation to the state's greenhouse gas (GHG) reduction goals and development of a sustainable freight system for California. 17. KEYWORDS California Sustainable Freight Action Plan (CSFAP), performance measures, sustainable freight 18. DISTRIBUTION STATEMENT No restrictions. This document is available to the public through The National Technical Information Service, Springfield, VA 22161 19. SECURITY CLASSIFICATION (of this report) Unclassified 20. NUMBER OF PAGES 38 21. COST OF REPORT CHARGED None. Reproduction of completed page authorized.
Transcript
STATE OF CALIFORNIA• DEPARTMENT OF TRANSPORTATION ADA Notice TECHNICAL REPORT DOCUMENTATION PAGE For individuals with sensory disabilities, this document is available in
alternate formats. For information call (916) 654-641 o or TDD (916) TR0003 (REV 10/98) 654-3880 or write Records and Forms Management, 1120 N Street, MS-89, Sacramento, CA 95814.
1. REPORT NUMBER
CA16-3244
2. GOVERNMENT ASSOCIATION NUMBER 3. RECIPIENT'S CATALOG NUMBER
4. TITLE AND SUBTITLE
Economic Competitiveness, Definitions and Metrics
5. REPORT DATE
10/01/2018 6. PERFORMING ORGANIZATION CODE
7. AUTHOR(S)
Genevieve Giuliano
8. PERFORMING ORGANIZATION REPORT NO.
9. PERFORMING ORGANIZATION NAME AND ADDRESS
METRANS University of Southern California (USC) 3500 S. Figueroa St./Ste 102, Los Angeles, CA 90089-8001
10. WORK UNIT NUMBER
11. CONTRACT OR GRANT NUMBER
65A0533 TO 020 13. TYPE OF REPORT AND PERIOD COVERED
Final Report - October 2018 12. SPONSORING AGENCY AND ADDRESS
California Department of Transportation Division of Research, Innovation and Systems Information (DRISI) MS-83, PO Box 942873 Sacramento, CA 94273-0001
14. SPONSORING AGENCY CODE
15. SUPPLEMENTARY NOTES
16. ABSTRACT
This Task Order continues earlier work aimed at establishing performance measures for monitoring the economic competitiveness of the freight sector as part of the implementation of the California Sustainable Freight Action Plan (CSFAP). The purpose of this task order is to defme competitiveness in California's freight sector, and work with industry, public and state and local government stakeholders to establish performance measures and targets relative to the implementation of the CSF AP. The task order is in support of the Governor's Office of Business and Economic Development (GO-Biz), which is taking the lead role in establishing these new defmitions and metrics in relation to the state's greenhouse gas (GHG) reduction goals and development of a sustainable freight system for California.
17. KEYWORDS
California Sustainable Freight Action Plan (CSF AP), performance measures, sustainable freight
18. DISTRIBUTION STATEMENT
No restrictions. This document is available to the public through The National Technical Information Service, Springfield, VA 22161
19. SECURITY CLASSIFICATION (of this report)
Unclassified
20. NUMBER OF PAGES
38
21. COST OF REPORT CHARGED
None. Reproduction of completed page authorized.
DISCLAIMER STATEMENT
This document is disseminated in the interest of information exchange. The contents of this report reflect the views of the authors who are responsible for the facts and accuracy of the data presented herein. The contents do not necessarily reflect the official views or policies of the State of California or the Federal Highway Administration. This publication does not constitute a standard, specification or regulation. This report does not constitute an endorsement by the Department of any product described herein.
For individuals with sensory disabilities, this document is available in alternate formats. For information, call (916) 654-8899, TTY 711, or write to California Department of Transportation, Division of Research, Innovation and System Information, MS-83, P.O. Box 942873, Sacramento, CA 94273-0001.
Economic Competitiveness, Definitions and Metrics Task Order 020
Final Report
October 2018
Genevieve Giuliano, Principal Investigator
Mohammed Hassan, Researcher METRANS Transportation
Center Sol Price School of Public Policy University of
Southern California
DISCLAIMER The contents of this report reflect the views of the authors, who are responsible for the facts and the accuracy of the information presented herein. This document is disseminated under the sponsorship of the California Department of Transportation in the interest of information exchange. The California Department of Transportation assume no liability for the contents or use thereof. The contents do not necessarily reflect the official views or policies of the State of California or the Department of Transportation. This report does not constitute a standard, specification, or regulation.
DISCLOSURE The project entitled, “Economic Competitiveness, Definitions and Metrics” was funded under California Department of Transportation (Agreement No: 65A0533). The total funding amount was $63,414.23. The Principle Investigator of the project was Professor Genevieve Giuliano of the Sol Price School of Public Policy at the University of Southern California and was carried out during the period: November 15, 2017 to June 14, 2018.
ACKNOWLEDGEMENT The authors would like to thank Frank Ramirez, Goods Movement and Sustainable Freight Manager, Governor’s Office of Business and Economic Development, and the Economic Competitiveness Working Group for participating in all aspects of this study. Frank Ramirez facilitated access to data from the California Economic Development Department. All errors and omissions are the responsibility of the authors.
I. INTRODUCTION ..................................................................................... 1
1. Task Order Purpose .............................................................................................................1 2. The CSFAP .........................................................................................................................1 3. Prior Work ..........................................................................................................................1
II. RESEARCH AND RESULTS ................................................................... 2
4. Task 1: Definition of the freight sector ................................................................................2 a. 1.1 Definition......................................................................................2 b. 1.2 Data and Sources ..........................................................................5
5. Electric power generation, transmission and distribution...................................................... 9 6. Task 2: Definition of “Economic Competitiveness” ........................................................... 15
d. 3.1 Generating the metrics data ..........................................................................16 e. 3.2 Generating the metrics ................................................................20
8. Task 4: Targets ................................................................................................................. 24 III. CONCLUSIONS .......................................................................................24
9. Limitations and scope for improvements ........................................................................... 24 10. Further considerations ....................................................................................................... 25
IV. Appendix A: (Calculated Revenues by Group) .......................................26
V. Appendix B: (GDP estimates by Group) .................................................30
INTRODUCTION Task Order Purpose This Task Order continues earlier work aimed at establishing performance measures for monitoring the economic competitiveness of the freight sector as part of the implementation of the California Sustainable Freight Action Plan (CSFAP). The purpose of this task order is to define competitiveness in California’s freight sector, and work with industry, public and state and local government stakeholders to establish performance measures and targets relative to the implementation of the CSFAP. The task order is in support of the Governor’s Office of Business and Economic Development (GO-Biz), which is taking the lead role in establishing these new definitions and metrics in relation to the state’s greenhouse gas (GHG) reduction goals and development of a sustainable freight system for California.
The main objective of this research is to build on previous work with public agencies and industry groups to establish a set of measures that would accurately depict the competitive state of California’s freight economy, and arrive at targets that could be used to evaluate competitiveness over time. In collaboration with the Economic Competitiveness Working Group, we defined competitiveness and the freight sector, evaluated data sources for potential metrics, and generated test metrics and comparable groups. The next step in this process is to generate the entire set of baseline metrics and establish a method for annual monitoring. This will be done in a later stage of the project.
The CSFAP As per Executive Order B-32-15 by Governor Brown, the California Sustainable Freight Action Plan (CSFAP) was initiated in July 2016. The Plan provides the vision for California’s freight sector to be more efficient, more economically competitive and less polluting. The freight sector is vital for California as the nation’s largest contributor for international trade and domestic commerce. It is also clear that the freight sector is responsible for a high portion of the pollution within the state of California. In order to combat climate change, the state of California has already set ambitious targets to reduce greenhouse gas emissions. The Plan aims at integrating investments, policies and programs within the state of California and offers a unified approach to improve efficiency, transition to zero emission technologies and improve the state’s freight sector competitiveness. As part of the freight sector vision for 2030 and beyond, the Executive Order has directed the state agencies to set targets for the three main aspects: improve efficiency, transition to zero emission and increase economic competitiveness. At the time the CSFAP was approved, economic competitiveness targets and metrics had not been selected.
Prior Work Under the previous task order contract, METRANS conducted three meetings with the Economic Competitiveness working group, one being a full day workshop. Outcomes of this work included a working definition of economic competitiveness, a high-level definition of the freight sector, a discussion of potential metrics and agreement on approach for continuing the work and fulfilling the requirements of the CSFAP.
1
This research aimed at developing economic competitiveness and growth metrics to track the health of the freight sector while implementing the Plan. The metrics will help evaluate the strategies proposed by the Plan and track any economic impact. The research started after the first meeting held on the 25th of January 2018. The first phase included freight sector definitions. It was agreed to include freight sector activities as well as freight related activities. The North American Industry Classification System (NAICS) was used to track different activities as it is the standard used by most economic studies. Possible data sources were examined and different statistical programs were considered to collect the required data to develop the indicators that make up the metrics. Available data sources and proposed competitiveness indicators were then presented in the second meeting held on the 4th of April 2018. The final metrics and indicators were presented in the last meeting held on the 8th of June 2018. The results also included comparison with some of the identified competitive states.
RESEARCH AND RESULTS This project has the following tasks: 1) Definition of the freight sector; 2) Definition of economic competitiveness; 3) Measuring economic competitiveness; 4) Identifying economic competitiveness targets. Strong emphasis was placed on carefully defining terms in order to develop metrics that accurately reflect the sector’s performance, as well as to select the best available data sources for measurement.
Task 1: Definition of the freight sector 1.1 Definition The working group agreed on the following broad definition of the freight sector:
The freight sector constitutes all transportation based and transportation dependent enterprises involved in the supply chain from point of origin to point of consumption.
It includes:
1. All carriers 2. All transportation service providers involved in moving, handling, managing, or
planning the flow of cargo 3. All transportation dependent activities 4. All cargo owners or intermediaries 5. Reverse logistics chains 6. Transportation infrastructure
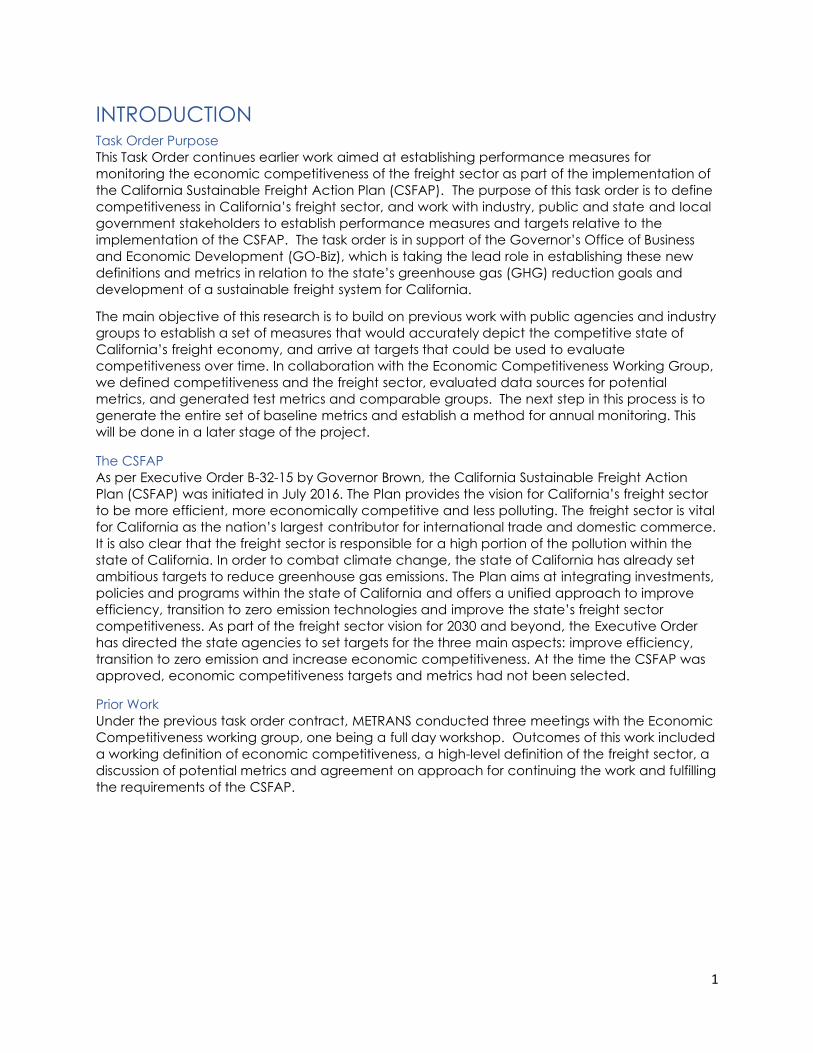
This definition is quite broad, as it includes “all cargo owners or intermediaries”, meaning retail, wholesale and manufacturing, as well as transportation infrastructure, both public and private. Justification is presented in Figure 1, an example of a retail supply chain. Shipping connects the production, distribution, consumption, and waste processes. Strictly speaking, each of the stationary activities is dependent on the transport that links each element of the supply chain. In addition, the velocity and reliability of the supply chain depends in part on the supply and quality of infrastructure, from public highways and airports to private railways and terminal facilities.
2
However, a broad definition of the freight sector creates problems for measuring economic competitiveness. First, the size of the retail, manufacturing, and wholesale sectors dwarfs the more traditional concept of freight sector. Second, performance of the transport system cannot be measured in the same way as performance of the freight sector, we further discuss these issues in Task 3 below.
Figure 1: Example of retail supply chain
Once defined, the freight sector definition must be made operational. All of the economic activities within each of the subsectors above must be fully enumerated. See Figure 2. This enumeration is the result of discussions of the first meeting of the working group, held on January 25, 2018. There are many activities or sub-sectors that are part of each aspect of the freight sector listed above. For example, “All carriers” includes each of the transport modes. “All transportation service providers” includes 11 activities, from port or intermodal operations to third party services to the USPS. The set of activities included provides the basis for examining data sources that can be used to measure the freight sector as defined here.
3
Figure 2: Freight sector enumerated by group
Carriers
ocean
inland water
Railroads
Trucking
Courier
Air
Pipeline
Service providers
freight consolidators
3PLs
customs brokers
port operators
terminal operators
airport operators
USPS
parcel delivery services
load matching intermediaries
equipment leasing
warehouse &
distribution
construction
Cargo owners
retailers
utilities operations, wholesalers
repairs
mobile manu-personal
Transportation dependent
road and infrastructure
maintenance
facturers services
mobile commercial 3PLs
services
Agriculture
energy production
Reverse logistics
waste management
reverse packaging
retailers
manufacturers
parcel delivery services
empty containers
Infrastructure
state highway system
local streets and roads
railroads
ports
airports
intermodal facilities
pipelines
border crossings
inland waterways
power generation, distribution, transmission
4
1.2 Data and Sources
1.2.1 Industry codes
The next step in creating an operational definition to measure freight sector performance is to identify the data that provides the best accuracy, consistency, and detail consistent with our definition. The obvious choice for mapping to economic data is the National Industrial Classification System (NAICS), developed by the US Bureau of Commerce. NAICS is a business establishment classification system with up to 6-digit granularity, with each higher level nested from lower levels. There are about 1000 unique 6-digit codes. Many different data sources are produced by federal and state governments based on the NAICS system. As would be expected, the more granular the code or geography, the more missing data there is due to confidentiality requirements.1 See [https://www.naics.com/business-lists/counts-by-naics-code/?#countsByNAICS] for more information on NAICS.
At the 2-digit level, the “freight sector” is typically defined as NAICS 48-49, transportation and warehousing. Table 1 shows the 3-digit codes included in 48-49. It can be seen that many of the activities in our definition are included, but some are not (e.g. waste management), and some included activities are not freight (e.g. transit and ground passenger). In order to map our definition to NAICS, we must eliminate the non-freight activities in 48-49 and add freight activities measured outside of 48-49. We therefore chose to use 6-digit NAICS as the basis of generating performance measures.
Table 1: 3-digit composition of NAICS 48-49
Code Description 481 Air transportation 482 Rail transportation 483 Water transportation 484 Truck transportation 485 Transit and ground passenger 486 Pipeline transportation 487 Scenic and sightseeing 488 Support activities for transportation 491 Postal service 492 Couriers and messengers 493 Warehousing and storage
Even using NAICS 6-digit coding, it is not possible to generate a perfect mapping to our definition. First, in some cases, six digits NAICS codes could not be broken down to capture the exact activity listed. Some NAICS codes include more than just one type of activity. Second,
1 See [https://www.naics.com/business-lists/counts-by-naics-code/?#countsByNAICS] for more information on NAICS.
transportation dependent activities could not be broken down to capture only the transportation portion within these sectors. Sectors like construction and utilities (NAICS codes 23 and 22 respectively) must be either included or excluded as a whole. The same issue was faced with Cargo owners (retailers, wholesalers and manufacturers; NAICS codes 44-45, 42 and 31-33 respectively); these were included as a whole. Similarly, mobile services (NAICS code 81) was broken down to capture the activities that included transportation, but it was not possible to break down the transportation portion in each activity. In the next phase of the research we will determine whether there is potential bias from either over-counting or undercounting these subsectors. Finally, it is not possible to capture transportation infrastructure with NAICS. Value of any establishment held (e.g. private) infrastructure is part of that sector’s economic productivity. Public infrastructure is not establishment based by definition and hence is not captured in NAICS.2
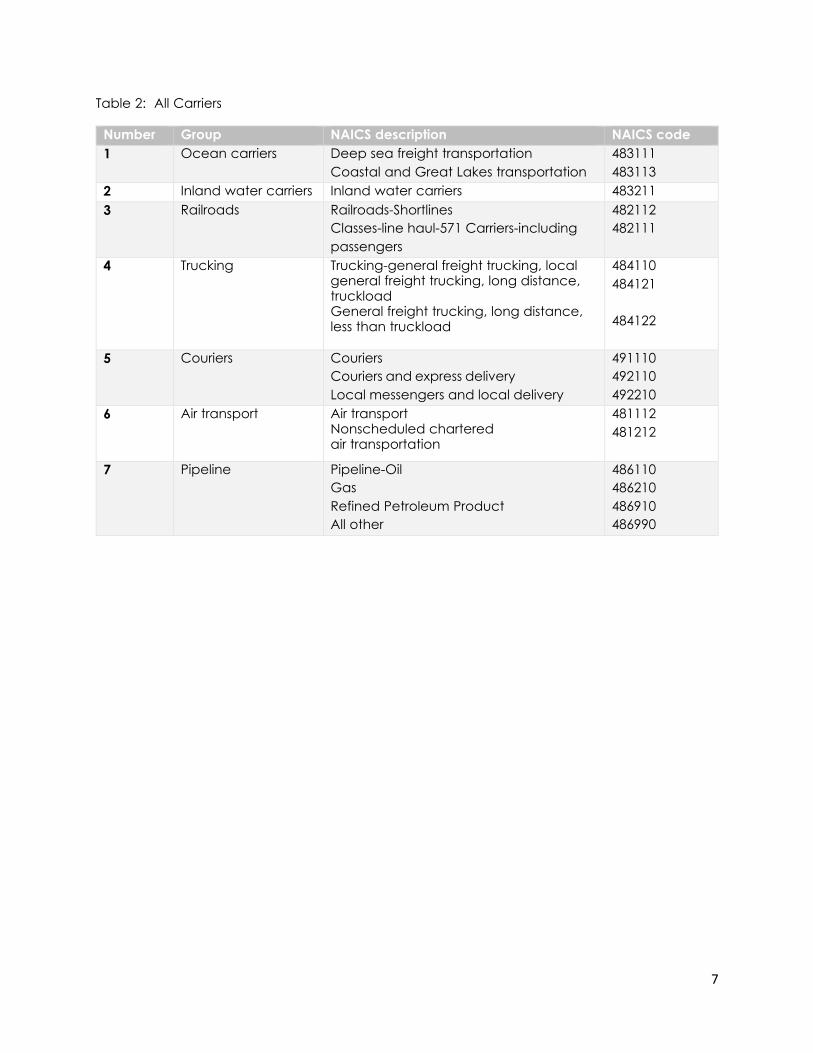
Tables 2 through 6 show the mapping of each group to 6 digit NAICS. Some entries are given in 2 or 4 digit NAICS; this means all the nested codes are included. It can be seen that overall, we are able to capture our definition with 6-digit NAICS. The least information is available for reverse logistics, but we assume the reverse activity is included in the general service activity. For example, the return packages processed by a parcel delivery service would be part of all courier service activity. The most problematic is transportation dependent services, as it is largely a judgement call to determine what services are in fact (commercial) transport dependent. This is an area for additional work in the next phase.
2 The omission of the economic value of public activity will lead to unavoidable distortions. For example, if a state DOT contracts road repair to a private company, it will be captured in NAICS, but if road repair is done by the DOT it will not be captured.
6
Table 2: All Carriers
Number Group NAICS description NAICS code 1 Ocean carriers Deep sea freight transportation
Coastal and Great Lakes transportation 483111 483113
2 Inland water carriers Inland water carriers 483211 3 Railroads Railroads-Shortlines
4 Trucking Trucking-general freight trucking, local general freight trucking, long distance, truckload General freight trucking, long distance, less than truckload
484110 484121
484122
5 Couriers Couriers Couriers and express delivery Local messengers and local delivery
491110 492110 492210
6 Air transport Air transport Nonscheduled chartered air transportation
481112 481212
7 Pipeline Pipeline-Oil Gas Refined Petroleum Product All other
486110 486210 486910 486990
7
Table 3: Service Providers
Number Group NAICS description NAIC488310S code
1 Freight consolidators Freight transportation arrangement 488510 2 3PLs Freight transportation arrangement 488510 3 Customs brokers Freight transportation arrangement 488510 4 Port operators Port and harbor operations
Marine cargo handling Navigational services to shipping Other support activities for water transport
488310 488320 488330 488390
5 Terminal operators Support activities 488119 488190
6 Airport operators Support activities 488119 488190
7 USPS USPS 491110 8 Parcel delivery
services Couriers and express delivery services 492110
Warehousing and distribution Refrigerated warehousing and storage Farm product warehousing and storage Other warehousing and storage
493110 493120 493130 493190
8
q~ÄäÉ=QW=qê~åëéçêí~íáçå=aÉéÉåÇÉåí=
kìãÄÉê= Group NAICS description NAICS code 1 jçÄáäÉ=éÉêëçå~ä=
services eçãÉ=~åÇ=Ö~êÇÉå=ÉèìáéãÉåí=êÉé~áê=maintenance Appliance repair and maintenance Re-upholstery and furniture repair Funeral homes and services Pet care services (except veterinary) Environment, conservation and wildlife services Communication equipment repair and maintenance
~åÇ= UNNQNN=
811412 811420 812210 812910 813312
811213
2 Mobile commercial services
Other electronic and precision equipment repair and maintenance Commercial and industrial machinery repair and maintenance (not auto or electronic)
811219
811310
3 Road and infrastructure maintenance.
488490
4 Energy production Electric power generation, transmission and distribution
2211
Table 5: Cargo Owners
Number Group NAICS description NAICS code 1 Retailers Retail Trade 44-45 2 Wholesalers Wholesale Trade 42 3 Manufacturers Manufacturing 31-33 4 Agriculture Specialized Freight (except Used Goods)
Trucking, Local 484220
9
Table 6: Reverse Logistics
Number Group NAICS description NAICS code 1 Waste management Waste management and remediation
services 562
2 Reverse packaging N/A – cannot be separated out 3 Retailers N/A – cannot be separated out 4 Manufacturers N/A – cannot be separated out 5 Parcel delivery
services N/A – cannot be separated out
6 Empty containers N/A – cannot be separated out
1.2.2 Data Sources
Several data sources were examined to determine whether and how metrics could be generated based on our freight sector definition. As a starting point, we seek data that is published at least annually, is consistent over time, available in constant dollars, and available at the state level. We examined seven data sources with contrasting advantages and disadvantages.
Description: QWI provides quarterly local labor market statistics by 2 to 4-digit NAICS industry, worker demographics, employer age and size. The main source of QWI is the Longitudinal Employment and Household Dynamics (LEHD) data. LEHD is a massive longitudinal database covering 95% of the US private sector. It is employer based, meaning that only establishments with employed workers are included.
Data Sources: LEHD relies on several administrative records on employment collected by the states, Social security data and federal tax records. Figure 3 below presents a data diagram of the composition of QWI and how each data source is linked to the other using common identifiers including PIK (Protected Identification Key, an encoded Social Security number), SEIN (State Employer Identification Number) or Federal EIN (Employer Identification Number). Having many data sources requires common identifiers to correctly merge the data.
Quarterly Census of Employment and Wages (QCEW) [2] http://www.labormarketinfo.edd.ca.gov/qcew/cew-select.asp
Description: The Quarterly Census of Employment and Wages (QCEW) is a quarterly count of employment and wages reported by employers by 2 to 6-digit NAICS code.
Data Source: QCEW microdata are collected from unemployment insurance (UI) accounting system in each state. The states receive a Quarterly Contributions Report (QCR) from all private sector employers, as well as from state and local governments covered under the UI program. The reports contain only employment and wages data, for each employer’s installations within each state. The QCEW conducts two surveys in addition to collecting administrative data. Approximately one-third of all private sector U.S. businesses with more than three employees are contacted annually to verify their main business activity and physical location address via the Annual Refiling Survey (ARS). Eligible multiple-establishment employers are required to report quarterly employment and wage data via the Multiple Worksite Report (MWR). Both surveys collect data via paper forms and electronically.
Description: NES is an annual data series that provides economic data in 2 to 6-digit NAICS code for businesses that have no paid employees and are subject to federal income taxes. The most common example is sole proprietorship. Data Sources: NES data relies on statistical data obtained through business income tax records that IRS provides the census bureau. Data are then processed through automated and analytical reviews.
Statistics of US Businesses (SUSB) [4] https://www.census.gov/programs-surveys/susb/about.html
Description: SUSB provides annual data on the distribution of economic data by enterprise size and industry, number of firms and establishments, annual payroll, and employment. NAICS level is 2 to 6-digit NAICS code. SUSB excludes non-employer businesses, private households, railroads, agricultural production, and most government entities.
Data Sources: SUSB data relies on the Business Register (BR). BR includes the Census Bureau's economic censuses and current business surveys, quarterly and annual Federal tax records, and other departmental and federal statistics.
Economic Census [5] https://www.census.gov/programs-surveys/economic-census/technical-documentation/methodology.html
Description: The Economic Census is the US government’s official five-year measure of American businesses and economy. NAICS level is 2 to 6-digit NAICS code.
Data Sources: The Economic Census data are based on a complete enumeration of all known employers in some sectors and a sample in some other sectors. It excludes railroads and USPS.
Survey of Business Owners (SBO) [6] https://www.census.gov/programs-surveys/sbo/technical-documentation/methodology.html
Description: SBO provides 2 to 6-digit NAICS code data on some economic and demographic characteristics of businesses and business owners.
Data Sources: SBO data is collected using a survey that is mailed asking respondents to report it back electronically. Surveys are mailed to a random sample of businesses selected from a list of all firms. The list of all firms is collected from business tax returns and data collected on other economic census reports. SBO excludes Rail Transportation (NAICS 482) from the survey.
Bureau of Economic Analysis [7] https://www.bea.gov/regional/pdf/GDPState/0417_GDP_by_State_Methodology.pdf https://www.bea.gov/regional/pdf/GDPMetro2015.pdf Description: BEA provides data by state and metropolitan area. Data are available only at 2-digit NAICS code. Data available are GDP, compensation of employees, taxes on production and imports, subsidies and per capita real GDP.
Data Sources: GDP by state is estimated in ten consecutive steps. It includes data from BEA’s state personal income accounts, tax data from the Census Bureau, federal and state government agencies, and other data from the Census Bureau. GDP for metropolitan areas by industry is generally calculated in two steps: first by multiplying the ratio of county to state earnings for the industry by the state level GDP and then, summing up all counties in a metropolitan area to generate GDP by that industry.
Table 7 summarizes the data sources described above and presents their respective advantages and disadvantages. Because annual data is preferred for this analysis, the 5 year sources are not adequate. However, since revenue data are only available from the economic census in 5 year increments, estimates had to be generated as described in Task 3 below. Our analysis relies on data with as little lag as possible, making QWI and QCEW particularly attractive. We also want to include as much of the entire sector as possible. For example, we know that independent operators make up a significant portion of the trucking industry. Thus data sources that omit independent operators (QWI, QCEW) will have to be supplemented. We retained all the data sources as candidates, with selections made in Task 3.
Quarterly Q4 2017 2-6 Employment, earnings Public sector not covered by unemployment insurance program
Non-Employer Statistics (NES)
Annual 2015 2-6 N of establishments, revenues Firms with employees
Statistics of US businesses (SUSB)
Annual 2014 2-6 N of firms, establishments, employment, annual payroll, revenues
Firms with no employees, RR, USPS
Economic Census 5 years 2012 2-6 N of establishments, employees, ave payroll per employee, total annual payroll, revenues
Firms with no employees, RR, USPS
Survey of business owners (SBO)
5 years 2012 2-6 N of firms with or without employees, revenues, payroll
RR
Bureau of Economic Analysis
Annual 2016 2 GDP, real GDP, per capita real GDP
14
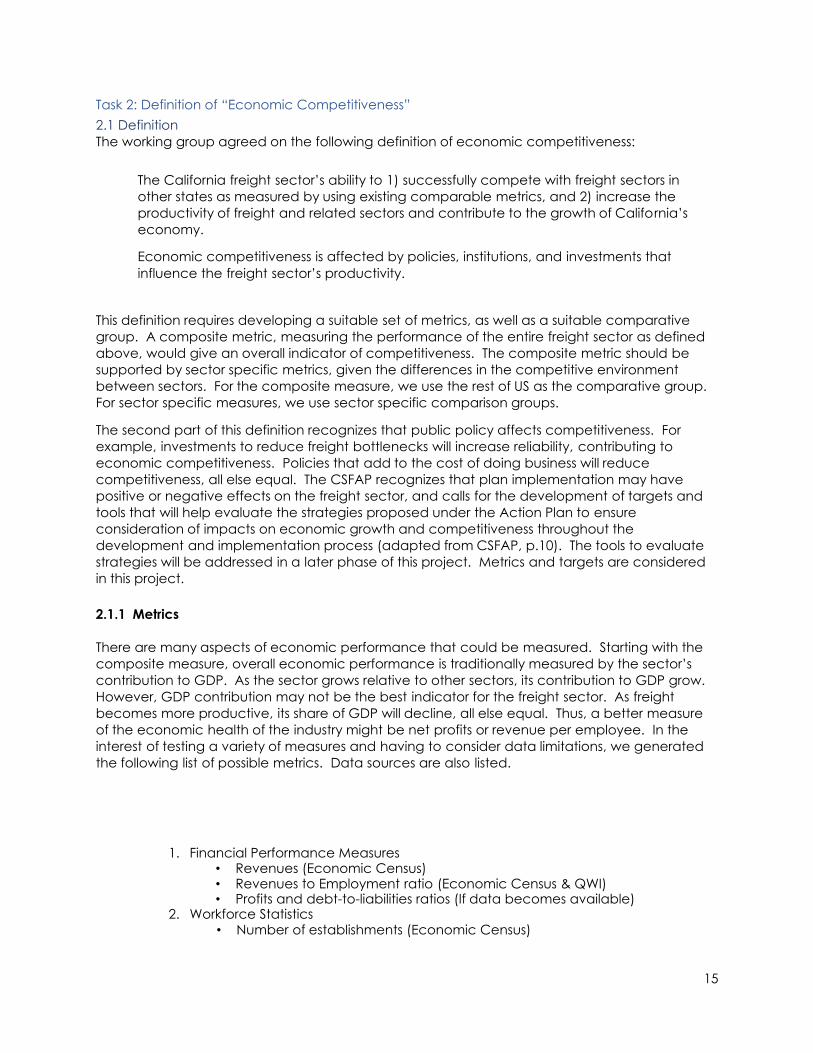
Task 2: Definition of “Economic Competitiveness” 2.1 Definition The working group agreed on the following definition of economic competitiveness:
The California freight sector’s ability to 1) successfully compete with freight sectors in other states as measured by using existing comparable metrics, and 2) increase the productivity of freight and related sectors and contribute to the growth of California’s economy.
Economic competitiveness is affected by policies, institutions, and investments that influence the freight sector’s productivity.
This definition requires developing a suitable set of metrics, as well as a suitable comparative group. A composite metric, measuring the performance of the entire freight sector as defined above, would give an overall indicator of competitiveness. The composite metric should be supported by sector specific metrics, given the differences in the competitive environment between sectors. For the composite measure, we use the rest of US as the comparative group. For sector specific measures, we use sector specific comparison groups.
The second part of this definition recognizes that public policy affects competitiveness. For example, investments to reduce freight bottlenecks will increase reliability, contributing to economic competitiveness. Policies that add to the cost of doing business will reduce competitiveness, all else equal. The CSFAP recognizes that plan implementation may have positive or negative effects on the freight sector, and calls for the development of targets and tools that will help evaluate the strategies proposed under the Action Plan to ensure consideration of impacts on economic growth and competitiveness throughout the development and implementation process (adapted from CSFAP, p.10). The tools to evaluate strategies will be addressed in a later phase of this project. Metrics and targets are considered in this project.
2.1.1 Metrics
There are many aspects of economic performance that could be measured. Starting with the composite measure, overall economic performance is traditionally measured by the sector’s contribution to GDP. As the sector grows relative to other sectors, its contribution to GDP grow. However, GDP contribution may not be the best indicator for the freight sector. As freight becomes more productive, its share of GDP will decline, all else equal. Thus, a better measure of the economic health of the industry might be net profits or revenue per employee. In the interest of testing a variety of measures and having to consider data limitations, we generated the following list of possible metrics. Data sources are also listed.
1. Financial Performance Measures • Revenues (Economic Census) • Revenues to Employment ratio (Economic Census & QWI) • Profits and debt-to-liabilities ratios (If data becomes available)
2. Workforce Statistics • Number of establishments (Economic Census)
15
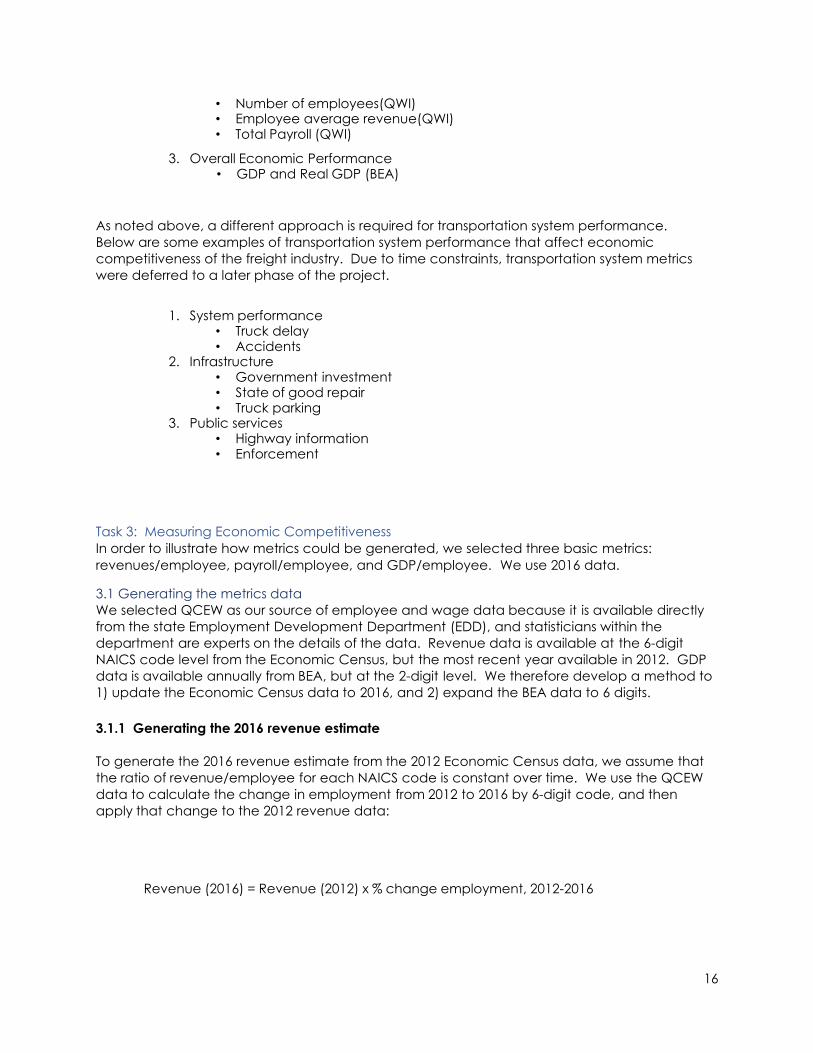
• Number of employees(QWI) • Employee average revenue(QWI) • Total Payroll (QWI)
3. Overall Economic Performance • GDP and Real GDP (BEA)
As noted above, a different approach is required for transportation system performance. Below are some examples of transportation system performance that affect economic competitiveness of the freight industry. Due to time constraints, transportation system metrics were deferred to a later phase of the project.
1. System performance • Truck delay • Accidents
2. Infrastructure • Government investment • State of good repair • Truck parking
3. Public services • Highway information • Enforcement
Task 3: Measuring Economic Competitiveness In order to illustrate how metrics could be generated, we selected three basic metrics: revenues/employee, payroll/employee, and GDP/employee. We use 2016 data.
3.1 Generating the metrics data We selected QCEW as our source of employee and wage data because it is available directly from the state Employment Development Department (EDD), and statisticians within the department are experts on the details of the data. Revenue data is available at the 6-digit NAICS code level from the Economic Census, but the most recent year available in 2012. GDP data is available annually from BEA, but at the 2-digit level. We therefore develop a method to 1) update the Economic Census data to 2016, and 2) expand the BEA data to 6 digits.
3.1.1 Generating the 2016 revenue estimate
To generate the 2016 revenue estimate from the 2012 Economic Census data, we assume that the ratio of revenue/employee for each NAICS code is constant over time. We use the QCEW data to calculate the change in employment from 2012 to 2016 by 6-digit code, and then apply that change to the 2012 revenue data:
Revenue (2016) = Revenue (2012) x % change employment, 2012-2016
16
The assumption that the ratio of revenue/employee is constant over time is strong and may lead to biased estimates. Unfortunately, there is no better option for estimating 2016 revenues given the data limitations. We will be able to check this assumption when the 2017 data is released.
Table 8 gives 2016 estimated revenues based on employment growth for the “All Carriers” group. Tables for the other groups are available in Appendix A. The employment column shows the number of employees within each activity in California in 2016. The employment growth column shows the growth rates from 2012 to 2016 which is used to estimate each activity’s revenues. The calculated revenues column shows the estimated revenues (in $1000) per activity in California for 2016. As already discussed, some activities suffer from suppressions. A calculated revenues cell showing NA means that the revenues data for this specific activity was missing within the economic census of 2012. However, an employment growth box showing NA means that the employment data for that specific activity was suppressed in 2012. In the latter case, there is an empty calculated revenues box for the same activity. It is also clear that railroad data is suffering from possible suppressions as the numbers seem unrealistic given the scale of the industry.
17
Table 8: Calculated revenues for “All Carriers” activities
GDP data were acquired from the Bureau of Economic Analysis. The data are limited to the 2-digit level. In order to expand the GDP data to 6-digit, we again use the QCEW employment data. We calculate the share of each 6-digit sector within the 2 digit sector, and use the shares to allocate GDP:.
GDPi = % employmenti x GDPj, where GDPi is 6-digit sector i, and GDPj is 2 digit sector j.
This method assumes a close relationship between employment and GDP. We estimated the correlation coefficient for employment and GDP for 22 quarters of data, from Q1 2012 to Q2 2017. The correlation is 0.991, indicating that employment is a very good proxy for GDP.
18
Table 9 presents GDP estimates for the all carriers group. Tables for the other groups are available in Appendix B. The employment column is the same as in Table 8. The GDP estimate is generated from applying the employment based GDP weight to the 2 digit GDP quantity.
Table 9: 2016 GDP estimates for “All Carriers” activities
All carriers Code Employment GDP Weight GDP ($million)
4 Trucking-General Freight trucking, Local 484110 35,733 7.0% 4,493.85
General Freight trucking, Long distance, truckload 484121 24,221 4.7% 3,046.08
General Freight trucking, Long distance, less than truckload 484122 20,844 4.1% 2,621.38
5 Couriers/Last mile 491110 720 0.1% 90.55 Couriers and express delivery 492110 68,128 13.3% 8,567.91 Local messengers and local delivery 492210 11,875 2.3% 1,493.42
6 Air Transport 481112 786 0.2% 98.85
Nonscheduled chartered air transportation 481212 1,225 0.2% 154.06
7 Pipeline-Oil 486110 581 0.1% 73.07 Gas 486210 437 0.1% 54.96 Refined Petroleum Product 486910 855 0.2% 107.53 All other 486990 21 0.0% 2.64
We generated the estimates in Tables 8 and 9 for all groups included in the freight sector as defined by the Working Group. As mentioned earlier, some of the industry sectors included are much larger than the traditional sector 48-49. To present a sense of these scale differences, Table 10 gives the estimated 2016 GDP by group, as well as the size of that group relative to sectors 48-49. Thus “All Carriers” makes up about 26% of 48-49, and freight transport service providers make up over 40%. All transportation dependent activities are about 24%. In contrast, cargo owners are nearly 9 times as large due to retail and manufacturing. We therefore separate
19
cargo owners when presenting examples of metrics in Task 4. The argument for including cargo owners is the GDP value they represent of the imports and exports of the ports. Adding up all these GDP values, the total freight sector as defined as per this project constitutes about 29% of the total state GDP in 2016.
Table 10: Freight sector group GDP as share of 48-49 GDP
Category GDP ($million) % of sector 48-49
All carriers 16,913 26.3%
Freight Transportation Service Providers
27,003 41.9%
All Transportation dependent activities 15,626 24.3 %
Reverse Logistics 5,919 9.2%
Cargo Owners 578,042 897.4%
3.1.4 Comparables
As noted earlier, for the composite metrics, the rest of the US is the comparison group. As examples for sector level comparisons, we selected trucking and ports. Discussions with the working group resulted in the selection of Arizona, Nevada and Utah as the potential competitor states for trucking, and Virginia and Georgia as potential competitor states for port activity.
3.2 Generating the metrics This section is divided in two parts. The first part covers California indicators for the year 2016. The second part covers the comparison with competitor states within two activities: trucking and ports.
3.2.1 2016 California Indicators
We generated a baseline set of indicators for 2016 based on the three groups of measures: financial performance, workforce statistics and overall economic performance. We noted earlier that our definition of the freight sector is quite broad. Including cargo owners means including sectors that are much larger than the conventionally defined freight sector. In calculating performance measures, these sectors are likely to dwarf any changes that might happen within the more narrowly defined sector. To show how including cargo owners could affect the measures, we calculate all measures with and without cargo owners.
1. Financial Performance Measures (Source: Economic Census) Revenues and revenues per number of employees were calculated for every activity under each of the five main groups. All activities under the same category were then added up to make up the revenues estimates per group. Table 11 shows Financial Performance Measures in 2016. It can be seen that cargo owners’ revenue is larger than the more conventionally defined freight
20
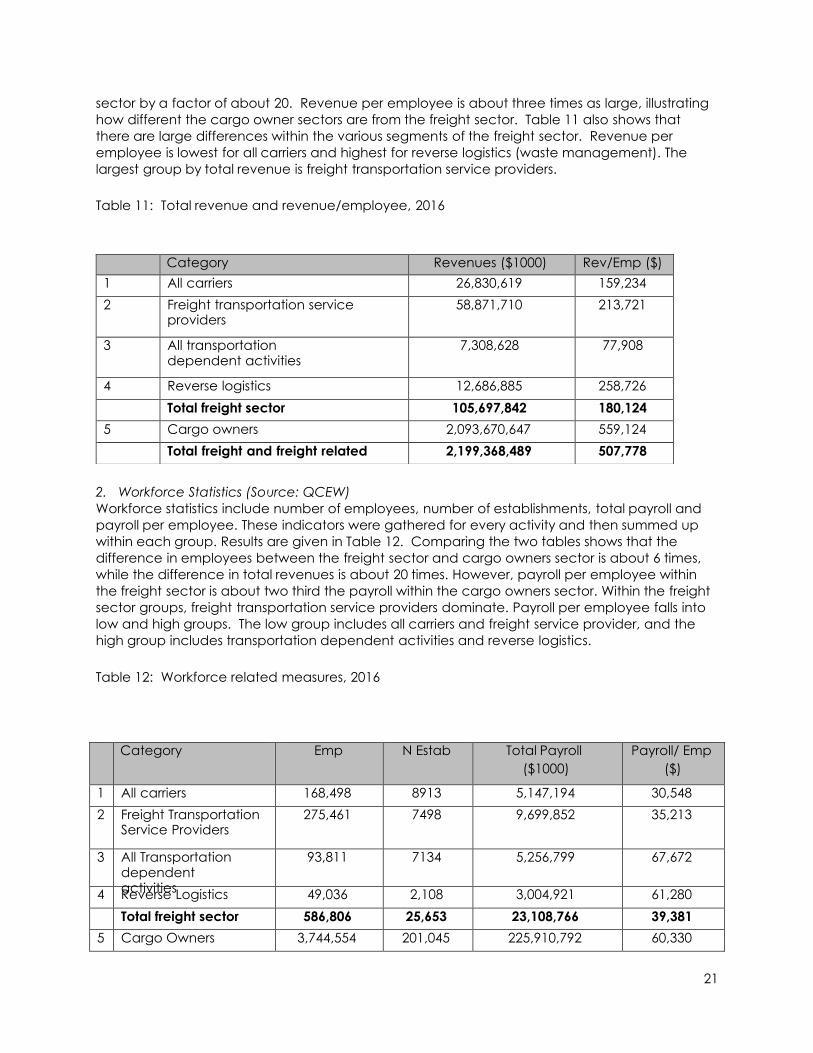
sector by a factor of about 20. Revenue per employee is about three times as large, illustrating how different the cargo owner sectors are from the freight sector. Table 11 also shows that there are large differences within the various segments of the freight sector. Revenue per employee is lowest for all carriers and highest for reverse logistics (waste management). The largest group by total revenue is freight transportation service providers.
Table 11: Total revenue and revenue/employee, 2016
Category Revenues ($1000) Rev/Emp ($) 1 All carriers 26,830,619 159,234 2 Freight transportation service
providers 58,871,710 213,721
3 All transportation dependent activities
7,308,628 77,908
4 Reverse logistics 12,686,885 258,726 Total freight sector 105,697,842 180,124
5 Cargo owners 2,093,670,647 559,124 Total freight and freight related 2,199,368,489 507,778
2. Workforce Statistics (Source: QCEW) Workforce statistics include number of employees, number of establishments, total payroll and payroll per employee. These indicators were gathered for every activity and then summed up within each group. Results are given in Table 12. Comparing the two tables shows that the difference in employees between the freight sector and cargo owners sector is about 6 times, while the difference in total revenues is about 20 times. However, payroll per employee within the freight sector is about two third the payroll within the cargo owners sector. Within the freight sector groups, freight transportation service providers dominate. Payroll per employee falls into low and high groups. The low group includes all carriers and freight service provider, and the high group includes transportation dependent activities and reverse logistics.
Table 12: Workforce related measures, 2016
Category Emp N Estab Total Payroll ($1000)
Payroll/ Emp ($)
1 All carriers 168,498 8913 5,147,194 30,548 2 Freight Transportation
3. Overall Economic Performance (Source: BEA) The third measure is overall economic performance, as measured by GDP and GDP per employee. We use the same method of calculating GDP for each activity and then summing up all activities under each group. Results are shown in Table 13. Cargo owners account for nearly 9 times as much GDP as the rest of the freight sector, and within the rest of the freight sector, freight transportation service providers’ account for the vast majority of GDP. GDP per employee for the freight sector is just over two thirds of the cargo owners group.
Table 13: GDP and GDP per employee
Category GDP ($million) GDP / Emp ($)
1 All carriers 16,913 100,374 2 Freight transportation service
providers 27,003 98,030
3 All transportation dependent activities
15,626 166,566
4 Reverse logistics 5,919 120,707 Total freight 65,461 111,554
5 Cargo owners 578,042 154,369 Total freight and freight related 643,503 148,568
3.2.2 Benchmark comparisons
As a final illustration of how metrics can be used at the subsector level, we compare performance of trucking and ports relative to competitor states. For trucking we use Arizona, and for ports we use Georgia. Because trucking and port activity fall within our first two freight sector categories, we use only these categories in calculating the performance measures. We use only the QCEW data, as project time constraints did not allow for constructing databases from Economic Census and BEA for other states. A single baseline year cannot provide comparative performance information (a single year gives no information on change over time); we use the change from 2015 to 2016 to illustrate the subsector comparisons.
1. Trucking Comparison
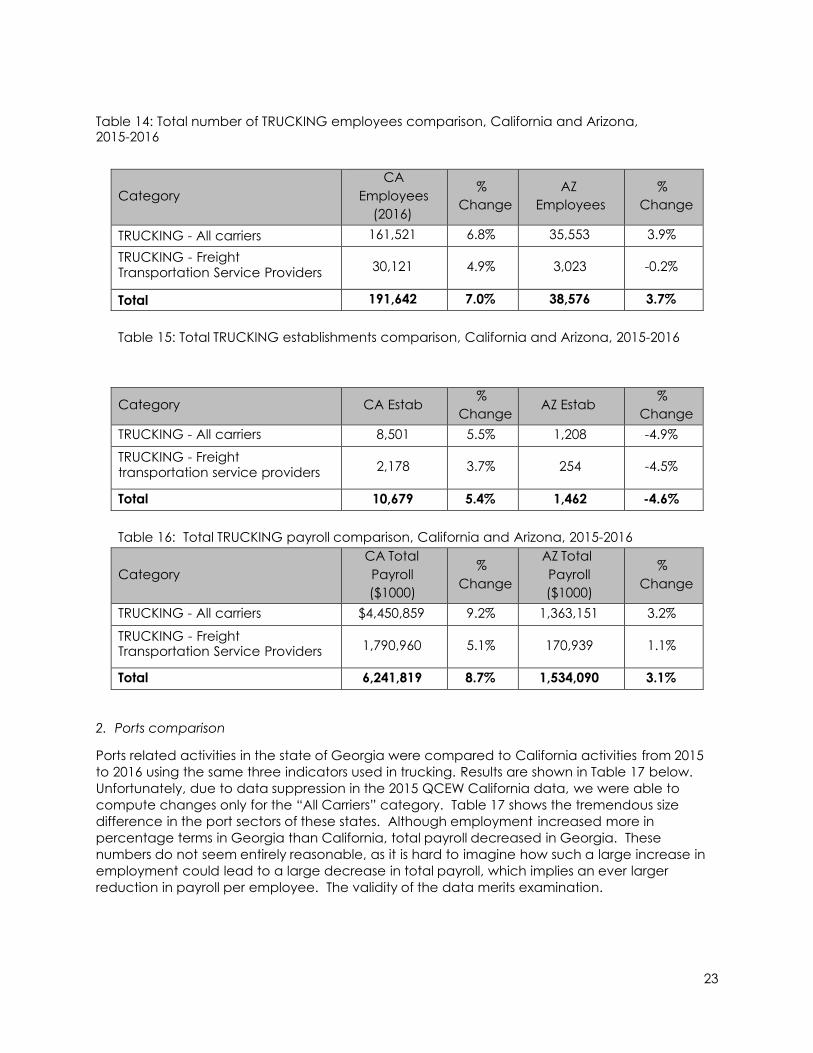
Results of the trucking comparison are given in Tables 14-16 below. Only trucking related activities, under “All Carriers” and “Freight transportation service providers”, were used for these calculations. By all measures, the California freight sector is much larger than that of Arizona, as expected. The California freight sector also appears to be performing better. The growth of the number of employees in California in 2016 was about as twice that of Arizona. The number of establishments in California increased by about 5%, while the number decreased in Arizona. Total payroll increased by more than the increase in employees for California, while in Arizona total payroll increased less than the increase in employees.
22
Table 14: Total number of TRUCKING employees comparison, California and Arizona, 2015-2016
Category CA
Employees (2016)
% Change
AZ Employees
% Change
TRUCKING - All carriers 161,521 6.8% 35,553 3.9% TRUCKING - Freight Transportation Service Providers 30,121 4.9% 3,023 -0.2%
Total 191,642 7.0% 38,576 3.7%
Table 15: Total TRUCKING establishments comparison, California and Arizona, 2015-2016
Category CA Estab % Change
AZ Estab % Change
TRUCKING - All carriers 8,501 5.5% 1,208 -4.9%
TRUCKING - Freight transportation service providers 2,178 3.7% 254 -4.5%
Total 10,679 5.4% 1,462 -4.6%
Table 16: Total TRUCKING payroll comparison, California and Arizona, 2015-2016
Category CA Total Payroll ($1000)
% Change
AZ Total Payroll ($1000)
% Change
TRUCKING - All carriers $4,450,859 9.2% 1,363,151 3.2%
TRUCKING - Freight Transportation Service Providers 1,790,960 5.1% 170,939 1.1%
Total 6,241,819 8.7% 1,534,090 3.1%
2. Ports comparison
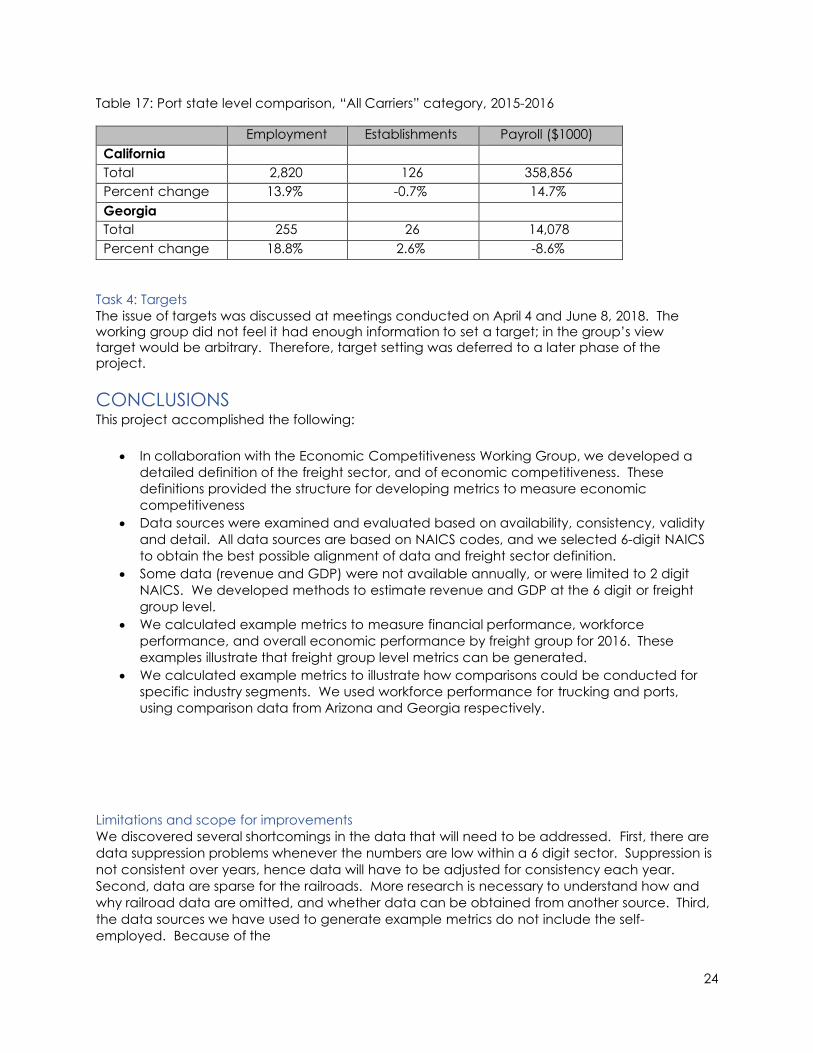
Ports related activities in the state of Georgia were compared to California activities from 2015 to 2016 using the same three indicators used in trucking. Results are shown in Table 17 below. Unfortunately, due to data suppression in the 2015 QCEW California data, we were able to compute changes only for the “All Carriers” category. Table 17 shows the tremendous size difference in the port sectors of these states. Although employment increased more in percentage terms in Georgia than California, total payroll decreased in Georgia. These numbers do not seem entirely reasonable, as it is hard to imagine how such a large increase in employment could lead to a large decrease in total payroll, which implies an ever larger reduction in payroll per employee. The validity of the data merits examination.
23
Table 17: Port state level comparison, “All Carriers” category, 2015-2016
Employment Establishments Payroll ($1000) California Total 2,820 126 358,856 Percent change 13.9% -0.7% 14.7% Georgia Total 255 26 14,078 Percent change 18.8% 2.6% -8.6%
Task 4: Targets The issue of targets was discussed at meetings conducted on April 4 and June 8, 2018. The working group did not feel it had enough information to set a target; in the group’s view target would be arbitrary. Therefore, target setting was deferred to a later phase of the project.
CONCLUSIONS This project accomplished the following:
• In collaboration with the Economic Competitiveness Working Group, we developed a detailed definition of the freight sector, and of economic competitiveness. These definitions provided the structure for developing metrics to measure economic competitiveness
• Data sources were examined and evaluated based on availability, consistency, validity and detail. All data sources are based on NAICS codes, and we selected 6-digit NAICS to obtain the best possible alignment of data and freight sector definition.
• Some data (revenue and GDP) were not available annually, or were limited to 2 digit NAICS. We developed methods to estimate revenue and GDP at the 6 digit or freight group level.
• We calculated example metrics to measure financial performance, workforce performance, and overall economic performance by freight group for 2016. These examples illustrate that freight group level metrics can be generated.
• We calculated example metrics to illustrate how comparisons could be conducted for specific industry segments. We used workforce performance for trucking and ports, using comparison data from Arizona and Georgia respectively.
Limitations and scope for improvements We discovered several shortcomings in the data that will need to be addressed. First, there are data suppression problems whenever the numbers are low within a 6 digit sector. Suppression is not consistent over years, hence data will have to be adjusted for consistency each year. Second, data are sparse for the railroads. More research is necessary to understand how and why railroad data are omitted, and whether data can be obtained from another source. Third, the data sources we have used to generate example metrics do not include the self-employed. Because of the
24
prevalence of owner-operators in the trucking sector, it will be necessary to supplement QCEW, BEA, and EC data with another source, most likely NES.
Our sample calculations provided some insights that will be useful in the next phase of this work. First, the cargo owner sector is so large relative to the more traditionally defined freight sector that it would overwhelm any composite metric. At a minimum, the cargo owner group should be kept separate from the other freight groups.
Second, it is worth rethinking the inclusion of utilities and construction in freight dependent activities. These sectors are much larger than any of the others in the group, and have notably different characteristics with respect to revenues, payroll and GDP. Transportation activity must account for a relatively small share of total revenue or GDP; therefore we recommend deleting these sectors from the group. Waste management (reverse logistics group) is a similar case, but transportation may constitute a relatively large portion of costs and employees. Possibilities for examining the waste management sector in more detail.
Third, establishing comparison groups requires obtaining the same data and doing the same conversion estimates for each state included. If the base comparison group is the US, then data from all 49 other states will have to be processed and checked. We expect that some of what was done can be automated, but will remain labor intensive. It will therefore be important to decide on a small set of metrics and a limited number of comparison groups so that the process of annual competitiveness evaluation can be accomplished as efficiently as possible.
Further considerations As this work moves to the next phase, the following tasks should be considered. First, the working group should consider a target, or a process for making a decision about a target. Second, a final set of metrics and comparison groups should be established and the 2016 and 2017 computations should be conducted. Third, it will be important to decide what organization will have responsibility for calculating the metrics and monitoring progress toward the target over the course of the CSFAP. Fourth, a stable funding source for continuation of this work should be identified. Finally, specific provisions of the CSFAP should be identified for analysis of impacts on the freight sector.