Page 1
State of Minnesota
Department of Human Services
Final Report: Non-Wage Provider Costs in Home and Community-Based Disability Waiver Services May 31, 2016
Truven Health Analytics, an IBM Company
Page 3
PAGE III
May 31, 2016 ▪ ©Truven Health Analytics, an IBM Company ▪ www.truvenhealth.com
Trade Secret, Proprietary and Confidential Property of Truven Health Analytics Inc.
This document contains trade secret, proprietary and/or confidential information as defined by the
Minnesota Government Data Practices Act, Minnesota Statutes § 13.37. As such, portions of this
document are protected by laws pertaining to such material. All rights thereto are the sole and
exclusive property of Truven Health Analytics Inc. (hereafter referred to as Truven Health or
Truven). This document is intended for use by prospective clients, clients, and employees of Truven
Health.
Unless otherwise stated, the product names and acronyms used herein are trademarks, service marks,
and registered trademarks of Truven Health used under license. All other product names used herein
are trademarks of their respective owners.
Page 5
PAGE V
May 31, 2016 ▪ ©Truven Health Analytics, an IBM Company ▪ www.truvenhealth.com
Table of Contents
PRELIMINARY RESEARCH .............................................................................................................................. 2
PRIMARY DATA COLLECTION........................................................................................................................ 5
PROVIDER SURVEY .......................................................................................................................................... 6
COMBINED RECOMMENDATIONS BY COMPONENT ................................................................................. 9
CAVEATS, LIMITATIONS, AND ADDITIONAL CONSIDERATIONS .......................................................... 24
APPENDICES .................................................................................................................................................... 27
APPENDIX A. SURVEY GUIDANCE DOCUMENT ....................................................................................... 28
APPENDIX B: PRIMARY DATA SOURCES .................................................................................................. 40
Page 6
PAGE 1
May 31, 2016 ▪ ©Truven Health Analytics, an IBM Company ▪ www.truvenhealth.com
Introduction
Minnesota Statutes 2013, section 256B.4914, subdivisions 10 (b) and (g), state that the
Commissioner shall conduct analyses that address differences in the underlying cost of providing
home and community-based disability waiver services (HCBS) throughout the state. In a prior study
for the Minnesota Department of Human Services (DHS), Truven Health researched and made
recommendations for implementing an index to capture their variation in wage-based costs. The aim
of this new study is to investigate the non-wage cost components associated with providing DWS.
We sought to address the following questions posed by Minnesota DHS:
What specific non-wage costs are needed to provide HCBS effectively? Are there
cost components that have not been identified previously?
By service framework and by service bucket, what value and/or percentage should be
incorporated in the rate methodology frameworks to cover each identified non-wage
cost component?
By service framework and by service bucket, how do these cost components vary by
provider? Were statistically significant trends observed, such as characteristics of
recipients served, waiver type, and geographic region?
To answer these questions, we (1) collected data from primary data sources, where available, and (2)
developed and administered a provider survey in collaboration with the Minnesota DHS and other
key stakeholders. These data collection activities were conducted by a panel of Truven Health
Medicaid experts, Minnesota DHS personnel, provider focus groups, and stakeholders. We used the
data collected to complete the following steps:
1. Validate existing and identify new non-wage cost components
2. Determine the values of each non-wage cost component
3. Identify whether credible variation in non-wage cost components across different service
buckets and categories, geographic areas, waiver programs, and other meaningful
characteristics could be determined.
In this report, we present the results of our study. First, we discuss our underlying understanding of
the issues and preliminary research activities conducted in preparation for our data collection. Next,
we discuss the methodologies and results of our primary data collection and our provider survey by
non-wage cost category. We then provide our recommendations based on both data collection
Page 7
PAGE 2
May 31, 2016 ▪ ©Truven Health Analytics, an IBM Company ▪ www.truvenhealth.com
activities. We conclude with a discussion of challenges, caveats, and limitations, and suggest further
areas of study.
Preliminary Research
Review Current Rate-Setting Methodology Structure
Our initial step was to review the current rate-setting methodology to identify underlying issues,
gaps, and areas for improvement in this current methodology. Three resources provided the
foundation for understanding the current rates, how they are calculated, and the supporting data for
the factors used. The first resource from the Minnesota DHS titled Disability Waiver Rate System
Component Values Effective January 1, 20141 provided a concise summary of each of the current
framework factors and how they differed between service buckets. The second resource from the
Minnesota DHS website2 provided all current disability waiver rate setting frameworks and showed
the details for how the framework factors are applied (e.g., order of operations).
The third resource, which provided information for the values in the current methodology, was a
report produced by Navigant Consulting, Inc. (Navigant) titled Summary of Recommendations:
Results of 2010 Rate Setting Methodologies Initiative (RSMI) Analyses and Recommendations
(Navigant Report), from January 31, 2012. Much like the study that we were engaged to perform,
the Navigant Report was based on both a primary data search and a provider survey. Although the
Navigant Report made recommendations for the cost components necessary to provide DWS in
Minnesota, the rate-setting methodology was developed and finalized after recommendations were
made to the Minnesota DHS. For some factors, a key difference will be that the Navigant report
provided most rates as a percentage of total compensation. In contrast, our recommendations take
into account the order of operations that are part of the current rate-setting methodology. Where
possible, we have made our recommendations in light of this methodology.
The following are cost components of the current rate-setting methodology:
Hourly wages
Supervision/span of control
Vacation, Sick Leave, and Training
Taxes and Workers’ Compensation
Other Benefits
Client Program and Support
Program Plan Support
1 Minnesota Department of Human Services. Disability Waiver Rate System Component Values Effective January
1, 2014. https://mn.gov/dhs-stat/images/WRS_ComponentValues.pdf. Accessed March 25, 2016.
2 Minnesota Department of Human Services. Disability Waiver Rate Setting Frameworks. Last updated March 14,
2016. http://mn.gov/dhs/partners-and-providers/continuing-care/reform-initiatives/rate-setting/rate-setting-
frameworks.jsp. Accessed March 25, 2016.
Standard General and Administrative
(G&A) Support
Program-Related Support
Utilization and Absence
Transportation
Facility use
Page 8
PAGE 2
May 31, 2016 ▪ ©Truven Health Analytics, an IBM Company ▪ www.truvenhealth.com
Through our preliminary research, we found that these cost components comprehensively cover the
allowable costs associated with providing home and community-based services (HCBS). However,
some areas within this component structure provide good opportunities for refinement or clarification
in their definition. These are discussed further in the Primary Data Collection section of this report.
Hourly wages were researched in a prior study, so we excluded them from our analysis of non-wage
cost components. We also excluded unallowable non-wage costs that are not eligible within Medicaid
rates, such as charitable contributions and lobbying costs.
The cost components identified above represent the scope of costs extensively studied within this
report. Some additional nuances within the frameworks, such as wages or customizations for
individuals who are deaf or hard of hearing, were not included in our study.
The cost components were categorized by four primary service buckets (Day, Residential, Unit-Based
With Programming, and Unit-Based Without Programming) that were further broken down by service
categories that align to framework models (see Table 1).
Page 9
PAGE 3
May 31, 2016 ▪ ©Truven Health Analytics, an IBM Company ▪ www.truvenhealth.com
Table 1. Service Organization by Bucket
Service Bucket
HCBS Services Framework Model
Day
Adult Day, 15-Minute AdultDayCare15Min.xls
Adult Day, Daily AdultDayCareDaily.xls
DTH, 15-Minute DTH15minutes.xls
DTH, Daily DTHdaily.xls
Prevocational Services, Hourly PrevocHourly.xls
Prevocational Services, Daily PrevocDay.xls
Structured Day, 15-Minute StructuredDay15Min.xls
Structured Daily, Daily StructuredDayDaily.xls
Residential
Customized Living Daily, 24-Hour Customized Living Daily, and Residential Care Services Daily
CustomizedLivingandResidentialCareSerives.xls
Corporate Foster Care Daily and Corporate Supportive Living Services Daily
FosterCareSupportedLivingCorporate.xls
Family Foster Care Daily and Family Supportive Living Services Daily
FosterCareSupportedLivingFamily.xls
Unit without programming
Personal Support and Companion Services
PersonalSupport.xls
Night Supervision NightSupervision.xls
Respite Care Services, 15-Minute Respite15minutes.xls
Respite Care Services, Daily RespiteDaily.xls
Unit with programming
Behavioral Support Services BehaviorSupport.xls
Housing Access Coordination HousingAccessCoorindation.xls
In-Home Family Support InHomeFamilySupport.xls
Independent Living Skills Training ILSTraining.xls
Supportive Living Services, 15-Minute
SLS15Min.xls
Supported Employment Services SupportedEmployment.xls
We believe that this service structure should remain intact, because it appropriately reflects the variety
of HCBS offered in Minnesota. Although other strong systems have been identified, we did not find
sufficient evidence to substantiate changing the basic rate structure. During a scan of comparable state
policies related to payment structures, no findings indicated that new rate structures would result in
meaningfully different or more equitable rates. The burden to change to an entirely new rate structure
is considerable, so we advise against major modification. Rather, we suggest implementing refined
rates within the existing framework to achieve payments that more accurately reflect cost. Through our
panel, focus group, and survey responses we received feedback that certain types of expenses were not
currently being covered. However, it has been determined that, of the allowable costs, all of these can
be included under one of the existing framework definitions. Although some providers have suggested
that certain costs are not currently addressed, further clarification of the categories has demonstrated
that these costs are in fact included in the current components.
Page 10
PAGE 4
May 31, 2016 ▪ ©Truven Health Analytics, an IBM Company ▪ www.truvenhealth.com
Gather Information From Multiple Sources
To prepare for our data collection activities, we sought input from a variety of sources to enhance our
understanding of the current rate-setting structure. Our team obtained feedback from multiple
stakeholders, such as the Minnesota DHS and the Advisory Committee, focus groups comprised of
providers and other related groups, as well as Truven Health Medicaid experts. Details regarding these
activities are provided below:
Review of prior Minnesota cost study. We reviewed the Navigant Report because it forms
the basis for many of the current rate-setting inputs. We found that many of the sources of
information in that report remain valid. In the current study, we updated references from the
Navigant Report, and we offer additional refinement to several cost components.
Meetings with the Minnesota DHS. Throughout our study, we conducted biweekly meetings
with the Minnesota DHS, in addition to frequent ad hoc communication, to gather critical
feedback on our approach. These meetings provided insight into the knowledge and experience
of Minnesota service providers and the constituents who may be affected by any changes to the
rate-setting methodology.
Advisory Committee meeting. We presented our rate-setting methodology at the November
19, 2015, Advisory Committee meeting to engage key stakeholders in the Minnesota HCBS
community. We used this meeting as an opportunity to elicit feedback from Advisory
Committee members.
Focus groups. On November 19–20, 2015, we conducted two focus group meetings with a
cross section of Minnesota HCBS providers to seek input about the provider survey
development process.
Internal Medicaid experts committee. We contacted a panel of Medicaid experts within
Truven Health and solicited information about HCBS rate-setting methodology. The panel
identified primary sources, potential risks, and best practices throughout the course of our
study.
Survey communication plan. Before releasing the survey, we planned a host of
communications to ensure that the survey was marketed comprehensively. This plan included
multiple notifications sent to providers, a recorded webinar to walk participants through the
survey, and a guidance document to concisely show all survey questions.
The goals of these activities were (1) to provide ample opportunity through multiple channels for all
stakeholders to understand the purpose and importance of our study and (2) to encourage participation,
elicit feedback, and gain a deeper understanding about stakeholders and the current rate-setting
methodology.
Page 11
PAGE 5
May 31, 2016 ▪ ©Truven Health Analytics, an IBM Company ▪ www.truvenhealth.com
Create a Research Timeline
This section outlines the activity timeline for this study. Table 2 presents key project milestones and
dates.
Table 2. Key Project Milestones and Dates
Project Milestone Dates
Minnesota DHS site visit November 18–20, 2015
Advisory Committee meeting November 19, 2015
Focus groups November 19–20, 2015
Survey February 19, 2016
Release sample survey to focus group participants December 14, 2015
Survey communication blasts to providers December 15, 2015 – February 19, 2016
Survey released to participants January 19, 2016
Survey training webinar January 20, 2016
Survey submission deadline February 19, 2016
Primary data collection November 19, 2015 – February 29, 2016
Final non-wage cost report May 31, 2016
Advisory Committee meeting June 21, 2016
Abbreviation: DHS, Department of Human Services
Primary Data Collection
This study used primary data sources where possible for determining non-wage costs in Minnesota. In
our research, we studied articles, websites, and publically available data sets. We performed our
primary data research in accordance with the following considerations:
Data specificity. Our primary aim in this study was to produce factors that accurately reflect
costs to reimburse participating providers for the provision of HCBS. Therefore, we evaluated
the denomination, or method of payment, to determine whether it accurately reflects the way
that costs are incurred. We evaluated each subcomponent of non-wage costs and determined
which denomination best reflects the reimbursement method. We also identified suitable levels
of data specificity for each cost component.
Variation by bucket or service. The current cost structure has some cost components that are
applied consistently across all services, whereas others vary by service bucket. We studied
whether variations were warranted across the buckets of service through the survey.
Variation by geography or urban/non-urban designation. For most cost components, we
were not able to identify a primary data source that demonstrated geographic variation.
However, we were able to capture variation using health insurance premiums from
MNsure.org. One challenge with these results is that the variation in health insurance
premiums are defined by nine areas that do not map cleanly with the Metropolitan Statistical
Areas (MSAs) used in the wage variation. Instituting a factor to account for the geographic
Page 12
PAGE 6
May 31, 2016 ▪ ©Truven Health Analytics, an IBM Company ▪ www.truvenhealth.com
variation in health insurance would be challenging to implement. It also should be noted that
because wages currently vary by MSA and most of the cost components are multiplied by the
wages, the current framework pays disproportionately for various costs based on the wage
adjustment.
Primary Data Collection Results
Our primary data research yielded several robust sources of information. Consistent with the Navigant
Report, our search for benefit-related information (i.e., insurance, retirement, vacation time) within cost
components produced more credible sources than our search for information on non-benefit cost
categories. We were able to identify a number of credible data sources from the Internal Revenue
Service (IRS) and Bureau of Labor Statistics (BLS) and from data gathered from other state
methodologies for determining non-wage costs, among other sources.
In some cases, we felt that our primary data sources provided very clear findings that easily translated
into relevant results for our study. Other sources provided benchmarks to determine a reasonable range
of results to use to validate our survey findings. For example, we identified similar reports from
Arizona, Georgia, Maine, Oregon, and Virginia; however, these reports were identifying similar cost
components representing different services, primarily behavioral health. Therefore, we have
represented these findings as a reasonable benchmark for our survey results.
BLS provided a wealth of information for our study, but BLS findings are reported by industry
category or by geographic location, but not both. Therefore, we had to make some assumptions in
terms of which category of data provided a more accurate depiction of costs for the Minnesota HCBS.
In most cases, we believed that services within the same industry provided a better view at costs than
geography. For these categories, we applied a modifying factor to account for geographic changes
within the data. We believe the geographic factors provided better results for taxes and workers’
compensation, because tax rates are tied to geography rather than to industry.
The results of our primary data research are discussed within the Combined Recommendations by
Component section of the report. Appendix B details our primary source findings.
Provider Survey
The provider survey was a critical part of our study because it contributed insights on the specific costs
for providing the various HCBS offered in Minnesota from stakeholders who have detailed knowledge
about their specific costs. We developed our survey design process to maximize stakeholder
engagement and provider participation through a collaborative, inclusive, and transparent process. We
also used the stakeholder survey as a potential source for information that was not found in primary
data sources. We sought to give providers insight into the purpose and methods of our study and to
allow ample opportunity before and during the survey’s design to provide objective information
regarding their costs.
Page 13
PAGE 7
May 31, 2016 ▪ ©Truven Health Analytics, an IBM Company ▪ www.truvenhealth.com
Survey Design
Our top priorities in designing the survey were to capture all appropriate metrics related to provider
expenses of HCBS, maximize provider survey participation, and minimize bias in survey results. We
based the survey’s initial designs on extensive preliminary research activities outlined earlier in our
report, in addition to input from experts with the Minnesota DHS and key figures in the HCBS provider
community. We conducted two focus groups with a variety of HCBS providers and trade group
representatives to identify any potentially problematic parts of the survey and to address possible
deficiencies within the current framework. These conversations proved vital in informing the survey’s
design.
We developed survey questions that were concise and clear. Where appropriate, we designed the
survey to solicit exact dollar amounts for various costs and measures of total costs per category of non-
wage expense. We tested the survey with participants from the focus groups prior to full launch to
identify and refine any potential problem areas in the survey. During this review period, we made
numerous changes to the draft survey in direct response to stakeholder feedback.
After finalizing the survey and developing a comprehensive state-wide list of appropriate providers, we
released the survey to all eligible providers on January 19, 2016. The survey was administered via
SurveyMonkey®, an online survey tool. The Minnesota DHS contacted all HCBS providers in the
state through its central provider portal, MN-ITS, to solicit provider email addresses. Those providers
who submitted their email addresses were able to create a unique profile for their organization whereby
survey responses could be saved and ultimately submitted.
Survey Outreach and Technical Assistance
Our outreach and support of the survey covered several activities during survey development and
continued through the survey response period from January 19 to February 19, 2016. These activities
included the following:
Advisory Committee meeting. We discussed our initial survey plan at the November 19,
2015, Advisory Committee meeting, which included an open dialog about ideas to consider in
the survey as well as the best ways to communicate with participants to maximize participation.
Discussion involved provider outreach strategies and stakeholders’ key concerns with the
current framework.
Focus groups. On November 19–20, 2015, we conducted two focus group meetings with a
varied cross section of Minnesota HCBS providers to inform the provider survey development
process. We selected focus group participants to capture the breadth of provider types and
services across the state—specifically large and small, geographically diverse providers and
representative trade groups. Focus group participants provided input on which metrics should
be studied and how best to solicit information on those metrics through the survey. We
maintained an open dialog through email with focus group participants throughout the
development of our survey in order to provide ample opportunity for feedback. This included
Page 14
PAGE 8
May 31, 2016 ▪ ©Truven Health Analytics, an IBM Company ▪ www.truvenhealth.com
soliciting feedback on a draft survey from all 25 focus group participants.3 These participants
reviewed the draft survey and offered critical input. We tracked all feedback and incorporated
key insights and recommendations into the survey.
Technical assistance. To ensure that participants were well-informed and supported
throughout the survey response, we offered multiple forms of technical assistance.
o Survey webinar. On January 20, 2016, we hosted a webinar that provided an overview
of the study and explained how to gain access to, complete, and submit the survey. The
webinar was recorded and posted to the http://MN.gov/dhs website to be accessed
throughout the survey response period.
o Guidance document. We provided a guidance document that accompanied the survey
and offered a consolidated overview. This document allowed participants to gather
their responses without being logged into the survey.
o Mailbox/help desk. We established a dedicated, email-based helpdesk to answer
questions related to the survey. We received and answered over 220 inquiries
throughout the survey response period.
We tracked all conversations and emails with stakeholders to ensure that their concerns were reviewed
and addressed in our survey development.
Survey Results
At the survey’s conclusion, we compiled all response data for review. We applied a variety of
statistical calculations (average, median, standard deviation, and variance) to better understand the
distribution of responses received in our survey. We used wages as a benchmark for other costs to
capture the difference in size for a particular organization. Based on our distribution analysis on each
cost component, we removed outliers by applying maximum and minimum caps to determine the range
of credible responses.
We also performed analysis on what percentage of the entire Minnesota HCBS provider community
submitted responses to the survey. Despite significant outreach efforts to providers, the response rate
was not as strong as anticipated. Although 466 unique provider email addresses registered to receive
the survey, only 296 responses were received. Of these responses, many were duplicate, incomplete, or
abandoned surveys. The final number was 193 responses that could be included in our results.
We compared the tax identification numbers (TINs) for the valid responses with a database of all TINs
for providers of HCBS services in calendar year (CY) 2015 and their corresponding revenue. This
comparison gave us a better understanding of the representation of our survey responses. The results of
this analysis are captured below:
3 Truven Health received 148 comments from focus group participants through the draft survey feedback
solicitation. These comments were incorporated into the final survey.
Page 15
PAGE 9
May 31, 2016 ▪ ©Truven Health Analytics, an IBM Company ▪ www.truvenhealth.com
Out of a possible 1,321 TINs, 193 TINs were captured in our survey, representing 15 percent of
the total.
Out of a possible 2,939 possible provider ID’s, 492 were captured in our survey,4 representing
17 percent of the total.
These responses corresponded to $1.096 billion out of $3.281 billion of total Minnesota HCBS
paid claims during CY 2014-2015, or 33 percent of the total.
The survey response was not high enough to offer statistically valid results for geographic-based
recommendations. However, the survey results have been shown by service bucket for those
components whose rates currently vary by service bucket. Other factors, which are currently the same
across all service buckets have only been represented in aggregate. Providers with less than $250,000
in CY 2015 revenue were given a more simplified survey, which allowed costs to be reported in
aggregate but not by service category. Therefore, these responses only impact the aggregate results for
each cost component.
Combined Recommendations by Component
Our recommendations are derived from the analysis of our primary data sources and our provider
survey. In determining and comparing data quality, we had three key factors used to assess the data we
found: reliability, applicability, and consistency.
Reliability relates most closely to the confidence held in that particular data point. If a
particular data source is well established and respected with a rigorous methodology, we assess
its reliability highly.
Applicability requires that the data apply specifically to the component at hand, with
corresponding services and client populations. Toward that end, we have evaluated
demographic and geographic similarity in our state comparison analysis. For example, data
sources that relate directly to Minnesota Medicaid HCBS services would be considered most
applicable.
Consistency dictates that any source that deviates significantly from all other sources should be
given less weight, and that sources should be able to be validated by other available data.
Therefore, we view data that cannot be validated easily as less consistent.
The remainder of this section details the findings of our research by cost component. For each
component, we provide a definition of the cost component, and then we share the results of our primary
data research and provider survey. Because some recommendations have been made as a percentage of
wages or another denomination that may not match the current framework calculation, where
necessary, we provide a translation of the recommended results in light of its placement within the
framework. These translations will be made assuming that all other cost components stay at the current
4 Some TINs may have multiple provider IDs.
Page 16
PAGE 10
May 31, 2016 ▪ ©Truven Health Analytics, an IBM Company ▪ www.truvenhealth.com
level. If some of the factors are implemented, it is strongly advised that these translations be taken into
considerations in order to properly reflect the denomination of each recommended factor. Also, most of
our results and recommendations have been shown with 1 decimal point of precision, which we feel is
appropriate. In some cases within the primary research, greater precision was provided in the data,
which we have reflected in the report.
Supervision/Span of Control
Definition
This cost component captures the supervision cost of direct care staff, expressed as the ratio of supervisors to direct care staff.
Primary Data Results
This cost component deals with the direct ratio of care providers to their supervisors, so it is closely
tied to the exact services provided. For this reason, we feel that the survey data is a better source of
information for this component. We were unable to identify sources of information that provided
meaningful comparisons for this component. For comparison states, the Program Plan Support factor is
assumed to combine the Supervisor Span of Control and the Program Plan support in the costs. This is
consistent with the previous Navigant-provided combined rate.
Provider Survey Results
Supervision/span of control is calculated based on the supervisor count divided by the total employee
count (not including supervisors) to develop a supervisor to employee ratio. This is distinctly different
from the other factors developed because it is not based on direct care wages. Also, for this
calculation, part-time employees were assumed to count as 50 percent of a full-time equivalent (FTE),
and temporary employees were assumed to count as 25 percent of an FTE.
Because the supervision/span of control factor does not vary by service category, results were only
captured across all service categories. The survey findings for this category yielded a 12.8 percent ratio
of supervisors to direct care staff.
Recommendation
The current factor for this component is 11 percent, whereas our survey yielded a rate of 12.8 percent.
We recommend a rate of 12.8 percent for this component because it is a more recent representation of
provider experience than the current factor, although we believe that a factor in the range of 11 percent
to 12.8 percent would be reasonable to be used in the frameworks.
Vacation, Sick Leave, and Training
Definition
This component covers wages paid to staff while they are on vacation, on sick leave, or in training.
Page 17
PAGE 11
May 31, 2016 ▪ ©Truven Health Analytics, an IBM Company ▪ www.truvenhealth.com
Primary Data Results
We used the National Health Care and Social Assistance tables from BLS to develop the vacation and
sick leave factors. The BLS-provided factor of 10.9 percent applies to wages, after converting it from a
total compensation factor. Regional data are available for the West North Central Division (Iowa,
Kansas, Minnesota, Missouri, Nebraska, North Dakota, and South Dakota). However, these data
include all occupation and industry types. Instead, we elected to use industry-specific data for health
care and social assistance because they are more representative of actual costs of providing HCBS. This
industry rate has been adjusted to account for regional variation captured in BLS.
A training factor of 2.0 percent is the result of our primary research. This factor comes from BLS, and
has been adjusted to reflect a percentage of direct billable time, opposed to total time worked.
The total wage-based factor of 12.9 percent combines the BLS paid time off (PTO) rate of 10.9 percent
plus a training factor of 2.0 percent.
Provider Survey Results
Vacation, sick leave, and training resulted in an average factor of 10.6 percent of wages, which was
comprised of 8.0 percent of PTO and 2.6 percent training time.
Recommendation
Both the primary and survey results provided credible sources of information for the vacation, sick, and
training component, based on our stated criteria. We recommend using the survey factor of 10.6
percent of wages since it most closely represents the experience within MN HCBS, and the survey
results were strong.
Program Plan Support
Definition
Program Plan Support is defined as the direct service staff needed to provide support of the HCBS
service when not engaged in direct contact with clients (indirect time). Examples include, but are not
limited to the following:
Documentation
Direct staff preparation and service planning
Collateral contact related to direct service
Travel time when the client is not present
Primary Data Results
Although our comparison states provide a basis of comparison, they vary significantly and do not
accurately represent the HCBS services provided in Minnesota. Because this cost component is closely
Page 18
PAGE 12
May 31, 2016 ▪ ©Truven Health Analytics, an IBM Company ▪ www.truvenhealth.com
tied to the specific services provided in Minnesota, we feel that the survey is a better source of
information for this component.
Provider Survey Results and Recommendation
The Program Plan Support component values vary by service component since this is a time-based
factor intended to capture how much indirect time is spent performing activities not directly related to
the provision of care. In addition, the current rate frameworks and billing structures apply nuanced
calculations aimed at capturing some of this inherent variation. Therefore, the survey results for
Program Plan Support must be considered in the context of the service frameworks to which they
apply.
The current Day services frameworks include a staffing ratio adjustment factor which is intended to
account for indirect time, where more indirect time in aggregate is required to serve individuals with a
higher ratio of care recipients to direct care staff. Our survey results for Day services indicated 16
percent of direct care staff’s total work time is spent not directly interacting with recipients, but
performing indirect tasks such as documentation, preparation, service planning, and service
coordination. Much of this indirect service cost is already accounted for in the staffing ratios and within
the bundled daily billable unit. Since a considerable amount of this time is already accounted for, we
cannot recommend implementing a 16.0 percent factor, as this would over account for indirect time in
the framework. We recommend a time study to better understand how best to determine and apply an
appropriate Program Plan Support factor within the current Day framework.
Residential programming is currently reimbursed as a bundled service which provides a full daily rate.
The bundled daily rate incorporates all staffing hours provided in the home, which includes both the
direct care staff’s time spent directly with the individual and time spent performing indirect tasks. The
provider survey result for Residential services indicated 12.8 percent of direct care staff’s total work
time is spent not directly interacting with recipients, but performing indirect tasks such as
documentation, preparation, service planning, and service coordination. Again, we cannot recommend
use of this factor, since this time is already built into the current bundled rate.
For the Unit Based With and Without Programming services, Program Plan Support time is not built
into the structure of the current frameworks in the same way it is for Day and Residential Services. For
this reason, we are able to recommend their use. The Unit Based With Programming survey result was
15.5 percent, and the Unit Based Without Programming result was 7.0 percent. We recommend the use
of these factors, as they reflect how much indirect time is necessary for the provision of these services.
Taxes and Workers’ Compensation
Definition
Taxes includes state and federal rates including Federal Insurance Contributions Act (FICA), Federal
Unemployment Tax Authority (FUTA), and State Unemployment Tax Authority (SUTA). Costs for
workers compensation are also included in this component.
Page 19
PAGE 13
May 31, 2016 ▪ ©Truven Health Analytics, an IBM Company ▪ www.truvenhealth.com
Primary Data Results
The Taxes and Workers Compensation factor is composed of legally required federal and state benefits.
The combined result for our primary research is 11.06 percent. This includes federal and state taxes and
workers compensation costs, as outlined below.
Federal Taxes
Information for federal taxes was readily available from the IRS website and included subcomponents
for federal and state taxes. Federal tax information consists of FICA, Medicare tax withholding, and
FUTA. The combined federal tax rate result is 7.78 percent.
FICA incorporates a wage-based limit for Social Security tax of $118,500. However, because this
annual income is likely higher than that paid direct care providers, no adjustment was made to the
factor. The full 6.2 percent is indicated for use as a factor applied to wages.
For Medicare tax withholding, the standard 1.45 percent is suggested for use as a factor applied to
wages. There is no cap for Medicare taxes wages, and although an additional 0.9 percent is withheld
wages in excess of $200,000, this has not been included because the wage threshold reasonably
exceeds the anticipated direct care wages.
The FUTA tax of 0.13 percent is based on BLS West North Central rates5 and reflects the annual wage
base limit of $7,000. The standard rate is 6.0 percent, but most employers received a credit of 5.4
percent when their Form 940 (FUTA Tax Return) is filed. It has been assumed that the Form 940 has
been completed, and a net 0.60 percent applies. Also, an annual wage-base limit of $7,000 applies to
FUTA. Once employee year-to-date wages exceed $7,000, an employer stops paying FUTA for that
employee. This limit equates to $3.37 per hour and is assumed to be exceeded over the course of the
year. To adjust for the wage-base limit, the BLS factor of 0.13 percent is indicated.
It is important to note that both the FUTA and SUTA have limitations and are no longer collected once
a maximum employee wage threshold is reached in a given year. We used BLS data as a proxy for
applying this maximum-wage threshold. Any alternatives to including a flat dollar amount for this
threshold would not fit into the current framework method.
State Taxes
State tax information consists of SUTA and the Workforce Development Fund. The combined primary
source state rate result is 1.59 percent.
The state unemployment tax and workforce development fund includes an annual wage base limit of
$31,000 applies to SUTA. Based on the professions providing services, the Non-High Experience rate
of 1.49 percent for new employers is suggested. No additional reductions were applied based on the
annual wage base limit.
5 Average of Q1–Q4 2015 Federal Unemployment Tax Authority (FUTA) percentage of total compensation (0.10
percent) divided by wages percentage of total compensation (70.08 percent). (Bureau of Labor Statistics website.
Employer Costs for Employee Compensation: Historical Listing March 2004 – December 2015, Table 18. Health
Care and Social Assistance. http://www.bls.gov/ncs/ect/sp/ececqrtn.txt. Accessed March 28, 2016.)
Page 20
PAGE 14
May 31, 2016 ▪ ©Truven Health Analytics, an IBM Company ▪ www.truvenhealth.com
The Workforce Development Fund has an annual wage base limit of $31,000 (about $14.90 per hour)
and applies to the Minnesota Department of Employment and Economic Development (DEED)
Workforce Development Fund. The factor of 0.10 percent is indicated with additional reductions
applied based on the annual wage base limit.
Workers Compensation
Worker’s compensation rates vary based on the provider’s experience and will vary between providers.
BLS reported a wage-based factor for workers compensation in the West North Central Division of 1.69 percent.
Provider Survey Results
Because the taxes and workers’ compensation should not vary by service category, we captured results
across all service categories. The average wage-based taxes and workers compensation response was
11.4 percent.
Recommendation
We recommend using primary sources results of 11.06 percent in order to capture costs related to taxes
and workers compensation. For this particular survey response, there were a considerable number of
responses that were deemed outliers. However, the overall survey response was very close to the result
of our primary research, which bolstered our confidence in our recommendation. In addition, the
information sources gathered from our primary data were very strong and credible. In the current
framework model, Taxes and Workers Compensation are combined with Other Benefits to form
Employee Related Expenses, and will need to be combined in their application within the frameworks.
Other Benefits
Definition
Other benefits refers to other employer-provided benefits to include health insurance, short-term
disability insurance, dental insurance, retirement, vision, tuition reimbursement, life insurance, and
wellness programs. Other benefits may include additional benefits not included in this list.
Primary Data Results
For other benefits, primary data sources indicate a factor of 20.44 percent, which is a combination of
insurance, retirement and savings, and supplemental pay (such as bonus compensation) costs gathered
from BLS.6 These costs were averages taken from 2015 Q1–Q4 total compensation amounts, modified
to reflect the percentage of wages within total compensation. This modification more accurately
reflects the way that other benefits are captured within the current rate framework.
6 Bureau of Labor Statistics website. Employer Costs for Employee Compensation: Historical Listing March 2004 –
December 2015, Table 18. Health Care and Social Assistance. http://www.bls.gov/ncs/ect/sp/ececqrtn.txt. Accessed
March 28, 2016.
Page 21
PAGE 15
May 31, 2016 ▪ ©Truven Health Analytics, an IBM Company ▪ www.truvenhealth.com
These results indicate a significant increase over the current 12.04 percent. These results have been
captured in Table 3 below.
Table 3. Survey Results for Other Benefits
Other Benefits Source Factor, % of
Wages
Insurance BLS 12.57
Retirement and savings BLS 4.81
Supplemental pay BLS 3.06
Combined Result for Other Benefits 20.44
Abbreviation: BLS, Bureau of Labor Statistics
We also collected data showing geographic variation in health insurance costs from http://MNsure.org.
By taking averages of health insurance premiums at different age groups and metal coverage levels
(bronze, silver and gold), we compared the relative average premiums within nine coverage areas.
Table 4 shows the relative values of insurance premiums, using Area 1 as the benchmark within each
age and coverage level category.
Table 4. Average Relative Insurance Premiums by Age and Coverage Area on MNsure.org, as a
Percentage of Area 1 Premiums
Coverage Area 1 Area 2 Area 3 Area 4 Area 5 Area 6 Area 7 Area 8 Area 9
Age, years
25 Bronze 100 72 85 94 90 83 67 65 81
Silver 100 76 88 108 90 83 71 69 81
Gold 100 84 89 101 93 87 74 78 81
40 Bronze 100 72 85 93 90 83 67 65 81
Silver 100 65 88 96 90 84 71 69 81
Gold 100 84 88 101 93 86 74 77 81
60 Bronze 100 72 85 93 90 83 67 65 81
Silver 100 77 88 96 90 84 71 69 81
Gold 100 84 88 101 93 86 74 77 81
Family of Four
Bronze 100 72 85 93 90 83 66 65 81
Silver 100 74 95 103 97 90 76 74 86
Gold 100 84 88 101 93 86 74 77 81
Average by area 100 76 88 99 92 85 71 71 81
Although the MNsure.org rates offer a credible source of information on variation across the state, one
challenge is that the nine areas defined within MNsure.org rates do not map cleanly to the MSA
Page 22
PAGE 16
May 31, 2016 ▪ ©Truven Health Analytics, an IBM Company ▪ www.truvenhealth.com
structure. For example, some MSAs are represented by as many as four different MNsure.org areas. It
becomes challenging to determine an appropriate way to represent the variation in cost, given that
MSAs are currently used to apply variation to wage costs in the frameworks. In addition, the
Minnesota DHS should consider the administrative burden of applying multiple geographic rate
modifications and the cumulative effect they would have for a particular provider.
Of the primary sources available, the most reliable and applicable source indicates a value of 20.44
percent, reflected as a percentage of base wages. This percentage is the BLS national industry-specific
amount for Insurance, Retirement and Savings, and the new category of Supplemental Pay costs to
health care and social assistance employers. This factor is significantly different from the current
factor of 12.04 percent.
Provider Survey Results
Given that other benefits should not vary by service category, results were only captured across all
service categories. The survey response indicated a wage-based result of 13.1 percent of wages for
other benefits.
Recommendation
Our primary research result of 20.44 percent was significantly higher than the survey result of 13.1
percent for other benefits. Since the 20.44 percent recommendation comes from a credible source of
information, BLS, we believe the survey results indicate that many providers are either not providing
other benefits to their employees, or these benefits are not given at the same level as the national
benchmark population reported through BLS. For these reasons, we recommend the survey result of
13.1 percent of base wages be applied for other benefits. This factor, as a percent of wages, does not
need to be adjusted to fit within the current framework methodology to account, which will be
discussed below. Also, while we were able to find information indicating geographic variation in health
insurance premiums throughout Minnesota, we believe that applying a regional adjustment factor
should not be introduced.
Since Taxes and Workers Compensation and Other Benefits are combined in the framework to form
Employee Related Expenses, we recommend that they be considered combined in our recommendation
in order to properly reflect these factors within the framework. Our Employee Related Expenses
recommendation, as a percent of wages, is 24.16 percent, which is a combination of 11.06 percent for
Taxes and Workers Compensation plus 13.1 percent for Other Benefits. While Employee Related
Expenses is applied after the Program Plan Support factor, it is unnecessary to make any modifications
since Program Plan Support accounts for additional support time provided by direct care workers which
are covered within the wages these employees are paid.
Page 23
PAGE 17
May 31, 2016 ▪ ©Truven Health Analytics, an IBM Company ▪ www.truvenhealth.com
Client Program and Supports
Definition
Client Program and Supports is defined as the provision of the participant’s access to the community or
care in their home. State plan or other available waiver services must be accessed first, and those
services must be billed separately. Examples of allowable costs vary by service, and may include, but
are not limited to the following:
Supplies and equipment that are not available through Medicaid state plan or other waiver
services
Participation costs for staff
Reinforcers as defined in the participant’s support plan
Cost to access services
Primary Data Results
Based on the definition of this cost component, there were no directly comparable sources of data. The
survey results should be used for a recommendation.
Provider Survey Results
The results by for client programming and supports, by service component, are shown in Table 5.
Table 5. Results for Client Program and Supports
Component Day Residential Unit Based With
Programming
Unit Based Without
Programming
All Service Categories
Client Program and Supports, % of wages
9.2 5.2 5.8 2.9 7.1
Recommendation
Before making a recommendation for this cost component, we must take into consideration the
differences in the framework application of programming plan support and the wage-based results from
the survey. Since Employee Related Expenses are applied within the frameworks after wages, we must
restate our Client Program and Supports recommendation to reflect this order of operations. To make
this conversion, our wage-based results in Table 5 must be divided by (1 + Employee Related
Expenses) to be stated as a percent of wages and Employee Related Expenses. Since this cost
component also varies by service category, we have demonstrated the changes necessary to our wage-
based results below in Table 6, using the current Employee Related Expenses factor of 23.6 percent.
Page 24
PAGE 18
May 31, 2016 ▪ ©Truven Health Analytics, an IBM Company ▪ www.truvenhealth.com
Table 6. Recommendations for Client Program and Supports
Component Day Residential Unit Based With
Programming
Unit Based Without
Programming
All Service Categories
Client Program and Supports, % of wages and Employee Related Expenses
7.4 4.2 4.7 2.3 5.7
If a new Employee Related Expenses factor is used, this calculation will need to be reconsidered by
dividing the wage-based recommendation by the updated Employee Related Expenses factor.
Also, the current Residential framework uses a flat annual dollar amount for the Client Program and
Supports factor. From our analysis, we believe our recommended value, as a percent of Employee
Related Expenses, is in line with the current framework value.
Standard G&A
Definition
This category includes general office and administrative overhead business costs including liability and
malpractice insurance, administrative salaries for finance, accounting and auditors. This also includes
office supplies, postage and any administrative office space necessary.
Primary Data Results
Our primary research yielded Standard G&A results between 10 percent and 20 percent of total service
costs. Much of the variation in this category comes from how other states have defined the category
and which costs are included. We have observed that costs within Standard G&A and Program-Related
Expenses often are not delineated consistently from state to state. The current rate of 13.25 percent of
total costs reasonably falls within the range observed in other states; however, we suggest using the
results from the survey to provide a more refined recommendation.
Provider Survey Results
Standard G&A has an average survey result of 23.0 as a percent of wages, across all service buckets.
Both Standard G&A and Program Related Expenses currently are represented as a percentage of
wages, and the denominator will need to be restated to align with framework calculation. It also
appears that some costs were stated for an entire organization (e.g., administrator salaries) and are not
allocated based on the percentage of HCBS services that the organization provides, which would
suggest that some survey responses for this component may include extraneous costs. HCBS should
not bear the full administrative cost of an organization offering services besides HCBS.
Page 25
PAGE 19
May 31, 2016 ▪ ©Truven Health Analytics, an IBM Company ▪ www.truvenhealth.com
Recommendation
Since our primary research was more useful in determining an overall range of possible factors, we
recommend using the survey results to form the basis of our recommendation. To restate one
complexity, the current Standard G&A factor is represented as a percent of total costs, which is
consistent with the range provided through our primary research of 10 – 20 percent. Our survey results
however, have been calculated based as a percent of wages. Therefore, the survey result must be
translated to fit into the current framework, as 23.0 percent will significantly overstate Standard G&A
costs. Since Standard G&A, Program Related Expenses and Utilization and Absence are combined
before being applied in the rate frameworks, the translation calculation of this factor is described in the
Program-Related Expenses section of this report.
Utilization and Absence
Definition
This factor accounts for costs associated with absences of the care recipient. It approximates providers'
fixed costs when a recipient is not able to participate in a planned service. This cost covers both
provider vacancy and recipient absences.
Primary Data Results
Utilization and absence factors found in other states range from 2 percent to 6 percent, however, these
factors primarily account for absence, not utilization. Our findings suggest that a factor within the
range of 2 to 6 percent of wages is reasonable for Utilization and Absence, but believe that the survey
results provide better results due to their inclusion of utilization in the results.
Provider Survey Results
The results for Utilization and Absence were captured by service bucket and provided as a percent of
wages, are shown in Table 7, below.
Table 9. Survey Results for Utilization and Absence
Component Day Residential Unit Based With
Programming
Unit Based Without
Programming
All Service Categories
Utilization and Absence, % of wages
3.1 2.2 7.5 3.9 3.9
Recommendation
We recommend that service bucket factors in Table 7 be used for utilization and absence, once they are
translated into the current framework which is done in the Program Related Support section.
Page 26
PAGE 20
May 31, 2016 ▪ ©Truven Health Analytics, an IBM Company ▪ www.truvenhealth.com
Program Related Support
Definition
This component captures overhead costs such as technology software and hardware,
telecommunications, and billing infrastructure. In some cases, this component is referred to as Program
G&A. Also, in the frameworks, Program Related Expenses is a category which includes Program
Related Support, Standard G&A and Utilization and Absence.
Primary Data Results
Comparable Program-Related Expenses in other state behavioral health programs have been provided
as a flat dollar amount per member per day. When converting this rate to a percentage of total service
costs or percentage of wages, there is a wide range of comparison rates. The broad definition of
Program-Related Expenses also accounts for the large variance in figures found in other states. For
these reasons, we cannot strongly suggest a factor based on these primary data sources.
Provider Survey Results
Our survey captured Program-Related Expenses by service buckets. These results have been provided
below in Table 8, as a percent of wages.
Table 8. Survey Results for Program Related Support
Component Day Residential Unit Based With
Programming
Unit Based Without
Programming
All Service Categories
Program Related Support, % of wages
5.4 4.4 5.8 2.9 5.9
Recommendation
We believe the survey results in Table 8 should be used to form the basis of our recommended. These
results are given as a percent of wages, and will need to be translated to fit into the framework models.
Since Program Related Support is applied at the same point in the rate frameworks as Standard G&A
and Utilization and Absence, they need to be considered concurrently. This section will cover the
translation for these 3 cost components, and the survey results will be reported within the respective
sections of this report. These 3 components combined will be referred to as Program Related Expenses.
The first step in converting this factor is to aggregate our wage based recommendations to form a total
Program Related Expenses factor, by service bucket. This is displayed below in Table 9.
Page 27
PAGE 21
May 31, 2016 ▪ ©Truven Health Analytics, an IBM Company ▪ www.truvenhealth.com
Table 9. Combined results for Program Related Expenses, as a percent of wages
Component Day Residential Unit Based With
Programming
Unit Based Without
Programming
All Service Categories
Standard G&A, % of wages
23.0 23.0 23.0 23.0 23.0
Utilization and Absence, % of wages
3.1 2.2 7.5 3.9 3.9
Program Related Support, % of wages
5.4 4.4 5.8 2.9 5.9
Combined Program Related Expenses, % of wages
31.5 29.6 36.3 29.8 32.8
Due to the current methodology in the frameworks, the following formula needs to be applied to the
wage based Program Related Expenses (shown in Table 9).
Since our recommended costs vary by bucket, we have calculated recommended Program Related
Expenses as a percent of total cost using one model for each service bucket, as follows:
Day: Adult Day Care Services – Daily Training and Habilitation (DT&H)
Residential: Supported Living Services
Unit-based with Programming – Independent Living Skills
PRETotal Cost = 1_____________________
{[(1+ERE) x (1+ CPS) + FACWage] / PREWage} + 1
Formula Key
PRETotal Cost = Program Related Expenses as a percent of Total Cost (to match framework calculation)
PREWage = Program Related Expenses as a percent of wages (from Table 11)
ERE = Employee Related Expenses
CPS = Client Program and Supports
FACWage = Facility Costs divided by direct wages (only applicable for Day Services)
Note: For Residential Foster Care, CPS is a flat annual amount of $2179. This should be converted to a daily
amount by dividing by 365, then applied as a percent of wages, as follows:
PRETotal Cost = 1_____________________
{[(1+ERE) x + (CPSDaily/Wages)] / PREWage} + 1
Page 28
PAGE 22
May 31, 2016 ▪ ©Truven Health Analytics, an IBM Company ▪ www.truvenhealth.com
Unit-based without Programming – Personal Support/Adult Companion
By applying our formula above with other inputs from the current factors, by corresponding service
framework model, Table 10 includes our combined Program Related Expenses, expressed as a percent
of the total cost.
Table 10. Recommendations for Program Related Expenses, as a percent of total cost
Component Day Residential Unit Based With
Programming
Unit Based Without
Programming
All Service Categories*
Program Related Expenses, % of total cost
17.2 18.8 21.3 18.2 19.6
*This figure was calculated using the same inputs as the Unit-based framework models.
Facility
Definition
This component covers the cost of facility usage in providing Day services.
Primary Data Results
The Minnesota DHS currently uses a rate of $19.30 per week, per member for facility use, only applied
to Day services. The most prevalent comparison for facility use in other states is reflected as an
amount per direct hour of care, which suggest a rate of $0.80 per direct care hour. This rate has a
different denomination but fits most closely with the present Minnesota framework for HCBS. Also,
many available resources suggest a given square-footage and cost per square-foot, which are not
considered within the current Minnesota rate framework.
Provider Survey Results
Facility use currently is only applied within the day services framework. The survey results indicate
that facilities cost 5.9% of wages within day services.
Recommendation
We recommend Minnesota implement a Facility factor of $.80 per direct care hour, or an equivalent
daily or weekly rate.
Transportation
Definition
In Residential services, transportation covers the cost of the vehicle. In Day services, DT&H
transportation covers the cost of the vehicle, mileage, and time.
Page 29
PAGE 23
May 31, 2016 ▪ ©Truven Health Analytics, an IBM Company ▪ www.truvenhealth.com
Primary Data Results
We reviewed the way that transportation costs are captured across a variety of states to offer insights on
the optimal methodology to be applied in Minnesota. Developing a methodology that adequately
captures transportation costs is challenging because of the variety of ways in which transportation
vehicles are used to provide HCBS and the different types of vehicles required for different services.
Although the types of vehicles and their use vary significantly, transportation costs generally fall into
three different categories: purchase cost, variable usage cost (based on mileage), and maintenance
costs. In some instances, variable usage costs include costs associated with ongoing vehicle
maintenance. We believe that a rate-setting methodology should reimburse costs for these categories.
Some other states have captured transportation costs by applying IRS Standard Mileage rates. Two
drawbacks to using this approach are that it may (1) incentivize discretionary transportation and (2)
incur more costs for the state. In addition, mileage reimbursements ideally should vary by vehicle type.
Standard vehicles have greater fuel efficiency and lower maintenance costs than do specialized
vehicles.
For Day services, tiered transportation rates are used based upon the following criteria: (1) the use and
requirement of a lift, (2) whether the vehicle is shared, and (3) the mileage driven. We suggest the
individual tiered rates have an average mileage rate that is equal to or above the Minnesota
Management & Budget rate of $0.54 per mile, where personal vehicles are used and a lift is not
required. This will cover the costs associated with vehicle and travel. The Minnesota Management
suggested rate is based on the standard IRS rates. To ensure that rates adequately reflect the fluctuating
nature of vehicle related transportation costs, it is suggested that an annual review of the updated
Minnesota Management & Budget rate is performed and assessed if rate adjustments are warranted. If
Minnesota Management & Budget has not released an update rate at the time of review, the IRS
Standard mileage rates would be a reasonable substitution for comparison. This combined method with
rates above the state mileage rate helps to address concerns about mileage and time required for
extended driving distances for services provided in rural or remote areas.
For Residential services, we suggest a flat annual amount for residential and adapted vehicles for the
residential population, with additional mileage-based reimbursement to account for number of hours
and the distance traveled. Other state Medicaid agencies frequently use mileage reimbursement models,
and these most commonly take into consideration the greater demands in vehicles for individuals
receiving similar services.
Provider Survey Results
Through the survey, we gleaned some observations that may be useful to MN DHS for consideration in
determining how to reimburse providers for their transportation costs. One of our questions inquired
about the mileage reimbursement rate providers pay staff for transportation using their own vehicles.
While some providers reimbursed at lower mileage rates, the median reimbursement level was $0.54
per mile. In addition, our survey captured both the cost of new vehicles as well as maintenance costs.
Of all costs reported, maintenance cost 80.1 percent, and the remaining 19.9 percent was spent on new
Page 30
PAGE 24
May 31, 2016 ▪ ©Truven Health Analytics, an IBM Company ▪ www.truvenhealth.com
vehicles. Based on individual responses, the cost to purchase a vehicle vary greatly depending on the
size, function and type of vehicle.
We also gathered data regarding the types of vehicles used by providers, at the service level. Table 11
below shows the counts of vehicles with and without lifts, for those who responded that they provided
vehicles for use. Survey responses were not captured for Residential since they are currently
reimbursed as a flat rate, regardless of vehicle type.
Table 11. Survey counts for vehicle type by service category
Component Day Unit Based With
Programming
Unit Based Without Programming
Vehicles with lifts 45 12 22
Vehicles without lifts 15 23 18
Total vehicles 60 36 40
Recommendation
The current framework does not appear to adequately differentiate for the different types of
transportation required and the vehicles used in providing HCBS. From the provider survey, we have
learned that the transportation costs vary significantly based on the type of vehicle used and the nature
of the transportation. Based upon our research and provider survey, we cannot make specific
recommendations to update the current framework values.
Caveats, Limitations, and Additional Considerations
The following caveats, limitations and additional considerations apply to this study and have been
addressed below.
Unknown Future Changes in Cost
We provide recommendations for the rate-setting framework that reflects non-wage costs as they
currently are, but future changes in HCBS costs may make the current framework inaccurate over time.
This study is contemporary and descriptive in scope and not prospective or predictive. We recommend
that a similar study be conducted every 3–5 years to maintain a current perspective on costs.
Variation by Other Factors
Our intent was to focus our analysis on all non-wage cost components that we identified. Additionally,
we examined these cost components on the basis of service bucket, provider size, and geography,
because those are the categories that we identified as the principle drivers of variation among HCBS
providers throughout Minnesota, as confirmed by previous research on this topic. It is possible that we
overlooked other factors that are have a substantial influence on cost variance. However, throughout
our research process and our consultation with stakeholders, we confirmed that the cost drivers we
Page 31
PAGE 25
May 31, 2016 ▪ ©Truven Health Analytics, an IBM Company ▪ www.truvenhealth.com
chose are valid and we believe that we did not miss other potential drivers. This concern was
addressed specifically during our focus group sessions and was corroborated by all available cost
reports.
Provider Reporting of Costs
Although the survey captured costs from some providers, there is potential for significant improvement
in the accurate representation of the nuances in costs across all HCBS providers. In the future,
Minnesota may want to consider a reporting mechanism to track accurate costs. This would provide
Minnesota with a breakdown of all costs for all providers and would allow the Minnesota DHS to
discern how costs vary by service type, provider size, and geography.
Additional Considerations
During the course of our research, we developed some observations that Minnesota DHS may want to
take into consideration:
Future changes to frameworks. Where possible, the recommendations in this report were
made in light of the order of operations applied in the current rating framework. If the rating
methodology were to change, the recommendations in this report likely would not be valid.
Capacity. We recognize that many facilities or providers do not always operate at full
capacity, and therefore some costs are not reimbursed. In our survey, several participants
commented that capacity issues presented a significant challenge to collecting adequate revenue
to cover expenses. This study was designed specifically to ascertain how best to reimburse
providers for the costs incurred to provide HCBS. However, some consideration should be
given to providers who are not able to operate at capacity, but provide valuable services.
Particularly providers in remote locations, this may be true as they play a critical role in
providing access to populations in remote areas, but may not be able to provide the volume of
services to generate adequate revenue.
Inflation. Although base wages were not addressed in this study, because wages serve as the
basis for cost reimbursements, a wage inflation factor should be considered periodically in
order to keep reimbursements in line with cost of living adjustments and general inflation.
Transportation Costs. Our research and provider survey offered several useful insights into
how to improve the framework structure to accommodate transportation costs. However, we
believe a separate study should be pursued in order to better capture the breadth of
transportation requirements and their respective costs to provide HCBS.
Startup costs for new care recipients. During our focus group with providers, there was
prominent discussion of the additional resources required to onboard new care recipients, which
are not currently accounted for in a discreet manner. Furthermore, some organizations with
greater administrative resources are more equipped to efficiently handle these responsibilities.
This may be an area of further investigation for MN DHS.
Page 32
PAGE 26
May 31, 2016 ▪ ©Truven Health Analytics, an IBM Company ▪ www.truvenhealth.com
Provider audit of survey findings. The survey aims to collect accurate information regarding
provider costs; however, by nature, these costs are self-reported and may contain inherent error.
We recommend a periodic audit of provider costs to validate that the submitted survey results
are in line with actual costs, and that costs are being attributed appropriately to account for
HCBS. We recommend this audit be done for cost components within the current framework.
Time study for Program Plan Support. As described above in the Program Plan Support
section, there is considerable indirect time applied through the staffing ratio adjustments within
the frameworks (particularly for Day and Residential services). It is unknown how these
staffing ratio factors were determined, and how the indirect time is attributed within the
adjustment factors. We recommend a time study to better understand how to appropriately
account for the indirect time within each of the service bucket frameworks.
Page 33
PAGE 27
May 31, 2016 ▪ ©Truven Health Analytics, an IBM Company ▪ www.truvenhealth.com
Appendices
Appendix A – Survey Guidance Document
Appendix B – Primary Data Sources
Page 34
PAGE 28
May 31, 2016 ▪ ©Truven Health Analytics, an IBM Company ▪ www.truvenhealth.com
Appendix A. Survey Guidance Document
Please note that this document originally was distributed to survey participants as a Microsoft® Excel
file, with an overview and attending workbook tabs for each of the two categories of provider revenue
size.
Overview
This guidance document is intended to assist providers gathering data sought in the Home and
Community Based Services (HCBS) Provider Survey. In many ways, this document mimics the survey
in a compressed format for convenience. In the guidance document, each topic has been listed along
with the details that the survey will capture. The guidance document can be used as a workbook that
will assist all participants in collecting and organizing the data before entering responses in the actual
survey.
The document has been separated into two sections: organizations with expenses above $250,000
and organizations with expenses below $250,000. While working within the attached document,
each organization will want to use the tab appropriate to their size.
The guidance document also gives providers more information on the level of detail that the survey
will require. The document includes a series of checkboxes that indicate how each service type will be
grouped for each question. For example, the first question in the Accounting I section seeks to capture
the number of individuals covered by Minnesota Medicaid Waiver programs; based on the checkboxes
to the left of the question, the survey will request that information to be separated in the respective
service “buckets” (e.g., Day, Residential, All Services). The option that indicates “All Services” aims
to capture the total for topics where a provider cannot break out responses by service bucket. Ideally,
all answers will be related specifically to HBCS services for Minnesota Medicaid. If a provider agency
is unable to provide the level of detail requested, they should provide information related to all HBCS,
regardless of payer.
Page 35
PAGE 29
May 31, 2016 ▪ ©Truven Health Analytics, an IBM Company ▪ www.truvenhealth.com
Above $250,000
Question #
Question Day Residential Unit Based w/ Programming
Unit Based w/o Programming
All
1 Provider Agency Name X
2
Provider Agency Tax ID Number. If one does not exist, provide your Provider ID(s) recognized by the Minnesota Medicaid program
X
3 Central Office Location X
4
In calendar year 2015, what percentage of all your organization's HCBS services were administered under the Minnesota Medicaid program?
X
5
Please indicate whether you are able to break out values for HCBS services paid by only the Minnesota Medicaid Program, or if you are only able to report for HCBS services covered by all payers.
X
6 In calendar year 2015, were your organization’s expenses above or below $250,000?
X
HCBS Services Provided
7 Please provide all HCBS that your organization provides under Minnesota Medicaid.
X X X X
8 What specific HCBS Minnesota Medicaid services do you currently provide?
X X X X X
County Selection
9 In what Minnesota counties do you administer HCBS services to individuals?
X X X X X
Accounting I
10
How many individuals covered by Minnesota Medicaid waiver programs did you provide services to under each of the service types?
X X X X X
11
In calendar year 2015, what was your organization's revenue provided for all HCBS services from all payers?
X X X X X
12
How many individuals does your organization currently employ full time, meaning for at least 30 hours each week?
X X X X X
Page 36
PAGE 30
May 31, 2016 ▪ ©Truven Health Analytics, an IBM Company ▪ www.truvenhealth.com
Above $250,000
Question #
Question Day Residential Unit Based w/ Programming
Unit Based w/o Programming
All
13
How many individuals does your organization currently employ part time, meaning 29 hours or less per week, or by contract?
X X X X X
14
How many individuals does your organization currently employ on a temporary basis, where the length of the employee's time is limited to a specific period of time based on your organization's employment needs?
X X X X X
15
If the above questions are too specific, how many different individuals does your organization currently employ in total?
X X X X X
Accounting II
16
For HCBS services provided in calendar year 2015, how many of each of the following kinds of service units has your organization provided to recipients of HCBS care under Minnesota Medicaid waiver programs?
X X X X X
17
What were your organization’s total expenses associated with the provision of HCBS care to individuals under Minnesota Medicaid waiver programs in calendar year 2015?
X X X X X
18
What were your organization's total wage expenses for the direct provision of HCBS care to individuals in calendar year 2015?
X X X X X
Employee Training
19
What were your organization’s expenses associated with the provision of employee training for direct care staff? This includes the cost of training materials and other fees accrued in providing employee training. Please do not include employee time spent in training.
X X X X X
20
What were your organization's expenses related to the training time of your direct care staff? Please do not include time spent by other employees needed to cover for employees in training. Include only wages for employees in training.
X X X X X
Page 37
PAGE 31
May 31, 2016 ▪ ©Truven Health Analytics, an IBM Company ▪ www.truvenhealth.com
Above $250,000
Question #
Question Day Residential Unit Based w/ Programming
Unit Based w/o Programming
All
21 Of that employee training, what percentage is legally mandated by the state of Minnesota?
X X X X X
22
Of that employee training, what percentage do you estimate is elected upon by your organization to provide the highest quality care to your patients?
X X X X X
23
What types of voluntary additional training are being provided to direct care employees? Please do not include any training that is mandated by the state of Minnesota or is listed in the questions above.
X
24
For HCBS services in calendar year 2015, of the wages paid to direct care staff, what dollar amount was for paid time off?
Please sum all wages paid by your organization to employees for time taken under your Paid Time Off policy.
X X X X X
Supporting Client Programs
25
For HCBS services in calendar year 2015, what were your organization’s expenses associated with providing participants access to the community or care in their home.
X X X X X
26
Please provide holistic examples of services your organization provides related to providing participants access to the community or care in their home.
X X X X X
Administration Costs
27
Administration costs
This includes liability/malpractice insurance, administrative salaries for finance, accounting, and auditors, all office supplies including postage, as well as any administrative office space.
X X X X X
28
Service support expenses
This includes overhead costs to support HCBS service such as technology software and hardware, telecommunications, billing, and human resources and recruiting.
X X X X X
Page 38
PAGE 32
May 31, 2016 ▪ ©Truven Health Analytics, an IBM Company ▪ www.truvenhealth.com
Above $250,000
Question #
Question Day Residential Unit Based w/ Programming
Unit Based w/o Programming
All
Day: Facility Use
29
For HCBS Day services in calendar year 2015, what were your organization’s expenses associated with Facility Use?
This includes only building mortgage or rent, utilities, maintenance and grounds keeping, depreciation (building/equipment and fixtures), interest on mortgage/loans, property tax, and facility insurance.
X
30
For HCBS Day services in calendar year 2015, what were your organization’s expenses associated with the mortgage, rent, interest on mortgage loans, and property taxes for buildings used in HCBS day service delivery?
X
31
For HCBS Day services in calendar year 2015, what were your organization’s expenses associated with facility insurance for buildings used in HCBS day service delivery?
X
32
For HCBS Day services in calendar year 2015, what were your organization’s expenses associated with utilities for buildings used in HCBS day service delivery?
X
33
For HCBS Day services in calendar year 2015, what were your organization’s expenses associated with maintenance and grounds keeping for buildings used in HCBS day service delivery?
X
Transportation
34
How many miles do your staff typically travel round trip to the service recipient per service appointment requiring staff travel (recipient is not in the vehicle)?
X X X X
35
How many miles do your staff typically travel as a part of the service (recipient is in the vehicle)?
X X X X
Page 39
PAGE 33
May 31, 2016 ▪ ©Truven Health Analytics, an IBM Company ▪ www.truvenhealth.com
Above $250,000
Question #
Question Day Residential Unit Based w/ Programming
Unit Based w/o Programming
All
36
What percentage of your overall transportation mileage typically goes unutilized because of scheduling issues such as cancelled appointments?
X X X X
37
In calendar year 2015, how much did it cost your organization to maintain its current transportation resources, including car insurance, repairs, and other maintenance?
X X X X
38
In calendar year 2015, how much did it cost your organization to acquire new vehicles to replace aging ones?
X X X X
39
Does your organization provide vehicles to employees for use related to the provision of HCBS services?
X X X X
40
If your organization has a calculation for mileage expenses used as a rate to reimburse employees, please provide it; that is, how much money in dollars and cents do you calculate for each mile of transportation costs?
X X X X
Care Maintenance
41
Please provide your organization’s wage expenses associated with time maintaining paperwork and other administrative tasks necessary for an individual receiving HCBS care for a period of 3 months.
X X X X
42 Please provide your organization’s startup costs for a new care recipient.
X X X X
43
What are the minimum amount of weekly units for which a care recipient would need care to make their care financially viable to your organization?
X X X X
44
For HCBS services in calendar year 2015, what were your organization’s expenses associated with supervisor wages? This does not include the cost of provision of direct care by supervisors, which should instead be reported under the questions related to direct care.
X X X X X
Page 40
PAGE 34
May 31, 2016 ▪ ©Truven Health Analytics, an IBM Company ▪ www.truvenhealth.com
Above $250,000
Question #
Question Day Residential Unit Based w/ Programming
Unit Based w/o Programming
All
45 How many supervisor full-time equivalents (FTEs) do you employ?
X X X X X
46
What is the average amount of time one of your supervisors spends per day providing direct care to service recipients?
X X X X X
Utilization and Absence
47
For Unit-Based Services Only: What were your organization’s expenses associated with wages for staff time scheduled to provide HCBS services that are declined due to recipient refusal or cancellation?
X X
48
For Unit-Based and Day Services Only: How many of your scheduled HCBS units were not provided because of recipient refusal or cancellation?
X X X
49
For Residential Services only, Please provide your organization’s expenses associated with bed vacancy/physical occupancy rate in calendar year 2015. This is the average percentage of beds and otherwise available physical space filled or utilized by individuals.
X
50
For Residential Services only: What percentage of your authorized HCBS units were unable to be billed because a service recipient was away from the home?
X
Residential: Remote Staffing
51
For residential facilities only: Does your agency utilize remote staffing technology for the purpose of providing oversight, monitoring, and supervision of an individual’s health and safety (not monitoring staff)?
X
52 If yes, in calendar year 2015, what were your total expenses for remote staffing?
X
53 How many service recipients utilized remote staffing?
X
54 How many average hours per day was remote staffing utilized?
X
Page 41
PAGE 35
May 31, 2016 ▪ ©Truven Health Analytics, an IBM Company ▪ www.truvenhealth.com
Above $250,000
Question #
Question Day Residential Unit Based w/ Programming
Unit Based w/o Programming
All
55 Does your agency employ an outside vendor to provide remote staffing?
X
56 What is the cost to your agency per hour for the use of remote staffing?
X
Direct Care Staff Time
57 What percentage is spent directly with the service recipient (i.e., is "billable")?
X X X X
58 What percentage is spent doing documentation for the service recipient?
X X X X
59
What percentage is spent doing preparation, service planning, and coordinating with others relating to the service recipient?
X X X X
60 What percentage is spent in travel time when the service recipient is not present?
X X X X
61
On average, what percentage of recipients’ scheduled services do not occur because the individual is unexpectedly unable or unwilling to attend your program?
X X X
62
How many employees involved in the care of HCBS services are currently enrolled in your organization’s employer-sponsored medical benefits?
To prevent double-counting, please include only those employees enrolled in health benefits and do not additionally include those of your employees enrolled in dental or vision insurance programs through your organization.
X
63
Health benefits
This includes medical, dental, and vision insurance, coverage for medication, all health spending accounts for your employees and their dependents, Employee Assistance Program (EAP), and wellness programs.
Please do not include any employee contributions.
X
Page 42
PAGE 36
May 31, 2016 ▪ ©Truven Health Analytics, an IBM Company ▪ www.truvenhealth.com
Above $250,000
Question #
Question Day Residential Unit Based w/ Programming
Unit Based w/o Programming
All
64
Employee retirement packages
Examples include 401(k)s, Roth IRA matching funds, service fees, or any pension funds.
Please do not include bonuses, wages, or employee contributions.
X
65
Bonuses
This includes any nonwage compensation given to employees as a bonus related to annual performance reviews, holidays, and special recognition bonuses.
X
66
Miscellaneous employee benefits
This includes childcare, short-term disability, food provided to staff, wellness plans, gym facilities, tuition reimbursement, or other similar allowable expenses.
Please do not include employee contributions.
X
67
Worker’s compensation
This includes worker’s compensation insurance and actual payouts related to worker’s compensation.
Please do not include employee contributions.
X
68
Wage taxes
This includes all federal, state, and local wage taxes.
Please do not include employee contributions.
X
Page 43
PAGE 37
May 31, 2016 ▪ ©Truven Health Analytics, an IBM Company ▪ www.truvenhealth.com
Below $250,000
Question #
Question Day Residential Unit Based w/ Programming
Unit Based w/o Programming
All
1 Provider Agency Name X
2
Provider Agency Tax ID Number. If one does not exist, provide your Provider ID(s) recognized by the Minnesota Medicaid program
X
3 Central Office Location X
4
In calendar year 2015, what percentage of all your organization's HCBS services were administered under the Minnesota Medicaid program?
X
5
Please indicate whether you are able to break out values for HCBS services paid for by only the Minnesota Medicaid Program, or if you are only able to report for HCBS services covered by all payers.
X
6 In calendar year 2015, were your organization’s expenses above or below $250,000?
X
HCBS Services Provided
7 Please provide all HCBS that your organization provides under Minnesota Medicaid.
X X X X
8 What specific HCBS Minnesota Medicaid services do you currently provide?
X X X X
Accounting
9
Please provide an estimate for the percentage of services your organization provides under each of the following four service buckets associated with the provision of HCBS care to individuals under the Minnesota Medicaid program in calendar year 2015. Note: values should add to 100.
X X X X
10 What were your organization's expenses in calendar year 2015?
X
11
How many individuals covered by Minnesota Medicaid waiver programs did you provide HCBS services to in calendar year 2015?
X
12 How many individuals does your organization currently employ full time, meaning for at least 30
X
Page 44
PAGE 38
May 31, 2016 ▪ ©Truven Health Analytics, an IBM Company ▪ www.truvenhealth.com
Below $250,000
Question #
Question Day Residential Unit Based w/ Programming
Unit Based w/o Programming
All
hours each week?
13
How many individuals does your organization currently employ part-time, meaning 29 hours or less per week, or by contract?
X
14
How many individuals does your organization currently employ on a temporary basis, where the length of the employee's time is limited to a specific period of time based on your organization's employment needs?
X
15
If the above questions are too specific, how many different individuals does your organization currently employ in total?
X
16
In calendar year 2015, what were your organization's expenses associated with wage expenses directly involved with the provision of care to individuals?
X
17
What are the minimum amount of weekly units for which a care recipient would need care to make their care financially viable to your organization? Please provide both the kind of unit (i.e., Day, Half Day, Fifteen Min.) and number of units per week necessary to make a patient's care financially viable.
X
18
For HCBS services in calendar year 2015, what were your organization's administration costs?
X
19
For HCBS services in calendar year 2015, of the wages paid to direct care staff, what dollar amount was for paid time off? Please sum all wages paid by your organization to employees for time taken under your Paid Time Off policy.
X
20
For HCBS services in calendar year 2015, what were your organization’s expenses associated with providing participants access to the community or care in their home?
X
Page 45
PAGE 39
May 31, 2016 ▪ ©Truven Health Analytics, an IBM Company ▪ www.truvenhealth.com
Below $250,000
Question #
Question Day Residential Unit Based w/ Programming
Unit Based w/o Programming
All
21
For HCBS services in calendar year 2015, what were your organization’s expenses associated with transportation? Please do not include residential services for this question.
X
22
For HCBS services in calendar year 2015, what were your organization’s expenses associated with the provision of employee training for direct care staff? This includes the cost of training materials and wages for employees' time spent in training.
X
23
Please include all other additional expenses that your organization may be able to capture in the comment box below, listing each item and its corresponding expense. Please include expenses such as employee training, employee benefits, transportation, administrative costs, or other categories applicable to your organization's provision of HCBS in the format found in this example: "Expense 1: $XX,XXX, Expense 2: XX,XXX".
X
County Selection
24 In what Minnesota counties do you administer HCBS services to individuals?
X
Page 46
PAGE 40
May 31, 2016 ▪ ©Truven Health Analytics, an IBM Company ▪ www.truvenhealth.com
Appendix B: Primary Data Sources
Page 47
PAGE 41
May 31, 2016 ▪ ©Truven Health Analytics, an IBM Company ▪ www.truvenhealth.com
Table of Contents
B.01 SUPERVISION/SPAN OF CONTROL ................................................................................................ 42
B.02 VACATION/SICK/TRAINING ............................................................................................................. 43
B.03 PROGRAM PLAN SUPPORT ............................................................................................................ 46
B.04 TAXES & WORKERS COMPENSATION .......................................................................................... 48
B.05 OTHER BENEFITS ............................................................................................................................. 55
B.06 CLIENT PROGRAM AND SUPPORTS .............................................................................................. 58
B.07 STANDARD G&A ............................................................................................................................... 59
B.08 UTILIZATION AND ABSENCE .......................................................................................................... 61
B.09 PROGRAM-RELATED EXPENSES ................................................................................................... 64
B.10 FACILITY USE .................................................................................................................................... 66
B.11 TRANSPORTATION ........................................................................................................................... 69
Page 48
PAGE 42
May 31, 2016 ▪ ©Truven Health Analytics, an IBM Company ▪ www.truvenhealth.com
B.01 Supervision/Span of Control
MN Framework Definition Supervision/Span of Control – Supervision cost of direct care staff, expressed as the ratio of supervisors to direct care staff.
Sources Table
Current Rates All Service Buckets 11%
Supervision Span of Control
Source Link Rate Notes
Truven Primary Source Value Use survey result
This cost component deals with the ratio of supervisors to direct care staff, and therefore is closely tied to
the specific services provided. For this reason, we feel the survey data is a better source of information for
this component. We were unable to identify strong comparable sources of information which provided
meaningful comparisons for this component. For comparison states, the Program Plan Support factor is
assumed to combine the Supervisor Span of Control and the Program Plan support in the costs. This is
consistent with the previous combined rate.
Page 49
PAGE 43
May 31, 2016 ▪ ©Truven Health Analytics, an IBM Company ▪ www.truvenhealth.com
B.02 Vacation/Sick/Training
MN Framework Definition Vacation/Sick/Training - Wages paid to staff while they are on vacation, on sick leave, or in training.
Sources Table
Current Rates All Service Buckets 8.71%
Vacation/Sick/Training
Source Link Rate Notes
Paid Leave
U.S. Bureau of Labor Statistics (BLS)
Employer Cost for Employee
Compensation March 2004 – December
2015
Table 18. Private industry workers, by
industry group
Health Care and Social Assistance. Paid
Leave.
http://www.bls.gov/n
cs/ect/sp/ececqrtn.txt
Paid Leave: 10.88%
Provided as a percent of wages.
Table 18. Health Care and Social
Assistance (NAICS 62). This Includes Ambulatory
Health Care Services (NAICS 621), Hospitals
(NAICS 622), Nursing and Residential Care
Facilities (NAICS 623), & Social Assistance
(NAICS 624).
Paid Leave Average of Q1 - Q4 2015 percent of
total compensation (7.83%) divided by wages
percent of total compensation (70.23%). This has
been adjusted by a BLS regional factor of 97.7% to
reflect regional variation.
Comparison States
Georgia Department of Behavioral
Health and Developmental Disabilities
Residential and Respite Cost Study-
Final Rate Models, September 17, 2015
Appendix C: Rate Model Productivity
Assumptions
https://dbhdd.georgia
.gov/sites/dbhdd.geor
gia.gov/files/related_
files/site_page/Final
RateModels_Septem
ber%2017%202015.
pdf
Paid Leave: 9.63%
Training: 1.88%
Total Combined Rate (as percent of total hours):
11.5%
The allocated time was provided as hours per week,
with the included rates calculated using the
following formula:
Paid Leave: 3.85 hours
Training: 0.75 hours
9.63% = 3.85/40 hours
Page 50
PAGE 44
May 31, 2016 ▪ ©Truven Health Analytics, an IBM Company ▪ www.truvenhealth.com
Vacation/Sick/Training
Source Link Rate Notes
Maine Office of Aging and Disability
Services
Section 21 Rate-Setting Initiative
Final Rate Models, February 3, 2015
Appendix B: Benefits Assumption
Appendix C: Productivity Assumptions
http://www.maine.
gov/dhhs/oads/doc
s/MEOADSRateM
odelsProposedFina
l.pdf
Paid Leave: 9.61%
Training: 1.88% - 2.5%
Total Combined Rate : 11.5% - 12.11%
Rates are a percent of hours per week.
Paid Leave: Total 25 days. Rates are a percent of
hours per week, assuming 260 work days per year.
Training: 0.75 - 1.50 hours.
Oregon Office of Developmental
Disabilities Services
Review of Provider Rates for
Employment and Day Support
Services-Proposed Rate Models,
October 29, 2015
Appendix C: Productivity Assumptions
http://www.burnshea
lthpolicy.com/wp-
content/uploads/2015
/10/Proposed-Rate-
Models.pdf
Proposed
Paid Leave: 9.23%
Training: 1.88% - 2.5%
Current
Training: 1.25% - 2.5%
Proposed Total Combined Rate: 11.73%
Rates are a percent of hours per week.
Proposed Paid Leave: 3.69 hours
Proposed Training: 0.75 - 1.00 hours
Current Paid Leave: Not provided by hours
Current Training: 0.5 - 1.00 hours
Virginia Department of Behavioral
Health and Developmental Services
My Life, My Community Provider Rate
Study - Final Rate Models, April 23,
2015
Appendix B: Benefits Assumption
http://www.dbhds.
virginia.gov/library
/developmental%2
0services/dds%20fi
nal%20waiver%20
rate%20models%2
02015%20april%2
023.pdf
Standard
Paid Leave: 9.8%
Training: 1.88%
Other*
Paid Leave: 11.55%
Training: 1.25%
Standard Combined Rate: 13.22%
Other Combined Rate: 14.32%
Rates are a percent of hours per week.
Standard Paid Leave: 3.92 hours
Standard Training: 0.75 hours
Other* Paid Leave: 4.62 hours
Other* Training: 0.5 hours
The same rates are used for across the state of
Virginia, so a single set of statewide rates are
provided.
* Other includes Nursing (RN, LPN) and
Therapeutic Consultation.
Page 51
PAGE 45
May 31, 2016 ▪ ©Truven Health Analytics, an IBM Company ▪ www.truvenhealth.com
Vacation/Sick/Training
Source Link Rate Notes
Arizona Department of Economic
Security Division of Developmental
Disabilities
Rebase Book, January 24, 2014
https://des.az.gov/s
ites/default/files/re
basebook_draft.pdf
7.31% Factor is calculated as a percent of wage.
Truven Primary Source Value 12.88%
The wage based factor of 12.88% combines the BLS PTO rate of 10.88% plus a training factor of 2.0%
which is an increase to the current 8.71% factor.
The BLS PTO factor is based on an industry rate for health care and social assistance. This rate has
also been adjusted to account for regional variation captured in BLS. This rate is a wage-based
factor.
Training rates are provided as a factor of total time per week in the comparison states. This ranges
from 1.25% to 2.5%. In order to fit within the wage based rate to be combined with the BLS factor,
this must be increased to reflect being a percent of direct billable time rather than total time worked.
2% for training time is suggested. The average percent of hours per week is between 0.5 and 1.5
hours per week, which is between 1.25% and 3.75% of standard (40 hour) work week.
Page 52
PAGE 46
May 31, 2016 ▪ ©Truven Health Analytics, an IBM Company ▪ www.truvenhealth.com
B.03 Program Plan Support
MN Framework Definition Program Plan Support - Direct service staff necessary to provide support of Adult Day Care services when not engaged in direct contact with
clients (indirect time). Examples include, but are not limited to:
Documentation
Direct staff preparation and service planning
Collateral contact related to direct service
Travel time when the client is not present
Sources Table
Current Rates Day 5.60%
Residential 3.10%
Unit with Programming 3.10%
Unit without Programming 3.10%
Program Plan Support
Source Link Rate Notes
Comparison States
Georgia Department of Behavioral
Health and Developmental Disabilities
Residential and Respite Cost Study-
Final Rate Models, September 17, 2015
Appendix C: Rate Model Productivity
Assumptions
https://dbhdd.georgia
.gov/sites/dbhdd.geor
gia.gov/files/related_
files/site_page/Final
RateModels_Septem
ber%2017%202015.
pdf
3.75% - 19.375% Rates are a percent of hours per week.
Time categories included all items other than direct
care and Paid Leave/Training. Where applicable,
these include travel time (between members),
recordkeeping, employer time, and participation in
ISP meetings.
Rates vary by service.
Maine Office of Aging and Disability
Services
Section 21 Rate-Setting Initiative
Final Rate Models, February 3, 2015
Appendix C: Productivity Assumptions
http://www.maine.
gov/dhhs/oads/doc
s/MEOADSRateM
odelsProposedFina
l.pdf
0.625% - 21.25% Rates are a percent of hours per week.
Time categories included all items other than direct
care Training (Paid Time Off note removed in
table). Where applicable, these include travel time
(between members), recordkeeping, employer time,
Page 53
PAGE 47
May 31, 2016 ▪ ©Truven Health Analytics, an IBM Company ▪ www.truvenhealth.com
Program Plan Support
Source Link Rate Notes
participation in ISP/PCP meetings, and employer
and one-on-one supervision of time.
Rates vary by service.
Oregon Office of Developmental
Disabilities Services
Review of Provider Rates for
Employment and Day Support
Services-Proposed Rate Models,
October 29, 2015
Appendix C: Productivity Assumptions
http://www.burnshea
lthpolicy.com/wp-
content/uploads/2015
/10/Proposed-Rate-
Models.pdf
5.25% - 37.5% Rates are a percent of hours per week.
Time categories included all items other than direct
care and Paid Leave/Training. Where applicable,
these include travel time (between members),
participation in ISP/PCP meetings, program
development/quality improvement, employment
market research, time spend on behalf of activities,
program preparation/set-up/clean-up, incomplete
assessments, incomplete placements, progress
notes/medical records, and employer and one-on-
one supervision of time.
Rates vary by service.
Virginia Department of Behavioral
Health and Developmental Services
My Life, My Community Provider Rate
Study - Final Rate Models, April 23,
2015
Final Rate Models
http://www.dbhds.
virginia.gov/library
/developmental%2
0services/dds%20fi
nal%20waiver%20
rate%20models%2
02015%20april%2
023.pdf
0.875% - 21.875% Rates are a percent of hours per week.
Time categories included all items other than direct
care and Paid Leave/Training. Where applicable,
these include travel time (between members),
ISP/Plan of Care meetings, program development,
program preparation/set-up/clean-up, progress
notes/medical records (not in member’s presence),
and employer and one-on-one supervision of time.
Rates vary by service.
Truven Primary Source Value Use survey result
Page 54
PAGE 48
May 31, 2016 ▪ ©Truven Health Analytics, an IBM Company ▪ www.truvenhealth.com
While our comparison states provide a basis of comparison, they vary significantly and do not accurately
represent the HCBS services provided in MN. Since this cost component is closely tied to the specific
services provided in MN, we feel the survey data is a better source of information for this component.
B.04 Taxes & Workers Compensation MN Framework Definition
Taxes & Workers Compensation – State and Federal rates including FICA, FUTA, SUTA, and Workers Compensation.
Sources Table
Current Rates All Service Buckets 11.56%
Taxes and Worker's Compensation
Source Link Rate Notes
Federal
Internal Revenue Service (IRS)
Federal Insurance Contributions Act
(FICA) - Social Security tax
withholding
https://www.irs.gov/t
axtopics/tc751.html 6.20% The wage base limit for Social Security is
$118,500 for 2016.
IRS
FICA - Medicare tax withholding
https://www.irs.gov/t
axtopics/tc751.html 1.45%
IRS
Federal Unemployment Tax Authority
(FUTA)
https://www.irs.gov/
Businesses/Small-
Businesses-&-Self-
Employed/FUTA-
Credit-Reduction
0.60% The wage base limit for FUTA is $7,000. Once
employee year-to-date wages exceed $7,000, an
employer stops paying FUTA for that employee.
Rate reflects the net annual FUTA applied to the
wage base. The standard rate is 6.0%, but generally
employers received a credit of 5.4% when their
Form 940 (Employer’s Annual Federal
Unemployment (FUTA) Tax Return) is filed.
Page 55
PAGE 49
May 31, 2016 ▪ ©Truven Health Analytics, an IBM Company ▪ www.truvenhealth.com
Taxes and Worker's Compensation
Source Link Rate Notes
U.S. Bureau of Labor Statistics (BLS)
Employer Cost for Employee
Compensation March 2004 – December
2015
Table 12. West North Central Division.
Federal Unemployment (FUTA).
http://www.bls.gov/n
cs/ect/sp/ececqrtn.txt
0.13% Average of Q1 - Q4 2015 Federal Unemployment
(FUTA) percent of total compensation (0.10%)
divided by wages percent of total compensation
(70.08%) and paid leave (6.90%).
West North Central Division includes IA, KS, MN,
MO, NE, ND, and SD.
State
Minnesota Department of Employment
and Economic Development
State Unemployment Tax Authority
(SUTA)
http://uimn.org/uimn/
employers/wages-
taxes/tax-rates/faq-
tax-rates.jsp
1.49% This is the 2016 rate for new employers (1.66% in
2015) for Non-High Experience Rating Industry.
8.34% for New Employers in High Experience
Rating Industry. Actual employer rate will be
experience based.
The wage base limit for SUTA is $31,000. The
maximum collected SUTA amount is $461.90
Minnesota Department of Employment
and Economic Development (DEED)
Workforce Development Fund
http://uimn.org/uimn/
employers/wages-
taxes/tax-rates/faq-
tax-rates.jsp
0.10% Used to retrain unemployed Minnesota workers.
Operates in the same manners as the above (only
first $31,000 of an employee’s income is taxed).
The maximum collected DEED amount is $31.00.
U.S. Bureau of Labor Statistics (BLS)
Employer Cost for Employee
Compensation March 2004 – December
2015
Table 12. West North Central Division.
State Unemployment Insurance.
http://www.bls.gov/n
cs/ect/sp/ececqrtn.txt 0.78%
Average of Q1 - Q4 2015 State Unemployment
Insurance percent of total compensation (0.60%)
divided by wages percent of total compensation
(70.08%) and paid leave (6.90%).
West North Central Division includes IA, KS, MN,
MO, NE, ND, and SD.
Page 56
PAGE 50
May 31, 2016 ▪ ©Truven Health Analytics, an IBM Company ▪ www.truvenhealth.com
Taxes and Worker's Compensation
Source Link Rate Notes
ADP 2016 Fast Wage and Tax Facts
Published 4/4/2016
http://www.adp.com/
Fast State
IA
KS
MO
NE
ND
SD
Rate
1.00%
2.70%
3.51%
1.25%
1.62%
1.75%*
Max
$28.3K
$14K
$13K
$9K
$37.2K
$15K
Average, including MN state employer rate, is
1.92%. Average maximized state employer tax is
$369.69.
Max reflects the annual maximum taxable earning.
Comparison of 2016 New Employer SUTA for
states included in the BLS West North Central
Division.
West North Central Division includes IA, KS, MN,
MO, NE, ND, and SD.
*SD includes a 0.55% investment fee.
Worker's Compensation (WC)
Minnesota Workers' Compensation
Insurers Association Inc.
Assigned Risk Rates
National Council on Compensation
(NCCI) Class code 8835
http://www.mwcia.or
g/OnlineServices/M
CISearch.aspx
2013 Rate: 4.79%
2016 Rate: 4.29%
Rates depend on industry. Year indicates the year
the assigned risk rate started.
NCCI Class Code 8835: Nursing-Home Health
4/1/2013 – 4/1/2014 Rate
4/1/2016 – 4/1/2017 Rate
Oregon Department of Consumer and
Business Services
Oregon Workers’ Compensation
Premium Rate Ranking - Calendar Year
2014
Released February, 2015
Table 1. Workers’ compensation
premium rate ranking, Pg. 4
http://www.cbs.state.
or.us/external/dir/wc
_cost/files/report_su
mmary.pdf
http://www.oregon.g
ov/DCBS/
State
MN
IA
KS
MO
NE
ND
SD
Rate
1.99%
1.88%
1.55%
1.98%
1.78%
0.88%
1.86%
Eff.
Date
1/2014
1/2014
1/2014
1/2014
2/2013
7/2013
7/2013
Region average: 1.70%
Composite rate is based on an index calculated to
provide a comparable hazard mix across states and
does not reflect the actual state average.
Effective date following rate.
Page 57
PAGE 51
May 31, 2016 ▪ ©Truven Health Analytics, an IBM Company ▪ www.truvenhealth.com
Taxes and Worker's Compensation
Source Link Rate Notes
Oregon Department of Consumer and
Business Services
Oregon Workers’ Compensation
Premium Rate Ranking - Calendar Year
2014
Appendix 4. Workers’ compensation
premium rate ranking by class, Pg. 33,
Class 8835 Home/Public Healthcare
http://www.oregon.g
ov/DCBS/
State
MN
IA
KS
MO
NE
ND
SD
Rate
3.62%
3.89%
2.67%
3.52%
2.85%
0.85%
3.21%
Eff.
Date
1/2014
1/2014
1/2014
1/2014
2/2013
7/2013
7/2013
Region average: 2.94%
Industry rate for Class Code 8835 Home/Public
Healthcare
Same dates as composite rates.
U.S. Bureau of Labor Statistics (BLS)
Employer Cost for Employee
Compensation March 2004 – December
2015
Table 12. Private industry workers, by
census region and division
West North Central Division. Workers'
Compensation.
http://www.bls.gov/n
cs/ect/sp/ececqrtn.txt 1.69% Table 12. West North Central Division (includes
IA, KS, MN, MO, NE, ND, and SD).
Workers Compensation Average of Q1 - Q4 2015
percent of total compensation (1.30%) divided by
wages percent of total compensation (70.08%) and
paid leave (6.90%).
All Legally Required Benefits Combined
U.S. Bureau of Labor Statistics (BLS)
Employer Cost for Employee
Compensation March 2004 – December
2015
Table 12. Private industry workers, by
census region and division
West North Central Division. Legally
Required Benefits.
http://www.bls.gov/n
cs/ect/sp/ececqrtn.txt 10.30% Table 12. West North Central Division (includes
IA, KS, MN, MO, NE, ND, and SD).
Workers Compensation Average of Q1 - Q4 2015
percent of total compensation (7.93%) divided by
wages percent of total compensation (70.08%) and
paid leave (6.90%).
Comparison States
Page 58
PAGE 52
May 31, 2016 ▪ ©Truven Health Analytics, an IBM Company ▪ www.truvenhealth.com
Taxes and Worker's Compensation
Source Link Rate Notes
Georgia Department of Behavioral
Health and Developmental Disabilities
Residential and Respite Cost Study-
Final Rate Models, September 17, 2015
Appendix B: Benefits Assumptions
https://dbhdd.georgia
.gov/sites/dbhdd.geor
gia.gov/files/related_
files/site_page/Final
RateModels_Septem
ber%2017%202015.
pdf
FICA: 7.65%
FUTA: 0.60%
SUTA: 1.5%
WC: 3.2%
Total Combined Rate: 12.95%
FICA includes social security tax rate (6.2%) and
Medicare tax rate (1.45%).
FUTA applies to first $7,000 in wages.
SUTA applies to first $9,500 in wages.
Maine Office of Aging and Disability
Services
Section 21 Rate-Setting Initiative
Final Rate Models, February 3, 2015
Appendix B: Benefits Assumptions
http://www.maine.
gov/dhhs/oads/doc
s/MEOADSRateM
odelsProposedFina
l.pdf
FICA: 7.65%
FUTA: 0.60%
SUTA: 2.20%
WC: 3.2%
Total Combined Rate: 13.65%
FUTA applies to first $7,000 in wages.
SUTA applies to first $12,000 in wages.
Oregon Office of Developmental
Disabilities Services
Review of Provider Rates for
Employment and Day Support
Services-Proposed Rate Models,
October 29, 2015
Appendix B: Benefits Assumption
http://www.burnshea
lthpolicy.com/wp-
content/uploads/2015
/10/Proposed-Rate-
Models.pdf
FICA: 7.65%
FUTA: 0.60%
SUTA: 2.90%
WC: 2.30%
Total Combined Rate: 13.45%
FUTA applies to first $7,000 in wages.
SUTA applies to first $8,000 in wages.
Virginia Department of Behavioral
Health and Developmental Services
My Life, My Community Provider Rate
Study - Final Rate Models, April 23,
2015
Appendix B: Benefits Assumption
http://www.dbhds.
virginia.gov/library
/developmental%2
0services/dds%20fi
nal%20waiver%20
rate%20models%2
02015%20april%2
023.pdf
FICA: 7.65%
FUTA: 0.60%
SUTA: 1.55%
WC: 3.11%
Total Combined Rate: 12.91%
FUTA applies to first $7,000 in wages.
SUTA applies to first $8,000 in wages.
The same rates are used for across the state of
Virginia, so a single set of statewide rates are
provided.
Page 59
PAGE 53
May 31, 2016 ▪ ©Truven Health Analytics, an IBM Company ▪ www.truvenhealth.com
Taxes and Worker's Compensation
Source Link Rate Notes
Arizona Department of Economic
Security Division of Developmental
Disabilities
Rebase Book, January 24, 2014
https://des.az.gov/sit
es/default/files/rebas
ebook_draft.pdf
FICA: 7.65%
FUTA and SUTA:
0.31% - 1.05%
WC: 2.0%
Total values ranging from $2,002 to $6,218.
Percentages ranging from 9.96% - 10.70%.
Combined FUTA and SUTA has a flat amount of
$196.
Truven Primary Source Value 11.1%
The Taxes & Workers Compensation factor is comprised of legally required federal and state benefits. This
includes Federal and state taxes and workers compensation costs, as outlined below:
Federal:
o Social Security tax withholding (Federal Insurance Contributions Act (FICA))
A wage based limit exist for Social Security tax as $118,500. However, since this
equates to $56.97/hour (40 hours a week for 52 weeks), no adjustment was made to
the factor.
The full 6.2% is suggested for use as a factor applied to wages.
o Medicare tax withholding
There is no cap for Medicare taxes wages, and while an additional 0.9% is withheld
wages in excess of $200,000, this has not been included due to the wage threshold
reasonably exceeding the anticipated direct care wages.
The standard 1.45% is used as a factor applied to wages.
o Federal Unemployment Tax Authority (FUTA)
Rate reflects the net annual FUTA applied to the wage base. The standard rate is
6.0%, but most employers received a credit of 5.4% when their Form 940
(Employer’s Annual Federal Unemployment (FUTA) Tax Return) is filed. It has
been assumed that the Form 940 has been completed, and a net 0.60% applies.
An annual wage base limit of $7,000 applies to FUTA. Once employee year-to-date
wages exceed $7,000, an employer stops paying FUTA for that employee. This
limit equates to $3.37/hour (40 hours a week for 52 weeks), and is assumed to be
exceeded over the course of the year. To adjust for the wage base limit, it is
suggested the BLS factor of 0.13% is used. This would be the roughly the
Page 60
PAGE 54
May 31, 2016 ▪ ©Truven Health Analytics, an IBM Company ▪ www.truvenhealth.com
equivalent of $32,307, or $15.53 per hour. It is expected that a portion of wages
will be above and below this rate.
o The combined primary source Federal tax rate is 7.78%
State:
o State Unemployment Tax Authority (SUTA)
An annual wage base limit of $31,000 ($14.90 per hour) applies to SUTA. Based
on the professions providing services, the Non-High Experience rate of 1.49% for
new employers is proposed. No additional reductions were applied based on the
annual wage base limit.
o Workforce Development Fund
An annual wage base limit of $31,000 (about $14.90 per hour) applies to DEED
Workforce Development Fund. The factor of 0.10% is indicated with additional
reductions were applied based on the annual wage base limit.
o The primary source State rate is 1.59%
BLS region rate was used for comparison purposes, with along with state specific
rates and caps. While the combined MN rate of 1.59% is below the average, the
annual wage base limit was higher, resulting in a larger possible total collected. As
a result we suggest using the combined MN rate.
Worker’s Compensation
o Worker’s compensation rates vary based on the provider’s experience and will vary
between providers.
o BLS reported a wage-based factor for workers compensation in the West North Central
Division of 1.69 percent.
Page 61
PAGE 55
May 31, 2016 ▪ ©Truven Health Analytics, an IBM Company ▪ www.truvenhealth.com
B.05 Other Benefits
MN Framework Definition
Other Benefits (could include but are not limited to):
Health insurance Short-term disability insurance
Dental insurance Retirement
Vision Tuition reimbursement
Life insurance Wellness program
Sources Table
Current Rates All Service Buckets 12.04%
Other Benefits
Source Link Rate Notes
Industry
U.S. Bureau of Labor Statistics (BLS)
Employer Cost for Employee
Compensation March 2004 – December
2015
Table 18. Private industry workers, by
industry group
Health Care and Social Assistance.
Insurance.
http://www.bls.gov/n
cs/ect/sp/ececqrtn.txt
12.27% Table 18. Health Care and Social
Assistance (NAICS 62). This Includes Ambulatory
Health Care Services (NAICS 621), Hospitals
(NAICS 622), Nursing and Residential Care
Facilities (NAICS 623), & Social Assistance
(NAICS 624).
Insurance Average of Q1 - Q4 2015 percent of total
compensation (8.83%) divided by wages percent of
total compensation (70.23%). This has been
adjusted by a BLS regional factor of 97.7% to
reflect regional variation.
U.S. Bureau of Labor Statistics (BLS)
Employer Cost for Employee
Compensation March 2004 – December
2015
http://www.bls.gov/n
cs/ect/sp/ececqrtn.txt
4.69% Table 18. Health Care and Social
Assistance (NAICS 62). This Includes Ambulatory
Health Care Services (NAICS 621), Hospitals
(NAICS 622), Nursing and Residential Care
Facilities (NAICS 623), & Social Assistance
(NAICS 624).
Page 62
PAGE 56
May 31, 2016 ▪ ©Truven Health Analytics, an IBM Company ▪ www.truvenhealth.com
Table 18. Private industry workers, by
industry group
Health Care and Social Assistance.
Retirement and Savings.
Retirement and Savings Average of Q1 - Q4 2015
percent of total compensation (3.38%) divided by
wages percent of total compensation (70.23%).
This has been adjusted by a BLS regional factor of
97.7% to reflect regional variation.
U.S. Bureau of Labor Statistics (BLS)
Employer Cost for Employee
Compensation March 2004 – December
2015
Table 18. Private industry workers, by
industry group
Health Care and Social Assistance.
Supplemental Pay.
http://www.bls.gov/n
cs/ect/sp/ececqrtn.txt 2.99%
Table 18. Health Care and Social
Assistance (NAICS 62). This Includes Ambulatory
Health Care Services (NAICS 621), Hospitals
(NAICS 622), Nursing and Residential Care
Facilities (NAICS 623), & Social Assistance
(NAICS 624).
Supplemental Pay Average of Q1 - Q4 2015
percent of total compensation (2.15%) divided by
wages percent of total compensation (70.23%).
This has been adjusted by a BLS regional factor of
97.7% to reflect regional variation.
Comparison States
Georgia Department of Behavioral
Health and Developmental Disabilities
Residential and Respite Cost Study-
Final Rate Models, September 17, 2015
Appendix B: Benefits Assumptions
https://dbhdd.georgia
.gov/sites/dbhdd.geor
gia.gov/files/related_
files/site_page/Final
RateModels_Septem
ber%2017%202015.
pdf
Retirement 5.2%
Health Ins. $375
Maine Office of Aging and Disability
Services
Section 21 Rate-Setting Initiative
Final Rate Models, February 3, 2015
Appendix B: Benefits Assumptions
http://www.maine.
gov/dhhs/oads/doc
s/MEOADSRateM
odelsProposedFina
l.pdf
With Paid Leave:
29.8% - 51.2%
Without Paid Leave:
18.3% - 39.7%
Rates range from $9 per hour to $35 per hour.
Page 63
PAGE 57
May 31, 2016 ▪ ©Truven Health Analytics, an IBM Company ▪ www.truvenhealth.com
Oregon Office of Developmental
Disabilities Services
Review of Provider Rates for
Employment and Day Support
Services-Proposed Rate Models,
October 29, 2015
Appendix B: Benefits Assumption
http://www.burnshea
lthpolicy.com/wp-
content/uploads/2015
/10/Proposed-Rate-
Models.pdf
With Paid Leave:
25.6% - 44.4%
Without Paid Leave:
18.2% - 36.9%
Rates range from $9 per hour to $40 per hour.
Virginia Department of Behavioral
Health and Developmental Services
My Life, My Community Provider Rate
Study - Final Rate Models, April 23,
2015
Appendix B: Benefits Assumption
http://www.dbhds.
virginia.gov/library
/developmental%2
0services/dds%20fi
nal%20waiver%20
rate%20models%2
02015%20april%2
023.pdf
Professional:
17.8% - 42.1%
Paraprofessional:
16.8% - 37.5%
Rates are a range of values based on hourly wage.
Arizona Department of Economic
Security Division of Developmental
Disabilities
Rebase Book, January 24, 2014
https://des.az.gov/s
ites/default/files/re
basebook_draft.pdf
5.92% - 19.74% Arizona applies a flat amount of $3,693 which
creates a rate range of rates based on hourly wage.
Truven Primary Source Value 19.95%
Our results suggest using the BLS factors for Insurance, Retirement and Savings, and the new category of
Supplemental Pay, which totals 19.95%, reflected as a percent of base wages. This factor is significantly
different than the current factor of 12.04%, but this difference reflects the basis for the rate calculation. It
appears that the previous recommendations were based on a percent of total compensation rather than a
factor that applies to the wages. In effect, this 19.95% will need to be adjusted downward to be reflected as
a percent of total compensation.
Page 64
PAGE 58
May 31, 2016 ▪ ©Truven Health Analytics, an IBM Company ▪ www.truvenhealth.com
B.06 Client Program and Supports
MN Framework Definition Client Program and Supports – Provision of participant’s access to the community or care in their home. State plan or other available waiver
services must be accessed first, and those services must be billed separately. Examples of allowable costs include, but are not limited to:
Participation costs for staff
Reinforcers as defined in the participant’s support plan
Transportation provided as part of Adult Day Care Service to provide in-program and transportation for the participant to increase
access to the community outside the Adult Day Care location
Sources Table
Current Rates Day 10.00%
Residential 8.60%
Unit with Programming 8.60%
Unit without Programming 8.60%
Client Program and Supports
Source Link Rate Notes
Truven Primary Source Value Use survey result
Based on the definition of this cost component, there were no directly comparable sources of data. The
survey results should be used for a recommendation.
Page 65
PAGE 59
May 31, 2016 ▪ ©Truven Health Analytics, an IBM Company ▪ www.truvenhealth.com
B.07 Standard G&A
MN Framework Definition Standard G&A - This category includes general office and administrative overhead business costs including liability and malpractice insurance,
administrative salaries for finance, accounting and auditors. This also includes office supplies, postage and any administrative office space
necessary.
Sources Table
Current Rates All Service Buckets 13.25%
Standard G&A
Source Link Rate Notes
Comparison States
Georgia Department of Behavioral
Health and Developmental Disabilities
Residential and Respite Cost Study-
Final Rate Models, September 17, 2015
Final Rate Models
https://dbhdd.georgia
.gov/sites/dbhdd.geor
gia.gov/files/related_
files/site_page/Final
RateModels_Septem
ber%2017%202015.
pdf
10%* Provided as a percent of total service cost (total
cost per member).
*Additional Residential Staffing includes a lower
factor of 5%.
Maine Office of Aging and Disability
Services
Section 21 Rate-Setting Initiative
Final Rate Models, February 3, 2015
http://www.maine.go
v/dhhs/oads/docs/M
EOADSRateModels
ProposedFinal.pdf
10% Provided as a percent of total service cost (total
cost per member).
Oregon Office of Developmental
Disabilities Services
Review of Provider Rates for
Employment and Day Support
Services-Proposed Rate Models,
October 29, 2015
http://www.burnshea
lthpolicy.com/wp-
content/uploads/2015
/10/Proposed-Rate-
Models.pdf
Proposed: 20%
Current: 22.5%
Provided as a percent of total service cost (total
cost per member).
The proposed rates separately include program
support funding ($10 per member day) while the
current rates do not.
Page 66
PAGE 60
May 31, 2016 ▪ ©Truven Health Analytics, an IBM Company ▪ www.truvenhealth.com
Proposed Rate Models
Virginia Department of Behavioral
Health and Developmental Services
My Life, My Community Provider Rate
Study - Final Rate Models, April 23,
2015
Final Rate Model
http://www.dbhds.vir
ginia.gov/library/dev
elopmental%20servi
ces/dds%20final%20
waiver%20rate%20
models%202015%20
april%2023.pdf
11% Provided as a percent of total service cost (total
cost per member).
Arizona Department of Economic
Security Division of Developmental
Disabilities
Rebase Book, January 24, 2014
https://des.az.gov/sit
es/default/files/rebas
ebook_draft.pdf
10% Administrative costs are 10% of the overall
benchmark rate for each service.
Truven Primary Source Value 10% – 20% of total service costs
Our primary research yielded Standard G&A results between 10% and 20% of total service costs. Much of
the variation in this category comes from how other states have defined the category and which costs are
included. We have observed that often costs within Standard G&A and Program-Related Expenses are not
delineated consistently from state to state. The current rate of 13.25% reasonably falls within the range
observed in other states, however, we propose using the results from the survey to provide a more refined
recommendation.
Page 67
PAGE 61
May 31, 2016 ▪ ©Truven Health Analytics, an IBM Company ▪ www.truvenhealth.com
B.08 Utilization and Absence MN Framework Definition Utilization and Absence - This factor accounts cost associated with absences of the care recipient. It approximates providers' fixed costs when a
recipient is not able to attend/be present for a planned service. Covers both provider vacancy and recipient absences.
Sources Table
Current Rates All Service Buckets 3.90%
Utilization and Absence
Source Link Rate Notes
Comparison States
Georgia Department of Behavioral
Health and Developmental Disabilities
Residential and Respite Cost Study-
Final Rate Models, September 17, 2015
Final Rate Model
https://dbhdd.georgia
.gov/sites/dbhdd.geor
gia.gov/files/related_
files/site_page/Final
RateModels_Septem
ber%2017%202015.
pdf
2.08% For Residential and Respite Services, 3 hour
allowance for day program absences. Rate applies
after reduction of 30 weekly hours for members out
of the home (without Home Staff).
Oregon Office of Developmental
Disabilities Services
Review of Provider Rates for
Employment and Day Support
Services-Proposed Rate Models,
October 29, 2015
Proposed Rate Model
http://www.burnshea
lthpolicy.com/wp-
content/uploads/2015
/10/Proposed-Rate-
Models.pdf
Proposed Rate 16%
Current Rate: 1.98%
Where applicable, provided as Member Attendance
Rate, which applies to the staffing ratio factor (and
as part of the denominator). The rate to the left has
been has been provided as a wage based factor.
Proposed: 84% or 210 days per year of member
attendance (based on attendance rate) out of 250
days per year of program operations.
Current: 98% or 248 days per year of member
attendance (based on attendance rate) out of 253
days per year of program operations.
Virginia Department of Behavioral
Health and Developmental Services
http://www.dbhds.
virginia.gov/library
/developmental%2
0services/dds%20fi
nal%20waiver%20
5.75% The Final rates are based on a 344-day year, which
allows for 21 absences and caps billing at 344 days.
Page 68
PAGE 62
May 31, 2016 ▪ ©Truven Health Analytics, an IBM Company ▪ www.truvenhealth.com
Utilization and Absence
Source Link Rate Notes
My Life, My Community Provider Rate
Study - Final Rate Models, April 23,
2015
Comparison of Current and Final Rates
rate%20models%2
02015%20april%2
023.pdf
Arizona Department of Economic
Security Division of Developmental
Disabilities
Rebase Book, January 24, 2014
https://des.az.gov/s
ites/default/files/re
basebook_draft.pdf
6% An absence factor of 6% for Habilitation, Nursing
Supported group home.
Truven Primary Source Value 6.0%
Utilization and absence factors found in other states range from 2% to 6%, however, these factors primarily
include absence, not utilization. Some of this variation may be explained by the billing caps imposed in
some states with higher utilization rates.
Page 69
PAGE 63
May 31, 2016 ▪ ©Truven Health Analytics, an IBM Company ▪ www.truvenhealth.com
Page 70
PAGE 64
May 31, 2016 ▪ ©Truven Health Analytics, an IBM Company ▪ www.truvenhealth.com
B.09 Program Related Support MN Framework Definition Program-Related Support - This component captures overhead costs such as technology software and hardware, telecommunications, and billing
infrastructure. This component is sometimes referred to as Program G&A.
Sources Table
Current Rates Day 1.80%
Residential 1.30%
Unit with Programming 6.10%
Unit without Programming 6.10%
Program Related Support
Source Link Rate Notes
Comparison States
Georgia Department of Behavioral
Health and Developmental Disabilities
Residential and Respite Cost Study-
Final Rate Models, September 17, 2015
Final Rate Models
https://dbhdd.georgia.
gov/sites/dbhdd.geor
gia.gov/files/related_f
iles/site_page/FinalR
ateModels_Septembe
r%2017%202015.pdf
$14 per member day* This Program Support rate includes all Program
Related support other than administrative costs.
This is adjusted by either
- dividing by the productivity factor and
number of hours to achieve an hourly rate,
or
- multiplying by the number of days to
achieve a weekly or annual rate.
Since this source uses a flat dollar rate, the
equivalent percent of total cost ranges widely due
to the adjustments described above.
*Flat dollar amount of $14.00 per day, except for
additional residential staffing which is a flat rate of
$7.00 per day.
Maine Office of Aging and Disability
Services
Section 21 Rate-Setting Initiative
http://www.maine.g
ov/dhhs/oads/docs/
MEOADSRateMod
$20 per member day* This Program Support rate includes all Program
Related support other than administrative costs.
This is adjusted by either
Page 71
PAGE 65
May 31, 2016 ▪ ©Truven Health Analytics, an IBM Company ▪ www.truvenhealth.com
Program Related Support
Source Link Rate Notes
Final Rate Models, February 3, 2015
Final Rate Models
elsProposedFinal.p
df - dividing by the productivity factor and
number of hours to achieve a hourly rate, or
- multiplying by the number of days to
achieve a weekly or annual rate.
Since this source uses a flat dollar rate, the
equivalent percent of total cost ranges widely due
to the adjustments described above.
Oregon Office of Developmental
Disabilities Services
Review of Provider Rates for
Employment and Day Support
Services-Proposed Rate Models,
October 29, 2015
Proposed Rate Model
http://www.burnsheal
thpolicy.com/wp-
content/uploads/2015
/10/Proposed-Rate-
Models.pdf
$10 per member day This proposed Program Support Funding rate
includes all Program-Related expenses other than
administrative costs.
This is adjusted by either
- dividing by the productivity factor and
number of hours to achieve an hourly rate,
or
- multiplying by the number of days to
achieve a weekly or annual rate.
Since this source uses a flat dollar rate, the
equivalent percent of total cost ranges widely due
to the adjustments described above.
The current rates do not reflect a split rate and is
combined in the total administrative cost (22.5%)
included in Standard G&A.
Virginia Department of Behavioral
Health and Developmental Services
My Life, My Community Provider Rate
Study - Final Rate Models, April 23,
2015
Final Rate Models
http://www.dbhds.v
irginia.gov/library/
developmental%20
services/dds%20fin
al%20waiver%20ra
te%20models%202
Northern Virginia:
$20 per member day
Rest of State:
$18 per member day
This Program Support Funding rate includes all
Program-Related expenses other than
administrative costs.
A flat dollar rate varies by location between
Northern Virginia and the rest of the state. This is
adjusted by either
Page 72
PAGE 66
May 31, 2016 ▪ ©Truven Health Analytics, an IBM Company ▪ www.truvenhealth.com
Program Related Support
Source Link Rate Notes
015%20april%2023
.pdf - dividing by the productivity factor and
number of hours to achieve an hourly rate,
or
- multiplying by the number of days to
achieve a weekly or annual rate.
Since this source uses a flat dollar rate, the
equivalent percent of total cost ranges widely due
to the adjustments described above.
Arizona Department of Economic
Security Division of Developmental
Disabilities
Rebase Book, January 24, 2014
https://des.az.gov/si
tes/default/files/reb
asebook_draft.pdf
Professional Services: 4%
All Other Services: 8%
Professional Services include all nursing and
therapy services and some specialized habilitation
services. Professional services accounts for 4% of
the total services.
Truven Primary Source Value Use survey result
Comparable Program-Related Expenses in other state behavioral health programs have been provided as a
flat dollar amount per member per day. When converting this rate to a percent of total service costs or
percent of wages, there is a wide range of comparison rates. The broad definition of Program-Related
Expenses also accounts for the large variance in figures found in other states. For these reasons, we cannot
strongly recommend a factor based on these primary data sources. As noted above, we believe that the costs
should be captured within the same cost component as Standard G&A.
B.10 Facility Use MN Framework Definition Facility Use – Costs of facility usage in providing day services.
Page 73
PAGE 67
May 31, 2016 ▪ ©Truven Health Analytics, an IBM Company ▪ www.truvenhealth.com
Sources Table
Current Rates Day $19.30/week
Residential Not applicable
Unit with Programming Not applicable
Unit without Programming Not applicable
Facility Use
Source Link Rate Notes
Comparison States
Oregon Office of Developmental
Disabilities Services
Review of Provider Rates for
Employment and Day Support
Services-Proposed Rate Models,
October 29, 2015
Proposed Rate Models
http://www.burnshea
lthpolicy.com/wp-
content/uploads/2015
/10/Proposed-Rate-
Models.pdf
Proposed
$0.80 per member per
billable hour (75 ft2) or
$843.75 per member
annually
Current
$1.50 per member per
billable hour (161.5 ft2)
or $1,817.09 per member
annually
Where facility rates apply, the proposed rate uses
75 ft2 at $11.25 per square foot for total annual
facility cost per member of $843.75.
With an attendance rate of 210 days per year with 5
hours per day, this equates to a facility cost of
$0.80 per member billable hour.
The current rate uses 161.5 ft2 at $11.25 per square
foot for total annual facility cost per member of
$1,817.09.
With an attendance rate of 248 days per year with
4.9 hours per day, this equates to a facility cost of
$1.47 per member billable hour (after rounding).
Maine Office of Aging and Disability
Services
Section 21 Rate-Setting Initiative
Final Rate Models, February 3, 2015
Final Rate Models
http://www.maine.
gov/dhhs/oads/doc
s/MEOADSRateM
odelsProposedFina
l.pdf
$1.41 per member per
billable hour (100 ft2) or
$1,500 per member
annually
Where facility rates apply, the proposed rate uses
100 ft2 at $15 per square foot for total annual
facility cost per member of $1,500.
With an attendance rate of 213 days per year with 5
hours per day, this equates to a facility cost of
$1.41 per member billable hour.
Virginia Department of Behavioral
Health and Developmental Services
http://www.dbhds.
virginia.gov/library
/developmental%2
0services/dds%20fi
Northern Virginia: $1.33
per member per billable
Where facility rates apply, statewide rates use 75
ft2.
Page 74
PAGE 68
May 31, 2016 ▪ ©Truven Health Analytics, an IBM Company ▪ www.truvenhealth.com
Facility Use
Source Link Rate Notes
My Life, My Community Provider Rate
Study - Final Rate Models, April 23,
2015
Final Rate Models
nal%20waiver%20
rate%20models%2
02015%20april%2
023.pdf
hour (75 ft2) or
$1,800/member annually
Rest of State:
$1.00 per member per
billable hour (75 ft2) or
$1,350 per member
annually
Northern Virginia uses an annual cost per square
foot of $24.00 for a total annual facility cost per
member of $1,800.
The rest of the state uses an annual cost per square
foot of $18.00 for a total annual facility cost per
member of $1,350.
A statewide attendance rate of 225 days per year
with 6 hours per day is applied. This equates to a
facility cost per member billable hour of $1.33 in
Northern Virginia and $1.00 in the rest of the state.
Arizona Department of Economic
Security Division of Developmental
Disabilities
Rebase Book, January 24, 2014
https://des.az.gov/s
ites/default/files/re
basebook_draft.pdf
$15.00 - $20.07 For Adult programs, urban and rural rate models
are used. Ranging from 125 (urban) to 271 (rural)
square feet per member at a flat rate ranging from
$15.00 (rural) to $20.07 (urban).
Truven Primary Source Value $0.80 per hour of direct care
MN DHS currently uses a rate of $19.30 per week, per member for facility use, only applied to day services.
The most prevalent comparison for facility use in other states is reflected as an amount per direct hour of
care. Based on this data, we suggest $0.80 per direct care hour. This rate has a different denomination but
fits most closely with the present MN framework for HCBS services. Many available resources recommend
a given square-footage and cost per square-foot, which are not considered within the current MN rate
framework.
Page 75
PAGE 69
May 31, 2016 ▪ ©Truven Health Analytics, an IBM Company ▪ www.truvenhealth.com
B.11 Transportation MN Framework Definition Transportation - In residential, the cost of the vehicle. In Daily DTH, covers the cost of the vehicle, mileage, and time.
Sources Table
Current Rates Day Varies – See Appendix B
Residential Standard Vehicle $1680, Adapted Vehicle $3000 (Annually)
Unit with Programming N/a
Unit without Programming N/a
Transportation
Source Link Rate Notes
National
Internal Revenue Service (IRS)
2016 Standard Mileage Rates for
Business, Medical and Moving
Announced
https://www.irs.gov/
uac/Newsroom/2016
-Standard-Mileage-
Rates-for-Business-
Medical-and-
Moving-Announced
$0.54 per mile for
business miles driven
2016 optional standard mileage rates used to
calculate the deductible costs of operating an
automobile for business, charitable, medical or
moving purposes.
The 2016 business mileage rate decreased 3.5 cents
per mile from the 2015 rate.
IRS rate could be considered minimum for
taxpayers since taxpayers always have the option of
calculating the actual costs of using their vehicle
rather than using the standard mileage rates.
U.S. Department of Veterans Affairs
Health Benefits: Beneficiary Travel
(BT): Mileage Rates
http://www.va.gov/h
ealthbenefits/vtp/ben
eficiary_travel.asp
$0.415 per mile with a
$3.00 deductible for each
one-way trip or $6.00 for
each round-trip
Upon reaching $18.00 in deductibles or six one-
way (three round) trips, whichever occurs first, in a
calendar month mileage reimbursement payments
for the balance of that month will be free of
deductible charges.
Minnesota
Minnesota Management & Budget https://www.mn.gov/
mmb/images/201512
21.pdf
$0.47 per mile for state-
owned vehicles
MN follows the IRS guidelines for when employees
travel using their own vehicle ($0.54 per mile). Use
Page 76
PAGE 70
May 31, 2016 ▪ ©Truven Health Analytics, an IBM Company ▪ www.truvenhealth.com
Transportation
Source Link Rate Notes
MN Memo: IRS Mileage Rate Effective
January 1, 2016
$0.54 per mile for
personal vehicles
of a state vehicle is reimbursed at the lower rate
shown.
Minnesota Department of Human
Services
Special Transportation Procedure
Codes, Modifiers and Payment Rates
http://www.dhs.state.
mn.us/main/idcplg?I
dcService=GET_DY
NAMIC_CONVERS
ION&RevisionSelect
ionMethod=LatestRe
leased&dDocName=
id_016391#
$11.50 per encounter per
trip
Non-emergency transportation; encounter per trip.
Minnesota Department of Human
Services
Special Transportation Procedure
Codes, Modifiers and Payment Rates
http://www.dhs.state.
mn.us/main/idcplg?I
dcService=GET_DY
NAMIC_CONVERS
ION&RevisionSelect
ionMethod=LatestRe
leased&dDocName=
id_016391#
$1.30 per mile
Non-emergency transportation; mileage, per mile.
Comparison States
Colorado
Employee Mileage Reimbursement
Rate
https://www.colorad
o.gov/pacific/osc/mil
eage-reimbursement-
rate
$0.49 - $0.51 per mile
For employees, Colorado uses 90% of the IRS rate
for 2 wheel drive vehicles ($0.49 per mile). As
necessary, 4-wheel drive is authorized at 95% of
the IRS rate ($0.51 per mile) due to road, terrain, or
adverse weather conditions.
The IRS rate is $0.54 per mile
Georgia Department of Behavioral
Health and Developmental Disabilities
Residential and Respite Cost Study-
Final Rate Models, September 17, 2015
Final Rate Models
https://dbhdd.georgia
.gov/sites/dbhdd.geor
gia.gov/files/related_
files/site_page/Final
RateModels_Septem
ber%2017%202015.
pdf
$0.278 - $0.575 per mile
Group Homes with capital cost: $0.278 per mile
Group Homes without capital cost: $0.335 per mile
All other: $0.575 per mile
Page 77
PAGE 71
May 31, 2016 ▪ ©Truven Health Analytics, an IBM Company ▪ www.truvenhealth.com
Transportation
Source Link Rate Notes
Oregon Office of Developmental
Disabilities Services
Review of Provider Rates for
Employment and Day Support
Services-Proposed Rate Models,
October 29, 2015
Proposed Rate Models
http://www.burnshea
lthpolicy.com/wp-
content/uploads/2015
/10/Proposed-Rate-
Models.pdf
Proposed
$0.575 per mile
Current
$0.50 per mile
Maine Office of Aging and Disability
Services
Section 21 Rate-Setting Initiative
Final Rate Models, February 3, 2015
Final Rate Models
http://www.maine.
gov/dhhs/oads/doc
s/MEOADSRateM
odelsProposedFina
l.pdf
$0.32 - $0.575 per mile Agency Home Support, Supported Living, Work
Support, and Community Support with capital cost:
$0.278 per mile
Agency Home Support, Supported Living, Work
Support, and Community Support without capital
cost: $0.278 per mile
All other: $0.575 per mile
Virginia Department of Behavioral
Health and Developmental Services
My Life, My Community Provider Rate
Study - Final Rate Models, April 23,
2015
Final Rate Models
http://www.dbhds.
virginia.gov/library
/developmental%2
0services/dds%20fi
nal%20waiver%20
rate%20models%2
02015%20april%2
023.pdf
$0.26 - $0.575 per mile Residential Supported Living, group home, work
crew: $0.26 per mile
Day Supports: $0.335 per mile
Day In-home Residential Support, community
access: $0.575 per mile
The assumed number of miles driven and number
of members per vehicle vary by service type and
are taken into consideration when developing the
overall rate. As a result, the total mileage cost
varies.
Arizona Department of Economic
Security Division of Developmental
Disabilities
Rebase Book, January 24, 2014
https://des.az.gov/s
ites/default/files/re
basebook_draft.pdf
$0.565 - $0.82 per mile
Mileage reimbursement of $0.565 per mile except
for Day treatment and training: $0.82 per mile
Page 78
PAGE 72
May 31, 2016 ▪ ©Truven Health Analytics, an IBM Company ▪ www.truvenhealth.com
Transportation
Source Link Rate Notes
Truven Primary Source Value Day: Use survey result
For Day services, tiered transportation rates are used based upon the following criteria: (a) the use and
requirement of a lift, (b) whether the vehicle is shared, and (c) the mileage driven. We suggest ensuring that
the individual tiered rates for no lift required has an average mileage rate that meets a minimum, or base
rate, matching the Minnesota Management & Budget rate of $0.54 per mile for when personal vehicles are
used. This will cover the costs associated with vehicle and travel. The Minnesota Management suggested
rate is based on the standard IRS rates. To ensure that rates adequately reflect the fluctuating nature of
vehicle related transportation costs, it is suggested that an annual review of the updated Minnesota
Management & Budget rate is performed and assessed if rate adjustments are warranted. If Minnesota
Management & Budget has not released an update rate at the time of review, the IRS Standard mileage rates
would be a reasonable substitution for comparison. This combined method with rates above the state
mileage rate helps to address concerns about mileage and time required for extended driving distances for
services provided in rural or remote areas.


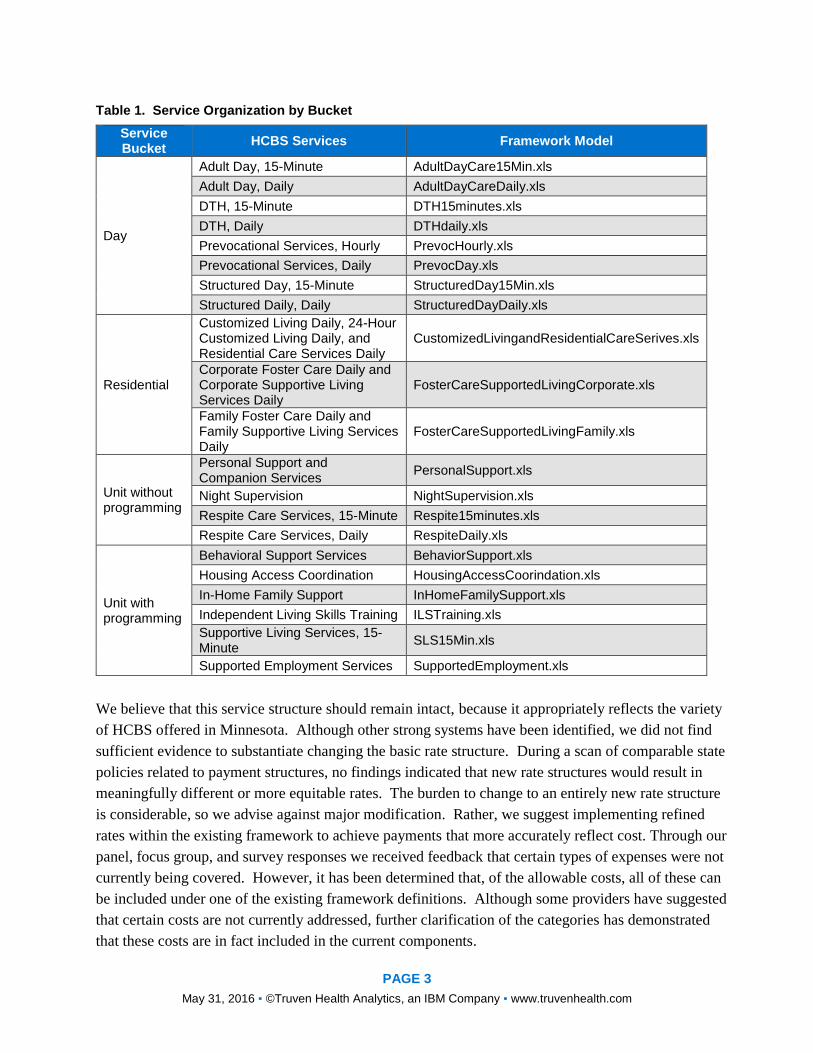

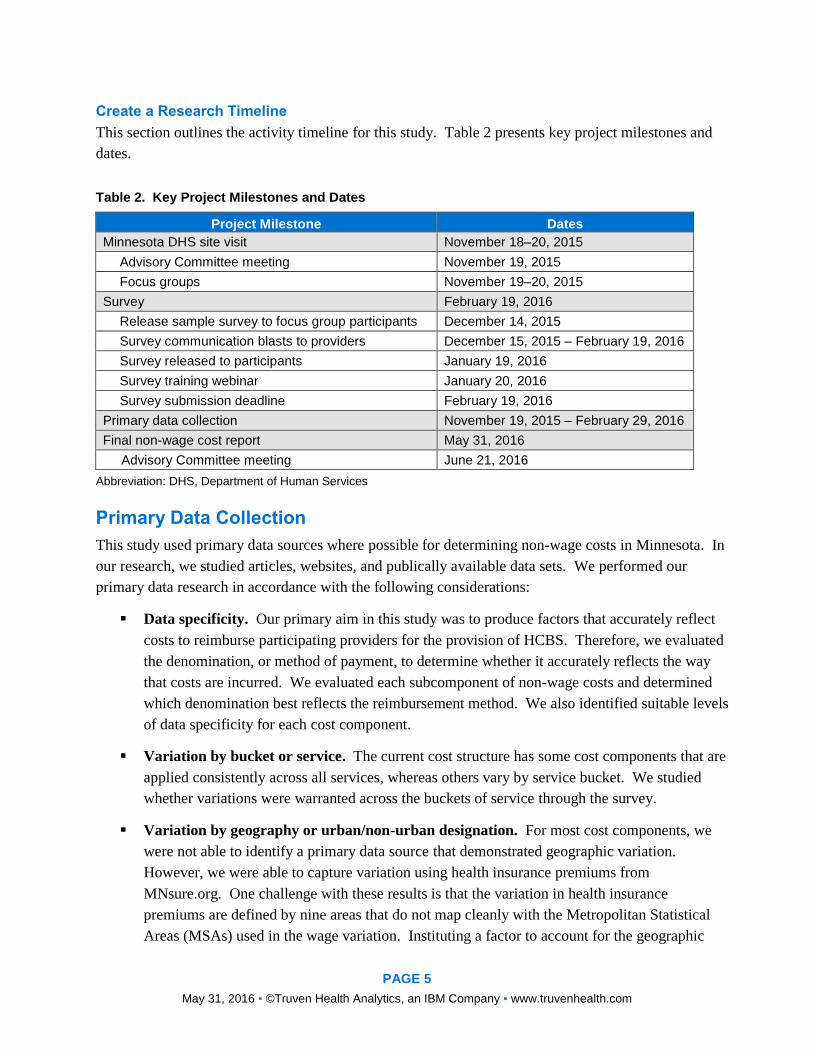


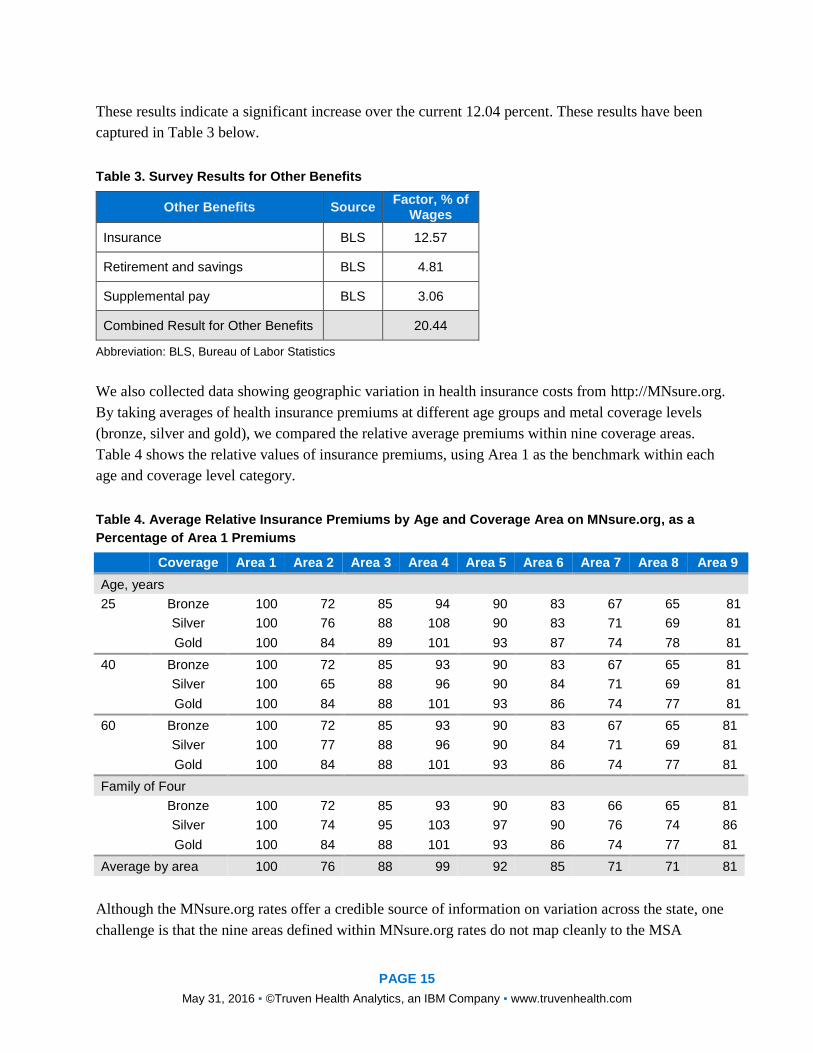


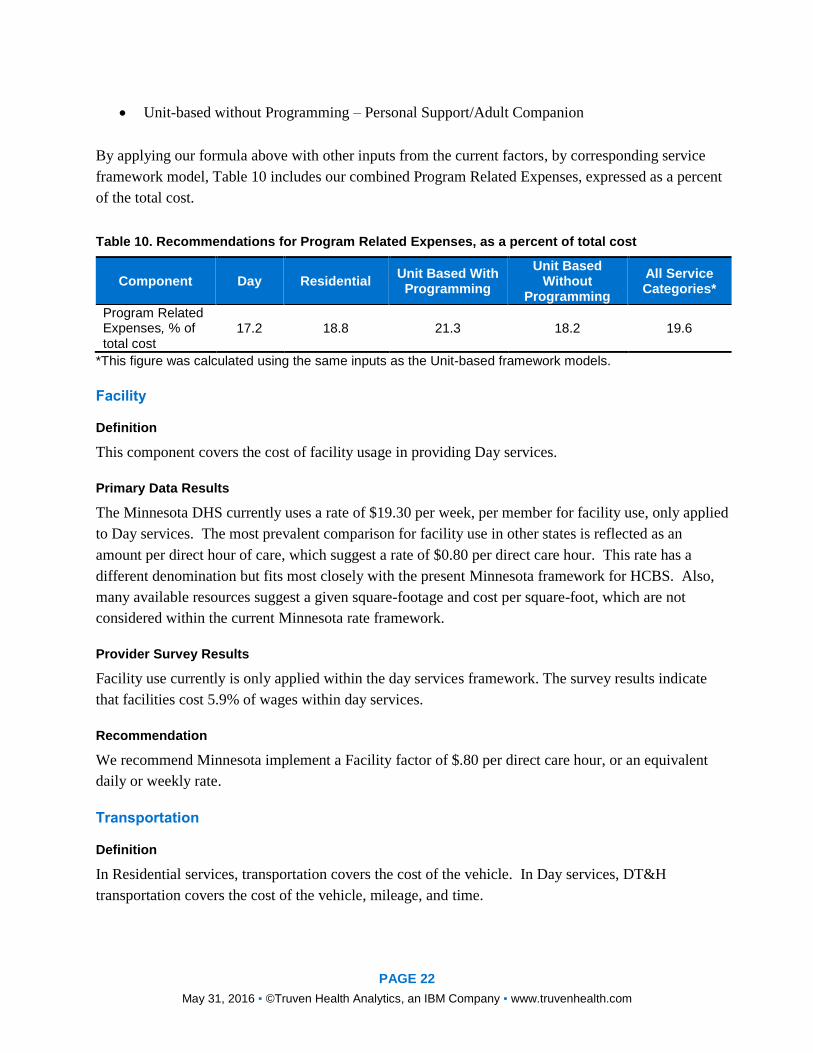

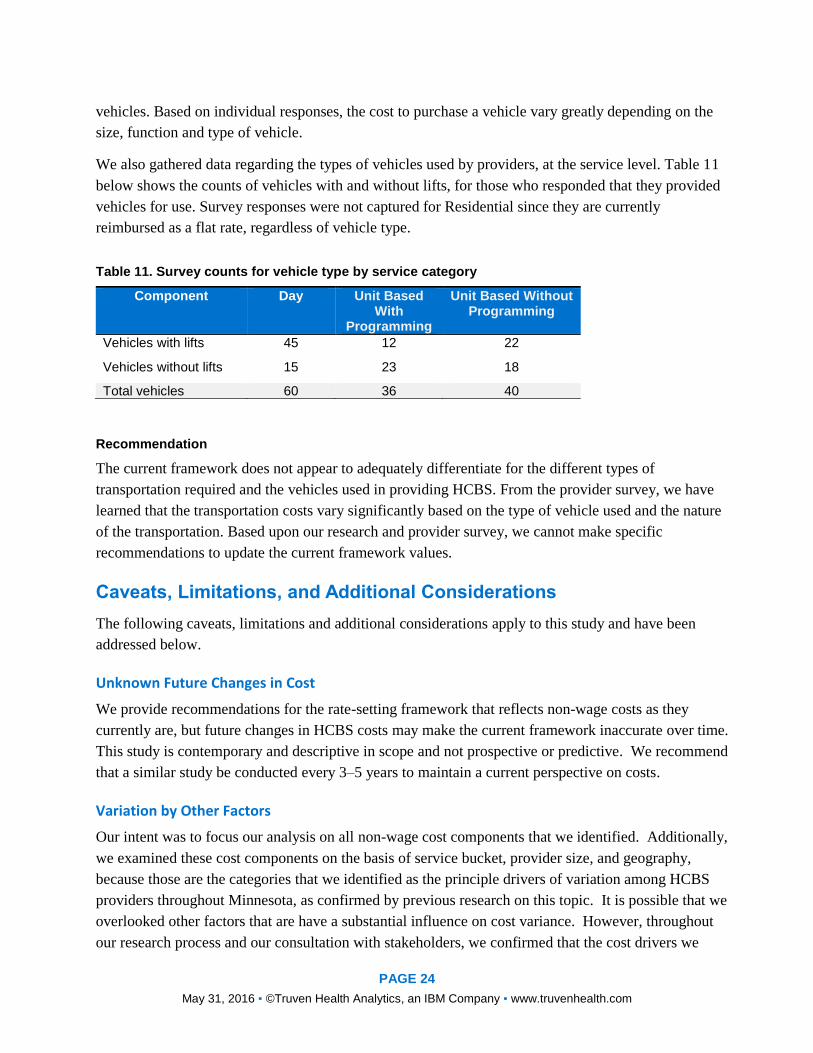


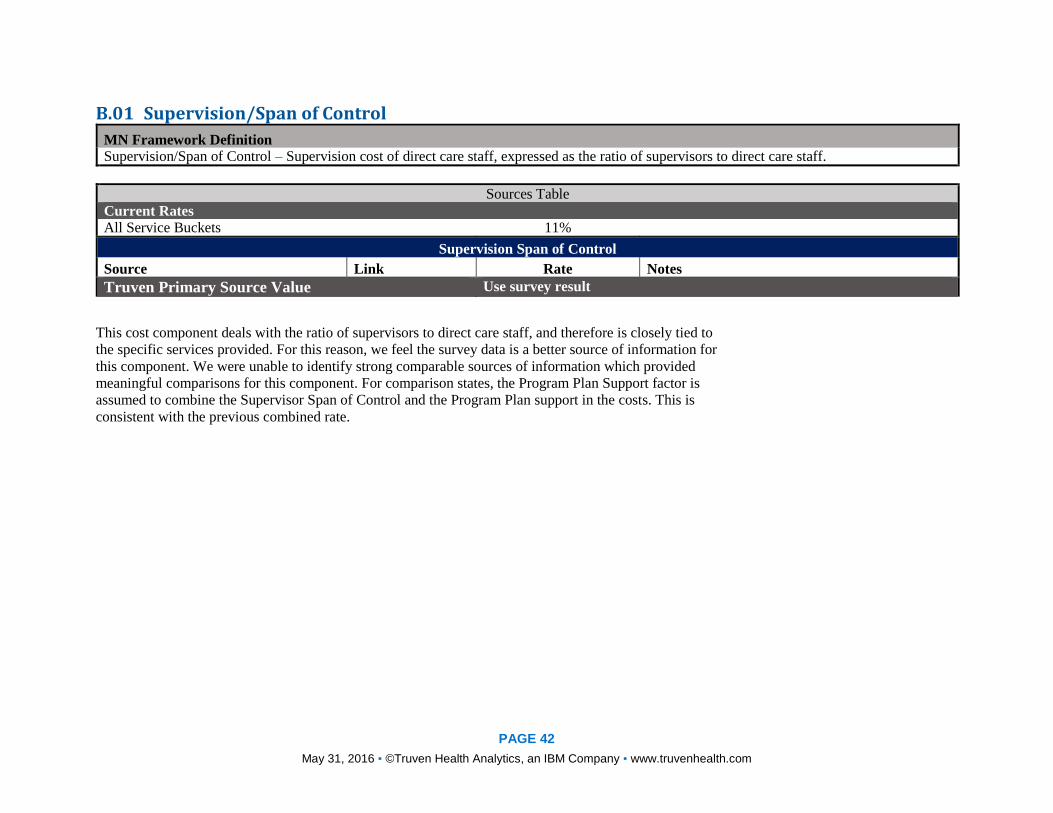


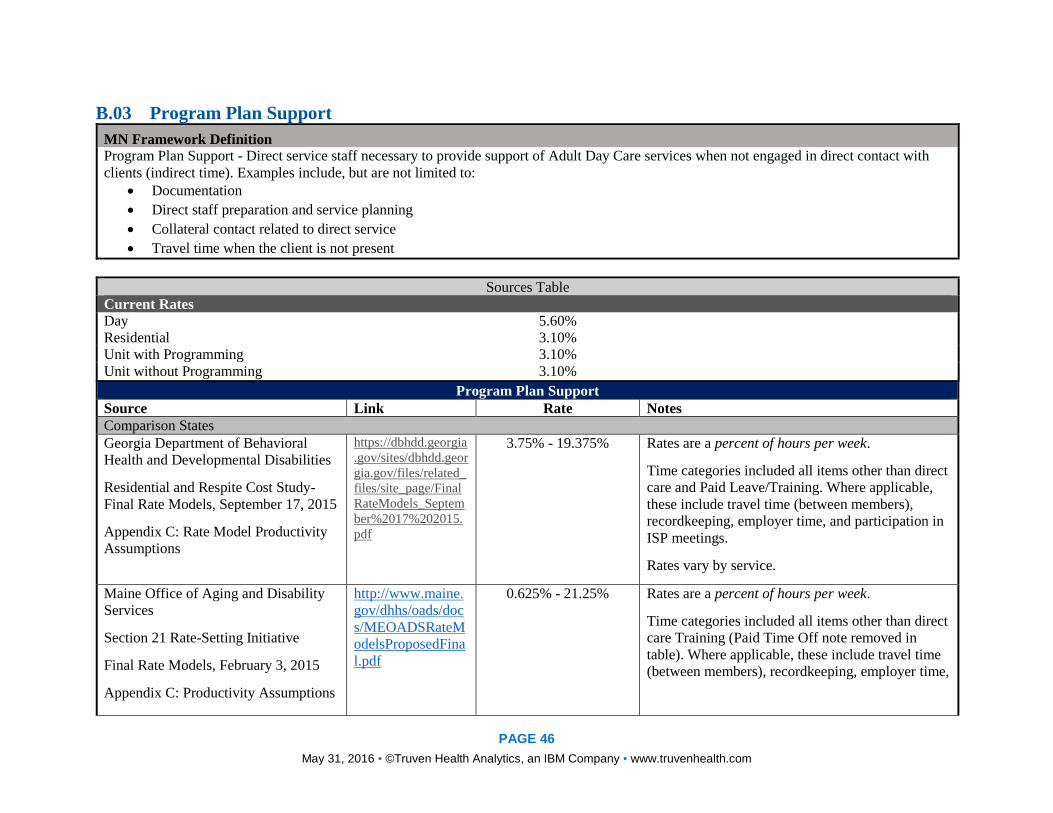
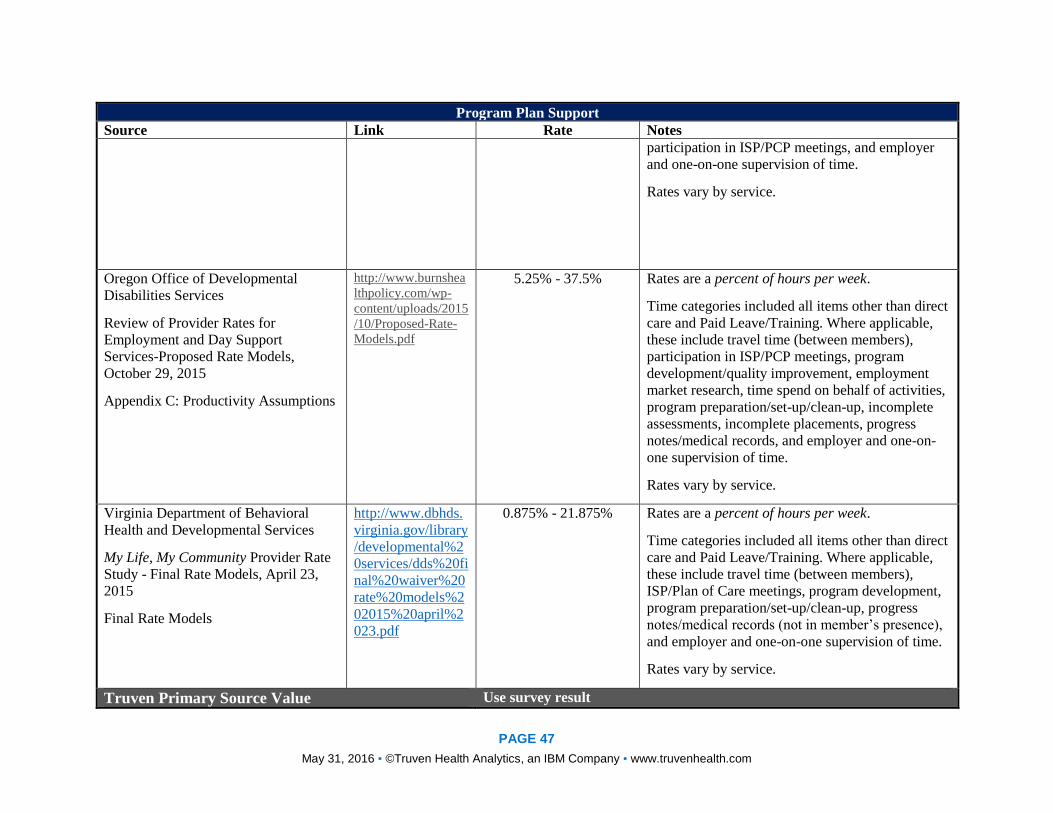
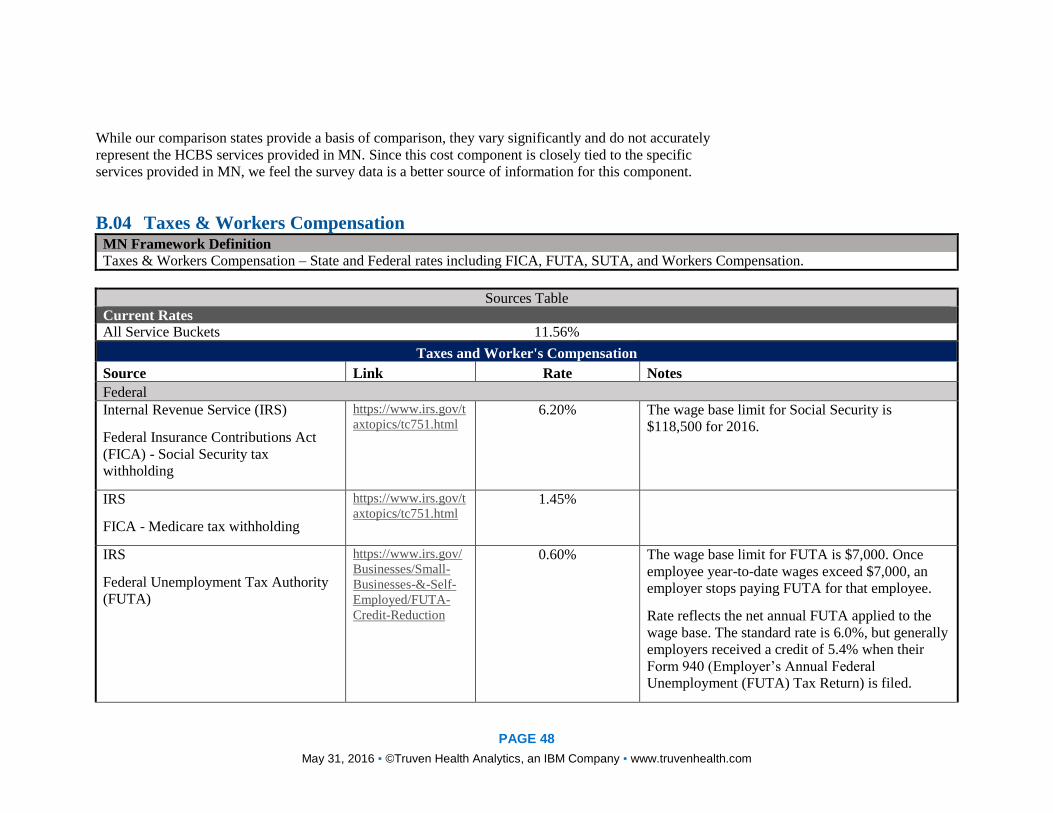
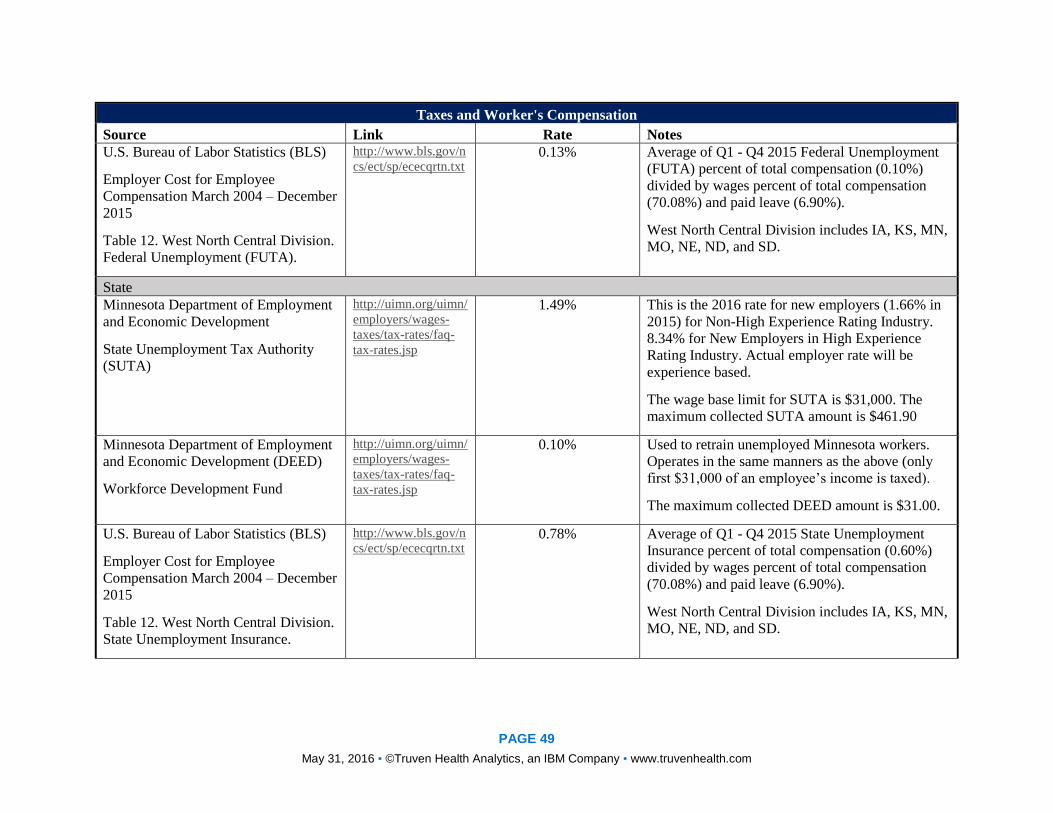
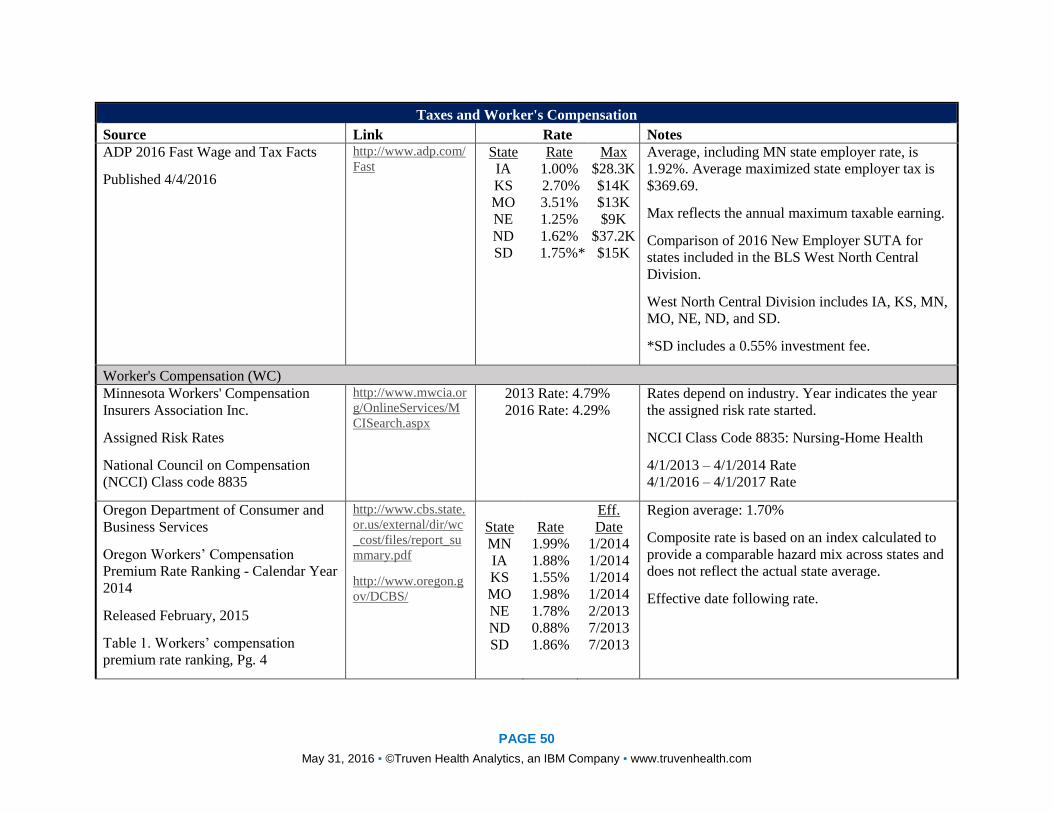


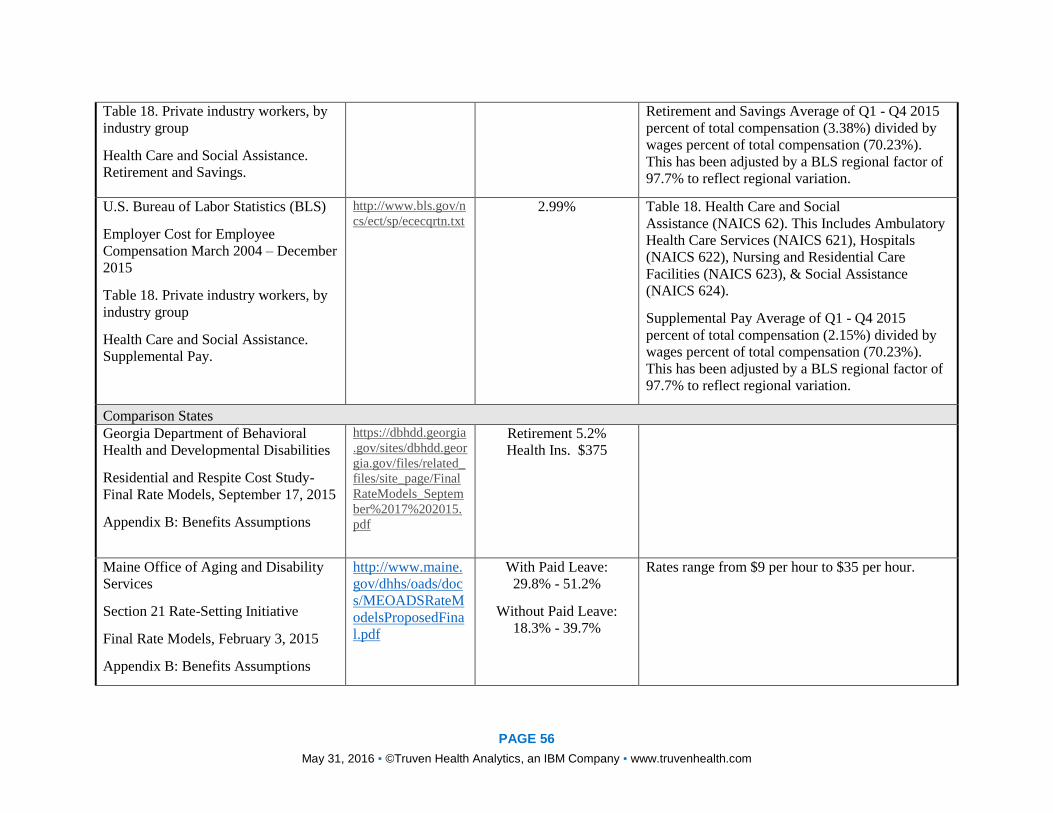


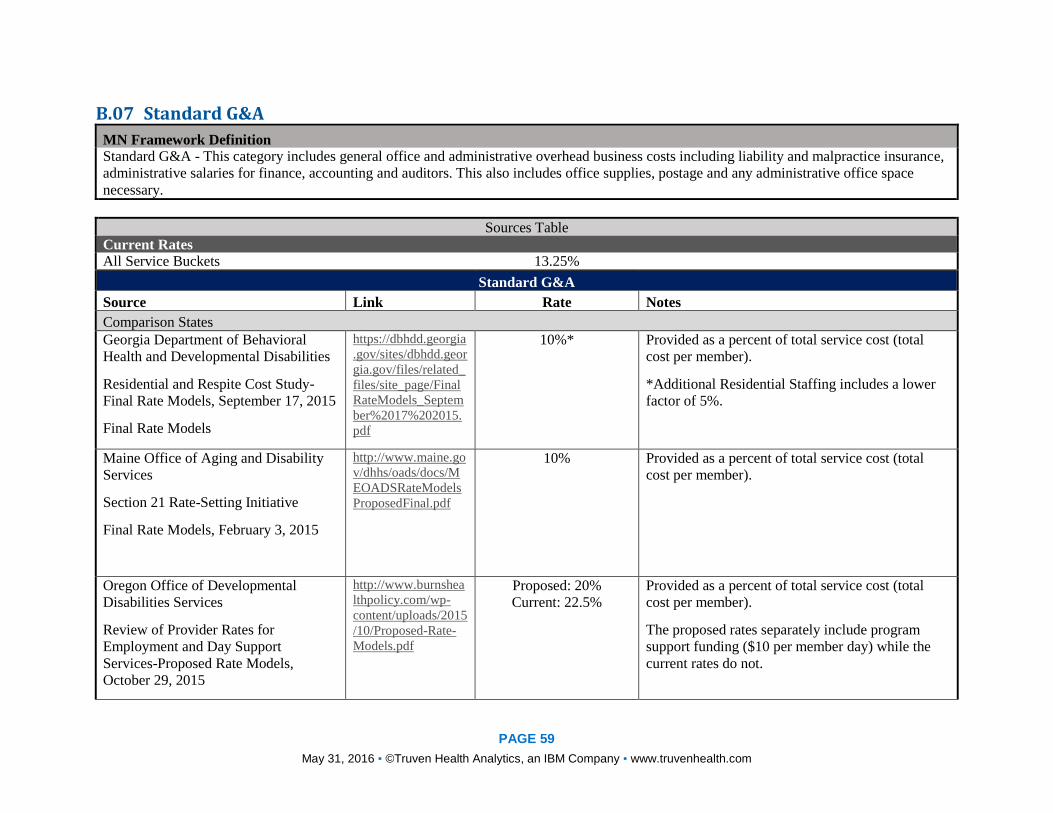
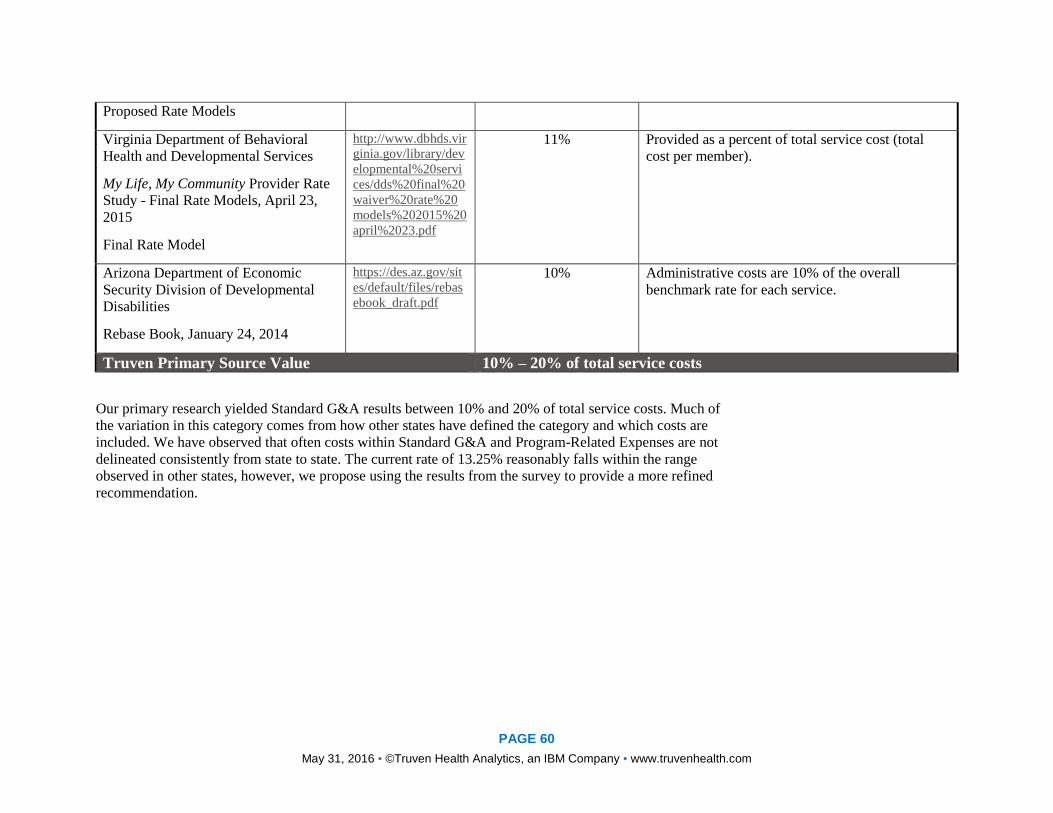


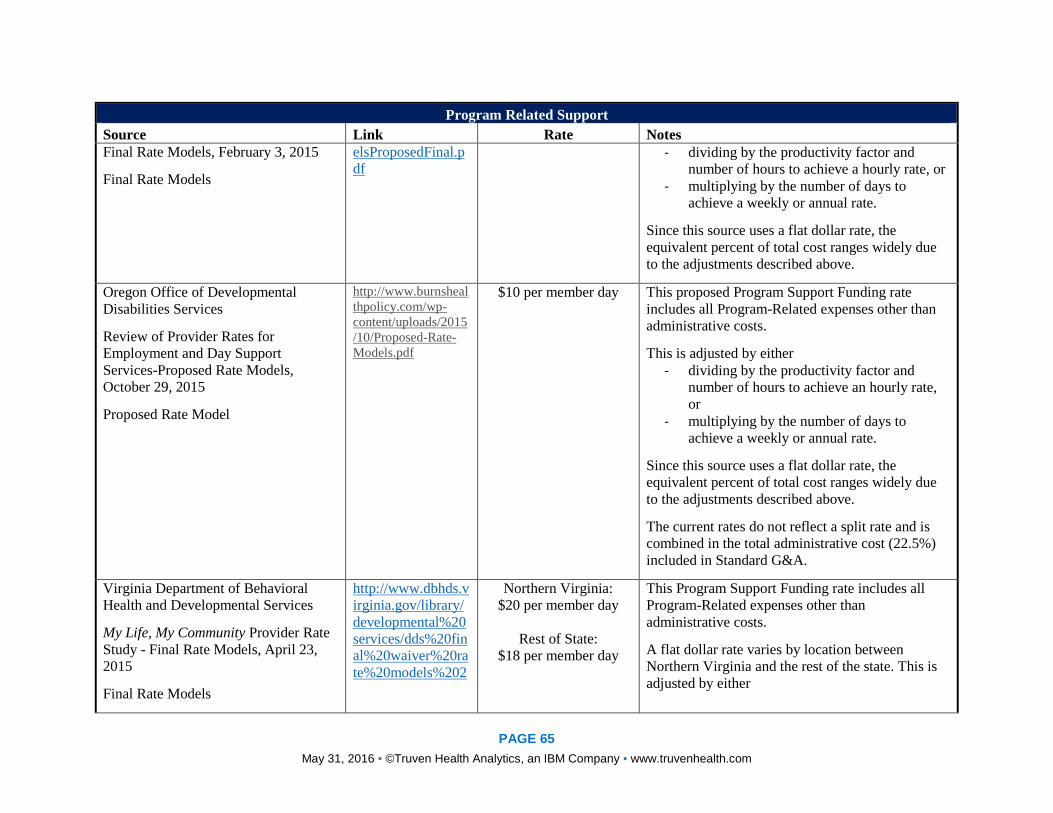

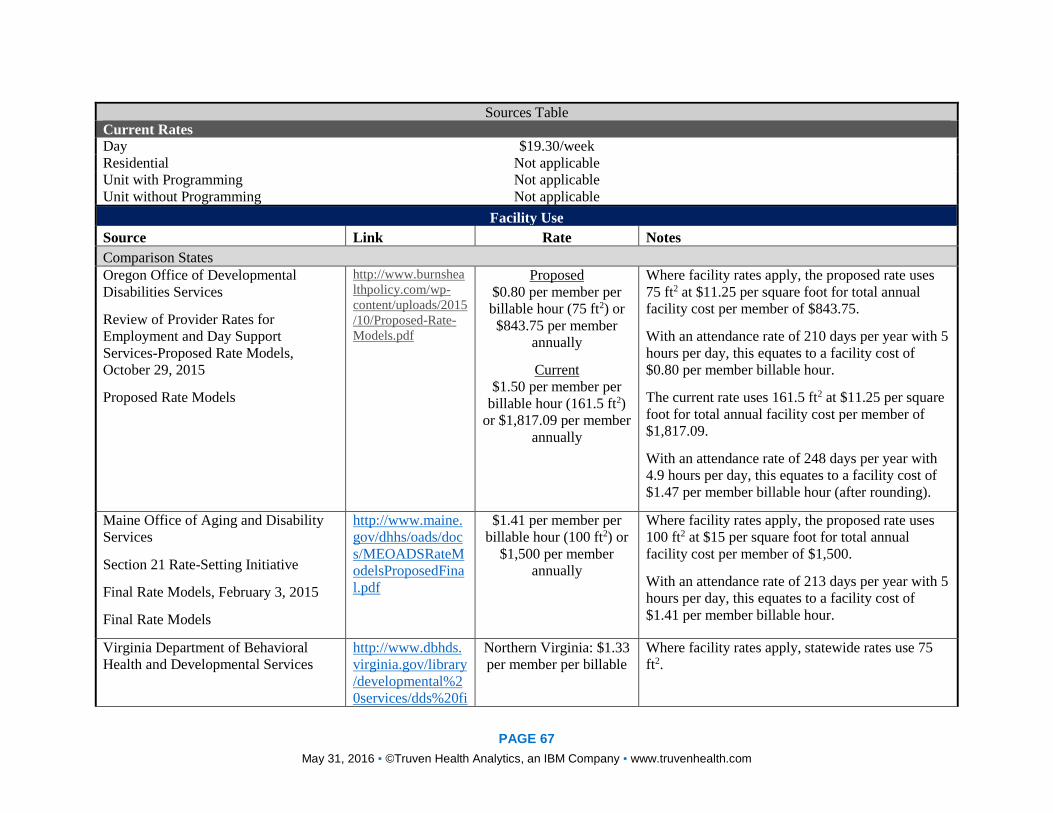

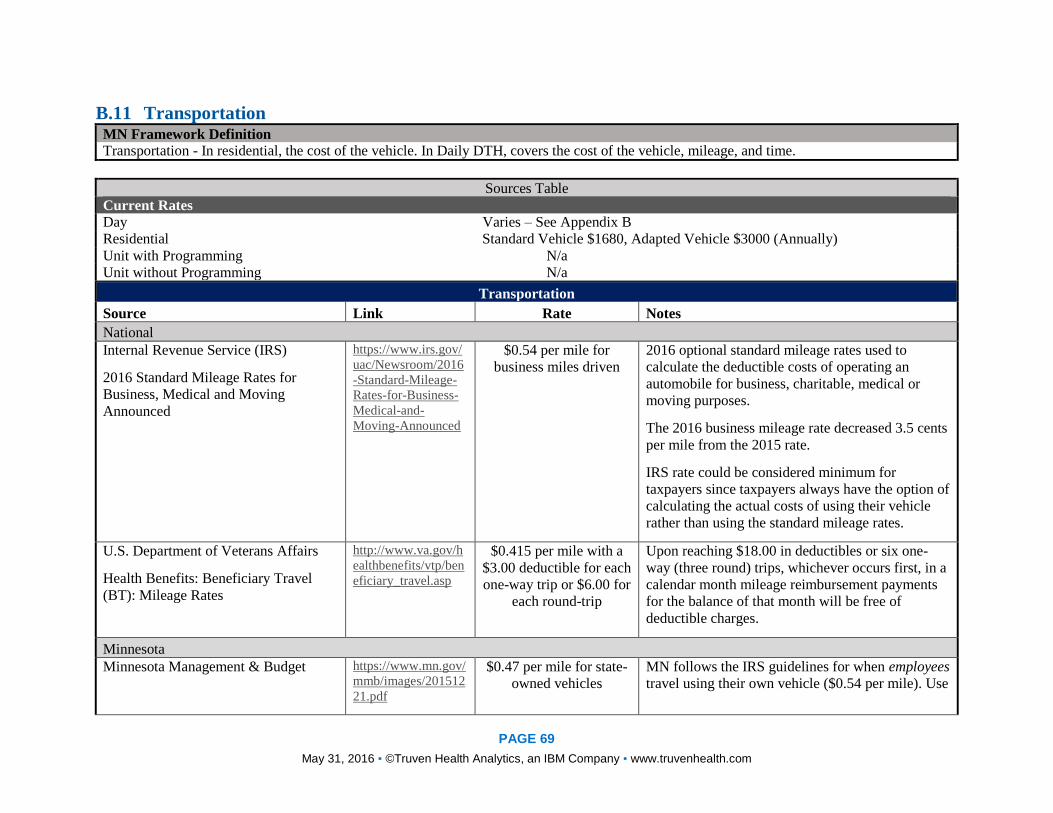

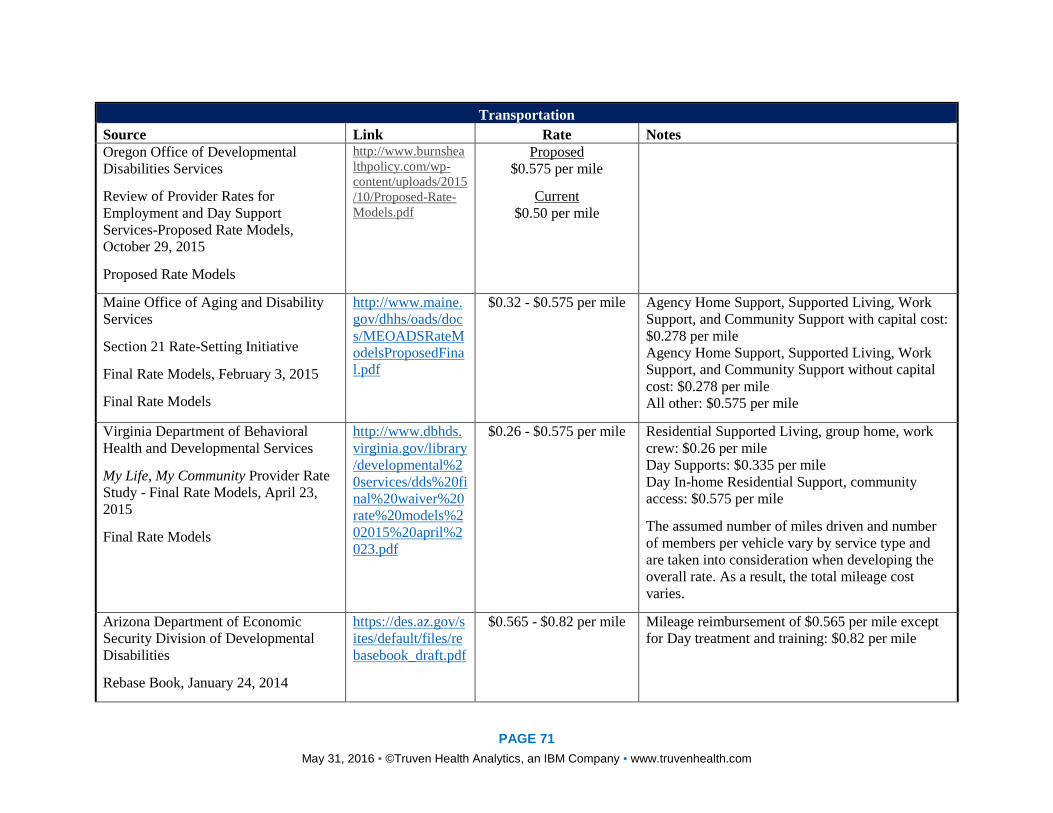


![DTH [Compatibility Mode]](https://static.documents.pub/doc/80x56/544f4cd3af7959e51e8b52d5/dth-compatibility-mode.jpg)


