39
Youth in the Prosperity of Cities Overview and Summary of Findings STATE OF THE URBAN YOUTH 2012/2013
| Date post: | 08-Apr-2016 |
| Category: |
Documents |
| Upload: | joao-scarpelini |
| View: | 217 times |
| Download: | 2 times |

The increasing prominence of the youth bulge in most urban areas presents a unique opportunity, as they represent the most dynamic human resource available. Their numbers today are larger than at
any point in human history. Yet this group suffers the most from urban unemployment and often feels that they lack equal access to opportunities. This is especially acute in developing countries, which have a relatively youthful population that must be mobilised to realise greater economic and social
development goals.
Today, 90 million youth around the world are unemployed (or 47 per cent of the total number of unemployed) and an additional 300 million belong in the “working poor” category —they are in
unskilled, insecure jobs and live in poor conditions. This Report takes a closer look at the condition of youth in major urban centres in four developing nations - Accra (Ghana), São Paulo (Brazil), Bangalore
(India) and Cairo (Egypt).
The conditions of these cities, and the way they are perceived by young people, are seen as representative of those in their respective regions, and therefore provide a reasonable basis for policy
recommendations focused on shared prosperity for urban youth. The four-city survey demonstrates that young people suffer disproportionately from poor prospects and
low quality employment.
The developing world continues to feature the fastest growing numbers of youth unemployment and persistent rural-to-urban migration; if these young people are to realise their potential, they need
innovative solutions that are anchored in local realities.
Survey outcomes suggest that educational and training systems must be better aligned with the current and future needs of young people. In this regard,
it would be helpful to share experiences and to investigate alternative educational arrangements for the provision of basic literacy, job skills training
and lifelong education. This Report is a step in that direction.
Young people in the survey want equity for better shared prosperity both for their own and their cities’ benefit, and they regard education as the best way of bringing about a more equitable type
of urban development. They point to other significant challenges like structural constraints and lack of a democratic culture in their respective cities. These are issues over which local authorities
wield a degree of influence that puts them in the best possible position to take remedial action. Local authorities must also seek to mainstream youth issues into all aspects of their planning and
operations policy areas.
The report recommends a better match between skills and labour markets through vocational training and with the participation of the private sector. ‘Soft’ skills matter more in service-oriented economies, young people in informal settlements need entrepreneurial abilities, and capacities must
be better geared to knowledge-intensive business services.
Youth in the Prosperity of CitiesOverview and Summary of Findings
United Nations Human Settlements ProgrammeP.O.Box 30030,Nairobi 00100,Kenya;Tel: +254-20-7623120; Fax: +254-20-76234266/7 (central office)[email protected]
www.unhabitat.org
Youth in the Prosperity of CitiesOverview and Summary of Findings
STATE OF THEURBAN YOUTH
2012/2013

State of the Urban Youth Report 2012/2013
ii
Acknowledgements
Core TeamDirector and Principal Author: Oyebanji Oyelaran-Oyeyinka
Coordinators: Mutinta Munyati, Subramonia Ananthakrishnan
Contributors and Advisors: Hoda Mansour, Sarah Bryce, Padma Prakash, Ndali Ojeikere, Kaushalesh Lal, Boladale Abiola Adebowale, Willem Kt Vanvliet, Paul Wambua, Victoria Chebet, Catherine Tololwo, Guenter Karl, Markandey Rai, Douglas Ragan, Thierry Naudin.
Design and Layout: Andrew Ondoo
Cover Images: Left: Young businessman outside his office. © elwynn / Shutterstock.
Right: Construction workers in residential part of Old Delhi. ©Paul Prescott / Shutterstock
Sponsor: Government of Norway
First published in Nairobi in 2012 by UN-Habitat. Copyright © United Nations Human Settlements Programme 2012
All rights reserved United Nations Human Settlements Programme (UN-Habitat) P. O. Box 30030, 00100 Nairobi GPO KENYA Tel: 254-020-7623120 (Central Office) www.unhabitat.org
Disclaimer
The designations employed and the presentation of the material in this publication do not imply the expression of any opinion whatsoever on the part of the Secretariat of the United Nations concerning the legal status of any country, territory, city or area or of its authorities, or concerning the delimitation of its frontiers of boundaries.
Views expressed in this publication do not necessarily reflect those of the United Nations Human Settlements Programme, the United Nations, or its Member States.
Excerpts may be reproduced without authorization, on condition that the source is indicated.

iiiii
Overview and Summary of Findings
I am pleased to present the second State of the Urban Youth report focusing on Youth and the Prosperity of Cities. This Report builds on the 2010/11 edition, “Leveling the Playing Field – Inequality of Youth Opportunity” and its insights into the state of urban youth. Much like the findings of the previous report, this one provides further evidence of the fundamental importance of job oriented education to the development of urban youth.
At a time when the global economy is looking for paths to recovery and seeking innovative, ideas to rejuvenate itself, young people may offer the best hope. The events of the Arab Spring demonstrated that youth can be a powerful social force for positive change. The unexpected nature of these events, point to an underlying problem that afflicts youth in all corners of our world. The question is, why, in an increasingly urbanised world, are young people underappreciated by many governments and not at the forefront of economic activity and innovation?
The increasing prominence of the youth bulge in most urban areas presents a unique opportunity, as they represent the most dynamic human resource available. Their numbers today are larger than at any point in human history. Yet this group suffers the most from urban unemployment and often feels that they lack equal
access to opportunities. This is especially acute in developing countries, which have a relatively youthful population that must be mobilised to realise greater economic and social development goals.
Today, 90 million youth around the world are unemployed (or 47 per cent of the total number of unemployed) and an additional 300 million belong in the “working poor” category —they are in unskilled, insecure jobs and live in poor conditions. This Report takes a closer look at the condition of youth in major urban centres in four developing nations - Accra (Ghana), São Paulo (Brazil), Bangalore (India) and Cairo (Egypt).
The conditions of these cities, and the way they are perceived by young people, are seen as representative of those in their respective regions, and therefore provide a reasonable basis for policy recommendations focused on shared prosperity for urban youth. The four-city survey demonstrates that young people suffer disproportionately from poor prospects and low quality employment.
The developing world continues to feature the fastest growing numbers of youth unemployment and persistent rural-to-urban migration; if these young people are to realise their potential, they need innovative solutions that are anchored in local realities.
Survey outcomes suggest that educational and
Foreword

State of the Urban Youth Report 2012/2013
iv
training systems must be better aligned with the current and future needs of young people. In this regard, it would be helpful to share experiences and to investigate alternative educational arrangements for the provision of basic literacy, job skills training and lifelong education. This Report is a step in that direction.
Young people in the survey want equity for better shared prosperity both for their own and their cities’ benefit, and they regard education as the best way of bringing about a more equitable type of urban development. They point to other significant challenges like structural constraints and lack of a democratic culture in their respective cities. These are issues over which local authorities wield a degree of influence that puts them in the best possible position to take remedial action. Local authorities must also seek to mainstream youth issues into all aspects of their planning and operations policy areas.
The report recommends a better match between skills and labour markets through vocational training and with the participation of the private sector. ‘Soft’ skills matter more in service-oriented economies, young people in informal settlements need entrepreneurial abilities, and capacities must be better geared to knowledge-intensive business services.
With their typical dynamism and energy, young people can exercise a unique multiplier effect on urban prosperity: the more they are allowed to benefit, the more they can give back, for the overall good of the society. “No nation can achieve prosperity unless it makes education one of its central concerns. Education brings honour, independence and freedom to a government and its people” - 16 year-old Supawat Yasothon province, Thailand.
Joan Clos Under-Secretary-General and Executive Director United Nations Human Settlements Programme
(UN-Habitat)
viv
Overview and Summary of Findings
Quick Facts: The cities and countries under review Ghana has a population of about 24 million, of which 27 per cent lives on less than 1.25 US dollar a day with 25 per cent of the working-age population unemployed. In 2010 population density was 107.2 per sq. km.
In 20011 Ghana’s gross domestic product (GDP – on a 2011 purchasing power parity (PPP) basis) per capita was USD3,100 ) to which the capital Accra contributes 33 per cent, and the labour force in 2010 totalled 11.5 million.
With an estimated population of 3.9 million, Accra is today one of the largest and fastest-growing cities in Africa, with an annual demographic growth rate of 3.3 per cent.
Accra is a youthful city, with an estimated 40.6 per cent of the population aged between 15 and 34 (in the year 2000). These are increasingly susceptible to poverty, with Accra’s unemployment (10.4 per cent) more than twice the national rate (4.1 per cent) or that of other urban areas in the country (4.7 per cent). In terms of gender
(15-24 years) female unemployment (9.1 per cent) is lower than male (11.8 per cent). Only 20.3per cent of Accra’s youth (15-24 years) are economically active.
India is one of the most populous nations in the world (1.3 billion) (with an annual demographic growth rate of 1.3 per cent. Some 30 per cent of the population live in urban areas (2010) and the annual urbanization rate of 2.4 per cent (2010-15 EST.).
Bangalore is the capital city in the State of Karnataka, south-central India. With an estimated population of 9.6 million in 2011, cosmopolitan Bangalore is the third most populous city in India. Roughly 10 per cent of the population live in slums, a relatively low proportion when compared with other cities in the developing world. Density was 4,378/sq.km. in 2011 ( 2,985/ sq.km. in 2001). The total area under Bangalore district jurisdiction is 2,190 sq.km.
Average literacy rate (2011) is 88.5 per cent. The total number of literate residents in Bangalore District was 7,609,962 (2011) of which 4,146,709 male and 3,463,253 female.
More than 62 per cent of Bangalore’s population is between 19 and 34 years old. Including over 15 year-olds, the proportion rises
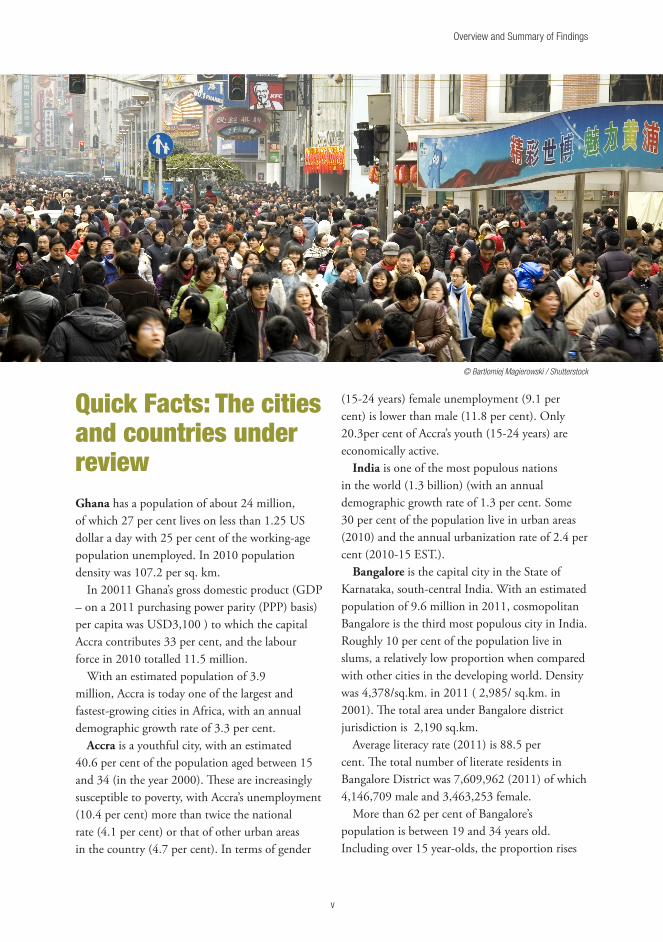
© Bartlomiej Magierowski / Shutterstock

State of the Urban Youth Report 2012/2013
vi
to 64 per cent. The workforce is predominantly aged 24 to 29. In the past, Bangalore had hardly any slums and almost all areas were equally well provided with basic amenities. This is not the case today and young people are very concerned about a deterioration which affects them deeply. Finally, 42 per cent of the population use public transport.
Brazil is the largest country in South America with a population expected to reach 205 million by end of 2012, with a density of 23.04/sq. km and a population growth rate of 1.1 per cent.
São Paulo is the country’s largest city with a population of 20 million over an area of 1,525 sq.km. It is the financial and economic capital of Brazil.
São Paulo has the largest slum population in South America (about four million, or 20 per cent of the total population). The rapid growth of informal housing dates back to 1980, when they were host to only five per cent of the population. Although both natural growth and rural-urban migration have reduced significantly, the housing problem remains immense in São Paulo.
Brazil’s population growth rate was 1.26 per cent between 2005 and 2010. The urban population was 164 million in 2010 and is expected to reach 174 million by 2015 (or 87 per cent of the total population).The Municipality of São Paulo is home to 1.8 million young people between 15 and 24 years of age, representing just over 16 per cent of the city’s total population (11.2 million).
Some 62 of Brazilians are aged 29 or under. The youth (15-24) unemployment rate stands at 17.8 per cent. In 2011, GDP per capita rose to USD11,600 (USD10,700 in 2010). São Paulo alone is responsible contributes 40 per cent to national GDP.
Egypt is the most populous country in the Middle East and the third-most populous on the African continent (after Nigeria and Ethiopia). Cairo(al-Qahirah- population: over 11.2 million) is one of the most densely populated cities in the world (1,540/ sq.km.) and is home to 21.5 per cent of the country’s total population.
Egypt’s GDP per capita was USD6,500 in 2011 Cairo accounts for 50 per cent of national GDP and 40 per cent of manufacturing outputs. Despite the relatively high rates of economic growth in recent years, living conditions for the average Egyptian have remained poor, contributing to public discontent. The unemployment rate was an estimated 12.2 per cent in 2011, up from 9% in 2010, as rural-to-urban migration remains significant.
In Cairo, the labour force is about 2.2 million and 9 per cent of the population live in poverty, out of which 2.2 per cent are in extreme poverty.
While Cairo is one of the largest cities in the world, it holds an average position in terms of services, and a relatively low one for economic and financial wealth.
SOURCES: Ghana: World Population Prospects;
World Development Prospects; Human
Development Report 2010; UNDESA, 2010; CIA,
World Fact Book, 2011; World Bank National
Accounts Data; ILO, 2011; Population of Accra,
Ghana, 2010. India: CIA, World Fact Book, 2011;
2011 Census. Brazil: UN Population Division, World
Population Prospects 2011; CIA, World Fact Book,
July 2012; World Bank, 2011; 2010 National
Census. Egypt: UNDESA, World Urbanization
Prospects - The 2011 Revision; CIA, World Fact
Book, 2011.
viivi
Overview and Summary of Findings
Main Findings, Messages and Policy Recommendations
1. The Youth Bulge: The Demographic Dynamics
A rising youth population – what is generally known as the “urban youth bulge” – makes it imperative to address the various dimensions of urban youth against the broader background of prosperity. Youth are society’s most important and dynamic human resource. There are more people under the age of 25 today than ever, totalling nearly three billion - or half of humankind − of which 1.3 billion between ages 12 and 24. Most live in urban areas.
2. More Youth, More Youth PovertyUrban areas in developing countries account for over 90 per cent of the world’s urban demographic growth, and it is estimated that as many as 60 per cent of all urban dwellers will be under the age of 18 by 2030, with most living in slums and informal settlements. Nearly 45 per cent of young people around the world— almost 515 million—live on less than two US dollars a day.
3. 50 per cent youth unemployed, and Large Numbers are “Working Poor”
Today nearly 90 million young people around the world are unemployed (47 per cent of the total number of unemployed) and an additional 300 million are “working poor”—i.e., in unskilled, insecure employment, and in unsatisfactory conditions. The vast majority work in the informal sector and live in slums. Indeed, 85 per cent of the new employment around the world is informal and slum-based, forcing young people into low-income jobs with little scope for advancement. The largest number of youth in this situation is in Africa.
Young people suffer disproportionately from low-quality employment with poor prospects – ‘dead-end’ jobs. They are more likely than adults to be among the working poor, i.e. low-paid employment. About 152 million young workers (more than a quarter) live in poor households (with per capita expenditure below USD1.25 a day)1. Young people account for 24 per cent of the world’s total working poor, compared with 18 per cent of all global employment.
1 (ILO, 2010).
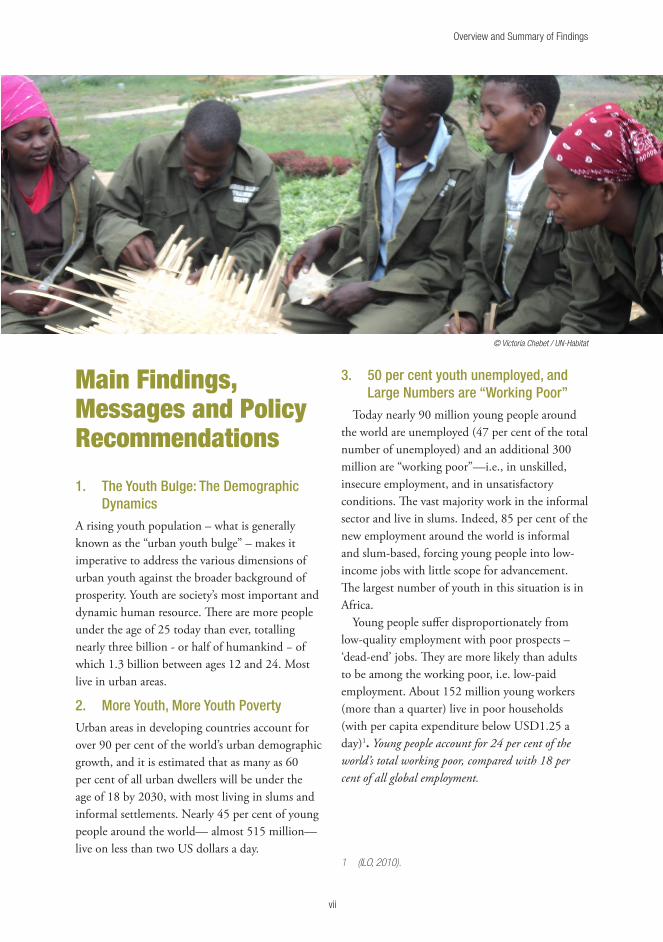
© Victoria Chebet / UN-Habitat

State of the Urban Youth Report 2012/2013
viii
4. 50 per cent of young people believe economic growth is not generating employment for them
The UN-Habitat Youth Survey shows that 52 per cent of respondents were positive about the ability of urban economies to generate employment for young people, except in Cairo where a large majority of respondents (96 per cent) took a negative view.
5. Education is the Key to Urban Employment Opportunities
Education is considered the key factor for equal opportunity and access to decent jobs. As many as 86 per cent of youth in the survey say that local access to primary school is free and equitable but this proportion falls to 36 per cent for secondary school and is negligible when it comes to higher education.This has serious implications for politics and policy-making — the operations of government, legal systems, and regulatory agencies, and indeed, of all the institutions that assign and enforce individual rights and mediate conflicts among citizens— is influenced by the distribution of political power (or influence, or ‘voice’) in society. Inefficiency or asymmetry of access to these institutions will perpetuate the institutional structures that preserve the interests of the most powerful to the detriment of large majorities of the population.
6. Sound Health and Education Infrastructure bring Quality of Life
Alongside education, the UN-Habitat Youth Survey points to health as the other main factor for human development and quality of life. This suggests that higher capital expenditure on health and education constitutes a sound development strategy and is one of the best uses to which cities can put their resources. Healthy children learn better and healthy adults work better— both being major assets to any city. Not unsurprisingly, education is regarded as the best way of gaining empowerment (‘agency’), reducing poverty and improving urban productivity.
7. Discriminatory Practices do not Promote Prosperity
A large proportion of the youths in multi-racial São Paulo (81 per cent) cited widespread discrimination based on race, ethnic origin or religion when it came to gaining opportunities to education and employment. However, in Accra (87.5 per cent), Bangalore (55.3 per cent) and Cairo (76 per cent) young survey respondents did not mention any such discrimination, and in all four cities, a significant majority (an overall 61 per cent) said there was no discrimination based on race, ethnic origin or religion.
8. Equity enhances the Productivity and Prosperity of Youth
Equity is perceived by young people as contributing to economy efficiency, which has a major role to play for the general well-being of any city. Equity also creates the conditions for individual capacity-building through quality education and skills, which in turn enhance individual ability for civic engagement, representation and participation in cultural and political life. Policy Action: provide universal public services and social protection, targeting underprivileged groups, together with wealth redistribution mechanisms.
9. The benefits of urban Prosperity are not evenly distributed
A substantially large percentage of young people in the four sample cities find that economic prosperity is not evenly distributed across the various social segments of their age cohort.
10. As many as 75 per cent of young people rank unemployment, unequal access to education and corrupt institutions as constraints on shared urban prosperity
Survey respondents ranked the main existing constraints on shared urban prosperity as follows: lack of employment, which was ranked the highest in Accra (80 per cent) and Bangalore (72 per cent). In Cairo, the highest factor was ruling

ixviii
Overview and Summary of Findings
elites’ control over public institutions (76 per cent) whereas youths in São Paulo chose unequal access to education.
11. Physical and Knowledge InfrastructureAdequate, well-managed infrastructure — improved water and sanitation, reliable and sufficient power supply, efficient transport networks and modern information and communications technology — contributes to wealth creation and prosperity in its various dimensions, such as raising quality of life and productivity. Cities with healthy, well-educated workforces are also more likely to be productive and competitive.
12. Over 50 Per cent Rank efficient Transport Infrastructure as Key to Prosperity
Over 50 per cent of respondents find that an efficient public transport system is essential for the proper functioning and prosperity of cities. Sustainable transport has brought huge benefits to a number of cities, enhancing their potential for shared prosperity. Apart from facilitating mobility, young respondents to the survey relate transport infrastructure directly and indirectly to six different outcomes: economic growth; improved access to health and education; improved quality of life; improved slum conditions, reduced poverty; and reducing spatial disparities.
13. Health, Education and mobility nurture Youth Prosperity
In all the cities except Cairo, the critical infrastructural factors contributing to urban youth prosperity are found to be “improving access to health and education” while the second most important factor is “facilitating mobility”.
14. Over 40 per cent believe Corruption and lack of Good Governance promote Inequality
Of the six factors interfering with urban prosperity, 42 per cent of young survey respondents rank corruption and lack of good governance as the major impediments. Next to corruption, inefficient and ineffective government
ranks very high, and more so in Latin America and Africa than in Asia and Arab States.
15. Knowledge and skill deficiencies hinder urban productivity (25 per cent)
25 per cent of young people in the survey rank lack of appropriate knowledge and skills development as the major impediment to youth’s contribution to urban productivity. Productive cities are gifted with an abundance of well-educated labour , sound infrastructure, mature financial markets, stable political systems and well- grounded market institutions, which are all based on appropriate knowledge and skills. In addition, urban productivity is generally linked to stable macroeconomic conditions and sound institutions.
16. Poor Democratic Culture and Unfair Market Practices undermine Equitable Development
Discriminatory practices, lack of democratic culture, inefficient, ineffective and corrupt political institutions tend to undermine equitable development. As a result, markets are not always the most equitable or most efficient means of resource allocation, since they tend to be systematically skewed to the detriment of young people from underprivileged backgrounds regardless of their potential.
17. Predetermined Circumstances Undermine Equality of Opportunity in Cities
The degree of inequity of outcomes (e.g., earnings and assets) that defines youth inequality in urban life is closely related to the unequal opportunities that occur in successive life stages. In this respect, the survey confirms earlier finding that unequal access often begins in childhood and continues into youth and adulthood, perpetuating the disadvantage faced in the early years. Historical and generational determinants of inequitable youth opportunities and deprivation in different interconnected spheres of urban activity tend to perpetuate disadvantages across the whole extent of an individual’s life.

State of the Urban Youth Report 2012/2013
x
Policy Actions and Recommendations
1. National and City-level Policies should confront the effects of structural change on skill requirements
Cities in developing countries should deal specifically with structural unemployment. This particular form of the more general problem of lack of labour demand arises from deep-seated obstacles or inefficiencies in urban labour markets (as opposed, for example, to a short-lived recession). Structural unemployment may result from mismatches between the characteristics of labour demand and supply in terms of necessary skill-sets, or from shifts in the structure of the urban economy (e.g., from manufacturing to services, or from low-skilled manual to highly skilled, knowledge-intensive occupations), which may require a combination of demand and supply-side policy responses.
2. The need for government policiesIt is for government policies specifically to address youth unemployment and to harness the potential of cities in favour of full, decent employment. National governments have both the powers and resources to act strategically
with macroeconomic and legal frameworks that can enhance economic conditions and opportunities for young people.
3. Incentives and Policies to target Equitable Youth Employment
Policies including industrial and investment in economic infrastructure; tax and incentives, vocational training schemes employment and labour market regulations should aim at a more equitable labour market for urban youth.
Group of students attending a training course at school.© Goodluz /Shutterstock
© arindambanerjee / Shutterstock

xix
Overview and Summary of Findings
4. Build the Institutional and Policy Capacities of Municipalities to create Employment
Institutional capacity-building and a sharper municipal focus on urban economic development must be promoted through adequate mechanisms (e.g., involving unemployed young people in the household services sector). In this respect, efforts should be made to align the functions of government departments and agencies and to build cooperative relationships with regional and local authorities.
5. Build Complementary Strategic Partnerships with the Private Sector
Youth employment-enhancing policies should encourage municipal authorities to forge partnerships with the private sector to foster emerging job-creating social businesses.
6. Spend on Formal and Vocational Training and Learning
A national urban policy should empower urban authorities to devise and deliver coherent strategies for sustained employment growth. In particular, formal and professional learning should be systematically connected, as in Germany where youth combine schooling with on-going work experience. Since municipal authorities are more familiar than national governments with local economic conditions, they could be more responsive to opportunities in their respective jurisdictions.
7. Build Policies for Equitable Youth Prosperity on Empirical Evidence
Policies looking to spread the benefits of urban prosperity to young people should be shaped by evidence as well as an understanding of economic trends and forces, emerging market realities and distinctive local assets and problems, rather than a wish-list of what people would like the city’s economy to be.
8. Municipalities should provide direct Business Support
Municipalities can and should provide support to business, including new firms, in the form of suitable land, financial assistance as well as public works programmes and training schemes for the vulnerable age group that is youth. In low and middle-income countries, municipal authorities should secure financial and technical support from central government for spending on the infrastructure and services required to gain economic momentum and create employment for young people.
9. Invest in Technological Literacy, Numeracy and ‘soft’ skills
Expansion of the service sector generates demand for a variety of skill-sets. Literacy and numeracy skills have become more important, along with a range of ‘soft’ (i.e., interpersonal) skills such as communication, team-working and adaptability. Many (white collar) service occupations also require secondary and tertiary education because thinking ability and problem-solving are important. Manual workers have struggled to adjust to deindustrialisation and the new skill demands (and occasionally lower earnings) of the service sector, leading to large-scale structural unemployment in former industrial cities. Urban authorities must enhance technological skills through specific schemes.
10. Tackle Unemployment with Knowledge-intensive Business Services (KIBS)
Knowledge-intensive Business Services (KIBS) have been gaining increasing shares in urban economies these past few years. These include financial services, accountancy, computer services, the media, advertising, design, legal services, data processing, research, engineering and other forms of consultancy. They demand highly qualified workers, usually university graduates, the higher demand for which is inciting more and more cities to compete for talent through attractive amenities and diverse career opportunities. Cities are

State of the Urban Youth Report 2012/2013
xii
increasingly encouraging local higher education institutions to expand, as this can be a very effective way of attracting youthful talent from elsewhere in the country or abroad. Municipal authorities can support these efforts by providing land or additional student accommodation (a significant determinant in young people’s choice of location for their studies).
11. Invest in Youth Apprenticeship TrainingSchool leavers who are not academically inclined should be encouraged to to improve their vocational skills and qualifications. An alternative route to skills development is the apprenticeship system, whereby young people learn a trade and gain practical experience through a combination of ‘on the job’ mentoring and part-time ‘off the job’ training. Developing high level skills is vital for long-term career progress. Where youth unemployment is particularly high, it may also be appropriate to introduce a special employment subsidy to encourage employers to recruit young people.
12. Use Higher Education and improved Skills-Sets to Raise urban Productivity
Intellectual resources (human intelligence, knowledge, skills, ingenuity) are increasingly important determinants of prosperity as they raise productivity and nurture innovation. The emphasis on high-calibre human capital also reflects greater mobility against a background of rising incomes, improved communications and more outsourcing or subcontracting of various business functions. Any city intent on sustaining economic prosperity will aspire to higher-level functions if it is to safeguard its specific comparative advantage. Consequently, cities must invest in advanced skill-sets that cut across industries, on top of more generic and versatile resources. Examples include software engineers, designers, scientists, senior managers, accountants, marketing experts, surveyors and management consultants.
13. Educational Strategies for Low-Skilled Youth.
Constraints on land and housing mean that considerable skills, physical resilience and use of personal networks are often required to gain access to urban labour markets. Evidence from developing countries suggests that young men are disproportionately represented in informal settlements because of the widespread poverty resulting from mass unemployment. For this reason, government funding will be required for both formal education, lifelong-learning and vocational training for these vulnerable youths, since equal opportunity is largely driven by access to education.
14. Build young people’s Entrepreneurial Capabilities
Entrepreneurial abilities are an important skill-set. Young people who are unable to find conventional employment can alternatively start their own businesses and create jobs or livelihoods by becoming self-employed or forming new enterprises. Weak labour markets and lack of welfare safety nets tend to encourage this kind of entrepreneurship – it serves as a last resort for
With Increasing Urbanization and poverty in urban areas, Urban Agriculture is providing food and jobs in Kampala, Uganda © Immaculate Gitta/UN-Habitat

xiiixii
Overview and Summary of Findings
people who would ordinarily prefer formal jobs in the public or private sector. The more successful entrepreneurs recognise commercial opportunities where others do not, and position themselves to take advantage with whatever resources at hand and to full effect; but in low-income countries they will find that credit markets are weak and unable to face the risks typically associated with innovation. Informal entrepreneurs tend to use family and social networks to secure additional support and recruit extra labour when needed; however, this is hardly sustainable, and some form of public becomes crucial.
15. Provide Physical and Knowledge Infrastructure
An important dimension of a productive city is the provision of trunk infrastructure for water, sanitation, power supply and access, which prevent the formation of slums. Investment in infrastructure can deliver major benefits for urban economic growth, prosperity, poverty alleviation, environmental sustainability and health.

xiv
Chapter 1.0
IntroductionThe previous edition of this Report (Leveling the playing field – Inequality of youth opportunity’) clearly showed that inequity, unequal opportunities and the related issues of unemployment and underemployment are, by far, among the greatest challenges faced by urban youth in this early 21st century. The report made it clear that in the developing world, the formal sector is unable to provide adequate employment opportunities for young people seeking gainful work. The inability of national and urban economies to create adequate numbers of quality jobs is one of the root causes not just of economic and social exclusion, but of informal economies, too. When young people in urban areas do find jobs, these are often with family-owned, small, low-productivity businesses, or in other informal businesses, or in domestic employment– all of which, being characterised by low productivity, can only offer low incomes and little if any labour protection. Despite these disadvantages, some cities do offer ways of improving the skills and knowledge of youth in low-income jobs or of those looking for employment (UN-Habitat, 2010/2011).
Second, the UN-Habitat survey has established that the degree of outcome inequality (such as earnings and assets) that defines youth exclusion or inclusion in urban life is closely related to the (un)equal opportunities that occur in successive life stages. The results show that unequal access often begins in childhood and continues into youth and adulthood, perpetuating the disadvantage faced in the early years.
More urgently, the demographic dynamics –
Youth at One Stop Centre Nairobi accessing one computer for training. © Julius Mwelu/UN-Habitat
© UN-Habitat

xvxiv
Overview and Summary of Findings
Developed economies and European Union
10%
Sub-Saharan Africa
14%
South Asia
27%
South-East asia and the Pacific
9%
East Asia
19%
Central and South-Eastern Europe (Non-EU) and CIS
5%
North Africa
3%Middle East
4%Latin America and the Caribean
9%
Regional Distribution of the Youth Population, 2012
Figure 1
Source: United Nations: World Population Prospects, the 2010 Revision database
City FactsheetsCity Urban
Population (million)
Slum Population (Thousands)
Rate of Youth Unemployment
(per cent)
National & City GDP per capita (USD 000s)
Accra 3.9 4, 848 10.4National: 1.7 City:
Bangalore 9.6 104, 679 10National: 1.455 City: 6.46
Cairo 11.2 6, 143 12.2National: 6.5 City: 3.0
São Paulo 4.0 44, 947 17.8National: 12.4 City: 4. 200
Table 1
and particularly the growing population of urban youth, known as the “urban youth bulge” – makes it imperative to address the diverse dimensions of the youth phenomenon against the broader background of prosperity. Youth are society’s most important and dynamic human resource. There are more people under the age of 25 today than ever, totalling nearly three billion, or half of the total global population; 1.3 billion of that total are aged 12 to 24. Most live in urban areas.
Cities in developing countries account for over 90 per cent of the growth in the world’s urban population. An estimated 60 per cent of that urban population will be under the age of 18 by 2030, and the majority of this high number live in slums and informal settlements. Nearly 45 per cent of all young people around the world — almost 515 million —live on less than two US dollars a day. In today’s world, nearly 90 million youth are unemployed (or 47 per cent of the

State of the Urban Youth Report 2012/2013
xvi
A prosperous city is one that fosters:
Productivity Contributes to economic growth and development, generates income, provides decent jobs and equal opportunities for all through effective economic policies and reforms
Infrastructure development Provides adequate infrastructure — water, sanitation, roads, information and communication technology —to improve living conditions and enhance productivity, mobility and connectivity
Quality of life Enhances public spaces for improved community cohesion and civic identity, and guarantees the safety and security of individuals and property
Equity and social inclusion Ensures equitable (re)distribution of the benefits of a prosperity, reduces poverty and the incidence of slums, protects the rights of minority and vulnerable groups, enhances gender equality, and ensures civic participation in the social, political and cultural spheres
Environmental sustainability Values the preservation of the urban environment and natural assets while ensuring growth with more energy efficiency and reduced pressure on surrounding land and natural resources, together with innovations to reduce environmental losses
Source: UN-Habitat SWCR 2012/13
Defining a Prosperous City
Table 2
total number of unemployed) and an additional 300 million are too unskilled for secure, gainful jobs in decent conditions. The vast majority of these youth work in the informal sector and live in slums. Indeed, 85 per cent of the new employment around the world is made available byin slum-based informal economies, forcing young people into low-income jobs with little scope for advancement. The largest numbers of youth in this situation are to be found in Africa.
It is well recognised by now that the dynamics of wealth creation and urbanization are closely related and that urban areas do provide huge opportunities when the benefits of economic growth are equitably distributed. However, young people living in urban slums tend to experience greater deprivations compared with those in rural areas when it comes to access to education and other social amenities such as health. These youths also face greater challenges in finding dignified work, often resorting to jobs in largely unregulated, highly exploitative informal economies. This is happening regardless of the goals of full employment and decent work that were endorsed at the 2005 World Summit, where heads of State “strongly supported fair globalisation and resolved to make the goals of full and productive employment and decent work for all, including for
women and young people, a central objective of national development strategies, including poverty reduction strategies, as part of efforts to achieve the Millennium Development Goals.” Teenage girls and young women, in particular, face even greater barriers to decent livelihoods, with poorer access to education and jobs and often under threat of violence or harassment. Clearly, urban youth poverty merits attention in its own right, since this phenomenon involves some issues that are distinct from those addressed in the typical analysis of poverty.
This is the background against which this Report appears as a logical sequel to the previous edition, which was based both on strong academic scholarship as well as on a survey of the historical and generational determinants of unequal youth opportunity and deprivation in different, interconnected spheres of urban activity. This Report largely relies on policy analysis based on a survey of representative cities in four developing regions (Africa, Asia, Latin America and the Caribbean, and Arab States), namely, Accra, Bangalore, São Paulo and Cairo. As in the previous edition, the survey is complemented with city-level background reports and focus group discussions. This abridged version of the Report provides a summary of the survey findings.

xviixvi
Overview and Summary of Findings
The UN-Habitat Urban Prosperity Index − Four sampled cities
Country City City prosperity Index (CPI with 5 Dimensions)
City prosperity Index (CPI with 4 Dimensions)
Productivity Index
Quality life Index
Infrastructure Index
Environment Index
Equity Index
Brazil São Paulo 0.757 0.836 0.742 0.803 0.918 0.894 0.507
Egypt Cairo 0.722 0.730 0.679 0.743 0.916 0.616 0.692
Ghana Accra 0.560 0.576 0.347 0.592 0.737 0.728 0.500
Source: United Nations Human Settlements Programme (UN-Habitat), Global Urban Indicators Database 2012.
Table 3
State of the Urban Youth Report 2012/2013
xviii

1xviii
Overview and Summary of Findings
Chapter 1.1
Urban Youth Employment and Productive Cities
A prosperous city fosters economic development and creates the conditions for provision of decent, productive and gainful jobs, along with and equal opportunities and decent living standards for everyone. This is achieved through effective economic policies and reforms that take into account creativity, innovation, research and development, science and technology. A prosperous urban economy contributes to national growth, Employment acts as the main gateway out of poverty and an important step towards social integration. It is the basis of wealth creation and the primary instrument for equitable (re)distribution of the benefits of prosperity.
Declining youth employmentNotwithstanding the foregoing, unemployment
remains largely an urban problem, as cities are often associated with high concentrations of unemployed people. In countries like the UK, Japan, Korea, the Netherlands and the USA, 60 per cent of unemployment is concentrated in urban areas. This is equally the case in many developing countries.
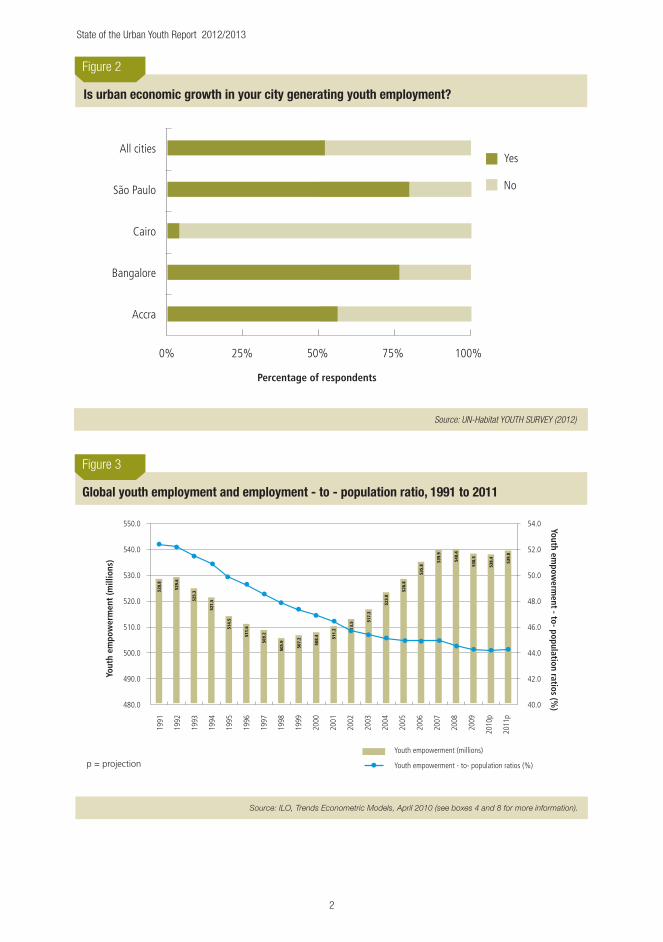
Figure 2 provides a graphic interpretation of representative young peoples’ perceptions of the ability of their city’s economy to generate employment for youth; the opinions of respondents on the issue were collected on a binary (yes/no) scale.
Analysis of the aggregate data from the survey shows that to 52 per cent of respondents, economic growth in their respective cities does generate youth employment, with the notable exception of a majority (96 per cent) in Cairo
Young businessman outside his office.©elwynn / Shutterstock
© Alain Grimard /UN-Habitat
State of the Urban Youth Report 2012/2013
2
Accra
Bangalore
Cairo
São Paulo
All cities
0% 25% 50% 75% 100%
Percentage of respondents
Yes
No
Is urban economic growth in your city generating youth employment?
Figure 2
Source: UN-Habitat YOUTH SURVEY (2012)
528.
8
529.
6
525.
3
521.
5
514.
5
511.
6
509.
2
505.
9
507.
2
508.
4 511.
2 513.
5 517.
3
523.
8
528.
8
535.
8
539.
9
540.
4
538.
5
538.
4
539.
8
1991
1992
1993
1994
1995
1996
1997
1998
1999
2000
2001
2002
2003
2004
2005
2006
2007
2008
2009
2010
p
2011
p
550.0
540.0
530.0
520.0
510.0
500.0
490.0
480.0
Yout
h em
pow
erm
ent
(mill
ions
)
Youth empowerment (millions)
Youth empowerment - to- population ratios (%)
Youth empow
erment - to- population ratios (%
)
p = projection
54.0
52.0
50.0
48.0
46.0
44.0
42.0
40.0
Global youth employment and employment - to - population ratio, 1991 to 2011
Figure 3
Source: ILO, Trends Econometric Models, April 2010 (see boxes 4 and 8 for more information).

32
Overview and Summary of Findings
Developed Economies & European Union
Central & South-Eastern Europe (non-EU) & CIS
East Asia
South-East Asia & the Pacific
South Asia
Latin America & the Caribbean
Middle East
North Africa
Sub-Saharan Africa1991
1992
1993
1994
1995
1996
1997
1998
1999
2000
2001
2002
2003
2004
2005
2006
2007
2008
2009
2010
p
2011
p
p = projection
75.0
70.0
65.0
60.0
55.0
50.0
45.0
40.0
35.0
30.0
25.0
You
th e
mp
ow
erm
ent
- to
- p
op
ula
tio
n r
atio
(%
)
Youth empowerment – to – population ratio, by region, 1991 to 2011
Figure 4
Source: ILO, Trends Econometric Models, April 2010 (see boxes 4 and 8 for more information).
whose perception was the opposite. The recent society-wide upheavals in Tunisia, Libya and Egypt did not occur against a background of extreme poverty or deprivation alone. Large infrastructure projects with good transport networks had been put in place or were underway; as for education and health, these countries were approaching or surpassing their national and urban Millennium Development Goals. However, communities in the Upper Nile, or Libyan and Tunisian country sides, were worse off than their urban counterparts while urban areas were relatively prosperous. In other words, the Cairo version of the Arab Spring was fuelled in part by unequal, rather than absent, unemployment opportunities.
One major factor behind the uprisings in those countries was the huge cohorts of urban youth whose unemployment caused steep economic inequity, with severely unequal access to opportunities, resources and political representation (because of systemic patronage, corruption and strangleholds by political elites) – and the resulting serious lack of confidence in individual and collective futures spread to older generations. The city capitals and other
urban centres constituted the trigger points for the revolutions that brought down the ruling governments. The sobering message from the Arab Spring, which is still an unfinished ‘revolution,’ is that leaders and societies can ignore inequality and mass unemployment only at their own peril.
This Report finds that youth employment is a special challenge in cities around the world because of their youth-biased demographic structures. The global economic crisis has exposed the particular vulnerability of young people in the labour market. Youth who fail to become integrated into the world of work after leaving school risk long-term exclusion from productive engagement. Young people are also more likely than adults to be among the working poor in informal jobs. An unemployed youth represents a colossal waste of resource, a social hazard and a burden on families or the government social support schemes, where any. Being forced into precarious livelihoods by intense poverty and lack of social protection is a lost opportunity, since these young might otherwise attend school or college and acquire the skills and abilities that could raise their future productivity and earnings.

4
Chapter 1.2
Young people’s Quality of Life and urban ProsperityA prosperous city provides the whole population, with adequate housing and decent basic services irrespective of race, ethnicity, gender or socioeconomic status, facilitating equal access to social amenities, public goods and sound environmental conditions. The phrase “quality of life” broadly defines the overall well-being of individuals or communities. The concept has been applied across a wide range of domains, particularly in international development, for instance the Human Development Index (HDI) and more recently the Multi-dimensional Poverty Index (MPI), which have been jointly developed by scholars, politicians and policy-makers. Quality of life is qualitatively different from standard of living, which derives largely from income; the measure of QoL includes proxy statistics for wealth, employment, the built environment, physical and mental health, education, recreation and leisure time, and sense of social belonging. For statistical purposes, both objective and subjective measures are now broadly used in the development agenda by decision-makers, practitioners and policy-makers in a bid to address the challenges they face. For instance,
politicians and economists have used quality of life measures to assess the liveability of a specific city or nation. The Economist Intelligence Unit (EIU) and Mercer’s Quality of Living Reports combine both subjective and objective proxies as determinants of quality of life.
For the purposes of this Report, the pursuit of quality of life is considered as one of the essential factors behind urban prosperity. The main variables include access to education, health and other basic services. On top of these defining features comes a non-discriminatory social environment, one where every citizen feels welcome and safe. Young people, or particular groups thereof, may be discriminated against. Personal attributes such as ethnicity, gender, religion and place of residence may feature in employers’ decisions about recruitment, promotion and retention. Specifically, personal characteristics may affect employers’ decisions in various ways. At one extreme, there may be pure prejudice without foundation or evidence of productivity, reliability or other aspects of performance. At the other extreme, there may be objective assessment of individual worker attributes linked directly to performance. Evidence of discrimination is most prevalent in service industries where personal and cultural attributes are perceived to be much more directly linked to performance than in traditional factory work, where sheer physical productivity is much more important. Employers tend to emphasise
© Nishu Aggarwal /UN-Habitat

54
Overview and Summary of Findings
100
80
60
40
20
0
Accra
Bang
alore
Cairo
São P
aulo
All citie
s
Perc
enta
ge o
f res
pond
enfs
Primary school level Secondary school level University
Availability of free education opportunities
Figure 5
Source: UNHABITAT Youth Policy Survey (2012)
‘soft’ (interpersonal and communication) skills, enthusiasm, flexibility and even appearance to favour some groups over others. This is common practice in the hospitality and retail sectors, and tends to disadvantage young working class men, particularly those from minority backgrounds.
The UN-Habitat survey has sought young peoples’ views on equal access to education. The outcome is that in all four cities, primary school has become widely accessible, but secondary and higher education remain challenging.
The trend shows that in all four sampled cities, a large majority of local young people confirmed that primary school is free (86 per cent), but were only 36 per cent with regard to secondary school. As far as higher (university) education is concerned, only very few young people perceive it as free and accessible. As might be expected, those developing countries with universal health and education systems, basic water and sanitation, together with functional transport and power networks tend to be in a stronger position to support economic development and job creation than countries without these resources.
Urban economies are invariably less productive where lack of basic education, incidence of ill health reduces life expectancy and where dysfunctional infrastructure is predominant.
Urban Youth Fund Beneficiaries, engaging in educational and social activities that covers a broad variety issues affecting youth. © Jon-Andreas Solberg UN-Habitat

State of the Urban Youth Report 2012/2013
6
Accra
Bangalore
Cairo
São Paulo
All cities
0% 25% 50% 75% 100%
Percentage of respondents
Yes
No
Social Harmony - Discrimination against Youth based on race, ethnic origin or religion
Figure 6
Source: UNHABITAT Youth Policy Survey (2012)
With regard to social harmony, Figure 6 provides a graphic summary of local young people’s perceptions of discrimination (based on skin colour, ethnic origin or religion) in their respective cities (responses collected on a binary scale). Significantly, a large proportion of the youths in multi-racial São Paulo (81.2 per
cent) cited widespread discrimination based on race, ethnic origin or religion. However, in Accra (87.5 per cent), Bangalore (55.3 per cent) and Cairo (76 per cent), majority of the respondents believe that there is no such discrimination, and the average for all four cities, is 61 per cent.

76
Overview and Summary of Findings
Prosperity and Equity-Based Youth DevelopmentA Prosperous city is inclusive, pursuing reduction of poverty and inequality through systematic (re)distributing the benefits of development. This is achieved through protection of the rights of the poor, minorities and vulnerable groups, enhancing gender equality, and ensuring civic participation by all in the social, political and cultural spheres. Over the past few decades, the world has witnessed a steepening in income inequalities. Other forms of inequity related to opportunities in life, political participation, consumption and access to resources, among others, have persisted. Simultaneously, new forms of inequity have emerged, such as in access to communication technologies, skill development and abilities.
Inequalities is in large part generated and sustained by various factors related to power imbalances, socio-cultural values, identities and diverse forms of exclusion. An individual will be treated inequitably on the basis of group identity such as gender, ethnicity or religion, or birthplace or parental background. Such discrimination reduces life opportunities and impairs enjoyment of basic rights and freedoms. However, no city
can claim to be harmonious when large sections of the population are denied basic needs while others live in affluence. Therefore, the pursuit of equity is not only fundamental for the reduction of poverty and exclusion; it is also inherent to progress and development. A more equitable distribution of resources and opportunities; just laws and enforcement combined with a fair system of rules and relationships that govern institutions will lead to better access to services and social amenities to enhance a city’s prosperity, whatever its socio-economic status.
More equitable cities feature lower degrees not just of poverty, but also ill health, exposure to various risks, violence and crime, mental illness
Chapter 1.3
Teenagers sitting by a street.© Petrenko Andriy/Shutterstock
© UN-Habitat

State of the Urban Youth Report 2012/2013
8
and environmental problems. Prosperous, equitable cities indiscriminately safeguard the whole population against a wide variety of existing, evolving and foreseeable risks (of a legal, socioeconomic, health, environmental and other nature), including through (re)distribution of the benefits of development. These safeguards provide the individual and collective sense of confidence in present and the future that is inherent to shared prosperity, and the absence of which triggered the Arab Spring. A fair amount of this confidence lies in the availability of multiple opportunities for individuals to fulfil their potential.
Equity does not only enhance economic efficiency, which is needed to to raise general well-being in the city; it also creates conditions for people to improve their capacities to represent themselves and participate in a more inclusive manner in a city’s cultural and political life. In the State of the World’s Cities 2010/11 report,
UN-Habitat laid down a series of practical steps to help cities become more inclusive from an equity perspective. These four steps include: providing universal public services, social protection, targeted action for underprivileged groups, and mechanisms for wealth redistribution.
As part of the UN-Habitat survey, young people have been asked to rate how economic growth effectively promotes equitable social progress in their respective cities. Responses ranked on a four-point scale ranging from ‘Not effective’ to ‘Very effective’. Figure 7 provides a graphic summary of the responses.
Figure 7 shows that in the four sampled cities, a majority of the youths(Accra: 56.25 per cent; Bangalore: 54.37 per cent; Cairo: 48.39 per cent; and São Paulo: 55.45 per cent) are of the opinion that economic growth is “somewhat effective” in promoting equity, while an average 24 per cent found it “not effective”.
100
80
60
40
20
0
Accra
Bang
alore
Cairo
São P
aulo
All citie
s
Perc
enta
ge o
f res
pond
enfs
Very effective
Effective
Somewhat effective
Not effective
How effective is the link between economic growth and equity?
Figure 7
Source: UN-Habitat YOUTH SURVEY (2012)
98
Overview and Summary of Findings
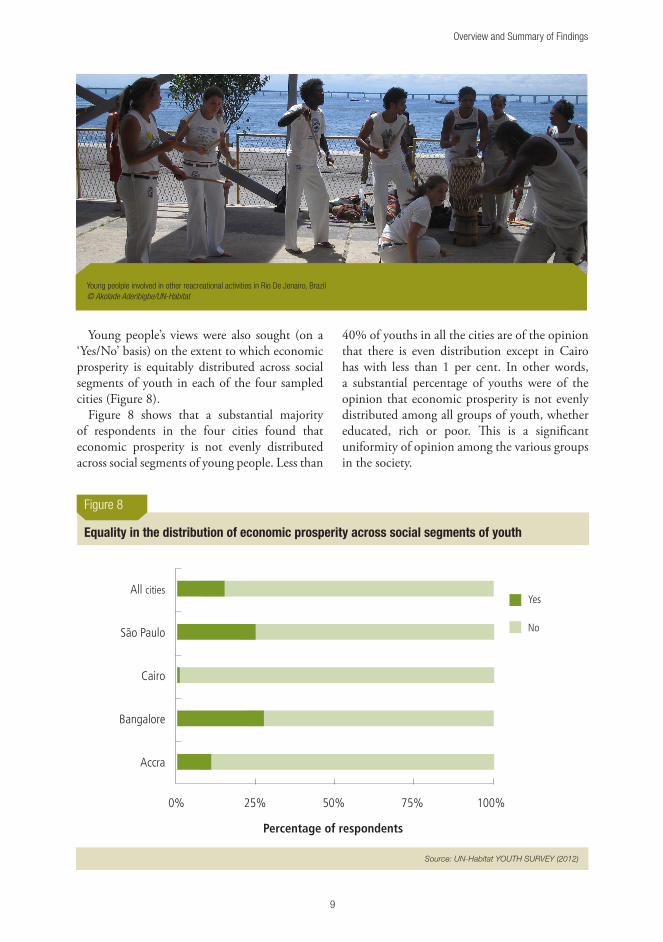
Young people’s views were also sought (on a ‘Yes/No’ basis) on the extent to which economic prosperity is equitably distributed across social segments of youth in each of the four sampled cities (Figure 8).
Figure 8 shows that a substantial majority of respondents in the four cities found that economic prosperity is not evenly distributed across social segments of young people. Less than
40% of youths in all the cities are of the opinion that there is even distribution except in Cairo has with less than 1 per cent. In other words, a substantial percentage of youths were of the opinion that economic prosperity is not evenly distributed among all groups of youth, whether educated, rich or poor. This is a significant uniformity of opinion among the various groups in the society.
Equality in the distribution of economic prosperity across social segments of youth
Figure 8
Source: UN-Habitat YOUTH SURVEY (2012)
Accra
Bangalore
Cairo
São Paulo
All cities
0% 25% 50% 75% 100%
Percentage of respondents
Yes
No
Young peolple involved in other reacreational activities in Rio De Jenairo, Brazil © Akolade Aderibigbe/UN-Habitat

State of the Urban Youth Report 2012/2013
10
70
60
50
40
30
20
10
0
Accra
Bang
alore
Cairo
São P
aulo
All citie
s
Perc
enta
ge o
f res
pond
ents
Weak public institutions
Corruption /Lack of good governance
Cost of conducting business
Poor access to information
Deficient infrastructure
Lack of appropriate knowledge & skill development
Perceived barriers in Youth contribution to economic productivity
Figure 9
Source: UN-Habitat YOUTH SURVEY (2012)

1110
Overview and Summary of Findings
Chapter 1.4
Urban Infrastructure: Policies and InstitutionsThis Report addresses access to infrastructure — water, sanitation, electricity, roads and telecommunications including digital technology. Collectively, these amenities form the physical assets of the city; their availability is indicative of the degree of prosperity of a city; at the same time, they make a major contribution to the productivity or prosperity of urban areas. This Report also examines the extent to which the provision of urban infrastructure is linked to urbanization— higher levels of urbanization should imply more infrastructures.
Broader provision of trunk infrastructure for water, sanitation, power and mobility will prevent the formation of slums, which are characterised by lack of such services. Investment in infrastructure can deliver major benefits in terms of economic growth, prosperity, poverty alleviation, environmental sustainability, and health. The cities that have been most successful in attracting foreign direct investment (‘competitive’ cities) are those that have vastly improved the range and quality of their infrastructure. Figure 9 is a graphic summary of young people’s perceptions of the actual
contribution of infrastructure to urban youth prosperity. Various benefits of infrastructure development were considered in the survey and opinions were sought on a five-point scale, from “Not contributing” to “Fully contributing”.
Figure 9 shows that the average ranking of all the factors considered in the survey is over the 2.5 mean in three cities (with the exception of Cairo ), which means that all the factors are perceived to be contributing to youth prosperity. In the three cities, “Facilitating mobility” is ranked highest by respondents, followed by “improving access to health and education”.
Rickshaw driver working in Calcutta, India. Rickshaws have been around for more than a century, but they could soon be a thing of the past. ©Hung Chung Chih / Shutterstock.com
©ladywewa / Shutterstock

State of the Urban Youth Report 2012/2013
12
4.0
3.0
2.5
2.0
1.5
1.0
0.5
0.0
Accra
Bang
alore
Cairo
São P
aulo
All citie
s
Rank
ing
Improving environmental quality
Guiding and directing urban growth
Reducing disparities between rich and poor youth
Improving access to education and health
supporting economic growth
Improving slum conditions & reducing poverty
Improving quality of life e.g sanitation
Facilitating mobility
Ranking scale: 1→ Not contributing, 2→ Somewhat contributing, 3→ Contributing, 4→ Contributing effectively, 5→ Fully contributing
Extent to which infrastructure development is contributing to youth prosperity
Figure 10
Source: UN-Habitat YOUTH SURVEY (2012)
One of the important outcomes of a city’s superior infrastructure is improved productivity. Young people in the four-city sample have been asked what they thought was the main impediment to youth productivity in their respective cities. Six such factors were considered in the survey. As shown in Figure 8, the largest percentage (42 per cent) of respondents felt that corruption and lack of good governance were the major impediments, while to 25 per cent; it was lack of appropriate knowledge and skills development. Across the four developing regions, the UN-Habitat Youth Survey (2012)
shows that corruption is the most insidious impediment to equity. Young people in cities in Sub-Saharan Africa and the Arab States rank corrupt practices as the greatest hindrances to equality. Corruption is also very significant in Asia and Latin America, though of lesser consequences compared with the other regions.
Next to corruption, ‘inefficient and ineffective government’ is seen as the other major factor behind urban youth inequities. These two factors together are perceived as more significant in Latin America and Africa compared with Asia and Arab States. An active civil society and

1312
Overview and Summary of Findings
effective public institutions also have significant roles to play in favour of more equitable cities. On a more negative side, discriminatory practices, lack of democracy and the vested interests of ruling elites also show various degrees of relevance. That is why young people believe that committed, efficient, effective and non-corrupt political institutions and equity are long-term complements in the pursuit of urban prosperity. Markets are not always the most equitable or most efficient means of resource allocation, since they tend to be systematically skewed to the detriment of young people
from underprivileged backgrounds regardless of their potential. The functionalities of government, legal systems, regulatory agencies or, indeed, all the institutions that assign and enforce property rights and mediate conflicts among citizens—can be distorted by the distribution of political power (influence, or ‘voice’). Inefficiency and asymmetry of access to these institutions perpetuate institutional structures that protect the interests of the more powerful, with scant regard for the rights or even property of the vast majority of the population.

14
Chapter 1.5
An over view of Mathare slum In Nairobi, Kenya © Julius Mwelu/ UN-Habitat
Ranking the Overall Prosperity of the four CitiesFigure 11 summarises the young respondents’ perceptions of the overall commitment of their respective cities to four dimensions of prosperity; again, the opinion was measured on a three-point scale, i.e. ‘Committed’, ‘Somewhat committed’, and ‘Not-committed’.
A majority of the youths hold the view that their respective cities are ‘committed’ to infrastructure development, and ‘somewhat committed’ to productivity, but a substantial proportion find their cities are ‘not committed’ to quality of life or equity.
Figure 12 summarises the young respondents’ ratings of their respective cities’ performances on the same four dimensions of prosperity.
In all four cities, policies promoting the various dimensions of prosperity are neither ranked ‘poor’ not considered ‘good’ , but none of the policies is rated as ‘very good’ or ‘excellent’.
Combining the results in Figures 11 and 12, it would seem that young people perceive their cities as promoting infrastructure and productivity more than equitable development or quality of life, which points to an ill-balanced pursuit of shared prosperity.
© Alessandro Scrotti / UN-Habitat

1514
Overview and Summary of Findings
Bangalore
Cairo
São Paulo
Accra
All cities
80
70
60
50
40
30
20
10
0
Committe
d
Somew
hat C
ommitte
d
Not Com
mitted
Committe
d
Somew
hat C
ommitte
d
Not Com
mitted
Committe
d
Somew
hat C
ommitte
d
Not Com
mitted
Committe
d
Somew
hat C
ommitte
d
Not Com
mitted
Quality of life Productivity Infrastructure development
Equity
Perc
enta
ge o
f res
pond
ent
Perceived commitment of the sampled cities to four dimensions of prosperity
Figure 11
Source: UN-Habitat YOUTH SURVEY (2012)
Motorcycle Taxis (Boda boda) are the fastest mode of transportation in Kampala, Uganda. © UN-Habitat

State of the Urban Youth Report 2012/2013
16
3.5
3.0
2.5
2.0
1.5
1.0
0.5
0.0
Quality of Life
Productivity
Infrastructure development
Equity
Accra
Bang
alore
Cairo
São P
aulo
All citie
s
Rank
ing
Ranking scale: 1→ Very poor, 2→ Poor, 3→ Good, 4→ Very good, 5→ Excellent
Rating of Policies promoting four Dimensions of Prosperity
Figure 12
Source: UN-Habitat YOUTH SURVEY (2012)

1716
Overview and Summary of Findings
Ranking Barriers and Policies to EquityIn finding the right strategies to the challenge of inequitable growth, we interrogate factors limiting the possibility of greater levels of equality. Based on a five-point ranking scale, opinions were sought to know the various factors that potentially constitute key impediments to the realization of greater levels of equality.
Figure 11 ranks all factors greater than 3 as barrier to greater equity for urban youth with lack of employment ranking highest in Accra (4.02 per cent) and Bangalore (3.61 per cent). Once again in Cairo, the respondents deplored obstructive public institutions controlled by the ruling elite (3.84 per cent) whereas the majority of youths in São Paulo chose unequal access to education as the greatest barrier to equity.
Responses were uniform except for Bangalore. A majority of young survey respondents in Accra (49 per cent), Cairo (47 per cent) and São Paulo (31 per cent) identified skills development as the most important action being implemented in their respective cities to improve equity, while in Bangalore the top ranking (29 per cent) went
to easier access to employment and opportunities. In all four cities, vocational training for skills development is seen as the best way of bringing about more equity for urban youth. Finally, it is worthy of note that significant proportions of young respondents said that no policies or actions were in place to make conditions more equitable for them in their respective cities.
Chapter 1.6
Young people in a discussion during Youth 21 meeting in Nairobi, Kenya.© UN-Habitat
© Akolade Aderibigbe/UN-Habitat

State of the Urban Youth Report 2012/2013
18
Historic patterns of inequality
Mother’s education
Unequal access to education
Living environment
Lack of empolyment
Public institutions controlled by ruling elite
Father’s education
Father profession
Weak civil society to claim or defend rights
4.5
4.0
3.5
3.0
2.5
2.0
1.5
1.0
0.5
0.0
Accra
Bang
alore
Cairo
São P
aulo
All citie
s
Rank
ing
Ranking scale: 1→ Least important, 2→ Somewhat important, 3→ Important, 4→ Very important, 5→ Most important
Ranking of barriers to equity for urban youth
Figure 13
Source: UN-Habitat YOUTH SURVEY (2012)
Vocation & other training to enable skills development
Easier access to employment & opportunities
New rules & regulations to promote equitable development
Cash transfers & other forms of financial support for disadvantaged groups
Creation of fiscal incentives in favor of the urban poor
Specific projects targeting the poor & marginalized
None
60
50
40
30
20
10
0
Accra
Bang
alore
Cairo
São P
aulo
All citie
s
Perc
enta
ge o
f re
spon
dent
s
Important policies for Equitable Youth Development
Figure 14
Source: UN-Habitat YOUTH SURVEY (2012)

1918
Overview and Summary of Findings
UNDESA (2010). World Population Prospects:The 2010 Revision. New York: United Nations
UNDESA (2010). World Development Prospects:The 2010 Revision. New York: United Nations
World Bank (2006) World Development Indicators (WDI) Online Database
UN-Habitat (2010) State of the World’s Cities Report 2010/11, London: Earthscan
Brazil 2010 National Census: http://www.ibge.gov.br/english/
CIA 2011 The World Fact Book https://www.cia.gov/library/publications/the-world-factbook/
UN-Habitat (2012) State of the World Cities Report 2012/13 –The Prosperity of Cities, London: Earthscan
ILO (2011), Youth Employment Crisis: Time for Action
http://www.ilo.org/ilc/ILCSessions/101stSession/reports/reports-submitted/WCMS_175421/lang--en/index.htm
REFERENCES

State of the Urban Youth Report 2012/2013
20

The increasing prominence of the youth bulge in most urban areas presents a unique opportunity, as they represent the most dynamic human resource available. Their numbers today are larger than at
any point in human history. Yet this group suffers the most from urban unemployment and often feels that they lack equal access to opportunities. This is especially acute in developing countries, which have a relatively youthful population that must be mobilised to realise greater economic and social
development goals.
Today, 90 million youth around the world are unemployed (or 47 per cent of the total number of unemployed) and an additional 300 million belong in the “working poor” category —they are in
unskilled, insecure jobs and live in poor conditions. This Report takes a closer look at the condition of youth in major urban centres in four developing nations - Accra (Ghana), São Paulo (Brazil), Bangalore
(India) and Cairo (Egypt).
The conditions of these cities, and the way they are perceived by young people, are seen as representative of those in their respective regions, and therefore provide a reasonable basis for policy
recommendations focused on shared prosperity for urban youth. The four-city survey demonstrates that young people suffer disproportionately from poor prospects and
low quality employment.
The developing world continues to feature the fastest growing numbers of youth unemployment and persistent rural-to-urban migration; if these young people are to realise their potential, they need
innovative solutions that are anchored in local realities.
Survey outcomes suggest that educational and training systems must be better aligned with the current and future needs of young people. In this regard,
it would be helpful to share experiences and to investigate alternative educational arrangements for the provision of basic literacy, job skills training
and lifelong education. This Report is a step in that direction.
Young people in the survey want equity for better shared prosperity both for their own and their cities’ benefit, and they regard education as the best way of bringing about a more equitable type
of urban development. They point to other significant challenges like structural constraints and lack of a democratic culture in their respective cities. These are issues over which local authorities
wield a degree of influence that puts them in the best possible position to take remedial action. Local authorities must also seek to mainstream youth issues into all aspects of their planning and
operations policy areas.
The report recommends a better match between skills and labour markets through vocational training and with the participation of the private sector. ‘Soft’ skills matter more in service-oriented economies, young people in informal settlements need entrepreneurial abilities, and capacities must
be better geared to knowledge-intensive business services.
Youth in the Prosperity of CitiesOverview and Summary of Findings
United Nations Human Settlements ProgrammeP.O.Box 30030,Nairobi 00100,Kenya;Tel: +254-20-7623120; Fax: +254-20-76234266/7 (central office)[email protected]
www.unhabitat.org
Youth in the Prosperity of CitiesOverview and Summary of Findings
STATE OF THEURBAN YOUTH
2012/2013


