Page i State Water Resources Control Board Clean Water Act Section 312 (f)(4)(A) Application TABLE OF CONTENTS I. INTRODUCTION ..................................................................................................................... 1 II. BACKGROUND INFORMATION ....................................................................................... 1 II.A – THE CRUISE SHIP TASK FORCE ...................................................................................................... 1 II.B – CRUISE SHIP LEGISLATION ............................................................................................................. 3 Chapter 488, Statutes of 2003 (AB 121): ................................................................................... 3 Chapter 494, Statutes of 2003 (AB 906): ................................................................................... 4 Chapter 710, Statutes of 2004 (AB 2093): ................................................................................. 4 Chapter 764, Statutes of 2004 (AB 2672): ................................................................................. 4 II.C – OCEANGOING SHIP LEGISLATION ................................................................................................ 5 Chapter 588, Statutes of 2005 (Senate Bill 771) ........................................................................ 5 II.D – INCREASES IN VESSEL TRAFFIC AND POTENTIAL IMPACTS ON CALIFORNIA’S OCEAN ECONOMY................................................................................................................................. 6 II.E – SEWAGE DISCHARGE PROHIBITIONS UNDER CWA SECTION 312(f) ................................... 7 III. APPLICATION REQUIREMENTS .................................................................................... 8 III.A – WATER RECREATIONAL AREAS .................................................................................................. 9 The Economic Importance of Coastal Public Resources…………………………………………...9 The Need for Public Resource Coastal Protection………………………………………………...15 California's Numerous and Diverse Water Recreational Areas…………………………………...16 III.B – DRINKING WATER INTAKES ........................................................................................................ 19 III.C – AQUATIC SANCTUARIES: FISH-SPAWNING, NURSERY AREAS, AND OTHER IMPORTANT MARINE AND COASTAL NATURAL RESOURCES ............................................. 21 California’s Natural Coastal, Estuarine, and Marine Environments: Oceanographic and Habitat Considerations ............................................................................................................. 22 California's Physical Oceanography………………………………………………………….23 Coastal Habitat………………………………………………………………………………..26 Benthic Habitat……………………………………………………………………………….30 Pelagic Habitat………………………………………………………………………………..31 General Water Quality Considerations……………………………………………………….33 California's Fisheries Economic Importance, Sustainability, and Long-Term Challenges…..34 California's Aquatic Sanctuaries .............................................................................................. 44 Threatened and Endangered Species………………………………………………………….46 Current NMFS Categories ....................................................................................................... 52 Essential Fish Habitat .......... …………………………………………………………………53 National Marine Sanctuaries .................................................................................................... 57 The California Coastal National Monument ............................................................................ 58 San Francisco Bay National Estuarine Research Reserve........................................................ 58 California’s State-Designated Marine Protected Areas............................................................ 59 III.D – RECREATIONAL BOATING ........................................................................................................... 60 IV. CONCLUSION ..................................................................................................................... 62
Transcript
Page i
State Water Resources Control Board Clean Water Act Section 312 (f)(4)(A) Application
TABLE OF CONTENTS
I. INTRODUCTION..................................................................................................................... 1
II. BACKGROUND INFORMATION ....................................................................................... 1 II.A – THE CRUISE SHIP TASK FORCE......................................................................................................1 II.B – CRUISE SHIP LEGISLATION .............................................................................................................3
Chapter 488, Statutes of 2003 (AB 121):...................................................................................3 Chapter 494, Statutes of 2003 (AB 906):...................................................................................4 Chapter 710, Statutes of 2004 (AB 2093):.................................................................................4 Chapter 764, Statutes of 2004 (AB 2672):.................................................................................4
II.C – OCEANGOING SHIP LEGISLATION ................................................................................................5 Chapter 588, Statutes of 2005 (Senate Bill 771)........................................................................5
II.D – INCREASES IN VESSEL TRAFFIC AND POTENTIAL IMPACTS ON CALIFORNIA’S OCEAN ECONOMY.................................................................................................................................6
II.E – SEWAGE DISCHARGE PROHIBITIONS UNDER CWA SECTION 312(f)...................................7 III. APPLICATION REQUIREMENTS.................................................................................... 8
III.A – WATER RECREATIONAL AREAS..................................................................................................9 The Economic Importance of Coastal Public Resources…………………………………………...9 The Need for Public Resource Coastal Protection………………………………………………...15 California's Numerous and Diverse Water Recreational Areas…………………………………...16
III.B – DRINKING WATER INTAKES ........................................................................................................19 III.C – AQUATIC SANCTUARIES: FISH-SPAWNING, NURSERY AREAS, AND OTHER
IMPORTANT MARINE AND COASTAL NATURAL RESOURCES .............................................21 California’s Natural Coastal, Estuarine, and Marine Environments: Oceanographic and Habitat Considerations.............................................................................................................22 California's Physical Oceanography………………………………………………………….23 Coastal Habitat………………………………………………………………………………..26 Benthic Habitat……………………………………………………………………………….30 Pelagic Habitat………………………………………………………………………………..31 General Water Quality Considerations……………………………………………………….33 California's Fisheries Economic Importance, Sustainability, and Long-Term Challenges…..34 California's Aquatic Sanctuaries ..............................................................................................44 Threatened and Endangered Species………………………………………………………….46 Current NMFS Categories .......................................................................................................52 Essential Fish Habitat .......... …………………………………………………………………53 National Marine Sanctuaries....................................................................................................57 The California Coastal National Monument ............................................................................58 San Francisco Bay National Estuarine Research Reserve........................................................58 California’s State-Designated Marine Protected Areas............................................................59
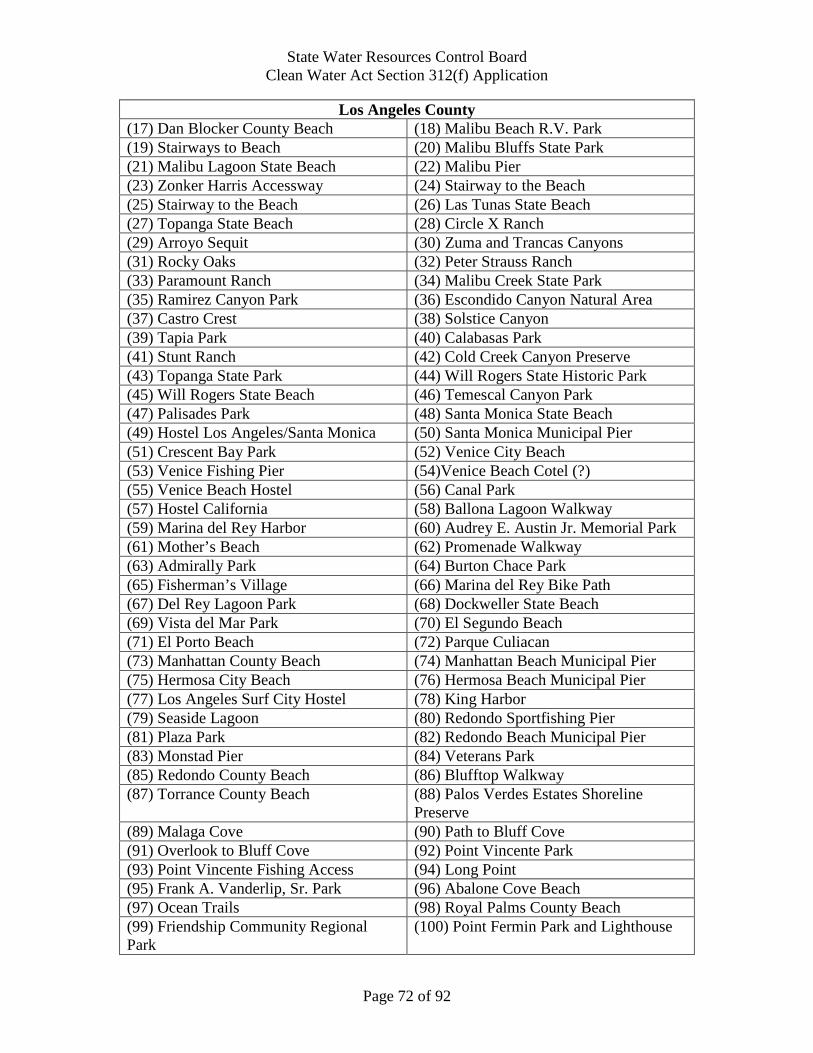
APPENDICES APPENDIX 1 - WATER RECREATIONAL AREAS LISTED BY COUNTY
Del Norte County Humboldt County Mendocino County Sonoma County Marin County San Francisco County San Mateo County Santa Cruz County Monterey County San Luis Obispo County Santa Barbara County Ventura County Los Angeles County Orange County San Diego County
APPENDIX 2 - DRINKING WATER INTAKES Existing Plants Proposed Plants
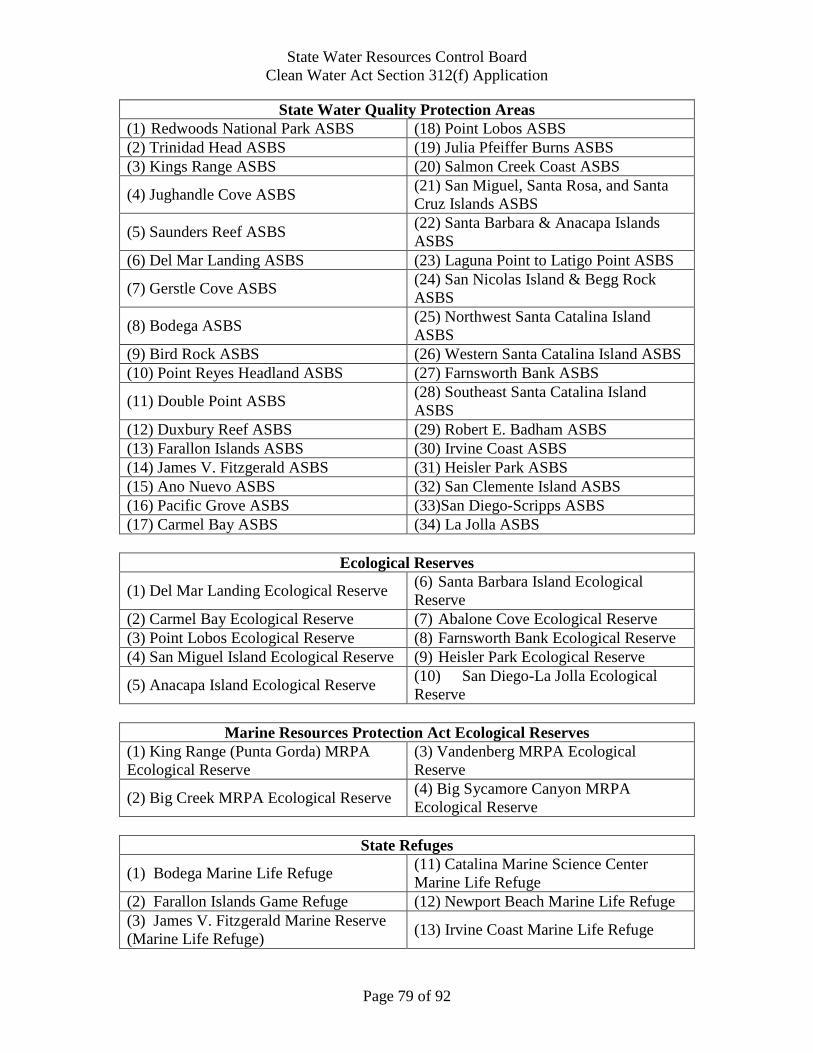
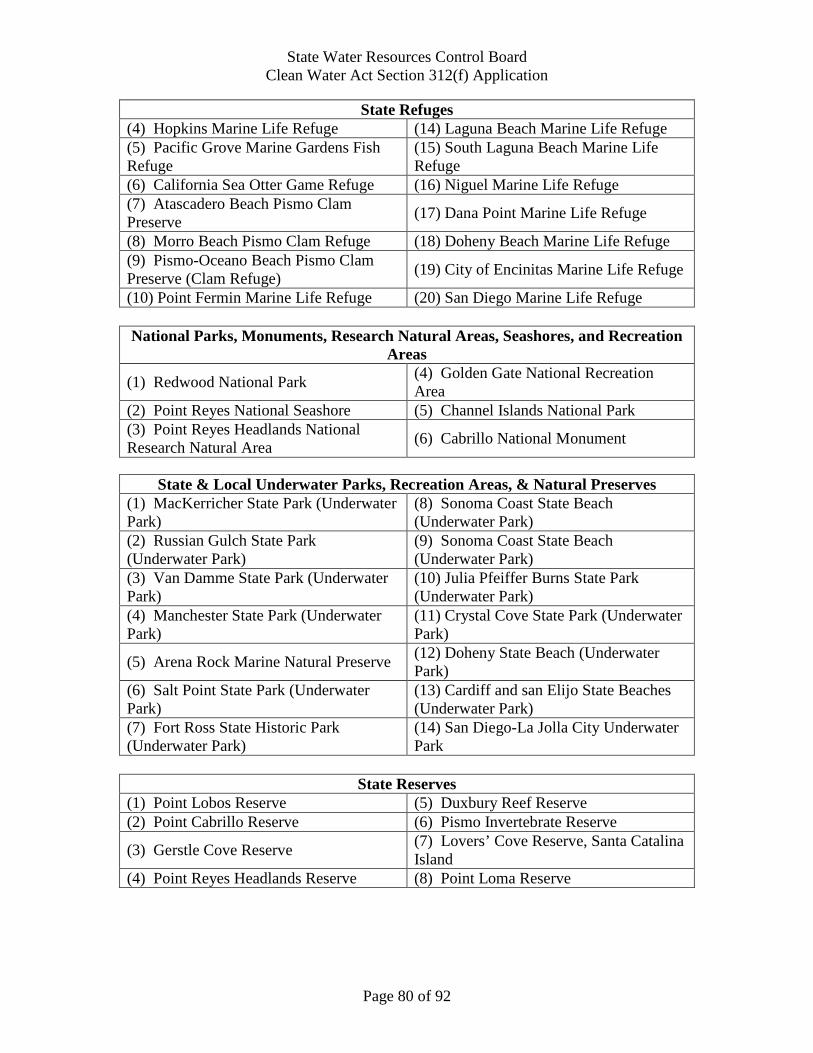
APPENDIX 3 - AQUATIC SANCTUARIES International Biosphere Reserves National Marine Sanctuaries National Monuments Conservation Zones
State Water Resources Control Board Clean Water Act Section 312(f) Application
Page iv
Coastal Sanctuaries State of California Department of Fish and Game Marine Protected Ares State Water Quality Protection Areas Ecological Reserves Marine Resources Protection Act Ecological Reserves State Refuges National Parks, Monuments, Research Natural Areas, Seashores, and Recreation Areas State and Local Underwater Parks, Recreation Ares, and Natural Preserves State Reserves University of California Natural Reserves Private Nature Reserves National Ecological Preserves National Estuarine Research Reserve
APPENDIX 4 - AREAS OF INTENSIVE BOATING ACTIVITIES Department of Boating and Waterways (Coastal) Regions
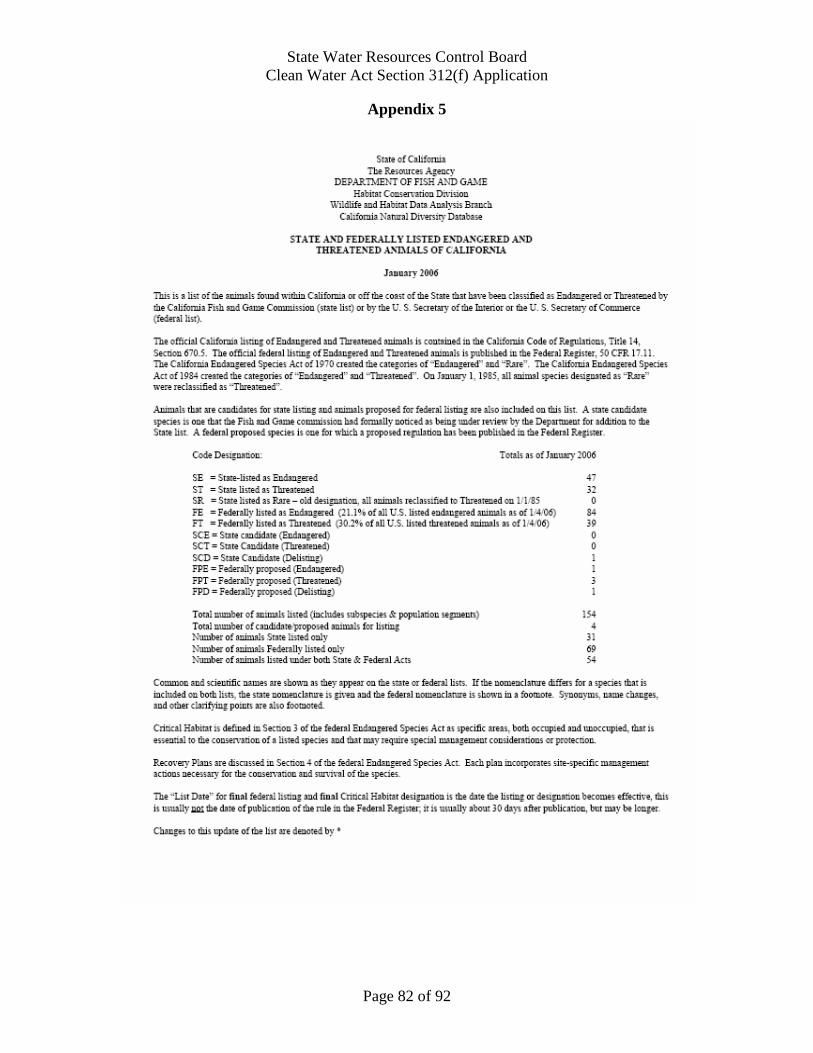
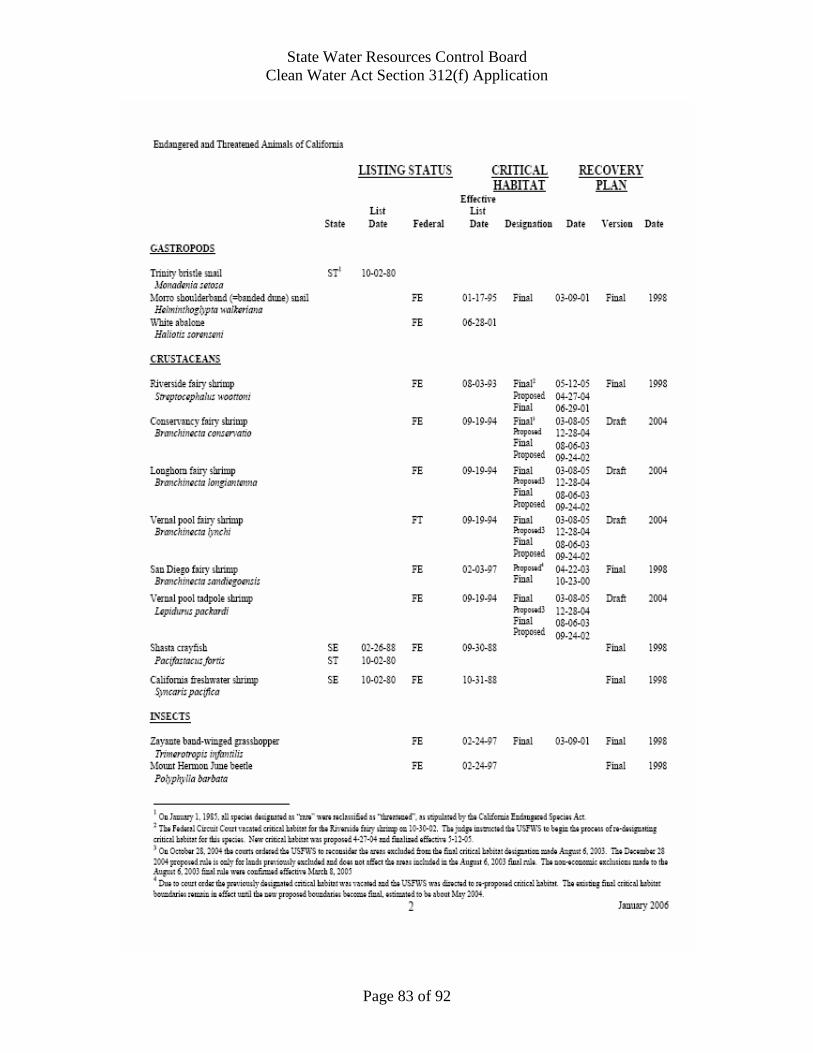
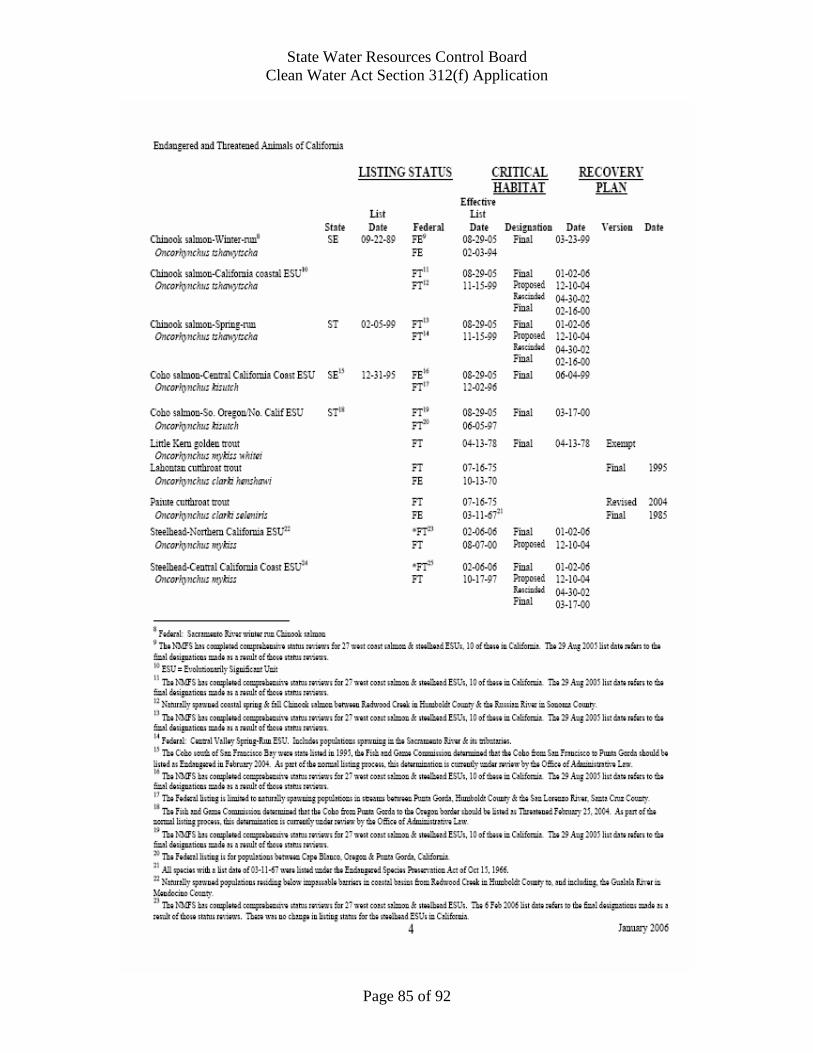
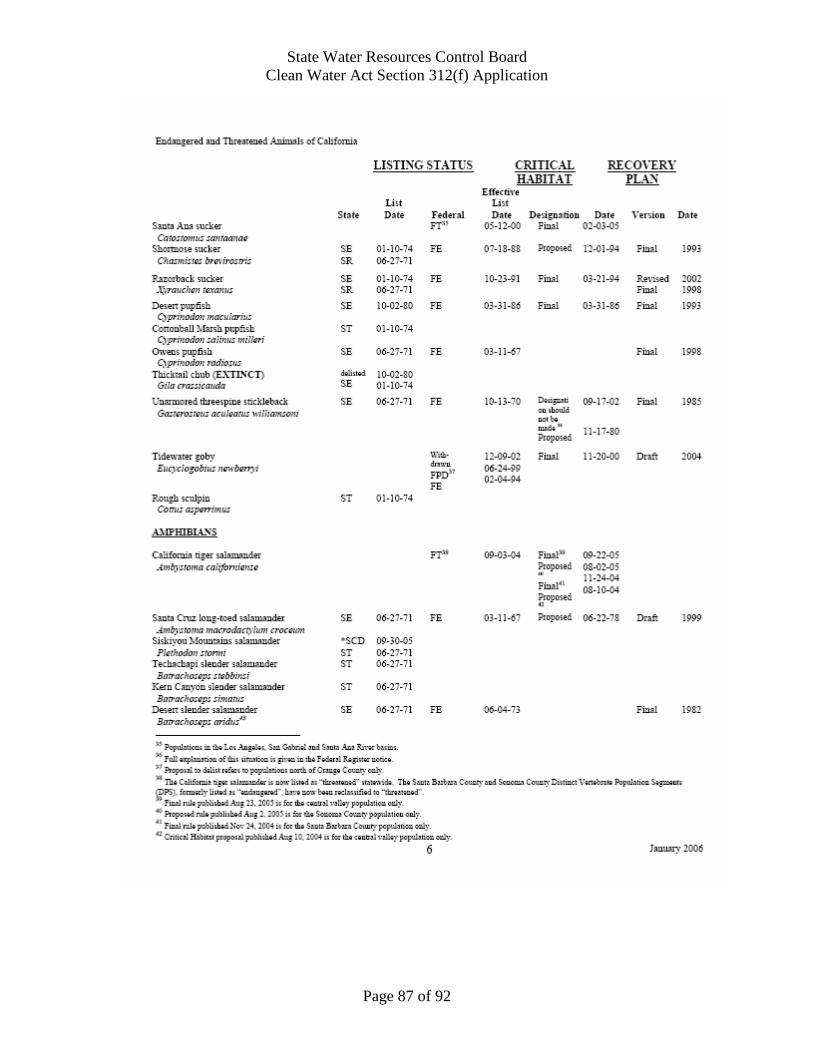
APPENDIX 5 - STATE AND FEDERALLY LISTED ENDANGERED AND THREATENED ANIMALS OF CALIFORNIA
State Water Resources Control Board Clean Water Act Section 312(f) Application
Page 1 of 92
I. INTRODUCTION Clean Water Act (CWA) section 312 (f)(4)(A) states, “If the [U.S. Environmental Protection Agency (U.S. EPA)] Administrator determines upon application by a State that the protection and enhancement of the quality of specified waters within such State requires such a prohibition, he shall by regulation completely prohibit the discharge from a vessel of any sewage (whether treated or not) into such waters.” In addition, section 140.4 (b) of Title 40 of the Code of Federal Regulations (CFR) provides, “a State may make a written application to the Administrator…for the issuance of a regulation completely prohibiting discharge from a vessel of any sewage, whether treated or not, into particular waters, or portions thereof, for which a complete prohibition is desired…such application shall include identification of water recreational areas, drinking water intakes, aquatic sanctuaries, identifiable fish-spawning and nursery areas, and areas of intensive boating activities.” Senate Bill 771, Chapter 588, Statutes of 2005, amended Section 72440 of the California Public Resources Code to require the State Water Resources Control Board (State Water Board) to seek permission from U.S. EPA to regulate sewage discharges from large passenger vessels (cruise ships) and other oceangoing ships (300 gross tons or more) in order to protect coastal and marine water quality. Under the Porter-Cologne Water Quality Control Act or California Water Code, the State Water Board is charged with the responsibility of protecting the beneficial uses of the State’s waters. These beneficial uses include 889 water recreational areas, 10 existing and 19 proposed drinking water intakes, 200 aquatic sanctuaries (including fish-spawning and nursery areas), and extensive coastal, bay, and estuarine areas which attract large numbers of recreational boaters in both northern and southern California. A more detailed description of each major category of coastal and marine resources is provided below. This application consists of three parts: background information, application requirements under 40 CFR section 140.4(b), and conclusions. Most of the information assembled for this application came from the following public documents:
(1) The California Coastal Access Guide, California Coastal Commission (2) The Nearshore Fisheries Management Plan, California Department of Fish and Game (3) The Ocean Economy, California Ocean Protection Council (4) Report to the Legislature: Regulation of Large Passenger Vessels in California,
State Water Resources Control Board (5) California Boating Facilities Needs Assessment, Department of Boating and Waterways.
II. BACKGROUND INFORMATION
II.A – THE CRUISE SHIP TASK FORCE The cruise industry is a rapidly growing multi-million dollar business. California ports handled an estimated 650,000 cruise ship passengers in 2001, making California the second largest market for the cruise industry in the United States. The sizes of cruise ships are reaching record
State Water Resources Control Board Clean Water Act Section 312(f) Application
Page 2 of 92
proportions with the population of crew and passengers equaling many small towns. Some ships can carry up to 5,000 persons. The number of cruise ships operating is also growing. There are over 31 new large cruise ships currently under construction worldwide. Cruise ships travel the entire length of the California coast and now make ports of call to at least six locations in California – Los Angeles/Long Beach, San Francisco, Avalon Bay (Catalina Island), Monterey Bay, and Humboldt Bay. In 2003, there were eight major cruise ship lines operating out of California involving over 20 vessels. In 2002, there were approximately 280 port calls scheduled by those vessels in the ports of San Diego, Long Beach/Los Angeles, San Francisco, and Monterey. The cruise industry estimates a 25 percent increase in the number of vessels that will operate in the waters of the State over the next eight years. While regulatory activities have made some progress in reducing the flow of sewage and waste materials released into the ocean from the shore, one source that has had little or no State regulation is pollution from vessels. Sewage and graywater, for example, are routinely discharged from vessels into California’s coastal waters. Other nations have taken first steps to improve the water quality of the ocean by reducing vessel waste. The European Union prohibits the dumping of sewage and effluents in the waters of all its member nations. All ships must use waste reception facilities in port. The International Maritime Organization, which is a project of the United Nations, instituted international sewage regulations in 2004. These regulations require the mandatory use of port reception facilities if they are available. California does not currently have waste reception facilities capable of handling sewage and graywater from cruise ships and other large oceangoing vessels. Pursuant to Public Resources Code (PRC) 72300 et seq., the California Environmental Protection Agency convened the Cruise Ship Environmental Task Force (Task Force) in 2000. The Task Force was charged with evaluating environmental practices and waste streams of cruise ships. It gathered information from the cruise industry and submitted this information with recommendations in a report to the Legislature in August 2003. Two relevant Task Force findings, as described in its 2003 report titled Regulation of Large Passenger Vessels in California, were as follows: (1) Cruise ships generate considerable quantities of sewage, graywater (wastewater from
kitchens, showers, laundry, etc.), ballast water, and other wastes; and
(2) Although many such cruise ships have installed marine sanitation devices, failure to meet current federal standards for the discharge of effluent is common; and there are no regular monitoring requirements for cruise ships in California’s coastal waters.
State Water Resources Control Board Clean Water Act Section 312(f) Application
Page 3 of 92
These concerns and related considerations led the Task Force to formulate a list of recommendations including the following: (1) Amend the federal CWA to allow California to establish a statewide discharge prohibition
zone for sewage discharges from cruise ships only; (2) Graywater should be required to meet the same standards required of marine sanitation
devices effluent or discharge should be withheld while in State waters; (3) Wastewater discharges should be prohibited in California’s National Marine Sanctuaries;
and (4) No discharge of any waste, food, or otherwise macerated waste into any marine sanctuary
within California coastal waters. II.B – CRUISE SHIP LEGISLATION
To address the issues raised in the Task Force report, the California Legislature enacted a series of new laws in 2003 and 2004 to regulate various discharges of wastes from cruise ships. The major provisions of these laws are summarized below: Chapter 488, Statutes of 2003 (Assembly Bill [AB] 121):
(1) The State Water Board is directed to determine whether it is necessary to apply for federal permission to prohibit the discharge of sewage sludge from cruise ships into State waters. Upon determining that this is necessary, the State Water Board must submit an application seeking authority to impose this prohibition to U.S. EPA under specified provisions of CWA.
(2) Upon federal approval, or if the State Water Board determines that an application is not necessary, cruise ships are prohibited from discharging sewage sludge into the marine waters of the State or national marine sanctuaries.
(3) Cruise ships are prohibited from discharging oily bilge water into the marine waters of the State or national marine sanctuaries.
(4) Releases of either sewage sludge or oily bilge water from cruise ships must be reported to the State Water Board within twenty-four hours of occurrence.
(5) Violations of the discharge prohibitions set forth in (2) and (3) above are subject to civil penalties of not more than $25,000 for each violation.
(6) The State Water Board shall request that the appropriate federal agencies prohibit the discharge of sewage sludge and oily bilge water from cruise ships into the non-State waters within the four national marine sanctuaries off California’s coast.
State Water Resources Control Board Clean Water Act Section 312(f) Application
Page 4 of 92
Chapter 494, Statutes of 2003 (AB 906):
(1) Discharges of either hazardous waste or “other waste” (i.e., wastes from photo-developing, dry cleaning, or medical wastes) from cruise ships are prohibited within State waters or a marine sanctuary.
(2) Discharges of the above-mentioned wastes must be reported to the State Water Board
within twenty-four hours of their occurrence.
(3) The State Water Board must request that the appropriate federal agencies prohibit the discharge of hazardous waste and “other waste,” within national marine sanctuaries off California’s coast.
(4) Violations of the discharge prohibitions set forth in (1) above are subject to civil penalties
of up to $25,000 for each violation. Chapter 710, Statutes of 2004 (AB 2093):
(1) Cruise ships are prohibited from releasing graywater into State waters. (2) Cruise ships are required to report releases of graywater, hazardous waste, and “other
waste” into the marine waters of the State or a national marine sanctuary no later than twenty four hours after the release to the State Water Board.
(3) Each violation of the discharge prohibition is subject to a civil penalty of up to $25,000.
Chapter 764, Statutes of 2004 (AB 2672):
(1) The State Water Board is directed to determine whether it is necessary to apply for permission to prohibit the discharge of sewage from cruise ships into State waters or national marine sanctuaries. Upon determining that this is necessary, the State Water Board must submit an application seeking authority to impose this prohibition to U.S. EPA.
(2) Upon federal approval or if the State Water Board determines that federal approval is
not required, cruise ships are prohibited from discharging sewage into the marine waters of the State until January 1, 2010.
(3) States the Legislature’s intent to request the Congress of the United States to amend
CWA to provide California with authority to regulate sewage discharges from cruise ships within State waters in a manner similar to that granted to the State of Alaska via Public Law 106-554.
(4) Releases of sewage into State waters or national marine sanctuaries must be reported to
the State Water Board within twenty-four hours of release.
(5) Each violation of the sewage discharge prohibition is subject to a civil penalty for an amount not to exceed $25,000.
State Water Resources Control Board Clean Water Act Section 312(f) Application
Page 5 of 92
II.C – OCEANGOING SHIP LEGISLATION Chapter 588, Statutes of 2005 (Senate Bill 771) Senate Bill (SB) 771, the “California Clean Coast Act of 2005,” expanded the sewage discharge prohibition application from cruise ships to a variety of “oceangoing ships.” SB 771 defines an “oceangoing vessel” as “a private, commercial, government, or military vessel of 300 gross registered tons or more calling on California ports or places.” The maritime industry has been growing steadily over the past decade. The Port of Los Angeles was ranked as the top U.S. international freight gateway in 2003. Two of the top five U.S. ports, ranked by dollar value of foreign trade in 2003, were located in California. According to figures from the ports of Oakland and Long Beach, tons of cargo transported since 1990 have been increasing through 2003. Data from the U.S. Maritime Administration and the U.S. Army Corps of Engineers show a steady increase in cargo imports and exports from 1992 through 2001 (Figure 2.1 below). As of November 2004 (the most recent data available), the California State Lands Commission reported that commercial vessel traffic totaled 6825 visits to California’s ports, and that the total number of port visits has been steadily increasing through the last decade. It should be noted, too, that this traffic is far in excess of visits made by cruise ship lines: the latter average around 600 visits per year. It is not currently known how many other types of oceangoing ships are routinely visiting California ports, or the general status of their capacity for storing sewage while operating within State waters and national marine sanctuaries. In order to generate needed information on this subject, SB 771 directs the California State Lands Commission to conduct a one-time survey of this and related information on all vessels visiting California’s commercial ports during 2006. The results of this survey will be forwarded to the State Water Board on or before February 1, 2007. The State Water Board will then report this information to the Legislature by October 1, 2007.
Figure 2.1 – Value of Import and Export of Major California Ports, 1992-2001
Value of Import and Export of Major CA Ports: 1992- 2001(in Millions of U.S. Dollars)
0
50,000
100,000
150,000
200,000
250,000
1992 1993 1994 1995 1996 1997 1998 1999 2000 2001
Import Export
State Water Resources Control Board Clean Water Act Section 312(f) Application
Page 6 of 92
II.D – INCREASES IN VESSEL TRAFFIC AND POTENTIAL IMPACTS ON CALIFORNIA’S OCEAN ECONOMY
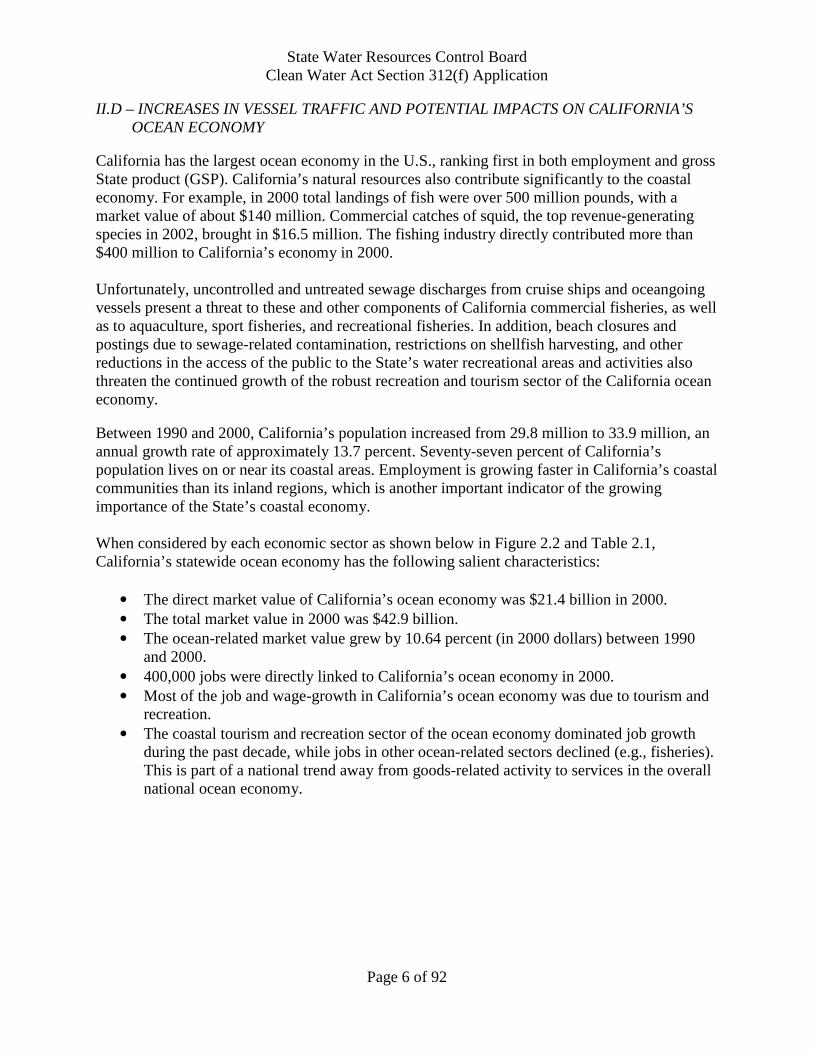
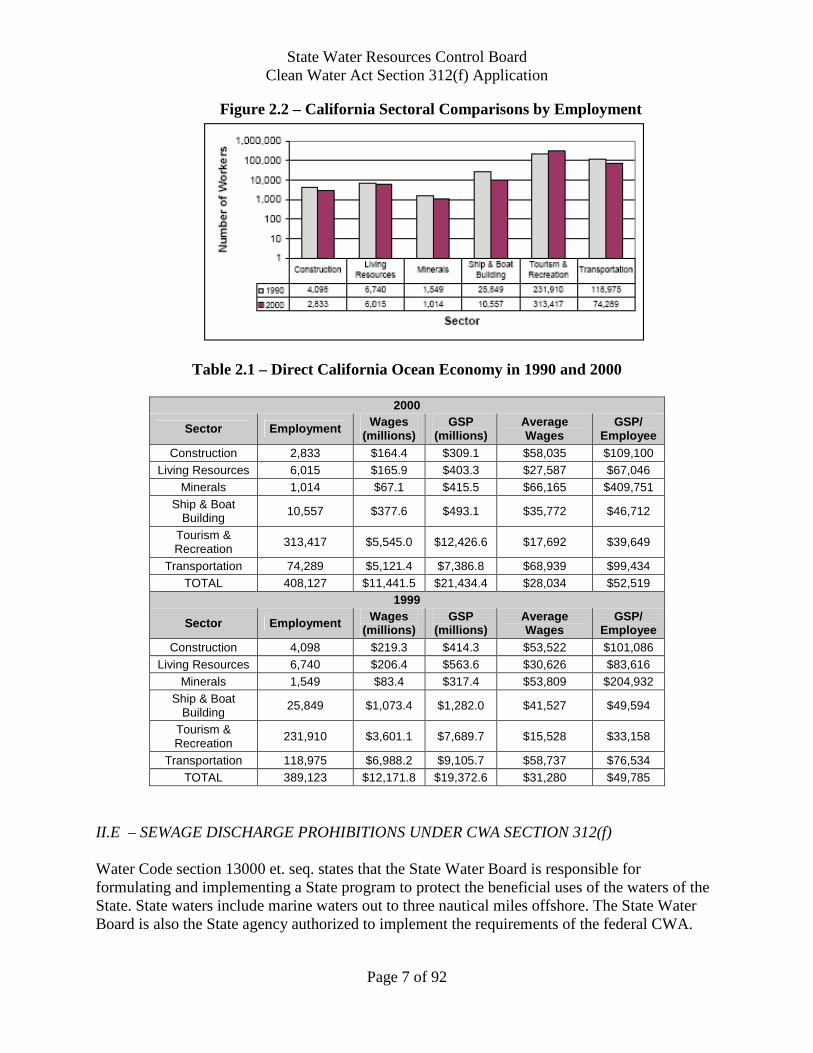
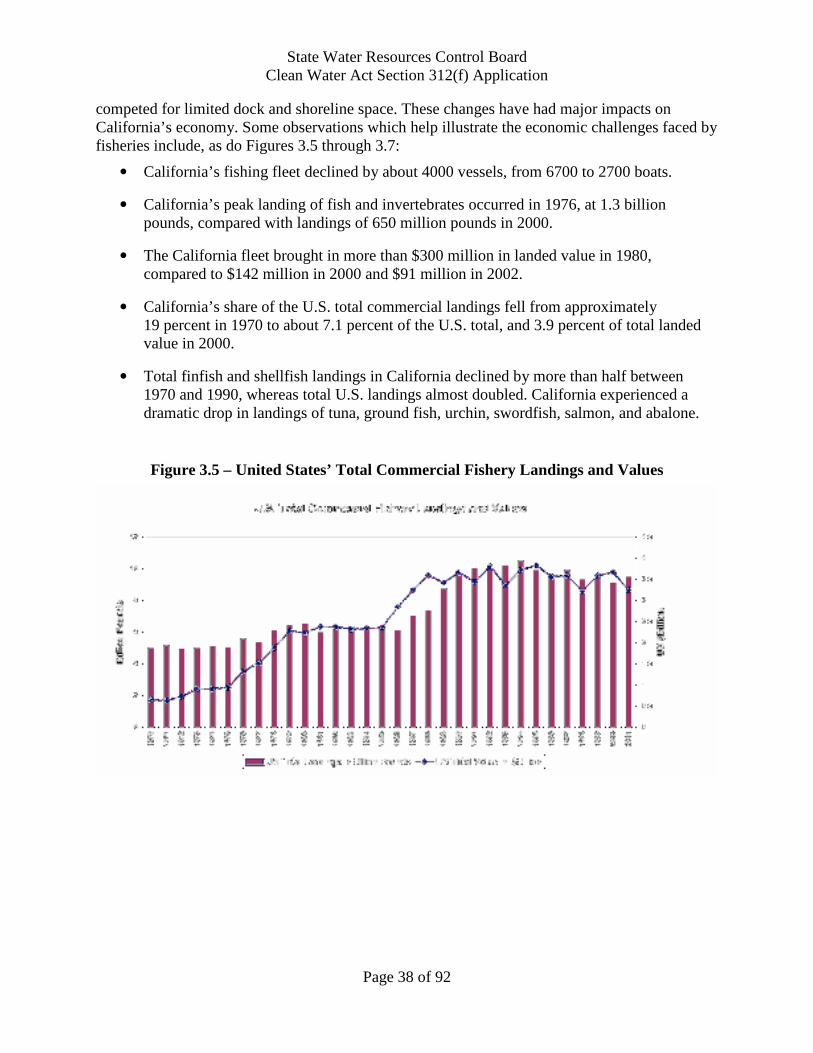
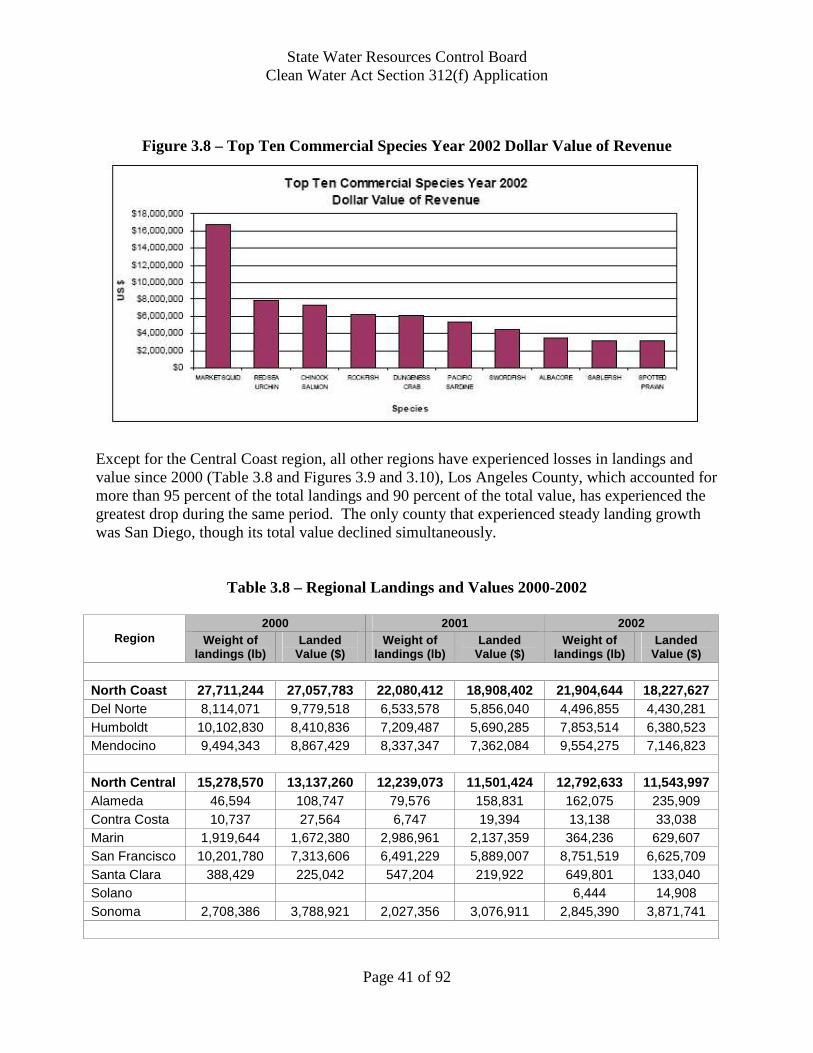
California has the largest ocean economy in the U.S., ranking first in both employment and gross State product (GSP). California’s natural resources also contribute significantly to the coastal economy. For example, in 2000 total landings of fish were over 500 million pounds, with a market value of about $140 million. Commercial catches of squid, the top revenue-generating species in 2002, brought in $16.5 million. The fishing industry directly contributed more than $400 million to California’s economy in 2000. Unfortunately, uncontrolled and untreated sewage discharges from cruise ships and oceangoing vessels present a threat to these and other components of California commercial fisheries, as well as to aquaculture, sport fisheries, and recreational fisheries. In addition, beach closures and postings due to sewage-related contamination, restrictions on shellfish harvesting, and other reductions in the access of the public to the State’s water recreational areas and activities also threaten the continued growth of the robust recreation and tourism sector of the California ocean economy. Between 1990 and 2000, California’s population increased from 29.8 million to 33.9 million, an annual growth rate of approximately 13.7 percent. Seventy-seven percent of California’s population lives on or near its coastal areas. Employment is growing faster in California’s coastal communities than its inland regions, which is another important indicator of the growing importance of the State’s coastal economy. When considered by each economic sector as shown below in Figure 2.2 and Table 2.1, California’s statewide ocean economy has the following salient characteristics:
• The direct market value of California’s ocean economy was $21.4 billion in 2000. • The total market value in 2000 was $42.9 billion. • The ocean-related market value grew by 10.64 percent (in 2000 dollars) between 1990
and 2000. • 400,000 jobs were directly linked to California’s ocean economy in 2000. • Most of the job and wage-growth in California’s ocean economy was due to tourism and
recreation. • The coastal tourism and recreation sector of the ocean economy dominated job growth
during the past decade, while jobs in other ocean-related sectors declined (e.g., fisheries). This is part of a national trend away from goods-related activity to services in the overall national ocean economy.
State Water Resources Control Board Clean Water Act Section 312(f) Application
Page 7 of 92
Figure 2.2 – California Sectoral Comparisons by Employment
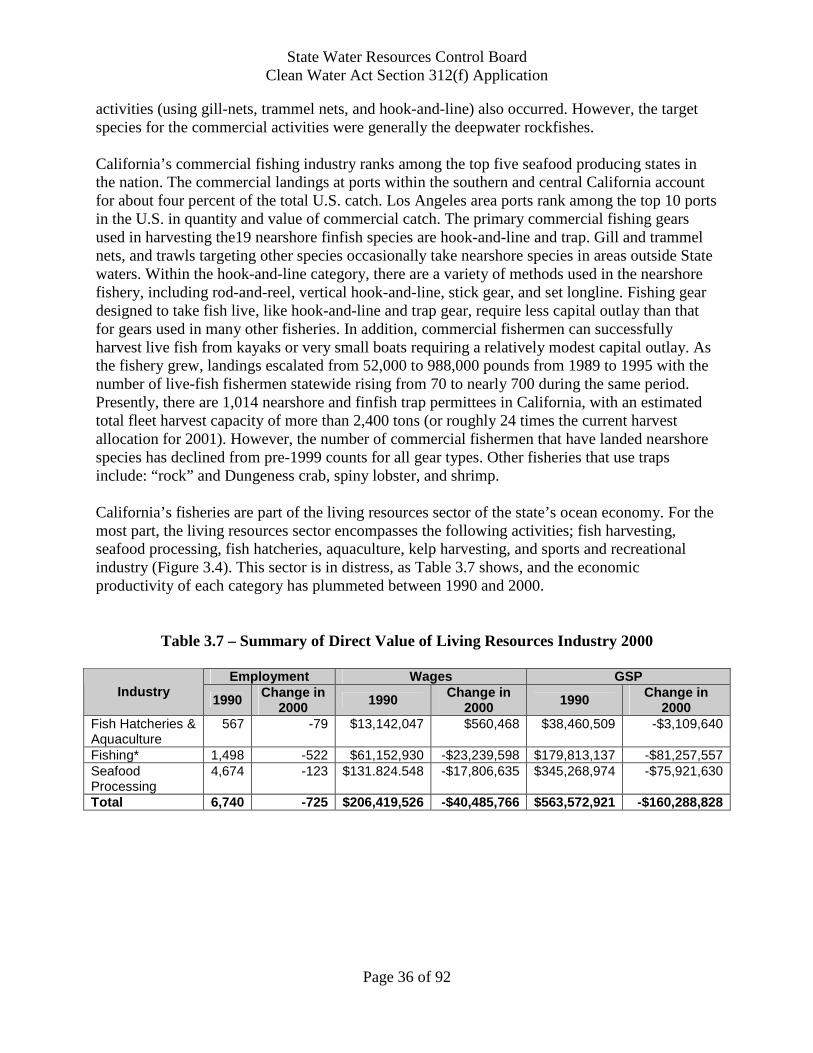
Table 2.1 – Direct California Ocean Economy in 1990 and 2000
2000
Sector Employment Wages (millions)
GSP (millions)
Average Wages
GSP/ Employee
Construction 2,833 $164.4 $309.1 $58,035 $109,100 Living Resources 6,015 $165.9 $403.3 $27,587 $67,046
II.E – SEWAGE DISCHARGE PROHIBITIONS UNDER CWA SECTION 312(f) Water Code section 13000 et. seq. states that the State Water Board is responsible for formulating and implementing a State program to protect the beneficial uses of the waters of the State. State waters include marine waters out to three nautical miles offshore. The State Water Board is also the State agency authorized to implement the requirements of the federal CWA.
State Water Resources Control Board Clean Water Act Section 312(f) Application
Page 8 of 92
The State Water Board regulates waste discharges through issuance of waste discharge requirements. It should be noted that on-shore waste treatment facilities are regulated through the issuance of waste discharge requirements (WDRs), and violations of WDRs can result in fines and penalties. National Pollutant Discharge Elimination System (NPDES) permits, which implement CWA requirements, serve as WDRs for discharges to surface waters. All waste discharges from point sources into bay waters are required to meet the water quality objectives established in either the statewide water quality control plans and/or more localized regional water quality control plans, as applicable. In addition, discharges into bays and estuaries must comply with the California Ocean Plan, the California Toxics Rule and the State Implementation Plan. However, it should be noted that the California Ocean Plan currently exempts vessel waste discharges. The amount of wastewater generated by a cruise ship is equivalent to that generated by a small city. Allowing these “floating cities” to discharge wastewater into coastal waters without meeting water quality standards would result in inconsistent application of regulations. The State Water Board maintains that the implementation of similar standards for oceangoing vessels including cruise ships would help protect the State’s marine waters and ocean environment and preserve public health. Federal law prohibits states from regulating sewage discharges from vessels, with some exceptions. Under CWA section 312, a state or local authority that has determined that some or all state waters require greater environmental protection must submit an application to the Administrator of U.S. EPA to prohibit these discharges. Based on the application, the Administrator must make a determination within 90 days whether the subject waters have sufficient coastal and marine resources to warrant protection from vessel discharges of sewage. Sections 72440 and 72425 of PRC offer the State Water Board two options: (1) if it determines that applying for this authority under CWA is not necessary, it may proceed to enforce a discharge prohibition of sewage from cruise ships; or (2) if it determines that an application is necessary, the State Water Board is directed to apply to U.S. EPA for this authority under CWA section 312(f). After reviewing its options and seeking advise from U.S. EPA, the State Water Board determined that it was indeed necessary to prepare an application. The enactment of SB 771 (Simitian, Chapter 588, Statutes of 2005) substantially broadened the classes of vessels subject to the discharge prohibition to include virtually any “ocean-going vessel” of 300 gross registered tons or greater. Accordingly, this application covers all oceangoing vessels that fall in this category. As advised by U.S. EPA, the State Water Board has followed the procedures described in section 140.4 of 40 CFR in preparing this application.
III. APPLICATION REQUIREMENTS Section 140.4(b) of 40 CFR states in part that the application shall include identification of water recreational areas, drinking water intakes, aquatic sanctuaries, identifiable fish-spawning and nursery areas, and areas of intensive boating activities. These specific information requirements are described in detail below.
State Water Resources Control Board Clean Water Act Section 312(f) Application
Page 9 of 92
III.A – WATER RECREATIONAL AREAS The Economic Importance of Public Coastal Resources The 1,100-mile California coast is a unique, varied, and extensive system of recreational resources for State residents. Its many and varied recreational opportunities attract millions of tourists each year to its beaches, parks, campgrounds, piers, trails, and other public facilities that stretch from the redwood forests of coastal Del Norte County to the beaches of southern San Diego County. California currently has 889 identified water recreational facilities, and all of the state’s coastal counties have a diverse assortment of these public resources. Appendix 1 lists these diverse and numerous coastal, marine, and estuarine water recreational facilities by county, and Map 3.0 (below) shows California’s state waters and enclosed bays.
Map 3.0 - California’s State Waters and Enclosed Bays
California coastal tourism and recreation encompasses the hotel and restaurant industry, marinas, the coastal water sports industry, recreational boating harbors, recreational fishing facilities and
State Water Resources Control Board Clean Water Act Section 312(f) Application
Page 10 of 92
stores, beaches, and retail businesses. Recreational activities include a diverse assortment of public resource utilization options, including ecotourism, boating, swimming, fishing, surfing, kayaking, diving, and snorkeling. California ranks first in the nation as a travel destination. The total California tourism industry annually generates more than $75 billion in direct travel spending for the State economy and supports more than 1 million jobs, which makes it the 3rd larges employer and 5th largest contributor to the State’s GSP. Coastal tourism and recreation has been the fastest growing activity, both in volume and diversity, along the coastal zone. As of 2000, it was one of the major growth engines not only for the coastal counties but also for the entire State. Tourism and recreation-related economic activities are shaping development patterns in the coastal zone, which account for a major share of population and economic activities. Coastal tourism also makes California’s position competitive in international tourism, since its beaches are the leading international tourist destination in the State. California’s coastal tourism and recreation sector grew by 62 percent between 1990 and 2000, with a wage increase of 55 percent and an employment increase of more than 35 percent (as shown in Figure 3.1, below).
Figure 3.1 – Distribution of the California Ocean Economy in 2000
All economic activities relating to coastal recreation are affected by the quality of the environment. Coast land, beaches, watersheds, and coastal waters each provide a link between the travel and tourism industry and coastal recreational industries such as swimming, surfing, boating, diving, and fishing. The level of participation in coastal water/nature-related industries
State Water Resources Control Board Clean Water Act Section 312(f) Application
Page 11 of 92
affects several other industries and sectors of the economy, too. Increased demand for coastal recreation will result in increased demand for the hotel, restaurant, and service industry. This will also, indirectly, increase the construction activity along the coast as more hotels and vacation homes are built. For example, an increase in water-skiing will increase the manufacture and sale of boats used for these activities. Similarly, an improvement in a beach will lead to more beach visitors leading to increased beach-wear demand, which will lead to increased manufacturing and retailing businesses. Increased demand will also affect infrastructure construction activities. Roads, parking lots, water and waste systems, and the like will also be necessary. Marine recreation activities can be divided into four major subgroups: beach activities, recreational fishing, recreational boating, and other marine recreational activities. Table 3.1 provides estimates for California for each of these subgroups, and Figure 3.2 depicts the proportion of different marine recreational activities. Figure 3.3 shows the proportion of beach related marine recreational activity days.
Table 3.1 – Measure of Participation in Marine Recreational Activities
Table 3.2 gives estimates for the number of participants and number of activity days for different beach related recreational activities in California. More than 12 million people visited different beaches in California during the year 2000, and, on average, each person made slightly more than 12 trips per year. Beach visitation activity includes multiple recreational activities at a beach on a given day such as swimming, sunbathing, viewing wildlife, or collecting seashells. Thus, beach visitation counts should not be added to other activity counts. It should be noted that the participation rate value cited gives a measure of the intensity of participation, and this varies from activity to activity, being as low as 4.8 days for scuba diving and as high as 20 days for surfing. California accounts for approximately 35 percent of all surfers in the U.S. in terms of the number of participants and 30 percent in terms of the number of surfing activity days in the United States. Significantly, 63.4 percent of all Californians make at least one visit to a California beach each year, which is 2.5 times the national average.
State Water Resources Control Board Clean Water Act Section 312(f) Application
Page 13 of 92
There are reported to be 417 California beaches, and beach attendance is estimated to be approximately 153 million activity days. Based on a conservative estimate of beach attendance of 150 million beach days annually, the estimated non-market value of beach visits in California is approximately $2.25 billion dollars annually: when the market value of beach attendance is employed instead, it is estimated that this figure would rise to $3.75 billion dollars. Beach going is more than just an idle past time in California. Beach going represents a major economic use of the California coast and ocean. Concession stands, paid parking lots, and waterfront restaurants reveal that beach goers contribute to a thriving coastal market economy. In fact, it is estimated that market expenditures by beach goers in California could substantially exceed $3 billion dollars. Less obvious, however, is the economic magnitude of beach values that never enter the market. Beaches in California represent recreational and open space resources that provide a level of public access rarely matched elsewhere in the United States. Beaches in California continue to provide non-market economic benefits that are on the order of at least $2 billion dollars. These values affect a beach-going public that includes over 60 percent of all California residents annually. When combined, the total value of beach going, including market and non-market values, may easily exceed $15 billion dollars annually. Table 3.3 below shows attendance at California’s top beaches and coastal parks.
Table 3.3 – California’s Top Beach/Coastal Park Attendance
Golden Gate National Recreation Area 13,459,000 Santa Monica State Park 7,342,250 Light House Field State Beach 3,977,600 Dockweiler State Beach 3,855,700 Huntington State Beach 2,780,400 Seacliff State Beach 2,424,400 Bolsa Chica State Beach 2,289,300 Doheny State Beach 2,145,100 Sonoma Coast State Beach 201,600 San Clemente State Beach 495,100
Table 3.4 – Participation in Other Marine Recreation-Related Activities
Recreation Activity Number of Participants Number of Days
Average Days Per Person
Visit Waterside Besides Beaches 1,500,965 20,683,000 13.78 Snorkeling 706,998 3,818,000 5.40 Bird Watching in Saltwater Surrounding 2,581,958 65,762,000 25.47 Viewing or Photographing Scenery in Saltwater Surroundings 4,175,372 N/A N/A Hunting Waterfowl in Saltwater Surroundings 113,302 N/A N/A
State Water Resources Control Board Clean Water Act Section 312(f) Application
Page 14 of 92
Table 3.4 above includes other marine recreational activities and gives the estimates of participants and number of activity days for all other marine recreational activities along the California coast, such as wild life viewing, photography, viewing scenery, or water fowl hunting in brackish and saltwater marshes. Table 3.5 provides the volume of visitors to coastal counties of California.
Table 3.5 – Visitor Volumes in Coastal Counties of California
Visitor Volumes in Coastal Counties of California* (Millions of person-trips) 1998 1999 2000 2001 County Total Leisure % Total Leisure % Total Leisure % Total Leisure %
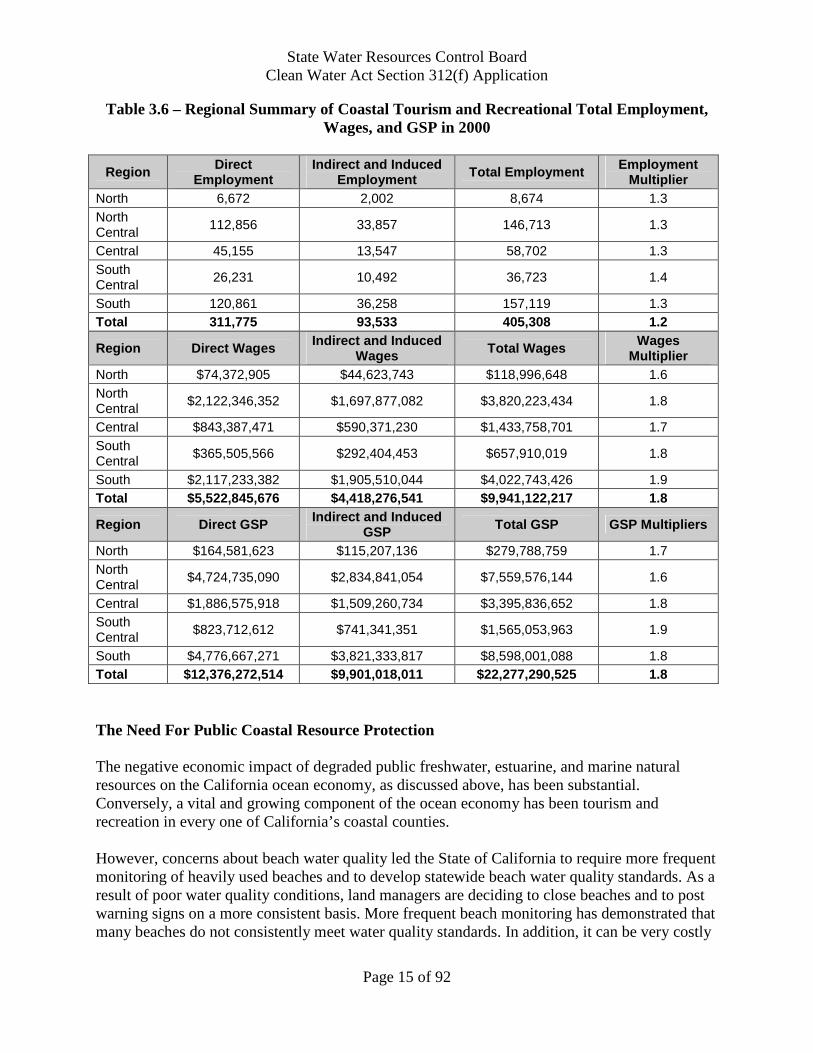
* Data for Del Norte, Humboldt, Yolo, Solano, San Joaquin, and San Luis Obispo coastal counties are not available. Table 3.6 summarizes the total economic impact of the California Coastal Tourism and Recreation sector by region. It should be noted that the tourism and recreation sector component of the California ocean economy grew significantly in the 1990s. The growth in the Central region was highest in terms of employment, wages, and contributions to GSP, followed by the San Francisco Bay, or North Central area. The growth in wages and contribution to GSP is relatively high compared to employment growth using constant 2000 dollars.
State Water Resources Control Board Clean Water Act Section 312(f) Application
Page 15 of 92
Table 3.6 – Regional Summary of Coastal Tourism and Recreational Total Employment, Wages, and GSP in 2000
Region Direct Employment
Indirect and Induced Employment Total Employment Employment
Multiplier North 6,672 2,002 8,674 1.3 North Central 112,856 33,857 146,713 1.3
Central 45,155 13,547 58,702 1.3 South Central 26,231 10,492 36,723 1.4
South 120,861 36,258 157,119 1.3 Total 311,775 93,533 405,308 1.2
Region Direct Wages Indirect and Induced Wages Total Wages Wages
Multiplier North $74,372,905 $44,623,743 $118,996,648 1.6 North Central $2,122,346,352 $1,697,877,082 $3,820,223,434 1.8
Central $843,387,471 $590,371,230 $1,433,758,701 1.7 South Central $365,505,566 $292,404,453 $657,910,019 1.8
South $2,117,233,382 $1,905,510,044 $4,022,743,426 1.9 Total $5,522,845,676 $4,418,276,541 $9,941,122,217 1.8
Region Direct GSP Indirect and Induced GSP Total GSP GSP Multipliers
North $164,581,623 $115,207,136 $279,788,759 1.7 North Central $4,724,735,090 $2,834,841,054 $7,559,576,144 1.6
Central $1,886,575,918 $1,509,260,734 $3,395,836,652 1.8 South Central $823,712,612 $741,341,351 $1,565,053,963 1.9
South $4,776,667,271 $3,821,333,817 $8,598,001,088 1.8 Total $12,376,272,514 $9,901,018,011 $22,277,290,525 1.8 The Need For Public Coastal Resource Protection The negative economic impact of degraded public freshwater, estuarine, and marine natural resources on the California ocean economy, as discussed above, has been substantial. Conversely, a vital and growing component of the ocean economy has been tourism and recreation in every one of California’s coastal counties. However, concerns about beach water quality led the State of California to require more frequent monitoring of heavily used beaches and to develop statewide beach water quality standards. As a result of poor water quality conditions, land managers are deciding to close beaches and to post warning signs on a more consistent basis. More frequent beach monitoring has demonstrated that many beaches do not consistently meet water quality standards. In addition, it can be very costly
State Water Resources Control Board Clean Water Act Section 312(f) Application
Page 16 of 92
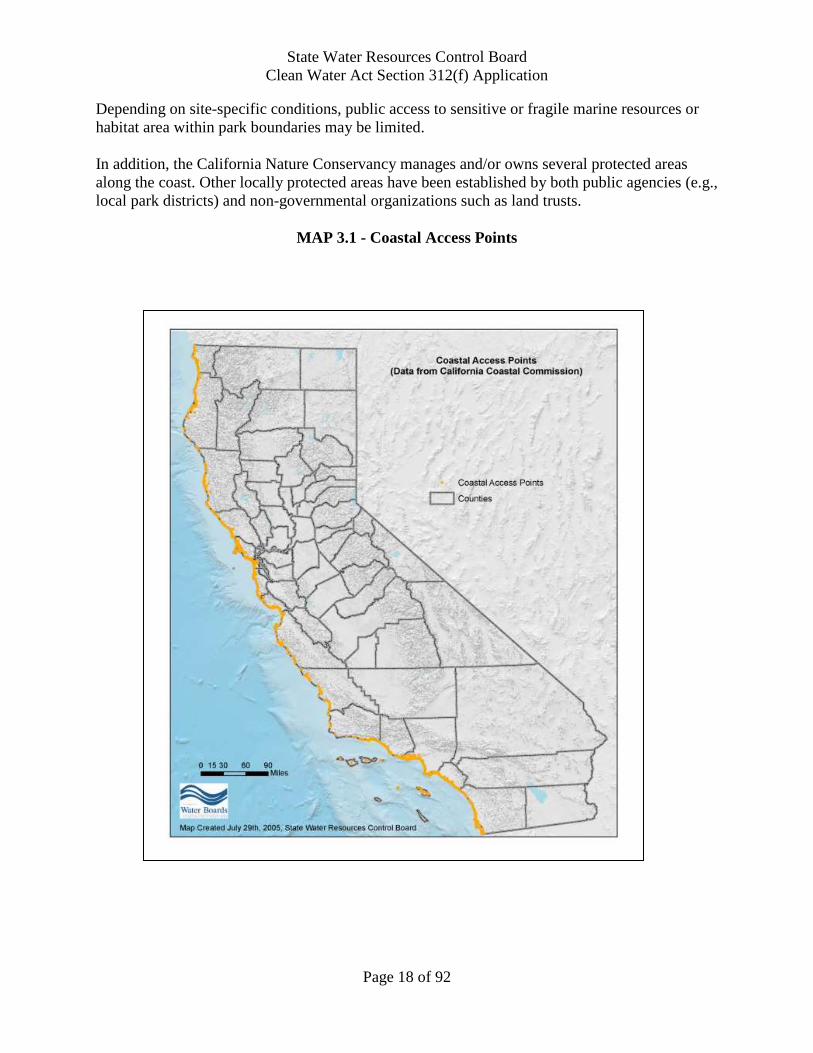
to determine the cause of poor water quality. Stormwater runoff and nonpoint sources of various wastes can pose public health hazards and/or impairments to coastal and marine ecosystems. The negative economic impact of degraded public freshwater, estuarine, and marine natural resources on the California ocean economy, as discussed above, has been substantial. The primary basis for beach closings by public health authorities is the detection of human pathogens, whether due to reported sewage spills reaching recreational waters or repeated incidences of exceedances of bacterial standards from an unknown source. Closures are mandatory when public health authorities have knowledge of a specific release of untreated sewage, and discretionary with respect to unknown sources of microbial indicators. A “beach warning” may be posted when there has been an exceedance of a bacterial standard, but there is no known source of human sewage: the warning alerts the public of the risk of illness associated with water contact. In 2002, 70.1 percent of the sources of contamination resulting in beach postings and closures in California were “unknown.” Given the magnitude of this unknown set of contributing sources, and the relative absence of regulation of discharges of sewage and graywater from cruise ships within California’s waters, the State Water Board is presently unable to address the possible contributions to this problem from such vessels because of pre-emption under CWA in this matter. The State Water Board’s ability to protect the important beneficial use of water-contact recreation along many miles of public beaches is thus significantly impaired. The California Coastal Act of 1976 charged the Coastal Commission with working to conserve, protect, and restore coastal environmental resources. One of its primary goals has been to enhance public access and recreational opportunities along the coast. Coastal access points are available to the public along the entire length of the shoreline at posted locations, thus maximizing public use of these coastal resources. It is important to note that 80 percent of California’s population lives within 30 miles of the coast. California’s Numerous and Diverse Water Recreational Areas Many of California’s 278 State parks and beaches include campground facilities. Many campground facilities fill up and require advance reservations, owing to their growing popularity. Day-use is also popular, and parking lots frequently fill up during periods of fair weather. The situation for local (e.g., county) and national parks and recreation areas is similar. Each area has a variety of features, such as forests, mountains, headlands, lakes, rivers, cliffs, beaches, and tidepools. California has 63 State beaches, which consist of areas with frontage on the ocean or bays designed to provide swimming, boating, fishing, and other beach-oriented activities, and these are distributed among all the coastal counties. State law provides that the public has legal access rights to California’s shores, in as much as the beaches extending up to the mean high tide line are State property and therefore held in trust for the benefit of the public. Hundreds of official coastal access points have been designated and improved to encourage public use and enjoyment of these public resources. These coastal access points range from the Oregon border to Mexico (see Map 3.1 below).
State Water Resources Control Board Clean Water Act Section 312(f) Application
Page 17 of 92
The California State Parks (CSP) is a state agency which offers environmental campsites at 13 locations. These are areas in which the scenic and natural features are enhanced by noise controls and the separation of the campsites from automobiles. Each campsite is accessible only by pedestrian traffic, and each campsite is separated from adjacent campsites by natural features such as vegetation. California has established a system of Marine Managed Areas (MMAs), which are named and have discrete geographic areas along the coast that protect, conserve, or otherwise manage a variety of resources and uses, including living marine resources, cultural and historical resources, and recreational opportunities. Classifications of MMAs encompass such designations as State marine cultural preservation areas and State marine recreational management areas, as well as Marine Protected Areas (MPAs). Natural reserves, refuges, and preserves have been established in many areas to protect and preserve remaining undisturbed areas of significant natural or cultural value. Historically, the California coast has been an area of diverse landforms, vegetation, animal life, and cultural resources. Today, many coastal ecosystems and resources have been altered or destroyed by human activity, but important conservation efforts have been made at this system of publicly owned natural areas. These protected areas offer excellent education and research opportunities and allow the general public to observe and develop an understanding of the State’s natural environment and cultural background. The California Department of Fish and Game (DFG) is responsible for the protection and management of California’s terrestrial and aquatic wildlife and their habitats. DFG operates more than 40 marine life refuges and reserves within the California coastal zone, some of which are located in or adjacent to publicly accessible areas such as State parks, while others are restricted to access for education or scientific research. The reserves and refuges have been established to protect and preserve endangered, threatened, or ecologically significant species of marine life or their habitats. As a general rule, marine reserves restrict the taking of most marine invertebrates and marine plant life. With respect to marine life refuges, it is generally unlawful to take or possess the marine life for which the refuge is designated. The purpose of reserves and preserves designated by CSP is to provide day-use areas for public enjoyment and education while preserving the reserve’s unique natural features. Preserves, which are distinct portions within a State park unit, are established for the purpose of maintaining an outstanding natural, scenic, scientific, or cultural feature in its natural condition. There are also 12 national wildlife refuges scattered along the length of California’s coastline that afford significant opportunities for both wildlife conservation and recreational uses, e.g., bird-watching and hunting. The National Park Service manages six federal facilities in coastal California, including parks, recreation areas, and national monuments. Activities which unduly disturb the physical, biological, and cultural resources of its properties are generally prohibited.
State Water Resources Control Board Clean Water Act Section 312(f) Application
Page 18 of 92
Depending on site-specific conditions, public access to sensitive or fragile marine resources or habitat area within park boundaries may be limited. In addition, the California Nature Conservancy manages and/or owns several protected areas along the coast. Other locally protected areas have been established by both public agencies (e.g., local park districts) and non-governmental organizations such as land trusts.
MAP 3.1 - Coastal Access Points
State Water Resources Control Board Clean Water Act Section 312(f) Application
Page 19 of 92
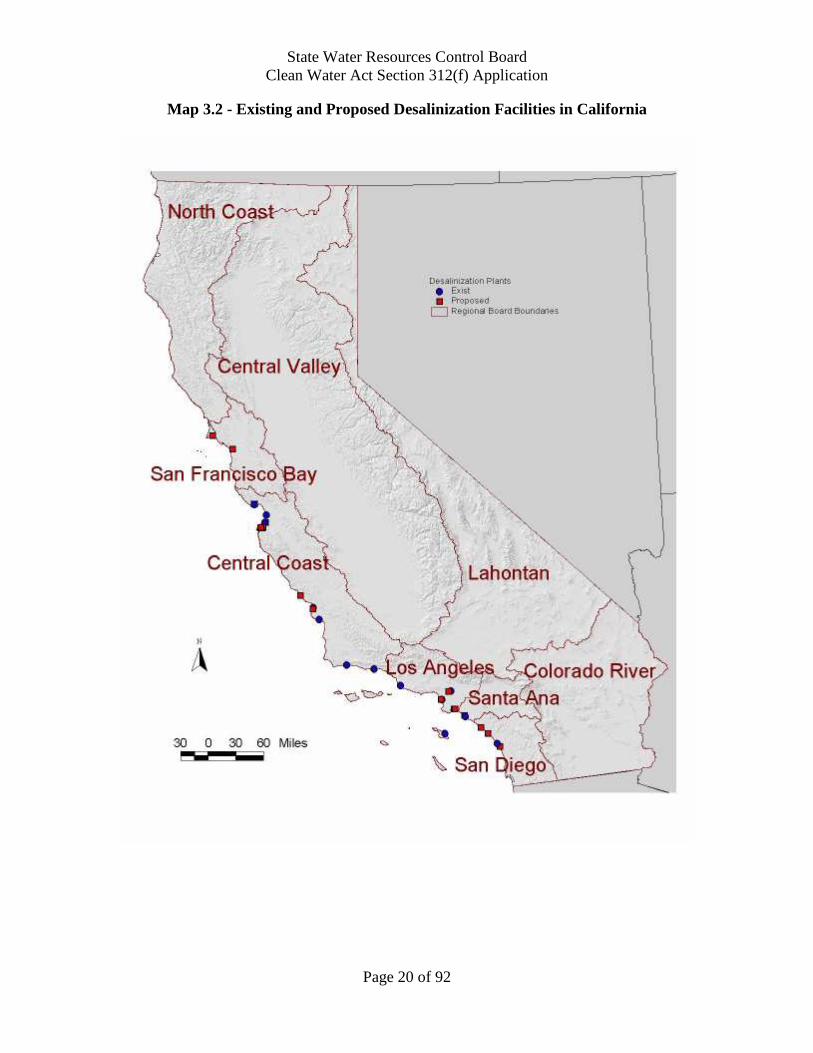
III.B – DRINKING WATER INTAKES Much of California is subject to episodes of drought that can last several years. Population growth in many of these drought-prone areas has created increased demand for drinking water that meets public health standards for potability. Currently, 10 desalinization facilities treat seawater to meet this growing demand, and 19 more are either proposed or under construction. Appendix 2 lists both existing and proposed desalination facilities, and Map 3.2 (below) shows the locations of these facilities. In the 21st Century, population growth is expected to increase in California, Nevada, and Arizona. Nevada and Arizona also continue to use more of their allocated Colorado River supplies, and the California Department of Water Resources (DWR) estimates that Colorado River imports to southern California could eventually decline from about 5.2 to 4.4 million acre-feet. In past years, Arizona and Nevada had been using less than their share of Colorado River water, and their unused supply was made available to California. Southern California was spared from severe rationing during most of the most recent drought (which lasted from 1987 through 1992) primarily because of the 600,000 acre-feet annually of unused Colorado River water made available to the Metropolitan Water District of Southern California. Even with this supply, however, much of Southern California still experienced significant rationing in 1991. Urban California water demand forecasts are primarily based on statewide population projections that show an increase of almost 19 million people from 1990 to 2020, from roughly 30 million to 49 million people. About half of the projected population increase will happen in southern California. One issue that is highly significant with respect to current and future population growth trends in California is the chronic shortage of water to meet competing demands in the San Francisco Bay-Sacramento-San Joaquin River Delta estuary (Bay-Delta). Two thirds of the State’s population and millions of acres of agricultural land receive part or all of their water supplies from the Bay-Delta. Compliance with Endangered Species Act (ESA) biological opinions has contributed to the current situation in which the Bay-Delta is no longer able to meet the demands of agricultural and urban water, even in years without drought. DWR has estimated that ESA and other regulatory requirements may redirect upwards of 500,000 to 1 million acre-feet annually during average years and 2 to 3 million acre-feet in drought years. Given this overall situation of net potable water demand exceeding supply in many areas of California, together with population growth projections, it is anticipated that more desalinization drinking water plants will be constructed.
State Water Resources Control Board Clean Water Act Section 312(f) Application
Page 20 of 92
Map 3.2 - Existing and Proposed Desalinization Facilities in California
State Water Resources Control Board Clean Water Act Section 312(f) Application
Page 21 of 92
III.C – AQUATIC SANCTUARIES: FISH-SPAWNING, NURSERY AREAS, AND OTHER IMPORTANT MARINE AND COASTAL NATURAL RESOURCES
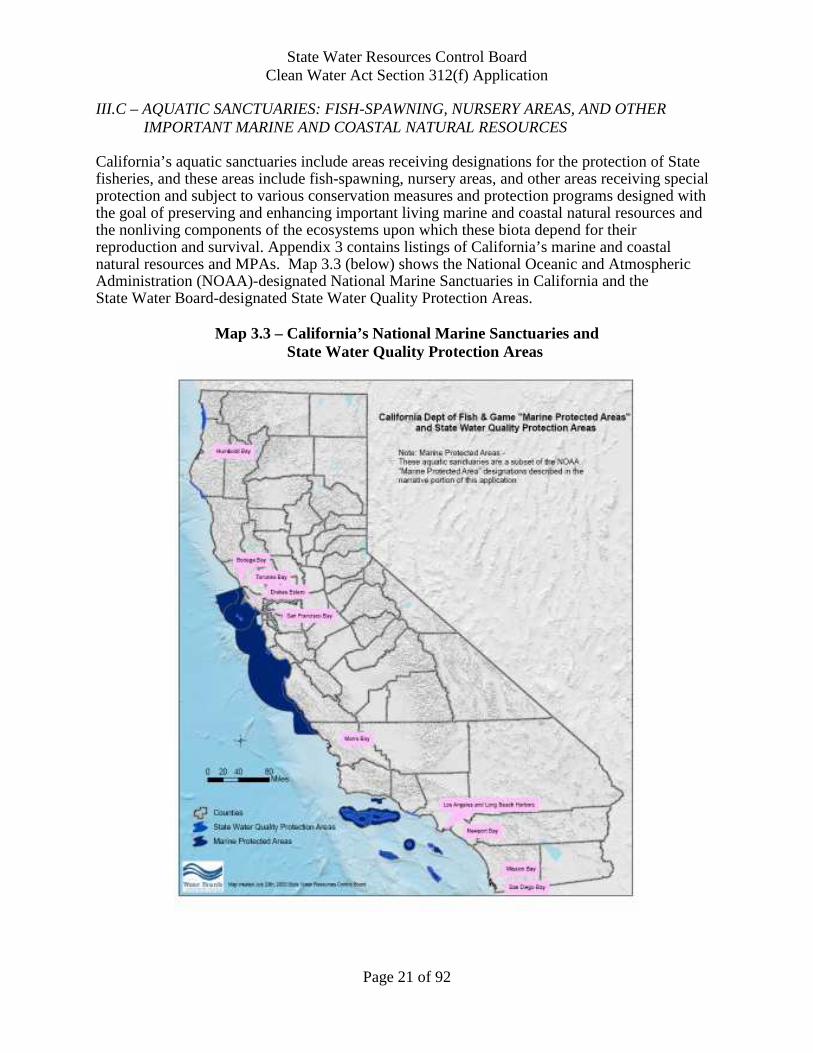
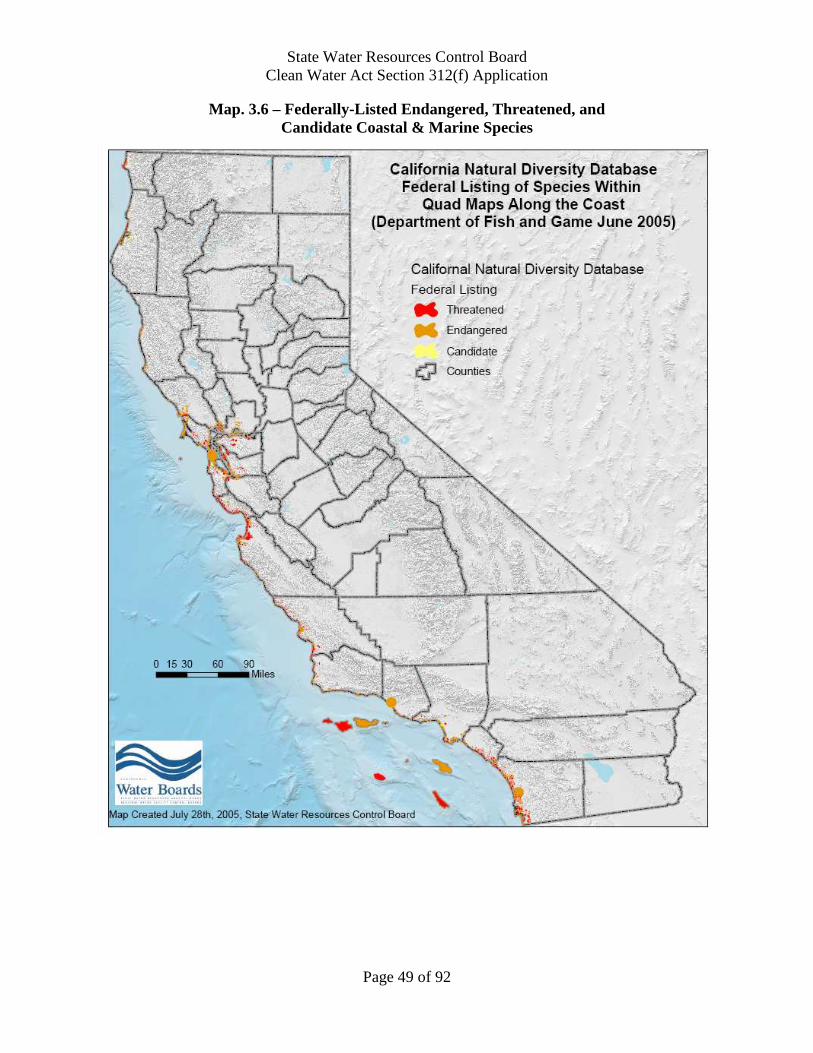
California’s aquatic sanctuaries include areas receiving designations for the protection of State fisheries, and these areas include fish-spawning, nursery areas, and other areas receiving special protection and subject to various conservation measures and protection programs designed with the goal of preserving and enhancing important living marine and coastal natural resources and the nonliving components of the ecosystems upon which these biota depend for their reproduction and survival. Appendix 3 contains listings of California’s marine and coastal natural resources and MPAs. Map 3.3 (below) shows the National Oceanic and Atmospheric Administration (NOAA)-designated National Marine Sanctuaries in California and the State Water Board-designated State Water Quality Protection Areas.
Map 3.3 – California’s National Marine Sanctuaries and State Water Quality Protection Areas
State Water Resources Control Board Clean Water Act Section 312(f) Application
Page 22 of 92
California’s Natural Coastal, Estuarine, and Marine Environments: Oceanographic and Habitat Considerations The Cenozoic geologic history (past 67 million years) of the Pacific coastal margin has been dominated by the interaction of oceanic and continental tectonic plates. Along the central and southern coast of California, north-northwest movement of the Pacific Plate relative to the American Plate has resulted in the formation of the San Andreas and subsidiary fault systems. Tectonic activity along these faults has dominated this region during the middle to late Cenozoic period. North of Cape Mendocino, the Gorda Plate is moving eastward beneath the continental North American Plate while the Pacific Plate is moving northwest. The Gorda, North American, and Pacific Coastal plates form the Mendocino triple junction approximately 35 miles south-southwest of the Humboldt Bay area. These plates are bounded by the San Andreas Fault, the Mendocino Fault zone, and the Gorda Ridge. It is the subducting Gorda Plate that gives rise to the deep seismic zone which generates much of the earthquake activity in this region. The geology along the California coast is characterized by three major stratigraphic sequences: 1) Cretaceous to lower Miocene (67 to 20 million years before present) clastic strata deposited as marine sequences in the shelf or slope environment, 2) middle to upper Miocene siliceous and calcareous (15 to 5 million years before present) strata deposited in deep-ocean environments, and 3) upper Miocene and younger (5 million years ago to present) clastic strata deposited primarily in shelf environments. The regional geology for northern California is divided into two basins, the Eel River Basin (Cape Mendocino to Cape Blanco, Oregon) and Point Arena Basin (Point Arena to Cape Mendocino). The regional geology for central and southern California is divided into five different provinces: Central California (Eureka to Point Conception) overlaps portions of the previous two Basins), Santa Barbara Basin, Los Angeles Basin, Inner Borderlands (Channel Islands vicinity), and Outer Borderlands (Channel Islands to Mexico). Each of these provinces contain numerous faults, some which extend onshore (e.g., San Andreas Fault and San Gregorio Fault). The main divisions of the seafloor are the shore, continental shelf, continental slope and rise, and deep-sea bottom. The continental shelf extends seaward from the shore to approximately 200 meters (m) depth. Because of the variability of the coastline and offshore topography, the distance that the shelf extends from shore varies from approximately one nautical mile to 25 nautical miles. The continental slope extends from approximately 200 m depth to an average depth of a few thousand meters. The continental slope can be further divided into upper, middle, and lower slope areas. The upper slope areas are from 200-500 m depth, middle slope between 500-1,200 m depth, and the lower slope between 1,200 and approximately 3,200 m depth. Much of the area along the continental slope between Point Arena and Point Reyes is subject to recent slumping. The existence of mass transport deposits indicates locations of past slope failure and zones of possible seafloor instability. Mass transport of sediments are common on the continental shelf and slope of northern California and the submarine canyons that incise the central California shelf. Mass transport is the gravity-induced downslope movement of consolidated to semi-consolidated sediments and consists of slides, slumps, and sediment creep.
State Water Resources Control Board Clean Water Act Section 312(f) Application
Page 23 of 92
The continental shelf of the greater Monterey Bay area between Point Año Nuevo and Point Sur exposes complex patterns of Mesozoic and Cenozoic rock outcrops, and coarse Quaternary sand bodies that occur in distinct depressions on the inner and mid-shelves. Exposures of familiar geologic formations from onshore central California, such as the Santa Cruz Mudstone and the Purisima and Monterey Formations, are present in the offshore. The tectonic structure mapped between Point Sal and Point Arena, offshore central California, found the main structural elements in the Monterey area include the San Andreas Fault Zone, San Gregorio Fault Zone, and the boundary of the Pacific and North American tectonic plates. A geologic map shows that bedrock in the area of Anacapa Island is either undifferentiated sedimentary rocks of Miocene age, or volcanic rocks of Miocene age. The layering of the rocks in the data identifies them as sedimentary rocks, probably of the Monterey Formation of Pliocene and Miocene age. The sea floor has representations of all major types of sediment: sand, mud, silt, hard rock outcroppings including pinnacles, cobbles and gravel, and clays. Low-relief rock outcrops (2 to 3 meters relief) provide unique habitat for a variety of fish and invertebrates. The canyons found throughout the coastal zone provide a channelized corridor for land-transported soils. The steep sides (up to 30 degrees for drops of several hundred meters along some canyons) are most likely cut into hard rock, probably the greywackes and metamorphic rocks of the Franciscan formation. Slump deposits are common in the submarine canyons off California and result from the undercutting of terrace and levee deposits by currents or by sediment transport in the canyons. The intermittent channel fill in the canyons is highly mobile and unstable. Sediment grain size generally decreases with increasing depth off the coast, from predominantly sand-sized sediments on the continental shelf to fine-grained muds on the continental slope. The sand-to-sandy mud transition occurs at depths of 600 to 800 m. Above this depth, waves and the California undercurrent can scour the bottom, preferentially removing the finer-grained sediments. At depths below this range, the scouring effects are attenuated, and fine-grained sediments have longer residence times on the bottom. Within the depth range of 600 to 800 m, where the slope flattens from eight to four percent, the mud (silt and clay) content of the sediment increases from 12 to 55 percent. This is called the “mud line” or the mud transition that generally separates non-depositional or erosional bottoms above this depth range from more depositional regimes below this depth range. California’s Physical Oceanography The hydrographic conditions along the California coast are influenced by the California current system, precipitation, and river runoff. The North Pacific region is dominated by the Transitional Domain but also is influenced by the Coastal Domain. The Transitional Domain is an east/west band of overlap between colder, lower salinity subarctic water to the north and warmer, more saline central Pacific water to the south. In this domain, water temperature in the upper layer is usually seven degrees Centigrade (°C) or greater in the winter and 15°C or more in the summer. The Coastal Domain is characterized by marked localized variability in temperature and salinity. This variability is caused by local river runoff, upwelling, and mesoscale circulation features. Very nearshore tides influence the distribution of temperature and salinity through mixing. The boundary of the Coastal Domain is defined by the 32.4 parts per thousand (ppt) isohaline at 10-meter depth.
State Water Resources Control Board Clean Water Act Section 312(f) Application
Page 24 of 92
The dominant oceanographic feature of the waters along the west coast of the United States and Baja California is the California Current. The California Current originates about 300 miles off the Oregon and Washington coasts between 45° and 50° North latitude and is described as a diffuse band (up to 620 miles wide), 328 to 1,640 feet deep, and slow moving (10 cm/sec) current which flows southward between late spring and early fall and northward during the winter and early spring. Within in the California Current are two poleward flows, the Coastal Countercurrent and the California Undercurrent. The northward flowing Coastal Countercurrent occurs over the continental shelf, inshore from the California Current, and typically is only 10 to 20 kilometers (km) wide with velocities less than 0.3 m/sec. It is broader and stronger in the winter when it occasionally covers the entire continental shelf and is referred to as the Davidson Current. The California Undercurrent is a strong current which flows poleward throughout the year over the slope (bottom depths of 200 to 5,000 meters). However, when viewed at any given time, the California Current is made up of numerous eddies and jet-like filaments which result in a chaotic velocity field. For example, in the area between Point Arena and Bodega Bay, currents of 50 cm/sec are observed lasting for several days. Coastal currents in a given location are strongly influenced by winds, large-scale currents occurring over a much larger area, bottom topography and the shape of the coastline, and changes in density due to heating/cooling and the input of freshwater from rivers. Winds are particularly important in influencing circulation along the California coast because they often produce intense upwelling and the energetic mesoscale circulation features associated with it. Satellite imagery frequently shows the presence of a large cyclonic counterclockwise eddy off Cape Mendocino during the summer. This eddy transports cold upwelled water originating near shore north of the cape seaward, while bringing warmer water ashore south of Cape Mendocino. Upwelling along the west coast results from the interaction of the California Current and the winds generated by the North Pacific High. Due to the Coriolis effect, these northwesterly along-shore winds entrain surface water to the right, or away from the coast, a process known as Ekman transport. The transported water is replaced by cold, nutrient-rich subsurface water. Upwelling generally begins during the late spring (April to May) and ends in late summer-early fall. This disruption of the stability of the water column is due to the transport of the deeper, colder, more saline, and nutrient rich water to the surface. The offshore extent of the primary upwelling zone appears to be 6 to 12 miles along the entire coast, although continental shelf topography may cause a seaward expansion of upwelling effects. There are generally four flow states that occur during the spring to fall time period: Upwelling, Cyclonic, Relaxation, and quiescent period. The Upwelling regime is characteristic of cold, deep waters along the coast during early spring (35 percent of the year) when equatorward winds overwhelm any poleward along-shelf pressure gradient. Cyclonic flow occurs most frequently in the late spring through the summer (31 percent of the year) when upwelling favorable winds and a strong poleward along-shelf pressure gradient exist. Relaxation flow occurs most prominently in the early fall to early winter (27 percent of the year) when winds “relax” from their usual equatorward direction. In the Southern California Bight (Point Arguello to Mexico border) there are three dominant sources of water types: 1) cold, low salinity, highly oxygenated sub-arctic water brought by the California Current and ultimately the Coastal Countercurrent, 2) the moderate, saline, central north Pacific water advecting into the Bight from the west, and 3) warm, highly saline, low oxygen content (Equatorial) water entering the Bight from the south, principally through the California Undercurrent. The distribution of these waters in the Bight is such that the top 200 m
State Water Resources Control Board Clean Water Act Section 312(f) Application
Page 25 of 92
is typically low in salinity and high in oxygen content, which identifies the water mass as principally sub-arctic even though temperatures range between nine to 18.7 degrees C. The lower mass (below 300 m) is consistently high in salinity and low in dissolved oxygen identifying it as equatorial Pacific with temperatures between nine to five degrees C. The circulation of the Bight is dominated by the Eastern Boundary Current of the North Pacific Gyre system, specifically the California Current, rather than by local wind forcing. The California Current carries sub-arctic water equatorward throughout the year, extends offshore a distance of about 400 km and to a depth of 300 m. The average speed is approximately 0.25 m/sec and occurs primarily during spring and summer. Nearer to the coast and within 150 km, the surface current periodically reverses to the poleward direction which is called the Coastal Countercurrent. This current is strongest during the fall and winter with its poleward flow reaching its maximum speeds typically within 50 km offshore of the coast. Below 200 meters depth, the poleward California Undercurrent exists throughout the year and is generally confined to within 100 km of the coast along the continental slope. This current originates in the eastern equatorial Pacific and brings these warm, saline, low dissolved oxygen water poleward into the Bight. Within the Bight are submarine valleys and mountains, the peaks of which form the various offshore islands that influence the movement of water masses within the Bight. A complete overturning of water masses in the Bight occurs between one to three months. El Niño events represent an important interannual mode of variability in the oceanographic conditions along the west coast of the Pacific Ocean. These events occur at irregular intervals but usually at least once and often twice in a decade. The extent to which they alter circulation has not been fully documented, but they are associated with anomalously warm water temperatures and the associated warm water biota which are transported northward with the advection of large volumes of water from the equatorial zone. The warm Pacific Current spawned an unusual series of storms from January 5 through 26, 1995, that caused heavy, prolonged, and, in some cases, unprecedented precipitation across California. This series of storms resulted in widespread minor to record-breaking floods from Santa Barbara to the Oregon border. Several stream-gaging stations used to measure the water levels in streams and rivers recorded the largest peaks in the history of their operation. El Niño events, that result in high river runoff, have been documented to spread riverine sediment plumes from the Ventura/Santa Clara Rivers south past Point Conception and to the vicinity of San Miguel Island. Both El Niño and regime changes are common, repetitive events readily observed in paleosediment analyses that extend back several thousand years. They also are clearly evident in time series analyses of physical factors (e.g., ocean temperatures) and indices of biological productivity (e.g., zooplankton densities). These longer-term events appear to be primarily dependent upon physical processes that are centered elsewhere in the Pacific, and their effects include alterations in the physical, nutrient, and biological content of the waters entering the California Current system. Both processes also result in alterations in regional physical processes such as currents and upwelling that control local inputs of nutrients, productivity of kelp forests, and zooplankton populations that support populations of fishes and shellfishes harvested by California's commercial and recreational fisheries.
State Water Resources Control Board Clean Water Act Section 312(f) Application
Page 26 of 92
The effects of El Niño events in California include reduced input of cold, nutrient-rich waters from the north, and increased advection of warm, nutrient-poor water of subtropical origin into the southern California area. There may or may not be a reduction in winds that promote upwelling; however, nutrient input to the surface waters from upwelling is decreased due to reduced nutrients in the subsurface waters and a depressed thermocline. Thus, during El Niños, the California Current becomes less productive and more subtropical, and organisms enter the system from the south in greater numbers. For example, California spiny lobster and California sheephead, both have their centers of distribution off Baja California and recruit heavily to southern California (and sheephead as far north as Monterey) during strong El Niño events. During La Niñas, the environment is colder, zooplankton densities are higher, and subarctic organisms are favored. La Niña events with enhanced transport from the north result in increased recruitment of cool water fishes such as blue rockfish, in southern California. Coastal Habitat Coastal areas contain the most variety of habitats in California: tidepools, estuaries, bays, rocky headlands, sandy beaches, mudflats, eelgrass, surfgrass, high and low-relief rocky features, and kelp forests. These habitats also are the most highly impacted by human disturbances including: dredging and filling, draining of wetlands, pollution from point and nonpoint sources (including oil spills), withdrawal of water flows from streams and rivers, clearing of vegetation, damning or stoppage of water courses, diverting water channels, placement of bank stabilization structures, modifying habitat from one type to another (removing wetland for marina construction), and withdrawal of water for cooling purposes (often killing all life entrained). Approximately one-half of the shoreline from Point Conception north along the coastline of California is rocky, forming either broad benches or cliffs. Boulder and cobble beaches are patchily distributed within this same area. Along the central coast, rocky shorelines form high cliffs and steep rocky benches. North of Point Conception, where strong and constant wave action prevails, sandy beaches are found in the lee of each point due to depositional patterns. South of Point Conception, over three-fourths of the shoreline is sandy (excluding offshore islands which are mostly rocky). Intertidal habitats are of two principal types - rocky or sandy. Gradations, such as unstable boulders and human constructed bulkheads, wharfs, breakwaters, etc., occur, but most of the coast is either sandy or rocky (including offshore stacks and islands). Biological and physical factors influence the distribution, abundance, and species composition in intertidal habitats. The more important physical factors include: exposure and impact of waves, substrate composition, texture and slope of the substrate, dessication, water temperature, and light. The more important biological factors include competition and predation. The rocky shore intertidal substrate form a stable platform to which macroalgae and invertebrates attach and obtain a firm hold against the force of waves. Rocky intertidal organisms are characterized by interesting physiological processes which offer methods of attachment, means of surviving wave shock and coping with an alternate exposure to air and water. Adaptions are in the form of tough skins, heavy shells, strong tube feet, and horny threads by which mussels attach to the rocks. Among the cover and protection given by the larger attached plants and animals live a myriad of usually smaller invertebrates. Some attach to the larger basal
State Water Resources Control Board Clean Water Act Section 312(f) Application
Page 27 of 92
organisms, while others move among the community grazing on vegetation and other filter planktonic species. Marine plants are primarily red, brown, and green algae. The sessile invertebrates include: barnacles in the upper zone, mussels in the middle zone, and anemones in the lower zone. Mobile grazers and predators include: crabs, amphipods, snails, urchins, limpets, and sea stars. During low tide, shore birds feed among the tidepools, while during high tide, fish feed on the productive intertidal community. Tidepool fish typically found include: striped surfperch, tidepool sculpin, tidepool snailfish, and cabezon. Another rocky intertidal community is dominated by surfgrass. This community occurs in the lower intertidal to subtidal areas and supports a major nursery habitat for a wide variety of fish and invertebrates. Since the mid-1980s in southern California and the mid-1990s in central California, the black abalone population has undergone major declines in abundance due to the fatal disease referred to as withering foot syndrome. Withering foot syndrome is caused by a bacterial infection which thrives in warm ocean waters. The disease caused the abalone’s foot to shrink in size to a point where it is no longer able to hold onto the rocks. The disease was first documented in the Channel Islands and at Diablo Cove where the nuclear plant discharges warm water. The El Niño conditions of the 1990s accelerated the northward and coastward spreading of the disease. Populations are less than five percent of their original level in some areas. Rocky features on the ocean floor, when compared to sandy bottom acreage are uncommon offshore California. Several hundred small rocky platforms and submerged islands can be found in the nearshore coastline off California, with the incidence of nearshore rocky areas increasing as you move north of Point Conception. Rocky features, or natural reefs, are important biologically because they support stable, long-lived, biologically diverse communities as well as provide a food source for fish and other organisms. Reefs can be as large as the offshore feature off Point Sal measuring seven miles at its widest point to small isolated pinnacles and outcrops. Subtidal rocky habitats are generally classified into two types, low- and high-relief. Low-relief is classified as rocky ledges and outcroppings less than one meter in height while high-relief are taller than one meter in height. Low-relief features contain less diverse, shorter-lived communities due to the constant or periodic disturbance by sedimentation. Most of the shallow water species prefer low-relief habitats where sediment flux is almost twice as high as on the deep reefs. Communities associated with high-relief are rare. Long-lived, highly diverse biological communities found on high-relief features are characterized by the presence of a variety of long-lived organisms such as sponges, corals, and feather stars. The endangered coral has been found in a couple of locations of high-relief. The environment of the exposed sandy intertidal is considerably less stable than that of the rocky intertidal. Every wave on the sandy beach moves large amounts of sand and, depending upon the season, may remove most of the sand overlying a hard substrate. Organisms on the surf-swept beach bury themselves for protection from being swept out to sea by waves. Most of the animals living on sandy beaches have pelagic larval stages, so the young must be set adrift and may settle in another part of the world than their parents. Food also is uncertain as little is produced in the sand itself. Sandy beaches have comparatively fewer organisms and species than the rocky habitats, and population level fluctuations are far greater than found on the more stable substrate. The only marine algae that may be present are benthic diatoms. Polychaete worms, molluscs (snails and clams), crustaceans (sand crab, shrimps, and mole crab), and echinoderms (sand
State Water Resources Control Board Clean Water Act Section 312(f) Application
Page 28 of 92
dollars) are the predominant invertebrates found. Surf smelt and grunion use the sandy beaches for spawning, while squid spawn in the sandy areas less than 100 feet. Wetlands and estuaries throughout California have been severely impacted through physical alteration by commercial and residential development, upland practices in the watersheds increasing sediment load, and discharges of pollutants into the watersheds through agricultural practices and surface runoff. Coastal wetlands have lost approximately 75 percent of their original acreage in California. Estuaries are bodies of water, ranging in size from streams to large bays, which communicate with the sea through relatively narrow openings. The openings of many estuaries are closed to the sea for certain periods of time. Wetlands are the saturated lowland areas associated with the estuary, such as salt marsh or mudflat. These habitats provide areas where numerous threatened and endangered plant and animal species reside or migrate through. Wetland, estuarine, and slough habitats consist of salt marshes, eelgrass beds, fresh and brackish water marshes, and mudflats. Wetland habitats may only occupy narrow bands along the shore, or they may cover larger expanses at the mouths of bays, rivers, or coastal streams. Wetlands and estuaries are characterized by high organic productivity, high detritus production, and extensive nutrient recycling. Portions of the wetland that are submerged during high tide provide valuable food resources and predator protection for the many larval stages that rear in estuaries. Plant species commonly associated with salt marshes include cordgrass and pickleweed. Estuaries contain a greater diversity of both plant and animal life forms per unit surface area than any other habitat in the marine environment. Estuaries are highly productive because they constitute an area where freshwater, marine, and terrestrial habitats meet and intermingle. High levels of nutrient input from terrestrial sources, high levels of freshwater input from streams, levels of marine-origin nutrient input caused by tidal flushing, shallow depths, and high heat retention are factors supporting the greater productivity of estuaries. Because of their extremely high rate of biological productivity, estuaries are frequented by numerous species. They provide critical resting and feeding habitats for migratory shore birds and water fowl. The inhabitants of estuaries are characteristically euryhaline as they can adapt themselves to changes in the salinity of the water. More marine organisms are capable of adjusting to lower salinities than fresh or brackish water species to increased levels of salinity. Estuaries are important habitats for both resident and transitory species, provide spawning and nursery habitats, foraging areas for numerous species such as invertebrates, fishes, reptiles, birds, and mammals. Some species spawn in estuaries and their young reside there before returning to the sea, while the young of other species spawned in the ocean use estuaries for nursery habitats. On a daily or tidal-cycle, many species enter estuaries to feed. The larval and juvenile stages of the following species are documented to reside in estuaries and/or eelgrass beds: cabezon, kelp greenling, black rockfish, brown rockfish, calico rockfish, copper rockfish, kelp rockfish, and quillback rockfish. Estuarine zone fisheries are of great economic importance across the Nation. Three-fourths of the fish species caught in the United States are supported by estuarine habitats. Clams, crabs, oysters, mussels, scallops, and estuarine and nearshore small commercial fishes contributed an average dockside revenue of $389 million nationally from 1990 to 1992. Seventy-five percent of all commercial fish and shellfish landings are of estuarine-dependent species. At least 31 groundfish species inhabit estuaries and nearshore kelp forests for part, or all, of their life cycle. Forage fish are small, schooling fish which serve as an important source of food for other
State Water Resources Control Board Clean Water Act Section 312(f) Application
Page 29 of 92
fish species, birds, and marine mammals. Examples of forage fish species are herring, smelt, anchovies, and sardine. Many species of fish feed on forage fish. In addition, marine mammals consuming forage fish include: harbor seals, California sea lions, Stellar sea lions, harbor porpoises, Dall’s porpoise, and minke whales. Forage fish are most commonly found in nearshore waters and within bays and estuaries, although some do spend some of their lives in the open ocean. Many threatened and endangered species’ habitat are saltmarsh and estuaries. The California coastal areas contain more listed species (birds, fish, plants, mammals) than the rest of the west coast. The food provided is more abundant than the open ocean or provided in freshwater ecosystems. Many open-ocean species spawn in estuaries such as the great jellyfish larval polyps that rear in the sheltered waters of Elkhorn Slough. Examples of other species that are found in estuaries include: oysters, sea cucumbers, octopus, midshipman, bat rays, leopard sharks, shrimps, sea pansies, sand dollars, clams, snails, crabs, sea otters, harbor seals, great egrets, great blue herons, terns, gulls, rails, pelicans, and cormorants. Eelgrass is a perennial flowering sea plant that reproduces vegetatively and by seeds. Large mats of eelgrass provide essential habitat for many larval stages of commercial fish and crabs. Eelgrass supports a rather characteristic group of animals which live on its blades, about its base, and among its roots in the sediment. Eelgrass beds are found in estuaries from Alaska to Baja California. Many species are specialized to living on a portion of the eelgrass including snails, fixed jellyfish, and nudibranchs which live on the blades, sponges and shrimps in and around the roots, and scallops attached to clusters of eelgrass or swimming among the plants. Decaying eelgrass provides essential nutrients released into the water column and sediments to support planktonic filter feeders and benthic detrital feeders. Almost all marine and intertidal waters, wetlands, swamps, and marshes are critical to fish. For example, seagrass beds protect young fish from predators, provide habitat for fish and wildlife, improve water quality, and control sediments. In addition, seagrass beds are critical to nearshore food web dynamics. Studies have shown seagrass beds to be among the areas of highest primary productivity in the world. This primary production, combined with other nutrients, provide high rates of secondary production in the form of fish. Kelp forests off California are dominated by two species, the giant kelp and the bull kelp. Giant kelp can grow up to 100 feet and prefers the more calmer portions of the coast south of Point Conception. Large kelp beds have been identified in waters up to one mile offshore in the area from Point Conception to Gaviota and at San Miguel, Santa Rosa, and Anacapa Islands. Giant kelp is one of the most productive plants on earth able to grow 18 inches a day in full sunlight. While the giant kelp may live several years, the life of each frond is typically six months or less. It is to the kelp’s advantage to replace old fronds with new and buoyant fronds. Bull kelp is more resistant to the rougher waters outside protective bays and inlets. Some areas contain both species but, where colder waters dominate through out the year, bull kelp forms a monoculture forest. Bull kelp is an annual plant dying off each fall season while giant kelp is a perennial and may live seven to eight years. Kelp usually attach to rock outcrops or cobbles to stay in place, but, in the Santa Barbara Channel, waters are so calm that kelp plants can become
State Water Resources Control Board Clean Water Act Section 312(f) Application
Page 30 of 92
established in sandy subtidal regions by attaching themselves to worm tubes. Hundreds of species of animals and 400 types of sea plants have been cataloged in the kelp forests of Monterey Bay. Kelp forests provide vertical water column habitat for many types of adult and juvenile fish, marine mammals such as the sea otter, and other marine animals. Kelp forests provide critical habitat for encrusting animals such as sponges, bryozoans, and tunicates, as well as for juvenile fish, molluscs such as abalone, algae, and for other invertebrates. Fish associated with kelp forests include: greenling, lingcod, bocaccio, and many species of surfperch and rockfish. Gray whales have been reported to feed near kelp forests and to seek refuge from predatory killer whales. Kelp also provides a food resource for fish, and for grazing and detritus-feeding invertebrates such as isopods and sea urchins. Predators, such as sea stars and sea otters, are active there also. As natural predators, the red and purple urchin have a dramatic effect on determining the health of a given kelp forest. In many areas, such as Diablo Cove, purple urchins have become overabundant preventing out reestablishment of kelp. Areas dominated by urchins are called “urchin barrens” due to the imbalance between urchins and kelp or other algae. During warm water years, or in areas influenced by warm power plant discharges, both kelp and urchins die off, but the urchins are able to tolerate higher temperatures and eventually graze the rocky areas bare of kelp and algae. Commercial taking of red urchins only exacerbates the problem by reducing the competition between red and purple urchins and eliminating the natural urchin predators such as the sheephead due to lack of prey items. Kelp detached and transported during storms provides a source of food for other local habitats. Sandy beach fauna, from invertebrates to shore birds, utilize the kelp washed up on the beach. Kelp wrack can provide critical food resources for wintering shore birds. Kelp that sinks provides food for deep water benthic organisms which are dependent on drifting food. Kelp that detaches and forms floating rafts provides habitat for juvenile rockfish and other pelagic species. Benthic Habitat All bottom types are represented off California and are discussed in the Geology section. Rocky shelves, pinnacles, and boulders give way to sandy and mud bottoms as depths increase. The benthic zone includes soft-bottom habitat, hard-bottom habitat, and low- and high-relief features. Organisms associated with the different types of benthic habitat are more specialized in their adaptations than those found in the changing coastal zone. Benthic infaunal species are those that primarily live all or a major part of their life cycle living within the sediments. Demersal epifaunal species are those that live on or near the bottom. Fish demersal species are differentiated by depth or depth-related factors. The shelf community is from depths of at least 30 to approximately 200 meters and is characterized by sanddabs, English sole, rex sole, rockfish, lingcod, pink surfperch, plainfin midshipman, skates, rays, halibut, and white croakers. Most are of commercial and recreational value. Flatfish are dominant on the shelf and upper slope at depths between 100 to 500 m in sandy and muddy bottoms. Upper and middle slope fish species are characterized by rockfish, flatfish, sablefish, hake, slickheads, and eelpouts. They range in depths from 200 to 1,200 meters deep with thorny heads, hake, slickheads, and rattails inhibiting the middle slope (500 to 1,200 m). The lower
State Water Resources Control Board Clean Water Act Section 312(f) Application
Page 31 of 92
slope (1,200 to 3,200 m) taxa include rattails, thornyheads, finescale codling and eelpouts. At depths lower than 1,500 m, the numbers of fish species, densities, and biomass are expected to be extremely low compared to those found on the upper and middle slope. Shelf habitats off California are very rich in the number of species and abundances of infauna. This trend is influenced by upwelling and high productivity. Continental shelf communities (less than 200 m) are dominated by polychaetes of several families and other common taxa such as amphipods, gastropod snails, decapods, mysids, ostracods, brittle stars, and phoronids. Continental slope communities also are very rich, with even higher numbers of species at some depth than noted for the continental shelf areas. Key features of the slope communities include the following: 1) a marked decrease in infauna densities between approximately 800 to 1,000 m depth, corresponding to the oxygen minimum zone, followed by 2) sharp density increases to approximately 1,800 m depth, and finally 3) a gradual decrease with further increases in depth. Most of the species tend to be either deposit-feeding or detrital-feeding primarily depending on food falling off from the photic zone. Large woody debris also plays a significant role in benthic ocean ecology, where deep-sea wood borers convert the wood to fecal matter providing terrestrial based carbon to the ocean food chain. Epifaunal communities include representatives from the following taxa: sponges, brittle stars, sea stars, sea pens, sea cucumbers, octopus, sea anemones, vase sponges, cup and branching corals, Tanner crabs, clams, and snails. Pelagic Habitat The continental shelf is relatively narrow off northern California. The east-west trending Mendocino Escarpment is a major submarine topographic feature off the west coast of the United States. Several submarine canyons are located offshore California with the Eel River Canyon prominent in northern California, Monterey Bay Canyon in central California, and Redondo Canyon in southern California. The pelagic habitat can be subdivided into three zones, epipelagic zone (surface to 200 m), mesopelagic (200 to 1,000 m), and bathypelagic zone (1,000 m to bottom). The epipelagic zone waters are typically well lighted, well mixed, and capable of supporting actively photosynthesizing algae. The mesopelagic zone is characterized by decreased light, temperature, and dissolved oxygen concentrations while pressure increases. The bathypelagic zone is characterized by complete darkness, lower temperatures and oxygen levels, and greater pressures as depth increases. Each of these zones is distinguished by characteristic fish assemblages. Pelagic species spend most of their life in the open ocean but some, like herring, utilize estuaries for a portion of their life cycle. Other commercial and recreational pelagic fish species include: northern anchovy, Pacific sardine, salmon, mackerel, and albacore tuna. Squid is another important pelagic species. Coastal pelagic species are schooling fish, not associated with the ocean bottom, that migrate in coastal waters. Several species are managed by the Pacific Fishery Management Council (PFMC) Coastal Pelagic Species Fishery Management Plan. Pacific sardine inhabit coastal subtropical and temperate waters and, at times, has been the most abundant fish species in the California Current. During times of high abundance, Pacific sardine range from the tip of Baja California to southeastern Alaska. When abundance is low, Pacific sardine do not occur in large quantities north of Point Conception, California. The central subpopulation of northern anchovy ranges from San Francisco, California to Punta Baja, Mexico.
State Water Resources Control Board Clean Water Act Section 312(f) Application
Page 32 of 92
Adult and juvenile squid are distributed throughout the Alaska and California current systems, but are most abundant between Punta Eugenio, Baja California, and Monterey Bay, California. Epipelagic fish can be distinguished based on two ecological types. Oceanic forms are those that spend all or part of their life in the open ocean away from the continental shelf, while nearshore forms spend all or part of their life in water above the continental shelf. Typical epipelagic fish include fast-moving species such as tunas, mackerels, swordfish, blue sharks, thresher sharks, white sharks, and salmon, as well as schooling baitfish such as Pacific herring, northern anchovy, and juvenile rockfish. The largest schools of anchovy occur within 25 miles of the coast over deep water, often over escarpments and submarine canyons. During daylight hours of summer and fall months, large compact schools may be found at depths of 360 to 600 feet. Most mesopelagic species undergo vertical migrations often moving into the epipelagic zone at night to prey on plankton and other fish. Typical mesopelagic species include: deep-sea smelt, lanternfish, and viperfish. In addition to various mesopelagic invertebrates such as krill and copepods, the major mesopelagic fish species forming the deep scattering layer include lanternfish and bristlemouths which migrate vertically. In contrast to mesopelagic fish, bathypelagic species are largely adapted for a sedentary existence in a habitat with low levels of food and no light. Some of the species occupying the bathypelagic zone also cross into the mesopelagic zone during vertical migrations. Many of these fish have light producing organs which attract prey and potential mates. Blackdragons, dragonfish, laternfish, and tubeshoulders can be found at these depths. Pelagic invertebrates include those species capable of movement throughout the water column and/or just above the bottom. Examples include: euphausiids, squid, pteropods, heteropods, cephalopods, and octopuses. Many of these species are either of commercial importance or are prey items for fish, seabirds, and marine mammals. Gelatinous invertebrates, such as jellyfish, salps, and tunicates, are the important prey items of sea turtles and blue rockfish. Many pelagic invertebrates are components of the deep scattering layer. The deep scattering layer is described as a layer of living organisms, ranging from almost microscopic zooplankton to copepods, shrimp, and squid. This layer is present at different depth ranges during the day (200 to 800 m) and night (generally near the surface). Phytoplankton is generally limited in distribution from the sea surface to approximately 100 m depth corresponding to the effective range of light penetration for photosynthesis. The predominant members of the phytoplankton community are diatoms, silicoflagellates, coccolithophore, and dinoflagellates. Population increases generally occur during the summer and fall months in response to upwelling events. The upwelling bloom events are dominated by diatoms, and during non upwelling events, dinoflagellates are dominant. Zooplankton species are not limited to the photic zone and can occur from surface waters to depths of over 400 m. Many zooplankton species are able to vertically migrate up to several hundred meters. Copepods and euphausiids dominate the zooplankton community in terms of numbers and biomass. They are critical food sources for many species including juvenile fish and mysticete whales. Commercial important crustacean larval and larval fish are members of the zooplankton community for several weeks to months.
State Water Resources Control Board Clean Water Act Section 312(f) Application
Page 33 of 92
General Water Quality Considerations Water quality affects all fish species either directly or indirectly through the food chain, and the health of the ecosystem is largely determined by materials in the water, sediment, and air. The quantity and type of constituents entering the water column determines if the ecosystem is degraded by these inputs. Pollutants enter the nearshore marine ecosystem from many land sources, activities occurring on the water, and underwater geologic changes. The most familiar transport mechanisms include: ocean outfall from sewage treatment plants, storm water discharges containing trash and chemicals, river inputs of sediments with nutrients and/or pesticides, thermal discharges from power plants, spills from vessel traffic, dredge material disposal, wind transport of air-borne contaminants, and construction activities. Some of the chemicals break down into harmless components in days or weeks, while others last for many decades. Some of the pollutants affect the fish immediately (such as a sewage spill depleting oxygen in the water column), while others remain in the fish for years, eventually affecting reproduction capability, feeding ability, growth potential, or physiological functions. The tissues of aquatic organisms may accumulate environmental pollutants more than one million times the concentrations in the water column. Environmental concentrations of some pollutants have decreased over the past 20 years as a result of better water quality management practices. However, environmental concentrations of heavy metals, pesticides, and toxic organic compounds have increased due to intensifying urbanization, industrial development, and the use of new agricultural chemicals. Health advisories have been issued in California for white croaker, black croaker, California corbina, surfperch, queenfish, California scorpionfish, rockfish, kelp bass, and striped bass. Historically, sewage treatment plants served only as a way to gather sewage from a specific geographic location and then move it into the ocean. Now, most plants remove a significant amount of solids prior to discharging into the nearshore environment. While the coastal population has significantly increased since the 1950s, the mass of wastewater pollutants discharged (subject to regulatory controls) has been somewhat reduced while the volume has continued to increase. Storm drain-associated runoff is now the largest source of unregulated pollution to the waterways and coastal areas of the United States. Discharged contaminants do not stay in the water column indefinitely but are transported to the sediments, and even directly to the aquatic organisms through absorption across body membranes or through ingestion of contaminated prey. Pollutants most frequently associated with sewage discharges include: sediment, nutrients, bacteria, petroleum products, heavy metals, pesticides, and other potentially toxic compounds. Chemicals released to surface waters from industrial and municipal discharges continue to accumulate to harmful levels in the sediments. Discharge limits for municipal and industrial point sources are based on either technology-based limits or state-adopted standards for the protection of the water column, not necessarily for downstream protection of sediment quality.
State Water Resources Control Board Clean Water Act Section 312(f) Application
Page 34 of 92
California’s Fisheries Economic Importance, Sustainability, and Long-Term Challenges Complex relationships exist between marine plant and animal communities. These relationships differ considerably among different habitats and communities. Many nearshore fish species are highly dependent upon particular types of habitat and may show little large-scale movement after they recruit to these areas. The life histories and habitat affinities of many nearshore fish focuses fishing effort by both recreational and commercial fishermen in certain habitat types. Coastal areas close to harbors and ports face zonal depletion as fishermen range up and down the coast after nearshore fish species. The closest nearshore rocky areas and kelp forests suffer the greatest effects of continuous fishing effort. Localized removals of large portions of the nearshore biomass of individual species may have significant short-term and long-term effects on both a population and community-wide scale, within these particular habitats and also, to an unknown extent, outside these habitats. The nearshore area provides opportunities for a broad variety of consumptive uses which includes recreational and commercial fishing. Consumptive uses often involve some type of an active market where the goods or services are traded, such as seafood markets or charter fishing services that cater to the end-user or consumer. These active markets provide convenient means to assess the value of the particular resource activity in terms of money spent on goods or services. Commercial and recreational fishing goods and services are bought and sold and thus generate revenues that produce a ripple effect in the California economy. Money or revenues resulting from these user-sectors stimulate further economic growth throughout the state of California in the form of economic output, earnings, and employment. Thus the economic contribution of a user-sector can be estimated as an end result contribution to the state, through the use of economic multipliers. For a full discussion of fishery socioeconomics refer to the appropriate section of the NFMP. Commercial or recreational fishermen engaged in the take of nearshore fishes may dispose of trash and other items while fishing or traveling to and from fishing areas. Evidence suggests that marine vessel and fishing activity are a primary source of human-generated debris in the SCB. Marine debris such as plastics and styrofoam can cause death or injury to animals in the marine environment when ingested or when it entangles an organism. Marine species are under great stress from environmental degradation, resource exploitation, and competing economic concerns. Of the United States fisheries for which the population status is known, 43 percent are over-utilized and 39 percent are fully utilized. In general, marine habitats that have been less altered by fishing and other activities are more complex in structure and more productive in lower level organisms such as worms and crustaceans than highly altered habitats. Marine habitats with greater complexity at lower trophic levels and with greater structural complexity tend to support a more complex mix of fish species in greater abundances than altered habitats. High relief rock piles that are not accessible to trawl gear are usually accessible to commercial longline and recreational hook-and-line gear. Similarly, marine canyons that have not been trawled may be used by commercial longliners. Longline gear has been seen to disturb or remove marine plants, corals, and sessile organisms. Trawl gear, particularly doors and footropes, can alter marine habitat complexity. Thus, there is hardly any habitat that is not altered by commercial or recreational fishers.
State Water Resources Control Board Clean Water Act Section 312(f) Application
Page 35 of 92
As rockfish stocks have been fished down to lower levels, there is little evidence of new increases in stocks of short-lived species that do not rely on high habitat complexity. Thus, alterations to rockfish habitat may not be accompanied by improvements in stocks that are better adapted to the altered habitat. For this reason, protection of rockfish and rockfish habitat is extremely important to long-term sustainability of the groundfish fishery. Gear used in the commercial and recreational fisheries of California can affect the nearshore environment. Almost 100 percent of nearshore finfish are taken by line gear north of Cape Mendocino while there is approximately a 50/50 split between line and trap gear south of Point Conception. Fishing gear was found to be the most common type of benthic debris of the SCB, from Point Dume, Ventura County, to Dana Point, Orange County. Lost fishing gear (referred to as ghost fishing), such as gill-nets and traps, can continue to capture target and non-target fishes and invertebrates, resulting in undocumented losses of these fishes and losses of potential prey species for nearshore fishes and invertebrates. Lost or discarded monofilament or other line used in fishing activities can cause death or injury to marine mammals if they become entangled. The lost shiny hooks may be attractive to fish or other marine animals and cause injury if ingested. A study of the long-term effects of trawling on the benthos of the eastern Bering Sea found that sedentary megafauna were more abundant in the untrawled areas, and that overall diversity and niche breadth of sedentary organisms was reduced. In addition, they found that a single trawl pass affected the dominant features on the seafloor, displacing a significant number of boulders and removing or damaging large epifaunal invertebrates. In a review of 22 studies worldwide, findings were that despite their wide geographic range, from tropical to boreal, all studies showed similar classes of impacts. They found that mobile fishing gear reduced habitat complexity in three ways: 1) epifauna are removed or damaged, 2) sedimentary bedforms are smoothed and bottom roughness is reduced, and 3) taxa which produce structure, including burrows and pits, are removed. During the 1990s, recreational landings showed a marked decrease while commercial landings increased slightly. Despite this fluctuation, commercial landings remained lower than recreational landings. From 1983 to 1989, 4,427,640 lb (2,008 mt) of rockfish were landed on average by the recreational fishery per year, while the commercial fishery landed on average only 617,400 lb (280 mt). For 1993 to 1999, average annual recreational landings decreased to 1,777,230 lb (806 mt), while average annual commercial landings increased to 950,355 lb (431 mt). Recreational landings in the Southern California Bight and Santa Maria Basin land about 60 percent of the total recreational catch in California. The landings for these two areas account for about five percent of the total recreational landings in the continental United States (MMS 2001). From 1985 to 2000, annual salmon landings averaged 91,600 fish for commercial passenger fishing vessels (CPFV) and 93, 600 fish for private boats that included an annual average effort of 86,200 CPFV trips and 128,300 private boat trips. According to the Marine Recreational Fisheries Statistics Survey (MRFSS) program, marine recreational fishing trips declined by 26.4 percent between 1993 and 1998 in southern California. Private/rental boat trips declined 18.4 percent, charter/party boats declined 42.6 percent and shore fishing trips declined 21.4 percent. In the 1980s, nearshore fishing activity was primarily conducted by recreational fishermen. Nearshore finfish were taken by angling or spear fishing from CPFVs, private/rental boats, beaches, banks, and man-made structures such as piers and jetties. Some commercial fishing
State Water Resources Control Board Clean Water Act Section 312(f) Application
Page 36 of 92
activities (using gill-nets, trammel nets, and hook-and-line) also occurred. However, the target species for the commercial activities were generally the deepwater rockfishes. California’s commercial fishing industry ranks among the top five seafood producing states in the nation. The commercial landings at ports within the southern and central California account for about four percent of the total U.S. catch. Los Angeles area ports rank among the top 10 ports in the U.S. in quantity and value of commercial catch. The primary commercial fishing gears used in harvesting the19 nearshore finfish species are hook-and-line and trap. Gill and trammel nets, and trawls targeting other species occasionally take nearshore species in areas outside State waters. Within the hook-and-line category, there are a variety of methods used in the nearshore fishery, including rod-and-reel, vertical hook-and-line, stick gear, and set longline. Fishing gear designed to take fish live, like hook-and-line and trap gear, require less capital outlay than that for gears used in many other fisheries. In addition, commercial fishermen can successfully harvest live fish from kayaks or very small boats requiring a relatively modest capital outlay. As the fishery grew, landings escalated from 52,000 to 988,000 pounds from 1989 to 1995 with the number of live-fish fishermen statewide rising from 70 to nearly 700 during the same period. Presently, there are 1,014 nearshore and finfish trap permittees in California, with an estimated total fleet harvest capacity of more than 2,400 tons (or roughly 24 times the current harvest allocation for 2001). However, the number of commercial fishermen that have landed nearshore species has declined from pre-1999 counts for all gear types. Other fisheries that use traps include: “rock” and Dungeness crab, spiny lobster, and shrimp. California’s fisheries are part of the living resources sector of the state’s ocean economy. For the most part, the living resources sector encompasses the following activities; fish harvesting, seafood processing, fish hatcheries, aquaculture, kelp harvesting, and sports and recreational industry (Figure 3.4). This sector is in distress, as Table 3.7 shows, and the economic productivity of each category has plummeted between 1990 and 2000.
Table 3.7 – Summary of Direct Value of Living Resources Industry 2000
Total 6,740 -725 $206,419,526 -$40,485,766 $563,572,921 -$160,288,828
State Water Resources Control Board Clean Water Act Section 312(f) Application
Page 37 of 92
Figure 3.4 – Changes in Living Resources Sector from 1990 to 2000
When compared with the larger ocean economy sectors in California such as tourism and transportation, the living resources market sector is relatively small. However, as a source of food and employment, the commercial fishing industry is very important to California’s coastal economy. Many activities are dependent on this industry, such as boat construction and repair, brokerage, dock handling, trucking and other transportation, gear and rigging stores, fish processing, and commercial seafood trade. In addition, the health of California’s fisheries is integrally related to the health of California’s coastal waters, reflecting the strength of offshore ecosystems. The size of the catch and its contribution to California’s economy is only a part of its value. These other values are not captured in the market place but have far reaching effects on the sustainability of California’s coastal resources, which fuels its flourishing coastal economy. The long-term sustainability of California’s fisheries has additional values, or future values, because fisheries are a renewable resource that, if well-managed, could sustain a viable industry for years to come. Poor management of California’s fisheries would be an opportunity lost, taking a major source of revenue and food from the citizens of California, costing Californians in future earnings and revenues. California has experienced the largest decline in fisheries landings over the last 25 years of any state in the nation, and the steepest drop has occurred in the most recent years, showing a decrease from billions to millions in a 20-year time frame. Each of the five regions in California showed a decrease in landings, with an increase in value, except for the central coast (representing Monterey, Santa Cruz, and San Mateo Counties), which showed an increase in both categories. Development pressure has intensified along California’s coastal areas, so there is a concern about other competitive uses of the land and water putting additional pressure on State fisheries. As tourism continues to grow, it needs space, and sometimes fisheries are out-
State Water Resources Control Board Clean Water Act Section 312(f) Application
Page 38 of 92
competed for limited dock and shoreline space. These changes have had major impacts on California’s economy. Some observations which help illustrate the economic challenges faced by fisheries include, as do Figures 3.5 through 3.7:
• California’s fishing fleet declined by about 4000 vessels, from 6700 to 2700 boats.
• California’s peak landing of fish and invertebrates occurred in 1976, at 1.3 billion pounds, compared with landings of 650 million pounds in 2000.
• The California fleet brought in more than $300 million in landed value in 1980, compared to $142 million in 2000 and $91 million in 2002.
• California’s share of the U.S. total commercial landings fell from approximately 19 percent in 1970 to about 7.1 percent of the U.S. total, and 3.9 percent of total landed value in 2000.
• Total finfish and shellfish landings in California declined by more than half between 1970 and 1990, whereas total U.S. landings almost doubled. California experienced a dramatic drop in landings of tuna, ground fish, urchin, swordfish, salmon, and abalone.
Figure 3.5 – United States’ Total Commercial Fishery Landings and Values
State Water Resources Control Board Clean Water Act Section 312(f) Application
Page 39 of 92
Figure 3.6 – California Total Commercial Fishery Landings and Values
Figure 3.7 - California Share of U.S. Total Commercial Fishery Landings and Value
The State’s marine resources and its resource management have undergone continuous changes in part because of changes in the economics of fisheries and partly because of the need to restrict fishing efforts in order to manage commercial fishery populations. The decline in tuna landings was primarily a result of the shift of landing ports from California to less costly cannery operations in Samoa and Puerto Rico, for example. Because of the severe decreases in abalone stock and concerns about the extinction of the white abalone, the total commercial fishing of
State Water Resources Control Board Clean Water Act Section 312(f) Application
Page 40 of 92
abalone was closed south of San Francisco. Ground fish production was disrupted by seasonal area closures, quota reductions, and long-term stock-building plans. Salmon fishing has raised public concerns since five California salmon populations have been listed under the federal ESA. Additional regulations also played an important role in the development of California’s commercial fishing industry. For example, numerous species of rockfish and the Cabezon were considered lucrative, and a major fishery dedicated to those near-shore species was established during the 1990s. Gillnet fishing in the near-shore areas of central and southern California was banned in 1994. The 1998 Marine Life Management Act (MLMA) led to additional suspension of permits in the near-shore fishery, and a squid management plan is in place, which involves restrictions of access. The 1999 Marine Life Protection Act authorizes new protections for ocean habitats and wildlife. It also will lead to the creation of a new network of MPAs along the coast, setting aside some areas as zones in which certain species will be undertaken to revive some of the depleted stocks. Outside the industry, competing uses of waterfront for recreational boating, commercial cargo handling, and tourism have confronted the California commercial fishing industry and could limit the availability of shore-side space for support facilities. Despite the decline of landings for certain species in California, some other species have exhibited growth patterns and have become the targets of fishery expansion. For example, increased international demand for squid resulted in a dramatic increase in landings during non-El Nino years, which has attracted participation from former salmon fishermen in California. Growth of California fisheries also included the development of specialized fisheries for sea urchin, Pacific herring, and rockfish (though the latter have recently received increasingly stringent protection from DFG to conserve these diverse and vulnerable species). California’s fishing industry no longer depends on tuna fisheries and other species have gained substantial relative importance. Squid and red sea urchin were the top two revenue-generating species in 2002. The revenue from market squid reached 16.5 million tons in 2002. Squid, Chinook salmon, Pacific sardine, and Albacore were among the top ten commercial species in terms of revenue, replacing tuna, Pacific herring, shrimp, and Dover sole in the 1992 list (see Figure 3.8).
State Water Resources Control Board Clean Water Act Section 312(f) Application
Page 41 of 92
Figure 3.8 – Top Ten Commercial Species Year 2002 Dollar Value of Revenue
Except for the Central Coast region, all other regions have experienced losses in landings and value since 2000 (Table 3.8 and Figures 3.9 and 3.10), Los Angeles County, which accounted for more than 95 percent of the total landings and 90 percent of the total value, has experienced the greatest drop during the same period. The only county that experienced steady landing growth was San Diego, though its total value declined simultaneously.
Table 3.8 – Regional Landings and Values 2000-2002
2000 2001 2002 Region Weight of
landings (lb) Landed
Value ($) Weight of
landings (lb) Landed
Value ($) Weight of
landings (lb) Landed
Value ($)
North Coast 27,711,244 27,057,783 22,080,412 18,908,402 21,904,644 18,227,627 Del Norte 8,114,071 9,779,518 6,533,578 5,856,040 4,496,855 4,430,281 Humboldt 10,102,830 8,410,836 7,209,487 5,690,285 7,853,514 6,380,523 Mendocino 9,494,343 8,867,429 8,337,347 7,362,084 9,554,275 7,146,823 North Central 15,278,570 13,137,260 12,239,073 11,501,424 12,792,633 11,543,997 Alameda 46,594 108,747 79,576 158,831 162,075 235,909 Contra Costa 10,737 27,564 6,747 19,394 13,138 33,038 Marin 1,919,644 1,672,380 2,986,961 2,137,359 364,236 629,607 San Francisco 10,201,780 7,313,606 6,491,229 5,889,007 8,751,519 6,625,709 Santa Clara 388,429 225,042 547,204 219,922 649,801 133,040 Solano 6,444 14,908 Sonoma 2,708,386 3,788,921 2,027,356 3,076,911 2,845,390 3,871,741
State Water Resources Control Board Clean Water Act Section 312(f) Application
Page 42 of 92
2000 2001 2002 Region Weight of
landings (lb) Landed
Value ($) Weight of
landings (lb) Landed
Value ($) Weight of
landings (lb) Landed
Value ($) Central Coast 65,054,096 14,809,023 66,674,419 12,041,962 99,208,364 16,671,474 Monterey 61,339,436 9,813,590 63,450,017 8,260,265 94,186,314 12,450,017 San Mateo 3,029,606 3,925,871 2,885,194 3,256,384 4,651,711 3,609,970 Santa Cruz 685,054 1,069,562 339,208 525,313 370,339 553,173 South Central Coast 174,848,867 33,230,847 113,480,611 22,341,361 60,231,135 19,225,417
San Luis Obispo 3,661,918 5,718,773 3,469,567 4,604,807 2,848,307 3,773,916
Santa Barbara 7,005,508 6,728,900 5,263,908 5,362,993 5,656,833 6,125,507 Ventura 164,231,441 20,783,174 104,747,136 12,353,561 51,723,995 9,325,994 South Coast 257,328,091 47,170,193 221,378,721 37,309,889 187,451,195 25,937,566 Los Angeles 254,044,639 39,316,639 217,999,578 29,979,777 163,951,419 19,445,966 Orange 548,667 1,774,456 556,041 1,694,446 529,351 1,646,180 San Diego 2,734,785 6,078,956 2,823,102 5,635,666 2,970,425 4,845,180
All Counties 540,220,868 135,405,106 435,853,236 102,103,038 361,587,971 91,506,081
Figure 3.9 - 1993 to 2002 Weight of Landings (Million Pounds)
State Water Resources Control Board Clean Water Act Section 312(f) Application
Page 43 of 92
Figure 3.10 - 1993 to 2002 Value of Landings (in Millions)
Kelp farming also occurs offshore in some areas of coastal California. Algin, an extract from kelp, is widely used in binding, stabilizing, and modeling pharmaceuticals, and in the cosmetics, hygiene, and food industries. Figure 3.11 presents the historical kelp production in wet tons in California. From 1970 to 1980, the kelp harvest produced about 150,000 wet tons annually. The kelp harvest dropped to below 100,000 wet tons from 1980 to 1989. The main reason for the lower average harvest was the 1982 to 1984 El Nino, which disturbed the oceanic and climatic conditions of the eastern Pacific Ocean. In 1990, kelp production increased to 150,000 wet tons, but, in 1998, harvesting plummeted to 25,000 wet tons and remained around 40,000 wet tons between 1999 and 2001.
State Water Resources Control Board Clean Water Act Section 312(f) Application
Page 44 of 92
Figure 3.11 - Historical California Kelp Production in Thousands of Wet Tons
Recreational fishing is an important component of the California ocean economy, but economic data on this activity are comparatively limited. Recreational and sport fishing generated 2 billion dollars of sales during 2000, but it should be noted that the dollar amount reported below in Table 3.9 does not reflect net income amounts. Table 3.9 – Total Economic Impacts from California Marine Recreational Fishing in 2000
Total economic impacts from California marine recreational fishing in 2000
California’s long coastline, including its estuaries, bays, and islands encompassed in its national marine sanctuaries, has a varied and distinctive biota. An indication of this biological diversity in the State’s coastal areas is shown in Map 3.4 below.
There are federal, State, local, and private aquatic sanctuaries in California’s coastal waters. In addition, California’s coastal waters include two United Nations’ Biosphere Reserves. All of these designations fall within the general NOAA designation of MPAs for regulatory purposes, even though each may be administered by different governmental agencies or private entities.
State Water Resources Control Board Clean Water Act Section 312(f) Application
Page 45 of 92
Many MPAs protect fish-spawning and nursery areas, e.g., kelp forests and reefs. California’s MPAs currently number 200, and they are broadly distributed among all counties possessing coastal/marine, bay, and/or estuarine habitats. An important addition to the California MPA list is the Klamath River Salmon Conservation Zone, which is a type of federal threatened/endangered species protected area created to conserve salmonids in this area under the auspices of the federal ESA.
Map 3.4 - California’s Natural Diversity in Coastal Areas
State Water Resources Control Board Clean Water Act Section 312(f) Application
Page 46 of 92
Threatened and Endangered Species All marine mammals are protected under the federal Marine Mammal Protection Act (MMPA 1972, amended 1994), administered by the NOAA’s National Marine Fisheries Service (NMFS) and the U.S. Fish and Wildlife Service (FWS). Additionally, NMFS and FWS grant at-risk marine mammal stocks additional protection under the federal ESA with endangered, threatened, and depleted status designations. ESA was passed to provide measures to conserve and recover listed species, thereby returning them to sustainable numbers no longer requiring the protection of ESA. ESA contains a number of tools that are used by government agencies, local jurisdictions, user groups, and landowners to ensure that human activities are done in a way that avoids or minimizes the harmful effects of these activities. NMFS is charged with the implementation of ESA for marine and anadromous species, while FWS implements programs and regulations for terrestrial and freshwater species. Section 7 of the Endangered Species Act of 1973 requires that federal agencies ensure that their actions are not likely to jeopardize the continued existence of endangered or threatened species or result in the destruction or adverse modification of the critical habitat of such species. Likewise, the California Endangered Species Act (CESA) policy is to conserve, protect, restore, and enhance any endangered or threatened species and its habitat. ESA requires NMFS and FWS to develop recovery plans for species added to the list of Threatened and Endangered (T&E) species. The plans describe necessary conservation measures to ensure recovery of the species so that it becomes appropriate to remove the species from the T&E list. The State also designates protection to one marine mammal under CESA. Additionally, the California Fish and Game Code (Section 4700) designates several marine mammal species as “fully protected.” Under ESA, an endangered species is defined in the law as "any species which is in danger of extinction throughout all or a significant portion of its range." Seven marine mammal species occurring in California waters are listed as endangered: six whales and the southern sea otter. A threatened species is "any species which is likely to become an endangered species within the foreseeable future throughout all or a significant portion of its range." The Steller sea lion and the Guadalupe fur seal are the only marine mammal species occurring in California waters that are listed as threatened. A candidate species is "any species being considered by the Secretary for listing as an endangered or threatened species, but not yet the subject of a proposed rule." There are no candidate marine mammal species found in California waters. The Guadalupe fur seal is listed under CESA as threatened. The MMPA also provides designations for at-risk marine mammal stocks. A species or a stock of a species is designated as depleted when it falls below its Optimum Sustainable Population (OSP) or, if the species is listed under ESA. Six whale species and the southern sea otter are considered depleted. The MMPA also lists a stock as strategic if: 1) it is listed as a T&E species under ESA; or 2) the stock is declining and likely to be listed as threatened under ESA; 3) the stock is listed as depleted under the MMPA; or 4) the stock has direct human-caused mortality which exceeds that stock's Potential Biological Removals (PBR) level. The term PBR is defined as "the maximum number of animals, not including natural mortalities, that may be removed from a marine mammal stock while allowing that stock to reach or maintain its OSP.” As
State Water Resources Control Board Clean Water Act Section 312(f) Application
Page 47 of 92
mandated in the 1994 amendments to the MMPA, NMFS develops estimates of PBRs for each marine mammal stock in U.S. waters. NMFS issues permits through the Marine Mammal Authorization Program (MMAP) to provide an exception for commercial fishers from the general taking prohibitions of the MMPA. The owner of a vessel or non-vessel gear participating in a Category I or II fishery must obtain authorization from NMFS in order to lawfully incidentally take a marine mammal in a commercial fishery, while those participating in Category III fisheries may incidentally take marine mammals without registering for or receiving an authorization. NMFS may also issue permits for the incidental, but not intentional, taking of marine mammals listed as T&E under ESA, (those species under NMFS’ jurisdiction), if NMFS determines that incidental mortality and serious injury due to commercial fishing will have a negligible impact on the affected species or stock, a recovery plan for has been or is being developed, a monitoring program has been established (where required), vessels are registered, and a take reduction plan has been developed or is being developed. With the 1994 amendments to the MMPA, intentional takes of marine mammals are now illegal except when imminently necessary in self-defense or to save the life of another person. While the two laws and resultant listings overlap, there are also significant differences between the federal and State-protected species listings, so these are presented separately in Maps 3.5 and 3.6 (below), respectively. Table 3.10 lists all marine mammal species found in California waters. Table 3.11 provides the status of federal and State seabirds.
California Fisheries Subject to the Restricted Access Program
Under the California Marine Life Management Act (MLMA), the California Department of Fish and Game has reviewed and published lists that include fisheries for which a restricted access program has been implemented. Restricted access refers to setting upper limits on the number of participants in a fishery and otherwise limiting fishing effort. Information such as ex-vessel product prices, vessel operating costs, consumer product prices, historical participation in the fishery, and landings are all essential to developing a restricted access program. The nearshore species managed in the commercial fishery are: Cabezon, California sheephead, California scorpionfish, kelp and rock greenlings, and black and yellow, China, gopher, grass and kelp rockfishes.
State Water Resources Control Board Clean Water Act Section 312(f) Application
Page 48 of 92
Map 3.5 – State-Listed Endangered, Threatened and Rare Species in Coastal and Marine Areas
State Water Resources Control Board Clean Water Act Section 312(f) Application
Page 49 of 92
Map. 3.6 – Federally-Listed Endangered, Threatened, and Candidate Coastal & Marine Species
State Water Resources Control Board Clean Water Act Section 312(f) Application
Page 50 of 92
Table 3.10 –Marine Mammal Species Found in California Waters
Marine Mammal Species Found in California Waters
Species Status PBR HUMPBACK WHALE (Megaptera novaeangllae) FE, SS, DEP 1.7 NORTHERN RIGHT WHALE (Eubalaena glacialls) FF, SS, DEP N/D SPERM WHALE (Physeter macrocephalus) FF, SS, DEP 2.0 SEI WHALE (Balaenoptera borealls) FF, SS, DEP N/D FIN WHALE (Balaenoptera physalus) FF, SS, DEP 2.1 BLUE WHALE (Balaenoptera musculus) FF, SS, DEP 1.7 GRAY WHALE (Eschrichtius robustus) 575 HARBOR PORPOISE (Phocoena phocoena)(Central CA Stock) SS 42 BRYDE’S WHALE (Balaenoptera edenl) N/D MINKE WHALE (Balaenoptera acutorostrata) 4.0 KILLER WHALE (Orcinus orca) 2.1 PYGMY SPERM WHALE (Kogia breviceps) 28 CUVIER’S BEAKED WHALE (Ziphlus cavirostris) 43 BAIRD’S BEAKED WHALE (Berardius bairil) 2.0 SHORT-FINNED PILOT WHALE (Globicephala macrohynchus) 5.7 NORTHERN RIGHT WHALE DOLPHIN (Lissodelphis borealis) 97 LONG-BEAKED COMMON DOLPHIN (Delphinus capensis) 14 SHORT-BEAKED COMMON DOLPHIN (Delphinus delphis) 79 BOTTLENOSE DOLPHIN (Tursiops truncatus)(Coastal Stock) 1.5 STRIPED DOLPHIN (Stenella coeruleoalba) 180 PACIFIC WHITE-SIDED DOLPHIN (Lagenorhynchus obllquidens) 157 RISSO’S DOLPHIN (Grampus griseus) 105 DALL’S PORPOISE (Phocoenoides dalli) 737 STELLER SEA LION (Eumetopias jubatus) (Eastern Stock) FT,DEP,SS 1,368 NORTHERN FUR SEAL (Callorhinus ursinus) (San Miguel Stock) 100 GUADALUPE FUR SEAL (Arctocephalus townsend) FT, ST, SS, PRO 104 NORTHERN ELEPHANT SEAL (Mirounga angustirostris) PRO 2,142 PACIFIC HARBOR SEAL (Phoca vltulina richardsl) (CA stock) 1,678 CALIFORNIA SEA LION (Zalophus californianus californianus) 6,591 SOUTHERN SEA OTTER (Enhydra lutris nereis) FT, DEP, PRO N/G
Status Codes FE - Federally listed as Endangered under ESA FT - Federally listed as Threatened under ESA DEP - Depleted under the MMPA SS - Listed as a Strategic Stock ST - State-listed as Threatened under CESA PRO - Fully Protected Mammal under Fish and Game Code §4700 N/D - Insufficient data to calculate PBR N/G - Incidental take not governed under the MMPA. ESA takes precedence in management of this species
State Water Resources Control Board Clean Water Act Section 312(f) Application
Page 51 of 92
Table 3.11 –The Status of Federal and State Seabirds The status of federal and state seabirds
Species Status* Brown pelican (Pelecanus occidentalis) FE, SE, DFGFP Black-footed albatross (Diomeda nigripes) Pink-footed shearwater (Puffinus creatopus) Sooty shearwater (P. griseus) Black-vented shearwater (P. opisthomelas) Northern fulmar (Fulmarus glacialis) Leach’s storm-petrel (Oceanodroma leucorhoa) Ashy storm-petrel (O. homochroa) SSC, FSC Black storm-petrel (O. melania) SSC Least storm-petrel (O. leucorhoa) Fork-tailed storm-petrel (O. furcata) SSC Brandt’s cormorant (Phalacrocorax penicillatus) Double-crested cormorant (P. auritus) SSC Pelagic cormorant (P. pelagicus) Bonaparte’s gull (Larus philadelphia) Heermann’s gull (L. heermanni) Ring-billed gull (L. delawarensis) California gull (L. californicus) SSC Herring gull (L. argentatus) Western gull (L. occidentalis) Glacous-winged gull (L. glaucescens) Parasitic jaeger (Stercorarius parasiticus) Pomarine jaeger (S. pomarinus) Red phalaropes (Phalaropus fulicaria) Red-necked phalaropes (P. lobatus) Black-legged kittiwake (Rissa tridactyla) Black skimmer (Rynchops niger) SSC California least tern (S. antillarum brown) FE, SE, DFGFP Royal tern (Sterna maxima) Elegant tern (S. elegans) FSC, SSC Common tern (S. hirundo) Arctic tern (S. paradisaea) Forster’s tern (S. forsten) Caspian tern (S. caspia) Black tern (Chlidonias niger) SSC Cassin’s auklet (Ptychoramphus aleuticus) Rhinoceros auklet (Cerorhinca monocerata) SSC Pigeon guillemot (Cepphus columba) Marbled murrelet (Brachyramphus marmoratus) Xantus’ murrelet (Synthliboramphus hypoleucus) FSC, FPL, SSC Common murre (Uria aalge) Tufted puffin (Fratercula cirrhata) SSC Pacific loon (Gavia pacifica) Common loon (Gavia artica) SSC Western grebe (Aechmophorus occidentalis) Clark’s grebe (A. clarki) Surf scoter (Melanitta perspicillata) Black scoter (Melanitta nigra) White-winged scoter (Melanitta fusca) Bald eagle (Haliaeetus leucocephalus) ST, DFGFP, FPD
* acronyms explained below
State Water Resources Control Board Clean Water Act Section 312(f) Application
Page 52 of 92
Acronym Definition FE Federally listed as endangered under ESA FT Federally listed as threatened under ESA FPL Petitioned for federal listing under ESA SE State listed as endangered under CESA ST State listed as threatened under CESA FSC Federal species of concern SSC State species of special concern DFGFP Fully protected under Fish and Game Code §3511 FPD Federally proposed for delisting Current NMFS Categories Under section 118 of the MMPA, NMFS classifies all U.S. commercial fisheries into one of three categories (I, II, III) based on the level of incidental serious injury and mortality of marine mammals that occurs in each fishery. The categorization of a fishery determines whether fishery participants will be required to comply with certain provisions of the MMPA, such as registration, observer coverage, and take reduction plan requirements. Fisheries are listed as Category I if the annual mortality and serious injury of a marine mammal stock in a given fishery is greater than or equal to 50 percent of the PBR. Fisheries are listed as Category II if the annual mortality and serious injury of a marine mammal stock is greater than one percent and less than 50 percent of the PBR level, while Category III’s annual mortality and serious injury of a marine mammal stock in a given fishery is less than or equal to one percent of the PBR level. Only participants in Category I or II are required to be registered under the MMPA. In California, the offshore shark-swordfish drift gill-net and the large mesh (>3.5 inches) set gill-net fishery are classified as Category I fisheries, while the anchovy, mackerel and tuna purse seine, the squid purse seine, and the California longline are classified as Category II fisheries. Category III fisheries include: small mesh (<3.5 inches) set gill-net; sardine purse seine; herring purse seine; squid dip net; salmon troll; groundfish longline/set line; shark/bonito longline/set line; groundfish trawl; shrimp trawl, lobster, prawn, shrimp, rock crab and fish pot; crab pot; sablefish pot; shrimp pot and trap; swordfish harpoon; bait pens; abalone, urchin; kelp; sea urchin, clam, octopus, oyster, sea cucumber, scallop, ghost shrimp hand dive or mechanical collection; CPFV; and finfish and shellfish live-trap/hook and line. Category III fisheries have a remote likelihood of marine mammal interaction or no known serious injuries or mortalities with marine mammals. There is no Category classification for recreational angling. Fisheries that have documented marine mammal mortality include the offshore groundfish trawl fisheries, purse seine fisheries for squid and other species, troll fisheries for salmon and other species, the salmon net pen fishery, and the commercial passenger fishing vessel industry (Forney et al. 2000). More than 72 percent of the marine mammals taken are California sea lions, but harbor seals, northern elephant seals, and a few Steller sea lions are also taken. Small cetaceans represent nearly 10 percent of the average annual take and include: short-beaked common dolphin, harbor porpoise, northern right whale dolphin, Dall’s porpoise, Pacific white-sided dolphin, and Risso’s dolphin.
State Water Resources Control Board Clean Water Act Section 312(f) Application
Page 53 of 92
Essential Fish Habitat (EFH) The Pacific Fishery Management Council (PFMC) manages 90 species of fish under three Fishery Management Plans: 1) Coastal Pelagics Fishery Management Plan, 2) Pacific Salmon Fishery Management Plan, and 3) Pacific Groundfish Fishery Management Plan. The Magnuson-Stevenson Act defines EFH as “those waters and substrate necessary to fish for spawning, breeding, feeding, or growth to maturity.” NMFS guidelines state that “adverse effects from fishing may include physical, chemical, or biological alterations of the substrate, and loss of, or injury to, benthic organisms, prey species and their habitat, and other components of the ecosystem.” EFH has been established for five species of coastal pelagics: Pacific sardine, Pacific mackerel, northern anchovy, jack mackerel, and market squid which is from the coast out to the edge of the Exclusive Economic Zone (EEZ) between the U.S. to Canada and U.S. to Mexico borders. EFH also has been established for 83 species of groundfish. EFH for Pacific Coast groundfish is defined as the aquatic habitat necessary to allow for groundfish production to support long-term sustainable fisheries for groundfish and for groundfish contributions to a healthy ecosystem. Descriptions of groundfish fishery EFH for each of the 83 species and their life stages result in over 400 EFH identifications. When these EFHs are taken together, the groundfish fishery EFH includes all waters from the mean higher high water line and the upriver extent of saltwater intrusion in river mouths, along the coast of Washington, Oregon, and California seaward to the boundary of the EEZ. The seven “composite” EFH identifications are as follows: estuarine, rocky shelf, non-rocky shelf, canyon, continental slope/basin, neritic zone (33 feet and shallower), and the oceanic zone (66 feet and deeper). EFH has been established for five species of salmon: chinook, coho, chum, pink, and sockeye. EFH for these salmon include those waters and substrate necessary for salmon production to support a long-term sustainable salmon fishery. EFH includes all streams, lakes, ponds, wetlands, and other currently viable water bodies and most of the habitat historically accessible to salmon. In the estuarine and marine areas, salmon EFH extends from the nearshore and tidal submerged environments within State territorial waters out to the full extent of the EEZ. Habitat Areas of Particular Concern (HAPC) are described in the regulations as subsets of EFH which are rare, particularly susceptible to human-induced degradation, especially ecologically important, or located in an environmentally stressed area. Currently, only Amendment 14 to the Pacific Coast Salmon Plan has addressed HAPC for chinook, coho, and pink salmon. DFG has mapped the ranges and habitats, including federally-designated “essential” habitats of some salmonids and nonsalmonids (i.e., California’s white and green sturgeon, and “ecologically significant units” (ESUs). This information is presented below as a series of maps of steelhead, coho, chinook, and sturgeon ranges and essential habitats in (Maps 3.7 through 3.10). Appendix 5 contains the January 2006 DFG listing of State and federally-listed endangered and threatened animal species in California. Many (though not all) of these listed species are dependent upon the preservation of acceptable levels of water quality in coastal, marine, and estuarine environments for their survival and successful reproduction.
State Water Resources Control Board Clean Water Act Section 312(f) Application
Page 54 of 92
Map 3.7 - Steelhead ESUs, Critical Habitat, and Abundance
State Water Resources Control Board Clean Water Act Section 312(f) Application
Page 55 of 92
Map 3.8 - Coho Range, ESUs, and Abundance
State Water Resources Control Board Clean Water Act Section 312(f) Application
Page 56 of 92
Map 3.9 - Chinook Range, ESUs, and Critical Habitat
State Water Resources Control Board Clean Water Act Section 312(f) Application
National Marine Sanctuaries Currently, four National Marine Sanctuaries have been established along California’s coastline. This designation allows coordinated management of the area’s ecological, research, recreational, aesthetic, and historic resources. No drilling for oil or gas is permitted in marine sanctuaries off California, and discharge of materials such as harbor dredge spoils is prohibited. Fishing in the marine sanctuaries requires a California fishing license, although in a few areas, removal or any marine organism is forbidden. Many of the habitats and species in the sanctuaries are listed under the ESA as endangered or threatened. The Channel Islands National Marine Sanctuary encompasses 1,252 square nautical miles and was established mainly to protect the resources of the waters surrounding five of the Channel Islands off Santa Barbara County. Twenty-seven species of whales and dolphins spend part of the year in this sanctuary, including the endangered gray, blue, humpback and sei whales. In addition, there are many species of fish, invertebrates, and seabirds inhabiting this sanctuary.
State Water Resources Control Board Clean Water Act Section 312(f) Application
Page 58 of 92
The Gulf of the Farallones National Marine Sanctuary surrounds the Farallon Islands and extends up to 40 miles off the mainland, and also extends to a significant portion of Marin County’s shoreline. The sanctuary supports populations of harbor seals, California sea lions, and elephant seals. Commercial fisheries include rockfish, Pacific herring, and Dungeness crab. The Farallon Islands are also a national wildlife refuge, providing habitat for the largest concentration of breeding seabirds in the continental United States. Cordell Bank is a seamount 50 miles northwest of San Francisco at the edge of the Continental Shelf. The wide range of ocean depths and upwelling of nutrient-laden waters has encouraged a wide range of algae, invertebrates, fishes, marine mammals, and seabirds to inhabit the area. Both divers and fishermen visit this sanctuary. The Monterey Bay National Marine Sanctuary encompasses 4,024 square nautical miles along the Central California Coast, from the southern boundary of the Gulf of the Farallones National Marine Sanctuary to Cambria Rock in San Luis Obispo County. Resources protected in this sanctuary are varied, and include extensive kelp forests near shore as well as the Monterey Submarine Canyon. The nutrient-rich currents support sea otters, seals, shorebirds, seabirds, California gray whales, finback, humpback, and sperm whales. Monterey Bay’s algal community is the most diverse in the U.S. Thirteen educational and oceanographic research facilities are adjacent to this sanctuary, and fishing, whale-watching, tidepool viewing, surfing, and diving are popular recreational activities. Commercial fishing also occurs within the sanctuary, including albacore tuna, anchovies, squid, and flatfish. The California Coastal National Monument This extensive federal designation includes all undesignated rocks, islands, exposed reefs, and pinnacles above mean high tide extending 12 nautical miles off the California coastline, stretching the entire length of California’s coastline from Mexico to Oregon. Protection of geological features, scenic values, and habitat for sea birds, mammals, and other forms of sea life are among the goals cited by the Presidential Proclamation that created the monument in 2000. As in the case in the National Marine Sanctuaries, the California Coastal National Monument includes habitats supplied with nutrients from upwelling and freshwater inflows, and supports approximately 200,000 seabirds, including the endangered California least tern, the endangered brown pelican, the snowy plover, and other birds which depend on the coastal rookeries for breeding. The rocky shores of these islands and rocks also provide forage, habitat, and breeding grounds for a number of threatened sea mammals and pinnipeds. San Francisco Bay National Estuarine Research Reserve This reserve is a cooperative effort among NOAA, the State of California, and local public and private organizations. The Reserve protects two important, pristine tidal wetlands in the Bay: these are located at China Camp State Park in Marin County and Rush Ranch Open Space in Solano County. Its goals include promotion of better coastal management policies, conservation research, public outreach and education, collecting environmental and meteorological data as part of a national network, and encouraging improved environmental stewardship of the Bay.
State Water Resources Control Board Clean Water Act Section 312(f) Application
Page 59 of 92
California’s State-Designated MPAs In general, California state-designated MPAs are named, discrete geographic or marine or estuarine areas seaward of the high tide line or the mouth of a coastal river, including any area of intertidal or subtidal terrain, together with its overlying water and associated flora and fauna that has been designated by law, administrative action, or voter initiative to protect or conserve marine life and habitat. MPAs are primarily intended to protect or conserve marine life and habitat, and are therefore a subset of the general category of MMAs mentioned previously. There are several kinds of designations under the general category of MPAs: California’s state MPAs include State Water Quality Protection Areas (SWQPAs), Areas of Special Biological Significance (ASBS), Coastal Sanctuaries, Ecological Reserves, Marine Resources Protection Act (MRPA) Ecological Reserves, various state parks, refuges, reserves, and a University of California Natural Reserve. Each type of designation will be briefly discussed below. SWQPAs are designated by the State Water Board to protect the species or biological communities in these areas from an undesirable alteration in natural water quality. The concept of “special biological significance” recognizes that certain biological communities, because of their value or fragility, deserve special protection, consisting of preservation and maintenance of natural water quality conditions to the extent practicable. There are currently 34 SWQPAs in California, and DFG is responsible for the management of their marine resources. SWQPAs are located in every coastal county in California. General regulations for SWQPAs regulate point-source sewage and industrial process wastes, and discharge of waste from nonpoint sources, including storm water runoff, silt, and urban runoff, are controlled to the extent practicable. ASBS are a subset of the SWQPAs and require special protection as determined by the State Water Board pursuant to the Ocean Plan and the State Water Quality Control Plan for Control of Temperature in the Coastal and Interstate Waters and Enclosed Bays and Estuaries. The Coastal Sanctuary designation prohibits any State agency from entering into a lease for the extraction of oil or gas from all State waters subject to tidal influence and out to three miles offshore, and is administered by the State Lands Commission. It encompasses 5,238 square miles of the State’s coastal waters. There are 22 marine Ecological Reserves. Their mission is to protect threatened or endangered native plants, wildlife, or aquatic organisms to specialized habitat types (both terrestrial and aquatic), or large heterogenous gene pools. DFG governs the occupation, utilization, operation, protection, enhancement, and maintenance of the ecological reserves. In general, marine and terrestrial species are protected, except for limited fishing access (via angling from shore) in accordance with other DFG fishing regulations. Commercial fishing is prohibited within these areas, and scientific specimen collection is controlled via DFG’s permitting processes. Boating and water-contact sports are also limited by special permit issuance. MRPAs are established by DFG as areas in which fishing and other marine life harvesting are banned in order to facilitate scientific research relating to the management and enhancement of marine resources. The four reserves are the King Range, Big Creek, Vandenberg, and
State Water Resources Control Board Clean Water Act Section 312(f) Application
Page 60 of 92
Big Sycamore Canyon MRPA Ecological Reserves. Public access to most of these reserves is restricted except for persons conducting scientific research. There are 10 other State Reserves established by DFG. Each State Reserve has a unique set of protections, specific missions, and rules pertaining to the management of these diverse assemblages of natural resources. Twenty State Refuges have been established to protect marine and coastal biological resources in California. Marine refuges are further subdivided into four categories: clam refuges, fish refuges, game refuges, and marine life refuges. Clam refuges protect only clams, fish refuges generally protect only fish, and marine life refuges generally protect invertebrates and plants. The level and type of protection in fish refuges and marine life refuges can vary significantly across sites. Game refuges protect marine mammals and birds. State Parks and State Recreation Areas are administered by the CSP. Twelve such areas border California’s coastal waters, estuaries, and bays. In general, these facilities promote maximum public interaction with California’s varied natural environments and diverse historic legacies. They provide many opportunities for activities such as fishing, boating, swimming, camping, hiking, guided tours, living history exhibits, and other recreational activities for public enjoyment and education about the State’s historic, cultural and diverse natural environments. The University of California (UC) has established a Natural Reserve System (NRS) in order to encompass nearly all of the State’s major ecosystems. These sites are preserved in as undisturbed a condition as possible in order to support the university-level research and teaching programs. The ecosystems and facilities located at each reserve are available to UC researchers as well as scientists from other educational institutions. The NRS’s mission is to contribute to the understanding and conservation of natural systems by supporting university-level teaching and research at 35 locations statewide. For the most part, non-educational private and public activities (such as fishing and boating) in the reserves are prohibited. Currently, 11 UC Natural Reserves encompass coastal, marine, bay and/or estuarine areas. III.D – RECREATIONAL BOATING Extended fair weather periods and a number of sheltered coastal areas contribute to favorable sailing conditions. At various times of the year fishing boats can be seen on coastal rivers and ocean waters. Appendix 4 lists areas of intensive boating activities, the Department of Boating and Waterways’ regional coastal listings, boating regions, numbers of vessels registered to each region, and the total number of marinas in California. Table 3.12 gives the estimates for recreational boating and fishing, which are two activities that often occur together. In 2000, more than 2.7 million fishers participated in more than 20.3 million recreational fishing activity days along the California coast, while more than 4 million people participated in marine boating related activities. Participation rates in different boating related activities averaged around 6 days per year. California had the largest number of marine fishers and sailors, while it was ranked second, behind Florida, in motor boating in the
State Water Resources Control Board Clean Water Act Section 312(f) Application
Page 61 of 92
United States. The proportions of different boating and fishing related activities are given in Figure 3.12.
Table 3.12 – Participation in Recreational Boating and Fishing Activities
Recreational Activity Number of Participants Number of Days Average Days Per
Person Recreational Fishing 2,727,286 20,318,000 7.45 Motorboating 1,549,289 11,589,000 7.48 Sailing 1,087,755 6,755,000 6.21 Personal Watercraft 680,309 2,925,000 4.30 Canoeing 190,948 N/A Kayaking 433,209 N/A Rowing 280,265 N/A Total for Recreational Boating 4,221,775 6.41
Figure 3.12 – Proportion of Fishing & Boating Related Activity Days
There are numerous locations along the coast with berthing and launching facilities for recreational boating. Over the years, California’s boating community has continued to grow as boating has become increasingly popular. For example, between 1960 and 2001, the number of boats per 1,000 Californians steadily increased from 11 to 28. Over one million boats are now registered to California residents. As the number of boaters has increased, so too has the variety of boating activities that are popular in California, as shown by the increasing numbers of kayakers, rafting enthusiasts, and jet skiers utilizing the State’s coastal waterways. Most boaters and marinas are concentrated in coastal, bay, and estuarine areas having the State’s largest urban populations – as evidenced by the fact that over 90 percent of California’s registered recreational vessels are located in the Southern California Bight, the San Francisco Bay, and the Sacramento-San Joaquin Delta. Tables 3.13 and 3.14 summarize California’s marina recreators’ characteristics and typical use patterns.
State Water Resources Control Board Clean Water Act Section 312(f) Application
Page 62 of 92
Table 3.13 – Marina Recreators’ Characteristics by Use
Visitor Characteristics Day Users Overnight Users
Total trips using boat 36.16 36.08 Nights away from home 0 2.52 Days use boat 1 2.68 People on boat 3.79 3.88
Table 3.14 – Marina Recreators’ Characteristics by Boat Length Segment Visitor Characteristics 20’ and smaller 21’-30’ 30” and larger Total trips using boat 49.72 28.14 43 Nights away from home 1.17 1.47 2.27 Days use boat 1.73 1.98 2.59 People on boat 3.36 3.87 4.44
IV. CONCLUSION The California Water Code directs the State Water Board to protect water quality for various beneficial uses. U.S. EPA has also authorized the State Water Board to implement the NPDES program for discharges regulated under the federal CWA. ABs 2093 and 2672 and SB 771 became State law in 2004 and 2005, respectively. These amendments to PRC represent the culmination of legislative efforts to prevent significant releases of sewage, sewage sludge, graywater, and other vessel wastes into California’s coastal, bay, and estuarine environments. Pursuant to directives contained in these statutes, and in consultation with the U.S. EPA, the State Water Board has prepared and submitted this application to receive federal authorization in order to prohibit the discharge of sewage and sewage sludge from ocean-going vessels including cruise ships into the State’s waters. This application documents the nature and extent of the resources and facilities listed under CWA section 312(f) including 889 water recreational areas, 200 aquatic sanctuaries (many of which also function as fish-spawning and/or nursery areas, as well as habitats supporting federally-listed species under the ESA), drinking water intakes, and areas of intensive boating activities. As demonstrated in the resource listings included in this application, California has a high density of both water recreational areas and aquatic sanctuaries stretching from the Oregon border to Mexico. Though the distribution of drinking water intake facilities and the concentration of recreational boaters is more regional in nature, both types of facilities exist in northern and southern California, and are expected to continue to increase in number as the State’s population continues to grow, thus generating more demand for both water supplies and water recreational facilities such as marinas. Along with the general trend of increased population growth, ocean-going vessels (including cruise ships) traffic continues to grow in proportion to increased demand. At present, sewage and
State Water Resources Control Board Clean Water Act Section 312(f) Application
Page 63 of 92
sewage sludge discharges from these vessels are unregulated. Experience has shown that mismanagement of these waste streams on these vessels can result in the release of significant amounts of sewage and sewage sludge in areas where there are many beneficial uses of concern, ranging from water-contact recreation, drinking water supplies, and aquatic sanctuaries. Therefore, the State Water Board requests that it be granted authority to regulate these discharges in order to preserve and protect water quality for the many beneficial uses of all of the State’s coastal waters, and to maintain conformity with applicable water quality standards established in statewide and regional water quality control plans and policies.
State Water Resources Control Board Clean Water Act Section 312(f) Application
Page 64 of 92
APPENDICES
Appendix 1 - Water Recreational Areas Listed by County
Del Norte County (1) Pelican State Beach (2) Clifford Kamph Memorial Park (3) Smith River County Park (4) Smith River Fishing Access (5) Smith River (6) Kellogg Beach Park (7) Lake Earl Wildlife Area/ Tolowa Dunes State Park
(8) Jedediah Smith Redwoods State Park
(9) Point St. George Public Access (10) Radio Road Accessway (11) Pebble Beach Public Fishing Access (12) Preston Island (13) Brother Joanthan Park/ Vista Point (14) Street Ends Leading to the Beach
(Crescent City) (15) Crescent Lighthouse at Battery Point (16) Beach Front Park (17) Shoreline Campground Accessway (18) Crescent City Harbor (19) Redwood National Park (20) Crescent Beach (21) Enderts Beach (22) Del Norte Coast Redwoods State
Park (23) Mill Creek Campgrounds (24) Redwood AYH Hostel-DeMartin
House (25) Wilson Creek Beach (26) Lagoon Creek Fishing Access (27) Requa Overlook (28) Klamath River (29) Flint Ridge (30) Coastal Drive
Humboldt County
(1) Redwood National Park (2) Coastal Drive (3) Prairie Creek Redwoods State Park (4) Butler Creek Backpack Camp (5) Fern Canyon (6) Gold Bluffs Campground (7) Elk Prairie Campground (8) Orick Beach Fishing Access (9) Redwood Creek Beach Picnic Area (10) Freshwater Lagoon (11) Stone Lagoon (12) Dry Lagoon State Park (13) Harry A. Merlo State Recreation Area
(14) Big Lagoon County Park
(15) Patrick’s Point State Park (16) Trinidad Roadside Rests (17) Trinidad State Beach (18) Trinidad Harbor (19) Luftenholtz Beach County Fishing Access
(20) Honda Point Access
(21) Moonstone County Park (22) Little River State Beach (23) Clam Beach County Park (24) McKinleyville Vista Point (25) Azalea State Reserve (26) Mad River Beach County Park (27) Hammond Trail (28) Arcata Hostel (29) Arcata Marsh (30) KOA Campground (31) Dead Mouse Marsh (32) Ebb Tide R.V. Park (33) Woodley Island Marina (34) Eureka Mooring Basin
State Water Resources Control Board Clean Water Act Section 312(f) Application
Page 65 of 92
Humboldt County (35) Fort Humboldt State Historic Park (36) Humboldt Bay (37) North Spit (38) Samoa Dunes Recreation Area (39) King Salmon Resort (40) Fields Landing County Boat Launch (41) South Spit and Jetty (42) Table Bluff County Park (43) Crab County Park (44) Eel River (45) Humboldt County Fairgrounds Campground
(46) Centerville Beach County Park
(47) Headwaters Forest Reserve (48) Mattole Road (49) Mattole River and Beach (50) King Range National Conservation
Area (51) Shelter Cove
Mendocino County
(1) King Range National Conservation Area
(2) Sinkyone Wilderness State Park
(3) Overlooks (4) Westport-Union Landing State Beach (5) Wages Creek Beach (6) Westport Headlands (7) Chadbourne Gulch (8) Bruhel Point Bluff (9) South Kibesillah Gulch View Area (10) Seaside Creek Beach (11) MacKerricher State Park (12) Glass Beach (13) Noyo Harbor (14) Mendocino Botanical Gardens (15) Path to Beach (16) Jefferson Way (17) Jug Handle State Reserve (18) Jackson State Forest (19) Mendocino Woodlands State Park (20) Caspar Creek Vista Point (21) Cantus Cove (22) Caspar Headlands State Beach (23) Caspar Headlands State Reserve (24) Point Cabrillo Light Station and
Preserve (25) Russian Gulch State Park (26) Deborah Bove Viewpoint (27) Mendocino Headlands State Park (28) Mendocino Bay Viewpoint (29) Path to Beach (30) Van Damme State Park (31) Dark Gulch Beach (32) Albion Flat (33) Navarro River Redwoods State Park (34) Paul Dimmick Campground (35) Greenwood Creek Project (36) Mallo Pass Creek Vista Point (37) Manchester State Beach (38) Garcia River Access (39) Point Arena Lighthouse (40) Arena Cove (41) Overlooks (42) Mendocino Coastal Preserve (43) Moat Creek Access (44) Bowling Ball Beach (45) Schooner Gulch (46) Hearn Gulch (47) Fish Rock Beach (48) Collins Landing (49) St. Orres Creek (50) Bourns Landing/ Cooks Beach (51) Gualala Bluff Trail (52) Gualala River
State Water Resources Control Board Clean Water Act Section 312(f) Application
Page 66 of 92
Sonoma County (1) Gualala Point Regional Park (2) Salal Trail (3) Sea Ranch Blufftop Trail (4) Sea Ranch Public Access Trails (5) North Horseshoe Cove (6) Kruse Ranch (7) Kruse Rhododendron State Park (8) Fish Mill Cove (9) Stump Beach (10) Salt Port State Park (11) Ocean Cove Reserve (12) Stillwater Cove Regional park (13) Fort Ross State Historic Park (14) Fort Ross Reef Campground (15) Vista Trail (16) Russian Gulch (17) North Jenner Beaches (18) Rivers End (19) Jenner Vistor Center (20) Duncans Mills Camping Club (21) Willow Creek/Pomo Canyon Campgrounds
(22) Casini Ranch Family Campground
(23) Sonoma Coast State Beaches (24) Goat Rocks (25) Wright’s Beach (26) Duncans Landing (27) Salmon Creek Beach (28) Bodega Bay Harbor (29) Bodega Bay Harbor (30) Mason’s Marina (31) Spud Port Marina (32) Westside Regional Park (33) Bodega Marine Laboratory (34) Bodega Head (35) Campbell Cove (36) Porto Bodega (37) Viewpoint (38) Bird Walk Trail (39) Pinnacle Gulch Trail (40) Doran Beach Regional Park
Marin County (1) Dillon Beach (2) Lawson’s Landing (3) Keys Creek Public Fishing Access (4) Walker Creek Delta (5) Miller Park Launching Facility (6) Tomales Bay State Park-Marshall (7) Livermore Marsh (8) Marconi Conference Center (9) Tomales Bay State Park – Millerton Point
(10) Tomales Bay Trailhead
(11) Marshall Beach (12) Tomales Bay State Park – Inverness Ridge
(13) Tomales Bay Ecological Reserve (14) Point Reyes National Seashore (15) Pierce Point Ranch (16) McChres Beach (17) Kehoe Beach (18) Abbotts Lagoon (19) North Beach and South Beach (20) Point Reyes Headlands (21) Drakes Beach (22) Drakes Estero (23) Limantour Estero Reserve (24) Point Reyes Hostel (25) White House Pool (26) Olema Marsh (27) Samuel P. Taylor State Park (28) Five Brooks Trailhead (29) Point Reyes Bird Observatory (30) Palomarin Trailhead (31) Agate Beach (32) Duxbury Reef (33) Bolinas Overlook (34) Bolinas Beach (35) Bolinas Lagoon Nature Preserve (36) Audubon Canyon Ranch
State Water Resources Control Board Clean Water Act Section 312(f) Application
Page 67 of 92
Marin County (37) Seadrift Beach (38) Walkaway (39) Stinson Beach (40) Red Rock Beach (41) Steep Ravine Beach (42) Slide Ranch (43) Muir Woods National Monument (44) Mount Tamalpais State Park (45) Muir Overlooks (46) Muir Beach (47) Coastal Trail (48) Marin Headlands (49) Tennessee Valley (50) Rodeo Beach (51) Marin Headlands – Golden Gate Hostel
(52) Point Bonita Lighthouse
(53) YMCA Point Bonita Center (54) Kirby Cove
San Francisco County (1) Angel Island State Park (2) Alcatraz Island (3) Aquatic Park (4) San Francisco International Hostel (5) Fort Mason (6) Marina Green (7) Fort Point (8) Presidio of San Francisco (9) Coastal Trail (10) Baker Beach (11) China Beach (12) Lands End (13) Ocean Beach (14) Golden Gate Park (15) San Francisco Zoological Gardens (16) Lake Merced (17) Fort Funston (18) Bay Area Ridge Trail (19) Phillip Burton Memorial Beach
San Mateo County
(1) Palisades Park (2) Northridge City Park/ Avalon Canyon (3) Mussel Rock City Park (4) Sharp Park Beach and Pacifica Pier (5) Milagra Ridge Park (6) Mori Point (7) Sweeney Ridge Skyling Preserve (8) San Francisco Bay Discovery Site (9) Reina del Mar Trail Access (10) Rockaway Beach (11) San Pedro Beach (12) San Pedro Valley County Park (13) Gray Whale Cove State Beach (14) Montara State Beach (15) Montara Lighthouse Hostel (16) James Fitzgerald Marine Reserve (17) West Beach Trail (18) Coastside Trail (19) Pillar Point Harbor (Johnson Pier) (20) East Breakwater (21) El Granada/ Surfer’s Beach (22) Dunes Beach (23) Venice Beach (24) Francis Beach (25) Blufftop Coastal Park (26) Overlook (27) Arroyo Canada Verde Beach (28) Pelican Point R.V. Park (29) Cowell Ranch Beach (30) Martin’s Beach (31) San Gregorio Private Beach (32) San Gregorio State Beach (33) Pomponio State Beach (34) Pescadero State Beach (35) Pescadero Marsh Natural Preserve (36) Pebble Beach (37) Bean Hollow State Beach (38) Overlooks (39) Gazos Creek Access (40) Ano Nuevo State Reserve
State Water Resources Control Board Clean Water Act Section 312(f) Application
Page 68 of 92
Santa Cruz County
(1) Big Basin Redwoods State Park (2) Waddell Creek Beach (3) Greyhound Rock Fishing Access (4) Scott Creek Beach (5) Davenport Landing Beach (6) Davenport and Davenport Beach (7) North Santa Cruz Beaches (8) Red, White and Blue Beach
(9) Wilder Ranch State Park (10) Long Marine Laboratory/Seymour Discovery Center
(11) De Anza Trailer Park Access (12) Natural Bridges State Beach (13) West Cliff Drive (14) Lighthouse Field and Point (15) Cowell Beach (16) Neary Lagoon City Park (17) Santa Cruz Municipal Wharf (18) Santa Cruz Beach and Boardwalk (19) San Lorenzo River Bike Path (20) Santa Cruz Hostel (21) San Lorenzo Point (22) Seabright Beach (23) Walton Lighthouse (24) Santa Cruz Harbor (25) Bike and Footpath (26) Stairways to Harbor (27) Stairway and Ramp to Harbor (28) Path to Harbor (29) Path to Harbor (30) Twin Lakes State Beach (31) East Cliff Drive (32) Twin Lakes State Beach (33) Sunny Cove (34) Corcoran Lagoon Beach (35) Moran Lake Beach and Park (36) Rockview Drive Overlook (37) Pleasure Point Beach (38) Pleasure Point Overlook (39) Opal Cliffs Recreation District (40) Cliff Drive (41) Hooper Beach (42) Capitola Fishing Wharf (43) Capitola City Beach (44) Views and Trails (45) New Brighton State Beach (46) Seacliff State Beach and Pier (47) Rio Del Mar Beach (48) Hidden Beach County Park (49) Stairway (50) Seascape County Park (51) Santa Cruz KOA Campground (52) Manresa State Beach (53) Sunset State Beach (54) Palm Beach
Monterey County
(1) Zmudowski State Beach (2) Moss Landing State Beach (3) Elkhorn Slough (4) Kirby Park (5) Moss Landing Wildlife Area (6) Moss Landing Harbor (7) Salinas River State Beach (8) Monterey Bay Sanctuary Scenic Trail (9) Marina Dunes R.V. Park (10) Marina State Beach (11) Locke Paddon Wetland Community Park
(12) Roberts Lake
(13) Laguna Grande (14) Monterey State Beach (off Sand Dunes Drive)
(15) Del Monte Beach (16) Monterey Bay Park (17) El Estero Park (18) Monterey Bay Coastal Trail (19) Municipal Wharf No. 2 (20) Monterey Marina (21) Fisherman’s Wharf (22) Custom House Plaza
State Water Resources Control Board Clean Water Act Section 312(f) Application
Page 69 of 92
Monterey County (23) Fisherman’s Shoreline Park (24) Breakwater Cove Marina (25) Coast Guard Pier (26) San Carlos Beach Park (27) Cannery Row (28) Aeneas Beach (29) Macabee Beach (30) Monterey Bay Aquarium (31) Hostelling International, Monterey (32) Shoreline Park (33) Berwick Park (34) Lover’s Point (35) Perkins Park (36) Point Pinos Lighthouse Reservation (37) Asilomar State Beach and Conference Grounds
(38) 17-Mile Drive
(39) Spanish Bay Recreational Trail (40) Spanish Bay Shoreline Pedestrian Trail
(41) Fanshell Beach (42) Stillwater Cove/Lodge at Pebble Beach
(43) Carmel City Beach (44) Carmel River State Beach (45) Point Lobos State Reserve (46) Garrapta State Park (47) Bixby Creek Bridge (48) Point Sur State Historic Park (49) Andrew Motera State Park (50) Big Sur Campground (51) Riverside Campground (52) Farmwood Park Campground (53) Pfeiffer Big Sur State Park (54) Los Padres National Forest/Ventana
Wilderness (55) Ventana Campground (56) Post Ranch Inn (57) Julia Pfeiffer Burns State Park (58) Esalen Institute (59) Landels-Hill Big Creek Reserve (60) Limekiln State Park (61) Kirk Creek Campground (62) Mill Creek Picnic Ground (63) Sand Dollar Picnic Area and Beach (64) Plaskett Creek Campground (65) Willow Creek Picnic Ground
San Luis Obispo County
(1) Ragged Point Trail and Overlook (2) Elephant Seal Viewing Areas
(3) Overlooks (4) Hearst San Simeon State Historical Monument
(5) William R. Hearst Memorial State Beach (6) Overlooks
(7) Stairway to Beach (8) Path to Beach (9) San Simeon State Beach (10) San Simeon Creek Access (11) Moonstone Beach (12) Leffingwell Landing (13) Santa Rosa Creek Access (14) Shamel County Park (15) Overlooks (16) East West Ranch (17) Cambria Hostel/Bridge Street Inn (18) Sherwood Drive Access Points (19) Estero Bluffs (20) Cayucos State Beach (21) Cayucos Beach (22) Morro Strand State Beach (North) (23) Morro Strand State Beach (South) (24) Coleman City Park (25) Morro Rock Ecological Preserve (26) City T-Piers (27) Morro Bay Estuary Visitor (28) Morro Bay Street Ends
State Water Resources Control Board Clean Water Act Section 312(f) Application
Page 70 of 92
San Luis Obispo County Information Center (29) Dunes Street Bluff and Park (30) Centennial Stairway and Park (31) Tidelands Park (32) Morro Bay State Park (33) El Moro Elfin Forest (34) Baywood Park Beach (35) Second Street Pier (36) Sweet Springs Nature Preserve (37) Morro Bay Access (38) Monarch Lane (39) Morro Dunes National Preserve (40) Los Osos Oaks State Preserve (41) Montaña de Oro State Park (42) Pecho Coast Trail (43) Port San Luis Pier and Beach (44) Avila State Beach (45) South Palisades City Park (46) Stairs to Beach (47) Spyglass City Park (48) Memory Park (49) Vista Points (50) Ocean City Park (51) Margo Dodd City Park (52) Dinosaur Caves Park (53) Pismo State Beach (54) Pismo Beach Pier
(55) Pismo Coast Village R.V. Resort (56) Pismo State Beach North Beach Campground
(57) Pismo State Beach Oceano Campground (58) Oceano Memorial County Park
(59) Pismo Dunes Preserve (60) Oceano Dunes Vehicular Recreation Area
(61) Oso Flaco Lake Natural Area
Santa Barbara County (1) Dunes Center (2) Rancho Guadalupe Dunes Preserve
(Guadalupe Entrance) (3) Point Sal State Beach (4) Vandenberg Air Force Base Fishing
Access (5) Ocean Beach County Park (6) Surf Railroad Depot (7) Vandenberg AFB Beach Access (8) Jalama Beach County Park (9) Gaviota Rest Area (10) Gaviota State Park (11) Refugio State Beach (12) Bike Path and Ramp to Beach (13) El Capitan State Beach (14) El Capitan Ranch Park (15) Sandpiper Golf Course (16) Path to Beach (17) Coal Oil Point Natural Reserve (18) Isla Vista County Park (19) Window to the Sea Park (20) Isla Vista Beach (21) University of California at Santa Barbara
(22) Goleta Beach County Park
(23) Cliff Drive (24) Arroyo Burro Beach County Park (25) Douglas Family Reserve (26) Mesa Lane Stairs (27) Overlook (28) La Mesa Park (29) One Thousand Steps (30) Shoreline Park (31) Leadbetter Beach (32) Pershing Park (33) Plaza del Mar (34) Santa Barbara Maritime Museum (35) Santa Barbara Harbor (36) Los Baños del Mar
State Water Resources Control Board Clean Water Act Section 312(f) Application
Page 71 of 92
Santa Barbara County (37) Ambassador Park (38) West Beach (39) Steams Wharf (40) Chase Palm Park (41) Santa Barbara International Tourist Hostel
(42) Cabrillo Ball Field
(43) East Beach (44) Dwight Murphy Field (45) A. Child’s Estate Zoological Gardens (46) Andree Clark Bird Refuge (47) Stairways to Beach (48) Hammonds to Beach (49) Miramar Beach (50) San Miguel Island (51) Santa Rosa Island (52) Santa Cruz Island (53) Anacapa Island (54) Santa Barbara Island
Ventura County
(1) Rincon Point (2) La Conchita Beach (3) Mussel Shoals Beach (4) Seacliff Beach (5) Hobson County Park (6) Rincon Parkway North (7) Faria County Park (8) Solimar Beach (9) Rincon Parkway South (10)Emma Wood State Beach (11) Seaside Wilderness Park (12) Bike Path (13) Ventura County Fairgrounds Beach (14) Surfer’s Point at Seaside Park (15) Promenade Park (16) San Buenventura State Beach (17) Marina Park (18) Ventura Harbor (19) Bike Path (20) Peninsula Beach (21) Santa Clara Estuary Natural Preserve (22) McGrath State Beach (23) Mandalay County Park (24) Oxnard Shores (25) Oxnard State Beach (26) Hollywood Beach (27) Peninsula Park (28) Channel Islands Harbor (29) Silver Strand Beach (30) Port Hueneme Beach Park (31) Bubbling Springs Park (32) Ormond Beach (33) Mugu Lagoon (34) Point Mugu Beach (35) La Jolla Valley (Unit of Point Mugu State Park)
(36) Thornhill Broome Beach (Unit of Point Mugu State Park)
(37) Sycamore Canyon Campground (Unit of Point Mugu State Park)
(38) County Line Beach
(39) Staircase Beach
Los Angeles County (1) Leo Carillo State Beach (2) Nicholas Canyon County Beach (3) Charmlee County Park (4) El Pescador State Beach (5) La Piedra State Beach (6) El Matador State Beach (7) Lechuza Beach (8) Stairway to Beach (9) Walkway and Steps to Beach (10) Zuma Beach County Park (11) Point Dume Whale Watch (12) Point Dume State Beach (13) Point Dume State Preserve (14) Paradise Cove (15) Escondido Beach (16) Stairs to Beach
State Water Resources Control Board Clean Water Act Section 312(f) Application
Page 72 of 92
Los Angeles County (17) Dan Blocker County Beach (18) Malibu Beach R.V. Park (19) Stairways to Beach (20) Malibu Bluffs State Park (21) Malibu Lagoon State Beach (22) Malibu Pier (23) Zonker Harris Accessway (24) Stairway to the Beach (25) Stairway to the Beach (26) Las Tunas State Beach (27) Topanga State Beach (28) Circle X Ranch (29) Arroyo Sequit (30) Zuma and Trancas Canyons (31) Rocky Oaks (32) Peter Strauss Ranch (33) Paramount Ranch (34) Malibu Creek State Park (35) Ramirez Canyon Park (36) Escondido Canyon Natural Area (37) Castro Crest (38) Solstice Canyon (39) Tapia Park (40) Calabasas Park (41) Stunt Ranch (42) Cold Creek Canyon Preserve (43) Topanga State Park (44) Will Rogers State Historic Park (45) Will Rogers State Beach (46) Temescal Canyon Park (47) Palisades Park (48) Santa Monica State Beach (49) Hostel Los Angeles/Santa Monica (50) Santa Monica Municipal Pier (51) Crescent Bay Park (52) Venice City Beach (53) Venice Fishing Pier (54)Venice Beach Cotel (?) (55) Venice Beach Hostel (56) Canal Park (57) Hostel California (58) Ballona Lagoon Walkway (59) Marina del Rey Harbor (60) Audrey E. Austin Jr. Memorial Park (61) Mother’s Beach (62) Promenade Walkway (63) Admirally Park (64) Burton Chace Park (65) Fisherman’s Village (66) Marina del Rey Bike Path (67) Del Rey Lagoon Park (68) Dockweller State Beach (69) Vista del Mar Park (70) El Segundo Beach (71) El Porto Beach (72) Parque Culiacan (73) Manhattan County Beach (74) Manhattan Beach Municipal Pier (75) Hermosa City Beach (76) Hermosa Beach Municipal Pier (77) Los Angeles Surf City Hostel (78) King Harbor (79) Seaside Lagoon (80) Redondo Sportfishing Pier (81) Plaza Park (82) Redondo Beach Municipal Pier (83) Monstad Pier (84) Veterans Park (85) Redondo County Beach (86) Blufftop Walkway (87) Torrance County Beach (88) Palos Verdes Estates Shoreline
Preserve (89) Malaga Cove (90) Path to Bluff Cove (91) Overlook to Bluff Cove (92) Point Vincente Park (93) Point Vincente Fishing Access (94) Long Point (95) Frank A. Vanderlip, Sr. Park (96) Abalone Cove Beach (97) Ocean Trails (98) Royal Palms County Beach (99) Friendship Community Regional Park
(100) Point Fermin Park and Lighthouse
State Water Resources Control Board Clean Water Act Section 312(f) Application
Page 73 of 92
Los Angeles County (101) Angels Gate Park (102) Hostel Los Angeles South Bay (103) Lookout Point Park (104) Cabrillo Beach (105) Cabrillo Fishing Pier (106) Cabrillo Marine Aquarium (107) Ports O’Call Village and Whalers Wharf
(108) John S. Gibson, Jr. Park
(109) Los Angeles Harbor (110) Catalina Terminal (111) Long Beach Harbor (112) Queen Mary (113) South Shore Public Boat Launch (114) Queensway Bay (115) Rainbow Harbor (116) Aquarium of the Pacific (117) Shoreline Park (118) Terminals for Catalina Island Boat
Service (119) Downtown Shoreline Marina (120) Long Beach City Beach (121) Bixby Park (122) Bluff Park (123) Belmont Park (124) Belmont Plaza Olympic Pool (125) Alamitos Peninsula (126) Alamitos Bay (127) Alamitos Bay Marina (128) Naples (129) Marine Park (130) Marine Stadium (131) Colorado Lagoon (132) San Gabriel River Bikeway (133) Hamilton Cove (134) Descariso Beach (135) Avalon Bay (136) Crescent Beach (137) Hermit Gulch Campground (138) Toyon Junction (139) Black Jack Campground (140) Two Harbors Campground (141) Parson’s Landing Campground (142) Two Harbors (Isthmus) (143) Little Harbor Campground (144) Ben Weston Beach
Orange County
(1) Seal Beach (2) Seal Beach Pier (3) Surfside Beach (4) Sunset Beach (5) Huntington Harbour (6) Trinidad Island (7) Sunset Aquatic Marina (8) Bolsa Chica State Beach (9) Colonial Inn Hostel (10) Huntington Beach International
Surfing Museum (11) Huntington Beach Pier (12) Huntington City Beach (13) Huntington State Beach (14) Huntington Beach Wetlands (Talbert
Marsh) (15) Santa Ana River Trail (16) Newport Dunes Resort (17) Upper Newport Bay Ecological Reserve
(18) Bayside Drive County Beach
(19) China Cove Beach (20) Rocky Point (21) Corona Del Mar State Beach (22) Little Corona Del Mar Beach (23) Crystal Cove State Park (24) Santa Ana River Mouth Beach (25) Newport Beach and Pier (26) Newport Harbor (27) Balboa Beach and Pier (28) West Jetty View Park (29) Balboa Pavilion (30) Balboa Island
State Water Resources Control Board Clean Water Act Section 312(f) Application
Page 74 of 92
Orange County (31) Newport Harbor Beaches (32) Crescent Bay Point Park (33) Northern Laguna Beaches (34) Heisler Park (35) Friends of the Sea Lion Marine Mammal Center
(36) Main Beach
(37) Southern Laguna Beaches (38) Ruby Street Park (39) Treasure Island Beach and Blufftop Park
(40) Aliso Beach
(41) Camel Point and West Street Beaches (42) Table Rock Beach (43) 1000 Steps (44) Salt Creek Beach Park (45) Three Arch Cove Beach (46) Ken Sampson Lookout (47) Heritage Park (48) Lantern Bay Park (49) Dana Point Harbor (50) Doheny State Beach (51) Louise Leyden Park (52) Capistrano Beach Park (53) Poche Beach (54) Ole Hanson Beach Club (55) San Clemente City Beach (56) Linda Lane City Park (57) San Clemente Municipal Pier (58) Leslie Park (59) San Clemente State Beach
San Diego County
(1) San Onofre State Beach (North) (2) San Onofre State Beach (South) (3) Bike Path (4) Las Flores Viewpoint (5) Camp Pendleton Beach Access (6) Aliso Creek Roadside Rest (7) Oceanside Harbor (8) Harbor Bach (9) Oceanside City Beach (10) Oceanside Pier (11) California Surf Museum (12) Linear Park (13) Buccaneer Park (14) South Oceanside Beach (15) Buena Vista Lagoon Ecological Reserve
(16) Maxton Brown Park
(17) Carlsbad City Park (18) Carlsbad State Beach (19) Agua Hedionda Lagoon (20) Encina Fishing Area (21) Overlook (22) South Carlsbad State Beach (23) Beacon’s Beach (24) Encinitas Beach (25) Stone Steps Beach (26) Moonlight Beach (27) D. Street Viewpoint (28) Viewpoint Parks (29) Self-Realization Fellowship Hermitage Grounds
(30) Swami’s
(31) San Elijo State Beach (32) Vista Point (33) Cardiff State Beach (34) Tide Beach Park (35) Fletcher Cove Park (36) Overlooks (37) Stairway to Beach (Seascape Surf) (38) Stairway to Beach (Del Mar Shores
Terrace) (39) Overlook (40) Del Mar Bluffs City Park (41) Del Mar City Beach (42) Powerhouse Park (43) Seagrove Park (44) Torrey Pines State Beach
State Water Resources Control Board Clean Water Act Section 312(f) Application
Page 75 of 92
San Diego County (45) Torrey Pines State Reserve Extension (46) Torrey Pines State Reserve (47) Torrey Pines City Park (48) Torrey Pines City Beach (Black’s
Beach) (49) Overlook (50) Scripps Beach and Tidepools (51) Scripps Institution of Oceanography (52) Underwater Reserves (53) La Jolia Shores Beach-Kellogg Park (54) Walkway to Beach (55) Coast Walk (56) La Jolia Cove (57) Ellen Scripps Park (58) Children’s Pool Beach (59) Coast Boulevard Park (60) Nicholson Point Park (61) Marine Street Beach (62) Windansea Beach (63) La Jolla Strand Park (64) Hermosa Terrace Park (65) Overlook and Stairs (66) La Jolla Hermosa Park (67) Bird Rock (68) Sun Gold Point (69) Calumet Park (70) Tourmaline Surfing Park (71) Palisades Park (72) Pacific Beach Park (73) Mission Beach Park (74) Mission Beach Hostel (75) Bonita Cove (76) Ventura Cove (77) Mission Bay Sports Center (78) Santa Clara Point and El Carmel
Point (79) Sail Bay and Rivera Shores (80) Crown Point Shores (81) Vacation Isle and Ski Beach (82) Dana Landing and Quivira Basin (83) Sea World (84) Fiesta Island (85) East Shore (86) De Anza Cove (87) Robb Field and Playground (88) Dog Beach (89) Ocean Beach Park (90) Ocean Beach Municipal Fishing Pier (91) Ocean Beach City Beach (92) Sunset Cliffs Park (93) Elliott (Point Loma) International Youth Hostel
(94) Commercial Basin
(95) Shelter Island Yacht Basin (96) Shelter Island (97) La Playa (98) Cabrillo National Monument (99) Point Loma Ecological Reserve (100) Spanish Landing Park (101) Harbor Island (102) Embarcadero (103) Maritime Museum (104) Broadway Pier (105) G Street Pier (106) Embarcadero Marina Park (107) San Diego Hostel International (108) Bay View Park (109) Harbor View Park (110) Centennial Park (111) Coronado Tidelands Regional Park (112) Coronado Municipal Golf Course (113) Glorietta Bay Marina (114) Glorietta Bay Park (115) Coronado City Beach (116) Coronado Shores Beach (117) L.M. “Pep” Pepper Park (118) Sweetwater Marsh National
Wildlife Refuge (119) Chula Vista Launching Ramp (120) Cays Parks (121) Silver Strand State Beach (122) South Bay Marine Biological Study
Area
State Water Resources Control Board Clean Water Act Section 312(f) Application
Page 76 of 92
San Diego County (123) Bike Path (124) Imperial Beach (125) Tijuana River National Estuarine Research Reserve
(126) Dairy Mart Ponds
(127) Border Field State Park
Appendix 2 – Drinking Water Intakes
EXISTING PLANTS (1) Chevron Gaviota Oil and Gas Processing Plant
(6) Proposed Hotel/Conference Sterling Center, Sand City
(2) City of Morro Bay (7) SCE, Santa Catalina Island (3) City of Santa Barbara (8) PG&E Diablo Canyon Power Plant (4) Department of Parks & Recreation, Hearst San Simeon State Historical Monument
(9) PG&E Morro Bay Power Plant
(5) Monterey Bay Aquarium (10) U.S. Navy, San Nicolas Island
PROPOSED PLANTS (1) Alameda County Water District (11) Marina Coast Water District (2) Cambria Community Service District (12) Mendocino County Property Owners (3) Channel Islands Beach Community Services District
(13) Metropolitan Water District of Southern California
(4) City of Buenaventura (14) Monterey Peninsula Water Management District
(5) City of Fort Bragg (15) North Coast County Water District (6) City of Goleta (16) Orange County Water District
(7) City of Lompoc (17) Sands of Monterey Development/Sand City
(8) City of San Luis Obispo (18) San Diego County Water Authority
(9) Los Angeles Department of Water and Power
(19) U.S. Navy, North Island Naval Air Station & 32nd Street Naval Station, San Diego
(10) Marin Municipal Water District
State Water Resources Control Board Clean Water Act Section 312(f) Application
Page 77 of 92
Appendix 3 – Aquatic Sanctuaries
International Biosphere Reserves (1) Central California Coast Biosphere Reserve (2) Channel Islands Biosphere Reserve
National Marine Sanctuaries (1) Channel Islands National Marine Sanctuary
(3) Gulf of the Farallones National Marine Sanctuary
(2) Cordell Bank National Marine Sanctuary
(4) Monterey Bay National Marine Sanctuary
National Monuments The California Coastal National Monument
Conservation Zones Klamath River Salmon Conservation Zone
Coastal Sanctuaries The California Coastal Sanctuary (all State waters subject to tidal influence and out to 3 miles offshore)
State Water Resources Control Board Clean Water Act Section 312(f) Application
Page 78 of 92
State of California Department of Fish & Game Marine Protected Areas (1) Punta Gorda State Marine Reserve (42) Harris Point State Marine Reserve (2) Point Cabrillo State Marine Conservation Are (43) South Point State Marine Reserve (3) MacKerricher State Marine Conservation Area (44) Carrington Point State Marine Reserve (4) Russian Gulch State Marine Conservation Area (45) Skunk Point State Marine Reserve (5) Van Damme State Marine Conservation Area (46) Gull Island State Marine Reserve (6) Manchester and Arena Rock State Marine Conservation Area
(47) Scorpion State Marine Reserve
(7) Bodega State Marine Reserve (48) Santa Cruz Island State Marine Reserve (8) Gerstle Cove State Marine Conservation Area (49) Painted Cave State Marine Conservation Area (9) Del Mar Landing State Marine Park (50) Goleta Slough State Marine Park (10) Fort Ross State Marine Conservation Area (51) Refugio State Marine Conservation Area (11) Sonoma Coast State Marine Conservation Area (52) Anacapa State Marine Reserve (12) Salt Point State Marine Conservation Area (53) Big Sycamore Canyon State Marine Conservation
Area (13) Fagan Marsh State Marine Park (54) Catalina Marine Science Center State Marine
Reserve (14) Point Reyes Headlands State Marine Conservation Area
(55) Lovers Cove State Marine Conservation Area
(15) Estero de Limantour State Marine Conservation Area
(56) Abalone Cove State Marine Park
(16) Tomales Bay State Marine Park (57) Arrow Point to Lions Head Point Invertebrate Area (17) Corte Madera Marsh State Marine Park (58) Farnsworth Bank State Marine Conservation Area (18) Marin Islands State Marine Park (59) Point Fermin State Marine Park (19) Duxbury Reef State Marine Conservation Area (60) Heisler Park State Marine Reserve (20) Farallon Islands State Marine Conservation Area (61) Crystal Cove State Marine Conservation Area (21) Petonia Slough State Marine Park (62) Doheny State Marine Conservation Area (22) Robert W. Crown State Marine Conservation Area (63) Doheny State Marine Conservation Area (23) Albany Mudflats State Marine Park (64) Dana Point State Marine Park (24) Redwood Shores State Marine Park (65) Robert E. Badham State Marine Park (25) Bair Island State Marine Park (66) Irvine Coast State Marine Park (26) Ano Nuevo Invertebrate Area (67) Laguna Beach State Marine Park (27) James V. Fitzgerald State Marine Park (68) Irvine Coast State Marine Park (28) Hopkins State Marine Reserve (69) Niguel State Marine Park (29) Point Lobos State Marine Reserve (70) Doheny State Marine Park (30) Big Creek State Marine Reserve (71) Upper Newport Bay State Marine Park (31) Elkhorn Slough State Marine Reserve (72) Agua Hedionda Lagoon State Marine Reserve (32) Carmel Bay State Marine Conservation Area (73) La Jolla State Marine Conservation Area (33) Pacific Grove State Marine Conservation Area (74) Buena Vista Lagoon State Marine Park (34) Julia Pfeiffer Burns State Marine Conservation Area
(75) Batiquitos Lagoon State Marine Park
(35) Pismo State Marine Conservation Area (76) San Elijo Lagoon State Marine Park (36) Morro Beach State Marine Conservation Area (77) San Dieguito Lagoon State Marine Park (37) Pismo-Oceano Beach State Marine Conservation Area
(78) Encinitas State Marine Conservation Area
(38) Atascadero Beach State Marine Conservation Area (79) San Diego-Scripps State Marine Conservation Area
(39) Vandenberg State Marine Reserve (80) Mia J. Tegner State Marine Conservation Area (40)Richardson Rock State Marine Reserve (81) Cardiff and San Elijo State Marine Conservation
Area (41) Judith Rock State Marine Reserve
State Water Resources Control Board Clean Water Act Section 312(f) Application
Page 79 of 92
State Water Quality Protection Areas (1) Redwoods National Park ASBS (18) Point Lobos ASBS (2) Trinidad Head ASBS (19) Julia Pfeiffer Burns ASBS (3) Kings Range ASBS (20) Salmon Creek Coast ASBS
(4) Jughandle Cove ASBS (21) San Miguel, Santa Rosa, and Santa Cruz Islands ASBS
(5) Saunders Reef ASBS (22) Santa Barbara & Anacapa Islands ASBS
(6) Del Mar Landing ASBS (23) Laguna Point to Latigo Point ASBS
(7) Gerstle Cove ASBS (24) San Nicolas Island & Begg Rock ASBS
(8) Bodega ASBS (25) Northwest Santa Catalina Island ASBS
(9) Bird Rock ASBS (26) Western Santa Catalina Island ASBS (10) Point Reyes Headland ASBS (27) Farnsworth Bank ASBS
(11) Double Point ASBS (28) Southeast Santa Catalina Island ASBS
(12) Duxbury Reef ASBS (29) Robert E. Badham ASBS (13) Farallon Islands ASBS (30) Irvine Coast ASBS (14) James V. Fitzgerald ASBS (31) Heisler Park ASBS (15) Ano Nuevo ASBS (32) San Clemente Island ASBS (16) Pacific Grove ASBS (33)San Diego-Scripps ASBS (17) Carmel Bay ASBS (34) La Jolla ASBS
Ecological Reserves
(1) Del Mar Landing Ecological Reserve (6) Santa Barbara Island Ecological Reserve
(2) Carmel Bay Ecological Reserve (7) Abalone Cove Ecological Reserve (3) Point Lobos Ecological Reserve (8) Farnsworth Bank Ecological Reserve (4) San Miguel Island Ecological Reserve (9) Heisler Park Ecological Reserve
(5) Anacapa Island Ecological Reserve (10) San Diego-La Jolla Ecological Reserve
(1) King Range (Punta Gorda) MRPA Ecological Reserve
(3) Vandenberg MRPA Ecological Reserve
(2) Big Creek MRPA Ecological Reserve (4) Big Sycamore Canyon MRPA Ecological Reserve
State Refuges
(1) Bodega Marine Life Refuge (11) Catalina Marine Science Center Marine Life Refuge
(2) Farallon Islands Game Refuge (12) Newport Beach Marine Life Refuge (3) James V. Fitzgerald Marine Reserve (Marine Life Refuge) (13) Irvine Coast Marine Life Refuge
State Water Resources Control Board Clean Water Act Section 312(f) Application
Page 80 of 92
State Refuges (4) Hopkins Marine Life Refuge (14) Laguna Beach Marine Life Refuge (5) Pacific Grove Marine Gardens Fish Refuge
(15) South Laguna Beach Marine Life Refuge
(6) California Sea Otter Game Refuge (16) Niguel Marine Life Refuge (7) Atascadero Beach Pismo Clam Preserve (17) Dana Point Marine Life Refuge
(8) Morro Beach Pismo Clam Refuge (18) Doheny Beach Marine Life Refuge (9) Pismo-Oceano Beach Pismo Clam Preserve (Clam Refuge) (19) City of Encinitas Marine Life Refuge
(10) Point Fermin Marine Life Refuge (20) San Diego Marine Life Refuge
National Parks, Monuments, Research Natural Areas, Seashores, and Recreation Areas
(1) Redwood National Park (4) Golden Gate National Recreation Area
(2) Point Reyes National Seashore (5) Channel Islands National Park (3) Point Reyes Headlands National Research Natural Area (6) Cabrillo National Monument
State & Local Underwater Parks, Recreation Areas, & Natural Preserves
(1) MacKerricher State Park (Underwater Park)
(8) Sonoma Coast State Beach (Underwater Park)
(2) Russian Gulch State Park (Underwater Park)
(9) Sonoma Coast State Beach (Underwater Park)
(3) Van Damme State Park (Underwater Park)
(10) Julia Pfeiffer Burns State Park (Underwater Park)
(4) Manchester State Park (Underwater Park)
(11) Crystal Cove State Park (Underwater Park)
(5) Arena Rock Marine Natural Preserve (12) Doheny State Beach (Underwater Park)
(6) Salt Point State Park (Underwater Park)
(13) Cardiff and san Elijo State Beaches (Underwater Park)
(7) Fort Ross State Historic Park (Underwater Park)
(14) San Diego-La Jolla City Underwater Park
State Reserves
(1) Point Lobos Reserve (5) Duxbury Reef Reserve (2) Point Cabrillo Reserve (6) Pismo Invertebrate Reserve
(3) Gerstle Cove Reserve (7) Lovers’ Cove Reserve, Santa Catalina Island
(4) Point Reyes Headlands Reserve (8) Point Loma Reserve
State Water Resources Control Board Clean Water Act Section 312(f) Application
Page 81 of 92
University of California Natural Reserves (1) Scripps Coastal Reserve (6) Coal Oil Point Natural Reserve (2) Bodega Marine Reserve (7) Carpinteria Salt Marsh Reserve
(3) Younger Lagoon Reserve (8) San Joaquin Freshwater Marsh Reserve
(4) Fort Ord Natural Reserve (9) Kendall-Frost Mission Bay Marsh Reserve
(5) Kenneth S. Norris Rancho Marino Reserve
Private Nature Reserves
Santa Cruz Island Reserve (The Nature Conservancy)
National Ecological Preserves Santa Barbara Channel Ecological Preserve
National Estuarine Research Reserve
San Francisco Bay National Estuarine Research Reserve
Appendix 4 – Areas of Intensive Boating Activities
Department of Boating & Waterways (Coastal) Regions Boating Region Number of Vessels Registered
in Region Number of Marinas
North Coast 34,643 19 San Francisco Bay Area 158,223 140
Central Coast 30,617 15 South Coast 245,380 86 San Diego 68,231 50 Sacramento Basin 160,490 111
State Water Resources Control Board Clean Water Act Section 312(f) Application
Page 82 of 92
Appendix 5
State Water Resources Control Board Clean Water Act Section 312(f) Application
Page 83 of 92
State Water Resources Control Board Clean Water Act Section 312(f) Application
Page 84 of 92
State Water Resources Control Board Clean Water Act Section 312(f) Application
Page 85 of 92
State Water Resources Control Board Clean Water Act Section 312(f) Application
Page 86 of 92
State Water Resources Control Board Clean Water Act Section 312(f) Application
Page 87 of 92
State Water Resources Control Board Clean Water Act Section 312(f) Application
Page 88 of 92
State Water Resources Control Board Clean Water Act Section 312(f) Application
Page 89 of 92
State Water Resources Control Board Clean Water Act Section 312(f) Application
Page 90 of 92
State Water Resources Control Board Clean Water Act Section 312(f) Application
Page 91 of 92
State Water Resources Control Board Clean Water Act Section 312(f) Application