Statewide Assessment of Drinking Water Facilities and Service Areas Current and Future Need 2020-2025 Delaware Department of Natural Resources and Environmental Control Prepared by: 240 Continental Drive, Suite 200 | Newark, Delaware and 10306 Eaton Place, Suite 340 | Fairfax, Virginia
Transcript
Statewide Assessment of Drinking Water Facilities and Service AreasCurrent and Future Need2020-2025Delaware Department of Natural Resources and Environmental Control
Prepared by:
240 Continental Drive, Suite 200 | Newark, Delaware and
10306 Eaton Place, Suite 340 | Fairfax, Virginia
Assessment of Drinking Water Facilities and
Service Areas Current and Future Needs
2020 - 2025
Tetra Tech, Inc.
240 Continental Drive, Suite 200 Newark, DE
and
10306 Eaton Place, Suite 340 Fairfax, VA
January 2020
Assessment of Drinking Water Facilities and Service Areas January 2020
i
Table of Contents
Tables ........................................................................................................................................................... ix
Figures .......................................................................................................................................................... xi
Acronyms and Abbreviations ...................................................................................................................... xii
Executive Summary ..................................................................................................................................... xiv
1. Report Purpose, Methodology and Background .................................................................................. 1
Data Gaps .............................................................................................................................................. 2
Data Analysis ......................................................................................................................................... 3
Drinking Water Infrastructure Overview and Definitions ..................................................................... 3
Federally-Mandated Drinking Water Regulations ................................................................................ 5
Delaware Drinking Water Programs and Regulation ............................................................................ 7
Funding for Drinking Water Facilities ................................................................................................... 8
Organization of the Report ................................................................................................................... 9
2. Statewide Drinking Water System Overview ...................................................................................... 11
Service Coverage ..................................................................................................................................... 11
Supply and Treatment ............................................................................................................................. 11
Groundwater-Sourced Systems .......................................................................................................... 12
Surface Water Sourced Systems ......................................................................................................... 15
Water Distribution .................................................................................................................................. 16
Storage Tanks and Booster Stations ................................................................................................... 16
Distribution Piping .............................................................................................................................. 17
Capital Plans ........................................................................................................................................ 20
3. Facilities in New Castle County ........................................................................................................... 21
New Castle County Overview .................................................................................................................. 21
Delaware City .......................................................................................................................................... 22
Supply and Treatment ......................................................................................................................... 23
Distribution ......................................................................................................................................... 23
Supply and Treatment ......................................................................................................................... 24
Distribution ......................................................................................................................................... 25
New Castle .............................................................................................................................................. 26
Supply and Treatment ......................................................................................................................... 26
Distribution ......................................................................................................................................... 27
Supply and Treatment ......................................................................................................................... 29
Distribution ......................................................................................................................................... 30
Supply and Treatment ......................................................................................................................... 32
Distribution ......................................................................................................................................... 33
4. Facilities in Kent .................................................................................................................................. 36
Kent Overview ......................................................................................................................................... 36
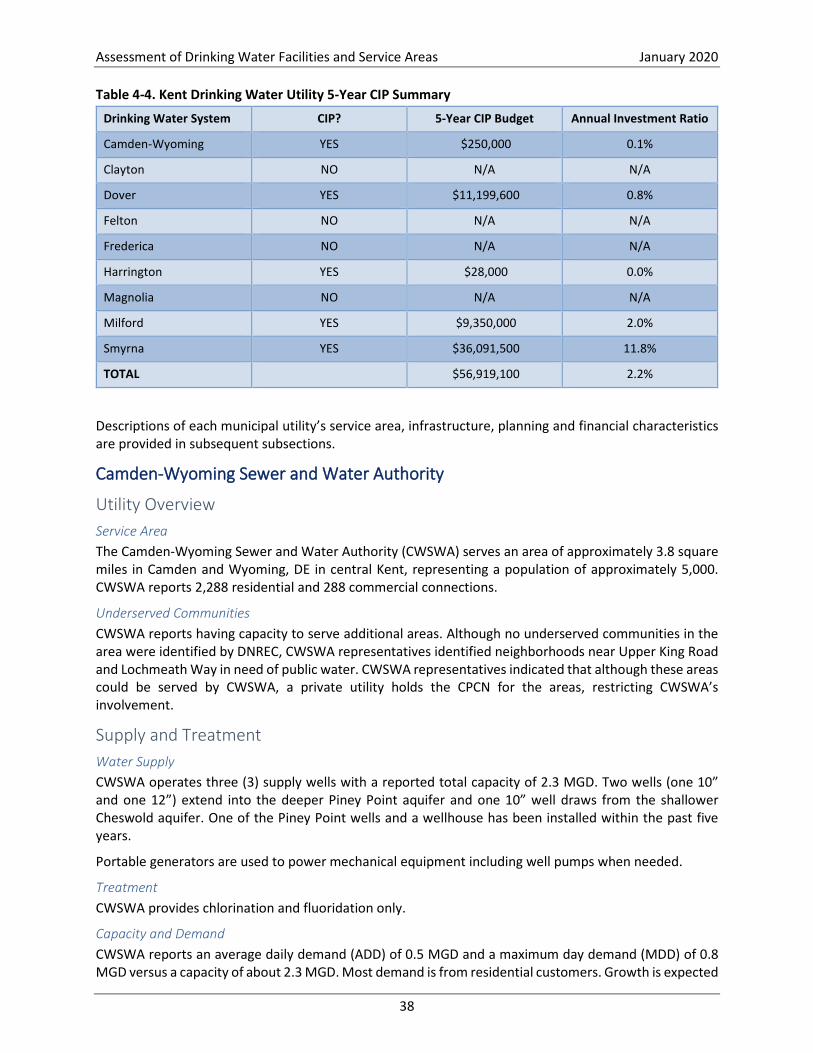
Camden-Wyoming Sewer and Water Authority ..................................................................................... 38
Assessment of Drinking Water Facilities and Service Areas January 2020
iii
Supply and Treatment ......................................................................................................................... 38
Distribution ......................................................................................................................................... 39
Supply and Treatment ......................................................................................................................... 40
Distribution ......................................................................................................................................... 41
Supply and Treatment ......................................................................................................................... 42
Distribution ......................................................................................................................................... 43
Supply and Treatment ......................................................................................................................... 45
Distribution ......................................................................................................................................... 46
Supply and Treatment ......................................................................................................................... 47
Distribution ......................................................................................................................................... 48
Supply and Treatment ......................................................................................................................... 49
Distribution ......................................................................................................................................... 50
Supply and Treatment ......................................................................................................................... 51
Distribution ......................................................................................................................................... 52
Supply and Treatment ......................................................................................................................... 53
Distribution ......................................................................................................................................... 54
Supply and Treatment ......................................................................................................................... 56
Distribution ......................................................................................................................................... 57
Supply and Treatment ......................................................................................................................... 62
Distribution ......................................................................................................................................... 63
Supply and Treatment ......................................................................................................................... 64
Distribution ......................................................................................................................................... 64
Supply and Treatment ......................................................................................................................... 66
Distribution ......................................................................................................................................... 66
Supply and Treatment ......................................................................................................................... 68
Distribution ......................................................................................................................................... 69
Supply and Treatment ......................................................................................................................... 70
Distribution ......................................................................................................................................... 70
Supply and Treatment ......................................................................................................................... 72
Distribution ......................................................................................................................................... 72
Supply and Treatment ......................................................................................................................... 74
Distribution ......................................................................................................................................... 74
Supply and Treatment ......................................................................................................................... 75
Distribution ......................................................................................................................................... 76
Supply and Treatment ......................................................................................................................... 77
Distribution ......................................................................................................................................... 78
Supply and Treatment ......................................................................................................................... 79
Distribution ......................................................................................................................................... 79
Supply and Treatment ......................................................................................................................... 81
Distribution ......................................................................................................................................... 81
Assessment of Drinking Water Facilities and Service Areas January 2020
Supply and Treatment ......................................................................................................................... 83
Distribution ......................................................................................................................................... 83
Supply and Treatment ......................................................................................................................... 85
Distribution ......................................................................................................................................... 86
Supply and Treatment ......................................................................................................................... 88
Distribution ......................................................................................................................................... 88
Supply and Treatment ......................................................................................................................... 90
Distribution ......................................................................................................................................... 90
Supply and Treatment ......................................................................................................................... 92
Distribution ......................................................................................................................................... 92
Supply and Treatment ......................................................................................................................... 94
Distribution ......................................................................................................................................... 95
Assessment of Drinking Water Facilities and Service Areas January 2020
vii
Supply and Treatment ......................................................................................................................... 97
Distribution ......................................................................................................................................... 97
Supply and Treatment ....................................................................................................................... 100
Distribution ....................................................................................................................................... 101
Supply and Treatment ....................................................................................................................... 102
Distribution ....................................................................................................................................... 103
Supply and Treatment ....................................................................................................................... 104
Distribution ....................................................................................................................................... 104
Supply and Treatment ....................................................................................................................... 105
Distribution ....................................................................................................................................... 106
7. Conclusions and Recommendations ................................................................................................. 109
Service Coverage ................................................................................................................................... 109
Supply and Treatment ........................................................................................................................... 109
Water Supply ..................................................................................................................................... 109
Drinking Water Treatment ................................................................................................................ 110
Water Distribution ................................................................................................................................ 110
Table 2-4. Groundwater Treatment Process Summary by County ............................................................14
Table 2-5. Groundwater Treatment Process Summary by Process ...........................................................14
Table 2-6. Surface Water Withdrawal Summary .......................................................................................16
Table 2-7. Storage Tank Summary .............................................................................................................16
Table 2-8. Distribution Piping Summary (all units in miles of pipe) ...........................................................17
Table 2-9. Utility Asset Management Summary (all units in percentage of utilities) ................................18
Table 2-10. Estimated Present-Worth Replacement Value of Drinking Water Assets ..............................19
Table 2-11. Summary of Affordability Metrics for Delaware Water Utilities ............................................20
Table 2-12. Summary of CIP Status and Budget for Delaware Water Utilities ..........................................20
Table 3-1. New Castle County Municipal Drinking Water Utility Characteristics ......................................21
Table 3-2. Affordability Metrics for New Castle County Water Providers .................................................21
Table 3-3. Estimated Present-Worth Replacement Value of New Castle County Municipal Drinking Water Assets ..............................................................................................................................22
Table 3-4. New Castle County Drinking Water Utility 5-Year CIP Summary ..............................................22
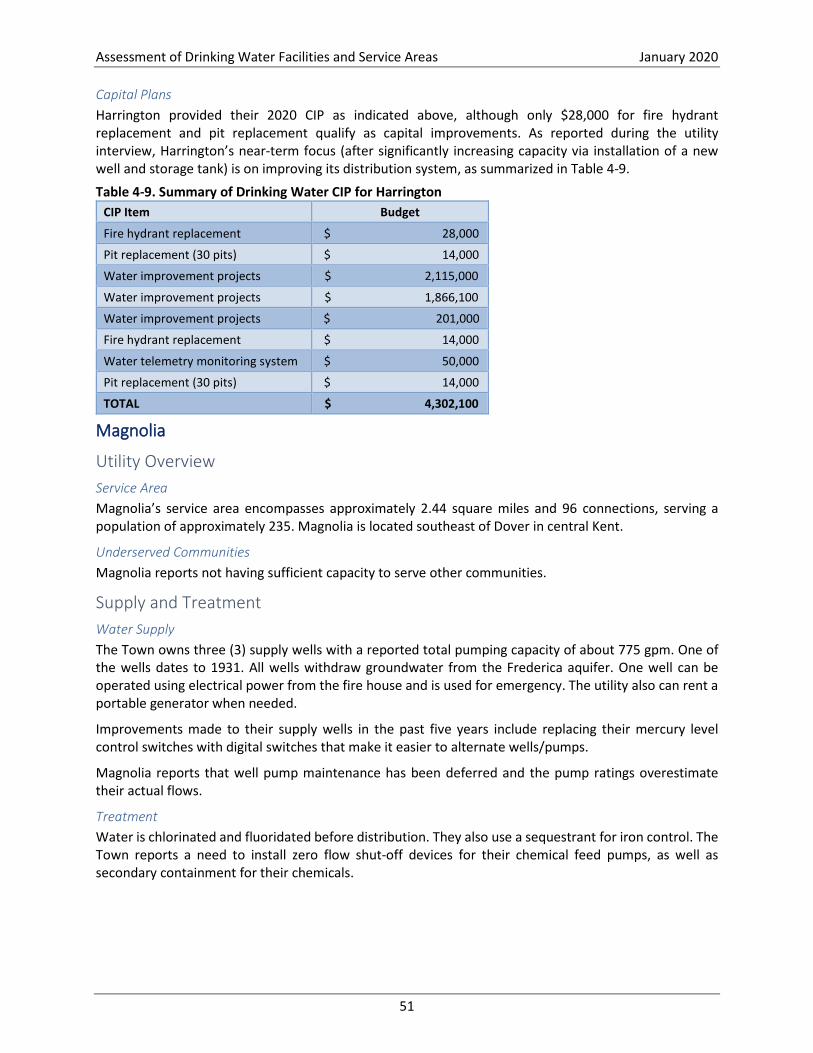
Table 3-5. Summary of Drinking Water CIP for Middletown .....................................................................25
Table 3-6. Summary of Drinking Water CIP for New Castle .......................................................................28
Table 3-7. Newark Water System Storage Facilities ..................................................................................30
Table 3-8. Newark Water System Pumps ..................................................................................................30
Table 3-9. Summary of Drinking Water CIP for the Newark ......................................................................32
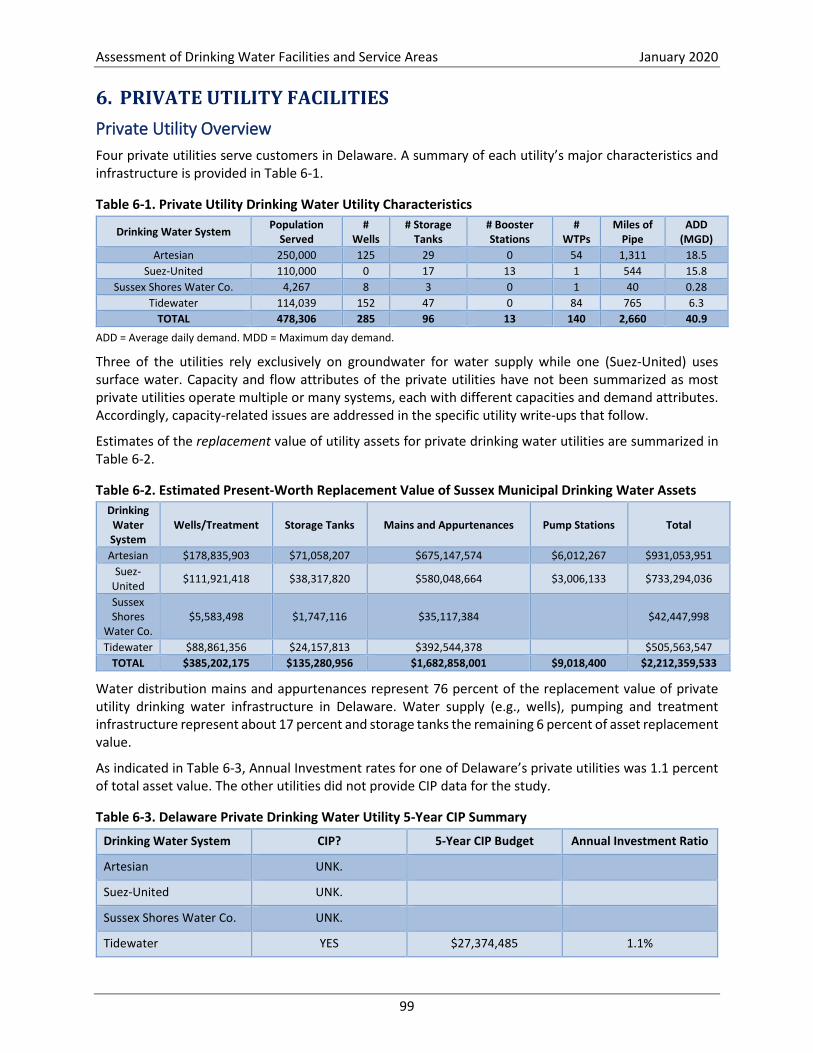
Table 6-4. Summary of Suez-United Distribution Piping Characteristics .................................................103
Table 6-5. Summary of Characteristics of Tidewater’s Largest Nine Systems .........................................106
Table 6-6. CIP Summary for Tidewater ....................................................................................................107
Assessment of Drinking Water Facilities and Service Areas January 2020
xi
FIGURES Figure 2-1. Status of Source Water Projection Ordinances for Drinking Water Systems in Delaware
(Delaware Source Water Protection Program, 2016) ................................................................15
Assessment of Drinking Water Facilities and Service Areas January 2020
xii
ACRONYMS AND ABBREVIATIONS ACP Asbestos Cement Pipe ADD Average Daily Demand AL Action Level BMP Best Management Practices CCR Consumer Confidence Reports CCTV Closed Circuit Television CIP Cast Iron Pipe CIP Capital Improvement Plan CCL Contaminant Candidate List CPCN Certificates of Public Convenience and Necessity CWSWA Camden-Wyoming Sewer and Water Authority DHSS Delaware Department of Health and Social Services DIP Ductile Iron Pipe DNREC Department of Natural Resources and Environmental Control DPH Division of Public Health DRBC Delaware River Basin Commission DWSRF Drinking Water State Revolving Fund EDUS Equivalent Dwelling Units EPA Environmental Protection Agency GAC Granular Activated Carbon GIS Geographical Information System GPD Gallons Per Day GPM Gallons Per Minute GPS Global Positioning Unit GSP Galvanized Steel Pipe HB House Bill IUP Intended Use Plan M Million MCL Maximum Contaminant Levels MDD Maximum Day Demand MG Million Gallons MGD Million Gallons Per Day MHI Median Household Income MSC Municipal Services Commission MTBE Methyl tert-butyl ether NGO Non-Governmental Organization NOI Notice of Intent NPDWR National Primary Drinking Water Regulations NRW Non-Revenue Water Or NRW NSDWR National Secondary Drinking Water Regulations PCE Perchloroethylene PDD Peak Daily Demand PER Preliminary Engineering Report PFAS Polyfluoroalkyl Substances PFOA Perfluorooctanoic Acid PLL Project Priority List PPM Parts Per Million PPT Parts Per Trillion
Assessment of Drinking Water Facilities and Service Areas January 2020
xiii
PSC Public Services Commission PSI Pounds Per Square Inch PVC Polyvinyl Chloride RLDWA Reduction of Lead in Drinking Water Act SCADA Supervisory Control and Data Acquisition SDWA Safe Drinking Water Act SMCL Secondary Maximum Contaminant Levels SRF State Revolving Fund SWAPP Source Water Assessment and Protection Program SWF South Well Field SWPA Source Water Protection Area TCE Trichloroethylene TMDL Total Maximum Daily Load TTHM Trihalomethanes UCMR Unregulated Contaminant Monitoring Rule UD University of Delaware UMCR Unregulated Contaminant Monitoring Rule UNC-EFC University of North Carolina Environmental Finance Center USDA-RD United States Department of Agriculture, Rural Development VOC Volatile Organic Compounds WEP Water and Environmental Programs WIAC Water Infrastructure Advisory Council WIFIA Water Infrastructure Finance and Innovation Act WTP Water Treatment Plant
Assessment of Drinking Water Facilities and Service Areas January 2020
xiv
EXECUTIVE SUMMARY A second Drinking Water Needs Assessment has been conducted for municipal and private drinking water utilities in Delaware. This report updates and supplements the initial Needs Assessment completed in February 2015.
Since the 2015 report, the State has initiated programs to meet previously-identified needs, including asset management program assistance (via grants), proactive lead abatement within distribution systems and planning for providing reliable drinking water service to currently underserved communities. Accordingly, numerous utilities reported making considerable progress in developing an asset management program and proactively removing lead-containing fittings from their distribution system. However, progress varies significantly among utilities with some being quite proactive and others having limited knowledge of asset management and lead abatement. Few municipal utilities, on the other hand, had made efforts to extend water service to underserved communities; however, this State effort is still in its initial stages.
In general, the overall landscape of water provision in Delaware is similar to that report in the 2015 Needs Assessment report. Groundwater is still the most important source of water, with only two (large) utilities using surface water. With regard to supply and treatment infrastructure, some utilities have upgraded their groundwater wells to rely on fewer, higher-capacity wells. Well redevelopment and supplementation (e.g., via new wells or system interconnections) and treatment system upgrades are ongoing efforts. In general, water availability does not appear to be a critical concern for Delaware utilities, as most are limited by treatment, storage or distribution capacity instead.
Distribution system piping (and related appurtenances) represent well over 80 percent (as measured by replacement value) of drinking water infrastructure in Delaware. The State’s Asset Management Grant program appears to be helping participating utilities become more proactive about maintaining and upgrading their distribution systems. Most utilities identified distribution piping maintenance and rehabilitation as their highest priority. Distribution system issues include lead-containing pipe/fitting abatement, aging/failing infrastructure, undersized piping (insufficient to meet required fire flows), dead-ends (causing water quality issues) and non-revenue water (NRW)/water loss. Most utilities did not demonstrate a clear understanding or appreciation of the impacts of NRW on their operations and the State’s Asset Management Grant program could benefit by a greater focus on water system auditing and loss reduction. Furthermore, many utilities in Delaware do not maintain proactive Capital Improvement Plans (CIPs), so translating asset management programs into capital planning and budgeting efforts should help utilities plan for focused investment where needed.
Finally, drinking water in Delaware appears to be priced affordably, based on gross metrics utilizing median household income (MHI). Nevertheless, MHI-based indicators tend to obscure affordability challenges, as those customers earning significantly less than the area-wide MHI may have trouble affording service. This is, of course, exacerbated in areas featuring a wide range of incomes and therefore should be considered on a utility-by-utility basis. Various pricing tools are available to help equalize cost impacts among users in different socioeconomic classes.
Assessment of Drinking Water Facilities and Service Areas January 2020
1
1. REPORT PURPOSE, METHODOLOGY AND BACKGROUND Purpose This Assessment of Drinking Water Facilities and Service Areas was commissioned by the Delaware Department of Health and Social Services (DHSS) Division of Public Health (DPH) in collaboration with the Department of Natural Resources and Environmental Control (DNREC) Environmental Finance group and the Water Infrastructure Advisory Council (WIAC). It is the second in a series of required, periodic water facility assessments (29 DE Code § 8011, 2018); the first having been completed in February 2015 (Kash Srinivasan Group, 2015). The purpose of this Needs Assessment is to assess water service and facilities at utility, county and state levels to identify the status of Delaware’s water supply, treatment and distribution systems from technical and economic perspectives. This report both updates the 2015 assessment and supplements the earlier assessment with additional information of interest to project stakeholders.
The report is intended to provide DPH, DNREC and the WIAC the information necessary to support local and statewide programs to improve the delivery of drinking water services in Delaware and maintain the high quality of water delivered to customers. The WIAC initiates, develops and recommends to the Delaware General Assembly projects and programs for the planning, construction, repair, renovation or expansion of drinking water facilities. The WIAC may use information in this report to provide guidance and policy advice to the Governor and Secretaries of DNREC, DHSS, and Finance, and to help develop funding options for capital and maintenance programs related to drinking water systems in Delaware.
In addition to identifying immediate, short-term and long-term drinking water needs, the report is intended to highlight trends and emerging issues with the goal of cost-effectively protecting human health in Delaware.
Methodology Like previous drinking water and clean water needs assessments in Delaware, research underlying this report relied primarily on direct inquiry of drinking water facility management and staff via survey, interviews and targeted information requests. These direct inquiries were supplemented using information extracted from previous needs assessment reports, other State of Delaware data collection efforts and other publicly-available sources of information.
The main steps used to collect relevant information and prepare this report include the following:
• Develop the survey questionnaire in collaboration with DNREC and DHSS
• Distribute survey questionnaires to management contacts at municipal and private drinking water utilities
• Receive and review survey responses
• Interview utility contacts to clarify and supplement survey responses
• Quality assure/control survey responses using notes prepared by all participating interviewers (with utility follow-up if/as necessary)
• Import survey data into an Excel based database
• Synthesize and analyze data and draft report
• Perform QA/QC checks on all source and processed data and report, with applicable follow-up
Assessment of Drinking Water Facilities and Service Areas January 2020
2
Survey The drinking water needs assessment survey was developed by Tetra Tech in collaboration with DNREC and DHSS. The survey was prepared and transmitted to utility contacts in “fillable .pdf” format to allow for automated extraction of entries into the Excel database.
The drinking water survey template is provided as Appendix A. The survey is subdivided into four thematic sections, as follows:
• General. Includes utility contact information and characteristics, along with interview documentation.
• Water Supply and Treatment Systems. Includes information about the water source, extraction infrastructure (e.g., wells, intakes), treatment facilities, capacity and demand, and treatment/water quality issues.
• Service Area and Distribution System. Includes information about the facility service area and distribution infrastructure (e.g., storage tanks, booster stations, piping, metering).
• Finance. Includes information about financial solvency and sustainability, fiscal management and affordability.
This topical breakdown is used to present much of the findings in subsequent sections of the report.
Interviews In most cases, completed surveys were returned by utility respondents prior to conducting the interviews; however, it should be noted that the completeness of survey responses varied greatly between utilities. Accordingly, the interviews served to normalize information resolution and completeness, although discrepancies between utilities still exist primarily due to differences in utility respondent capacity and resources.
At least two members of the consulting team participated in each interview; in most cases, three or more team members participated, each independently taking notes so that interview data could be better verified for quality control purposes. From the utility side, participation in interviews was generally left to the discretion of the utility contact (typically a manager) and varied from one to more than five participants. In multiple cases, interview subjects followed-up with staff not present during the interview for clarification or supplemental information.
Interview format was generally open and informal, broadly following the survey format, but allowing space for elaboration of issues unique to the utility.
Data Gaps Following the interview, the interviewers’ notes were compared and consolidated, discrepancies were resolved internally or upon further clarification with utility representatives, and the notes were used to supplement the raw surveys provided by the utilities. The “finalized” surveys were used for data analysis and reporting.
In addition to directly querying interviewees and requesting additional clarification or information, other publicly-available sources of information were used to supplement or complete data collection as applicable. These sources included, primarily, the 2015 Drinking Water Needs Assessment report, as well as Source Water Protection Plan reports, Consumer Confidence Reports (CCRs), State databases, and other source of information available from the utility (e.g., from its website).
The data presented herein represents the best available information meeting the resource constraints of the project, as well as stakeholder interest in not overly burdening utility respondents. Critical data gaps
Assessment of Drinking Water Facilities and Service Areas January 2020
3
that transcend a single utility respondent are identified in the Conclusions and Recommendations section, particularly where programmatic efforts at the State level can better fill these gaps for future assessments.
Data Analysis Although the survey (see Appendix A) and interview solicited quantitative data, the bulk of the information generated (and, it could be argued, the most valuable information) was qualitative in nature. Accordingly, the first step in data analysis (and presentation) was to distill the survey and interview data into summaries for each utility and/or system. These summaries constitute a major portion of the findings reflected in this report. Summaries for each utility are provided in the “county-level” sections of the report (i.e., Sections 3 through 6). Significant findings from the surveys are reflected in the appropriate sections of the utility summaries. To the extent practical and useful, qualitative information has been summarized semi-quantitatively to elucidate the prevalence of certain common findings among utilities (e.g., number of utilities using a certain technology).
Quantitative data are also summarized accordingly. These include, for example, water supply well characteristics, storage tank characteristics, capacities and water demand attributes and financial information including capital expenditure estimates, reserve account and debt limit figures and the like. Where practical and useful, these quantitative data are presented using subtotals (e.g., by utility and county) and totals (e.g., for the entire state). Other statistical measures are used where applicable although their practical significance is generally limited because of the type of data collected.
Background
Drinking Water Infrastructure Overview and Definitions As previously indicated, the surveys and interviews were used to solicit information from drinking water utilities about various characteristics of their drinking water enterprise, including drinking water supply, treatment and distribution assets and the utility’s service area and finances. For the purposes of this report, further subdivisions are described below, and descriptions of each are provided.
Utility Overview The Service Area describes the geographic area within which the utility provides drinking water services and other characteristics of the utility’s customers (e.g., numbers of different customer types).
Underserved Communities refer to geographic areas where residents lack both access to consistent, high-quality drinking water and the means (e.g., economic, organizational) to develop their own sustainable, affordable supply. In the context of this report, underserved communities are those for which project stakeholders seek to understand available options for drinking water service and the feasibility of those options. All utilities were asked about their capacity for and interest in serving unserved areas or underserved communities. Those utilities in proximity to underserved communities identified in advance by the project stakeholders were asked specifically about any efforts to extend service to them.
Supply and Treatment Water Supply describes a utility’s source(s) of water and means of extracting and delivering that water to the utility’s system. The two main water sources used by Delaware drinking water utilities are groundwater (from both shallow/surficial and deeper/confied aquifers) and fresh surface water. (Other sources not currently used by Delaware utilities include brackish or saltwater, and reclaimed wastewater via potable reuse.) Extraction methods include wells for groundwater sources and intake structures for surface waters (with or without a raw water reservoir or storage facility).
Treatment describes the physical, chemical and (in rare cases) biological processes used by the utility to make the water safe and palatable for human consumption and compatible with existing materials and water-using fixtures and appliances. Conventional surface water treatment typically consists of
Assessment of Drinking Water Facilities and Service Areas January 2020
4
coagulation, flocculation, clarification, filtration and disinfection steps. Required groundwater treatment varies depending on the water quality associated with the source water. In general, sources drawing from surficial, unconfined aquifers require more treatment, whereas sources drawing from deeper, confined aquifers may require minimal treatment (e.g., only chlorination, which is primarily for maintaining residual which prevents biological growth within the distribution network). Other groundwater treatment unit processes may include aeration, physical filtration, reactive media (e.g., Greensand) filtration, activated carbon adsorption, advanced oxidation, ion exchange and others. Many drinking water utilities also fluoridate their water to support proper development of teeth in adolescents and prevent dental caries among vulnerable populations within their service area.
Capacity and Demand are important for determining the suitability of the supply and treatment infrastructure to meet the needs of the utility’s customers now and in the future.
Capacity describes the practical throughput of the supply and treatment systems. Supply capacity relates to both the source (e.g., safe yield of the surface water body or aquifer recharge capacity) and extraction methodology (e.g., well pumping rates). Treatment capacity relates to the effective throughput of the unit processes employed. Treatment capacity is often limited by the smallest unit process within the system (although in some cases, partial treatment and blending of waters of different qualities is sufficient to meet finished water quality objectives). System “capacity” was typically self-reported by the utility and intended to refer to the limiting process within their system (e.g., well pumping rates versus treatment system capacities).
Demand broadly refers to the amount of water used or desired by the utility’s customers. However, “demand” can be defined in different ways that can have different implications on the operation of the system and its ability to meet customer water supply needs including such factors as adequate system water pressure at the tap, fire flows and water quality at all points within the distribution network. For this assessment, utilities were asked to provide at least their average daily demand (ADD) and peak daily demand (PDD). ADD is defined as the average daily water demand (which includes consumption as well as system losses and other non-revenue water or NRW) over the course of a year, while the PDD is defined as the maximum demand in a single day over the course of a year (this often corresponds to a summer day when irrigation demands are particularly high and seasonal occupancy may be high). Utilities were asked for other characteristics of their water demand, including demand by customer type (e.g., residential, commercial, industrial, institutional) and by use (e.g., system process water and unaccounted for water). Utilities were also asked to provide demand projections for 2020 and 2030. DNREC’s Water Allocation Program staff provided monthly flow data for calendar year 2018 to supplement utility-provided data when data was in question or incomplete.
Water Quality describes the physical, chemical and biological characteristics of the raw source water and, most importantly, the finished water. Source water quality should be addressed via treatment. Utilities were asked about any recent primary or secondary water quality standards exceedances as well as about other emerging contaminants (e.g., PFAS/PFOA) which may have been detected in their system.
Distribution Storage Tanks are used to hold sufficient water to meet customer demands while maintaining water quality and to pressurize the distribution network (for elevated water tanks or “towers” which represent most storage facilities in Delaware). Booster Stations provide another mechanism for directly supplying and pressurizing system at grade using pumps. Booster stations are relatively rare in Delaware.
Distribution Piping describes the network of water mains, laterals and service lines that convey water from treatment or storage facilities to customers. Mains and laterals are typically owned and controlled by the water utility, while service lines belong to the customer. However, service lines are still of importance to water utilities, since leaks in service lines affect demand and service line materials can contain contaminants like lead which are consumer health risks.
Assessment of Drinking Water Facilities and Service Areas January 2020
5
Asset Management broadly describes a formalized process for business enterprises to proactively inventory, assess the criticality of, understand the condition of, and maintain, repair or replace system assets (infrastructure and equipment). In the context of this report, utilities were asked to describe their asset management efforts, including whether they are participating in Delaware’s Drinking Water Asset Management Incentive Program, a five-year program where participants can receive funding to develop and implement asset management plans for their facilities.
Utilities were asked how much, if any, of their system was spatially located in GIS (they were also asked for a map of their service area). Utilities were also asked to provide estimates of non-revenue water (NRW, typically expressed as a percentage of total demand) and describe efforts to reduce NRW. For water and wastewater utilities, “asset management” generally focuses most on underground assets (e.g., distribution piping for drinking water systems), but can and should also address other asset types, such as wells, pumps, storage tanks and treatment systems.
Metering describes the use of mechanical equipment to generate measurements of water flows that can be used for billing customers and to develop a water balance for the system. Utilities were asked explicitly about customer metering (e.g., type, age, condition of water meters), although some utilities provided additional information about their district or main meters (i.e., those meters that measure water flow through a larger part of their distribution system).
System Controls refer to electronic systems for controlling mechanical equipment and, ideally, monitoring system conditions. Utilities were specifically asked if they had a Supervisory Control and Data Acquisition (SCADA) system and, if so, which of their equipment and facilities it controls and monitors. Those utilities not having a SCADA system often provided information about control systems for individual equipment.
Finances Revenue Generation refers to the ability of the utility to recover costs related to sustainable operation of the drinking water enterprise. Utilities were asked specifically whether their revenue was sufficient and for information about the utilities’ rate structures (customer charges being their main source of revenue).
Reserves refers to accounts set aside for specific activities related to the drinking water systems. Utilities were asked if they have reserve accounts and, if so, how (and how much) they were funded and whether use of reserve funds were restricted and, if so, how.
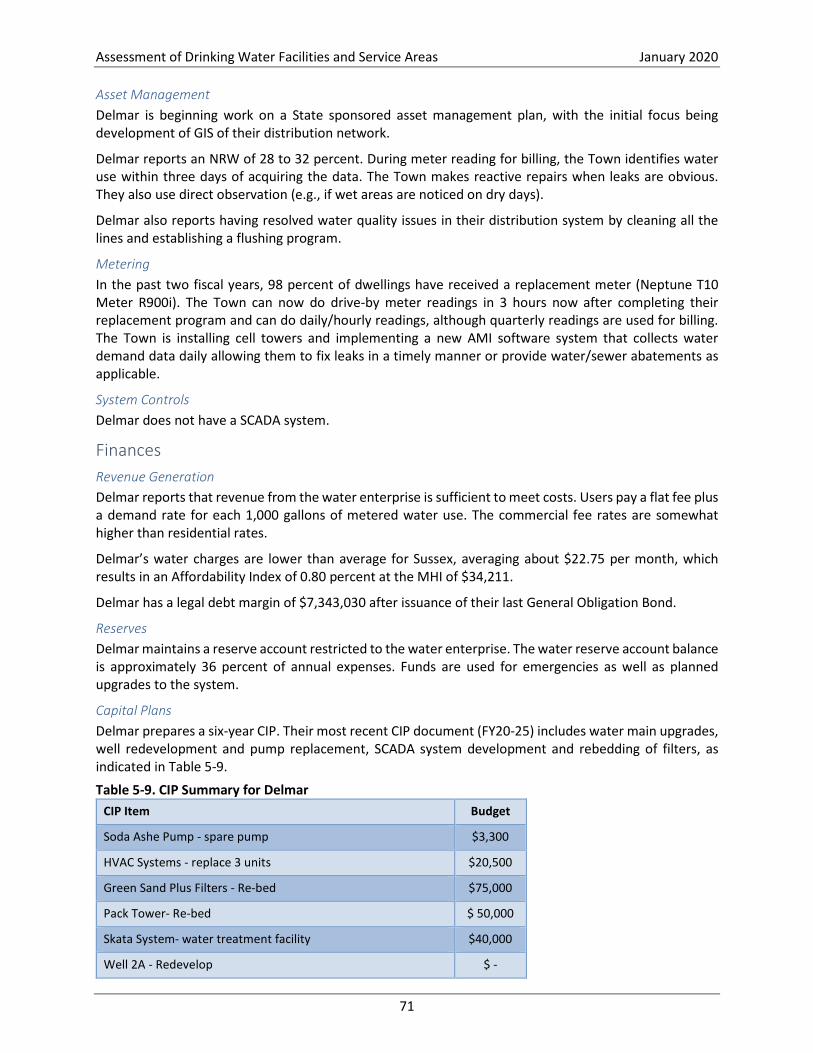
Capital Plans, in this context, relates to the process used by the utility to plan, fund and execute capital projects (e.g., a Capital Improvement Plan or CIP). Specifics about the utilities’ actual capital plans and projects are generally addressed in the sections about specific system components (e.g., supply, treatment, distribution).
Federally-Mandated Drinking Water Regulations The Safe Drinking Water Act (SDWA) is the federal law that protects public drinking water supplies in the United States. Under the SDWA, EPA sets standards for drinking water quality and with its partners implements various technical and financial programs to ensure drinking water safety.
Primary Drinking Water Standards Per EPA (2019), “The National Primary Drinking Water Regulations (NPDWR) are legally enforceable primary standards and treatment techniques that apply to public water systems. Primary standards and treatment techniques protect public health by limiting the levels of contaminants in drinking water.”
Standards are provided for the following classes of constituents1:
1 See https://www.epa.gov/ground-water-and-drinking-water/national-primary-drinking-water-regulations for full list of NPDWR standards
Assessment of Drinking Water Facilities and Service Areas January 2020
6
• Microorganisms
• Disinfectants
• Disinfection Byproducts
• Inorganic Chemicals
• Organic Chemicals
• Radionuclides
Drinking water standards are enforced by establishing maximum contaminant levels (MCLs), which are defined as the maximum allowable amount of a contaminant in drinking water which is delivered to the consumer. The NPDWR also requires drinking water utilities to prepare Consumer Confidence Reports (CCRs) and distribute the CCRs to their customers annually2.
EPA maintains a Contaminant Candidate List (CCL) of drinking water contaminants that are known or anticipated to occur in public water systems and are not currently regulated. The SDWA requires EPA to publish the CCL every five years and to make regulatory determinations for at least five contaminants on the CCL within five years after completion of the previous round of regulatory determinations.
Secondary Drinking Water Standards EPA has also established National Secondary Drinking Water Regulations (NSDWRs). NSDWRs are non-mandatory water quality standards for 15 contaminants 3, termed secondary maximum contaminant levels (SMCLs). SMCLs are intended to minimize aesthetic (e.g., taste and odor), cosmetic (e.g., discoloration) and technical (e.g., corrosivity, staining, scaling) effects; however, these secondary contaminants are not believed to threaten human health at the SMCL.
Lead and Copper Rule Lead and copper in drinking water typically occur because of corrosion of lead and copper containing piping materials. The Lead and Copper Rule4, originally promulgated in 1991, establishes action levels for lead and copper. Although exceeding the action level is not a violation per se, it can trigger additional monitoring, control, retrofit/replacement activities and public education. The Rule requires that public water systems monitor water using first draw samples at the tap at high-risk buildings every six months; the number of samples is based on system size. Systems may qualify for a reduced sampling frequency based on the results of previous monitoring. EPA has been considering significant revisions to the Lead and Copper Rule for several years.
In addition to system monitoring as required by the Lead and Copper Rule, Congress passed the Reduction of Lead in Drinking Water Act (RLDWA) in 2011, which establishes the most recent refinements to restrictions on using lead-containing materials in drinking water systems5; the original prohibitions date to 1986 amendments to the SDWA. Unregulated Contaminant Monitoring Rule (UCMR) The SDWA Amendments of 1996 require monitoring of up to 30 currently unregulated contaminants every five years. All drinking water systems serving more than 10,000 people are required to monitor;
2 See https://www.epa.gov/ccr/consumer-confidence-report-rule-and-rule-history-water-systems for more information 3 See https://www.epa.gov/dwstandardsregulations/secondary-drinking-water-standards-guidance-nuisance-chemicals for full list of NSDWRs 4 See https://www.epa.gov/dwreginfo/lead-and-copper-rule for more information 5 Refer to https://www.epa.gov/dwstandardsregulations/use-lead-free-pipes-fittings-fixtures-solder-and-flux-drinking-water for more information
Assessment of Drinking Water Facilities and Service Areas January 2020
7
representative samples from small public systems serving 10,000 or less people are also monitored with costs covered by EPA.
Delaware Drinking Water Programs and Regulation Drinking water in Delaware is regulated by both the DNREC Division of Water and the DHSS Division of Public Health.
Within DNREC’s Division of Water, the Water Supply Section administers programs related to source water assessment and protection, and water use and supply. The Water Supply Section issues permits for well construction and use and water allocation.
Within the DHSS Division of Public Health, the Office of Drinking Water enforces federal drinking water regulations and helps build capacity among Delaware’s public water utilities, while the Drinking Water State Revolving Fund (DWSRF) provides infrastructure improvement loans and grants to eligible water systems.
Permitting As implied above, public drinking water systems in Delaware require a Water Allocation Permit6 (issued by the Water Supply Section) for all withdrawals of more than 50,000 gallons per day from groundwater or surface water sources. Withdrawals of over 100,000 gallons per day within the Delaware River Basin also require approval by the Delaware River Basin Commission (DRBC). Groundwater sourced systems further require a permit for the construction and use of a water supply well7.
Water use data is collected by the Water Allocation Branch of the Water Supply Section. Permitted utilities record water production (for each well or intake) and usage on at least a monthly basis and report data to the Branch each year. Other information such as water levels, withdrawal rates, water transfers, and leak-related losses are also required to be reported.
Delaware’s Public Services Commission8 (PSC) was established in 1949 to regulate investor-owned public utilities and ensure safe, reliable and reasonably priced water services. The PSC regulates water service territories via Certificates of Public Convenience and Necessity (CPCN) for most water utilities in the state and it regulates water service practices and rates for the following water companies:
• Artesian Water Company • Broadkill Beach Water Company • Cantwell Water Company • Long Neck Water Company • Pickering Beach Water Company • Prime Hook Water Company • Slaughter Beach Water Company • Southern Shores Water Company • Sussex Shores Water Company • Tidewater Utilities • United Water Delaware • Wilkerson Water Company
6 See https://dnrec.alpha.delaware.gov/water/supply/allocation/ for more information 7 See https://dnrec.alpha.delaware.gov/water/supply/well-permits/ for more information 8 See https://depsc.delaware.gov/ for more information about the PSC
Assessment of Drinking Water Facilities and Service Areas January 2020
8
The utility’s approved tariff establishes the rules that must be followed in providing service to its customers and the rates it may charge for that service. The PSC also requires some private utilities to provide annual reports related to its infrastructure inventory and investments. (Investor-owned utilities are also required to submit detailed financial data to the federal Securities Exchange Commission annually.)
Source Water Assessment and Protection Program The Source Water Assessment and Protection Program (SWAPP)9 was established by Congress in the SDWA Amendments of 1996 to better protect public drinking water resources by providing local and state governments and the public more information about those resources. EPA provides funding to states to support source water assessments of the susceptibility of drinking water sources to contamination. DNREC (Water Supply Section) leads the development and implementation of the Delaware SWAPP, with support from DHSS and the Water Resources Agency, Institute for Public Administration at the University of Delaware.
The SWAPP provided initial Source Water Assessment reports for public water supplies in Delaware in or around its creation in 2003, many of which have been updated in the intervening years. The SWAPP also developed source water protection guidance and other resources for local government, including draft model ordinance language for smaller municipalities. Finally, the SWAPP administers low-interest revolving loan programs that help local governments protect source water via land or easement acquisition and other management practices.
Underserved Communities The Division of Public Health is currently exploring best practices for a state-wide Underserved Community program. Accordingly, utilities were queried as to their interest and ability to extend water service as well as any efforts to serve specific nearby underserved communities.
Funding for Drinking Water Facilities A variety of state, federal and private sources of funding are routinely used to finance capital improvements to drinking water systems in Delaware. As in most states, the Drinking Water State Revolving Fund (money allocated by EPA via the SDWA) is an important source of funding via low-interest loans. The DWSRF is also used to fund grant programs as applicable. United States Department of Agriculture, Rural Development (USDA-RD) is also an important source of federal funding for small utilities in designated areas. Although Delaware utilities have yet to pursue this source of funding, the Water Infrastructure Finance and Innovation Act (WIFIA) represents a potential source of supplemental funding for regionally and nationally significant projects. Finally, debt financing represents an important potential source of capital for most utilities in Delaware.
Drinking Water State Revolving Fund Under the Drinking Water State Revolving Fund 10 (DWSRF), which was established by the 1996 amendments to the SDWA, Congress appropriates funding and EPA provides grants to states to capitalize their DWSRF loan programs (states contribute a 20-percent match). State DWSRF programs provide low interest loans to eligible recipients for drinking water infrastructure projects. States are responsible for the operation of their DWSRF programs and may set specific loan terms. States rank project applications and produce a Project Priority List (PPL) and Intended Use Plan (IUP) annually. States also have the authority to provide additional subsidization as grants, principal forgiveness and negative interest loans
9 See http://delawaresourcewater.org/ for more information about the SWAPP 10 See https://www.epa.gov/dwsrf for more information about the federal DWSRF program
Assessment of Drinking Water Facilities and Service Areas January 2020
9
and can set aside up to 31 percent of their DWSRF capitalization grant for non-infrastructure needs (e.g., capacity development).
Delaware’s DWSRF11 is primarily administered by the DHSS Division of Public Health. The Delaware DWSRF IUP reflects the State’s priorities in awarding funding to projects that help disadvantaged systems and to mitigate high priority concerns such as lead piping within distribution networks. DNREC Environmental Finance12 administers a set-aside grant or loan interest rebate program targeted to help municipal utilities implement asset management plans for both water and wastewater systems13. Due to implementation recommendations by EPA Headquarters and Region III, the DWSRF program put the Lead Service Line Replacement program on hold until Spring 2020. At that time, the program will be re-evaluated upon consideration of best management practices utilized by surrounding states.
USDA – Rural Development USDA-RD offers loans, grants and loan guarantees for essential services including drinking water infrastructure, mainly through their Rural Utilities Service Water and Environmental Programs (WEP)14. The program is exclusively focused on meeting the water infrastructure needs of qualified rural communities with populations of 10,000 or fewer.
Water Infrastructure Finance and Innovation Act The federal Water Infrastructure Finance and Innovation Act (WIFIA) program15 is intended to accelerate investment in water infrastructure by providing long-term, low-cost supplemental loans for regionally and nationally significant projects. WIFIA can fund up to 49 percent of eligible projects costs and includes minimum project size thresholds for small and large communities. Although Delaware water utilities have not yet applied for WIFIA funding, it might be an attractive supplemental funding source for Delaware’s larger utilities with major capital needs.
Debt Financing Delaware drinking water utilities periodically rely on debt financing to fund capital projects that exceed their capability to fund via water enterprise operating or reserve funds. Municipal utilities may issue general obligation bonds supported by the taxing power of the issuer or revenue bonds which are supported by the income generated by the project being funding. Private (e.g., bank) financing may also be pursued by drinking water utilities.
Organization of the Report Following this introductory section of this report is a statewide summary of the findings of the Assessment of Drinking Water Facilities and Service Areas. Following the statewide summary section are four report sections that provide full details of each utility’s enterprise: one section for each of the three Delaware counties (New Castle, Kent and Sussex) and one section covering private water utilities. These four sections also “roll up” and summarize the utility data at the appropriate level (e.g., for each county and for the private utilities as a group). Following these detailed sections is a “Conclusions and Recommendations” section, followed by a list of references and Appendices, all of which are cited and
11 See https://www.dhss.delaware.gov/dhss/dph/hsp/dwsrf.html for more information about Delaware’s DWSRF program 12 See https://dnrec.alpha.delaware.gov/environmental-finance/ for more information about DNREC Environmental Finance 13 See https://dnrec.alpha.delaware.gov/environmental-finance/asset-management/ for information about the Asset Management Incentive Program 14 See https://www.rd.usda.gov/programs-services/all-programs/water-environmental-programs for more information about USDA-RD WEP 15 See https://www.epa.gov/wifia for more information about the WIFIA program
Assessment of Drinking Water Facilities and Service Areas January 2020
10
referenced in the report.
Assessment of Drinking Water Facilities and Service Areas January 2020
11
2. STATEWIDE DRINKING WATER SYSTEM OVERVIEW Service Coverage Utilities were asked for maps of their current drinking water service areas. Because of concerns about water system security, GIS shapefiles of their systems were not required. Instead, the team solicited maps in whatever format was most convenient (.pdf in many cases). A geographically-indexed compilation of service area maps is provided in Appendix B.
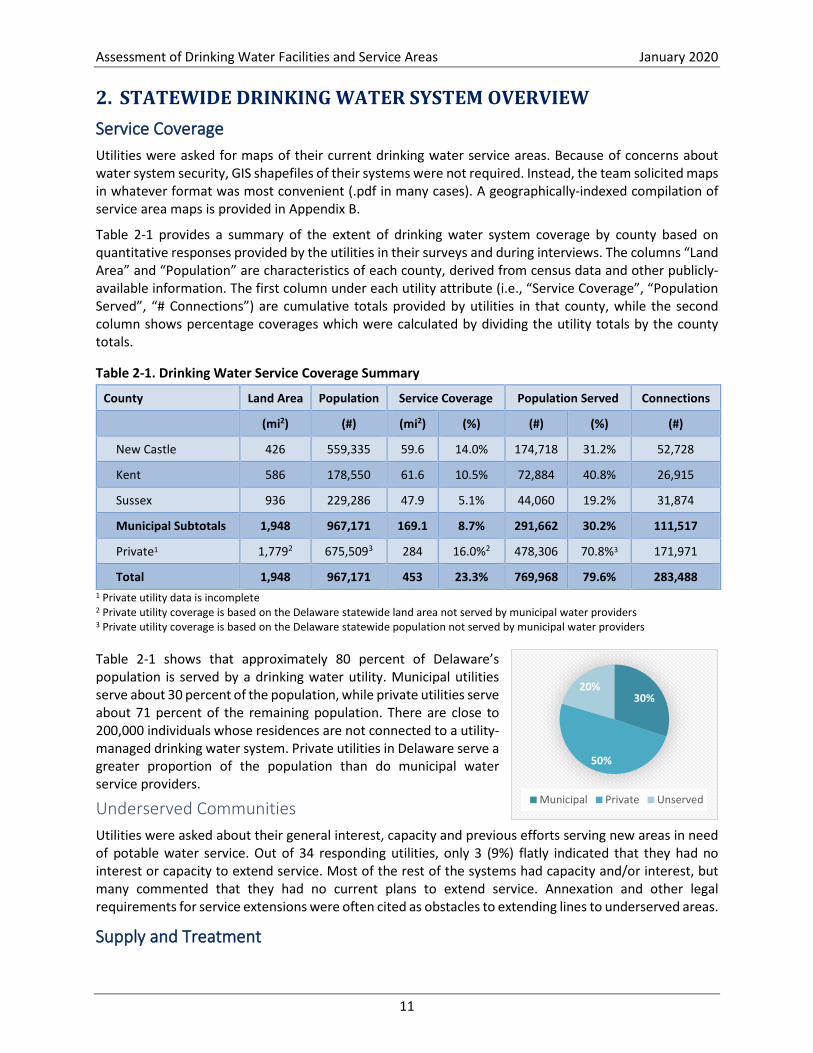
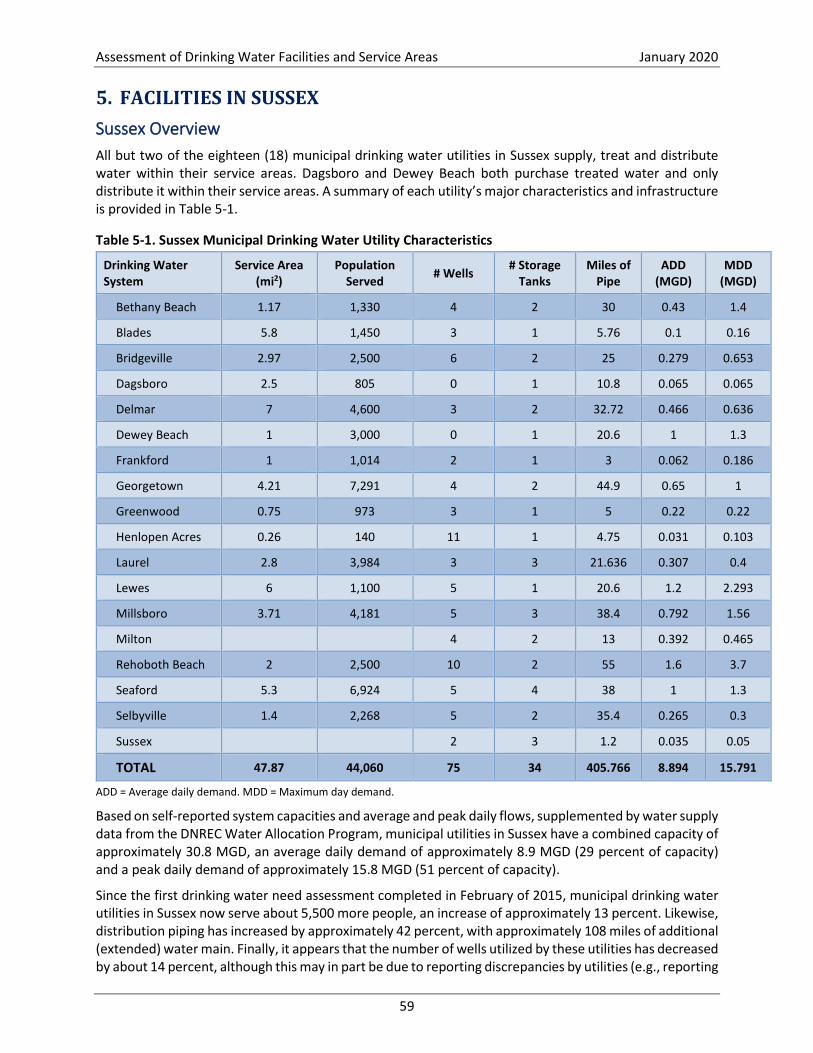
Table 2-1 provides a summary of the extent of drinking water system coverage by county based on quantitative responses provided by the utilities in their surveys and during interviews. The columns “Land Area” and “Population” are characteristics of each county, derived from census data and other publicly-available information. The first column under each utility attribute (i.e., “Service Coverage”, “Population Served”, “# Connections”) are cumulative totals provided by utilities in that county, while the second column shows percentage coverages which were calculated by dividing the utility totals by the county totals.
Table 2-1. Drinking Water Service Coverage Summary
County Land Area Population Service Coverage Population Served Connections
(mi2) (#) (mi2) (%) (#) (%) (#)
New Castle 426 559,335 59.6 14.0% 174,718 31.2% 52,728
Kent 586 178,550 61.6 10.5% 72,884 40.8% 26,915
Sussex 936 229,286 47.9 5.1% 44,060 19.2% 31,874
Municipal Subtotals 1,948 967,171 169.1 8.7% 291,662 30.2% 111,517
Total 1,948 967,171 453 23.3% 769,968 79.6% 283,488 1 Private utility data is incomplete 2 Private utility coverage is based on the Delaware statewide land area not served by municipal water providers 3 Private utility coverage is based on the Delaware statewide population not served by municipal water providers
Table 2-1 shows that approximately 80 percent of Delaware’s population is served by a drinking water utility. Municipal utilities serve about 30 percent of the population, while private utilities serve about 71 percent of the remaining population. There are close to 200,000 individuals whose residences are not connected to a utility-managed drinking water system. Private utilities in Delaware serve a greater proportion of the population than do municipal water service providers.
Underserved Communities Utilities were asked about their general interest, capacity and previous efforts serving new areas in need of potable water service. Out of 34 responding utilities, only 3 (9%) flatly indicated that they had no interest or capacity to extend service. Most of the rest of the systems had capacity and/or interest, but many commented that they had no current plans to extend service. Annexation and other legal requirements for service extensions were often cited as obstacles to extending lines to underserved areas.
Supply and Treatment
30%
50%
20%
Municipal Private Unserved
Assessment of Drinking Water Facilities and Service Areas January 2020
12
Out of 40 responses (some utilities have more than one source of raw water), 35 (88%) indicated that they were groundwater based, three (8%) indicated that they purchase treated water from another system (as their only water supply; numerous systems are interconnected with others to supplement supply or for emergency) and two (5%) indicated that they were surface water based.
Groundwater-Sourced Systems
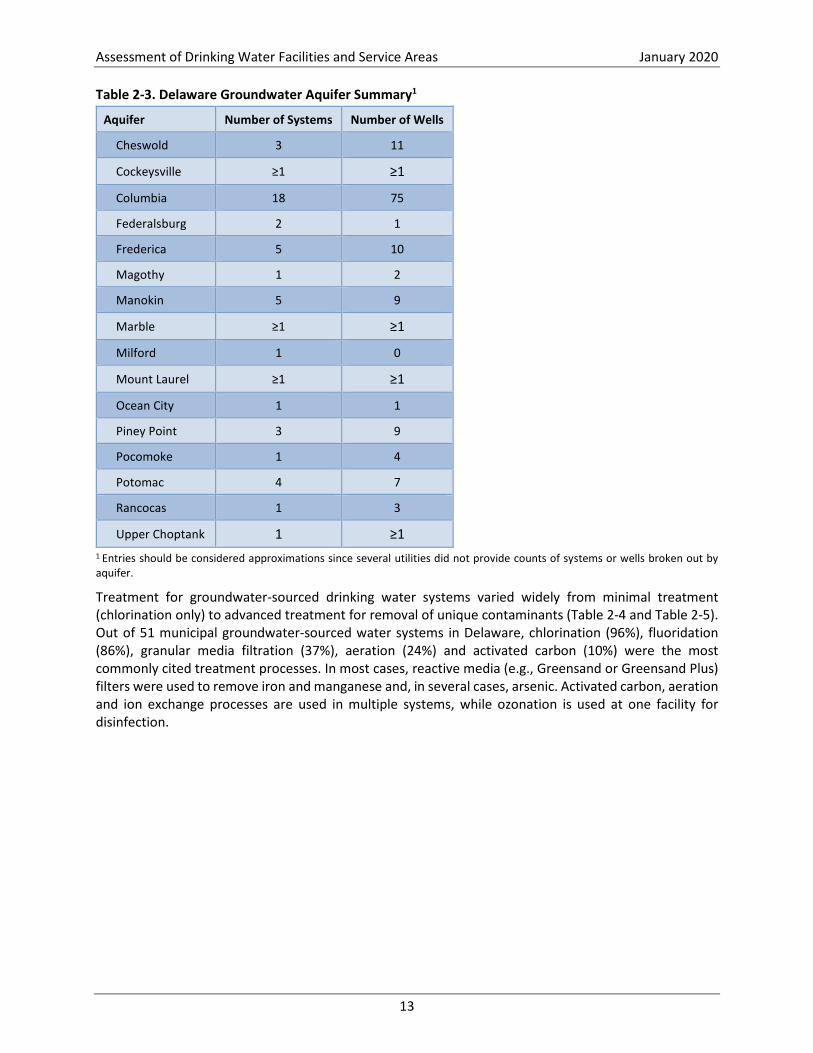
Table 2-2 provides a summary of groundwater withdrawals and infrastructure by county. Sixteen (16) different aquifers were cited as groundwater sources by Delaware drinking water utilities, as indicated in Table 2-3.
Table 2-2. Groundwater Well and Withdrawal Summary
County Number of
GW sourced systems
Number of Wells
ADD (MGD) MDD (MGD) Aquifers Used
New Castle 4 13 19.8 24.8 Potomac, Lower Potomac, Magothy, Columbia
Kent 9 53 9.8 14.8
Piney Point, Cheswold, Rancocas, Columbia, Frederica, Milford, Federalsburg, Upper
Assessment of Drinking Water Facilities and Service Areas January 2020
13
Table 2-3. Delaware Groundwater Aquifer Summary1
Aquifer Number of Systems Number of Wells
Cheswold 3 11
Cockeysville ≥1 ≥1
Columbia 18 75
Federalsburg 2 1
Frederica 5 10
Magothy 1 2
Manokin 5 9
Marble ≥1 ≥1
Milford 1 0
Mount Laurel ≥1 ≥1
Ocean City 1 1
Piney Point 3 9
Pocomoke 1 4
Potomac 4 7
Rancocas 1 3
Upper Choptank 1 ≥1 1 Entries should be considered approximations since several utilities did not provide counts of systems or wells broken out by aquifer.
Treatment for groundwater-sourced drinking water systems varied widely from minimal treatment (chlorination only) to advanced treatment for removal of unique contaminants (Table 2-4 and Table 2-5). Out of 51 municipal groundwater-sourced water systems in Delaware, chlorination (96%), fluoridation (86%), granular media filtration (37%), aeration (24%) and activated carbon (10%) were the most commonly cited treatment processes. In most cases, reactive media (e.g., Greensand or Greensand Plus) filters were used to remove iron and manganese and, in several cases, arsenic. Activated carbon, aeration and ion exchange processes are used in multiple systems, while ozonation is used at one facility for disinfection.
Assessment of Drinking Water Facilities and Service Areas January 2020
14
Table 2-4. Groundwater Treatment Process Summary by County
County Number of Treatment Systems Chlorination Fluoridation Granular Media
Table 2-5. Groundwater Treatment Process Summary by Process
Treatment Process Number of Systems Purpose/Other Notes
Chlorination 98 Disinfection
Fluoridation 65
Granular media filtration 40
Mostly Greensand or Greensand Plus for iron, manganese and arsenic removal
Activated carbon 11 PFAS, Taste and Odor
Aeration 25 PCE, MTBE, TTHMs, other VOCs, Odor/Color, Iron
Ion exchange 2
Other 6
• Ozone disinfection • InterPhos and other sequestrants for corrosion/lead
control • pH adjustment (caustic soda, lime)
Assessment of Drinking Water Facilities and Service Areas January 2020
15
Most groundwater system respondents reported no exceedances of drinking water standards within the past five years. Those that were reported include two utilities with Lead and Copper Rule exceedances, two utilities with nitrate exceedances, two utilities with iron exceedances (a secondary standard) and one utility with a TTHM exceedance. Other utilities report VOCs, arsenic and PFAS/PFOA in their source water but these are being effectively removed via treatment.
Utilities generally appeared to be aware of the importance of source water protection and had a reasonable knowledge of threats to their source water. Most utility representatives knew whether their local government had a source water protection ordinance; however, most did not know the details of the ordinance (e.g., radius of protection zones around well heads). Out of the thirty-two (32) municipal water utilities surveyed, twenty-one (21), or 66 percent had some type of formalized source water protection program (i.e., more than simply having a required source water protection plan on file with the State).
The status of source water protection ordinances for drinking water systems in Delaware is illustrated graphically in Figure 2-1.
Figure 2-1. Status of Source Water Projection Ordinances for Drinking Water Systems in Delaware (Delaware Source Water Protection Program, 2016)
Surface Water Sourced Systems Only Wilmington and Newark (Curtis WTP) in New Castle County extract raw water from surface water sources in Delaware. Artesian purchases surface water from several entities, including the Chester (PA) Water Authority (with draws from the Susquehanna River) and Wilmington. Table 2-6 provides a summary of surface water withdrawals and infrastructure by county.
Assessment of Drinking Water Facilities and Service Areas January 2020
16
Table 2-6. Surface Water Withdrawal Summary
System ADD (MGD) MDD (MGD) Intake
Wilmington 16.4 19.6 Intake on Brandywine Creek
Newark 2.0 3.8 Newark Reservoir on White Clay Creek
Total 18.4 23.4
Conventional surface water treatment is used at both facilities. Wilmington also uses membrane filtration. Neither facility reported exceedances of drinking water standards within the past five years; however, both reported the detection of contaminants resulting from routine UMCR testing, including PFOA at 21 parts per trillion (ppt) at the Curtis WTP.
Both facilities have active source water protection programs including partnerships with land conservancies and non-governmental organizations (NGOs) supporting land acquisition and improved land management (e.g., best management practices, or BMPs, on farms).
Water Distribution
Storage Tanks and Booster Stations Table 2-7 provides a summary of installed storage tank capacity and age by county.
Table 2-7. Storage Tank Summary
County Number of Tanks
Total Capacity
(MG)
Average Capacity (MG)
Average Age (yr.) Notes
New Castle 23 17.7 0.77 47 Also 3 raw water storage tanks
Kent 23 11.9 0.52 47
Sussex 34 11.6 0.34 33
Municipal Subtotal 80 41.3 0.52 38
Private 96 50.3 0.52 28 At least 1 raw water storage tank
Total 176 91.6 0.52 38
The vast majority of utilities were aware of the lead paint restrictions in HB 456 and contracted for regular maintenance of their storage tanks. Common issues with storage tanks included the following:
• Old age and deteriorating condition of tanks
• Lack of altitude valve limiting the ability to fully utilize tank storage volume
• Single pipe for both inlet and outlet
• Inability to easily monitor tank water levels
Multiple utilities reported plans for replacing or retiring tanks, adding altitude valves and providing remote water level monitoring systems (sometimes integrated with SCADA).
Assessment of Drinking Water Facilities and Service Areas January 2020
17
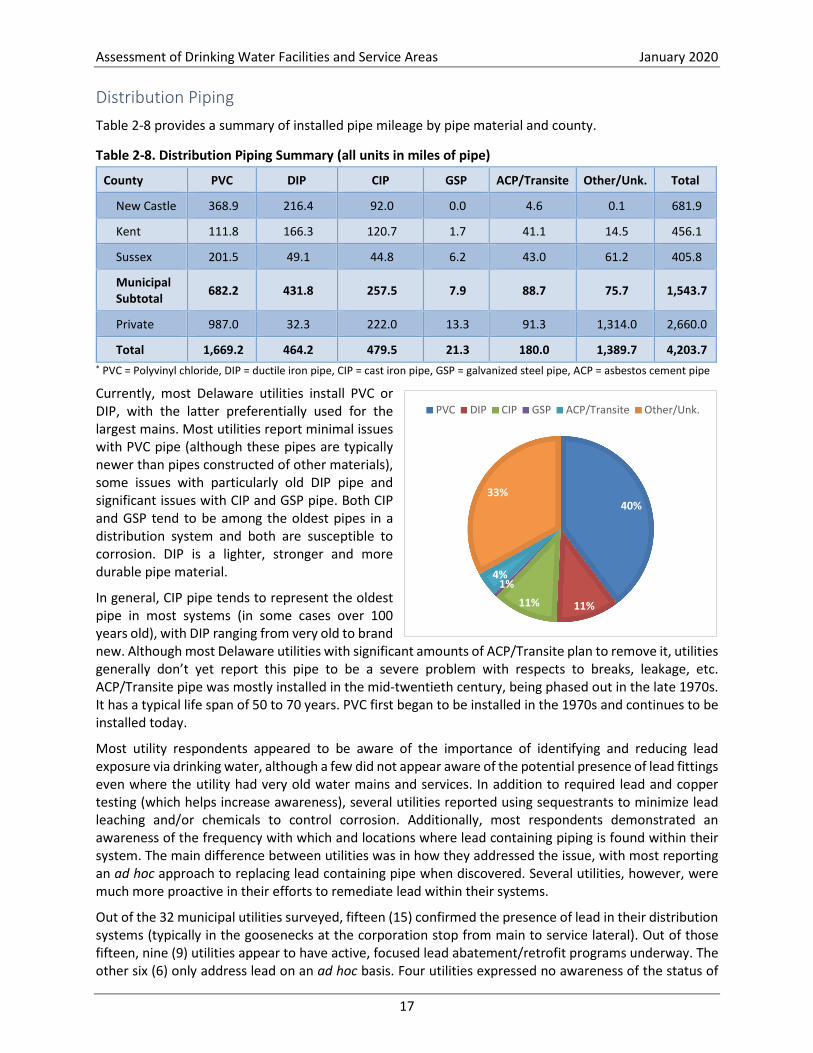
Distribution Piping Table 2-8 provides a summary of installed pipe mileage by pipe material and county.
Table 2-8. Distribution Piping Summary (all units in miles of pipe)
County PVC DIP CIP GSP ACP/Transite Other/Unk. Total
New Castle 368.9 216.4 92.0 0.0 4.6 0.1 681.9
Kent 111.8 166.3 120.7 1.7 41.1 14.5 456.1
Sussex 201.5 49.1 44.8 6.2 43.0 61.2 405.8
Municipal Subtotal 682.2 431.8 257.5 7.9 88.7 75.7 1,543.7
Currently, most Delaware utilities install PVC or DIP, with the latter preferentially used for the largest mains. Most utilities report minimal issues with PVC pipe (although these pipes are typically newer than pipes constructed of other materials), some issues with particularly old DIP pipe and significant issues with CIP and GSP pipe. Both CIP and GSP tend to be among the oldest pipes in a distribution system and both are susceptible to corrosion. DIP is a lighter, stronger and more durable pipe material.
In general, CIP pipe tends to represent the oldest pipe in most systems (in some cases over 100 years old), with DIP ranging from very old to brand new. Although most Delaware utilities with significant amounts of ACP/Transite plan to remove it, utilities generally don’t yet report this pipe to be a severe problem with respects to breaks, leakage, etc. ACP/Transite pipe was mostly installed in the mid-twentieth century, being phased out in the late 1970s. It has a typical life span of 50 to 70 years. PVC first began to be installed in the 1970s and continues to be installed today.
Most utility respondents appeared to be aware of the importance of identifying and reducing lead exposure via drinking water, although a few did not appear aware of the potential presence of lead fittings even where the utility had very old water mains and services. In addition to required lead and copper testing (which helps increase awareness), several utilities reported using sequestrants to minimize lead leaching and/or chemicals to control corrosion. Additionally, most respondents demonstrated an awareness of the frequency with which and locations where lead containing piping is found within their system. The main difference between utilities was in how they addressed the issue, with most reporting an ad hoc approach to replacing lead containing pipe when discovered. Several utilities, however, were much more proactive in their efforts to remediate lead within their systems.
Out of the 32 municipal utilities surveyed, fifteen (15) confirmed the presence of lead in their distribution systems (typically in the goosenecks at the corporation stop from main to service lateral). Out of those fifteen, nine (9) utilities appear to have active, focused lead abatement/retrofit programs underway. The other six (6) only address lead on an ad hoc basis. Four utilities expressed no awareness of the status of
40%
11%11%1%
4%
33%
PVC DIP CIP GSP ACP/Transite Other/Unk.
Assessment of Drinking Water Facilities and Service Areas January 2020
18
lead materials in their systems. The balance of the municipal utilities (13 of them) confirmed no lead in their systems – sometimes this was the result of a completed abatement program, sometimes it was because their distribution network was relatively new and other times, it wasn’t clear how the utility could confirm the absence of lead in their systems.
Asset Management Table 2-9 provides a summary of utility asset management programs by county.
Table 2-9. Utility Asset Management Summary (all units in percentage of utilities)
County Most of System in GIS
State Asset Management
Grant
Full Asset Management
Program
Partial or In-Progress Asset Management
Program
No Asset Management
Program
New Castle 100% 20% 40% 40% 20%
Kent 89% 67% 11% 78% 11%
Sussex 53% 59% 12% 59% 29%
Municipal Subtotal 71% 55% 16% 61% 23%
Private 100% 0% 67% 33% 0%
Total 74% 50% 21% 59% 21%
Most drinking water utilities in Delaware have made some efforts to improve their asset management efforts, minimally consisting of efforts to map their systems in GIS and to assess the condition of their system and target capital improvements accordingly. Some of the smaller and most resource-challenged utilities have instituted little or no proactive asset management.
In general, most utility respondents were unable to provide useful quantitative information about their non-revenue water (NRW) rates or about measurable efforts to reduce NRW. Those respondents who provided a response to this question (in survey and/or interview) typically provided a rough approximation or range of NRW rate or a qualitative descriptor (e.g., “very low”).
Metering The vast majority of drinking water customers in Delaware are metered, with only several very small, under-resourced utilities not yet metering water use. Of those metered systems, AMR using “drive-by” reading is the most common metering infrastructure. Several utilities are in the initial stages of transitioning to AMI (i.e., “remote read” systems) and several appear to still use some type of manual read metering systems.
Out of the 32 municipal utilities surveyed, only four did not meter their customers’ water use, including one in Kent and three in Sussex. Most of the private utilities’ customers are metered. Tidewater has one service area (Southern Shores) that is unmetered and Artesian reports several small pockets of unmetered users.
System Controls Approximately 56 percent of municipal drinking water systems in Delaware use a SCADA system, for monitoring and controlling their operations. This includes 80 percent of New Castle County utilities, 33 percent of Kent utilities and 61 percent of Sussex utilities. Those which don’t have SCADA appear to recognize the potential improvements in service delivery associated with improving the monitoring and control of conditions within their systems; in particular, storage tank operation.
Assessment of Drinking Water Facilities and Service Areas January 2020
19
Finances Estimates of the replacement value of utility assets for drinking water systems are summarized by county in Table 2-10.
Table 2-10. Estimated Present-Worth Replacement Value of Drinking Water Assets
County Wells/Treatment Storage Tanks
Mains and Appurtenances
Pump (Booster) Stations Total
New Castle $98,396,623 $77,108,785 $1,272,551,917 $51,411,469 $1,499,468,794
Kent $54,458,896 $37,103,227 $419,256,136 $510,818,259
TOTAL $639,559,274 $294,176,176 $3,938,488,425 $60,429,869 $4,932,653,744
Revenue Generation and Affordability Most respondents indicated that their revenue was sufficient to fund the operation of the water system, although the ability to fund capital projects without financial assistance varies significantly among utilities.
Although potable water rates vary between utilities, rate structures are similar among many, consisting of a flat fee (e.g., a service fee, availability fee, meter fee, tap fee) plus charges based on metered water usage for those utilities metering their customers’ water usage (which represents most of the systems). Several utilities charge a separate “special” fee (e.g., for debt service).
Most respondents indicated that residential and non-residential rates are the same, although some utilities do charge different flat fees based on meter or tap size or customer type. Most respondents representing utilities that serve customers outside of their municipal limits charge a higher rate (typically 50 percent greater) to those customers than for town or city residents.
Based on data generated by the University of North Carolina Environmental Finance Center (UNC-EFC), average water bills16 in Delaware range from a low of $13.67 to a high of $66.25 per month, with a median monthly bill of $30.42. UNC-EFC also developed a metric that reflects the water conservation signal provided by the utility (a higher number indicates a greater signal to the consumer to conserve water), which is the cost per 1,000 gallons of water usage above 10,000 gallons per month. Finally, UNC-EFC presented an affordability index, which is calculated as the average annual water charge per household divided by the median household income (MHI) for the utility service area. These data, along with calculations performed by the project team using the most recent MHI data are presented by county in Table 2-11.
16 Average monthly bill is based on an assumed household water use of 5,000 gallons per month
Assessment of Drinking Water Facilities and Service Areas January 2020
20
Table 2-11. Summary of Affordability Metrics for Delaware Water Utilities
County Average Monthly Charge
Conservation Signal
UNC-EFC Affordability Index
2019 MHI
Affordability Index
New Castle $32.91 $6.17 0.83% $59,183 0.67%
Kent $25.72 $3.74 0.60% $55,835 0.55%
Sussex $30.74 $5.34 0.81% $61,849 0.60%
Municipal Subtotal $29.42 $4.95 0.73% $59,741 0.59%
Private $53.57 $7.78 N/A unknown N/A
TOTAL $32.64 $5.33 0.73% $59,741 0.66%
Reserves Most respondents indicated that they maintain a dedicated reserve account for water expenditures, although capitalization rates varied significantly (e.g., in Kent, they ranged from 7 to 50 percent of the total annual water enterprise budget). Restrictions on the use of reserve funds also varied considerably.
Capital Plans The capital planning processes employed by Delaware drinking water utilities varies considerably, apparently as a function of the municipal entity’s capital planning processes. Larger, better resourced municipalities tended to have more formal capital planning processes, while smaller, lower resource municipalities tended to have more informal (or virtually no) processes. As summarized in Table 2-12, 80 percent of New Castle County utilities, 56 percent of Kent utilities and 39 percent of Sussex utilities currently have formal or semi-formal CIPs. A compilation of CIPs is provided as Appendix C.
Table 2-12. Summary of CIP Status and Budget for Delaware Water Utilities
County # Systems # Systems with CIP 5-Year CIP Budget Annual Investment Ratio1
New Castle 5 4 $78,938,396 1.1%
Kent 9 5 $56,919,100 2.2%
Sussex 18 7 $29,938,620 0.8%
Municipal Subtotal 32 16 $158,174,506 1.2%
Private Utilities 4 1 $27,374,485 0.2%
TOTAL 36 17 $193,170,601 0.8% 1 Investment ratio = Average annual CIP Budget divided by total asset replacement value (Table 2-10)
Multiple utility respondents referenced other related efforts, such as facility master plans and asset management plans as the tools used to select and prioritize capital projects. It appears that at least some of the utilities currently participating in the State’s asset management grant program plan to develop a CIP when their AMP is completed.
Assessment of Drinking Water Facilities and Service Areas January 2020
21
3. FACILITIES IN NEW CASTLE COUNTY
New Castle County Overview All five (5) of the municipal drinking water utilities in Kent supply, treat and distribute water within their service areas. A summary of each utility’s major characteristics and infrastructure is provided in Table 3-1.
Table 3-1. New Castle County Municipal Drinking Water Utility Characteristics
Drinking Water System Service Area (mi2)
Population Served # Wells # Storage
Tanks Miles of
Pipe ADD
(MGD) MDD
(MGD)
Delaware City 1.2 1,742 2 1 10 0.101 0.363
Middletown 11 19,500 3 2 (+1 raw) 60 1.5 2
New Castle 3.4 5,500 3 2 29 0.5 1.3
Newark* 12 40,000 5 9 (+2 raw) 136 1.3 1.5
Wilmington* 32 107,976 0 9 447 16.4 19.6
TOTAL 59.6 174,718 13 23 (+3 raw) 682 19.8 24.8
ADD = Average daily demand. MDD = Maximum day demand. * Wilmington and Newark both also have surface water facilities
Based on self-reported system capacities and average and peak daily flows, supplemented by water supply data from the DNREC Water Allocation Program, municipal utilities in New Castle County have a combined capacity of approximately 54.4 MGD, an average daily demand of approximately 19.8 MGD (36 percent of capacity) and a peak daily demand of approximately 24.8 MGD (46 percent of capacity).
Since the first drinking water need assessment completed in February of 2015, municipal drinking water utilities in New Castle County now have approximately 7 percent more distribution piping, mostly resulting from extensions of Wilmington’s system. The total number of storage tanks and total number of wells is about the same as recorded in 2015. It is impossible to determine the population which has newly been served since 2015, since some of the population data in the 2015 report appear to represent approximations (e.g., Wilmington served population was reported to be 140,000 in 2015; however, in 2019 the utility provided a served population figure of 107,976).
On average, New Castle County utilities provide more expensive water service than other municipal utilities in Delaware, as summarized in Table 3-2 (by comparison, the average monthly water bills for municipal systems in Kent and Sussex are $25.72 and $30.74, respectively).
Table 3-2. Affordability Metrics for New Castle County Water Providers
Drinking Water System
Average Monthly Charge
Conservation Signal
UNC-EFC Affordability
Index
2019 MHI Affordability Index
Delaware City $29.25 $3.25 0.60% $53,958 0.65%
Middletown $18.79 $4.49 $87,375 0.26%
New Castle $44.75 $7.00 0.90% $59,773 0.90%
Newark* $39.21 $9.09 0.85% $54,590 0.86%
Wilmington* $32.53 $7.03 0.97% $40,221 0.97%
TOTAL $32.91 $6.17 0.83% $59,183 0.67%
Assessment of Drinking Water Facilities and Service Areas January 2020
22
Estimates of the replacement value of utility assets for New Castle County municipal drinking water systems are summarized in Table 3-3.
Table 3-3. Estimated Present-Worth Replacement Value of New Castle County Municipal Drinking Water Assets
Drinking Water System Wells/Treatment Storage Tanks Mains and
Appurtenances Pump Stations Total
Delaware City $4,338,717 $1,075,062 $9,995,892 NA $15,409,671
Middletown $4,695,076 $5,734,135 $52,676,076 NA $63,105,287
New Castle $4,947,621 $4,659,751 $25,460,103 NA $35,067,474
TOTAL $98,396,623 $77,108,785 $1,272,551,917 $51,411,469 $1,499,468,793
Water distribution mains and appurtenances represent a full eighty-five percent (85%) of the replacement value of municipal drinking water infrastructure in New Castle County. Water supply (e.g., wells), pumping and treatment infrastructure represent about 7 percent, storage tanks about 5 percent and pump stations the remaining 3 percent of asset replacement value.
As indicated in Table 3-4, Annual Investment rates for New Castle County utilities range from 0.3 to 1.4 percent of total asset value.
Table 3-4. New Castle County Drinking Water Utility 5-Year CIP Summary
Drinking Water System CIP? 5-Year CIP Budget Annual Investment Ratio
Delaware City NO N/A N/A
Middletown YES $1,075,000 0.3%
New Castle YES $918,000 0.5%
Newark YES $13,945,396 1.3%
Wilmington YES $63,000,000 1.1%
TOTAL $78,938,396 1.1%
Descriptions of each municipal utility’s service area, infrastructure, planning and financial characteristics are provided in subsequent subsections.
Delaware City
Utility Overview Service Area The Delaware City water system serves an estimated 1.2-square mile area in central New Castle County, bordered to the east by the Delaware River and to the south by the Chesapeake and Delaware Canal. It serves the corporate limits of the Delaware City, excluding the recently annexed Fort DuPont. The system serves a population of 1,742 through 804 connections, two of which serve industrial customers.
Underserved Communities Delaware City reports having the capacity to extend water service, but no plans to do so. No underserved communities have been identified near Delaware City.
Assessment of Drinking Water Facilities and Service Areas January 2020
23
Supply and Treatment Water Supply Delaware City operates two (2) supply wells with a reported total capacity of 1.4 MGD. Both wells extend approximately 700 feet into the Lower Potomac aquifer. The most recent improvements were to one well (labeled #5) – the pump and motor were replaced in 2009. Delaware City plans to assess the conditions of both wells in the next couple years in preparation to either sell the system to a private entity (e.g., Artesian, Suez/United Water) or to own/operate the system with assistance from a private utility (Artesian currently provides this service to Delaware City).
An onsite diesel-powered generator is used to power mechanical equipment including well pumps when needed.
Treatment Delaware City’s treatment system includes granular media filtration, chlorination and fluoridation.
Capacity and Demand Delaware City reports a system capacity of 1.4 MGD, an average daily demand (ADD) of 0.101 MGD and a maximum day demand (MDD) of 0.363 MGD. Most demand is from residential customers. No projections were provided by the utility for future flows. The utility reports no problems meeting fire flow or peak demands.
Water Quality Delaware City has not reported exceedances of primary or secondary drinking water standards and is not aware of the presence of emerging contaminants in their source water. Delaware City does not have a source water or wellhead protection program.
Distribution Storage Tanks Delaware City maintains one 250,000-gallon elevated storage tank. The tank is not under contract for maintenance and the utility is not sure whether the tank is currently coated with lead-free paint. Delaware City has proposals to upgrade the tank and plan to address it in their capital plan.
Delaware City would like to increase system pressures to around 60 psi and are considering interconnecting with the Artesian water storage tank at Governor Bacon/Fort Dupont.
Distribution Piping Water mains in Delaware City’s system include approximately 10 miles of 4- to 8-inch diameter PVC, ductile iron, cast iron and asbestos cement pipe. The utility does not know whether the system includes lead service lines.
Asset Management Delaware City does not appear to have a formal asset management program; replacement efforts generally occur after the asset has failed. Locations of distribution piping, meters and hydrants are, however, mapped.
Metering All customers are metered. Currently, meters in Delaware City are read manually, but the utility is planning for an upcoming program whereby meters will be replaced with an AMR system.
System Controls Delaware City does not currently have a SCADA system for their supply, treatment or distribution systems.
Assessment of Drinking Water Facilities and Service Areas January 2020
24
Finances Revenue Generation Delaware City reports that their water enterprise fund operates at a loss. Rates were raised in FY2019 for the first time since 2006 and include a base charge and a demand charge. Rates are still considered low for New Castle County, at an average of $29.25 per month, which results in an Affordability Index of 0.65 percent at the MHI of $53,958.
Delaware City has a debt borrowing limit of 15 percent of assessed property value, approximately $9,900,000. Their current loan balance is about $1,670,000.
Reserves Delaware City maintains a capital reserve account. The reserve account is not restricted to the water enterprise or certain types of projects.
Capital Plans Delaware City reports not being able to keep up with capital needs, so they have been advertising to sell the water system in the fall and winter of 2019. They do not currently have a CIP.
Middletown
Utility Overview Service Area The Middletown water system serves an area of approximately 11 square miles in central New Castle County, close to Delaware’s border with Maryland. The system serves roughly 2,300 connections.
Underserved Communities Middletown reports not having the capacity to extend service and suggested that most new development is in Artesian’s CPCN.
Supply and Treatment Water Supply Middletown operates three (3) supply wells with a reported total pumping capacity of 1,410 gpm. The wells range from 375 to 846 feet in depth and extract groundwater from the Potomac and Magothy aquifers. Wells #8 and 9 replaced four old wells.
Middletown also maintains five (5) interconnections with Artesian whose water supply is also groundwater sourced.
Onsite generators are used to power mechanical equipment including well pumps when needed.
Treatment Middletown has two treatment systems consisting of Greensand filtration and chlorination. The original plant was built in the 1960 and was most recently upgraded in 2011.
Capacity and Demand Middletown reports an average daily demand (ADD) of 1.5 MGD and a maximum day demand (MDD) of 2.0 MGD with system capacity reported to be 2.0304 MGD. Middletown projects an ADD of 2.75 MGD by 2030.
Water Quality Middletown has not reported exceedances of primary or secondary drinking water standards and is not aware of the presence of emerging contaminants in their source water. Middletown has a source water protection program, including a 150 to 300-foot radius wellhead protection zone ordinance.
Assessment of Drinking Water Facilities and Service Areas January 2020
25
Distribution Storage Tanks Middletown has one raw water storage tank and two 1.5 MG elevated tanks for finished water storage; one is 14 and the other is 23 years old. The town has a maintenance contract for the older Greentown tank; it was last painted 3 years ago. The other tank – the Industrial Drive elevated tank – was paid for by both the town and Artesian and is operated/maintained by Artesian
Distribution Piping Middletown’s system includes over 60 miles of 8 to 16-inch diameter PVC, ductile iron, cast iron and asbestos cement pipe installed. Most of the lines (est. 80 percent) are DIP ranging from new to 40 years old, with about 14 percent PVC (10-25 years old). CIP and ACP represent a small proportion of the system and range from 25 to 80 years in age.
The utility is not aware of lead service lines in their system, although they do report galvanized goosenecks. They currently use copper pipe from the main to the curb, and the service to the house is based on the customer’s preference.
Asset Management The town is currently developing GIS of their system, but otherwise do not report having a formal asset management program.
Metering All customers are metered with drive-by AMR. They are starting to implement smart AMI meters, but the current signal is weak.
System Controls Middletown has a SCADA system for the water treatment plant and storage tanks.
Finances Revenue Generation Middletown’s water fund is generated through user rates and charges. A new rate study is underway. Existing charges include a flat rate per 1,000 gallons of consumption.
Middletown’s water charges are by far the lowest in New Castle County, averaging about $18.79 per month, which results in an Affordability Index of 0.26 percent at the MHI of $87,375.
The town’s total outstanding debt limit per Charter is 15 percent of the total assessed value. Of that number, 4 percent is allowed without a referendum.
Reserves Capital projects related to growth are funding using impact fees.
Capital Plans Middletown reports aging infrastructure (e.g., distribution piping) as being a major driver of capital demands. A metering system upgrade from AMR to AMI is ongoing. Middletown does maintain a formal CIP (covering 6+ years), as summarized in Table 3-5. Table 3-5. Summary of Drinking Water CIP for Middletown
CIP Item Budget
Well #6 Replacement $330,000
Water Plant Iron removal $100,000
Transite Removal $500,000
Assessment of Drinking Water Facilities and Service Areas January 2020
26
Re-pack #4 filter $40,000
Water Meter Replacements $105,000
TOTAL $1,075,000
New Castle
Utility Overview Service Area The Municipal Services Commission (MSC) of New Castle water system serves an area of 3.4 square miles in northeastern New Castle County, on the western shore of the Delaware River. The system serves a year-round population of 5,500 through roughly 1,967 residential, 146 commercial/industrial and 16 other connections.
Underserved Communities The MSC service area is surrounded by Artesian’s CPCN, and the city has no plans to extend service.
Supply and Treatment Water Supply New Castle MSC currently operates three (3) supply wells with a fourth pending DNREC approval. Two existing 12-inch wells draw from the Middle Potomac aquifer at 125-130 feet and one 10-inch well draws from the Upper Potomac at 83’ below grade. The new 12-inch well will draw from the Lower Potomac.
The facility reports alternating two running wells every 30 days. Total well capacity is approximately 2.33 MGD.
MSC also maintains two interconnections with Artesian Water Company: 1 two-way interconnection and 1 one-way (Artesian to MSC) interconnection.
Treatment All four wells are piped into a single treatment facility, which includes up-draft aeration (for PCE/TCE in one well), hydrated lime for pH adjustment and sodium hexametaphosphate for corrosion control. The system also includes disinfection using calcium hypochlorite (tablet chlorination) and fluoridation. The plant was originally constructed in 1970 and was completely rehabilitated in 2010. Permanent granular activated carbon (GAC) filters were installed in 2014/2015 for PFAS treatment. MSC is trying to determine the useful life of the carbon in the GAC system.
A portable generator is used for emergency power at the wells and treatment plant. MSC has installed a solar array in 2015 and has plans to installation two additional arrays so they can produce enough energy to run the treatment system. Delaware’s Green Energy Grant program has funded the work.
Capacity and Demand MSC reports an average daily demand (ADD) of 0.5 MGD and a maximum day demand (MDD) of 1.3 MGD with system capacity reported to be 1.6 MGD. MSC reports an average residential demand of 0.25 MGD, commercial and institutional demand of 0.203 MGD with the balance being a combination of non-revenue water (NRW) demands, including process water (0.02 MGD) and losses (0.01 MGD).
Water Quality During MSC’s 2014 Lead and Copper sampling, 4 out of 27 Lead sample results were detected above the Action Level (AL) of 15 ppb. MSC resampled the locations which exceeded the AL and only one was above the AL again. During 2016, MSC participated in enhanced lead and copper monitoring as required. After
Assessment of Drinking Water Facilities and Service Areas January 2020
27
the most recent sampling in the Fall of 2016, it was determined the enhanced monitoring was no longer required because compliance issues have been resolved. MSC will resume triennial testing in 2019.
MSC became aware of PFAS contamination in the city's water supply from the well in the Upper Potomac aquifer around August 2014. Additionally, Artesian found 6 PFAS-related compounds in nearby wells during UCMR testing. MSC began purchasing water from the (interconnected) Artesian Water system and installed a temporary Granular Activated Carbon (GAC) filtration system to remove PFAS in 2014-2015, installing a permanent system afterward. DNREC and US EPA are working on an assessment of the source of PFAS. The City believes that the National Guard, Fire Practice Site, and County Airport are the most likely candidate sources contributing to this contamination. City is working on developing a waiver for customers who had to pay for the remediation for this contamination.
New Castle City Ordinance No. 456, An Ordinance Amending the City Zoning Code, includes a section which provides for Protection of Wellheads and Source Water Supplies within the city limits which includes a 300-foot wellhead protection area.
Distribution Storage Tanks MSC has two elevated storage tanks – a 600,000-gallon tank installed around 1950 and a 1.0 MG tank installed around 1980. The interior and exterior of both tanks are inspected by their consulting engineer every 3 years and recommended maintenance is scheduled and completed. In 2010 the exterior of Gray Street tank was blasted and painted. In 2011 the interior and exterior of Ships Landing Tank were blasted and painted. Paints were confirmed lead-free in accordance with HB 456.
Distribution Piping MSCs oldest mains are 4 to 16-inch cast iron dating from the 1890s to 1950s. CIP represents about 17 miles, or 65 percent, of the distribution system. The remainder of the mains are 3 to 12-inch ductile iron installed from the 1960s to present. DIP represents about 12 miles, or 35 percent, of the distribution system. The oldest CIP is in the historic downtown area. Unlined CIP and old valves can be problems in the system.
MSC has replaced all know lead goosenecks installed in the 1950s. They also treat their water with 1 ppm sodium hexametaphosphate for corrosion control.
MSC continues to be proactive in replacing and rehabilitating (cleaning and lining) mains. They report that although most of the system is looped, there are still a few dead ends. Mains are flushed two times per year – in the spring and fall.
Using a State grant, the MSC has demonstrated the efficacy of non-destructive main testing using the Echologics technology to determine pipe material, wall thickness and life expectancy for 2.5 miles of mains.
Asset Management In 2008, MSC started utilizing ArcFM and ESRI software for their GIS Mapping System. The water department used a Trimble handheld GPS unit to get sub-meter accuracy in locating all water assets. Along with spatially locating assets, a geodatabase was created to input all known information about each asset. Their goal is to have a fully integrated asset management program. MSC has recently received a State grant to develop an integrated Asset Management Program. Once developed, the program will utilize the existing ESRI/ArcFM Water System Mapping information to develop a process for prioritizing and choosing water system projects.
Assessment of Drinking Water Facilities and Service Areas January 2020
28
Metering In 2005, MSC upgraded to an AMR System. This system uses an unlicensed radio system to obtain meter readings in a drive by process. All water services are metered with 90% of meters indoors and 10% in meter pits. In 2005, the MSC did a total meter replacement on all meters older than 1997 and retrofitted newer meters. The MSC uses small and large portable meter testers to certify meter accuracy. With the AMR system approaching the end of its life cycle, MSC is exploring the option of converting to an AMI System. System Controls MSC's SCADA system monitors and operates the water production, treatment, and storage facilities through an integrated control system. All operations of the water system including site security are monitored, controlled, and reported on by the SCADA System.
Finances Revenue Generation MSC reports that current revenue is not sufficient to meet water enterprise costs and that the electric department has been subsidizing the water department. However, rate increases and borrowing changes are being implemented to address this over the next two to three years. MSC currently has no outstanding third-party water enterprise debt.
MSC’s rate structure includes a demand charge based on metered use, and charges based on tap size for public and private fire protection, and meter size for the customer charge. Water rates were increased by about 12 percent this year and are planned to increase another 9 percent next year.
MSC’s water charges are among the highest in the state, averaging about $44.75 per month, which results in an Affordability Index of 0.86 percent at the MHI of $59,773.
Reserves MSC has a combined, unrestricted reserve account for both the electric and water departments.
Capital Plans MSC maintains a five-year CIP. The most recent CIP includes a variety of main rehabilitation, asset management, well rehabilitation and AMI implementation projects, along with one main extension project, as summarized in Table 3-6.
Table 3-6. Summary of Drinking Water CIP for New Castle
CIP Item Budget
Delaware St 12th Main extension $113,000
FTR Well Rehab $30,000
AMI System $240,000
AMI System $240,000
SL Well Rehab $30,000
AMI System $240,000
BR Well Rehab $25,000
TOTAL $918,000
Assessment of Drinking Water Facilities and Service Areas January 2020
29
Newark
Utility Overview Service Area Newark water system serves an area of approximately 12 square miles in northwest New Castle County, near the Maryland state line. The system serves a year-round population of approximately 40,000 through roughly 10,000 residential, commercial and industrial connections.
Underserved Communities Newark reports having no plans to extend water service.
Supply and Treatment Water Supply Newark replies on both groundwater and surface water for supply, with two systems – the Curtis Surface Water Treatment Plant and the South Well Field (SWF) Groundwater Treatment Plant.
Curtis draws surface water from the 317 MG Newark Reservoir (constructed in 2006) on White Clay Creek, from which Newark is permitted to withdraw 18 MGD. Aerators were added to the reservoir within the past five years.
The SWF draws groundwater from four active wells in the Columbia Aquifer (from 62 to 81 feet below grade). These wells – three of which are 10-inch diameter and one which is 18 inches – have a combined capacity of 1,105 gpm or 1.59 MGD. A fifth well screened in the Lower Potomac aquifer (128 feet below grade) is currently out of service due to elevated VOC levels.
The Newark water system also has two interconnections with Suez/United and one with Artesian.
Treatment The Curtis facility was originally constructed in 1992, consisting of conventional surface water treatment and fluoridation. The plant has a capacity of 4.3 MGD. Two additional filter units were installed in 2006 and the facility was rehabilitated in 2014. In 2018-2019, the treatment plant underwent a major improvement involving the conversion from liquid chlorine to sodium hypochlorite, insulated roof/wall panels, HVAC upgrades, and architectural improvements. The Trident Filters (rapid sand filters) are open top units resulting in a corrosive and humid environment that require ongoing maintenance and replacement of equipment. A more modern filter technology upgrade will likely be assessed in the next 5 to 10 years. An onsite diesel generator is used to power the facility in emergencies.
The SWF was originally constructed in 1956. The Treatment Plant was constructed in 2002 and most recently re-bedded with filter media in 2016. Prior to the construction of the treatment plant, all wells pumped into a storage tank where the water was chlorinated and then sent into the distribution system. Due to increasing iron and manganese levels the City constructed the SWF treatment plant. Water first enters an equalization tank and air stripper (for VOC removal) and then is pumped to a Greensand Plus filtration system for iron and manganese treatment, sodium hypochlorite disinfection and fluoridation. A portable generator is used to power well pumps and treatment systems as needed. Within the past five years, Newark has replaced the filters/media and performed pump and VFD efficiency upgrades. Replacement of the air stripping system is imminent. The SWF has a treatment capacity of 2.06 MGD. A portable generator is used to power the SWF in case of power failure.
Capacity and Demand Newark reports an average daily demand (ADD) of 3.4 MGD and a maximum day demand (MDD) of 3.8 MGD with system capacity reported to be 6.38 MGD.
Assessment of Drinking Water Facilities and Service Areas January 2020
30
Water Quality As part of the EPAs Unregulated Contaminant Rule #3, the City sampled in 2014 and 2015. Two groundwater samples had detectable PFOA concentrations, both at 21 parts per trillion. Additionally, all the wells have some VOCs which began to be detected in 2002. Air stripping at the SWF treatment facility is used to control VOCs.
Article VII, Water Resource Protection Regulations, of Chapter 30 of Newark’s Code of Ordinances, establishes wellhead resource protection areas, recharge protection areas and surface water protection areas. The City partners with Christiana Healthy to improve and protect source water quality in White Clay Creek, mostly via BMPs on private properties. White Clay Creek is a Wild and Scenic River.
Distribution Storage Tanks In addition to the two raw water storage units mentioned above, Newark’s distribution system includes nine (9) finished water storage tanks, ranging in size from 0.175 to 3.2 MG, as detailed in Table 3-7.
Table 3-7. Newark Water System Storage Facilities
Type Type Construction Total Capacity Location Year Built
Ground-Level Steel 500,000 Gallons South Well Field 1961
Clear Well Concrete 175,000 Gallons Curtis Treatment Plant 1965
Reservoir Bank-side 317 Million Gallons (Raw) Newark Reservoir 2006
Storage tanks are maintained on a regular basis, and lead-free paints are now used; however, some of the tanks are coated with older, lead-containing paint. Booster/Pump Stations Newark maintains five (5) booster pump stations with a total of 11 pumps. Additionally, the Curtis and SWF water treatment plants have a total of five (5) finished water pumps. Pumps are listed in Table 3-8.
Table 3-8. Newark Water System Pumps
Pump No. HP Capacity Location
1 200 3200 GPM Curtis Water Treatment Plant #1
2 200 3200 GPM Curtis Water Treatment Plant #2
1 125 1055 GPM South Well Field #1
2 125 800 GPM South Well Field #2
3 200 1165 GPM South Well Field #3
Assessment of Drinking Water Facilities and Service Areas January 2020
31
1 60 1000 GPM Academy Street Booster #1
2 75 1500 GPM Academy Street Booster #2
3 15 750 GPM Academy Street Booster #3
1 20 310 GPM Paper Mill Booster Pump #1
2 60 825 GPM Paper Mill Booster Pump #2
1 30 850 GPM Northwest Booster Pump #1
2 30 850 GPM Northwest Booster Pump #2
1 5 - Arbor Park Booster Pump #1
2 5 - Arbor Park Booster Pump #2
1 3 - Evergreen Booster Pump #1
2 3 - Evergreen Booster Pump #2
Onsite generators are used to power pumping systems in emergencies. Distribution Piping Newark reports having 136 miles of mostly ductile iron and cast-iron distribution piping, along with some PVC and Transite. Mains range from 4 to 16 inches in diameter. The oldest pipe is downtown (e.g., Main Street), dating to 1888. The most problematic areas are associated with unlined cast iron pipe installed in the 1960s.
Within the past five years, Newark has replaced over 4 miles of water main, upgraded booster systems, and implemented the SCADA system.
Lead containing joints are commonly encountered in services and are replaced with all copper piping when discovered.
Asset Management The locations of distribution system components are digitized in GIS. The City's water asset management program is managed through GIS and real-time field reporting applications. The GIS data were used in developing a hydraulic water model of the distribution system. Additionally, various data stored in the GIS provide City staff the tools to prioritize specific water mains for rehabilitation.
Priorities for Newark include reducing main breaks, discolored water and low-pressure areas. They have instituted an annual unidirectional flushing program and continue to reduce dead ends in the system. They are also creating a new pressure zone for homes located on a hill within the city. The system currently has a very large pressure zone that accounts for 60 to 70 percent of the service area. Newark is beginning to add main/district meters on pressure zones.
Metering A Honeywell AMI metering system is used, covering 100 percent of customers. System software allows for automated letters informing customers of potential leaks detected. System Controls Newark's SCADA system monitors and operates the booster stations, storage tanks and treatment plants. It should be built out in two years.
Finances Revenue Generation Newark’s water enterprise is not sufficient to recover costs. Newark’s rate structure is based solely on consumption; there is no convenience fee, although there have been proposals for a meter charge. They
Assessment of Drinking Water Facilities and Service Areas January 2020
32
have an inclining block rate structure. The University does not pay property tax, so they make it up through transfers.
Newark’s water charges are above average for New Castle County, averaging about $39.21 per month, which results in an Affordability Index of 0.97 percent at the MHI of $54,590.
Reserves Newark has a reserve account.
Capital Plans The Newark maintains a five-year CIP, as summarized in Table 3-9. The most recent CIP includes valve inspection, exercising and rehabilitation, source water protection, well restoration, backup generation, a new pressure district, interconnection, SWF air stripper replacement, SCADA system build-out, main replacement, tank maintenance and equipment replacement. Water main improvements which include lining/cleaning is programmed at about $1M/year for the next 5 years. Table 3-9. Summary of Drinking Water CIP for the Newark
CIP Item Budget
Newark Reservoir Upgrades $1,600,000
Laird Tract Well Field Restoration $2,025,000
Backup Generation at Water Facilities $125,000
Roseville Park Pressure District $275,000
Academy Street Interconnection Pump Station $590,000
Air stripper replacement - south well field $2,582,695
Well Restoration Program $145,000
Water SCADA System $350,000
Water Main Replacement Program $5,750,000
Equipment Replacement Program $502,701
TOTAL $13,945,396
Wilmington
Utility Overview Service Area Wilmington’s water system serves a population of 107,976 through 37,495 connections over about 32 square miles in northern New Castle County.
Underserved Communities Wilmington reports no underserved communities in the vicinity.
Supply and Treatment Water Supply Wilmington sources drinking water from a river intake on Brandywine Creek, via a raceway that was recently rehabilitated.
Assessment of Drinking Water Facilities and Service Areas January 2020
33
Treatment Wilmington’s system includes two treatment plants. The Brandywine Filter Plant was originally constructed in 1910 and was upgraded to a 14 MGD membrane filtration facility (using microfiltration) in 2013. The plant can treat up to 14 MGD in warm weather and 8 MGD in cold weather. The Porter Plant was originally constructed in 1955, with additional construction in 1966. Upgrades have been made consistently over the years. Porter includes conventional surface water treatment, chlorination and fluoridation and has a design capacity of 36 MGD. Both plants are powered by onsite generators during power outages.
Within the past five years, Wilmington has upgraded the Brandywine clearwell and added ferric coagulation tanks and air scour at Porter. They are planning to rehabilitate three claroflocculators at Porter which is also scheduled for a lime storage silo upgrade in 2019.
Wilmington reports that raw water pumping is the utility’s single largest operational cost and accordingly, the system is set up to pump two hours off-peak, to take advantage of the lower electrical rate.
Capacity and Demand Wilmington reports a current system capacity of 43 MGD, an ADD of 16.4 MGD and an MDD of 19.6 MGD. Wilmington projects growth to an ADD of about 19.6 MGD by 2030.
Water Quality Wilmington has not reported exceedances of primary or secondary drinking water standards and is not aware of the presence of emerging contaminants in their source water.
Wilmington does have an active source water protection program17, partnering with the Brandywine Conservancy on water quality protection programs throughout the watershed, most of which is in Pennsylvania.
Pursuant to the Delaware Source Water Protection Law of 2001, the City has delineated a Source Water Protection Area (SWPA) within the city limits and is proposing requirements in the SWPA that will protect water quality.
Distribution Storage Tanks Wilmington replaced Cool Spring Reservoir, which was originally built in 1875 as a finished water reservoir, with a buried clear well in 2006. The reservoir and surrounding area was converted into a new city park which opened in 2009.
Wilmington has nine (9) elevated finished water tanks, ranging in size from 0.1 to 2.2 MGD. Most of the tanks date back to 1957, although other tanks were installed in 1960, 1967 and 1982. The tanks are maintained regularly and painted approximately every 7 years using lead-free paint in accordance with HB 456.
Booster Stations Wilmington has eight (8) booster stations, summarized in Table 3-10Table 4-7.
Table 3-10. Wilmington Booster Pump Stations Station Name Number of
Distribution Piping Wilmington reports maintaining about 447 miles of water mains ranging in size from 1 to 48 inches in diameter. The mains are undersized in various areas and old mains (some dating to the 1800s) are located throughout the city. The City is actively increasing the rate of small main replacement, replacing 2- and 4-inch pipes with at least 6-inch to support fire flows.
The City is also actively replacing lead-containing service lines; everything from the corporation stop to the home is customer’s responsibility however. Copper is used for new pipes, and if they come across lead they replace with galvanized/copper service. They report having replaced between 80 and 85 percent of the lead services and are accelerating replacements, as programmed into their CIP.
The City is also developing a more aggressive hydrant flushing and valve exercising program, which has been ongoing for the past 6 years.
Asset Management Wilmington has a developed asset management program including an inventory and mapping of most system components. They have created a position to investigate leaks using acoustic leak detection, rusty water complaints, visible water and increased dry weather flow (all tracked daily). They have an AWWA model in place that is used to prioritize the replacement of their mains. The City uses their pump station meters to estimate flows going to different pressure zones and estimate a high NRW rate averaging 6.5 MGD (almost 40 percent based on ADD).
Metering Wilmington installed an AMR system between 2003-2006. They are now actively replacing their meters with AMI, which requires changing out domestic meters to 100W Badger units. The City cites improved leak detection as one of the drivers toward full AMI implementation. The City reports a relatively high rate of apparent loss. To date, approximately 85 percent of the meters have been replaced since 2016. They have programmed the remaining 15 percent as a capital project to wrap up by end of calendar year 2019.
System Controls Wilmington has a SCADA system for plant operations, elevated tanks and pump stations.
Assessment of Drinking Water Facilities and Service Areas January 2020
35
Finances Revenue Generation Wilmington reports that their water and sewer enterprise fund generates sufficient revenue. The City does not issue revenue bonds.
Wilmington conducts a rate study annually. They charge an availability fee which includes the first 2,000 gallons of consumption. Costs for additional usage is tiered, using an inclining block structure.
Wilmington’s water charges are about average for New Castle County, averaging about $32.53 per month, which results in an Affordability Index of 0.67 percent at the MHI of $40,221.
Reserves Wilmington maintains a newly created capital reserve account. The reserve account is restricted to the water enterprise and they have a goal to have 60 days of operating funds in reserve. They also have a rate stabilization fund.
Capital Plans Wilmington completes a biennial six-year CIP in even numbered years. Their Public Works (combined water/sewer) funding is approximately $185,000,000 over the latest six-year period of FY 2020-2025. It includes $22.5M for major water improvements, $17M for Porter Filter Plant improvements, $12M for transmission main improvements, and $3M for pressure zone reliability improvements, as indicated in Table 3-11. Table 3-11. Summary of Drinking Water CIP for Wilmington
CIP Item Budget
Annual water improvements $22,500,000
Porter Filter Plant improvements $17,000,000
Hoopes Dam $7,000,000
Transmission Main Improvements $12,000,000
Pressure zone reliability improvements $3,000,000
Pumping Station Improvements $1,500,000
TOTAL $63,000,000
Assessment of Drinking Water Facilities and Service Areas January 2020
36
4. FACILITIES IN KENT Kent Overview All nine (9) of the municipal drinking water utilities in Kent supply, treat and distribute water within their service areas. A summary of each utility’s major characteristics and infrastructure is provided in Table 4-1.
Table 4-1. Kent Municipal Drinking Water Utility Characteristics
Drinking Water System Service
Area (mi2)
Population Served
# Wells
# Storage Tanks
Miles of Pipe
ADD (MGD)
MDD (MGD)
Camden-Wyoming 3.8 5,000 3 3 37 0.5 0.8
Clayton 1.83 2,981 3 2 23.7 0.19 0.27
Dover 23.7 37,686 21 7 227.8 5.01 7.67
Felton 1 1,566 2 1 1.3 0.1 0.13
Frederica 1.9 750 2 1 4.8 0.08 0.1
Harrington 11 3200 3 1 11.8 0.23 0.24
Magnolia 2.44 235 3 1 3.2 0.06 0.24
Milford 9.89 9,882 12 4 82 2.75 4.36
Smyrna 6.01 11,584 4 3 64.5 0.92 1.02
TOTAL 61.6 72,884 53 23 456.1 9.8 14.8
ADD = Average daily demand. MDD = Maximum day demand.
Based on self-reported system capacities and average and peak daily flows, supplemented by water supply data from the DNREC Water Allocation Program, municipal utilities in Kent have a combined capacity of approximately 22.8 MGD, an average daily demand of approximately 9.8 MGD (43 percent of capacity) and a peak daily demand of approximately 14.8 MGD (65 percent of capacity).
Since the first drinking water need assessment completed in February of 2015, municipal drinking water utilities in Kent now serve about 7,000 more people, an increase of approximately 10 percent. Likewise, distribution facilities have increased by approximately 13 percent, with three new storage tanks and approximately 47 miles of additional (extended) water main. Finally, it appears that the number of wells utilized by these utilities has decreased by about 15 percent, although this may in part be due to reporting discrepancies by utilities (e.g., reporting only those wells that are currently in use rather than all their wells, active and inactive). However, it is believed that the number of wells used by Kent utilities has in fact decreased, as some older, smaller wells have been replaced by a smaller number of newer wells with higher capacities.
On average, Kent utilities provide the most affordable water service in Delaware, as summarized in Table 4-2.
Assessment of Drinking Water Facilities and Service Areas January 2020
37
Table 4-2. Affordability Metrics for Kent Water Providers
Drinking Water System
Average Monthly Charge
Conservation Signal
UNC-EFC Affordability
Index
2019 MHI Affordability Index
Camden-Wyoming $34.89 $4.96 0.68% $65,440 0.64%
Clayton $31.00 $4.00 0.60% $64,992 0.57%
Dover $17.50 $3.00 0.45% $49,738 0.42%
Felton $27.00 $3.40 0.63% $52,059 0.62%
Frederica $38.03 $6.00 0.84% $47,292 0.96%
Harrington $27.92 $3.25 0.84% $39,805 0.84%
Magnolia $18.33 $- 0.49% $75,938 0.29%
Milford $16.50 $4.00 0.42% $52,576 0.38%
Smyrna $20.29 $5.07 0.45% $54,675 0.45%
TOTAL $25.72 $3.74 0.60% $55,835 0.55%
Estimates of the replacement value of utility assets for Kent municipal drinking water systems are summarized in Table 4-3.
Table 4-3. Estimated Present-Worth Replacement Value of Kent Municipal Drinking Water Assets
Drinking Water System Wells/Treatment Storage Tanks Mains and Appurtenances Total
TOTAL $54,458,896 $37,103,227 $419,256,136 $510,818,259
Water distribution mains and appurtenances represent a full eighty-two percent (82%) of the replacement value of municipal drinking water infrastructure in Kent. Water supply (e.g., wells), pumping and treatment infrastructure represent about 11 percent and storage tanks the remaining 7 percent of asset replacement value.
As indicated in Table 4-4, Annual Investment rates for Kent utilities range from 0.6 to 6.3 percent of total asset value.
Assessment of Drinking Water Facilities and Service Areas January 2020
38
Table 4-4. Kent Drinking Water Utility 5-Year CIP Summary
Drinking Water System CIP? 5-Year CIP Budget Annual Investment Ratio
Camden-Wyoming YES $250,000 0.1%
Clayton NO N/A N/A
Dover YES $11,199,600 0.8%
Felton NO N/A N/A
Frederica NO N/A N/A
Harrington YES $28,000 0.0%
Magnolia NO N/A N/A
Milford YES $9,350,000 2.0%
Smyrna YES $36,091,500 11.8%
TOTAL $56,919,100 2.2%
Descriptions of each municipal utility’s service area, infrastructure, planning and financial characteristics are provided in subsequent subsections.
Camden-Wyoming Sewer and Water Authority
Utility Overview Service Area The Camden-Wyoming Sewer and Water Authority (CWSWA) serves an area of approximately 3.8 square miles in Camden and Wyoming, DE in central Kent, representing a population of approximately 5,000. CWSWA reports 2,288 residential and 288 commercial connections.
Underserved Communities CWSWA reports having capacity to serve additional areas. Although no underserved communities in the area were identified by DNREC, CWSWA representatives identified neighborhoods near Upper King Road and Lochmeath Way in need of public water. CWSWA representatives indicated that although these areas could be served by CWSWA, a private utility holds the CPCN for the areas, restricting CWSWA’s involvement.
Supply and Treatment Water Supply CWSWA operates three (3) supply wells with a reported total capacity of 2.3 MGD. Two wells (one 10” and one 12”) extend into the deeper Piney Point aquifer and one 10” well draws from the shallower Cheswold aquifer. One of the Piney Point wells and a wellhouse has been installed within the past five years.
Portable generators are used to power mechanical equipment including well pumps when needed.
Treatment CWSWA provides chlorination and fluoridation only.
Capacity and Demand CWSWA reports an average daily demand (ADD) of 0.5 MGD and a maximum day demand (MDD) of 0.8 MGD versus a capacity of about 2.3 MGD. Most demand is from residential customers. Growth is expected
Assessment of Drinking Water Facilities and Service Areas January 2020
39
to increase demand by about 0.1 MGD (ADD) by 2030. CWSWA reports no problems meeting fire flow or peak demands.
Water Quality CWSWA has not reported exceedances of primary or secondary drinking water standards and is not aware of the presence of emerging contaminants in their source water. CWSWA’s Source Water Assessment was last updated in 2018. Both aquifers used by CWSWA are confined and current land use near the wells is described as residential.
Distribution Storage Tanks CWSWA maintains three (3) elevated storage tanks – two (2) 1 MG tanks built in 2001 and 2017, and one (1) 0.3 MG tank built in 1983. CWSWA has a contract for regular storage tank maintenance including the use of lead-free paints in accordance with HB 456.
Distribution Piping Water mains include about 37 miles of ductile or cast iron (estimated to total approximately 30 percent of the system in 2014) and PVC (used for all new installations), ranging in size from 1-1/2 to 12 inches in diameter. The oldest pipes are in the centers of each town. Replacement of old 4-inch and 6-inch water mains along the streets in the centers of each town (e.g., Main Street in Camden and Railroad Ave. in Wyoming) is a priority. CWASA also plans to cross the DCR railroad with a 12-inch PVC C-900 water pipe sleeved in a 24-inch steel casing.
The distribution system is described as well-looped, minimizing water quality issues within the network.
Older service connections have lead goosenecks. These are replaced with PVC SDR 9 whenever they fail.
Asset Management CWSWA does not appear to have a formal asset management program; however, line locations are digitized in GIS and a water balance is completed monthly. CWSWA reports the following recent annual totals:
• Withdrawal of 149,000,000 gal.
• Metered/sold/billed: 101,000,000 (32% total NRW)
• Leaks: 150,000 gal.
• Hydrants: 10,000 gal.
• Flow testing: 13,000 gal.
• Vacuum truck: 27,000 gal.
• Fire house: 110,000 gal.
Based on these figures, CWSWA has an NRW of approximately 32 percent, with virtually all the NRW being unaccounted losses.
Locations of valves and hydrants are known and CWSWA is proactive in maintaining and replacing them as needed.
Metering More than 1,000 of the original (circa 1983) meters have been replaced with radio read AMR meters. CWSWA has approximately 80 manual read meters remaining. Using the AMR meters, CWSWA’s billing processes can flag high flows, so that the customer can be notified proactively.
Assessment of Drinking Water Facilities and Service Areas January 2020
40
System Controls CWSWA does not currently have a SCADA system for their supply, treatment or distribution systems.
Finances Revenue Generation CWSWA reports that current revenues are sufficient to meet the cost of the water enterprise. Water rates are based on an availability fee plus a metered usage charge. Residential and non-residential customers pay the same rates.
CWSWA’s water charges are higher than average for Kent, averaging about $34.89 per month, which results in an Affordability Index of 0.64 percent at the MHI of $65,440.
Reserves CWSWA maintains a reserve account, estimated to be approximately 20 percent of the total annual budget of the water enterprise. The reserve account is not restricted to certain projects or systems.
Capital Plans CWSWA provided a summary of projected water distribution system projects, showing prioritization (short-term, intermediate-term, long-term) and ranking of projects. Rehabilitation of wells, meter replacement, and modest extension of the distribution network appear to be the highest priorities in the short term, with pipe replacement and rehabilitation also planned. CWSWA’s CIP includes future development of a Leslie Drive main for $250,000.
Historically, CWSWA shied away from using DWSRF funds due to legislative restrictions and the soft costs associated with loan administration.
Clayton
Utility Overview Service Area The Clayton water system serves an area of approximately 1.83 square miles and is situated in the north-central portion of Kent and the south-central portion of New Castle County. Clayton’s system serves a population of 2,981 via 1,294 connections.
Underserved Communities Clayton reports having limited or no capacity to serve additional areas. The town includes developments that were approved over a decade ago but are only recently being built and population and water demand is expected to double within 20 years. It is believed that private utilities are better positioned to serve new development in areas west of town, rather than have them annexed into Clayton.
Supply and Treatment Water Supply Clayton operates three (3) supply wells – two (2) 4” wells and one (1) 6” well – with a reported total supply capacity of 1.7 MGD. All the wells extend to 320-340 feet below grade (fbg) into the Rancocas aquifer.
Clayton has a contract to purchase water from Artesian via an interconnection on Underwood Road southwest of town.
A diesel-powered generator is provided at the water treatment plant (WTP) and can run the two wells sited there. Well #3 is more remotely located and does not currently have an onsite generator.
Assessment of Drinking Water Facilities and Service Areas January 2020
41
Treatment Clayton has a WTP including Greensand filtration for arsenic removal, chlorination and fluoridation which serves the two co-located wells. The WTP was constructed in 2008. The remotely-located well #3 is not connected to the WTP.
Solar panels were installed on the roof of the WTP to supplement power demands.
Capacity and Demand Clayton reports an ADD of 0.19 MGD, an MDD of 0.27 MGD and a treatment capacity of 1.232 MGD. Clayton reports that seasonal water demand for irrigation is relatively high.
Water Quality Clayton has not reported exceedances of primary or secondary drinking water standards and is not aware of the presence of emerging contaminants in their source water.
CWSWA’s Source Water Assessment was last updated in 2014. Wellhead protection areas are identified in the Town’s Comprehensive Plan and the Town has an ordinance to enforce wellhead protection.
Distribution Storage Tanks CWSWA maintains two (2) 100,000-gallon elevated storage tanks; one is 45 and the other is 36 years old. CWSWA has a contract for regular tank maintenance including the use of lead-free paints in accordance with HB 456.
Distribution Piping Water mains include about 23.7 miles of cast iron and PVC (which is estimated to comprise 80 percent of the system and used for new installations), ranging in size from 2 to 12 inches in diameter. The oldest pipes (~66 years old) are in the center of town.
Installing isolation valves, replacing aging (and often undersized for fire flow) mains and increasing looping within the distribution system are ongoing capital priorities for the Town.
Clayton reports having some lead service lines. They prefer to replace these in conjunction with main replacement or rehabilitation efforts.
Asset Management Clayton received a grant from the State to complete an asset management plan (AMP) in 2018. They are starting to use the AMP to direct capital planning and spending. Their distribution system is mapped in GIS.
Metering The Town has a drive-by read AMR metering system.
System Controls The WTP, water towers and well pumps for the two co-located wells are connected to the Town’s SCADA system; however, the remote well #3 is not.
Finances Revenue Generation The Town reports that current revenues are sufficient to meet the cost of the water enterprise. Water rates include a base charge for the first 2,000 gallons and then a usage fee for each additional 100 gallons.
Clayton’s water charges are about average for Kent, averaging about $31.00 per month, which results in an Affordability Index of 0.57 percent at the MHI of $64,992.
Assessment of Drinking Water Facilities and Service Areas January 2020
42
Reserves The Town has recently created a reserve account restricted to the water enterprise and estimated to be approximately 7 percent of the total annual budget of the water enterprise.
Capital Plans Clayton does not currently provide a capital improvement plan, although rehabilitation and improvement of the distribution network appear to be the highest priorities in the short term. They are using their ongoing asset management planning process to begin development of a more formal CIP.
By charter, the Town has a debt borrowing limit of $850,000.
Dover Water Department
Utility Overview Service Area Dover’s water system serves an area of approximately 23.74 square miles and includes most of Dover as well as several small areas outside of the City. The system serves a population of 37,686 through 12,729 connections.
Underserved Communities Dover reports having the capacity to serve additional customers, but that capital upgrades would be required to extend lines to underserved communities. In general, they are more focused on addressing aging infrastructure and not actively extending service. Furthermore, their Comprehensive Plan restricts expanding the water system without annexation.
Supply and Treatment Water Supply Dover currently operates twenty-one (21) supply wells, including six (6) in the shallow Columbia aquifer and fifteen (15) in the deeper Cheswold and Piney Point aquifers (see Table 4-5). Their permit limits groundwater withdrawals to 11.043 MGD, total. New well installation and rehabilitation of old wells has been completed within the past five years.
Table 4-5. Dover Water Supply Well Summary
Well ID Permit # Well Diameter (in.) Well Depth (ft.) Capacity (gpm)
12R Piney 87-0018BRM1 6 410 1,000
7 Piney 87-0018BRM1 Not available 382.33 250
11 Piney 87-0018BRM1 8 x 1-1/16 446 475
6 Piney 87-0018BRM1 8 x 1-1/2 456 800
10 Piney 87-0018BRM1 8 483.75 1,100
2 Piney 87-0018BRM1 8 x 1-1/16 500 1,150
4 Cheswold 87-0018RAM3 8 221 400
15 Cheswold 87-0018RAM3 Not available 250 500
3 Cheswold 87-0018RAM3 8 222.33 290
9 Cheswold 87-0018RAM3 6 x 1 222.75 585
1 Cheswold 87-0018RAM3 4 228 237
Assessment of Drinking Water Facilities and Service Areas January 2020
43
5 Cheswold 87-0018RAM3 Not available Not available 400
13R Cheswold 87-0018RAM3 Not available 230 250
14 Cheswold 87-0018RAM3 Not available 221 160
8R Cheswold 87-0018RAM3 6 225 350
PW-1A Columbia 92-0002M1 6 60 avg 500
PW-8A Columbia 92-0002M1 6 60 avg 300
PW-2 Columbia 92-0002M1 6 60 avg 500
PW-4B Columbia 92-0002M1 6 60 avg 400
PW-5 Columbia 92-0002M1 6 60 avg 500
PW-6A Columbia 92-0002M1 6 60 avg 500
Dover also has four interconnections with Tidewater’s system, three being for bulk purchase and one for emergency.
Dover uses one onsite diesel generator and two portable generators for back-up power for the wells and treatment systems.
Treatment The deepest wells which withdraw from the Piney Point aquifer pump directly into the system following chlorination. The wells which withdraw from the Cheswold aquifer pump directly into the system following chlorination and fluoridation.
The wells pulling from the surficial Columbia aquifer pump to the Long Point WTP, which includes ozonation, granular activated carbon adsorption, chlorination and fluoridation. The Long Point WTP was initially constructed in 1995 and major upgrades are scheduled to be undertaken in 2020. The Long Point WTP is often taken down for maintenance during the winter months.
Capacity and Demand Dover reports an ADD of 5.005 MGD, an MDD of 7.671 MGD and a permitted capacity of 11.043 MGD. Modest growth is projected to increase ADD to 5.050 and 5.385 by years 2020 and 2030, respectively.
Water Quality Dover has not reported exceedances of primary or secondary drinking water standards and is not aware of the presence of emerging contaminants in their source water.
Dover has a Source Water Overlay Zone established as part of their Comprehensive Plan. Dover also has an undated Source Water Assessment filed with the State (it is believed to date to the early 2000s).
Distribution Storage Tanks Dover’s system includes seven (7) elevated storage tanks, with the oldest installation in 1955 and the newest in 2016 (see Table 4-6). Dover has three (3) 250,000-gallon tanks, three (3) 1 MG tanks and one 1.5 MG tank. Tanks are maintained on a 10-year maintenance contract and a lead-based paint consultant has been engaged to verify that their tanks do not use lead paint.
Table 4-6. Dover Elevated Storage Tank Summary
Tank ID Installation Year Volume (gal.) Pressure Range (psi)
Assessment of Drinking Water Facilities and Service Areas January 2020
44
Garrison Oak 2016 1,500,000 45 – 60
General Foods 1963-66 250,000 45 – 60
Walker Road 1986-87 1,000,000 45 – 60
McKee Road 1974 1,000,000 45 – 60
Dover Park 1986-87 1,000,000 45 – 60
Bayard Avenue 1955 250,000 45 – 60
Kent County Aero Park 1994 250,000 45 – 60
Distribution Piping Dover’s 228 miles of water mains include a combination of sizes (1-20”), ages (oldest pipes installed in 1882) and materials, including asbestos concrete (ACP) cast iron (CIP), ductile iron (DIP), galvanized steel (GSP), high-density polyethylene (HDPE) and polyvinyl chloride (PVC). Most of Dover’s mains are ductile iron and cast iron, as indicated in Table 4-7. DIP is currently used for new installations.
Table 4-7. Dover Distribution Piping Summary
Material Installation Year Size Range (in.) Percentage of Lines (%) Line Length (mi.)
ACP 1955-1995 4-10 1.1 2.63
BCIP 1960-1967 8-10 0.6 1.55
CIP 1940-2008 2-16 37.3 90.44
DIP 1952-2018 1-16 44.5 107.95
GSP 1940-1968 1-2 0.5 1.16
HDPE 1997 14 0.0 0.07
PVC 1960-2006 4-20 4.6 11.12
UCIP 1882-1959 4-14 1.1 2.66
UNKNOWN UNKNOWN 2-12 4.2 10.17
Dover is not aware of lead-containing pipes in their system, but there could be since parts are over 100 years old.
Piping in the downtown Dover area has the worst problems.
Asset Management Water lines and appurtenances are digitized in GIS and water main replacements are the focus of ongoing capital efforts. Dover reports low NRW and line breaks per mile as a significant achievement.
Dover’s 2006 Water Master Plan and approved 5 Year Capital Plan guide projects.
Metering All users are metered using a drive-by read AMR metering system. All the meters are less than 20 years old and in satisfactory condition. Dover plans to move to AMI in the future.
System Controls The WTP, water towers and well pumps are connected to the Town’s SCADA system.
Assessment of Drinking Water Facilities and Service Areas January 2020
45
Finances Revenue Generation The City reports that current revenues are sufficient to meet the cost of the water enterprise.
Water rates are modeled in-house and the model is calibrated/verified annually. Inputs include revenues, expenses, capital assets, debt depreciation and budget balancing. Billing includes a customer charge per equivalent dwelling unit (EDU) plus a usage charge.
Dover’s water charges are low for Kent, averaging about $17.50 per month, which results in an Affordability Index of 0.42 percent at the MHI of $49,738.
Reserves The City has a reserve account restricted to the water enterprise and for bond covenants.
Capital Plans Dover provided their FY2020 capital improvement plan. Highest priorities are wellhead redevelopment and water treatment plant/water quality improvements. Installation of a new well and 1.0 MG elevated storage tank is programmed for FY21-22, as summarized in Table 4-8. Table 4-8. Summary of Drinking Water CIP for Dover
CIP Item Budget
Wellhead redevelopment $ 375,000
Future well installation $ 1,374,000
Denneys Road 1 MG elevation water storage tank $ 3,074,000
Meter replacement project $ 700,000
Water quality improvements $ 5,159,800
Water treatment plant process improvements $ 516,800
TOTAL $ 11,199,600
The City has a debt borrowing limit of 1.2 times the water income based on audited financial statements.
Felton Water Department
Utility Overview Service Area Felton serves an area of approximately 1 square mile south of Dover in central Kent. Felton reports serving a population of 1,566 through 571 connections.
Underserved Communities There are some old users that are located out of town, but the Town hasn’t had an annexation and actual hookup in a while. Their policy is to only extend lines if there is a good reason and costs are paid by a developer.
Supply and Treatment Water Supply The Town owns two (2) supply wells with a reported total capacity of about 0.67 MGD. However, they currently only operate one 12-inch x 8-inch well that extends into the Piney Point aquifer to a depth of 580 fbg. Operating the other (4-inch) well would require treatment to remove iron.
An onsite natural gas-powered generator is used to power mechanical equipment including well pumps when needed.
Assessment of Drinking Water Facilities and Service Areas January 2020
46
Treatment Drinking water is treated for naturally-occurring arsenic, which is removed in a three-phase Macrolite media filter that went online in 2007, as part of an EPA Demonstration Project. Water is also chlorinated prior to distribution.
Capacity and Demand Felton reports an ADD of 0.1 MGD and an MDD of 0.13 MGD. System capacity is reported to be 0.396 MGD. Most demand is from residential customers.
Water Quality As implied, the well currently being used has naturally-occurring arsenic, while the well that is not being used is high in iron. The Town is not aware of any emerging contaminants (e.g., PFOA/PFOS) in their water.
The Town has an undated Source Water Assessment on file with the state, but no formal source water protection program in place. The wells are located toward the outskirts of town on an approximately 20-acre site. The site is fenced in but leased out as a stone yard.
Distribution Storage Tanks Felton operates one elevated storage tank - the 200,000-gallon Walnut Street Tower which is located near the wells and was installed in 1990.
The tank is maintained on a regular basis using lead-free paints in accordance with HB 456.
Distribution Piping Felton has about 7,000 feet (1.3 miles) of distribution line with about 15 percent being PVC, and the remainder galvanized or Transite, in roughly equal proportions. The oldest pipes are in the center of town. The Town would like to replace the galvanized and Transite lines with C900 PVC. Unless the piping is found to be in excellent condition, the Town is replacing Transite pipe in conjunction with street paving projects.
Older service connections have lead goosenecks. The Town is identifying and replacing lead service lines with C-900 PVC.
Asset Management Felton is in the process of developing an asset management program under a State grant. Although all water lines have not yet been located, all valve boxes, fire hydrants and water meter pits have been GPS located.
The Town conducts a water balance based on metered/billed water. They evaluate NRW annually and report that it is relatively low.
Metering All users are metered. Some meters are touch pad (analog) and some are radio read (digital), with meter age ranging from 2 months to 30 years. The Town continues to replace old meters as needed at a rate of approximately 30 per year.
System Controls CWSWA does not currently have a SCADA system, but they do have a control panel that logs data for the treatment system.
Finances Revenue Generation Felton reports that current revenues are sufficient to meet the cost of the water enterprise.
Assessment of Drinking Water Facilities and Service Areas January 2020
47
Water rates are based on an availability fee plus a debt service charge plus a metered usage charge. Residential and non-residential customers pay the same rates; however, out-of-town rates are higher than those charged to residents.
Felton’s water charges are about average for Kent, averaging about $27.00 per month, which results in an Affordability Index of 0.62 percent at the MHI of $52,059.
Reserves Felton maintains a reserve account, restricted for use on the water system.
Capital Plans Felton does not have a capital improvement plan for the water system, as they indicate that they are awaiting the results of their asset management effort before doing so. They report having no specific upcoming projects for the water systems, although rehabilitation of the distribution network appears to be a high priority.
Felton reports having no plans for further borrowing as they are still paying off a $250,000 loan for their arsenic removal system.
Frederica
Utility Overview Service Area Frederica serves an area of approximately 1.9 square miles south of Dover in central Kent. Frederica reports serving a population of 750 through 475 connections.
Underserved Communities Frederica has the capacity to serve additional areas but have no immediate plans to do so. The system currently provides service to some schools and businesses, and about 5 houses were recently annexed. The Town is working with a developer to connect an additional 330 homes to the water system.
Supply and Treatment Water Supply The Town owns two (2) supply wells with a reported total capacity of about 1.4 MGD (however, Frederica is only permitted to withdraw about 0.13 MGD). Both wells withdraw groundwater from the Frederica aquifer. The wells are sited several hundred yards apart. The wells were redeveloped, and the well pumps serviced within the past five years.
Frederica runs their well pumps only 2-3 hours per day, per the recommendations resulting from an energy audit which was completed under a State sustainability grant.
A portable generator is used to power mechanical equipment including well pumps when needed.
Treatment Each well has its own chlorination and fluoridation system. Chemical feed pumps were replaced about five years ago. Additionally, new controls for the wells and treatment systems have been installed within the past five years.
Capacity and Demand Frederica reports an ADD of 0.08 MGD and an MDD of 0.10 MGD. Permitted capacity is 0.13 MGD, although their system appears capable of supplying more water. Frederica projects approximately a 40-percent increase in connections (and presumably demand) by 2030.
Assessment of Drinking Water Facilities and Service Areas January 2020
48
Water Quality Frederica has not reported exceedances of primary or secondary drinking water standards and is not aware of the presence of emerging contaminants in their source water.
The Town requires a 300-foot radius around each well for groundwater protection. They also have a Source Water Assessment dated November 2016 on file with the State.
Distribution Storage Tanks Frederica operates one 100,000-gallon elevated storage tank, installed in the 1930s; use of another 35,000-gallon tank was recently discontinued due to elevation and pressure issues.
The tank is maintained under contract on a regular basis using lead-free paints in accordance with HB 456. The inside of the active storage tank was scheduled to be painted at the time of the interview with utility staff.
Distribution Piping Frederica has about 25,500 feet (4.8 miles) of distribution line with about 80 percent being PVC (installed starting in 1994), and the remainder DIP which is original dating back to 1968. The oldest DIP pipes are in the center of town on Jackson and Front Streets. The Jackson Street main has been replaced, but the old DIP main is still charged, indicating that it is interconnected elsewhere in the system. Most of the Front Street main has also been replaced or fixed in the 1990s, but some old segments remain.
Dirty water recurs in two areas with DIP. They regularly flush the lines at the 6 or 7 dead ends in town but are also looking at possibly looping at the dead ends.
The Town would like to extend their mains to serve more commercial businesses out on the highway.
Older service connections have lead goosenecks.
Asset Management Frederica’s distribution system is mapped in GIS. The utility estimates 7 to 10 percent NRW.
Metering All users are metered. Manual-read meters were replaced with drive-by AMR meters beginning in the 1990s.
System Controls Frederica does not currently have a SCADA system, but they do have new control panels for the wells and chemical feed systems.
Finances Revenue Generation Frederica reports that current revenues are sufficient to meet the cost of the water enterprise.
Water rates are based on an availability fee based on tap size plus a metered usage charge. Residential and non-residential customers pay the same usage rates. Customers are billed quarterly although meters are read monthly.
Frederica’s water charges are the highest County, averaging about $38.03 per month, which results in an Affordability Index of 0.96 percent at the MHI of $47,292.
Reserves Frederica maintains a reserve account for use on the water system. The reserve account balance is estimated to be about 28 percent of the annual water enterprise budget.
Assessment of Drinking Water Facilities and Service Areas January 2020
49
They also maintain a separate account to pay off USDA loans.
Capital Plans Frederica produces an annual budget, but does not appear to have a capital improvement plan. Rehabilitation and extension of the distribution network appear to be the highest priorities in the short term.
Harrington
Utility Overview Service Area Harrington’s service area includes approximately 1,280 connections (estimated 3,200 people based on 2.5 persons per residence) within an 11-square mile area in south-central Kent.
Underserved Communities Harrington has some capacity to serve new customers. One housing development in the service area has recently restarted construction and a few other redevelopment projects are starting. They expect some growth but have not explicitly considered serving extending service to underserved communities. The underserved (for drinking water) community of Farmington is approximately 2 miles south of Harrington’s service area.
Supply and Treatment Water Supply The City owns three (3) supply wells with a reported total pumping capacity of about 770 gpm. All wells withdraw groundwater from the Frederica aquifer. Two 4-inch wells are run simultaneously, alternating with the third, 6-inch well. The City is getting ready to install a new 8-inch well and water tower at Friendship Village.
An onsite natural gas generator is used to power mechanical equipment when needed.
Treatment Water is chlorinated and fluoridated before distribution. The City reported inconsistent chlorine residuals and believed it was because of storing chlorine tablets on site for extended periods of time. Accordingly, they are looking into working with Milford to share chlorine supplies. Orthophosphorus was used for iron control, but the utility did not find it effective.
Capacity and Demand Harrington reports an average daily water demand of about 0.23 MGD and a peak day demand of 0.24 MGD. Permitted capacity is about 0.7 MGD, although their system appears to be capable of supplying up to about 1.1 MGD. The City indicates that they need all three wells running simultaneously to meet flushing and fire flow water demands. Harrington does expect some growth although demand projections were not provided.
Water Quality Harrington has not reported exceedances of primary or secondary drinking water standards and is not aware of the presence of emerging contaminants in their source water.
The City has a groundwater protection ordinance in place.
Assessment of Drinking Water Facilities and Service Areas January 2020
50
Distribution Storage Tanks Harrington operates one 200,000-gallon elevated storage tank which is about 64 years old and is installing a new 500,000-gallon tank at Friendship Village.
The City does not have a maintenance contract for its tank, but they have had it inspected and it was painted two years ago. They plan to rehab the existing tank when the new storage tank comes online.
Distribution Piping Harrington has about 11.8 miles of distribution line with about 70 percent being older DIP in the 4- to 10-inch range, and the remainder PVC in the 6- to 12-inch range. The City is actively replacing the oldest DIP pipes (from the 1940s and 1950s) with PVC of six-inch diameter or greater to ensure adequate fire flow capacity.
The City flushes mains monthly for water quality purposes. The City has done some interconnecting and looping of their distribution system in the past. They currently have an engineer looking at addressing capacity issues within their distribution system. Hydrant replacement is an ongoing effort.
The City has discovered some lead in their distribution system in the past. They always replace it with black PVC and brass. For example, they found one main with all galvanized services; however, only 3 out of 27 had lead goosenecks. The City reports always passing their Lead and Copper Rule testing.
Asset Management Harrington’s distribution system is currently being mapped in GIS; this includes all lines, valves, meters and hydrants. They are participating in the State’s asset management grant program. The utility does not have an estimate of their NRW.
Metering All users are metered. Neptune drive-by meters were installed about five years ago. Metering has helped them reduce ADD from about 360,000 gpd to about 230,000 gpd.
System Controls Harrington does not currently have a SCADA system, but they do have an alarm system on their public works building - if system pressures get too low or a well pump does not activate, an autodialer calls the operator.
Finances Revenue Generation Harrington reports that current revenues are sufficient to meet the cost of the water enterprise.
Water rates are based on a flat base rate plus charges based on metered usage. Water service is billed quarterly.
Harrington’s water charges are about average for Kent, averaging about $27.92 per month, which results in an Affordability Index of 0.84 percent at the MHI of $39,805.
Reserves Harrington’s 2020 CIP indicates that the City does have a water fund reserve. Programmed expenditures over the five-year period of 2016-2020 totaled $78,000.
Based on the 2015 Drinking Water Needs Assessment, the threshold for borrowing without a referendum is $3.5M and the debt limit is 25 percent of the assessable base.
Assessment of Drinking Water Facilities and Service Areas January 2020
51
Capital Plans Harrington provided their 2020 CIP as indicated above, although only $28,000 for fire hydrant replacement and pit replacement qualify as capital improvements. As reported during the utility interview, Harrington’s near-term focus (after significantly increasing capacity via installation of a new well and storage tank) is on improving its distribution system, as summarized in Table 4-9. Table 4-9. Summary of Drinking Water CIP for Harrington
CIP Item Budget
Fire hydrant replacement $ 28,000
Pit replacement (30 pits) $ 14,000
Water improvement projects $ 2,115,000
Water improvement projects $ 1,866,100
Water improvement projects $ 201,000
Fire hydrant replacement $ 14,000
Water telemetry monitoring system $ 50,000
Pit replacement (30 pits) $ 14,000
TOTAL $ 4,302,100
Magnolia
Utility Overview Service Area Magnolia’s service area encompasses approximately 2.44 square miles and 96 connections, serving a population of approximately 235. Magnolia is located southeast of Dover in central Kent.
Underserved Communities Magnolia reports not having sufficient capacity to serve other communities.
Supply and Treatment Water Supply The Town owns three (3) supply wells with a reported total pumping capacity of about 775 gpm. One of the wells dates to 1931. All wells withdraw groundwater from the Frederica aquifer. One well can be operated using electrical power from the fire house and is used for emergency. The utility also can rent a portable generator when needed.
Improvements made to their supply wells in the past five years include replacing their mercury level control switches with digital switches that make it easier to alternate wells/pumps.
Magnolia reports that well pump maintenance has been deferred and the pump ratings overestimate their actual flows.
Treatment Water is chlorinated and fluoridated before distribution. They also use a sequestrant for iron control. The Town reports a need to install zero flow shut-off devices for their chemical feed pumps, as well as secondary containment for their chemicals.
Assessment of Drinking Water Facilities and Service Areas January 2020
52
Capacity and Demand Magnolia reports an average daily water demand of about 0.06 MGD and a peak day demand of about 0.24 MGD. The system capacity is about 0.648 MGD. They project about a 10-percent increase in ADD by 2030.
Water Quality Magnolia reported one iron exceedance in the past five years. They are not aware of the presence of emerging contaminants in their source water.
The Town does not yet have a groundwater protection ordinance in place. They do have a Source Water Assessment on file with the State, dated January 2015. The Town reports that land use near their wells is residential.
Distribution Storage Tanks Magnolia has one 40,000-gallon elevated storage tank installed in 1946. The tank is maintained under contract, which is renegotiated every 10 years (the newest one was executed in 2018). The contract covers cleaning, painting, repairs, etc. to the water tower. They just changed out some rusted struts. The Town’s former water system operator tried to replace the tank using SRF funding but couldn’t. Tank replacement has fallen down the Town’s priority list.
Distribution Piping Magnolia has about 3.2 miles of distribution line consisting of a mix of C-900 PVC and DIP. The oldest DIP mains are downtown.
Lead gooseneck service lines are currently being replaced under a grant. Out of a total of 96 services, 15 have been replaced to date.
In addition to the replacement of lead services, supply reliability and pressure maintenance in the distribution system are priorities. There are approximately two leaks per month, usually on mains at goosenecks or shutoff valves on service lines. System pressure is relatively low (31-32 psi), which limits the working volume in the storage tank.
Asset Management Magnolia is participating in the State’s asset management grant program. Their distribution system is mapped in GIS. The utility does not have an estimate of their NRW. Significant distribution system upgrades were done in 1980, 1986, 1990, 1994, 1996, 1998, and 1999.
Magnolia is working on a comprehensive plan since they are struggling with revenue as population is decreasing.
Metering Users are not metered.
System Controls Magnolia does not have a SCADA system.
Finances Revenue Generation Magnolia reports that current revenues are sufficient to meet the cost of the water enterprise.
Water rates are flat and slightly higher out of town (a trailer park) than in town. Magnolia bills for water quarterly.
Assessment of Drinking Water Facilities and Service Areas January 2020
53
Magnolia’s water charges are low for Kent, averaging about $18.33 per month, which results in an Affordability Index of 0.29 percent at the MHI of $75,938.
Reserves Magnolia has a water reserve account which is capitalized at approximately 50 percent of the annual water budget. Use of the reserve account is not restricted.
Capital Plans Magnolia produces an annual budget, but not a CIP. The Town is currently working on a Comprehensive Plan. Based on interview responses, most of Magnolia’s spending on the water system is reactive and includes routine maintenance plus repairs to mains and corporation stops/service lines.
Magnolia’s debt is limited to 15 percent of the assessed valuation of the Town’s taxable real estate. Their debt limit is reported to currently be $297,000.
Milford Water Department
Utility Overview Service Area Milford’s service area encompasses approximately 9.89 square miles and 4,210 connections, serving a population of approximately 9,882. Milford is in southeastern Kent on the border with Sussex.
Underserved Communities Milford has both the ability and plans to extend water to underserved communities in the area. Ellendale is already working on a system and there has been some discussion within the past year about serving Lincoln. Shawnee Acres is an area within the City where some homes have service, but most do not. They would extend service to Wood Haven, Northwoods, and other areas if they annex into the City.
Supply and Treatment Water Supply The Town owns twelve (12) supply wells with a reported total capacity of about 5.22 MGD. The wells range in size from 6 to 12 inches in diameter and extend from 210 to 468 fbg, withdrawing from the Milford, Frederica, Federalsburg and Upper Choptank aquifers.
Two new wells (labeled #15 and #16) were installed to serve the southeast corridor within the past five years. The City is actively identifying and developing new wells and is currently testing a new well at the Tenth Street treatment system.
Onsite generators are used to power pumps when needed. The City would like to convert existing generators over to natural gas as the service comes available.
Treatment Milford has five (5) treatment systems. Two of the systems treat water from three wells each and three systems treat water from two wells each. Each system includes chlorination and fluoridation. Aeration for reducing hardness is also provided at three of the systems.
The dilapidated Washington Street Water Treatment Facility was demolished and replaced with a new facility located at the base of the existing water tower within the past five years. Additional upgrades to existing treatment systems are planned.
The City currently uses gaseous chlorine but would like to switch to liquid. The Seaberry treatment system is undergoing a rehabilitation of the onsite reservoir and installation of a tablet chlorinator (to get away from gas). They are also rebuilding the aerator at this site.
Assessment of Drinking Water Facilities and Service Areas January 2020
54
Several the City’s production facilities utilize VFDs on the high lift pumps to improve overall efficiency and power consumption. The City plans to upgrade those remaining pumps with VFDs.
Capacity and Demand Milford reports an average daily water demand of about 2.75 MGD and a peak day demand of about 4.36 MGD. The system capacity is reported to be 5.01 MGD. Although projections for future demand were not provided, the City appears to be actively expanding both their systems and service area.
Water Quality Milford has not reported exceedances of primary or secondary drinking water standards and is not aware of the presence of emerging contaminants in their source water.
The City added a Source Water Protection District (§230-19.5) their Code of Ordinances in 2008. Milford also has a Source Water Assessment dated July 2018 on file with the State.
Distribution Storage Tanks Milford currently has four storage tanks, summarized in Table 4-10.
Table 4-10. Milford Storage Tank Characteristics
Storage Tank Size (gal) Age
Washington 750,000
Southeast 750,000 <5 years
Tenth 500,000
LD Caulk 250,000
The tanks are maintained on a regular basis using lead-free paints in accordance with HB 456.
The City is installing an altitude valve on the last of their storage towers to allow the tanks to completely fill before the plants shut off, thus allowing the pumps to run longer and rest longer and allow the aquifers to more fully recharge before starting another fill cycle.
The City is also planning to install another new elevated storage tank to better service a business park currently experiencing low pressures in the northwest corner of the city.
Distribution Piping Milford reports having 82 miles of mains consisting of a combination of DIP, CIP, PVC and Transite piping in their distribution system. About 30 percent of the system is newer (30 years old or less) PVC. DIP and CIP (60 years old or more) each represent about 25 percent of the system. The remaining 20 percent is Transite (estimated to be 50-60 years old). Milford estimates that about 75 percent of the system is less than 35 years old, 15 percent is between 35 and 75 years old and 10 percent is over 75 years old with the oldest parts in the downtown area around the Washington Street Water Treatment Facility and in the southeast corridor.
Lead-containing service lines are present within Milford’s service area and they are proactively replacing it. A project to replace lead joints along SE Front Street will begin soon. Milford has programmed $250,000 per year for replacing lead service lines in their five-year CIP.
In addition to the replacement of lead services, the City has an active valve and hydrant replacement program.
Assessment of Drinking Water Facilities and Service Areas January 2020
55
The City is currently executing a $4M program of distribution network improvements intended to remove lead from the distribution system and to improve water quality by removing dead ends and/or adding hydrants, for more targeted flushing in problem areas.
Asset Management The Milford distribution system is digitized in GIS and the City reports maintaining a very low NRW percentage. They are currently working on an asset management grant through the State.
Metering Milford is in the process of retrofitting customer meters with AMI; they are GPSing meter locations as they go and estimate being 80-90 percent complete. They are working out the bugs with remote reading. Since Milford is also the electricity provider in the area, they are trying to get the water and electric meters to communicate using 17 data hubs and a 17-mile ring of fiber. They have begun using the AMI system for billing – AMI electric metering began in July 2018 and AMI water metering began in December 2018. The meters read in 15-minute increments and they have developed a customer portal.
Flow meters at all well sites are calibrated annually. The City diligently monitors contractor and fire service water usage. Meters at the plants are radio read and are approximately 20 years old. The intent is to also upgrade these meters to AMI soon so that all meters can be read remotely.
System Controls Wells, generators, high lift pumps, reservoirs and towers are all monitored by the City’s SCADA system. The City is upgrading their existing SCADA system to optimize the efficiency of the water production facilities and improve their ability to perform preventative maintenance. The City is working on adding instrumentation and upgrading the SCADA system to incorporate newer technologies. The City wants to be able to monitor all systems remotely via web. They also want to install in-line chlorine monitors at treatment plants.
Finances Revenue Generation Milford reports that current revenues are sufficient to meet the cost of the water enterprise.
Water rates are different between residential and commercial customers, but both include a flat fee (based on meter size and type) plus a tiered usage rate. A consultant is currently doing a cost of service study to recommend new rates. Out-of-town rates are currently 1.5 times the in-town rates.
Milford’s water charges are the lowest in Kent, averaging about $16.50 per month, which results in an Affordability Index of 0.38 percent at the MHI of $52,576.
Reserves Milford has a water reserve account that funds the enterprise. The cost of service study will recommend reserve account contributions. Approximately 33.5 percent of the City’s overall reserve funds are water reserves. Use of the reserve account is not restricted, but the City is working on a fund balance policy.
Capital Plans Milford’s five-year CIP includes over $9M in water enterprise spending. The main projects have been described above and include a combination of supply, treatment, control and distribution system expansion and improvements, as summarized in Table 4-11. Table 4-11. Summary of Drinking Water CIP for Milford
Standardized Water Treatment Facility Controls 150,000
Assessment of Drinking Water Facilities and Service Areas January 2020
56
Install Automated Blow-off Valves 200,000
Seabury Water Treatment Facility Upgrades 2,000,000
Replacement of Lead Water Service Lines 1,000,000
New NW City Area Tower/Wells/Treatment 5,000,000
TOTAL 9,350,000
Smyrna Water Department
Utility Overview Service Area Smyrna’s service area encompasses approximately 6.01 square miles and 3,684 connections, serving a population of approximately 11,584. Smyrna is located adjacent to the Clayton in north-central Kent on the border with New Castle County.
Underserved Communities DNREC did not identify underserved communities near Smyrna, however, the Town does report having capacity to serve additional areas. As reflected in their CIP, Smyrna needs to install another well on the south side and more storage north, ultimately resulting in a total of four active wells and four elevated storage tanks. The type of business(es) that might occupy their industrial park could impact capacity and future ability to serve.
Supply and Treatment Water Supply The Town owns four (4) supply wells, although one serves as a backup. The three active wells are 6-inch diameter and extend to a depth of 100 fbg, drawing water from the surficial Columbia aquifer. Cumulative pumping capacity is 2,350 gpm. Well sites have onsite generators for backup power.
One of the wells has been redeveloped within the past five years.
Treatment Each of their three well sites (one has two wells – one active and one backup) has its own treatment system consisting of Greensand filters (recently upgraded to Greensand Plus which does not require potassium permanganate for recharge), chlorination (sodium hypochlorite and gaseous), and fluoridation.
The oldest treatment system was installed in 1950 but was most recently upgraded in 2011.
Eventually the Town will have four well sites, four treatment systems and four elevated storage tanks.
Capacity and Demand Smyrna has a permitted allocation of approximately 2 MGD but reports their system capacity as 1.4 MGD. Their average and peak daily flows are both reported to be about 1 MGD.
Water Quality Smyrna reports having iron issues in Well #3. They may need to rehabilitate or replace Well #3 to address the iron issue, although it has been determined that this is a source water issue, not a well issue. There is an engineering report and addressing the problem is reflected in the City’s CIP. Smyrna reports that consumers are generally happy with the water quality and they receive few/no complaints.
The utility reports no exceedances of water quality standards, although they did have a failure to do Lead and Copper Samples in 2016. They are unaware of the presence of emerging contaminants in their water.
Assessment of Drinking Water Facilities and Service Areas January 2020
57
Smyrna reports that their wellheads are protected using fences surrounding the properties and alarm systems on the treatment buildings. Smyrna has a Source Water Assessment dated September 2003 on file with the State.
Distribution Storage Tanks Smyrna operates three elevated storage tanks: The Eagles View tank is about 13 years old and 750,000 gallons, the Monrovia tank is about 53 years old and 400,000 gallons and the Carters Road tank is about 19 years old and 250,000 gallons. The tanks are maintained under contract with a company that cleans and paints the tanks using lead-free paint in compliance with HB 456.
Smyrna also has three booster pump stations: two are eight years old (since major renovation) and one is 18 years old. Onsite and portable generators are used for backup power at booster stations.
The Town is planning a new water tower for the north end of town.
Distribution Piping Smyrna has 64.5 miles of mains and has been actively working to determine the age and condition of their distribution piping for the past 12 years. They report a combination of CIP, PVC and Transite pipe, with Main Street, Commerce Street and Delaware Street having the oldest pipe with the most significant problems.
Within the past five years, the water distribution system was extended about 1 mile, to the rest area north of Duck Creek. Smyrna has also completed some rehabilitation and replacement of water lines on Commerce Street between Market and East.
The Town was not aware of any lead-based service lines in their system.
New infrastructure planned in the next 5 to 10 years is described in the CIP under “development-driven projects”. These include annexation of a new development into town and plans for serving the new industrial park.
Asset Management As indicated, Smyrna continues to work on assessing their distribution network, currently through a State asset management grant being supported by KCI Engineering. Part of their system has been digitized in GIS.
Metering All commercial, industrial and residential water use is metered. Only the water at a fire hydrant fill station along Carter Road is not metered.
Residential meters were replaced in 2003 and 2004 and equipped with 50W AMR meters to allow drive-by reading. Smyrna is in the process of replacing the AMR meters to 100W AMI units to allow for remote reads. This change should allow Smyrna to transition from AMR to AMI and allow them to read water meters every 2 hours and better detect leaks. Their goal is to replace all AMR meters with AMI within the next 3 or 4 years.
Meters are required to be placed within the structure of the building. Smyrna also has approximately 20 manual read meters that they are hoping to replace, depending on size, location and usage. They also still have a few commercial meters located within insulated piping above ground.
Meter calibration is conducted during the installation of a new water meter or when requested by a customer. The water technician takes a read of the water meter, then fills a five-gallon bucket and verifies that the meter read increased by 5 gallons.
Assessment of Drinking Water Facilities and Service Areas January 2020
58
System Controls Smyrna does not currently have a SCADA system, but new SCADA systems for both water and wastewater are listed as high priorities in their CIP.
Finances Revenue Generation Smyrna reports that current revenues are sufficient to meet the cost of the water enterprise.
Meter reading is conducted every month. Rates are the same for all customer classes and based on an initial service charge which includes the first 3,000 gallons and then an increasing block rate structure for demand over 3,000 gallons.
Smyrna’s water charges are below average for Kent, averaging about $20.29 per month, which results in an Affordability Index of 0.45 percent at the MHI of $54,675.
Reserves Information not available.
Capital Plans Smyrna updates their 10-year CIP every six months. They indicate that funding for capital projects includes a combination of State (DWSRF) and USDA loans and bond money. Their most recent CIP is summarized in Table 4-12. Table 4-12. CIP Summary for Smyrna
CIP Item Budget North Duct Creek Water Tower #1 31,000,000
East Commerce St utility replacement project 941,500
North main streeet utility replacement project 1,087,500
North duck creek western water project 1,250,000
Smyrna Venture utility extension 1,812,500
TOTAL 36,091,500
Assessment of Drinking Water Facilities and Service Areas January 2020
59
5. FACILITIES IN SUSSEX Sussex Overview All but two of the eighteen (18) municipal drinking water utilities in Sussex supply, treat and distribute water within their service areas. Dagsboro and Dewey Beach both purchase treated water and only distribute it within their service areas. A summary of each utility’s major characteristics and infrastructure is provided in Table 5-1.
Table 5-1. Sussex Municipal Drinking Water Utility Characteristics
Drinking Water System
Service Area (mi2)
Population Served # Wells # Storage
Tanks Miles of
Pipe ADD
(MGD) MDD
(MGD)
Bethany Beach 1.17 1,330 4 2 30 0.43 1.4
Blades 5.8 1,450 3 1 5.76 0.1 0.16
Bridgeville 2.97 2,500 6 2 25 0.279 0.653
Dagsboro 2.5 805 0 1 10.8 0.065 0.065
Delmar 7 4,600 3 2 32.72 0.466 0.636
Dewey Beach 1 3,000 0 1 20.6 1 1.3
Frankford 1 1,014 2 1 3 0.062 0.186
Georgetown 4.21 7,291 4 2 44.9 0.65 1
Greenwood 0.75 973 3 1 5 0.22 0.22
Henlopen Acres 0.26 140 11 1 4.75 0.031 0.103
Laurel 2.8 3,984 3 3 21.636 0.307 0.4
Lewes 6 1,100 5 1 20.6 1.2 2.293
Millsboro 3.71 4,181 5 3 38.4 0.792 1.56
Milton 4 2 13 0.392 0.465
Rehoboth Beach 2 2,500 10 2 55 1.6 3.7
Seaford 5.3 6,924 5 4 38 1 1.3
Selbyville 1.4 2,268 5 2 35.4 0.265 0.3
Sussex 2 3 1.2 0.035 0.05
TOTAL 47.87 44,060 75 34 405.766 8.894 15.791
ADD = Average daily demand. MDD = Maximum day demand.
Based on self-reported system capacities and average and peak daily flows, supplemented by water supply data from the DNREC Water Allocation Program, municipal utilities in Sussex have a combined capacity of approximately 30.8 MGD, an average daily demand of approximately 8.9 MGD (29 percent of capacity) and a peak daily demand of approximately 15.8 MGD (51 percent of capacity).
Since the first drinking water need assessment completed in February of 2015, municipal drinking water utilities in Sussex now serve about 5,500 more people, an increase of approximately 13 percent. Likewise, distribution piping has increased by approximately 42 percent, with approximately 108 miles of additional (extended) water main. Finally, it appears that the number of wells utilized by these utilities has decreased by about 14 percent, although this may in part be due to reporting discrepancies by utilities (e.g., reporting
Assessment of Drinking Water Facilities and Service Areas January 2020
60
only those wells that are currently in use rather than all their wells, active and inactive). However, it is believed that the number of wells used by Sussex utilities has in fact decreased, as some older, smaller wells have been replaced by a smaller number of newer wells with higher capacities.
On average, Sussex utilities provide water service at roughly the statewide average cost for municipal utilities in Delaware, as summarized in Table 5-2.
Table 5-2. Affordability Metrics for Sussex Water Providers
Drinking Water System Average Monthly Charge
Conservation Signal
UNC-EFC Affordability
Index 2019 MHI Affordability
Index
Bethany Beach $78,889
Blades $40.01 $6.15 $43,264 1.11%
Bridgeville $21.45 $3.75 0.50% $51,713 0.50%
Dagsboro $57,738
Delmar $22.75 $3.50 0.87% $34,211 0.80%
Dewey Beach/Sussex Co. $26.00 $73,750 0.42%
Frankford $44,265
Georgetown $31.07 $3.88 0.80% $47,376 0.79%
Greenwood $30.00 $30.00 0.82% $49,554 0.73%
Henlopen Acres $189,375
Laurel $38.75 $5.25 1.28% $34,291 1.36%
Lewes $21.55 $2.10 0.39% $72,474 0.36%
Magnolia $43,750
Millsboro $30.83 $3.50 0.77% $55,000 0.67%
Milton $13.67 $2.10 0.20% $85,729 0.19%
Rehoboth Beach $66.25 $- 1.99% $44,886 1.77%
Seaford $27.08 $3.89 0.72% $49,107 0.66%
Selbyville $25.48 $- 0.56% $57,901 0.53%
TOTAL $30.38 $5.34 0.81% $61,849 0.59%
Estimates of the replacement value of utility assets for Sussex municipal drinking water systems are summarized in Table 5-3.
Assessment of Drinking Water Facilities and Service Areas January 2020
61
Table 5-3. Estimated Present-Worth Replacement Value of Sussex Municipal Drinking Water Assets
Drinking Water System Wells/Treatment Storage Tanks Mains and Appurtenances Total
TOTAL $101,501,580 $44,683,208 $563,822,371 $710,007,159
Water distribution mains and appurtenances represent eighty percent (80%) of the replacement value of municipal drinking water infrastructure in Sussex. Water supply (e.g., wells), pumping and treatment infrastructure represent about 14 percent and storage tanks the remaining 6 percent of asset replacement value.
As indicated in Table 5-4, Annual Investment rates for Sussex utilities range from 0.1 to 7.8 percent of total asset value.
Table 5-4. Sussex Drinking Water Utility 5-Year CIP Summary
Drinking Water System CIP? 5-Year CIP Budget Annual Investment Ratio
Bethany Beach NO
Blades NO
Bridgeville YES $723,200 0.5%
Dagsboro NO
Delmar YES $60,500 0.0%
Dewey Beach NO
Assessment of Drinking Water Facilities and Service Areas January 2020
62
Frankford NO
Georgetown NO
Greenwood NO
Henlopen Acres YES $220,000 0.7%
Laurel YES $460,000 0.4%
Lewes YES $9,893,220 6.4%
Millsboro NO
Milton NO
Rehoboth Beach YES $4,700,500 6.1%
Seaford YES $3,881,200 1.1%
Selbyville YES $10,000,000 3.9%
Sussex NO
TOTAL $29,938,620 0.8%
Descriptions of each municipal utility’s service area, infrastructure, planning and financial characteristics are provided in subsequent subsections.
Bethany Beach
Utility Overview Service Area The Town of Bethany Beach Water Department serves an area of approximately 1.2 square miles in the town limits of Bethany Beach, DE in southeastern Sussex, representing a population of approximately 1,330 year-round residents. The seasonal population rises to 12,128 during summer months. The total number of connections is 3,400.
Underserved Communities Bethany Beach indicated that they had no interest or plans to extend water service as they are virtually locked in by private utility CPCNs.
Supply and Treatment Water Supply Bethany Beach has five (5) supply wells, four (4) of which are operational. Of these four wells, three (an 8” diameter, 12” diameter and 10”x16” well) are in the Manokin aquifer at depths between 214 and 251 feet below grade. A 6”x12” well extends 365 feet below grade into the Ocean City aquifer.
The Bethany Beach water system is interconnected with Tidewater and Sussex Shores’ systems.
Treatment Bethany Beach has a single water treatment plant with aeration, enhanced coagulation, flocculation, sedimentation, filtration, disinfection and fluoridation, dating to a major upgrade in 1992. They plan to replace the aerator within the next year and expect to replace the filter media within the next three years.
Onsite generators are used to power equipment when the electrical grid is down.
Assessment of Drinking Water Facilities and Service Areas January 2020
63
Capacity and Demand Bethany Beach reports an average daily demand (ADD) of 0.43 MGD and a maximum day demand (MDD) of 1.4 MGD, as well as an overall system capacity of 1.75 MGD.
Water Quality Bethany Beach reports no water quality exceedances and is unaware of the detection of emerging contaminants in its water within the past five years.
Distribution Storage Tanks Bethany Beach maintains two (2) elevated storage tanks at the treatment site, with a total storage capacity of 1.5 MG. They have a 500,000-gallon tank installed in 2015 and a 1 MG tank installed in 1980.
The utility is planning for the addition of another 500,000-gallon tank within the next five years.
The tanks are maintained regularly using lead-free products conforming to the requirements of HB 456.
Distribution Piping Water mains include about 30 miles of piping, estimated to consist of about 7 percent galvanized pipe, 24 percent Transite, 9 percent DIP and the balance (~60 percent) PVC. Replacing remaining Transite pipes is an ongoing priority for the utility (some of the Transite piping is also undersized).
Asset Management Bethany Beach indicates that their system is not mapped in GIS. They do not report having a formalized asset management program.
Metering Bethany Beach reports that all customer services are metered using touch-read AMR units.
System Controls Bethany Beach reports that its entire system is monitored and controlled using a SCADA system.
Finances Revenue Generation Bethany Beach reports that revenues are sufficient to meet the needs of the water enterprise.
Bethany Beach utilizes an inclining block rate structure for in-town residents and a flat (but higher) rate structure for out-of-town customers.
Bethany Beach’s water charges were not calculated by UNC-EFC, so an Affordability Index could not be calculated. Bethany Beach’s MHI is $78,889.
Bethany Beach reports that its town-wide debt borrowing limit is $155M and that the water enterprise currently has $1.4M in debt.
Reserves Bethany Beach reports not having a reserve account for the water enterprise.
Capital Plans Although Bethany Beach is operating under a 10-year Comprehensive Plan (2010-2020) and approves an annual budget, it does not appear that they have a more formal capital planning process or plan.
Blades
Assessment of Drinking Water Facilities and Service Areas January 2020
64
Utility Overview Service Area Blades’ service area encompasses approximately 5.8 square miles with 473 connections (including 37 non-residential), serving a population of approximately 1,450. Blades is located adjacent to Seaford in west-central Sussex.
Underserved Communities DNREC did not identify underserved communities near Blades, however, the Town reports having capacity to expand their distribution system.
Supply and Treatment Water Supply The Town owns three (3) supply wells – two (2) four-inch and one (1) six-inch diameter – all extending into the surficial Columbia aquifer. Two of the wells are about 40 years old, while the third is about five years old. Cumulative pumping capacity is approximately 500 gpm. Well sites have onsite generators for backup power.
Treatment The water treatment plant (WTP) at Blades was installed in 2004 and consists of granular media filtration (Greensand), granular activated carbon (GAC) filtration, chlorination and fluoridation.
Blades is expecting a $1M grant to rehabilitate the WTP by installing smaller GAC filters inside the facility (the existing GAC system is currently outdoors and exposed to the elements) and replacing media in the Greensand filters to minimize manganese breakthrough. The Greensand media has not been replaced since 2004.
Capacity and Demand Blades has a treatment capacity of about 0.32 MGD and reports average and peak daily flows to be 0.10 and 0.16 MGD respectively.
Water Quality Blades reports having relatively high manganese in their source water, requiring Greensand filters for removal. Additionally, they report that EPA identified potential PFOA/PFOS from two nearby plating facilities (one remains in operation) about one year ago. The National Guard distributed water until the granular activated carbon filtration system was installed. They considered drilling deeper wells, but the GAC filters have been effective and are a less expensive option.
Blades has a source water assessment dated November 2018.
Distribution Storage Tanks Blades maintains a single 150,000-gal storage tank installed in 1979 (40 years old) and located about a quarter mile from the WTP. The town recently signed its first maintenance contract, although the inside of the tank has been periodically cleaned and is reported to be in excellent condition.
Distribution Piping Blades has approximately 5.76 miles of 6- to 12-inch diameter C-900 PVC mains, installed in 1979. Newer mains have been installed to serve the subdivisions Little Meadows I in 2005 and Little Meadows II in 2006.
Assessment of Drinking Water Facilities and Service Areas January 2020
65
Additional new connections were made in the fall of 2018, including extension to Highway 13 via Brickyard Road. This new line did not loop, but the Town is seeking funding to do so. The Town is also planning to run a main under the highway to a car dealership and complete additional loops.
The Town does not believe they have any lead-based service lines in their system, given the relative newness of the distribution piping.
Asset Management Hydrants and valves are mapped in GIS.
Blades reports a non-revenue water rate of 23 percent and believes that most is attributed to leaks in one-inch service lines that were not installed properly. They replace lines as problems are identified. If a line needs service more than two times, it is replaced from the main to the meter pit.
Metering All water customers are metered. However, existing manual read meters are about 15 years old, so the town is implementing a meter replacement project and switching to an AMR system with a combination of touch and radio read units.
System Controls In conjunction with upcoming WTP rehabilitation, the town would like to move to a more advanced/automated control system. The current system includes an autodialer to identify high water, low water, alarm/pump faults, and storage conditions.
Finances Revenue Generation Blades’ user rates are the same for all customers and include a base rate for the first 2,000 gallons of water use per month and an increased rate for each 1,000 gallons used thereafter. Rates were most recently raised in 2014.
Blades’ water charges are relatively high for Sussex, averaging about $40.01 per month, which results in an Affordability Index of 1.11 percent at the MHI of $43,264.
Reserves Blades does not maintain a reserve fund. Rather, all revenue goes into a general fund.
Capital Plans Blades does not appear to have a capital improvement plan.
Bridgeville
Utility Overview Service Area Bridgeville’s service area encompasses approximately 2.97 square miles, serving a population of approximately 2,500 in northwestern Sussex via 1,918 connections (1,806 household connections).
Underserved Communities Bridgeville reports having capacity to serve additional areas, but no plans to do so.
Assessment of Drinking Water Facilities and Service Areas January 2020
66
Supply and Treatment Water Supply The Town owns six (6) supply wells – two (2) 12-inch wells (one in service and one backup) extend into the surficial Columbia aquifer, one (1) 10-inch and one (1) 8-inch well extend into the Frederica aquifer, one (1) 8-inch well extends into the Columbia and one (1) 8-inch well extends into the Cheswold.
Bridgeville’s two oldest wells predate 1997; however, both were upgraded in 2011. Their newest well (a 12” well in the Columbia) was installed in 2007. The most recent improvements to the wellfield was installation of a new security fence and a new well valve installed in 2019.
Treatment Bridgeville has three separate water treatment systems consisting of chlorination and fluoridation. Treatment systems and wells are powered by onsite generators in case of power failure.
Capacity and Demand Bridgeville has a capacity of approximately 2.152 MGD with all wells running, but its allocation is for 1.0 MGD. Current ADD is reported to be 0.279 MGD and PDD is 0.653 (May 9, 2018).
Bridgeville staff provided the breakdown of annual water use summarized in Table 5-5.
Table 5-5. Summary of Bridgeville Water Demand by Category
Water Quality Bridgeville reports that there have been no drinking water standard violations within the past five years. One of their Columbia aquifer wells has been tested for PFAS compounds by USGS since 2012 with no PFAS hits.
Bridgeville has a source water/wellhead protection ordinance.
Distribution Storage Tanks Bridgeville maintains two elevated storage tanks: a 44-year old, 125,000-gallon tank and a 13-year old 400,000-gallon tank. The tanks are maintained under a 10-year contract. The older tank was to be stripped and recoated in 2019.
Distribution Piping Bridgeville has about 25 miles of distribution piping, consisting of a mix of DIP, asbestos cement and PVC C-900 in sizes for 4 to 16 inches in diameter (see Table 5-6). The DIP and asbestos cement pipe was installed originally in the 1940s and 1950s and is mostly located in the downtown area. Some of these lines are not sized for fire flows. PVC pipe is used for new installations. Most of the system is PVC.
Assessment of Drinking Water Facilities and Service Areas January 2020
67
Table 5-6. Summary of Bridgeville Distribution Piping by Size
Bridgeville continues to replace old, undersized DIP and ACP pipe with PVC sized for fire flows. They are also actively trying to connect and loop dead ends in the water system, sometimes caused by lines serving new developments. Bridgeville plans to develop a more proactive capital plan after their in-progress asset management plan is complete.
Bridgeville reports that all lead goosenecks were replaced in 1989 and 1998, although they do still find meter pits installed before 2012 with brass meters and lead fittings. These are replaced as discovered.
Asset Management Bridgeville recently finished year 2 of a five-year, State sponsored asset management program. They are working on developing GIS coverage of their system. As indicated in Table 5-5, Bridgeville reports an NRW of 11.9 percent, although this figure includes sanctioned City uses. Bridgeville reports only two distribution system leaks in 2018 – one at a ductile iron bell joint and one in an ACP pipe.
Metering All water customers are metered. Existing AMR meters are up to 13 years old, although residential meters in old town were replaced in 2015.
System Controls Bridgeville has an Indusoft SCADA system which connects three well houses and two water towers to the water department offices.
Finances Revenue Generation Bridgeville reports that revenue from the water enterprise is sufficient to meet costs. All users pay the same rate for each 1,000 gallons of metered water use.
Bridgeville’s water charges are relatively low for Sussex, averaging about $21.45 per month, which results in an Affordability Index of 0.50 percent at the MHI of $51,713.
Bridgeville has a debt limit of $1.5M without a referendum. With a referendum, they have no debt limit.
Reserves Bridgeville maintains a reserve account restricted to the water enterprise. The water reserve account balance is approximately one-third of annual expenses and spending is limited to capital expenses.
Pipe Size (in.) Length of Pipe (ft.)
4” 6,571
6” 27,680
8” 59,912
10” 20,545
12” 14,779
14” 3,560
16” 3,391
Total 136,438
Assessment of Drinking Water Facilities and Service Areas January 2020
68
Capital Plans Bridgeville maintains a five-year CIP, as summarized in Table 5-7. For the water enterprise, the CIP refers to Bridgeville’s approved Facilities Plan for details on most of their planned capital projects. Table 5-7. CIP Summary for Bridgeville
CIP Item Budget
WT-Water Main Replacements (1 per 10yr) $275,000
WT-Water Meter Reading Equipment $4,800
WT-Truck (Current = 2017) $21,000
WT-Truck (Current = 2003) $45,000
WT-Security Fence- Well 6 $0
WT- Office Upgrades $50,000
WT-Additional Payments to Retire Debt $475,000
WT-Misc repairs $500,000
Facility Plan Updates $14,000
Capacity Improvements $0
Treatment Improvements $0
Distribution Improvements $433,834
TOTAL $ 1,818,634
Dagsboro
Utility Overview Service Area Dagsboro’s service area encompasses approximately 2.5 square miles, serving a population of approximately 805 in southeastern Sussex. Dagsboro provides storage and distribution only and is operated and maintained under contract with Artesian.
Underserved Communities Information not available.
Supply and Treatment Water Supply Dagsboro purchases water in bulk from Millsboro. Their system only provides storage and distribution.
Treatment Dagsboro does not provide water treatment.
Capacity and Demand Dagsboro’s agreement with Millsboro, as of 2015, was for bulk purchase of 90,000 gpd. Dagsboro reports using about 65,000 gpd in 2015 on both average and peak day bases.
Water Quality Information not available.
Assessment of Drinking Water Facilities and Service Areas January 2020
69
Distribution Storage Tanks Dagsboro has a single 500,000-gallon storage tank, which is maintained under contract. It is reportedly 14 years old.
Distribution Piping Dagsboro reports having about 10.8 miles of relatively new PVC piping. They do report some pressure issues on the south end of town due to undersized pipe. Additionally, dead end lines have caused both water quality and pressure problems at times. Dagsboro is actively trying to retrofit the system with adequately sized piping and looping.
Because the system is relatively new, Dagsboro does not believe it has lead-containing fittings in its system.
Asset Management Information not available.
Metering Most meters were replaced in 2009; batteries are starting to fail.
System Controls Information not available.
Finances Revenue Generation Dagsboro pays Millsboro $3.00 per 1,000 gallons of bulk water. Water customers pay a flat rate for the first 3,000 gallons of water demand and a rate for each subsequent 1,000 gallons of use. Developers are required to pay for annexation and connection to the system.
Dagsboro’s water charges were not calculated by UNC-EFC, so an Affordability Index could not be calculated. Dagsboro’s MHI is $57,738.
Reserves Information not available.
Capital Plans Dagsboro does not have a capital improvement plan.
Delmar Utility Commission
Utility Overview Service Area Delmar’s service area encompasses approximately 7 square miles, serving a population of approximately 4,600 in southwestern Sussex on the border of Maryland and Delaware via 1,740 connections. Because the system serves customers in both states, it is jointly regulated.
Underserved Communities Delmar reports having capacity to serve additional areas, but no plans to do so.
Assessment of Drinking Water Facilities and Service Areas January 2020
70
Supply and Treatment Water Supply The Town has three (3) supply wells, all located in Delaware – two (2) 10-inch wells extend into the surficial Columbia aquifer, one (1) 10-inch and one (1) 16-inch well extends into the Manokin aquifer. The newest well is one of the 10-inch wells used as a backup. The well tapping the Manokin aquifer has a higher iron content than the others. No additional wells are currently planned.
Treatment Delmar has a water treatment plant featuring Greensand filters, a packed aeration tower for PCE and iron removal, chlorination and fluoridation. The WTP was originally constructed in 1998, with subsequent major upgrades to add Greensand filters and rehab the packed tower.
The treatment system and wells are powered by an onsite generator during power outages
Capacity and Demand Delmar reports a current system capacity of 0.650 MGD and an ADD of 0.466 and a PDD of 0.636 MGD.
Water Quality Delmar reports that there have been no drinking water standard violations within the past five years and that they are not aware of the presence of PFAS or other emerging contaminants in their source water.
New wells in Delmar are reviewed by their engineers. Their source water assessment report was last updated in September 2002.
Distribution Storage Tanks Delmar maintains two storage tanks – a 20-year old, 250,000-gallon tank and a 38-year old, 300,000-gallon tank. The tanks are maintained under contract and coated with paints conforming to HB 456.
Distribution Piping Bridgeville has about 32 miles of distribution piping, consisting of a mix of DIP and C-900 PVC in sizes ranging from 4 to 12 inches in diameter (see Table 5-8), along with a small amount of original cast iron pipe. The oldest pipe (~75 years) is located on Poplar Street
Table 5-8. Summary of Bridgeville Distribution Piping by Size
Delmar continues to work on replacing remaining iron pipe.
Delmar replaced all lead-containing service line fittings over several years and reports no lead materials remaining in their distribution system.
Pipe Material Pipe Size (in.) Length of Pipe (mi.)
DIP 4” 3.23
DIP 6” 7.46
PVC 8” 12.77
PVC 10” 5.86
PVC 12” 3.40
32.72
Assessment of Drinking Water Facilities and Service Areas January 2020
71
Asset Management Delmar is beginning work on a State sponsored asset management plan, with the initial focus being development of GIS of their distribution network.
Delmar reports an NRW of 28 to 32 percent. During meter reading for billing, the Town identifies water use within three days of acquiring the data. The Town makes reactive repairs when leaks are obvious. They also use direct observation (e.g., if wet areas are noticed on dry days).
Delmar also reports having resolved water quality issues in their distribution system by cleaning all the lines and establishing a flushing program.
Metering In the past two fiscal years, 98 percent of dwellings have received a replacement meter (Neptune T10 Meter R900i). The Town can now do drive-by meter readings in 3 hours now after completing their replacement program and can do daily/hourly readings, although quarterly readings are used for billing. The Town is installing cell towers and implementing a new AMI software system that collects water demand data daily allowing them to fix leaks in a timely manner or provide water/sewer abatements as applicable.
System Controls Delmar does not have a SCADA system.
Finances Revenue Generation Delmar reports that revenue from the water enterprise is sufficient to meet costs. Users pay a flat fee plus a demand rate for each 1,000 gallons of metered water use. The commercial fee rates are somewhat higher than residential rates.
Delmar’s water charges are lower than average for Sussex, averaging about $22.75 per month, which results in an Affordability Index of 0.80 percent at the MHI of $34,211.
Delmar has a legal debt margin of $7,343,030 after issuance of their last General Obligation Bond.
Reserves Delmar maintains a reserve account restricted to the water enterprise. The water reserve account balance is approximately 36 percent of annual expenses. Funds are used for emergencies as well as planned upgrades to the system.
Capital Plans Delmar prepares a six-year CIP. Their most recent CIP document (FY20-25) includes water main upgrades, well redevelopment and pump replacement, SCADA system development and rebedding of filters, as indicated in Table 5-9. Table 5-9. CIP Summary for Delmar
CIP Item Budget
Soda Ashe Pump - spare pump $3,300
HVAC Systems - replace 3 units $20,500
Green Sand Plus Filters - Re-bed $75,000
Pack Tower- Re-bed $ 50,000
Skata System- water treatment facility $40,000
Well 2A - Redevelop $ -
Assessment of Drinking Water Facilities and Service Areas January 2020
72
Dewey Beach
Utility Overview Service Area The Dewey Beach Water District purchases finished water from Rehoboth Beach and stores and distributes it within the approximately 1.0 square mile service area in east-central Sussex between the Lewes Rehoboth Canal Bridge and Delaware Seashore State Park via 3,300 connections. The District serves a year-round population of about 3,000 and a seasonal population that can approach 25,000 during the summer months.
Underserved Communities Dewey could potentially expand service within its existing service area, but the service area itself is fixed geographically.
Supply and Treatment Water Supply Dewey Beach purchases treated drinking water from Rehoboth Beach.
Treatment Dewey Beach does not maintain any water treatment infrastructure.
Capacity and Demand Dewey Beach reports and ADD of 1.3 MGD and a PDD of 1.5 MGD.
Water Quality Dewey Beach reports no exceedances of water quality standards or presence of PFAS or other emerging contaminants.
Distribution Storage Tanks Dewey Beach has one 1.0 MG elevated storage tank, which is over 40 years old. The tank is maintained regularly and coated with paints meeting HB 456.
Distribution Piping Dewey Beach maintains 20.6 miles of distribution piping, with 20 percent being DIP in 16-inch and greater size and 80 percent being C-900 PVC in 4 to 12-inch sizes. Most piping is original and approximately 40 years old. The main feed from Rehoboth Beach to the storage tank and back to the main trunk line is reported to be the oldest and most problematic piping.
Dewey Beach has replaced many service connections and meter pits over recent years and is not aware of any remaining lead-containing piping within their network.
Well 3A - New Pumps $ -
Water Towers - Cleaning/Maintenance $7,800
Electronic Entrance Gate $ -
4" Water Main - Ductile Iron - Upgrade to 8" PVC Poplar Street $ -
TOTAL $196,600
Assessment of Drinking Water Facilities and Service Areas January 2020
73
Most of Dewey’s activity continues to be repairing and replacing mains and services, adding isolation valves and upsizing and looping mains. For example, they recently replaced 100 service connections in the Spring Lake condos area which did not meet Dewey Beach standards and had recurring problems and leaks because of the position of the service tap which was causing stress cracks at the nut. Additionally, the town recently installed five 16" isolation valves to facilitate servicing breaks in the system without interrupting service unnecessarily.
Dewey Beach has a proactive maintenance program for their distribution system where they flush the system annually and exercise the valves.
Asset Management Dewey has started implementing a GIS system for their distribution network, but otherwise does not have a formal asset management program.
Metering Customers in Dewey Beach are not metered. Metering may be 5 to 10 years out. They do have one main meter that measures flow to and from the Rehoboth Beach system.
System Controls Dewey’s storage tank and the main flow meter is connected to the Rehoboth Beach’s SCADA system.
Finances Revenue Generation Dewey charges a flat combined rate for water and sewer service quarterly. Dewey reports that revenue is not currently sufficiently meeting the needs of the water enterprise and that metering would help.
Dewey Beach’s water charges were not calculated by UNC-EFC, so an Affordability Index could not be calculated. Dewey’s MHI is $73,750.
Reserves Dewey maintains a reserve account, set aside for capital projects.
Capital Plans Dewey Beach has a Comprehensive Development Plan adopted in 2018 but does not appear to have a CIP. Sussex develops an annual budget which includes a five-year CIP for enterprise funds. However, no forward-looking capital plans were provided for drinking water in the 2020 budget document.
Frankford
Utility Overview Service Area The Frankford water system provides service to about 1,003 residents via 353 connections within a service area of about 1.0 square mile in southeast Sussex. At the time of this survey, Frankford was developing a Request for Proposal (RFP) for a private utility to take over the water system. Tidewater currently operates the system under contract as Whitemarsh Utility, but Artesian has a lot of systems in the area.
Underserved Communities Frankford does have the capacity and interest in extending water service to currently underserved areas although annexation requirements can be a deterrent. Extension has been addressed in Preliminary Engineering Reports prepared in 2013 and 2018. The Town expects to receive funding from USDA for a water extension down Delaware Avenue to an area that has had historical issues; however, current water rates are prohibitive especially for low-income customers.
Assessment of Drinking Water Facilities and Service Areas January 2020
74
Supply and Treatment Water Supply The system consists of two wells (8-inch and 12-inch diameter) tapping the shallow unconfined Columbia aquifer at depths of 250 and 128 feet, both of which are located near the water tower. The system capacity is 400,000 gpd according to a capacity test that was required for annexation. Frankford only uses the larger (12 inch), shallower well because the other well is high in iron and is only available for emergency.
Treatment Frankford treatment system includes using Greensand filters, a Waterboy coagulation and settling system for iron removal, caustic soda addition and chlorination. The treatment system is described as having been cobbled together, with some installed in 2002 and other components installed in 2009. Utility representatives describe the system as failing to provide consistent quality water which being costly to run. Greensand filter backwash has been described as a problem, causing a slug of fluoride. Consequently, the town stopped fluoridating. Improvements to the treatment system are described in a 2018 Preliminary Engineering Report. There has been some discussion of switching to an ion exchange system to avoid backwash discharge problems. WTP improvements are estimated to cost over $2M.
The WTP and wells use an onsite generator in case of power outage.
Capacity and Demand Frankford’s existing system has a capacity of about 250,000 gallons per day and report an ADD of 62,000 and PDD of 186,000 gpd. Frankford projects approximately 10 percent population growth by 2030.
Water Quality The shallower part of the aquifer has less iron, but more nitrate, but Frankford reports no exceedances of water quality standards within the past five years.
In August 2017, Frankford hired a firm to conduct a wide spectrum analysis of their water quality. MTBE and Benzo(a)pyrene were detected in both wells.
Frankford’s wellhead protection area is delineated in the Delaware DNREC document Public Water Supply Source Water Assessment (dated December 2003). There is a Mountaire chicken feed manufacturing facility within the wellhead protection area.
Distribution Storage Tanks Frankford has a single 39-year old, 125,000-gallon elevated storage tank. The storage tank came from Aberdeen Proving Ground and has not been adequately maintained.
Distribution Piping Frankford’s distribution network consists of a combination of CIP/DIP, Transite and PVC pipe ranging from 20 to 60 years old, with the PVC pipe being the newest. Older lines on Clayton Avenue and a dead end on Dover Street were described as the most problematic pipes and undersized and dead-end mains, along with main breaks are the most pressing issues.
The Town has not had problems passing their required lead and copper testing, although they probably have some older lead-containing goosenecks in the system. The Town is hoping to take care of remaining lead goosenecks when the meters are replaced if and when the system is sold.
Asset Management The Town does not have a formal asset management program, although they have had several PERs and other studies conducted within the past five years. One study suggests that Frankford does not have a significant NRW issue, with NRW estimated at only 2 percent. They do report occasional breaks during
Assessment of Drinking Water Facilities and Service Areas January 2020
75
freezing weather. The Town does not have a full breakdown of pipe materials or other characteristics and the distribution network is not geospatially located.
Metering All customers in Frankford are metered. A 2018 PER recommended upgrading the meters to electronic read units at a cost of about $500,000.
System Controls Frankford’s WTP, including the Greensand filters and chlorination system are controlled via SCADA.
Finances Revenue Generation Although Frankford now covers system expenses through increased water rates, its water rates are very high (over 3 percent MHI) and current revenue does not allow for proactive improvement to the system. Mountaire used to purchase approximately 50 percent of Frankford’s water, but after they were allowed to install their own system, this revenue stream stopped, causing Frankford’s system to struggle financially.
Frankford’s water charges were not calculated by UNC-EFC, so an Affordability Index could not be calculated. Frankford’s MHI is $44,265.
Reserves Frankford maintains a reserve account, set aside for the water enterprise. As of February 2019, Frankford had about $157,000 in their water fund $54,000 in their sinking fund and $50,000 in their water capital reserve fund.
Capital Plans Although Frankford has a Comprehensive Development Plan, it does not appear that they maintain a CIP.
Georgetown
Utility Overview Service Area The Georgetown water system provides service to 7,291 residents via 2,002 connections within a service area of about 4.2 square miles in central Sussex.
Underserved Communities Although it appears that Georgetown’s water system has the capacity, the Town is not interested in serving additional areas via annexation.
Supply and Treatment Water Supply Georgetown’s water system consists of four wells tapping the shallow unconfined Columbia and Manokin aquifers at depths of 90 to 120 feet. Three 12-inch diameter wells are active, and one 6-inch diameter well is currently not being used. Another well at the State Correctional Institute was shut down. The Town is currently installing a new 1,000 gpm well to replace the inactive well.
Treatment Georgetown has two treatment systems: King Street and Stevenson Lane. The two systems are similar and consist of chlorination and fluoridation. The King Street system also includes an air stripping system for PCE removal; however, PCE issues have now been resolved. The plants were originally installed in 1992, but Stevenson was upgraded in 2014 and King Street upgrades are being completed in 2019. These
Assessment of Drinking Water Facilities and Service Areas January 2020
76
upgrades have allowed other water treatment plants to be decommissioned. Stevenson is supplied by two active wells and King Street is supplied by the other active well and the new 1,000 gpm well being installed.
The wells and treatment system use onsite generators in case of power outage.
Capacity and Demand Georgetown’s existing system has a capacity of about 2,376,000 gallons per day. They report an ADD of 650,000 and a PDD of 1,000,000 gpd.
On an annual basis, Georgetown reports that residential use accounts for about 53 percent of demand, followed by institutional use at 26 percent, commercial use at 13 percent and unaccounted for water at 8 percent.
Water Quality Georgetown reports that previous PCE contamination issues have been resolved. They report no other exceedances of standards and no other emerging constituents in their water.
The Town has a source water protection ordinance including a plan that restricts certain land uses within a given distance from wellheads. Their latest source water assessment reports dates from 2003.
Distribution Storage Tanks Georgetown has two elevated storage tanks, both installed in 1992: a 125,000-gallon and a 250,000-gallon. The tanks are maintained regularly under contract using materials adhering to HB 456. The storage tanks are described as being in good condition.
Distribution Piping Georgetown maintains 44.9 miles of mains, consisting of a mix of C-900 PVC installed in 1992, and a mix of DIP and asbestos cement pipe whose age is generally unknown but may date back to 1902. Approximately 80 to 85 percent of the distribution system has been renovated/replaced with C-900. The remaining mains are on DelDOT highways and are more complicated to work on.
The Town reports that all lead goosenecks have been replaced. Main rehabilitation and service line replacement are still high priorities for distribution system improvement in Georgetown. Most of the distribution system is described as looped, with just a few spurs.
Asset Management The Town has an asset management grant via the State and is currently geolocating their lines and creating a GIS of their network.
Metering All customers in Georgetown are metered. Approximately 90 percent of the meters have been switched out to drive-by radio read AMR, with the remaining meters scheduled for replacement in 2019.
System Controls Georgetown’s treatment systems and storage tanks are controlled via SCADA.
Finances Revenue Generation Georgetown reports that revenue is sufficient to cover the water enterprise expenses. Its rates include a flat availability charge for the first 3,000 gallons and then a demand rate.
Assessment of Drinking Water Facilities and Service Areas January 2020
77
Georgetown’s water charges are about average for Sussex, averaging about $31.07 per month, which results in an Affordability Index of 0.79 percent at the MHI of $47,376.
Georgetown’s debt borrowing limit is set at 75 percent of the assessed value of real property. Currently, water debt is about 37 percent of the overall town debt.
Reserves Georgetown maintains a water depreciation account and an account for water impact fees. The accounts are used for all water related expenses.
Capital Plans Georgetown does not appear to have a CIP.
Greenwood
Utility Overview Service Area The Greenwood water system provides service to 973 residents via 477 connections within a service area of about 0.75 square miles in northwest Sussex.
Underserved Communities Greenwood reports having the capacity to extend service, but no imminent plans to do so.
Supply and Treatment Water Supply Greenwood has three water supply wells – two shallow wells (12-inch and 10-inch) that draw from the Columbia aquifer and one relatively new, deep 6-inch diameter well that draws from the Federalsburg aquifer. One of the shallower wells was schedule for renovation in 2019.
Treatment Greenwood treats its water using chlorination, fluoridation and caustic soda for pH/corrosion control. Greenwood installed a new fluoride saturator in 2018 and recently replaced a starter for a well pump.
The wells and treatment system use onsite generators in case of power outage.
Capacity and Demand Greenwood’s water system capacity is reported to be 0.25 MGD, with ADD and PDD reported at 0.22 MGD.
Water Quality The two wells drawing from the Columbia aquifer are relatively high in nitrates, as Greenwood is an agricultural community with a legacy of chicken litter being applied to fields and the Town expects nitrate concentrations to increase in the shallow wells. Source water from the three wells is currently blended to
Assessment of Drinking Water Facilities and Service Areas January 2020
78
keep nitrates in check, as water from the deep well contains essentially no nitrate. The Town is installing a new well pump control system to better manage nitrates.
Greenwood is not aware of the presence of emerging contaminants in its water, although there are a couple industrial facilities near the wellheads.
Greenwood’s source water assessment report was last updated in 2009.
Distribution Storage Tanks Greenwood uses one 250,000-gallon elevated storage tank. It is 14 years old and maintained using lead-free paints in accordance with HB 456.
Distribution Piping Greenwood’s distribution system is about 90 percent PVC, aged 12 years. There are old pipes located downtown along N. Church and E. Market Streets. The Town has plans to sleeve a terra cotta pipe that is routed under Route 13.
Greenwood is not aware of any lead containing service lines in their system.
Asset Management The Town does not have a formal asset management program and the location of the distribution piping is not digitized in GIS.
Metering All customers in Greenwood are metered using Sensus AMR radio-read meters.
System Controls Two wells are on a Sensaphone alarm system. The Town is installing a new electrical control system for the well pumps to optimized blending.
Finances Revenue Generation Greenwood reports that revenue is sufficient to cover the water enterprise expenses. Revenue sources are impact fees, late fees, connection fees, and service charges. The Town’s rates include a flat availability charge for the first 3,000 gallons and then a demand-based rate.
Greenwood’s water charges are about average for Sussex, averaging about $30.00 per month, which results in an Affordability Index of 0.73 percent at the MHI of $49,554.
Reserves Greenwood has a reserve account for water and wastewater infrastructure, which is funded using the budget surplus at the end of the fiscal year.
Capital Plans The Town is in the process of implementing an annual capital budget to go along with its operating budget.
Henlopen Acres
Utility Overview Service Area The Henlopen Acres water system provides service to 140 year-round residents via 203 connections within a service area of about 0.26 square miles and bounded by the town limits in east-central Sussex. The
Assessment of Drinking Water Facilities and Service Areas January 2020
79
seasonal population rises to about 600 during the summer months. Henlopen Acres does not anticipate significant growth through 2030.
Underserved Communities Most areas outside of Henlopen Acres are served by Rehoboth Beach.
Supply and Treatment Water Supply Henlopen Acres has eleven (1) 6-inch diameter wells in the Columbia aquifer to depths of about 75 feet.
Treatment Henlopen Acres has a single water treatment system consisting of aeration (for odor and color) in underground storage tanks, chlorination and fluoridation. The treatment system is approximately 25 years old.
The wells and treatment system use onsite generators in case of power outage.
Capacity and Demand Henlopen Acres’ water system capacity is reported to be 0.52 MGD, with ADD and PDD reported to be 0.03 and 0.10 MGD respectively.
Water Quality Henlopen Acres reports no exceedances of drinking water standards and no detection of emerging contaminants in their water.
Henlopen Acres prepared a wellhead protection plan, but it was not acted on by the Planning Commission. Most wells are sited in easements between properties.
Henlopen Acres’ source water assessment report was last updated in 2003.
Distribution Storage Tanks Henlopen Acres has one 60,000-gallon buried concrete tank with two pumps that pressurize the distribution system. The tank was installed about 25 years ago. The tank was visually assessed via CCTV in 2018. The pumping system is connected to an onsite generator in case of power outage. The pumps have been replaced within the past five years.
Distribution Piping Henlopen Acres distribution piping consists for about 4.75 miles of PVC, installed with the original system 25 years ago. Most of the lines are undersized (e.g., 4-inch) and inadequate for fire flow. There are no hydrants.
In addition to installing hydrants, the Town is planning an interconnect with Rehoboth Beach.
Henlopen Acres reports that there are no lead-containing pipes or fittings given the relative newness of the system.
Assessment of Drinking Water Facilities and Service Areas January 2020
80
Asset Management Henlopen Acres is currently working on a State grant for asset management and digital mapping of the distribution system is complete.
The Town reports that most leaks are on the consumer’s side of the meter (e.g., winter freezing of outdoor shower piping).
Metering Henlopen Acres currently does not meter customer water use, but the Town is planning to install drive-by AMR meters.
System Controls Henlopen Acres does not have a SCADA system.
Finances Revenue Generation Henlopen Acres reports that revenue is sufficient to cover the water enterprise expenses. Customers are billed a flat, annual rate. A transfer tax funds their reserve account.
Henlopen Acres’ water charges were not calculated by UNC-EFC, so an Affordability Index could not be calculated. Henlopen Acres’ MHI is $189,375.
Reserves Capital improvements and emergency repairs are funding using a reserve account.
The Town currently has no debt, but they do have a borrowing limit capped at 15 percent of the assessed value of all properties within the Town limits.
Capital Plans Henlopen Acres provided an informal listing of planned capital projects, which includes the following projects:
• 2020: $30,000 for an interconnect with a neighboring system
• 2021: $85,000 to replace master panel at treatment plant
• 2022: $105,000 for residential metering
• 2024: installation of fire hydrants
Laurel
Utility Overview Service Area Laurel provides water service to 3,984 people via 1,505 connections within a service area of about 2.8 square miles in southwest Sussex. Laurel anticipates about 7 percent growth through 2030.
Underserved Communities Laurel indicates that their water system is sized to serve their existing municipal boundaries. The Town could expand outside the existing boundaries based on where the need is greatest.
Assessment of Drinking Water Facilities and Service Areas January 2020
81
Supply and Treatment Water Supply Laurel has three (3) wells – 10-inch and 12-inch wells in the Columbia aquifer, and a 12-inch well in the Manokin. The Manokin well has been installed within the past five years, and the Town is planning for the installation of another Manokin aquifer, 525 GPM capable well.
One of the shallow (Columbia aquifer) wells has sporadic nitrate issues and is offline and available for backup using an activated carbon treatment system.
Green technologies used in water supply systems include Variable Frequency Drives that allow pumping equipment to be operated at lower speeds when necessary, saving power consumption.
Treatment Two years ago, Laurel installed a new 1,000-gpm water treatment plant consisting of Greensand filters, chlorination, fluoridation, polyphosphate for iron sequestration and caustic for pH control. The Town is adding a third Greensand filter at the new plant and a post-caustic feed for effluent from filters.
The oldest portion of the treatment system includes the chemical feed associated with Well No. 4 which was installed in 1977. The chemical feed systems are rehabilitated as necessary and are deemed to be in good, operational condition at the time of this survey.
The wells and treatment system use onsite generators in case of power outage.
Capacity and Demand Laurel reports a capacity of 1.98 MGD and an ADD of 0.307 and a PDD of 0.400 MGD. Laurel anticipates about 7 percent growth through 2030.
Based on current flows, residential demand accounts for about 78 percent of the total demand, followed by commercial uses at 7 percent and institutional uses at 3 percent. Laurel reports about 12 percent unaccounted for water.
Water Quality Laurel reports no exceedances of drinking water standards and no detection of emerging contaminants in their water.
Laurel Ord. 2009-14 defines the source water protection program for the town. The ordinance outlines the source water protection zoning overlay that is used to ensure the integrity of the water resources. These protection standards establish Zones 1 and 2 for wellhead protection standards and the limitations imposed on new construction, redevelopment, subdivision, and expansion of existing facilities. The wellhead protection ordinance provides a management radius around the wellheads.
Laurel also has an undated source water assessment on file with the State.
Distribution Storage Tanks Laurel has three elevated storage tanks: a 130,000-gallon tank that is about 100 years old, a 300,000-gallon tank that is about 13 years old and a 500,000-gallon tank that is about 2 years old. All tanks are covered by an annual maintenance contract. Lead-free paints are used in accordance with HB 456.
Distribution Piping Laurel maintains 21.6 miles of pipe, with PVC ranging in age from 1 to 15 years and size from 2 to 16 inches constituting about 49 percent of the mileage. Four- to six-inch ductile and cast-iron pipe constitutes about 47 percent and 10-inch Transite pipe constitutes the remaining 4 percent. The iron and Transite pipes were installed over 60 years ago. The system is described as being adequately looped.
Assessment of Drinking Water Facilities and Service Areas January 2020
82
Laurel is bidding replacement of the remaining Transite pipe which is in the area of 8th Street.
The Town has come across very few lead services and have always complied with lead and copper MCLs without a problem. Raising pH to 7.2 has helped with copper. Ninety percent of service lines are galvanized. When they find service leaks they run new poly line from the main to the meter pit. Asset Management Laurel’s asset management efforts include fixing leaks as required and replacing aged pipe as funding is available. The Town has met with State about getting assistance with their asset management program.
Digitizing of the water distribution network has been completed.
Metering Laurel’s water customers are metered using radio-read AMR meters. The oldest meters in their system are between 10 and 15 years old.
System Controls Laurel uses a SCADA system to monitor and control the water towers, wells and water treatment plant.
Finances Revenue Generation Laurel reports that revenue is sufficient to cover the water enterprise expenses. Customers are billed an availability charge (based on EDU, with commercial customers paying a higher rate) and a usage fee. Customers not within town limits pay a demand rate that is twice what in-town residents pay.
Laurel’s water charges are relatively high for Sussex, averaging about $38.75 per month, which results in an Affordability Index of 1.36 percent at the MHI of $34,291.
The Town has a debt borrowing limit of $17M, of which 60 percent is allocated to the water enterprise.
Reserves Laurel maintains a reserve account that is limited to the water enterprise and used to fund repairs, maintenance and replacement of infrastructure.
Capital Plans Laurel provided an informal list of projects underway or planned. Planned capital improvement projects associated with the distribution system include replacement of water main as necessary, and the replacement of the South Poplar Street Water Tower, because of cost to maintain it and its location (lots of houses/power lines).
The 7th Street water main replacement project is going to bid soon and will increase main size for fire protection. This project will also extend water service down Georgetown Road to the area near the WTP and the new water tower.
Lewes
Utility Overview Service Area The Lewes Board of Public Works (BPW) provides water service via 3,711 connections within a service area of about 6.0 square miles in northeast Sussex. Lewes anticipates about 11 percent growth in connections through 2030. Lewes estimates that its seasonal population increases total population by about 25 percent during summer months.
Assessment of Drinking Water Facilities and Service Areas January 2020
83
Underserved Communities Lewes has the capacity to extend service to underserved communities and has actively considered doing so for the Donovan Smith Trailer Park.
Supply and Treatment Water Supply Lewes has five 16 to 18-inch wells, all drawing from the Columbia aquifer at a depth ranging from 101 to 150 feet below grade. The wells are physically located within Sussex’s jurisdiction.
The Town is looking to install some new wells in the northwest part of town to serve new development.
Treatment Treatment consists of a single system consisting of pH adjustment using caustic soda, chlorination and fluoridation. The treatment system was built in November 2013. This system replaced the old Schley Avenue plant.
Wells and treatment processes use one of two on-site generators in case of power failure.
Capacity and Demand Lewes reports a current system capacity of 4.0 MGD. ADD is 1.2 MGD and PDD is 2.3 MGD.
Lewes reports that industrial water demand accounts for 43 percent, residential 31.5 percent, commercial 14.9 percent and institutional 0.6 percent of total. Unaccounted for water is about 9.9 percent.
Water Quality Lewes reports a Lead and Copper Rule exceedance in 2018, requiring the utility to increase the frequency of testing. They believe that most of the issues are the result of pipe connections under the customer’s ownership.
Recent testing resulted in a non-detect for PFOA and a PFOS level of 10.9 ng/l.
Lewes’ wells are covered by the Sussex Wellhead protection law. There are some failing septic systems along the Savannah Road corridor that are near the well field.
Lewes also has a source water assessment dated December 2003 on file with the State.
Distribution Storage Tanks Lewes maintains one 300,000-gallon elevated storage tank that is about 50 years old. The tank is inspected annually and was most recently blasted, repaired and repainted in 2017. Lead-free paints are used in accordance with HB 456.
The Town is looking to install some new wells and a new storage tank in the northwest part of town due to pressure issues and also to serve new development.
Distribution Piping Lewes maintains about 20.6 miles of distribution piping. However, they report a combination of 2 to 10-inch steel pipe from the early 1900s consisting of about 20 percent of their network, with an equal combination of 4 to 16-inch ductile iron and 4 to 12-inch PVC making up the balance. The DIP has been installed from the 1950s to the present, while PVC began being installed in the 1980s through the present.
The oldest and most problematic pipes are in the Pilottown Road, Cedar Street, Kings Highway, 3rd and 4th Streets and in the Historical Section. The biggest issue with water mains is with tuberculation in the DIP, leaks and some WQ problems (rust). Dead ends are not so much of an issue since BPW flushes the system every 6 months in April and October. It is an effective process, but rust remains an issue.
Assessment of Drinking Water Facilities and Service Areas January 2020
84
Getting lead goosenecks and old lead and oakum joints out of system is a high priority for the Town. There is a 5-year plan to create a loop system contingent on some development and construction taking place.
Asset Management Lewes reports implementing an aggressive capital plan to replace old piping. They do participate in the State’s asset management program and are working on developing a condition assessment. Their distribution network is mapped in GIS.
Metering All of Lewes’ water customers are metered, with about 75-percent on radio-read AMR meters.
System Controls Lewes uses a SCADA system to monitor and control the water tower, wells and water treatment plant. The Town reports some communication issues between the SCADA system and water tower.
Finances Revenue Generation Lewes reports that revenue is sufficient to cover the water enterprise expenses and that the Town relies on State Revolving Funds for major capital projects. Customers are billed an availability charge and a usage fee, which increases with each increment of consumption (i.e., inclining block rate structure). Industrial and commercial customer rates vary by tap size, and customers outside of the city pay a rate that is 50 percent greater than in-town residents.
Lewes’ water charges are relatively low for Sussex, averaging about $21.55 per month, which results in an Affordability Index of 0.36 percent at the MHI of $72,474.
Impact fees on new development are used to help fund capacity increases.
Reserves Lewes maintains a reserve account that is restricted to the water enterprise and is currently funded at a rate of about 24 percent of the annual water enterprise budget.
Capital Plans Lewes maintains a five-year Capital Improvement Plan for the water enterprise. Approximately 90 percent of its most recent five-year plan involves the distribution system with about 63 percent of distribution system funding going toward projects with lead abatement elements. In addition to specific distribution system renewal projects, the CIP includes focused hydrant and valve replacement program funding.
As previously indicated, additional well development and installation of a new storage tank are also programmed into the five-year CIP, which is summarized in Table 5-10. Table 5-10. CIP Summary for Lewes
CIP Item Budget
Lead Service Line Replacement $260,000
Pilottown Road Main Abandonment QA to New (LEAD) $850,000
Pilottown Road Main Abandonment New to U of D (LEAD) $930,000
Cedar- YC to CBH (LEAD) $1,400,000
Cedar- CBH to Savannah (LEAD) $1,500,000
Kings Highway Savannah to Bike Path (LEAD) $1,130,000
3rd Street and Burton New Main (LEAD) $275,000
Johnson Street Main Renewal $650,000
Expansion to CPCN $560,000
Assessment of Drinking Water Facilities and Service Areas January 2020
85
Kings Higway and Devries Path to Savannah $300,000
School Lane Renewal $270,000
New Road to Rodney Loop $550,000
Water Main Replacement/Renewal $750,000
Hydrant Replacement $67,164
Vehicle $110,000
Valve Replacement $547,170
Hydrology Report $75,000
Well Development $550,000
1 MG Water Tank $850,000
Increased Monitoring $60,000
Well Maintenance $145,000
Tank and Site Beautification $20,000
Security Fence $95,000
TOTAL $11,944,334
Millsboro
Utility Overview Service Area Millsboro provides water service to a population of 4,200 via 2,471 connections within a service area of about 3.7 square miles in central Sussex. Millsboro anticipates substantial growth amounting to about 3 to 5 percent annual growth through 2030.
Underserved Communities Millsboro has the capacity to extend service to underserved communities but has no current plans to do so. Millsboro reports having been approached by the State to serve a new development southeast of town, but the Town is not legally able to annex and serve the area.
Millsboro currently provides water to Dagsboro.
Supply and Treatment Water Supply Millsboro has five wells, with two eight-inch wells installed in the Columbia aquifer and three 10 to 16-inch wells installed in the deeper Manokin aquifer; however, the two Columbia aquifer wells are no longer used for production, but rather for a TCE pump and treat system. The Manokin wells have naturally high iron and manganese concentrations.
Two additional wells are planned in Plantation Lakes. These will be turned over to the town after installation.
Treatment Treatment consists of a coagulation and uplift sand filtration, oxidation using sodium hypochlorite, chlorination and fluoridation. The system was installed in 2010.
Wells and treatment systems use on-site generators in case of power failure.
Capacity and Demand Millsboro reports a current system capacity of 2.16 MGD. ADD is 0.792 MGD and PDD is 1.56 MGD. Millsboro projects a high growth rate for their system, with 3 to 5 percent annual growth through 2030.
Assessment of Drinking Water Facilities and Service Areas January 2020
86
Millsboro reports that residential water demand accounts for about 62 percent, commercial 25 percent, industrial 3.8 percent and institutional 0.5 percent of total. Unaccounted for water is reported to be about 8.9 percent.
Water Quality Millsboro reports non-compliance of the secondary standard for iron several times and pH twice within the past five years.
As indicated above, the two Columbia aquifer wells are contaminated with TCE, which was discovered over a decade ago. Once the remediation is complete, the Town may be able to reuse these wells.
Millsboro has a wellhead protection ordinance in place, requiring a buffer for certain activities near wellheads. They also have a source water assessment dated 2003 on file with the State.
Distribution Storage Tanks Millsboro maintains three elevated storage tanks: 1 37-year old, 250,000-gallon tank, a 47-year old, 150,000-gallon tank and a 14-year old, 500,000-gallon tank (this tank was raised in 2018). The tanks are maintained under contract and lead-free paints are used in accordance with HB 456.
The Town is considering installing a new 1 MG elevated storage tank and plans to replace the 150,000-gallon tank near Route 13.
Distribution Piping Millsboro has 38.4 miles of distribution piping, mostly consisting of 4 to 12-inch PVC that was installed between 3 and 41 years ago (77.7% of total mileage). Approximately 20.5 percent of the network consists of 4 to 12-inch asbestos cement pipe installed 54 years ago. The balance of the distribution piping (approximately 1.8%) is 4 to 10-inch cast iron installed 54 years ago.
The most problematic piping in the distribution system is the original asbestos cement and cast-iron pipe installed downtown.
Millsboro’s distribution system does include lead goosenecks in the older sections of Town. At the time of the survey, the Town had recently discussed EPA funding with DHSS and is discussing a referendum with the Town’s legal counsel.
In addition to their lead abatement efforts, Millsboro is also prioritizing replacement of cast iron water mains, installing interconnections and loops within the system and upsizing some lines that are not sized for fire flows.
Assessment of Drinking Water Facilities and Service Areas January 2020
87
Asset Management Millsboro participates in the State’s asset management grant program and they are updating their existing asset management plan (AMP) developed in 2016. Current efforts are to integrate the AMP and Millsboro’s CIP and review the Town’s revenues and rate structure. The water system is mapped in GIS.
A water loss survey performed by Delaware Rural Water about 10 years ago showed that NRW was less than 10 percent.
Metering All of Millsboro’s water customers are metered, with a combination of older manual-read meters and newer radio-read AMR units. The Town has considered implementing a remote read (i.e., AMI) system and implementing a more proactive meter replacement program.
System Controls Millsboro uses a SCADA system to monitor and control the elevated storage tanks and water treatment plant. The Town reports some communication issues between the SCADA system and water tower.
Finances Revenue Generation Millsboro reports that revenue is sufficient to cover the water enterprise expenses. Customers are billed an availability fee and a demand charge based on metered usage. Industrial and commercial customers are billed at the same rates as residential connections. Some customers have separate irrigation meters for use in calculating appropriate sewer bills.
Millsboro’s water charges were not calculated by UNC-EFC, so an Affordability Index could not be calculated. Millsboro’s MHI is $43,750.
The Town has an overall debt borrowing limit of $36M with about $5.1M currently allocated to the water enterprise. The Town is close to maxing out on its borrowing limit.
Reserves Millsboro maintains a reserve account that is restricted to the water enterprise and is currently funded at a rate of about 16 percent of the annual water enterprise budget. Reserve funds may be used for debt service, emergency repairs or major renovations.
Capital Plans Although Millsboro adopts an annual budget, it does not appear that they prepare a CIP.
Milton
Utility Overview Service Area Milton provides water service in northeastern Sussex. In additional to residential customers, Milton serves three schools and 110 commercial units.
Assessment of Drinking Water Facilities and Service Areas January 2020
88
Underserved Communities The Town is willing to extended water service farther out of town (e.g., Martin’s to the southeast) and has a 5-year plan for development (e.g., Lucas) in town that is not currently served with water.
Supply and Treatment Water Supply Milton has four wells in service – two are in one aquifer and the other two are in another. The wells are maintained annually, and the oldest wells were recently rehabilitated with new motors, pumps and screens. The oldest active well dates to 1987. Each well has its own, dedicated onsite generator.
Milton has a 5-year and a 7-year CIP, which includes the installation of additional wells, including one with its own WTP, for which they have recently received a loan.
Treatment Three wells pump to one water treatment system consisting of only chlorination and fluoridation. The other well has its own, similar treatment system.
Milton plans to upgrade/modernize the larger treatment plant within the next two years. There will also be small upgrades (changing out all electrical panels) to allow for remote operation/SCADA. The SCADA will also control well pump pressure and water tower levels.
Capacity and Demand Milton reports an ADD of 0.392 MGD and PDD is 0.465 MGD.
Water Quality Milton has a source water protection ordinance, which prohibits building within 150 feet of wellheads.
Milton has a source water assessment on file with the State, dated May 2014.
Distribution Storage Tanks Milton has two elevated storage tanks, both maintained under contract. One 150,000-gallon storage tank was installed around 1982 and a 75,000-gallon storage tanks was installed around 1986.
Distribution Piping Most of Milton’s distribution network is original Transite pipe in the 4 to 12-inch range, dating from the early 1950s. The condition of the Transite pipes is described as poor and breaks are common.
That said, the Town is constantly adding to the system and is upgrading water mains from 4-6” to 8-12” for fire flow sufficiency. As money allows, they actively replacing pipes based on leaks and extending water service farther out of town. They recently installed a new main from Wagmans loop down the railroad tracks but have no plans to extend further. The Town has been in contact with a few developers about annexing and expanding.
Assessment of Drinking Water Facilities and Service Areas January 2020
89
There are about 100 lead goosenecks left in town and they have been working to replace these over last 10 years. They anticipate completing the replacement program within 5 years. They typically replace corporation stops when replacing mains.
Asset Management The distribution system is predominantly original from the 1950s (asbestos/Transite pipe that is in bad shape). Milton developed an asset management plan about 4 years ago, so they have 90% accuracy on length of pipe and type of pipes, different pipes.
Metering All of Milton’s water customers are metered, with radio-read, drive-by AMR units. Some customers have irrigation meters so that outdoor water use is not charged for sewer.
System Controls Milton currently has an alarm system for their storage tanks that notifies operators of water levels, well pressures and other minor things.
As previously indicated, the Town is planning controls upgrades, including changing out all panels, to allow for remote operation/SCADA. The SCADA will also control well pump pressure and water tower levels.
Finances Revenue Generation Milton charges an availability fee plus a demand rate per 1,000 gallons of consumption, billed quarterly. They also add a debt service charge. All customers are billed at the same rates at this time.
Milton’s water charges are about average for Sussex, averaging about $30.83 per month, which results in an Affordability Index of 0.67 percent at the MHI of $55,000.
Revenues are sufficient to cover water enterprise expenses. Milton relies on loans to fund major capital projects.
Reserves Milton has a reserve fund dedicated to the water enterprise.
Capital Plans Milton has a Comprehensive Plan developed in 2018 but does not appear to prepare a CIP.
Rehoboth Beach
Utility Overview Service Area Rehoboth Beach Water Department provides water service to a population of 2,500 via 5,500 connections within a service area of about 2.0 square miles (about 1.0 square mile within city limits and 1.0 square mile outside the city limits) in northeastern Sussex. The summer population is estimated to be up to 45,000.
Rehoboth Beach projects growth of 10 to 20 percent within their service area by 2030.
Underserved Communities Rehoboth Beach has the ability to expand, but no imminent plans to do so. There are very few vacant lots within the City and most properties within the service area are already developed. The City provides service outside of its geographic boundary by selling finished water to the County (the County then sells it to Dewey Beach). The City also provides water service to the Breezeview community, Northshore and some commercial locations.
Assessment of Drinking Water Facilities and Service Areas January 2020
90
Supply and Treatment Water Supply Rehoboth Beach has a total of ten (10) wells, with seven (7) wells in service at any given time. All wells extend into the surficial Columbia aquifer. The wells range in size from 6-inch to 18-inch and in depth from 98 to 140 feet below grade. Rehoboth Beach plans the renewal of multiple wells within the next six years.
Rehoboth Beach uses a combination of dedicated/onsite and portable generators in case of power outage.
Treatment Rehoboth Beach has three separate treatment systems. One treats using activated carbon, chlorination and fluoridation. The other two use air stripping (for lindane treatment), chlorination and fluoridation. They also add InterPhos OPP as a lead sequestrant. Rehoboth Beach plans to replace their GAC media within the next six years.
Rehoboth Beach’s oldest treatment system dates to the 1960. Major upgrades to the Lynch well site were completed in 2007.
An onsite generator is used to power the treatment system during power outages.
Capacity and Demand Rehoboth Beach reports and overall system capacity of 7.8 MGD, with a current ADD of 1.6 MGD and PDD of 3.7 MGD (July 4, 2018).
Water Quality Rehoboth Beach reports no exceedances of water quality standards and no detection of emerging contaminants including PFOS/PFAS within the past five years, although lindane was discovered in one well leading to the addition of air stripping processes to two of the Town’s treatment systems.
Delaware Rural Water helped Rehoboth Beach develop a source water protection plan. All of their wells are located outside of town in residential areas near Henlopen High School. Rehoboth Beach has a source water protection plan on file with the state, dated May 2014.
Distribution Storage Tanks Rehoboth Beach has two elevated storage tanks, both maintained under contract. The 2nd Street tank has a capacity of 500,000 gallons and is 20 years old. The Lincoln Street tank has a capacity of 1.0 MG and is 19 years old. The Lincoln tank exterior was painted using materials compliant with HB 456 in early 2019.
Distribution Piping Rehoboth Beach’s distribution network includes 55 miles of 4- to 16-inch pipe. The original system was 4- to 10-inch cast iron, installed in the 1940s and 1950s; cast iron still comprises about 36 percent of the network (~20 miles). Transite pipe in 6- to 16-inch sizes was installed in the 1960s and 1970s; these comprise about 27 percent of the network (~15 miles). C-900 PVC (6- to 16-inch) has been installed beginning in the 1980s to the present; it comprises about 36 percent of the network (~20 miles)
The oldest mains are within the Town limits on the south end of town from Rehoboth Avenue to Dewey Beach. The City has replaced approximately 10 blocks of old 4" CI water mains and the lead goosenecks connected to water service lines on those blocks. These mains have been upgraded to new 8-inch C-900 lines with new water service lines to the meter pit.
The City has a targeted water main replacement/upgrade program focused on replacing 4-inch mains and old service lines. The City tries to replace at least one block of water main a year coincident with street repaving. They are also conducting a survey to help identify and correct dead ends and develop a program
Assessment of Drinking Water Facilities and Service Areas January 2020
91
to target flushing aging water within the distribution system. They have not implemented a flushing program yet.
Rehoboth Beach reports having lead gooseneck connections within the City limits that need to be replaced.
Asset Management Rehoboth Beach completed an asset management plan in December 2017. Most of the distribution network is mapped in GIS.
The City is beginning to implement a new software platform to facilitate asset management.
Metering All potable and irrigation systems in Rehoboth Beach are metered. Fire protection lines are not metered. Most meters are 15 to 25 years old, and the City is beginning to implement a meter replacement program whereby meters will be replaced on a 15-year cycle. Rehoboth Beach is moving to automated drive-by meters.
System Controls Pumps and wells, water tower levels, the Dewey Beach meter and system flow meters are all tied into the City’s SCADA system.
Finances Revenue Generation Rehoboth Beach reports that revenues are sufficient to meet the needs of the water enterprise without loans (all debt capacity is being used to finance wastewater system needs). User fees include an availability fee plus peak and non-peak demand rates. Rehoboth Beach reports that their rates are very low, especially in comparison to private water utilities serving surrounding areas. Rehoboth Beach will be doing a rate study soon.
Rehoboth Beach’s water charges are very low for Sussex, averaging about $13.67 per month, which results in an Affordability Index of 0.19 percent at the MHI of $85,729.
Reserves Rehoboth Beach has a reserve fund for the water enterprise. They have separately tracked reserve funds for drinking water and wastewater and some of the reserve account revenue is transferred into the General Fund.
Capital Plans The City develops a five-year CIP annually. The latest CIP (2019-2023) programs funds for meter replacements, filter media replacement and vehicle purchase, as summarized in Table 5-11. Table 5-11. CIP Summary for Rehoboth Beach
Assessment of Drinking Water Facilities and Service Areas January 2020
92
CIP Item Budget
Replacement vehicle (#36; ford transit connect) $6,540
Replacement vehicle (#32; ford F-350) $16,798
SCADA upgrades $25,000
Backhoe replacement $125,000
Census reading equipment $70,000
TOTAL $243,338
Seaford
Utility Overview Service Area Seaford provides water service to a population of 6,924 via 3,204 connections within a service area of about 5.3 square miles in west-central Sussex.
Underserved Communities Seaford reports having the capacity to extend water service, but no plans to do so.
Supply and Treatment Water Supply Seaford has five (5) wells with four (4) currently in service and one (1) in emergency status; all extend into the surficial Columbia aquifer. Two wells were drilled in 1993 and one was drilled in 1989. Two wells have an onsite generator, and another has the capability of portable generator hookup.
Treatment Seaford has four separate treatment systems – two co-located wells share treatment and the other well sites each have their own treatment system. Treatment consists of chlorination and fluoridation. The systems were constructed in the 1990s and have had no major upgrades since.
Capacity and Demand Seaford reports and overall system capacity of 6.192 MGD, with a current ADD of 1.0 MGD and PDD of 1.3 MGD. Seaford reports that overall flows have actually gone down over the past ten years due to water conservation initiatives.
Water Quality Seaford reports having nitrates in one well close to the edge of town; no emerging contaminants have been detected in the City’s water.
Seaford has a source water protection map and plan. They have a source water assessment report on file with the State, dated January 2002.
Distribution Storage Tanks Seaford has four (4) elevated storage tanks, as summarized in Table 5-12.
Table 5-12. Seaford Storage Tank Characteristics
Storage Tank Year of Installation Capacity (gal.)
Dulany 1966 300,000
Assessment of Drinking Water Facilities and Service Areas January 2020
93
Spruce 1947 300,000
Lowes 2006 500,000
Industrial Park 1996 750,000
Tanks are maintained on a regular basis and paints are confirm lead-free in accordance with HB 456. Sandblasting and repainting the Spruce Street tank is on the City’s 3-year CIP.
Distribution Piping Seaford has roughly 38 miles of distribution piping, consisting of about 50 percent cast iron in 4- to 10-inch sizes, 20 percent DIP in 6- to 18-inch sizes, 20 percent PVC in 6- to 16-inch sizes and 10 percent Transite in 4- and 6-inch sizes.
The old part of Town has the oldest cast iron pipe, some of which is about 100 years old. These suffer occasional main breaks from freezing.
The City is still replacing some of the Transite pipes in one neighborhood to resolve complaints about dirty water. Generally, these are replaced when there is a problem. The Town has also installed some mains to increase looping in the system.
Seaford’s CIP includes the installation of 5,600 feet of 16" water main along Rt. 13. The City has identified other projects to serve annexed properties.
Seaford recognizes that they have lead goosenecks in their system between the corporation stop to the galvanized service line. These are replaced when services are repaired or replaced. Seaford reports never having had any copper or lead violations.
Asset Management Digitizing of Seaford’s distribution system maps is in progress. The City recognizes that it has some NRW but currently has no way to quantify it.
Metering The City has commercial and industrial customers metered, but residential service is not metered. The Water Department would like to have meters. With ARRA funding they had a 60% principal forgiveness loan for meters, but a referendum on the matter did not pass. System Controls Seaford has a SCADA system that controls the well pumps and elevated storage tanks from the central Public Works Department offices.
Finances Revenue Generation Seaford reports that revenues are sufficient for funding the water enterprise.
Seaford charges (unmetered) residential customers a flat monthly rate per EDU. Commercial and other non-residential customers are billed based on metered water consumption.
Seaford’s water charges are the highest in the state, averaging about $66.25 per month, which results in an Affordability Index of 1.77 percent at the MHI of $44,886.
Assessment of Drinking Water Facilities and Service Areas January 2020
94
Seaford has a debt borrowing limit of $2M annually, without requiring a referendum. The City currently has a water main extension bond that will mature in November 2031.
Reserves Seaford has a reserve account used to fund 100 percent of water enterprise expenses. Reserves are restricted for emergency repairs and for future water enterprise fund projects such as water main extensions, water towers, etc.
Capital Plans Seaford has a Comprehensive Plan developed in 2008. The Water Department maintains a three-year CIP, as summarized in Table 5-13. Table 5-13. CIP Summary for Seaford
CIP Item Budget
Blast and repaint interior and exterior water tank $550,000
Estimate for new tank $2,000,000
Rt 13 water and sewer main extension; 16" water main and 12" gravity sewer $1,881,200
TOTAL $4,431,200
Selbyville
Utility Overview Service Area Selbyville provides water service to a population of 2,268 via approximately 1,200 connections within a service area of about 1.4 square miles in southeast Sussex. The Town approximates that 10 percent of the population is seasonal. They anticipate significant future growth.
Underserved Communities Selbyville runs pipes along Routes 70 and 54 to allow service to customers outside the limits. Currently these customer properties are not annexed but when the Town’s service boundary reaches them, they will be annexed.
Selbyville has two underserved communities close to their service area. They have talked with Frankford about annexation, while they have had no discussions with Johnsons Corner. They typically encourage annexation to make water service extension easier.
Supply and Treatment Water Supply Selbyville has five (5) wells, with three (3), 12-inch wells currently in service and one (1), 10-inch well and one (1) 12-inch well reserved for emergency/backup. All of the wells are drilled into the surficial Columbia aquifer. The newest active well was installed three (3) years ago.
Three wells are on one onsite generator and two wells have their own onsite generator in case of power outage.
Selbyville’s water system is interconnected with Artesian’s water system on the east side of town. The interconnection helps maintain adequate pressure for this part of the distribution system. Selbyville typically purchases about 50,000 gallons per day from Artesian.
Assessment of Drinking Water Facilities and Service Areas January 2020
95
Treatment All of Selbyville’s wells feed one water treatment plant consisting of five (5) Greensand Plus filters (three active, two for redundancy), packed aeration towers for VOC removal, chlorination, fluoridation and pH adjustment using caustic soda.
The water system was originally built in 1933. A new WTP building was installed and put into service in 2018. Packed bed aeration was installed in 2017/2018.
The Town is installing a backwash recovery system that settles out iron precipitate and pumps cleaner water back into the system.
Capacity and Demand Selbyville reports having a current system capacity of 1.0 MGD, with an ADD of 0.265 MGD and a PDD of 0.300 MGD.
Water Quality Selbyville reports exceeding the MCL for TTHM in 2016.
Two wells had MTBE and PFAS issues, so new treatment and wells were installed. There are a number of old gas stations and USTs in the area; however, the contamination source has not been determined.
Packed bed aeration was installed in 2017/2018 used to remove VOCs including the TTHMs and MTBE.
Selbyville has a source water protection plan, a source water contingency plan and a wellhead protection plan.
Distribution Storage Tanks Selbyville has two elevated storage tanks of 120,000 and 125,000 gallons. One was installed in 2001 and the other dates to 1944. They are regularly maintained under contract and are coated using lead-free materials compliant with HB 456.
Artesian is currently installing an elevated storage tank on the east side of town under agreement with Selbyville.
Distribution Piping Selbyville has about 35.4 miles of distribution piping, ranging in size from less than 4 to 12 inches in diameter. The Town reports less than a mile of asbestos cement and PVC piping with the remainder being
Assessment of Drinking Water Facilities and Service Areas January 2020
96
of “unknown” material which could be some combination of asbestos cement, ductile iron and galvanized steel.
Some old lines were upgraded to PVC in the late 1980s. The worst/oldest pipes are located in the central part of the city, including Railroad Avenue and Clendaniel Avenue.
The Town reports continued efforts to loop dead-ends in their distribution system. They are also working on rehabilitating or adding valves to enable maintenance with minimal disruption to customer service.
The distribution system contains some lead goosenecks which are replaced as they are discovered. The Town reports passing all of their Lead and Copper Rule testing.
Asset Management Selbyville is currently in year 2 of the Town’s five-year, State-sponsored, asset management program and reports that its core system assets are mapped in GIS (it is unclear why more specifics on the piping characteristics could not be provided for this survey).
Metering All Selbyville customers are metered. The Town implemented Sensus radio read meters about 10 years ago. System Controls Selbyville’s SCADA system monitors and controls well pumps, well water chemical injection, water treatment facility, aerators, chlorine injection, clear wells, elevated storage tanks, treated water chemical injection and alarm conditions.
Finances Revenue Generation Selbyville reports that revenues are sufficient for funding the water enterprise.
Selbyville bills quarterly based on a flat fee for 18,000 gallons. Water consumption that exceeds 18,000 gallons is billed on a per-gallon basis. Customers outside the Town limits pay a modestly higher flat fee and per-gallon rate. Residential and non-residential customers pay the same rates.
Selbyville’s water charges are slightly below average for Sussex, averaging about $27.08 per month, which results in an Affordability Index of 0.66 percent at the MHI of $49,107.
Selbyville has a debt borrowing limit of 50 percent of the appraised value of its real property.
Reserves Selbyville has a reserve account restricted to the water enterprise. It can pay for any capital costs required to plan, design, acquire and construct facilities with adequate capacity to serve new users of the water distribution system.
Capital Plans Selbyville does not currently have a formal CIP for the water system; however, its asset management plan is used as a guide to spending. Utility representatives indicate that they plan to spend approximately $10M on water main replacement over the next five years.
Sussex
Assessment of Drinking Water Facilities and Service Areas January 2020
97
Utility Overview Service Area Sussex owns and operates a water distribution system that provides finished water from the Rehoboth Beach system and delivers it to the Dewey Beach distribution system (see Dewey Beach summary for more information).
Sussex also operates a small system serving the Sussex County Industrial Airpark which currently serves a total of 24 connections including general aviation, chicken processing, propane, fiberglass tank manufacture and a foundry.
Underserved Communities Sussex is planning to provide water service to Ellendale. A water district was created for a new CPCN (The County has submitted an NOI for a permit per DE Code Title 9 Ch. 65). The County is purchasing the distribution system for $5M and will buy water from Artesian to distribute to users.
Sussex pointed out that the required petition process for extending service requires 50 signatures initiated by local jurisdictions or through State mandate.
Supply and Treatment Water Supply The Sussex County Industrial Airpark water system sources water from two 10-inch wells drilled 110 to 120 feet below grade into the Columbia aquifer.
Treatment The Sussex County Industrial Airpark water system includes activated carbon treatment, chlorination, fluoridation, caustic addition for pH control and phosphate addition for corrosion control. The wells and treatment system are powered by an onsite generator in case of power outage.
The original system was installed in the 1950s with significant upgrades in 1973, 1982, 1985 and 2006.
Capacity and Demand Sussex reports that the Industrial Airpark system has a current capacity of 0.432 MGD, with an ADD of 0.035 MGD and a PDD of 0.050 MGD.
Water Quality Sussex reports that the Industrial Airpark system had no exceedances or detections of emerging contaminants within the past five years.
Although Sussex requires a minimum 150-foot wellhead protection radius, wells serving the Industrial Park predate the wellhead protection program.
Distribution Storage Tanks Sussex has three (3) elevated storage tanks, two (2) 150,000-gallon tanks installed in 1985 and a 326,000-gallon tank installed in 2006. The tanks are maintained annually under contract using paints confirmed to be lead-free in accordance with HB 456.
Distribution Piping The water distribution system serving the Industrial Park consist of a mix of DIP (dating from the 1950s) and PVC (C-900 installed in 2006, SDR 18 installed in 1973 and SDR 21 installed in 1985) piping ranging in size from 10 to 24 inches in diameter. The County estimates that about 35 percent of the piping is C-900,
Assessment of Drinking Water Facilities and Service Areas January 2020
98
25 percent SDR 21, 25 percent SDR 18 and 15 percent DIP. The total installed length of each material is reported less than 1 mile.
There are plans to expand and upgrade the distribution system within the next five years and there was an expansion to King Farm Industrial Park within the past five years.
There are no lead-containing pipes or fittings within the distribution system.
Asset Management Sussex does not have a formal asset management program for the Industrial Park system
Metering System flows are metered using drive-by, radio read AMR meters. System Controls The entire system is monitored and controlled using SCADA.
Finances Revenue Generation Sussex reports that Industrial Park revenues are sufficient for funding the water enterprise.
Revenues are paid for out of airport funding. Individual users are not charged directly.
Reserves Sussex has a reserve account restricted to infrastructure improvements for the water enterprise.
Capital Plans Sussex develops an annual budget which includes a five-year CIP for enterprise funds. However, no forward-looking capital plans were provided for drinking water in the 2020 budget document.
Assessment of Drinking Water Facilities and Service Areas January 2020
99
6. PRIVATE UTILITY FACILITIES Private Utility Overview Four private utilities serve customers in Delaware. A summary of each utility’s major characteristics and infrastructure is provided in Table 6-1.
Table 6-1. Private Utility Drinking Water Utility Characteristics
TOTAL 478,306 285 96 13 140 2,660 40.9 ADD = Average daily demand. MDD = Maximum day demand.
Three of the utilities rely exclusively on groundwater for water supply while one (Suez-United) uses surface water. Capacity and flow attributes of the private utilities have not been summarized as most private utilities operate multiple or many systems, each with different capacities and demand attributes. Accordingly, capacity-related issues are addressed in the specific utility write-ups that follow.
Estimates of the replacement value of utility assets for private drinking water utilities are summarized in Table 6-2.
Table 6-2. Estimated Present-Worth Replacement Value of Sussex Municipal Drinking Water Assets Drinking Water System
Wells/Treatment Storage Tanks Mains and Appurtenances Pump Stations Total
Water distribution mains and appurtenances represent 76 percent of the replacement value of private utility drinking water infrastructure in Delaware. Water supply (e.g., wells), pumping and treatment infrastructure represent about 17 percent and storage tanks the remaining 6 percent of asset replacement value.
As indicated in Table 6-3, Annual Investment rates for one of Delaware’s private utilities was 1.1 percent of total asset value. The other utilities did not provide CIP data for the study.
Table 6-3. Delaware Private Drinking Water Utility 5-Year CIP Summary
Drinking Water System CIP? 5-Year CIP Budget Annual Investment Ratio
Artesian UNK.
Suez-United UNK.
Sussex Shores Water Co. UNK.
Tidewater YES $27,374,485 1.1%
Assessment of Drinking Water Facilities and Service Areas January 2020
100
TOTAL $27,374,485 0.2%
Descriptions of each private utility’s service area, infrastructure, planning and financial characteristics are provided in subsequent subsections.
Artesian
Utility Overview Service Area Artesian currently serves over 86,500 metered customers, representing a population of about 250,000, across about 284 square miles (CPCN area). Artesian has a large, interconnected water system in northern New Castle County consisting of about 141 square miles and 76,000 metered customers. Artesian also owns and operates several satellite water systems in Kent and Sussex Counties, mostly serving new development. A sizable portion of Artesian’s CPCN in Sussex is currently undeveloped.
Artesian Water purchased existing water assets from Fort DuPont Redevelopment and Preservation Corporation, including a water treatment plant, storage tank, mains and other equipment in June 2017. Artesian plans to build a new water system and upgrade the existing system to serve planned future development of Fort DuPont.
In March 2018, Artesian Water purchased the utility assets of Slaughter Beach Water Company which serves 265 customers in Slaughter Beach in Sussex.
Artesian water has been providing water service in Delaware since 1905.
Underserved Communities Artesian reports having the capacity, capability and interest to extend water service to underserved communities.
Artesian’s mains are very close to some underserved communities and they are willing to serve them, and they have capacity to do so. They actively try to work with counties – particularly Sussex – to address underserved community needs. They serve the area south of Ellendale in Sussex and are expanding service to serve the greater Ellendale area. They have also had conversations with Houston. They are currently working on a public-private partnership model in Sussex.
Supply and Treatment Water Supply Artesian sources about 85 percent of its water from its own groundwater wells (drawing from the Columbia, Potomac, Cockeysville, Marble, and Mount Laurel aquifers), with the remaining 15 percent from interconnections with other utilities and municipalities.
Artesian’s 125 wells range in size from 4 to 18 inches in diameter and up to 970 feet in depth. Artesian’s Self Sufficiency Report describes well capacity for the northern New Castle County system in detail.
Artesian has 22 interconnections with two neighboring utilities and six municipalities. They provide service connections to Selbyville and Dagsboro and have an emergency interconnection with Bethany Beach.
Treatment Artesian operates 54 different water treatment facilities in Delaware. Although treatment details vary by system, Artesian uses variety of treatment methods, including aeration, pH adjustment, chlorination, fluoridation, ultra violet oxidation, arsenic removal, nitrate removal, radium removal, iron removal, and
Assessment of Drinking Water Facilities and Service Areas January 2020
101
carbon adsorption, depending on need. Artesian also uses a corrosion inhibitor for all of its groundwater sourced treatment systems.
Details on treatment processes used at each WTP is provided in Artesian’s annual PSC report.
Capacity and Demand Artesian reports that their peak water supply capacity is 55.0 MGD and ADD was 18.5 MGD in 2018.
Water Quality Artesian has reported PFAS issues in northern New Castle County; they use activated carbon to remove it. PFAS is mainly an issue south of I-295, and north of Route 40.
Most of Artesian’s wells meet wellhead protection requirements, although some have small variances. Typical requirements are for protection radii of 150 feet and 300 feet for unconfined and confined aquifers, respectively.
Distribution Storage Tanks Artesian reports having 29 steel storage tanks in Delaware ranging in size from 110,000 gallons to 5.4 MG, with a combined total storage volume of about 42 MG. Artesian also has an aquifer storage and recovery (ASR) system in New Castle County, which provides about 130 MG of storage capacity.
Storage tanks are maintained regularly using materials that meet HB 456.
Artesian reports having 26 contact storage tanks, which are either at ground level or underground, constructed of steel or masonry block and ranging in size from 3,700 to 350,000 gallons.
Additional details about Artesian’s storage infrastructure can be found in their annual PSC report.
Distribution Piping Artesian reports maintaining approximately 1,311 miles of distribution mains ranging in diameter from 2 to 24 inches in diameter. Most piping is DIP or CIP.
Artesian has a proactive main replacement program in place. Some mains, particularly in New Castle County, are up to 70 years old.
Artesian is actively getting rid of cast iron and galvanized pipe proactively.
Artesian has done some research and is not aware of any lead in service lines.
Asset Management As a private utility, Artesian’s business model revolves around asset management. Accordingly, they continue proactive infrastructure investments and have an active program for flushing their service lines. They are actively trying to get rid of galvanized piping on a proactive basis and are always addressing new water quality issues, many of which come up unexpectedly. Artesian reports always rehabbing and upgrading and adding new systems as they grow.
Metering Most of Artesian’s users are metered; they have radio read, drive-by meters. There remain some small sections of Artesian’s service area that are unmetered.
Per their approved tariff, Artesian is required to test or replace meters based on approved intervals and meter throughput allowances.
System Controls All system components are tied into a SCADA system.
Assessment of Drinking Water Facilities and Service Areas January 2020
102
Finances Revenue Generation Artesian’s approved tariff authorizes its rates which include a monthly customer charge based on meter size along with demand rates charged per thousand gallons using an increasing block (i.e., conservation) rate structure.
Artesian’s average monthly water charge is about $64.50.
Reserves Detailed financial information for Artesian can be found in their annual Form 10-K submission to the U.S. Securities and Exchange Commission.
Capital Plans Information not available.
Suez-United
Utility Overview Service Area Suez-United serves about 38,000 connections in various areas in and around New Castle County, including Newport, Claymont, areas along the Pennsylvania state line, south of Newark, the River Road area, the Chestnut Hill area and the refinery and nearby subdivisions around Delaware City.
Underserved Communities Suez-United has the capacity and is interested in extending water service to underserved communities. However, they require a minimum number of households to make it feasible from a financial perspective.
Supply and Treatment Water Supply Suez-United’s Delaware operations are sourced using two surface water intakes, one on the White Clay Creek and one on the Christina River. The Christina River intake was out of service at the time of this survey. Suez-United plans to study a new water intake structure within the next six years.
Suez-United also has multiple interconnections with the Chester Water Authority, Newark, and Wilmington.
Treatment Suez-United operates a conventional surface water treatment plant with coagulation, flocculation, clarification, filtration, chlorine disinfection and fluoridation.
WTP electrical systems upgrades are planned within the next six years. Within the past six years, Suez-United has replaced electrical MCCs, added an air scour system to the filters and added a sludge discharge line to the sewer. The original treatment system was installed in 1946 with upgrades in the late 1960s, 1970s, 1990s and in 2019.
The WTP has an onsite generator to power it in case of power failure.
Capacity and Demand Suez-United has a 30 MGD allocation and treatment capacity, a report a current ADD of 15.8 MGD and a PDD of 20 MGD.
Assessment of Drinking Water Facilities and Service Areas January 2020
103
Water Quality Suez-United did not report any compliance issues within the past five years but is aware of the presence of emerging contaminants in their water. They have a US EPA-approved watershed control plan.
Distribution Storage Tanks Suez-United has 17 storage tanks and 13 booster stations
Storage tanks are maintained regularly using materials that meet HB 456.
Booster stations are powered using onsite generators or portable generators in case of emergency.
Distribution Piping Suez-United reports maintaining approximately 544 miles of distribution mains ranging in diameter from 2 to 30 inches. A summary of the water distribution piping characteristics is provided in Table 6-4.
Table 6-4. Summary of Suez-United Distribution Piping Characteristics
Pipe Material Age Range (yr.) Size Range (in.) Line Length (mi.) Percentage of Total Lines (%)
PVC 0-45 2-16 224 42
Cast Iron 45-100 2-30 222 40
Ductile Iron 0-45 4-30 19 4
Asbestos Cement 30-80 16-24 76 14
Other 30-80 16-24 3 <1
The oldest pipes are located in north Wilmington. System-wide, Suez-United replaces approximately 0.3 percent of its distribution mains per year but plans to increase the replacement rate to 0.7 percent.
Suez-United is not aware of any lead containing materials in their distribution system.
Asset Management Suez-United has its water distribution network mapped in GIS. They report an NRW rate of 14.5 percent.
Metering 99 percent of customers are metered using drive-by, radio-read AMR.
System Controls All distribution pumping/tanks are on SCADA for operator control.
Finances Revenue Generation Suez-United’s approved tariff authorizes its rates which include a monthly customer charge based on meter size along with demand rates charged per thousand gallons using an increasing block (i.e., conservation) rate structure.
Suez-United’s average monthly water charge is about $44.20.
Reserves Detailed financial information for United-Suez can be found in their annual Form 10-K submission to the U.S. Securities and Exchange Commission.
Assessment of Drinking Water Facilities and Service Areas January 2020
104
Capital Plans Information not available.
Sussex Shores Water Company
Utility Overview Service Area Sussex Shores Water Company was established in 1956 to supply water to retail customers in Sussex. It currently serves 1,855 customers in southeastern Sussex.
Underserved Communities
Information not available.
Supply and Treatment Water Supply Sussex Shores currently has eight (8) wells: four (4) 185-feet deep well in the Pocomoke aquifer and four (4) shallower wells in the surficial Columbia aquifer.
Sussex Shores is also interconnected with Bethany Beach for emergency only.
Treatment Information not available.
Capacity and Demand Sussex Shores has a monthly allocation of 1.28 MGD and an annual allocation of 0.52 MGD. In 2018, their average monthly flow was 0.28 MGD and their maximum monthly flow averaged 0.73 MGD.
Water Quality Sussex Shores did not report any compliance issues on their 2018 Consumer Confidence Report (CCR).
Distribution Storage Tanks Sussex Shores has two ground level storage tanks: a 100,000-gallon tank installed in the 1970s and a 50,000-gallon tank installed in 1991. They also have one 400,000-gallon elevated tank installed in 2007.
Distribution Piping Sussex Shores reports having about 40 miles of buried distribution system mains, consisting of a mix of ductile iron, galvanized steel and PVC between 2 and 16 inches in diameter.
Asset Management Information not available.
Metering Information not available.
System Controls Information not available.
Assessment of Drinking Water Facilities and Service Areas January 2020
105
Finances Revenue Generation Sussex Shores’ approved tariff authorizes its rates which include a quarterly customer charge based on meter size along with demand rates charged per thousand gallons using an increasing block (i.e., conservation) rate structure.
Sussex Shores’ average monthly water charge is about $39.76.
Reserves Information not available.
Capital Plans Information not available.
Tidewater
Utility Overview Service Area Tidewater Utilities, Inc. provides water services to 45,616 customers in 415 residential communities and commercial establishments in all three Delaware counties. They have 50 systems with PWSIDs, and a total of 84 facilities. For the most part, Tidewater builds the plants and interconnections/mains. The developer builds onsite infrastructure (e.g., lines) and turns the infrastructure back over to Tidewater. Most of Tidewater’s systems are 20-25 years old or less.
Tidewater also sells bulk water under contract to the Ocean View, Dover Air Force Base and Southern Shores Water Company, a Tidewater subsidiary since 2009 which serves Sea Colony’s 2,300 residential customers (which is the only area whose customers are not metered). Tidewater also sells bulk water to Baywood Greens golf course development and contract operates some facilities for municipalities.
Tidewater was originally established in 1964.
Underserved Communities Tidewater has the capacity, capability and interest in extending water service to underserved communities. However, they have only extended service to one underserved community in 18 years: Quaint Acres.
According to Tidewater, Docket 15 – 2006 says that to extend service to new areas, growth must pay for itself (i.e., developers pay for new line or new plant if required). Tidewater believes that it might help if the WIAC or DNREC mandated connections or provided funding. For example, the Ocean View couldn’t make everyone connect, so the town created a district and got funding and then could require everyone to connect. For Holiday Pines, the PSC waived Docket 15, allowing costs to be spread across ratepayers. For Cheswold (an older community with wood frame houses), the legislature allocated money to provide fire flow.
Tidewater can serve communities if they are within their CPCN. They are very interested in working with DNREC on this, particularly on the water side.
Supply and Treatment Tidewater provided survey information for their 9 largest DW systems, the major characteristics of which are summarized in Table 6-5.
Assessment of Drinking Water Facilities and Service Areas January 2020
106
Table 6-5. Summary of Characteristics of Tidewater’s Largest Nine Systems
Garrison Lake 0.8 0.51 0.53 10,575 10,575 3,525 TOTAL 20.7 5.53 8.53 77,492 122,378 38,877
Water Supply Tidewater water systems are almost entirely groundwater sourced. They currently have 152 wells, although details about their construction and depth are unknown. Tidewater has also interconnected their systems together and interconnected their systems with adjacent systems, particularly in Sussex. At least half of their systems include interconnections where they share supply and storage. These include Tidewater’s Sea Colony interconnection with Artesian and Tidewater interconnections with Dover, Lewes BPW and Bethany Beach.
Treatment Tidewater reports having 84 water treatment systems, although details about their characteristics were not provided.
Capacity and Demand Tidewater reports having an installed capacity of over 20.7 MGD and an ADD of 6.3 MGD. Water demand is generally very seasonal (refer to Table 6-5).
Water Quality Given the extent of Tidewater’s systems, they do have some legacy groundwater contamination issues. EPA’s UCMR brought some issues to light including occasional MBTE and PFOA hits. Several of their systems are treated for PCE removal and some are treated for nitrate. Tidewater
For groundwater protection areas, county ordinances cover them in most cases, but the protection is pretty limited. Found PFOA in a surficial aquifer using data from a DNREC/USGS network of wells. One of their wells was taken out of service. Ion exchange is used to treat lower levels and the finished water does not exceed guidelines.
Distribution Storage Tanks Tidewater has 47 storage tanks, with a total of 3,598,500 gallons of ground storage and 4,200,000 gallons of elevated storage.
Assessment of Drinking Water Facilities and Service Areas January 2020
107
Distribution Piping Tidewater has about 765 miles of buried water mains. Ninety-eight percent (98%) of water mains are relatively new PVC. They know where the oldest (Transite) mains are. There is some lead solder on the customer side of some of their older systems.
Tidewater is working on interconnecting the three Lewes-Rehoboth area systems, including Bay Shores and the South District.
Asset Management Information not available.
Metering All users except those in Southern Shores are metered.
System Controls Tidewater is currently working on full implementation of their SCADA system to ultimately pull everything together.
Finances Revenue Generation Tidewater’s approved tariff authorizes its rates which include a monthly or quarterly customer charge based on meter size along with demand rates charged per thousand gallons using an increasing block (i.e., conservation) rate structure. They also charge fire protection fees for facilities with sprinkler systems. Water service is billed quarterly, in arrears.
Tidewater’s average monthly water charge is about $65.83.
Reserves N/A
Capital Plans Tidewater have a rolling five-year capital planning process, where each department brings its needs forward. Tidewater invested $9.3M in water infrastructure upgrades and improvements in 2018, as provided the 5-years CIP summary indicated in Table 6-6. Table 6-6. CIP Summary for Tidewater
CIP Item Budget
Mains and Valves $3,600,000
Service Lines $8,326,464
Hydrants $502,500
Meters $5,135,000
Source of supply $1,650,000
pumping and treatment $6,725,000
remote station $-
pumping equipment $912,500
water treatment equipment $150,000
production structures $373,021
TOTAL $27,374,485
Assessment of Drinking Water Facilities and Service Areas January 2020
108
Assessment of Drinking Water Facilities and Service Areas January 2020
109
7. CONCLUSIONS AND RECOMMENDATIONS Many findings of this Needs Assessment effort have been presented in previous sections. In particular, Section 2. Statewide Drinking Water System Overview, presents summary findings of most of the key issues upon which this report focuses.
Additional insights and programmatic recommendations for State stakeholders are provided in this section.
Service Coverage As indicated in Section 2, most utilities did not provide full GIS coverages of their water systems. Even acquiring targeted data on distribution facilities near underserved areas in Delaware proved difficult. Although the PSC maintains spatial coverage of CPCN areas, State-wide infrastructure coverage is not currently available to the public.
Particularly for water systems, making such spatial data widely available can present a security risk. However, this data can be quite important for State-wide and local planning efforts. For this assessment, the project team solicited water system infrastructure spatial coverages (e.g., without the precise locations of system components identified).
That said, the utilities were also surveyed as to the physical size of their service areas (i.e., where they currently actually provide service, not their CPCN). Based on this data, it appears that about 22 percent of the State is served by a centralized (public or private utility) water system. Overall, private utilities serve more than two times the geographical area than municipal utilities do: 14.6 percent for private utilities versus 7.8 percent for public.
On a population basis, over 80 percent of Delaware residents are served by a centralized water system (presumably, the remainder are served by either individual wells or small community water systems). Municipal utilities serve approximately 30.5 percent of Delaware residents, while private utilities serve about 72 percent of the balance (or 50 percent of the population overall).
Underserved Communities Although improving water provision to underserved communities is the focus of other State efforts, all water utilities were queried as to their ability and interest in extending service accordingly.
Respondents fell into several categories. Most (62 percent) of the surveyed utilities – including 68 percent of municipal utilities – have the capacity to extend service, but no imminent plans or interest; these service providers often cited annexation requirements as a barrier. The State should formalize programs to accelerate the extension of water to underserved communities, with a focus on alleviating requirements (or perceived requirements and barriers) such as annexation restrictions and perhaps incentivizing extensions.
About 30 percent of utilities (23 percent of municipal utilities) expressed interest or ongoing efforts to extend service to underserved communities. Roughly 9 percent of utilities indicated that they did not have sufficient capacity to extend service.
Supply and Treatment
Water Supply The vast majority of water utilities in Delaware rely exclusively on groundwater for their source. Only Wilmington relies exclusively on surface water sources. Newark uses both groundwater and surface water
Assessment of Drinking Water Facilities and Service Areas January 2020
110
as significant sources. All water utilities in Sussex and Kent Counties rely on groundwater as their sole source of supply (excluding water purchases from neighboring systems).
A total of 16 different aquifers are used by groundwater-sourced water utilities in Delaware. The shallow/surficial Columbia aquifer is the most predominantly used source of groundwater in Delaware. (It is likely that many or most small community and individual wells in Delaware also tap this inexpensive supply, although this was outside the scope of this project.) Besides the Columbia, the Frederica, Manokin, Potomac (upper, middle and lower), Cheswold and Piney Point aquifers are most frequently used by water utilities in Delaware. Although a detailed groundwater resource evaluation was outside of the scope of this project, there are no obvious indications than any of the aquifers cited are being overexploited. In fact, very few utilities suggested that, for example, saltwater intrusion is an emerging issue. Groundwater supply limitations appear to be mostly the result of insufficient well pumping capacity, rather than aquifer recharge. Most utilities appeared to do a good job of proactively maintaining their water sourcing infrastructure (e.g., wells, by redeveloping them and replacing pumps).
In summary, Delaware’s water allocation and permitting program appears to be an effective steward of the State’s water resources.
Drinking Water Treatment Drinking water systems in Delaware share many similarities in terms of treatment approaches. The two-surface water sourced systems rely or more-or-less conventional surface water treatment processes. Almost all the groundwater sourced systems focus on chemical systems to ensure safe water provision. Chlorination is used as the primary disinfectant for most systems (96 percent). Most systems (~86 percent) fluoridate their water as a preventative health measure. Although these efforts were not always reported consistently by utilities, most if not all, appear to use sequestrants and pH adjustment chemicals to control corrosion and the dissolution of potentially harmful chemicals from (particularly old) distribution piping.
In addition to direct chemical injection, reactive media (e.g., Greensand and Greensand Plus) filtration is a common unit process in groundwater sourced systems, mainly for iron control. Aeration (either direct or in packed beds for VOC removal) and activated carbon (granular or GAC) are commonly employed for control of contaminants like solvents and for aesthetic reasons (e.g., taste and odor).
Without a much more detailed assessment (more like an asset condition assessment), it is somewhat difficult to precisely estimate State-wide water treatment needs. Utilities were surveyed as to the age of their treatment system and years when major upgrades occurred, but the information received was generally too vague to estimate when major system components might need to be rehabilitated or replaced. Rather, this specific information was solicited in separate survey questions related to recent and planned treatment system improvements. Again, however, the quantity and quality of information received from the surveyed utilities varied widely. The bottom line is that utilities need to be proactive with regard to maintaining the reliability and efficacy of their treatment systems. Accordingly, the State’s asset management grant program provides an excellent model for utilities. It was, however, unclear whether those utilities implementing an asset management program focused exclusively on their buried infrastructure (distribution network) or also included source and treatment infrastructure.
Water Distribution Not surprisingly, Delaware water utilities face significant challenges related to maintaining their distribution infrastructure. Aging buried infrastructure represents a clear risk – line breaks can be catastrophic. However, this risk is magnified when one considers that the replacement value of mains and distribution system appurtenances in Delaware is nearly $4B, representing 80 percent of the total
Assessment of Drinking Water Facilities and Service Areas January 2020
111
replacement value of water infrastructure in the State. It is therefore imperative that drinking water utilities proactively maintain their buried assets to avoid mass infrastructure failures in the future.
Based on feedback from utility respondents, the highest risk materials in distribution system across the State are cast iron pipe (typically among the oldest pipe and can be corroded and brittle), galvanized steel and ACP/Transite. Ductile iron and PVC pipe are often newer and more durable and thus typically represent lower risks, although this varies by system.
Asset Management State-wide, over half of surveyed utilities in Delaware have partially or fully implemented an asset management program, with the twenty-eight percent (28%) of Delaware water utilities taking advantage of the State’s asset management grant program. Efforts should be made to engage the 22 percent of water utilities with little or no asset management program. These utilities appear to be distributed relatively evenly across Delaware’s three counties.
As previously indicated, asset management programs initiated by Delaware water utilities tend to focus mostly on buried infrastructure (pipe). This make sense given the high value and considerable risk associated with this infrastructure class and the fact that it is buried where problems can easily be hidden to the utility. However, asset management should also extend to water sourcing and treatment systems.
Although it does not appear that Delaware have imminent water supply issues, there is a conspicuous lack of interest, knowledge and focus on system-wide water balances and quantification (and reduction) of NRW. Very few utilities were able to confidently report their NRW rate. In terms of financial and environmental sustainability (e.g., less water lost yields more revenue and lower pumping and treatment energy consumption, not to mention water consumption), asset management planning should include a greater focus on NRW quantification and reduction.
Lead Service Line Replacement Water utility awareness to the presence and potential impact of lead-containing piping in their systems varies quite a bit among systems, with some having completed abatement programs, others currently implementing programs, others replacing offending pipe fittings as encountered, to others with virtually no awareness of the status of lead-containing fitting in their systems.
Utility Finances Although most water utilities in Delaware reported solvency with respect to their revenues versus expenses, the amount of spending (especially, proactive spending) on their systems and their rates varies widely from utility to utility. In addition to building capacity vis-à-vis asset management, the State should consider other capacity building around financial and business enterprise concepts, including capital planning, budgeting and rate setting. Perhaps a “Phase 2” for utilities that have completed an asset management plan could involve taking integrating those AMPs into other business entity planning and implementation activities.
Assessment of Drinking Water Facilities and Service Areas January 2020
112
8. REFERENCES Delaware Source Water Protection Program. 2016. “Status of Source Water Protection Ordinances.”
http://delawaresourcewater.org/swstatus/. Figure dated November 2016 (Accessed August 16, 2019).
Kash Srinivasan Group. 2015. “Water Infrastructure Advisory Council Drinking Water Needs Assessment.” Prepared by the Kash Srinivasan Group for the State of Delaware. February 2015.
USEPA. 2019. “National Primary Drinking Water Regulations.” https://www.epa.gov/ground-water-and-drinking-water/national-primary-drinking-water-regulations. Accessed August 16, 2019.