29
Jasmin Kemper IEA Greenhouse Gas R&D Programme Cheltenham, UK BECCS Specialist Meeting 23 June 2016, London Status of biomass with carbon capture and storage (BECCS/Bio-CCS)

Jasmin Kemper IEA Greenhouse Gas R&D Programme
Cheltenham, UK
BECCS Specialist Meeting
23 June 2016, London
Status of biomass with carbon capture and storage
(BECCS/Bio-CCS)

Concept of Bio-CCS
Sanchez et al. 2014, courtesy of Nature

C balance of energy systems
IEAGHG/Ecofys 2011, adapted from ecofriendlymag.com; grey denotes carbon of fossil origin, blue denotes carbon of biogenic origin)
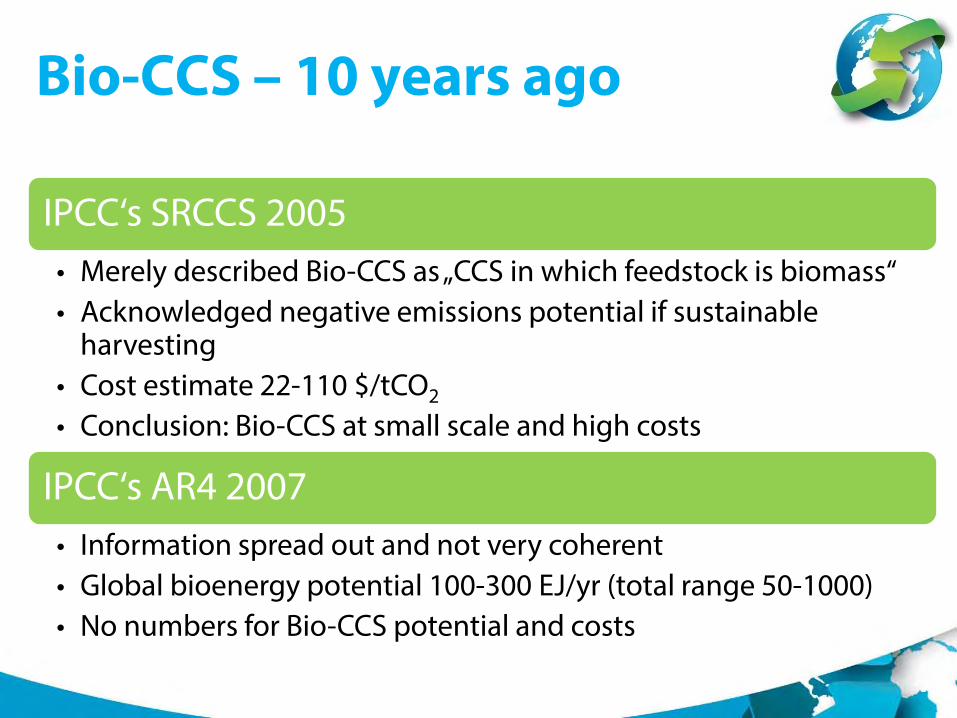
Bio-CCS – 10 years ago
IPCC‘s SRCCS 2005 • Merely described Bio-CCS as „CCS in which feedstock is biomass“ • Acknowledged negative emissions potential if sustainable
harvesting • Cost estimate 22-110 $/tCO2 • Conclusion: Bio-CCS at small scale and high costs
IPCC‘s AR4 2007 • Information spread out and not very coherent • Global bioenergy potential 100-300 EJ/yr (total range 50-1000) • No numbers for Bio-CCS potential and costs

Bio-CCS – 10 years ago
IEA Bioenergy (set up in 1978) • Biomass gasification • Liquid biofuels • Biomass co-firing • Biogas production and utilisation • Availability and sustainability of biomass
feedstocks
Only small number of small-scale Bio-CCS projects starting to come online: • Russel EOR project: first negative emissions delivery
at small scale (7.7 ktCO2) [completed 2005] • Arkalon: CO2 from EtOH plant for EOR, 0.1-0.3
MtCO2/yr [operating since 2009]
University of Kansas Center for Research, IEA Bioenergy
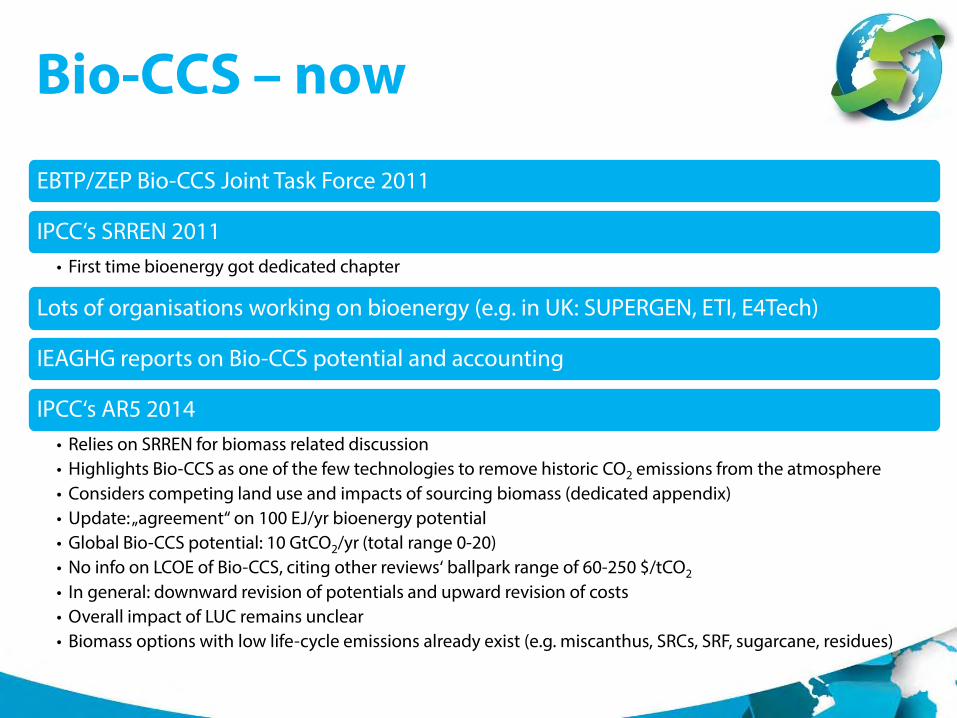
Bio-CCS – now
EBTP/ZEP Bio-CCS Joint Task Force 2011
IPCC‘s SRREN 2011 • First time bioenergy got dedicated chapter
Lots of organisations working on bioenergy (e.g. in UK: SUPERGEN, ETI, E4Tech)
IEAGHG reports on Bio-CCS potential and accounting
IPCC‘s AR5 2014 • Relies on SRREN for biomass related discussion • Highlights Bio-CCS as one of the few technologies to remove historic CO2 emissions from the atmosphere • Considers competing land use and impacts of sourcing biomass (dedicated appendix) • Update: „agreement“ on 100 EJ/yr bioenergy potential • Global Bio-CCS potential: 10 GtCO2/yr (total range 0-20) • No info on LCOE of Bio-CCS, citing other reviews‘ ballpark range of 60-250 $/tCO2 • In general: downward revision of potentials and upward revision of costs • Overall impact of LUC remains unclear • Biomass options with low life-cycle emissions already exist (e.g. miscanthus, SRCs, SRF, sugarcane, residues)

Bio-CCS – brief status summary
Many studies conclude: Bio-CCS, incl. its CCS
components, technically feasible as of today (TRL 3-
7) [except microalgal biomass]
Perceived „double benefit“: heat/power + negative
emissions
5 operating Bio-CCS projects 0.1-1 MtCO2/yr (all EtOH, 3 for EOR, 4 in US, 1 rather Bio-CCU), several
more underway
GHG accounting: only 2006 IPCC GLs, CDM/JI, Ca
LCFS and EU RED/FQD cover Bio-CCS
Plenty of research on public perception of CCS but very limited and contradictory on Bio-CCS • Bio-CCS generally has lower
profile than Fossil-CCS
Main drivers/barriers for Bio-CCS: • CO2/NG price,
infrastructure/clusters, sustainable feedstocks, public perception

Global Bio-CCS potential
Kemper 2015

Negative emissions potential for Bio-CCS
• TP up to 10 GtCO2eq/yr, significant cp. to IEA scenarios • EP up to 3.5 GtCO2eq/yr (~1/3 of TP) • IGCC, BIGCC and FT biodiesel most promising • CO2 price 50 €/t • Co-firing shares 30% in 2030, 50% in 2050 • Numbers not additive, assessment route-by-route
IEAGHG/Ecofys 2011

Negative emissions potential for biomethane routes
• TP up to 3.5 GtCO2eq/yr, smaller than previous routes • Significant potential only for gasification & AD (EC & AR) • EP up to 0.4 GtCO2eq/yr, only fraction of TP • Gasification & AD (MSW & S/M) most promising • Only economically viable at natural gas prices over 11 €/GJ
and CO2 prices of at least 20 €/t (except AD MSW & S/M @ 6.7 €/GJ)
EC & AR = energy crops & agricultural residues MSW = biogenic municipal solid waste S/M = animal manure / sewage sludge
IEAGHG/Ecofys 2013

Cost and TRL of Bio-CCS
McL
aren
201
2

Accounting frameworks Scheme CCS
Biomass growth/ harvesting/ combustion/
processing dLUC/iLUC Life cycle
emissions Negative emissions
2006 IPCC GLs
EU ETS
EU RED/FQD
US GHGRP
California ETS
California LCFS
Australia CPM#
UNFCCC KP’s CDM/JI
# Note that the Australian Senate repealed the CPM on 17th July 2014, taking effect from 1st July 2014. The repeal has no effect on entities’ reporting obligations under the NGER.
IEA
GH
G/C
arbo
n Co
unts
201
4

Bio-CCS public perception
dpa, biofuelwatch.org.uk, aero-news.net
Research on Bio-CCS public perception limited
Contradicting results Socio-cultural context of
stakeholders important

Overview Bio-CCS projects
Kemper 2015, with data from Karlsson and Byström 2011, DiPietro et al. 2012, GCCSI 2015a, 2015b; map by FreeVectorMaps.com

Illinois Industrial CCS Project • IBDP (Illinois Basin Decatur Project) CO2 source: ADM’s corn EtOH plant (350 Mgal/yr) Captured ~ 0.3 MtCO2/yr over more than 3 years
(total 1.0 MtCO2 achieved in Nov 2014) Stored in Mount Simon sandstone 3-year post-injection monitoring
• IL-ICCS (Illinois Industrial CCS Project) Will capture 1.0 MtCO2/yr over 3 years Expected to be operational in 2016 Draw level with Fossil-CCS demo scale Biggest hurdle: permits and regulations Credits off-set operational costs
McDonald 2016, Archer Daniels Midland, openclipart.org

OCAP • Rotterdam, NL • 0.1 MtCO2/yr from Abengoa ethanol plant • CO2 utilisation in nearby greenhouses • Operating since 2011 • Part of wider cluster development under RCI, which plans to store total of 2.5
MtCO2/yr in the North Sea, including a “Bio-CCS ready” power plant
Rot
terd
am C
limat
e In
itiat
ive
2011

Bio-CC(U)S: Waste-to-energy
Koornneef et al. 2016, AVR, Aker Solutions
ARV Duiven • Duiven, The Netherlands • Aim: capture 50,000 tCO2/yr • 70 MWth • 126 GWhe
• 54% biomass • Flue gas: 10% CO2 (dry) • Capture rate 78% • MEA solvent • CO2 used for horticulture
Klemetsrud Plant AS • Oslo, Norway • Aim: capture 300,000 tCO2/yr • 55 MWth • 175 GWhe / 10 MMe
• 50-60% biomass • Flue gas: 10% CO2
• Capture rate: 90%
• Aker Solutions’ amine process
• Pilot capturing 2,000 tCO2/yr

Case study: Bio-CCS in UK
• Bio-CCS essential for power sector
• Forest biomass from USA/CA will be key
• Uncertainty about Bio-CCS’ role in transport
• Excl. biomass/Bio-CCS, could cost the UK ~£44 billion (ETI 2015)
DfT, DECC and defra 2012, ETI 2015

Case study: Bio-CCS in UK
ETI 2015

Bio-CCS in nexus context
World Business Council on Sustainable Development 2014
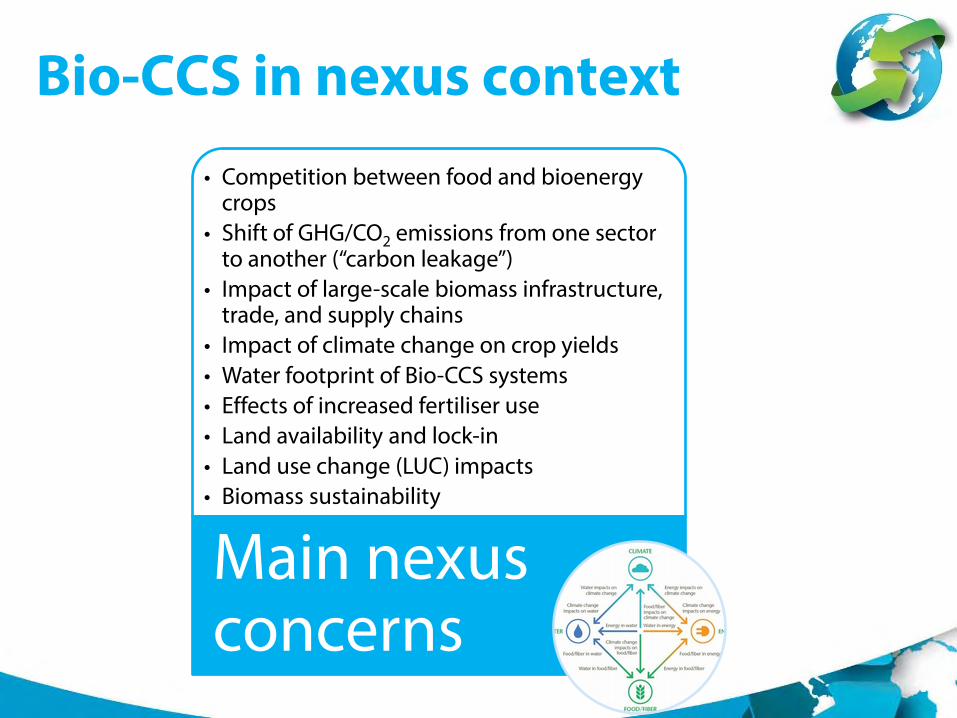
Bio-CCS in nexus context • Competition between food and bioenergy
crops • Shift of GHG/CO2 emissions from one sector
to another (“carbon leakage”) • Impact of large-scale biomass infrastructure,
trade, and supply chains • Impact of climate change on crop yields • Water footprint of Bio-CCS systems • Effects of increased fertiliser use • Land availability and lock-in • Land use change (LUC) impacts • Biomass sustainability
Main nexus concerns
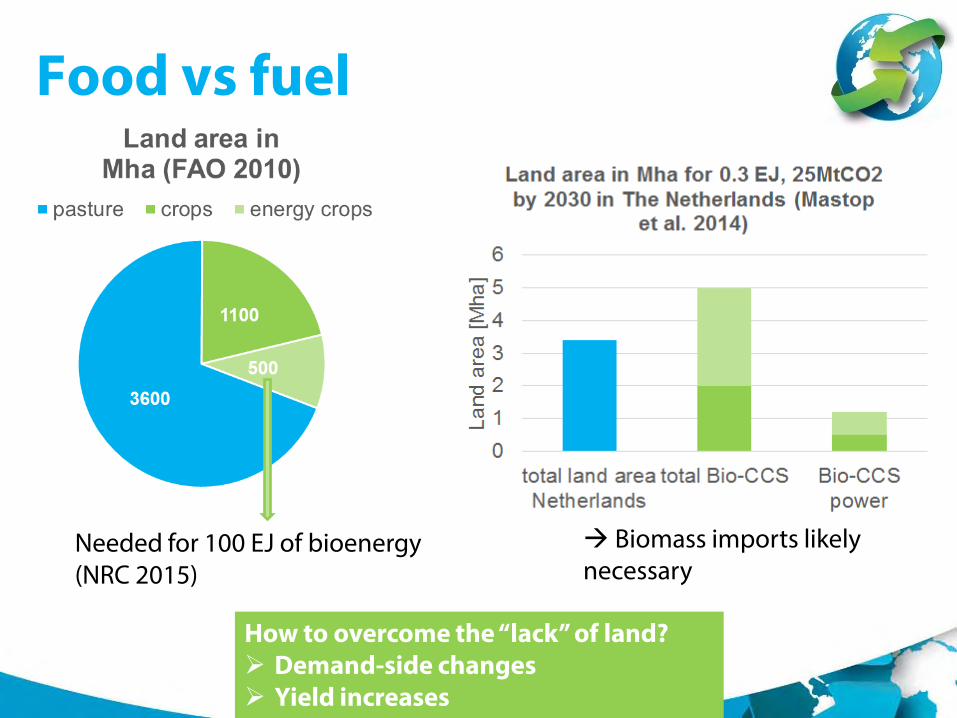
Food vs fuel
Needed for 100 EJ of bioenergy (NRC 2015)
Biomass imports likely necessary
How to overcome the “lack” of land? Demand-side changes Yield increases

Demand-side
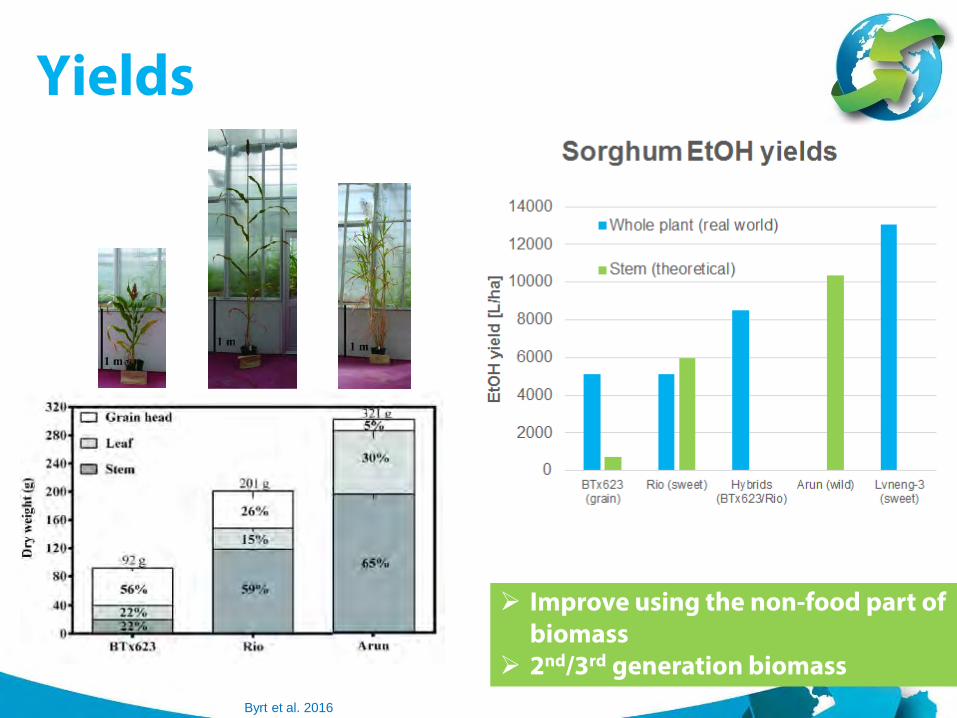
Yields
Improve using the non-food part of biomass
2nd/3rd generation biomass Byrt et al. 2016

Bio-CCS – research needs • More research on some gasification technologies
necessary • Verification for high amounts of co-firing >30% re
pre-treatment and boiler modifications • Bio-CCS scale-up issues • Overcome uncertainty and lack of standard
methodology for estimating bioenergy potentials and costs
• Inclusion of NETs/Bio-CCS in more policies and accounting frameworks
• Clarify circumstances of double benefit (zero-carbon energy + negative emissions permits)
• Approaches to prevent carbon leakage • Open question/debate: Does Bio-CCS need more
support than other NETs/Fossil-CCS? • Need to explore other financial instruments than
the CDM • More research on impacts of Bio-CCS on global
trade and commodity markets
Karen Roach
• Address the whole food-water-energy-climate nexus of Bio-CCS, integrated approaches
• Water and carbon intensity of Bio-CCS systems • Address LUC issues, esp. iLUC (incl.
measurement/quantification) and carbon debts • Opportunities to free land for bioenergy
production • Monitoring systems for land management
activities need improvement • Investigating competition for land, feedstock
and storage resources • Supply chain optimisation for non-forest biomass • Identify more “sweet spots” for Bio-CCS • Clarification of Bio-CCS public perception and
impact of CCS perception on Bio-CCS, public outreach efforts, building up trust

Conclusions Ability of Bio-CCS to deliver negative emissions important to achieve climate mitigation targets
Majority of research suggests bioenergy potential of ~100 EJ/yr and Bio-CCS potential of ~10 GtCO2/yr
Costs of Bio-CCS comparable to Fossil-CCS, in the region of 60 – 250 $/tCO2
Several projects underway but lots more needed to build up confidence
Policy, regulations and financial instruments for Bio-CCS need development
Bio-CCS deployment will hinge on case-specific details, with sustainable biomass supply likely to be the linchpin
Nexus-approach required due to complex sustainability issues

Bio-CCS – good or bad thing?
silverbulletbullion.com, 123rf.com
My main conclusions: Will be very case-specific Bio-CCS no silver bullet or complimentary
ticket but deserves our fullest attention as we are running out of time and options

LAUSANNE, SWITZERLAND, NOVEMBER 14-18, 2016
www.ghgt.info
Technical programme online Early bird registration closes 13 July 2016 BECCS@GHGT-13: Wed 16 Nov, 09:10-10:50, Session 4E “Negative Emissions I” Fri 18 Nov, 11:20-13:00, Sessions 11D “Negative Emissions II”

Thank you, any questions?
• www.ieaghg.org
• www.linkedin.com/groups/IEAGHG-4841998
• https://twitter.com/IEAGHG
• www.facebook.com/pages/IEA-Greenhouse-Gas- RD-Programme/112541615461568?ref=hl
Contact me at: [email protected]
Website: LinkedIn: Twitter: Facebook:
iconshut.com


![Bio-energy with carbon capture and storage (BECCS ... et al. Fuel... · 66 Coal blending to meet power plant requirements is conventional practice 67 [29, 30, 31]. ... 107 tain biomass](https://static.documents.pub/doc/80x56/5f7bc17d51116a2e2e3fbbf7/bio-energy-with-carbon-capture-and-storage-beccs-et-al-fuel-66-coal-blending.jpg)


