142
2016 Status of the Geoscience Workforce Carolyn Wilson This PDF is licensed for individual use ([email protected])
2016
Status of the Geoscience Workforce
Carolyn WilsonT
his
PD
F is
lice
nsed
for
indi
vidu
al u
se (
jbar
one@
mon
roec
c.ed
u)

Thi
s P
DF
is li
cens
ed fo
r in
divi
dual
use
(jb
aron
e@m
onro
ecc.
edu)
Status of the Geoscience Workforce 2016Carolyn Wilson
ISBN-13: 978-0-913312-54-4
Published and printed in the United States of America. All rights reserved. No part of this work may be reproduced or transmitted in any form or by any means, electronic or mechanical, recording, or any information storage and retrieval system without the expressed written consent of the publisher.
Typeset in Minion Pro and Myriad Pro using Adobe InDesign CC Graphs by Carolyn Wilson, AGI Design and Layout by Brenna Tobler, AGI
For more information on the American Geosciences Institute and its publications, check us out at http://www.americangeosciences.org/pubs.
© 2016 American Geosciences Institute.
Front cover: University of Alaska, Anchorage Master’s student surveying the tidal flats in Turnagain Arm, Alaska during his USGS internship. Photo submitted by Rob Witter, U.S. Geological Survey to AGI’s 2015 Life in the Field photo contest.
Back cover photo submitted by Dan Scott to AGI’s 2015 Life in the Field photo contest.
If you have any questions or comments related to this report, please contact:
Carolyn Wilson Geoscience Workforce Data Analyst American Geosciences Institute 4220 King Street Alexandria, VA 22302 http://www.americangeosciences.org Email: [email protected] Phone: (703) 379-2480 ext. 632
iStatus of the Geoscience Workforce 2016
Thi
s P
DF
is li
cens
ed fo
r in
divi
dual
use
(jb
aron
e@m
onro
ecc.
edu)
Introduction
The “Status of the Geoscience Workforce” report provides a comprehensive benchmark of the geo-science profession. This report is based on original
data collected by the American Geosciences Institute and existing data from federal sources, industry sources, and professional membership organizations. This report synthesizes all the recent, readily available and reliable data related to the geosciences from the education and training of new geoscientists, to the employment trends in the geoscience workforce, to the federal funding trends for the geosciences and economic trends of the major geo-science industries. The report is broken into 5 chapters:
Chapter 1: Trends in K-12 Geoscience Education — Preparing Students for College Geoscience Programs and Society
Chapter 2: Trends in Two-Year College Geoscience Programs
Chapter 3: Trends in Geoscience Education at Four-Year Institutions
Chapter 4: Geoscience Employment Sectors — Trends in Student Transitions and Workforce Dynamics
Chapter 5: Economic Metrics and Drivers of the Geoscience Workforce
Some highlights of this report include:
• 16% of doctoral graduates, 23% of master’s graduates, and 33% of bachelor’s graduates had transferred from a two-year college during their education, which is an increase across all degree levels since 2013. The growth in participation at two-year colleges continues to high-light the importance of collaborations between two-year colleges and four-year institutions to help with the transition of these students into bachelor’s programs.
• Field camps may have reached capacity. In 2014, atten-dance reached its peak at 3,237 students and decreased in 2015 to 2,867. The availability of field camps must be taken into consideration if employers are expecting students to have this skills development experience.
• 64% of bachelor’s graduates, 41% of master’s graduates, and 57% of doctoral graduates did not participate in an internship. However, these experiences are seen by employers as essential for career preparation and professional skills development. Those graduates that did participate in internship experiences recognized the importance of these experiences for their profes-sional and academic development.
• With very little change in the enrollments in master’s and doctoral geoscience programs, it appears these programs have reached capacity. Students seem to have recognized the competitiveness for graduate slots in the geosciences as fewer bachelor’s and master’s graduates indicated plans to immediately enroll in a graduate program.
• While there has been a downturn in the oil and gas industry starting at the end of 2014, the oil and gas industry was still hiring geoscience graduates, par-ticularly with master’s degrees. However, for bachelor’s graduates, the environmental industry appears to be a viable job option at graduation with 40% of bachelor’s graduates finding a job within this industry in 2015. Other industries, such as the nonprofit sector, have been hiring recent graduates at a higher rate than seen previously.
• While the full salary ranges for each degree level can be wide depending on the job, typically bachelor’s gradu-ates have starting salaries between $30,000-$50,000; master’s graduates have starting salaries either between $40,000-$60,000 or between $100,000-$120,000; and doctoral graduates typically have starting salaries between $50,000-$70,000. Every graduate making more than $90,000 was working in the oil and gas industry.
• Median salaries for geoscientists continue to increase in all major industries. In a shift from the 2014 report, engineering managers, instead of petroleum engineers, have the highest median salary of $132,800; petroleum engineers have a median annual salary of $129,990; geoscientists have a median annual salary of $89,700; mining and geological engineers have a median annual salary of over $94,040; and hydrologists have a median annual salary of nearly $79,550.
• There were approximately 324,000 geoscientists employed in the United States in 2014. Over the next decade, 48% of the workforce will be at or near retire-ment. However, while there will still be a predicted shortage of around 90,000 geoscientists, this shortage continues to decrease from prior estimates because of an increase in worker productivity and the surge of new students entering the job market over the last decade.
ii Status of the Geoscience Workforce 2016
Thi
s P
DF
is li
cens
ed fo
r in
divi
dual
use
(jb
aron
e@m
onro
ecc.
edu)
Acknowledgements
I would like to thank the AGI Foundation for funding the AGI Workforce Program and for their support for this report.
I also want to thank the people and organizations that allowed my use of their data for this report, including: Ann Benbow and Ed Robeck for the K-12 earth science education data; Dr. Penelope Morton for the field camp attendance data; Dr. Heather Macdonald for her list of two-year colleges with geoscience programs; the National Mining Association for the data on mining employment demographics; the American Association of Petroleum Geologists, the National Ground Water Association, the Society of Economic Geologists, and the Society of Exploration Geophysicists for their membership data; The National Science Foundation’s center for Science and Engineering Statistics for granting access to some of their restricted-use data files; and GeoRef Information Services for data on publications, theses, and dissertations.
I want to acknowledge the multiple organizations and agencies that freely provide their data and information online, including: the American Geophysical Union, the American Meteorological Society, the Association for the Sciences of Limnology and Oceanography, ACT, Baker Hughes, the College Board, the Energy Information Administration, the National Association of Geoscience Teachers, the National Science Foundation’s National Center for Science and Engineering Statistics, the National Science Foundation award database, the U.S. Bureau of Economic Analysis, the U.S. Census Bureau, the U.S. Bureau of labor Statistics, the U.S. Department of Education’s Integrated Postsecondary Education Database, the U.S. Department of Education’s National Center of Education Statistics, the U.S. Geological Survey, the U.S. Office of Personnel Management, and the World Gold Council.
I want to give recognition to the AGI Workforce Program data interns over the past few years, Sebastian Corrochano and Jordan Ellington, for their hard work quality con-trolling the Directory of Geoscience Departments data-base and the raw data from AGI’s Geoscience Student Exit Survey.
Contents1 Chapter 1: Trends in K–12 Geoscience
Education — Preparing Students for College Geoscience Programs and Society
2 Earth Science Education6 Teachers8 Students
17 Chapter 2: Trends in Two-Year College Geoscience Programs
18 National Benchmarks21 Two-Year Enrollments23 Geoscience Departments and Faculty26 Geoscience Students28 Geoscience Associate’s Degrees
31 Chapter 3: Trends in Four-Year Institution Geoscience Programs
33 Geoscience Departments35 Geoscience Faculty42 Geoscience University Students53 Co-Curricular Activities62 Student Plans for Graduate School64 Funding of the Geosciences at the University
Level76 Funding of Geoscience Students
79 Chapter 4: Trends in Geoscience Employment — Examining Student Transitions and Workforce Dynamics
80 Early Career Workforce86 Salary Trends for Geoscience Occupations88 Demographics of the Geoscience Profession93 Workforce Age Demographics
102 Geoscience Employment Projections 2014–2024
111 Chapter 5: Trends in Economic Metrics and Drivers of the Geoscience Workforce
112 Federal Research Funding for the Geosciences115 Commodity Prices and Output117 Gross Domestic Product Contribution of
Geosciences118 Productive Activity of Geoscience Industries
123 Appendix A: Defining the Geosciences124 Educational Classifications126 Occupational Classifications129 Industry Classifications130 AGI’s Working Definition of Geoscience
Occupations
131 Appendix B: Data Sources131 AGI Data Sources:131 Other Public Sources:
iiiStatus of the Geoscience Workforce 2016
|| Status of the Geoscience Workforce 2016• CONTENTS
Thi
s P
DF
is li
cens
ed fo
r in
divi
dual
use
(jb
aron
e@m
onro
ecc.
edu)
Tables1 Chapter 1: Trends in K–12 Geoscience
Education — Preparing Students for College Geoscience Programs and Society
3 Table 1.1: Changes in State-Level Earth Science Requirements for Graduation
4 Table 1.2: States Counting Earth Science Courses Towards Graduation Requirements
17 Chapter 2: Trends in Two-Year College Geoscience Programs
24 Table 2.1: Percentage of Two-Year Colleges with Geoscience Programs for Selected States
31 Chapter 3: Trends in Four-Year Institution Geoscience Programs
34 Table 3.1: Universities with the Highest Student per Faculty Member Ratios, 2015
34 Table 3.2: Percentage of All U.S. Geoscience Undergraduate Students Enrolled in 2014-2015
34 Table 3.3: Percentage of All U.S. Geoscience Graduate Students Enrolled in 2014-2015
36 Table 3.4: Top Ten Degree Granting Institutions of U.S. Geoscience Tenure-Track or Tenured Faculty, 2015
38 Table 3.5: Top Five Geoscience Publication Topics, 1970-2013
40 Table 3.6: Research and Teaching Specialties of Geoscience Faculty, 2015
41 Table 3.7: Top Geoscience Specialities with the Most Change in Faculty Since 2013
56 Table 3.8: U.S. Universities Hosting Geoscience Field Camps, 2015
60 Table 3.9: Top Five Geoscience Master’s Theses Topics
61 Table 3.10: Top Five Geoscience Doctoral Dissertation Topics
70 Table 3.11: Top 10 Universities Receiving NSF Atmospheric and Geospace Science (AGS) Awards Annually, 2006-2015 (Millions $USD)
71 Table 3.12: Top 10 Universities Receiving NSF Earth Science (EAR) Awards Annually, 2006-2015 (Millions $USD)
72 Table 3.13: Top 10 Universities Receiving NSF Ocean Sciences (OCE) Awards Annually, 2006-2015 (Millions $USD)
78 Table 3.14: Top 10 Baccalaureate Institutions Attended by NSF Geoscience Graduate Fellows (2007-2016)
78 Table 3.15: Top 10 Graduate Institutions Attended by NSF Geoscience Graduate Fellows (2007-2016)
79 Chapter 4: Trends in Geoscience Employment — Examining Student Transitions and Workforce Dynamics
104 Table 4.1: U.S. Bureau of Labor Statistics Current and Projected Geoscience Employment
111 Chapter 5: Trends in Economic Metrics and Drivers of the Geoscience Workforce
123 Appendix A: Defining the Geosciences
124 Appendix Table 1: CIP Codes that Refer to Geoscience Programs
126 Appendix Table 2: Geoscientists are Found within the Following SOC Codes
128 Appendix Table 3: Geoscientists are Found within the Following OPM Handbook Codes
129 Appendix Table 4: All Occupations Fall Within the Following NAICS Codes
iv Status of the Geoscience Workforce 2016
|| Status of the Geoscience Workforce 2016• TABLES
Thi
s P
DF
is li
cens
ed fo
r in
divi
dual
use
(jb
aron
e@m
onro
ecc.
edu)
Figures1 Chapter 1: Trends in K–12 Geoscience
Education — Preparing Students for College Geoscience Programs and Society
2 Figure 1.1: Earth Science Education Graduation Requirements in High School
5 Figure 1.2: States that Assess Earth and Space Science Concepts in Middle and High School
6 Figure 1.3: Degree Fields of Elementary School Teachers, 2013
7 Figure 1.4: Degree Fields of STEM Secondary Teachers, 2013
8 Figure 1.5: Selected Math Courses Taken by U.S. High School Graduates
9 Figure 1.6: Selected Math Courses Taken by Gender of U.S. High School Graduates, 2009
9 Figure 1.7: Selected Math Courses Taken by Race and Ethnicity of U.S. High School Graduates, 2009
10 Figure 1.8: Science Courses Taken by U.S. High School Graduates
10 Figure 1.9: Science Courses Taken by Gender of U.S. High School Graduates, 2009
11 Figure 1.10: Science Courses Taken by Race and Ethnicity of U.S. High School Graduates, 2009
11 Figure 1.11: Number of Students Taking AP Courses in Science and Math, 2006-2015
12 Figure 1.12: Advanced Placement Courses Taken by Gender of U.S. High School Graduates, 2009
12 Figure 1.13: Advanced Placement Courses Taken by Race and Ethnicity of U.S. High School Students, 2009
13 Figure 1.14: SAT Test-Takers with Coursework or Experience in Selected Sciences
13 Figure 1.15: Mean Math SAT Scores for Test-Takers with Coursework in Science
14 Figure 1.16: Mean Critical Reading SAT Scores for Test-Takers with Coursework in Science
14 Figure 1.17: Mean Writing SAT Scores for Test-Takers with Coursework in Science
15 Figure 1.18: Intended Degree Level of College-Bound High School Seniors that took the SAT
15 Figure 1.19: SAT Test-Takers Intending College Degrees in Physical Sciences or Interdisciplinary Studies
16 Figure 1.20: High School Students Meeting ACT College Readiness Benchmarks
16 Figure 1.21: Geoscience Postsecondary Graduates Who Took an Earth Science Course in High School
17 Chapter 2: Trends in Two-Year College Geoscience Programs
18 Figure 2.1: Race/Ethnicity of U.S. College-Age Population, 2014-2060
19 Figure 2.2: Degrees Granted from U.S. Postsecondary Institutions
19 Figure 2.3: Percentage of Degrees Granted to Women by Degree Level, All Majors
20 Figure 2.4: Percentage of Associate’s Degrees Awarded to Underrepresented Minorities, All Degree Fields
21 Figure 2.5: Fall Enrollments at U.S. Two-Year Colleges
22 Figure 2.6: Participation of Women in Two-Year Colleges
22 Figure 2.7: Underrepresented Minority Enrollments at Two-Year Colleges
23 Figure 2.8: Number of Geoscience Departments/Programs at Two-Year Colleges by State
24 Figure 2.9: Number of Faculty per Geoscience Department/Program at Two-Year Colleges
25 Figure 2.10: Age Demographics of Two-Year College Geoscience Faculty
25 Figure 2.11: Percentage of Two-Year Geoscience Faculty Positions Held by Women
26 Figure 2.12: Four-Year University Graduates by Degree Field Who Attended a Two-Year College, 2013
27 Figure 2.13: Geoscience Graduates with at Least One Semester at a Two-Year College, 2015
28 Figure 2.14: Geoscience Associate’s Degrees Awarded Annually
29 Figure 2.15: Percentage of Associate’s Degrees Awarded to Women by Discipline
29 Figure 2.16: Percentage of Associate’s Degrees Awarded to Underrepresented Minorities by Discipline
vStatus of the Geoscience Workforce 2016
|| Status of the Geoscience Workforce 2016• FIGURES
Thi
s P
DF
is li
cens
ed fo
r in
divi
dual
use
(jb
aron
e@m
onro
ecc.
edu)
31 Chapter 3: Trends in Four-Year Institution Geoscience Programs
33 Figure 3.1: Number of Geoscience Departments by State
36 Figure 3.2: Percentage of Geoscience Faculty by Rank at Four-Year Institutions, 2015
37 Figure 3.3: Number of Geoscience Faculty by Age Group and Rank, 2015
37 Figure 3.4: Percentage of Female Geoscience Faculty by Rank
38 Figure 3.5: Trends in Geoscience Publications
39 Figure 3.6: Publication Trends in Selected Geoscience Journals
39 Figure 3.7: Trends in Geoscience Faculty Specialities (1999-2015)
44 Figure 3.8: Fall Enrollments at Four-Year Institutions
44 Figure 3.9: Participation of Women in Four-Year Institutions
45 Figure 3.10: Underrepresented Minority Enrollments at Four-Year Institutions
45 Figure 3.11: Geoscience Enrollments at U.S. Four-Year Institutions, 1955-2015
46 Figure 3.12: Geoscience Degrees Awarded at U.S. Four-Year Institutions, 1973-2015
46 Figure 3.13: Participation of Women in Geoscience Programs
47 Figure 3.14: Percentage of Science and Engineering Degrees Awarded to Underrepresented Minorities, 2013
47 Figure 3.15: Percentage of Geoscience Bachelor’s Degrees Awarded to Underrepresented Minorities
48 Figure 3.16: Percentage of Geoscience Master’s Degrees Awarded to Underrepresented Minorities
48 Figure 3.17: Percentage of Geoscience Doctoral Degrees Awarded to Underrepresented Minorities
49 Figure 3.18: Race and Ethnicity of Geoscience Graduates, 2015
49 Figure 3.19: Citizenship of Geoscience Graduates, 2015
50 Figure 3.20: Highest Level of Education of Parents of Geoscience Graduates, 2015
50 Figure 3.21: Quantitative Skills and Knowledge Gained by Geoscience Graduates, 2015
51 Figure 3.22: Supplemental Science Courses Taken by Geoscience Graduates, 2015
51 Figure 3.23: The Point in Time When Geoscience Graduates Decided to Major in the Geosciences, 2015
52 Figure 3.24: The Chosen Degree Fields of Geoscience Graduates, 2015
54 Figure 3.25: Field Camp Attendance, 1998-2015
54 Figure 3.26: Geoscience Graduates that Have Participated in a Field Camp, 2015
55 Figure 3.27: Locations of Geoscience Field Camps by State, 2015
57 Figure 3.28: Geoscience Graduates with One or More Field Experiences, 2015
57 Figure 3.29: Geoscience Graduates that Have Taken One or More Field Courses, 2015
58 Figure 3.30: Geoscience Graduates with One or More Research Experiences, 2015
58 Figure 3.31: Research Methods Utilized by Geoscience Graduates for Their Individual Research Projects, 2015
59 Figure 3.32: Trends in Geoscience Master’s Thesis Topics
60 Figure 3.33: Trends in Geoscience Doctoral Dissertation Topics
61 Figure 3.34: Number of Internships Held by Geoscience Graduates, 2015
62 Figure 3.35: Geoscience Students Planning to Attend Graduate School Immediately After Graduation, 2015
63 Figure 3.36: Geoscience Undergraduate Students Planning to Pursue a Graduate Degree, 2015
63 Figure 3.37: Geoscience Graduate Students Planning to Pursue Another Graduate Degree, 2015
64 Figure 3.38: Percentage of Total Federal Research Funding Applied to the Geosciences
65 Figure 3.39: Percentage of University Geoscience Research Funding per Subdiscipline from Selected Federal Agencies
65 Figure 3.40: Average Annual University Geoscience Research Funding by the Department of Agriculture
66 Figure 3.41: Average Annual Geoscience Research Funding by the Department of Defense
vi Status of the Geoscience Workforce 2016
|| Status of the Geoscience Workforce 2016• FIGURES
Thi
s P
DF
is li
cens
ed fo
r in
divi
dual
use
(jb
aron
e@m
onro
ecc.
edu)
66 Figure 3.42: Average Annual University Geoscience Research Funding by the Department of Energy
67 Figure 3.43: Average Annual University Geoscience Research Funding by NASA
67 Figure 3.44: Average Annual University Geoscience Research Funding by NSF
68 Figure 3.45: Funding of Geoscience Proposals at NSF
68 Figure 3.46: Funding Rates of Geoscience Proposals at NSF by GEO Division
69 Figure 3.47: Median Annual Size of Geoscience Awards at NSF by GEO Division
73 Figure 3.48: Trends in NSF Atmospheric and Geospace Science Funding Rates by Subject
73 Figure 3.49: Trends in NSF Atmospheric and Geoscience Sciences Award Size by Subject
74 Figure 3.50: Trends in NSF Earth Sciences Funding Rates by Subject
74 Figure 3.51: Trends in NSF Earth Sciences Award Size by Subject
75 Figure 3.52: Trends in NSF Ocean Sciences Funding Rates by Subject
75 Figure 3.53: Trends in NSF Ocean Sciences Award Size by Subject
76 Figure 3.54: Types of Financial Aid Used by Geoscience Graduates While Working Towards Their Degree, 2015
77 Figure 3.55: Number of NSF Graduate Fellowships Awarded, 2007-2016
77 Figure 3.56: Total Funding of Geoscience NSF Graduate Fellowships
78 Figure 3.57: NSF Geoscience Graduate Fellowships by Field of Study, 2007-2016
79 Chapter 4: Trends in Geoscience Employment — Examining Student Transitions and Workforce Dynamics
80 Figure 4.1: Geoscience Graduates Seeking or Have Accepted a Position within the Geosciences, 2015
81 Figure 4.2: Industries Hiring Geoscience Graduates, 2015
82 Figure 4.3: Industries of Interest for Graduating Students Seeking a Job within the Geosciences, 2015
82 Figure 4.4: Starting Salaries for Employed Geoscience Graduates, 2015
83 Figure 4.5: Additional Compensation Granted to Geoscience Graduates with a Geoscience Job, 2015
83 Figure 4.6: Other Job Opportunities Granted to Employed Geoscience Graduates, 2015
84 Figure 4.7: Useful Resources Used by Geoscience Students to Find a Job, 2015
85 Figure 4.8: Industries of Geoscience Graduates’ First Jobs by Degree Field (2013-2015)
86 Figure 4.9: Median Annuals Salaries of Geoscience Occupations (2005-2015)
87 Figure 4.10: Median Annual Salaries of Geoscience Occupations, 2015
88 Figure 4.11: Total Number of Employed Geoscientists in the United States
89 Figure 4.12: Number of Geoscience Jobs by Industry Sector in 2014
89 Figure 4.13: Current Employment for Detailed Geoscience Occupations (2008-2014)
90 Figure 4.14: Percentage of Women in Environmental Science and Geoscience Occupations
90 Figure 4.15: Percentage of Women in Geoscience and Other Science and Engineering Occupations, 2013
91 Figure 4.16: Percentage of Women in Detailed Geoscience Occupations, 2013
91 Figure 4.17: Percentage of Underrepresented Minorities in Environmental Science and Geoscience Occupations
92 Figure 4.18: Percentage of Underrepresented Minorities in Geoscience and Other Science and Engineering Occupations, 2013
92 Figure 4.19: Percentage of Underrepresented Minorities in Detailed Geoscience Occupations, 2013
94 Figure 4.20: Geoscience Age Distribution by Member Society
94 Figure 4.21: Geoscience Age Distribution by Membership Society without Student Memberships
95 Figure 4.22: Age Distribution of Geoscientists in the U.S. Government
95 Figure 4.23: Age Distribution of Environmental Engineers in the U.S. Government
96 Figure 4.24: Age Distribution of Mining Engineers in the U.S. Government
viiStatus of the Geoscience Workforce 2016
|| Status of the Geoscience Workforce 2016• FIGURES
Thi
s P
DF
is li
cens
ed fo
r in
divi
dual
use
(jb
aron
e@m
onro
ecc.
edu)

96 Figure 4.25: Age Distribution of Geophysicists in the U.S. Government
97 Figure 4.26: Age Distribution of Hydrologists in the U.S. Government
97 Figure 4.27: Age Distribution of Meteorologists in the U.S. Government
98 Figure 4.28: Age Distribution of Geologists in the U.S. Government
98 Figure 4.29: Age Distribution of Oceanographers in the U.S. Government
99 Figure 4.30: Age Distribution of Geoscientists in the U.S. Geological Survey
99 Figure 4.31: Oil and Gas Industry Supply and Demand for Geoscientists
100 Figure 4.32: Age Distribution of Geoscientists in Mining, 2014
100 Figure 4.33: Age Distribution of Geoscientists in Support Activities for Mining and Oil & Gas, 2014
101 Figure 4.34: Trends in Faculty Rank Distribution at Four-Year Institutions (1980-2015)
101 Figure 4.35: Age Distribution of Geoscience Faculty Members
102 Figure 4.36: Employment Projection for Geoscience Occupations (2014-2024)
103 Figure 4.37: Employment Projections for All Geoscience Occupations by Industry Sector (2014-2024)
103 Figure 4.38: Employment Projections for Detailed Geoscience Occupations (2014-2024)
111 Chapter 5: Trends in Economic Metrics and Drivers of the Geoscience Workforce
112 Figure 5.1: Percentage of Federal Research Funding Applied to the Geosciences
113 Figure 5.2: Total Federal Research Funding of the Geosciences
113 Figure 5.3: Federal Funding of Basic Research in the Geosciences
114 Figure 5.4: Federal Funding of Applied Research in the Geosciences
115 Figure 5.5: Price of Oil by Currency and by Gold
116 Figure 5.6: Commodity Output for the U.S. Mining, Oil and Gas Extraction, and Support Industries
116 Figure 5.7: Gross Operating Surplus for the U.S. Mining, Oil and Gas Extraction, and Support Industries
117 Figure 5.8: Amount of Geoscience Industry GDP Contributed by Specific Industries
118 Figure 5.9: Average Rotary Rig Counts by World Region
119 Figure 5.10: U.S. Rotary Rig Counts
119 Figure 5.11: U.S. Rotary Rigs by Location
120 Figure 5.12: U.S. Rigs by Type
120 Figure 5.13: Average Depth of Wells Drilled by Type
121 Figure 5.14: Number of U.S. Mines
121 Figure 5.15: Material Handled at U.S. Mines
122 Figure 5.16: Value of Non-Fuel Mineral Production from U.S. Mines
viii Status of the Geoscience Workforce 2016
|| Status of the Geoscience Workforce 2016• FIGURES
Thi
s P
DF
is li
cens
ed fo
r in
divi
dual
use
(jb
aron
e@m
onro
ecc.
edu)
Chapter 1: Trends in K–12 Geoscience Education — Preparing Students for College Geoscience Programs and Society
Earth Science education is becoming more pervasive in middle school and high school curriculums across the U.S. because of an increased awareness
of the importance of earth science and environmental science to a functioning society.1 Nearly every state in the United States allows for earth science courses to count as a science credit for graduation and assesses students’ knowledge of earth science concepts during middle school and high school. The College Board recognizes Earth Science as an essential domain for college readi-ness in science.2 A majority of colleges also accept Earth Science courses as a creditable science course with over 77% accepting these courses for student admission into their programs.3
However, the earth sciences still have the fewest trained teachers at the elementary and secondary levels than other sciences. In fact, in elementary schools the majority of teachers providing computer, math and science education have degrees in the social or related sciences and non-science and engineering related fields, instead of a science or engineering field. In secondary schools, approximately half of computer, math, and science teachers have degrees in science and engineering related fields, such as health fields, and non-science and engineering related fields, such as humanities fields, instead of holding a degree in a science or engineering field.
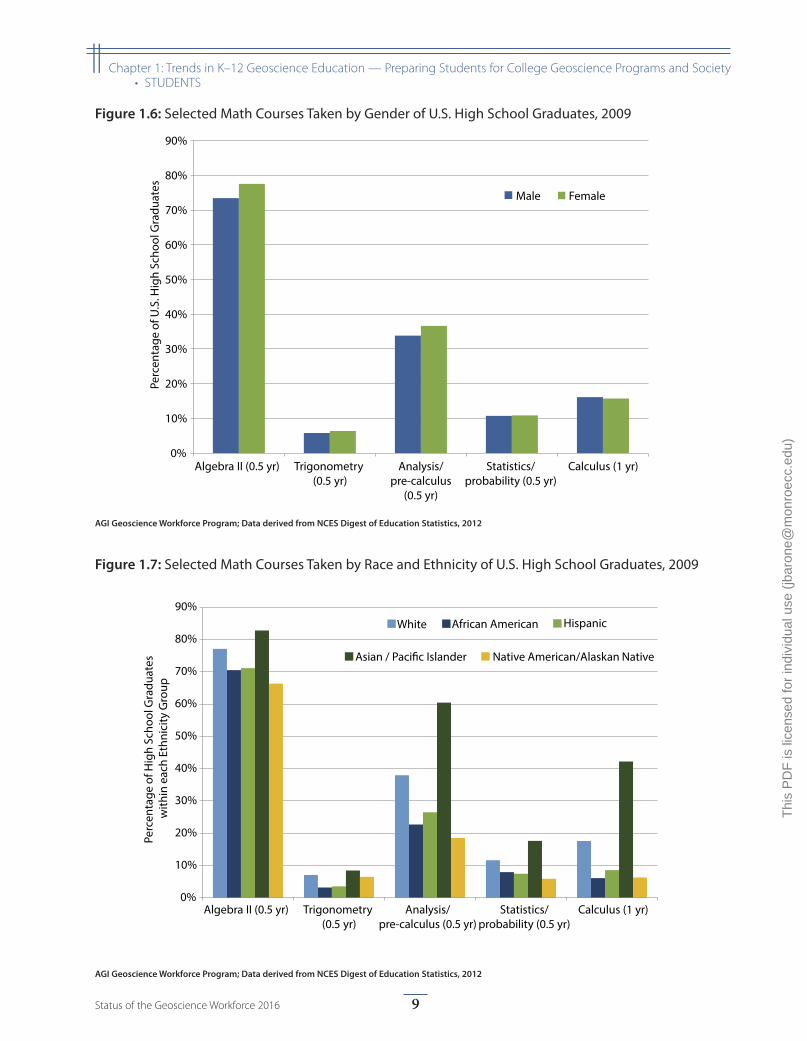
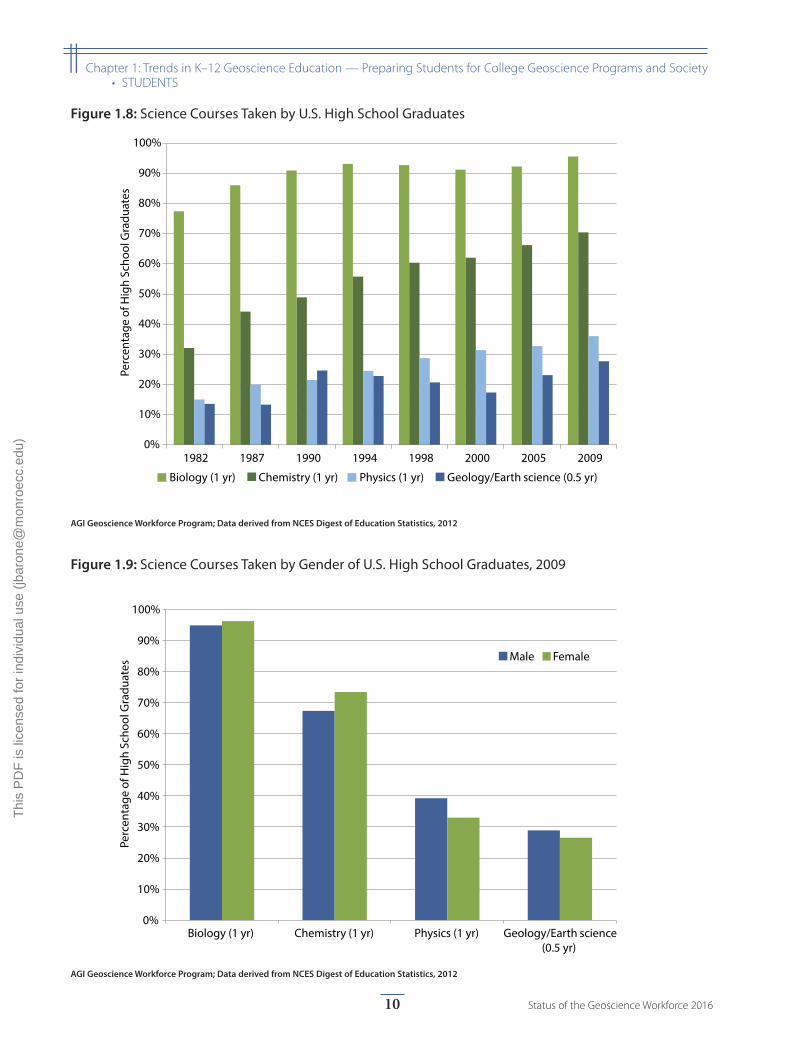
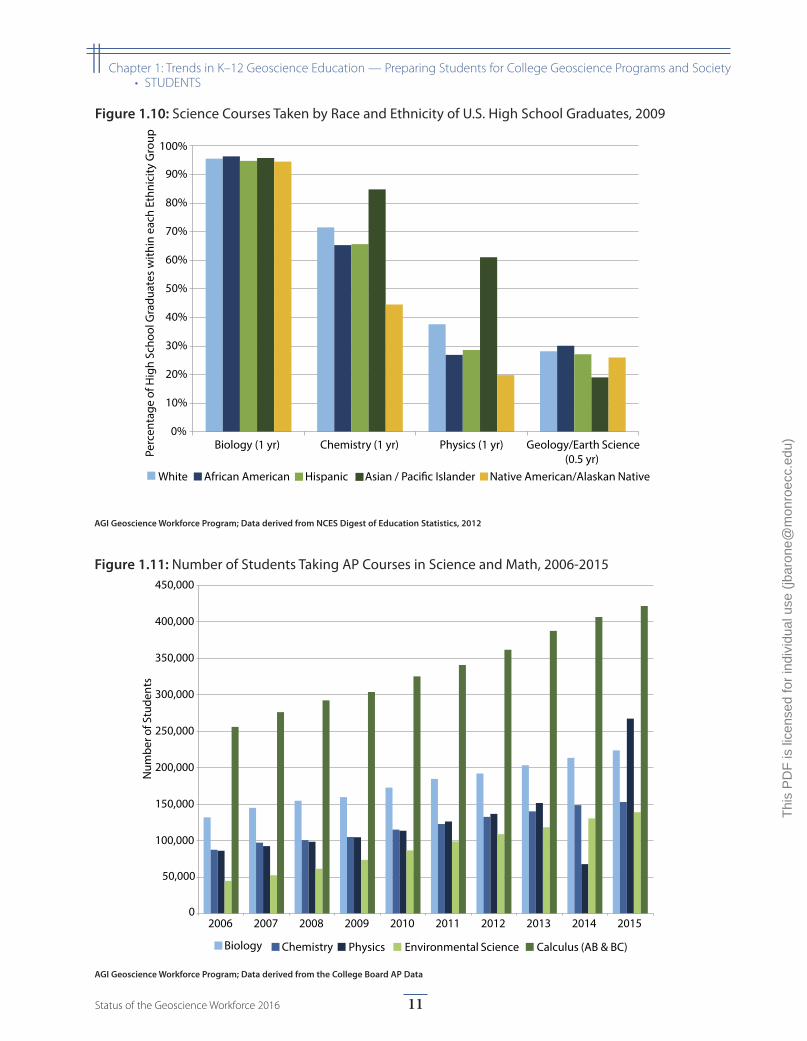
College readiness among students is often indicated through course selection of higher level math and science courses, such as Advanced Placement (AP) course selec-tion, and SAT test scores. There continues to be growth in the percentages of high school graduates taking higher level math courses with 75% completing Algebra II, 35% completing Pre-Calculus, and 16% completing Calculus in 2009. There is similar growth among high school gradu-ates taking science courses, with 96% completing Biology, 70% completing Chemistry, 36% completing Physics, and 28% completing Geology/Earth Science in 2009. Science and Calculus Advanced Placement courses show similar growth over time.
1 National Research Council, Board on Science Education. (2012) A Framework for K-12 Science Education: Practices, Crosscutting Concepts, and Core Ideas. Retrieved from http://www.nap.edu/catalog.php?record_id=13165#
2 College Board. (2010) Science College Board Standards for College Success. Retrieved from http://media.collegeboard.com/digitalServices/pdf/research/Science_College_Board_Standards_for_College_Success_SCAS.pdf
3 Center for Geoscience Education and Public Understanding. (2013) Earth and Space Science Education In U.S. Secondary Schools: Key Indicators and Trends. Retrieved from http://www.americangeosciences.org/sites/default/files/education-ESS-sec-status-report-2013-09-01-13.pdf
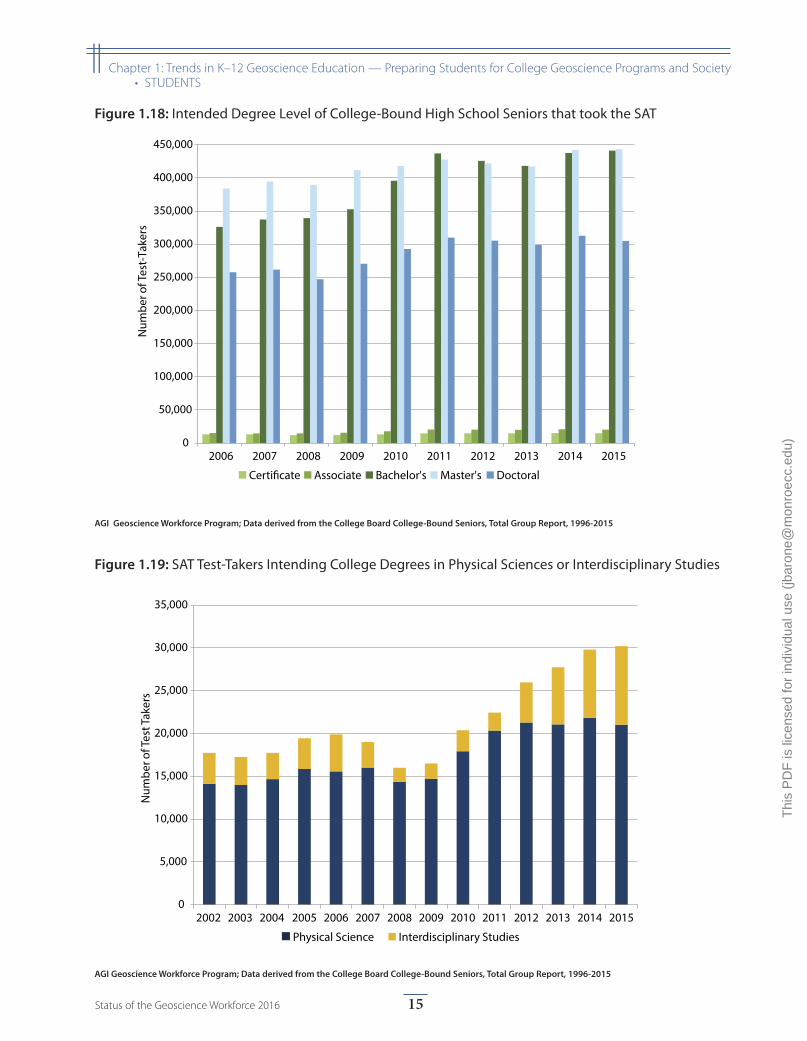
Generally SAT test-takers with coursework in the sciences tend to have higher average scores than the average of all test-takers, however, this is not the case for students with coursework in the earth and space sciences. This tends to be the case because many students that take Geology or Earth Science in high school are generally not as interested in science and count it as a science elective required for graduation. Over the past few years, it appeared that SAT test-takers interested in degrees in the physical sciences has hovered just above 20,000 students, but there has been an increase in the number of students interested in interdisciplinary studies. As Earth Science tends to be a highly interdisciplinary degree area, this increase can be encouraging for the future recruitment of geoscience majors from the introductory geoscience courses offered at postsecondary degree institutions.
Since 2013, AGI surveyed students graduating with a degree in the geosciences using AGI’s Geoscience Student Exit Survey about their educational background in the geosciences. Consistently over the past three years, approximately half of the graduates had taken a formal earth science, environmental science, or geography course while in high school. This indicates the usefulness of these courses to start recruiting students into geoscience majors during their postsecondary education, as well as reiterates the increasing inclusion of earth science courses in the high school curriculum.
While Earth Science education is typically presented as a single course in middle school or high school for most students, the National Research Council, the National Science Teachers Association, the American Association for the Advancement of Science, and Achieve worked together to create more integrated K-12 science curricu-lum with the Next Generation Science Standards in 2013. One of the recognized Disciplinary Core Ideas is Earth and Space Science, which makes earth science concepts equally represented with the other science disciplines within the state standards. Curriculum continues to be developed to integrate all areas of science throughout the entire K-12 science curriculum as set standards for what students should know at each grade level. Currently, eleven states, plus the District of Columbia, have adopted the Next Generation Science Standards, with more states looking to adopt in the near future. For more information about the Next Generation Science Standards, please visit http://www.nextgenscience.org.
1Status of the Geoscience Workforce 2016
Thi
s P
DF
is li
cens
ed fo
r in
divi
dual
use
(jb
aron
e@m
onro
ecc.
edu)
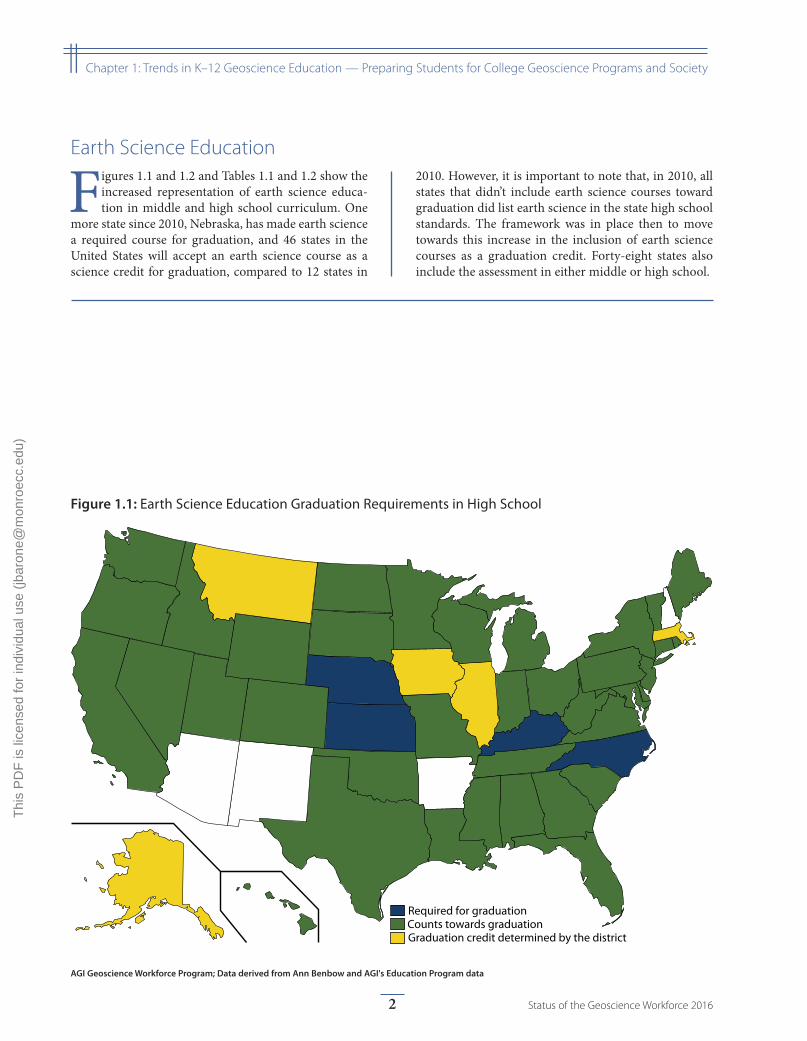
Required for graduationCounts towards graduationGraduation credit determined by the district
Figure 1.1: Earth Science Education Graduation Requirements in High School
AGI Geoscience Workforce Program; Data derived from Ann Benbow and AGI's Education Program data
Earth Science Education
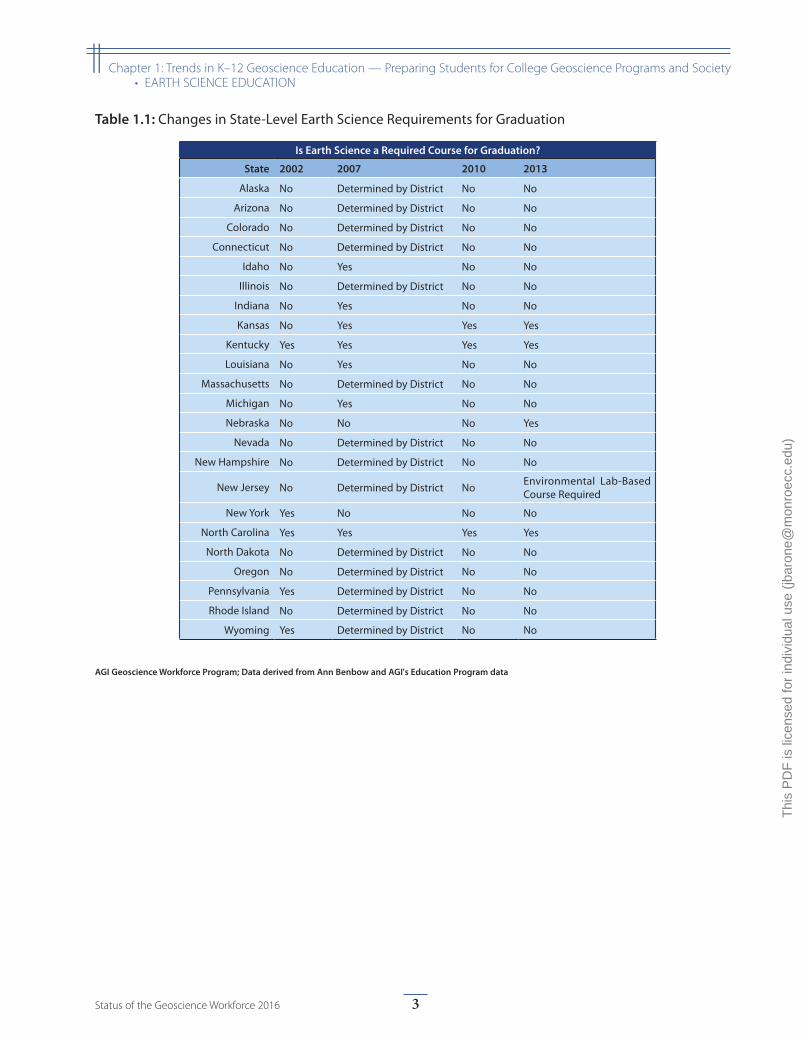
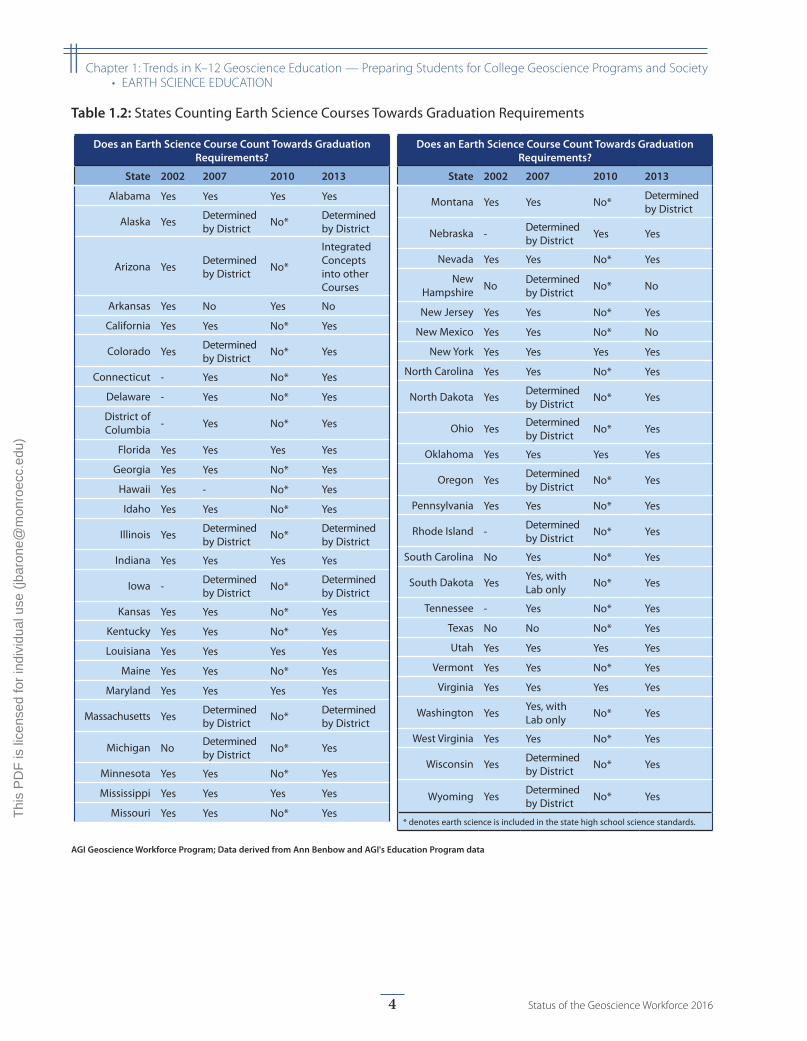
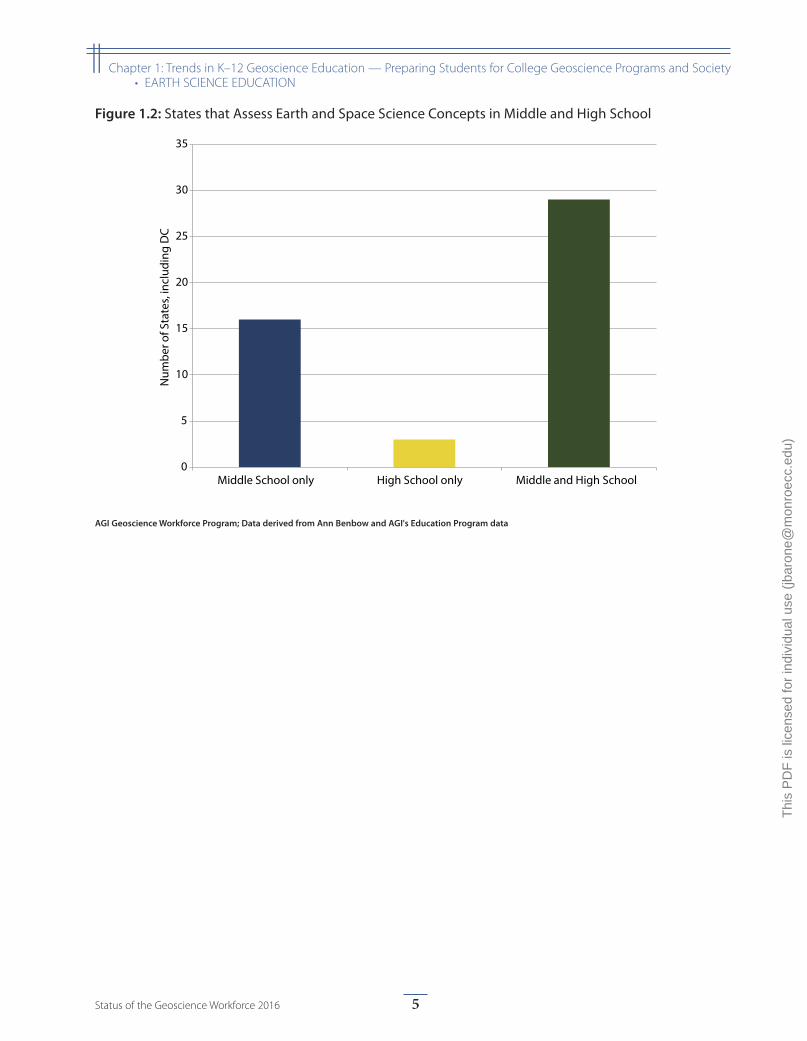
Figures 1.1 and 1.2 and Tables 1.1 and 1.2 show the increased representation of earth science educa-tion in middle and high school curriculum. One
more state since 2010, Nebraska, has made earth science a required course for graduation, and 46 states in the United States will accept an earth science course as a science credit for graduation, compared to 12 states in
2010. However, it is important to note that, in 2010, all states that didn’t include earth science courses toward graduation did list earth science in the state high school standards. The framework was in place then to move towards this increase in the inclusion of earth science courses as a graduation credit. Forty-eight states also include the assessment in either middle or high school.
2 Status of the Geoscience Workforce 2016
|| Chapter 1: Trends in K–12 Geoscience Education — Preparing Students for College Geoscience Programs and Society
Thi
s P
DF
is li
cens
ed fo
r in
divi
dual
use
(jb
aron
e@m
onro
ecc.
edu)
Is Earth Science a Required Course for Graduation?
State 2002 2007 2010 2013
Alaska No Determined by District No No
Arizona No Determined by District No No
Colorado No Determined by District No No
Connecticut No Determined by District No No
Idaho No Yes No No
Illinois No Determined by District No No
Indiana No Yes No No
Kansas No Yes Yes Yes
Kentucky Yes Yes Yes Yes
Louisiana No Yes No No
Massachusetts No Determined by District No No
Michigan No Yes No No
Nebraska No No No Yes
Nevada No Determined by District No No
New Hampshire No Determined by District No No
New Jersey No Determined by District No Environmental Lab-Based Course Required
New York Yes No No No
North Carolina Yes Yes Yes Yes
North Dakota No Determined by District No No
Oregon No Determined by District No No
Pennsylvania Yes Determined by District No No
Rhode Island No Determined by District No No
Wyoming Yes Determined by District No No
Table 1.1: Changes in State-Level Earth Science Requirements for Graduation
AGI Geoscience Workforce Program; Data derived from Ann Benbow and AGI's Education Program data
3Status of the Geoscience Workforce 2016
|| Chapter 1: Trends in K–12 Geoscience Education — Preparing Students for College Geoscience Programs and Society• EARTH SCIENCE EDUCATION
Thi
s P
DF
is li
cens
ed fo
r in
divi
dual
use
(jb
aron
e@m
onro
ecc.
edu)
Does an Earth Science Course Count Towards Graduation Requirements?
State 2002 2007 2010 2013
Alabama Yes Yes Yes Yes
Alaska Yes Determined by District No* Determined
by District
Arizona Yes Determined by District No*
Integrated Concepts into other Courses
Arkansas Yes No Yes No
California Yes Yes No* Yes
Colorado Yes Determined by District No* Yes
Connecticut - Yes No* Yes
Delaware - Yes No* Yes
District of Columbia - Yes No* Yes
Florida Yes Yes Yes Yes
Georgia Yes Yes No* Yes
Hawaii Yes - No* Yes
Idaho Yes Yes No* Yes
Illinois Yes Determined by District No* Determined
by District
Indiana Yes Yes Yes Yes
Iowa - Determined by District No* Determined
by District
Kansas Yes Yes No* Yes
Kentucky Yes Yes No* Yes
Louisiana Yes Yes Yes Yes
Maine Yes Yes No* Yes
Maryland Yes Yes Yes Yes
Massachusetts Yes Determined by District No* Determined
by District
Michigan No Determined by District No* Yes
Minnesota Yes Yes No* Yes
Mississippi Yes Yes Yes Yes
Missouri Yes Yes No* Yes
Does an Earth Science Course Count Towards Graduation Requirements?
State 2002 2007 2010 2013
Montana Yes Yes No* Determined by District
Nebraska - Determined by District Yes Yes
Nevada Yes Yes No* Yes
New Hampshire No Determined
by District No* No
New Jersey Yes Yes No* Yes
New Mexico Yes Yes No* No
New York Yes Yes Yes Yes
North Carolina Yes Yes No* Yes
North Dakota Yes Determined by District No* Yes
Ohio Yes Determined by District No* Yes
Oklahoma Yes Yes Yes Yes
Oregon Yes Determined by District No* Yes
Pennsylvania Yes Yes No* Yes
Rhode Island - Determined by District No* Yes
South Carolina No Yes No* Yes
South Dakota Yes Yes, with Lab only No* Yes
Tennessee - Yes No* Yes
Texas No No No* Yes
Utah Yes Yes Yes Yes
Vermont Yes Yes No* Yes
Virginia Yes Yes Yes Yes
Washington Yes Yes, with Lab only No* Yes
West Virginia Yes Yes No* Yes
Wisconsin Yes Determined by District No* Yes
Wyoming Yes Determined by District No* Yes
* denotes earth science is included in the state high school science standards.
Table 1.2: States Counting Earth Science Courses Towards Graduation Requirements
AGI Geoscience Workforce Program; Data derived from Ann Benbow and AGI's Education Program data
4 Status of the Geoscience Workforce 2016
|| Chapter 1: Trends in K–12 Geoscience Education — Preparing Students for College Geoscience Programs and Society• EARTH SCIENCE EDUCATION
Thi
s P
DF
is li
cens
ed fo
r in
divi
dual
use
(jb
aron
e@m
onro
ecc.
edu)
0
5
10
15
20
25
30
35
Middle School only High School only Middle and High School
Num
ber o
f Sta
tes,
incl
udin
g D
C
Figure 1.2: States that Assess Earth and Space Science Concepts in Middle and High School
AGI Geoscience Workforce Program; Data derived from Ann Benbow and AGI's Education Program data
5Status of the Geoscience Workforce 2016
|| Chapter 1: Trends in K–12 Geoscience Education — Preparing Students for College Geoscience Programs and Society• EARTH SCIENCE EDUCATION
Thi
s P
DF
is li
cens
ed fo
r in
divi
dual
use
(jb
aron
e@m
onro
ecc.
edu)
0%
5%
10%
15%
20%
25%
30%
35%
40%
45%
Computer and Mathematical
Sciences
Life andRelatedSciences
Physical andRelated
Sciences
Social andRelatedSciences
Engineering S and ERelatedFields
Non-S and ERelatedFields
Geosciences
Perc
enta
ge o
f Ele
men
tary
Tea
cher
s
Figure 1.3: Degree Fields of Elementary School Teachers, 2013
AGI Geoscience Workforce Program, Data derived from NSF's SESTAT Restricted-Use data files
Teachers
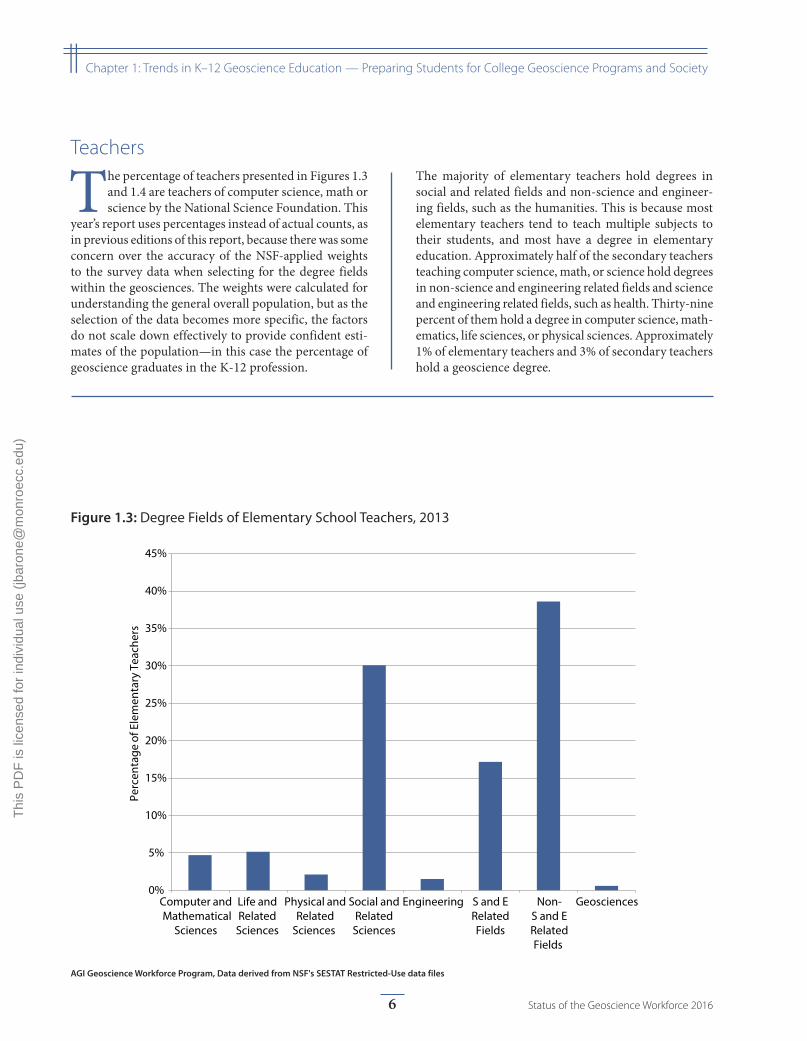
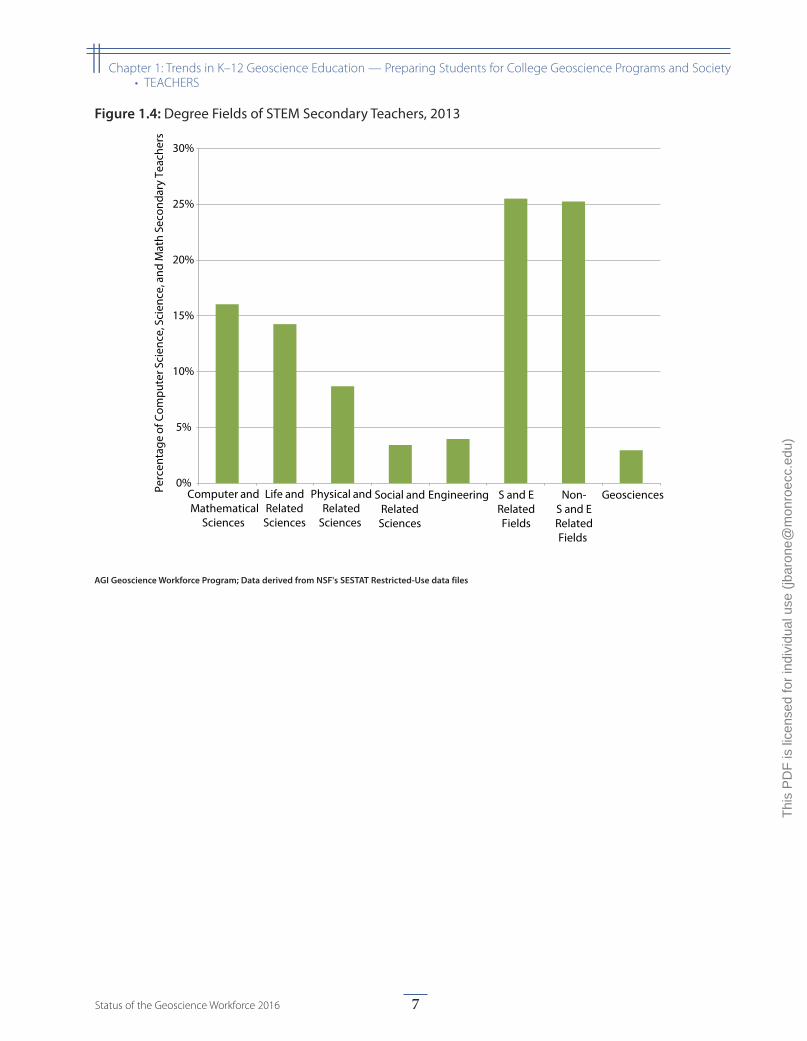
The percentage of teachers presented in Figures 1.3 and 1.4 are teachers of computer science, math or science by the National Science Foundation. This
year’s report uses percentages instead of actual counts, as in previous editions of this report, because there was some concern over the accuracy of the NSF-applied weights to the survey data when selecting for the degree fields within the geosciences. The weights were calculated for understanding the general overall population, but as the selection of the data becomes more specific, the factors do not scale down effectively to provide confident esti-mates of the population—in this case the percentage of geoscience graduates in the K-12 profession.
The majority of elementary teachers hold degrees in social and related fields and non-science and engineer-ing fields, such as the humanities. This is because most elementary teachers tend to teach multiple subjects to their students, and most have a degree in elementary education. Approximately half of the secondary teachers teaching computer science, math, or science hold degrees in non-science and engineering related fields and science and engineering related fields, such as health. Thirty-nine percent of them hold a degree in computer science, math-ematics, life sciences, or physical sciences. Approximately 1% of elementary teachers and 3% of secondary teachers hold a geoscience degree.
6 Status of the Geoscience Workforce 2016
|| Chapter 1: Trends in K–12 Geoscience Education — Preparing Students for College Geoscience Programs and Society
Thi
s P
DF
is li
cens
ed fo
r in
divi
dual
use
(jb
aron
e@m
onro
ecc.
edu)
0%
5%
10%
15%
20%
25%
30%
Perc
enta
ge o
f Com
pute
r Sci
ence
, Sci
ence
, and
Mat
h Se
cond
ary
Teac
hers
Computer and Mathematical
Sciences
Life andRelatedSciences
Physical andRelated
Sciences
Social andRelatedSciences
Engineering S and ERelatedFields
Non-S and ERelatedFields
Geosciences
Figure 1.4: Degree Fields of STEM Secondary Teachers, 2013
AGI Geoscience Workforce Program; Data derived from NSF's SESTAT Restricted-Use data files
7Status of the Geoscience Workforce 2016
|| Chapter 1: Trends in K–12 Geoscience Education — Preparing Students for College Geoscience Programs and Society• TEACHERS
Thi
s P
DF
is li
cens
ed fo
r in
divi
dual
use
(jb
aron
e@m
onro
ecc.
edu)
0%
10%
20%
30%
40%
50%
60%
70%
80%
1982 1987 1990 1994 1998 2000 2005 2009
Perc
enta
ge o
f Hig
h Sc
hool
Gra
duat
es
Algebra II (0.5 yr) Trigonometry (0.5 yr) Analysis/pre-calculus (0.5 yr)
Statistics/probability (0.5 yr) Calculus (1 yr)
Figure 1.5: Selected Math Courses Taken by U.S. High School Graduates
AGI Geoscience Workforce Program; Data derived from NCES Digest of Education Statistics, 2012
Students
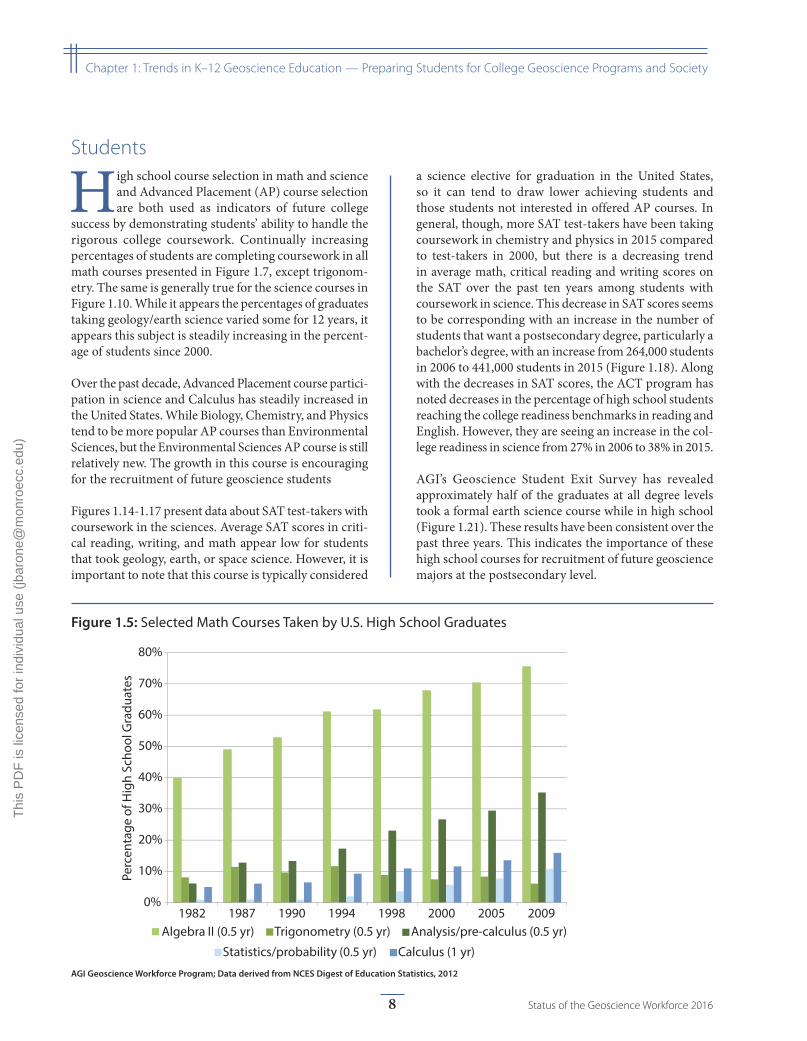
High school course selection in math and science and Advanced Placement (AP) course selection are both used as indicators of future college
success by demonstrating students’ ability to handle the rigorous college coursework. Continually increasing percentages of students are completing coursework in all math courses presented in Figure 1.7, except trigonom-etry. The same is generally true for the science courses in Figure 1.10. While it appears the percentages of graduates taking geology/earth science varied some for 12 years, it appears this subject is steadily increasing in the percent-age of students since 2000.
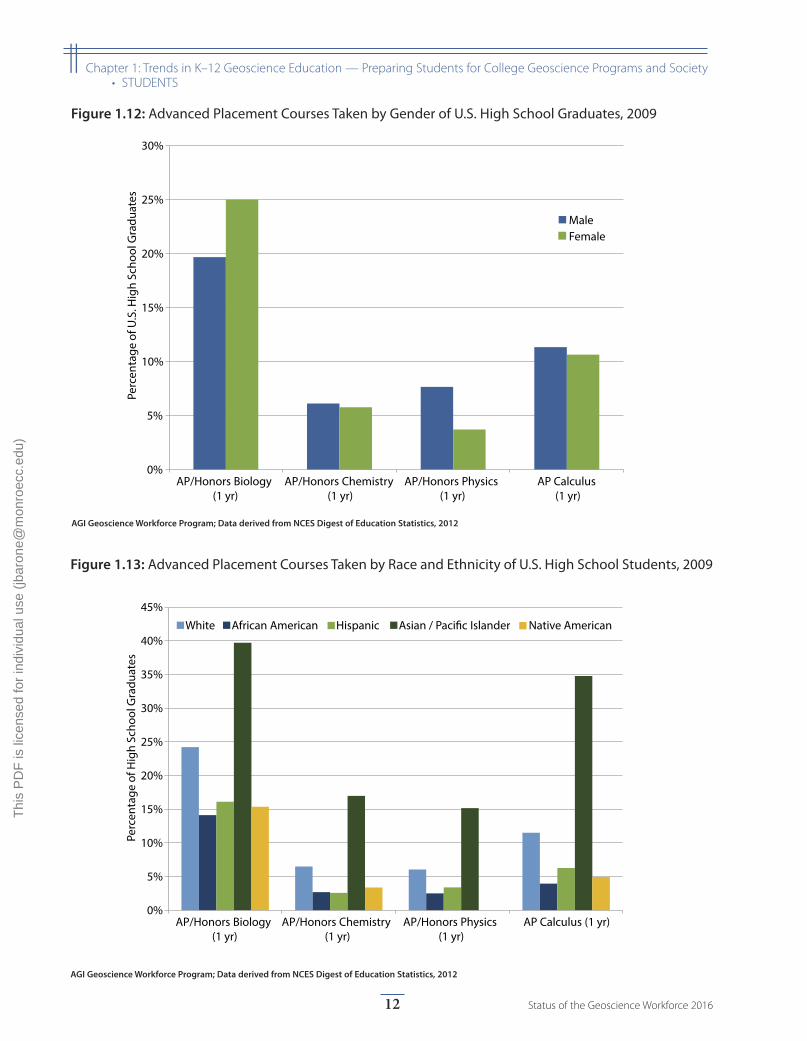
Over the past decade, Advanced Placement course partici-pation in science and Calculus has steadily increased in the United States. While Biology, Chemistry, and Physics tend to be more popular AP courses than Environmental Sciences, but the Environmental Sciences AP course is still relatively new. The growth in this course is encouraging for the recruitment of future geoscience students
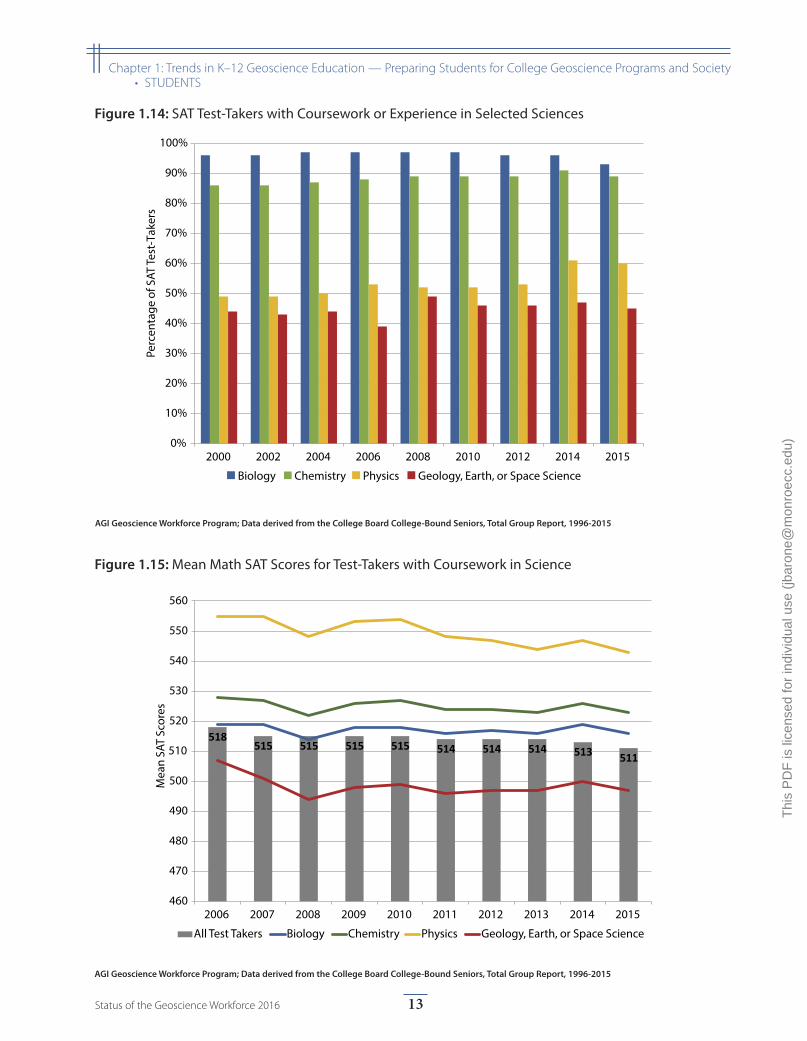
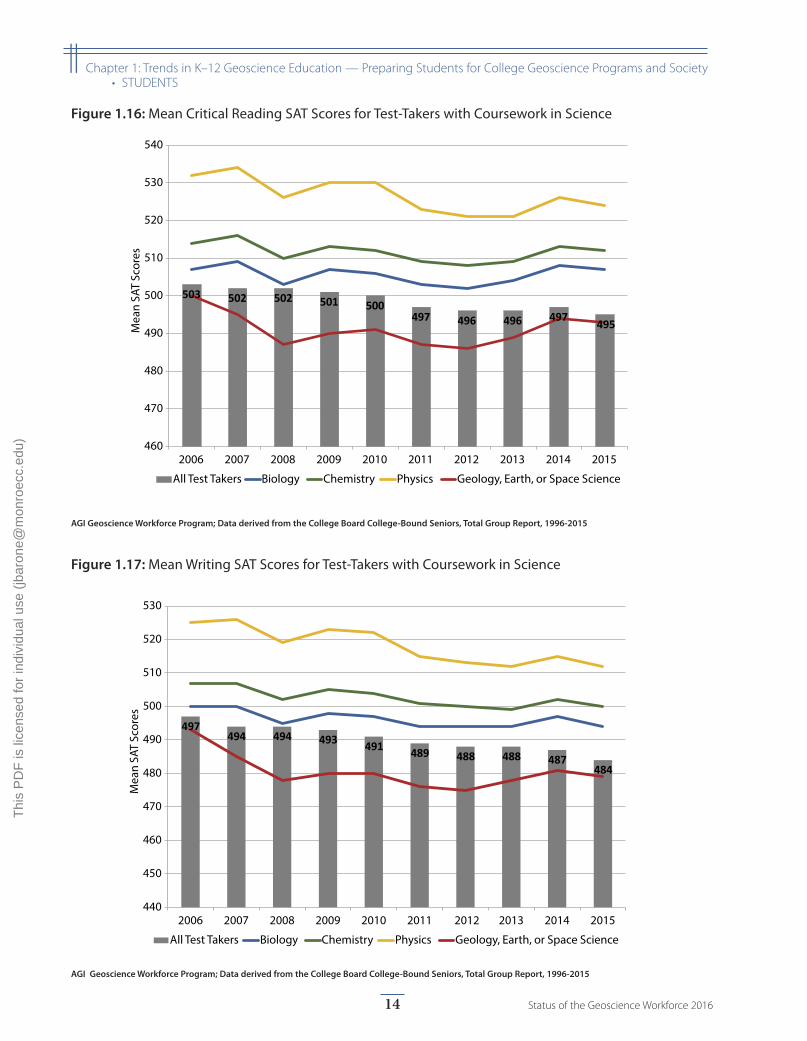
Figures 1.14-1.17 present data about SAT test-takers with coursework in the sciences. Average SAT scores in criti-cal reading, writing, and math appear low for students that took geology, earth, or space science. However, it is important to note that this course is typically considered
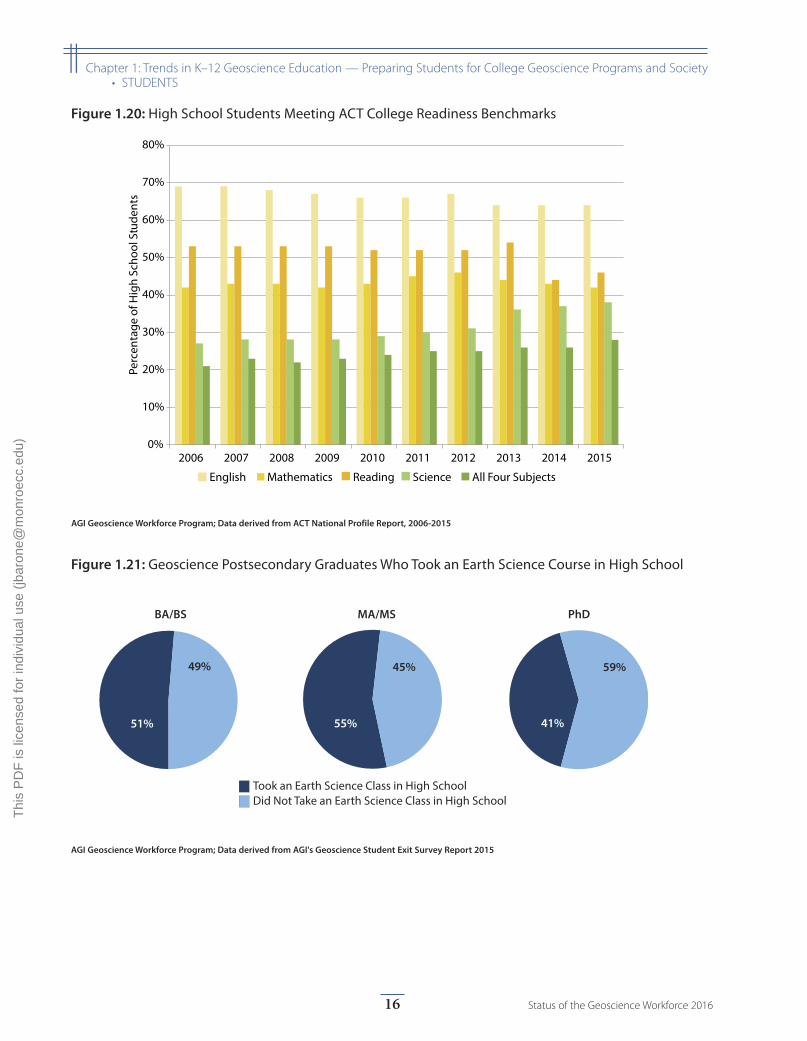
a science elective for graduation in the United States, so it can tend to draw lower achieving students and those students not interested in offered AP courses. In general, though, more SAT test-takers have been taking coursework in chemistry and physics in 2015 compared to test-takers in 2000, but there is a decreasing trend in average math, critical reading and writing scores on the SAT over the past ten years among students with coursework in science. This decrease in SAT scores seems to be corresponding with an increase in the number of students that want a postsecondary degree, particularly a bachelor’s degree, with an increase from 264,000 students in 2006 to 441,000 students in 2015 (Figure 1.18). Along with the decreases in SAT scores, the ACT program has noted decreases in the percentage of high school students reaching the college readiness benchmarks in reading and English. However, they are seeing an increase in the col-lege readiness in science from 27% in 2006 to 38% in 2015.
AGI’s Geoscience Student Exit Survey has revealed approximately half of the graduates at all degree levels took a formal earth science course while in high school (Figure 1.21). These results have been consistent over the past three years. This indicates the importance of these high school courses for recruitment of future geoscience majors at the postsecondary level.
8 Status of the Geoscience Workforce 2016
|| Chapter 1: Trends in K–12 Geoscience Education — Preparing Students for College Geoscience Programs and Society
Thi
s P
DF
is li
cens
ed fo
r in
divi
dual
use
(jb
aron
e@m
onro
ecc.
edu)
0%
10%
20%
30%
40%
50%
60%
70%
80%
90%
Algebra II (0.5 yr) Trigonometry (0.5 yr)
Analysis/pre-calculus (0.5 yr)
Statistics/probability (0.5 yr)
Calculus (1 yr)
Perc
enta
ge o
f Hig
h Sc
hool
Gra
duat
es
with
in e
ach
Ethn
icity
Gro
up
White African American Hispanic
Asian / Paci�c Islander Native American/Alaskan Native
Figure 1.7: Selected Math Courses Taken by Race and Ethnicity of U.S. High School Graduates, 2009
AGI Geoscience Workforce Program; Data derived from NCES Digest of Education Statistics, 2012
0%
10%
20%
30%
40%
50%
60%
70%
80%
90%
Algebra II (0.5 yr) Trigonometry (0.5 yr)
Analysis/pre-calculus
(0.5 yr)
Statistics/
probability (0.5 yr)Calculus (1 yr)
Perc
enta
ge o
f U.S
. Hig
h Sc
hool
Gra
duat
es
Male Female
Figure 1.6: Selected Math Courses Taken by Gender of U.S. High School Graduates, 2009
AGI Geoscience Workforce Program; Data derived from NCES Digest of Education Statistics, 2012
9Status of the Geoscience Workforce 2016
|| Chapter 1: Trends in K–12 Geoscience Education — Preparing Students for College Geoscience Programs and Society• STUDENTS
Thi
s P
DF
is li
cens
ed fo
r in
divi
dual
use
(jb
aron
e@m
onro
ecc.
edu)
0%
10%
20%
30%
40%
50%
60%
70%
80%
90%
100%
Biology (1 yr) Chemistry (1 yr) Physics (1 yr) Geology/Earth science(0.5 yr)
Perc
enta
ge o
f Hig
h Sc
hool
Gra
duat
es
Male Female
Figure 1.9: Science Courses Taken by Gender of U.S. High School Graduates, 2009
AGI Geoscience Workforce Program; Data derived from NCES Digest of Education Statistics, 2012
0%
10%
20%
30%
40%
50%
60%
70%
80%
90%
100%
1982 1987 1990 1994 1998 2000 2005 2009
Perc
enta
ge o
f Hig
h Sc
hool
Gra
duat
es
Biology (1 yr) Chemistry (1 yr) Physics (1 yr) Geology/Earth science (0.5 yr)
Figure 1.8: Science Courses Taken by U.S. High School Graduates
AGI Geoscience Workforce Program; Data derived from NCES Digest of Education Statistics, 2012
10 Status of the Geoscience Workforce 2016
|| Chapter 1: Trends in K–12 Geoscience Education — Preparing Students for College Geoscience Programs and Society• STUDENTS
Thi
s P
DF
is li
cens
ed fo
r in
divi
dual
use
(jb
aron
e@m
onro
ecc.
edu)
0%
10%
20%
30%
40%
50%
60%
70%
80%
90%
100%
Biology (1 yr) Chemistry (1 yr) Physics (1 yr) Geology/Earth Science(0.5 yr) Pe
rcen
tage
of H
igh
Scho
ol G
radu
ates
with
in e
ach
Ethn
icity
Gro
up
White African American Hispanic Asian / Paci�c Islander Native American/Alaskan Native
Figure 1.10: Science Courses Taken by Race and Ethnicity of U.S. High School Graduates, 2009
AGI Geoscience Workforce Program; Data derived from NCES Digest of Education Statistics, 2012
0
50,000
100,000
150,000
200,000
250,000
300,000
350,000
400,000
450,000
2006 2007 2008 2009 2010 2011 2012 2013 2014 2015
Num
ber o
f Stu
dent
s
Biology Chemistry Physics Environmental Science Calculus (AB & BC)
Figure 1.11: Number of Students Taking AP Courses in Science and Math, 2006-2015
AGI Geoscience Workforce Program; Data derived from the College Board AP Data
11Status of the Geoscience Workforce 2016
|| Chapter 1: Trends in K–12 Geoscience Education — Preparing Students for College Geoscience Programs and Society• STUDENTS
Thi
s P
DF
is li
cens
ed fo
r in
divi
dual
use
(jb
aron
e@m
onro
ecc.
edu)
0%
5%
10%
15%
20%
25%
30%
AP/Honors Biology (1 yr)
AP/Honors Chemistry (1 yr)
AP/Honors Physics (1 yr)
AP Calculus (1 yr)
Perc
enta
ge o
f U.S
. Hig
h Sc
hool
Gra
duat
es
MaleFemale
Figure 1.12: Advanced Placement Courses Taken by Gender of U.S. High School Graduates, 2009
AGI Geoscience Workforce Program; Data derived from NCES Digest of Education Statistics, 2012
0%
5%
10%
15%
20%
25%
30%
35%
40%
45%
AP/Honors Biology (1 yr)
AP/Honors Chemistry (1 yr)
AP/Honors Physics (1 yr)
AP Calculus (1 yr)
Perc
enta
ge o
f Hig
h Sc
hool
Gra
duat
es
White African American Hispanic Asian / Paci�c Islander Native American
Figure 1.13: Advanced Placement Courses Taken by Race and Ethnicity of U.S. High School Students, 2009
AGI Geoscience Workforce Program; Data derived from NCES Digest of Education Statistics, 2012
12 Status of the Geoscience Workforce 2016
|| Chapter 1: Trends in K–12 Geoscience Education — Preparing Students for College Geoscience Programs and Society• STUDENTS
Thi
s P
DF
is li
cens
ed fo
r in
divi
dual
use
(jb
aron
e@m
onro
ecc.
edu)
518 515 515 515 515 514 514 514 513 511
460
470
480
490
500
510
520
530
540
550
560
2006 2007 2008 2009 2010 2011 2012 2013 2014 2015
Mea
n SA
T Sc
ores
All Test Takers Biology Chemistry Physics Geology, Earth, or Space Science
Figure 1.15: Mean Math SAT Scores for Test-Takers with Coursework in Science
AGI Geoscience Workforce Program; Data derived from the College Board College-Bound Seniors, Total Group Report, 1996-2015
0%
10%
20%
30%
40%
50%
60%
70%
80%
90%
100%
2000 2002 2004 2006 2008 2010 2012 2014 2015
Perc
enta
ge o
f SAT
Test
-Tak
ers
Biology Chemistry Physics Geology, Earth, or Space Science
Figure 1.14: SAT Test-Takers with Coursework or Experience in Selected Sciences
AGI Geoscience Workforce Program; Data derived from the College Board College-Bound Seniors, Total Group Report, 1996-2015
13Status of the Geoscience Workforce 2016
|| Chapter 1: Trends in K–12 Geoscience Education — Preparing Students for College Geoscience Programs and Society• STUDENTS
Thi
s P
DF
is li
cens
ed fo
r in
divi
dual
use
(jb
aron
e@m
onro
ecc.
edu)
497 494 494 493 491 489 488 488 487
484
440
450
460
470
480
490
500
510
520
530
2006 2007 2008 2009 2010 2011 2012 2013 2014 2015
Mea
n SA
T Sc
ores
All Test Takers Biology Chemistry Physics Geology, Earth, or Space Science
Figure 1.17: Mean Writing SAT Scores for Test-Takers with Coursework in Science
AGI Geoscience Workforce Program; Data derived from the College Board College-Bound Seniors, Total Group Report, 1996-2015
503 502 502 501 500 497 496 496 497 495
460
470
480
490
500
510
520
530
540
2006 2007 2008 2009 2010 2011 2012 2013 2014 2015
Mea
n SA
T Sc
ores
All Test Takers Biology Chemistry Physics Geology, Earth, or Space Science
Figure 1.16: Mean Critical Reading SAT Scores for Test-Takers with Coursework in Science
AGI Geoscience Workforce Program; Data derived from the College Board College-Bound Seniors, Total Group Report, 1996-2015
14 Status of the Geoscience Workforce 2016
|| Chapter 1: Trends in K–12 Geoscience Education — Preparing Students for College Geoscience Programs and Society• STUDENTS
Thi
s P
DF
is li
cens
ed fo
r in
divi
dual
use
(jb
aron
e@m
onro
ecc.
edu)
0
5,000
10,000
15,000
20,000
25,000
30,000
35,000
2002 2003 2004 2005 2006 2007 2008 2009 2010 2011 2012 2013 2014 2015
Num
ber o
f Tes
t Tak
ers
Physical Science Interdisciplinary Studies
Figure 1.19: SAT Test-Takers Intending College Degrees in Physical Sciences or Interdisciplinary Studies
AGI Geoscience Workforce Program; Data derived from the College Board College-Bound Seniors, Total Group Report, 1996-2015
0
50,000
100,000
150,000
200,000
250,000
300,000
350,000
400,000
450,000
2006 2007 2008 2009 2010 2011 2012 2013 2014 2015
Num
ber o
f Tes
t-Ta
kers
Certi�cate Associate Bachelor's Master's Doctoral
Figure 1.18: Intended Degree Level of College-Bound High School Seniors that took the SAT
AGI Geoscience Workforce Program; Data derived from the College Board College-Bound Seniors, Total Group Report, 1996-2015
15Status of the Geoscience Workforce 2016
|| Chapter 1: Trends in K–12 Geoscience Education — Preparing Students for College Geoscience Programs and Society• STUDENTS
Thi
s P
DF
is li
cens
ed fo
r in
divi
dual
use
(jb
aron
e@m
onro
ecc.
edu)
0%
10%
20%
30%
40%
50%
60%
70%
80%
2006 2007 2008 2009 2010 2011 2012 2013 2014 2015
Perc
enta
ge o
f Hig
h Sc
hool
Stu
dent
s
English Mathematics Reading Science All Four Subjects
Took an Earth Science Class in High SchoolDid Not Take an Earth Science Class in High School
BA/BS MA/MS PhD
51%
49%
55%
45%
41%
59%
Figure 1.20: High School Students Meeting ACT College Readiness Benchmarks
Figure 1.21: Geoscience Postsecondary Graduates Who Took an Earth Science Course in High School
AGI Geoscience Workforce Program; Data derived from ACT National Profile Report, 2006-2015
AGI Geoscience Workforce Program; Data derived from AGI's Geoscience Student Exit Survey Report 2015
16 Status of the Geoscience Workforce 2016
|| Chapter 1: Trends in K–12 Geoscience Education — Preparing Students for College Geoscience Programs and Society• STUDENTS
Thi
s P
DF
is li
cens
ed fo
r in
divi
dual
use
(jb
aron
e@m
onro
ecc.
edu)
Chapter 2: Trends in Two-Year College Geoscience Programs
Between 2010 and 2013, there was a decrease in the enrollments of students at two-year colleges, as well as little growth in the number of associate’s degrees
awarded. While the total number of students enrolled at two-year colleges did not increase, the percentage of women at these institutions remained above 55%, and Hispanic student enrollments continue to increase, reach-ing 22% in 2013. However, African American/Black and Native American/Native Indian enrollments have seen no growth between 2010 and 2013. These changes to enrollments and completions at two-year colleges have not affected the continued increase in the overall number of associate’s degrees awarded in the geosciences, as well as the small gains in percentages of women and under-represented minorities that earned associate’s degrees in the geosciences.
Approximately 19% of two-year colleges in the United States offer a geoscience program or course. This may appear to be a decrease in programs since the 2014 report, but since the publication of the earlier edition of this report, the Directory of Geoscience Departments database has been extensively updated, which included the removal of duplicate listings. While AGI’s database is extensive, it may not contain all the geoscience programs in existence at two-year colleges due to periodic changes in programs, course offerings, and faculty. There is an identifiable relationship between states with major geo-science industries and the number of 2-year institutions with a geoscience presence, such as Texas, California, Washington, Illinois, New York, and Arizona.
Most geoscience activities within two-year colleges only have one or two faculty members assigned to teach a geoscience course, and these faculty members tend to be within a natural sciences or physical sciences division. Two-year colleges tend to have younger faculty and a
higher percentages of female faculty in tenure and tenure-track positions than at four-year institutions.
Geoscience faculty teaching at two-year colleges have indicated that there is a growing interest in the geosci-ences among their students, particularly in states with strong geoscience industries, and they tend to encour-age their students to transfer to four-year institutions to complete their geoscience education. Therefore, this student population is an ideal target for recruitment of geoscience majors at four-year institutions. Over the past three years, there has been a steady increase in the percentages of bachelor’s, master’s, and doctoral gradu-ates that indicated spending at least one semester at a two-year college during their postsecondary education. Among these graduates, there have also been increases in the percentages of these recent students taking an earth science course while at the two-year colleges. Further development of relationships between two-year colleges and four-year institutions will increase the recruitment of students into geoscience majors.
With growing evidence for more active recruitment of geoscience majors from two-year college transfers, AGI is currently collaborating with two-year college faculty to investigate the factors that assist in effective transfer of two-year college students, as well as the challenges these students have faced after entering a geoscience program at a four-year institution. While family and friends were seen as helpful to some stu-dents with their transition into four-year institutions, the majority of two-year college transfers considered their personal motivation to a bachelor’s degree and the transferred coursework as the most impactful for a successful transfer and completion. This research is ongoing as more information related to the transfers of two-year college students is released.
17Status of the Geoscience Workforce 2016
Thi
s P
DF
is li
cens
ed fo
r in
divi
dual
use
(jb
aron
e@m
onro
ecc.
edu)
0%
10%
20%
30%
40%
50%
60%
2014 2020 2030 2040 2050 2060
Perc
enta
ge o
f 18-
24 y
ear-
olds
African AmericanHispanic American Indian/Native AlaskanWhite Asian
Figure 2.1: Race/Ethnicity of U.S. College-Age Population, 2014-2060
AGI Geoscience Workforce Program; Data derived from US Census Bureau Population Estimates
National Benchmarks
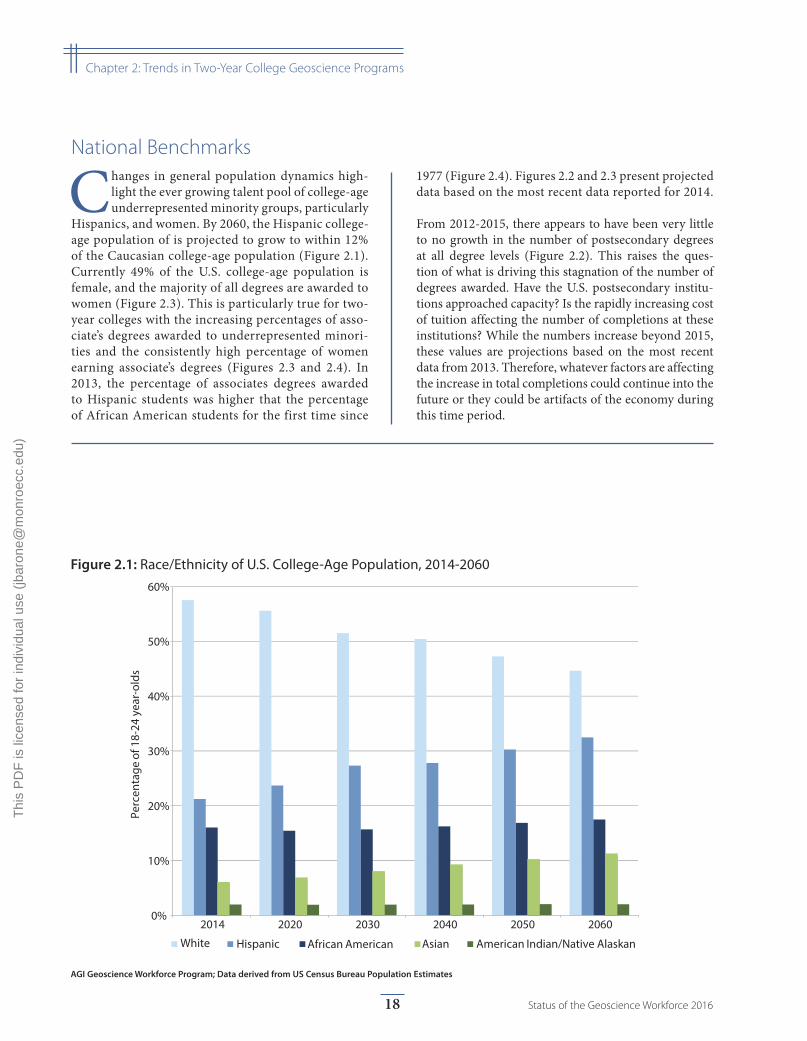
Changes in general population dynamics high-light the ever growing talent pool of college-age underrepresented minority groups, particularly
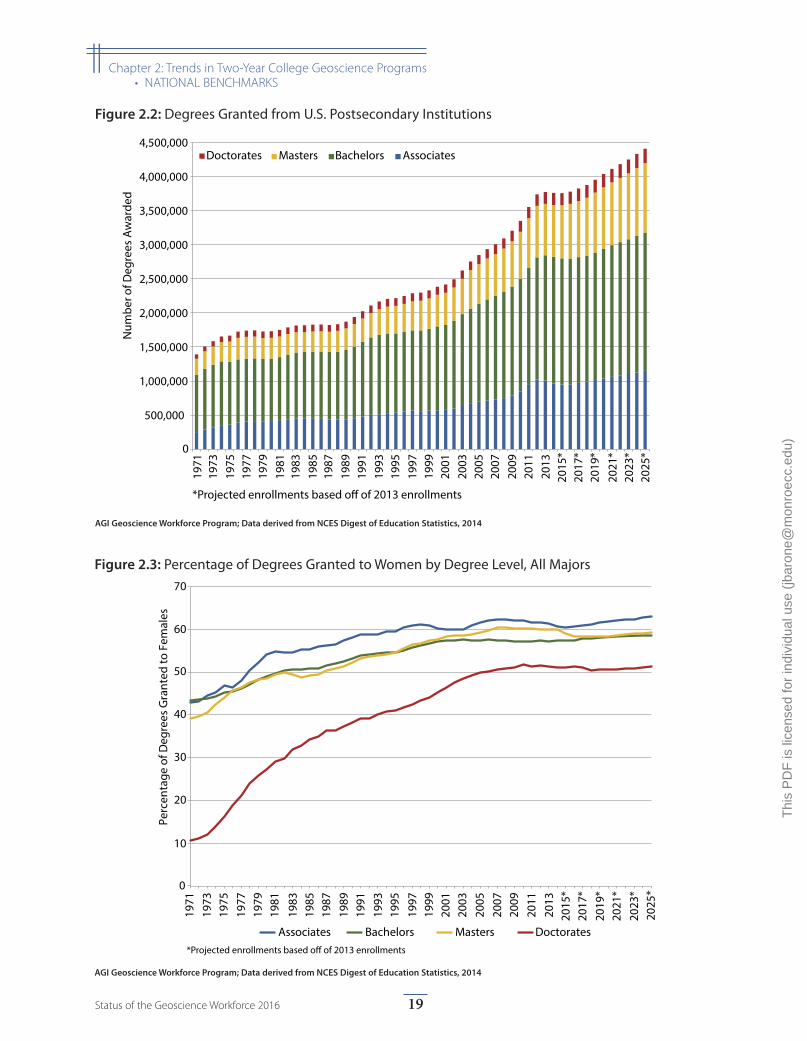
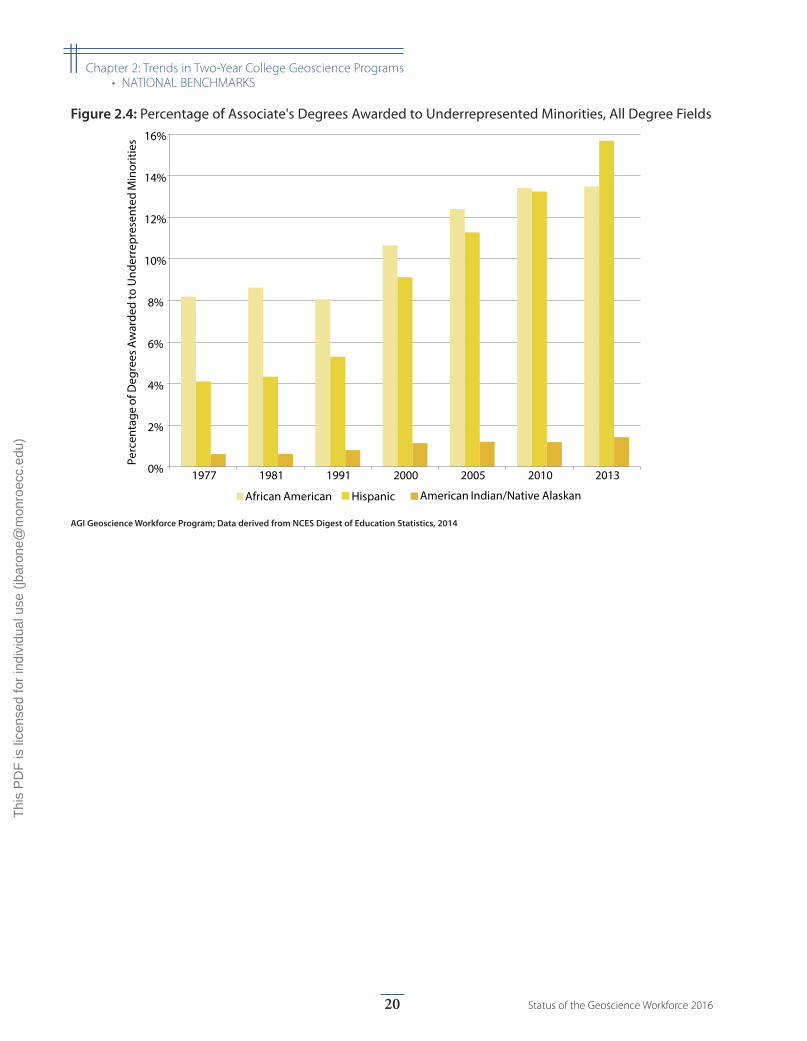
Hispanics, and women. By 2060, the Hispanic college-age population of is projected to grow to within 12% of the Caucasian college-age population (Figure 2.1). Currently 49% of the U.S. college-age population is female, and the majority of all degrees are awarded to women (Figure 2.3). This is particularly true for two-year colleges with the increasing percentages of asso-ciate’s degrees awarded to underrepresented minori-ties and the consistently high percentage of women earning associate’s degrees (Figures 2.3 and 2.4). In 2013, the percentage of associates degrees awarded to Hispanic students was higher that the percentage of African American students for the first time since
1977 (Figure 2.4). Figures 2.2 and 2.3 present projected data based on the most recent data reported for 2014.
From 2012-2015, there appears to have been very little to no growth in the number of postsecondary degrees at all degree levels (Figure 2.2). This raises the ques-tion of what is driving this stagnation of the number of degrees awarded. Have the U.S. postsecondary institu-tions approached capacity? Is the rapidly increasing cost of tuition affecting the number of completions at these institutions? While the numbers increase beyond 2015, these values are projections based on the most recent data from 2013. Therefore, whatever factors are affecting the increase in total completions could continue into the future or they could be artifacts of the economy during this time period.
18 Status of the Geoscience Workforce 2016
|| Chapter 2: Trends in Two-Year College Geoscience Programs
Thi
s P
DF
is li
cens
ed fo
r in
divi
dual
use
(jb
aron
e@m
onro
ecc.
edu)
0
10
20
30
40
50
60
70
1971
1973
1975
1977
1979
1981
1983
1985
1987
1989
1991
1993
1995
1997
1999
2001
2003
2005
2007
2009
2011
2013
2015
*20
17*
2019
*20
21*
2023
*20
25*
Perc
enta
ge o
f Deg
rees
Gra
nted
to F
emal
es
Associates Bachelors Masters Doctorates*Projected enrollments based o� of 2013 enrollments
Figure 2.3: Percentage of Degrees Granted to Women by Degree Level, All Majors
AGI Geoscience Workforce Program; Data derived from NCES Digest of Education Statistics, 2014
0
500,000
1,000,000
1,500,000
2,000,000
2,500,000
3,000,000
3,500,000
4,000,000
4,500,000
1971
1973
1975
1977
1979
1981
1983
1985
1987
1989
1991
1993
1995
1997
1999
2001
2003
2005
2007
2009
2011
2013
2015
*20
17*
2019
*20
21*
2023
*20
25*
Num
ber o
f Deg
rees
Aw
arde
d
Doctorates Masters Bachelors Associates
*Projected enrollments based o� of 2013 enrollments
Figure 2.2: Degrees Granted from U.S. Postsecondary Institutions
AGI Geoscience Workforce Program; Data derived from NCES Digest of Education Statistics, 2014
19Status of the Geoscience Workforce 2016
|| Chapter 2: Trends in Two-Year College Geoscience Programs• NATIONAL BENCHMARKS
Thi
s P
DF
is li
cens
ed fo
r in
divi
dual
use
(jb
aron
e@m
onro
ecc.
edu)
0%
2%
4%
6%
8%
10%
12%
14%
16%
1977 1981 1991 2000 2005 2010 2013
Perc
enta
ge o
f Deg
rees
Aw
arde
d to
Und
erre
pres
ente
d M
inor
ities
African American Hispanic American Indian/Native Alaskan
Figure 2.4: Percentage of Associate's Degrees Awarded to Underrepresented Minorities, All Degree Fields
AGI Geoscience Workforce Program; Data derived from NCES Digest of Education Statistics, 2014
20 Status of the Geoscience Workforce 2016
|| Chapter 2: Trends in Two-Year College Geoscience Programs• NATIONAL BENCHMARKS
Thi
s P
DF
is li
cens
ed fo
r in
divi
dual
use
(jb
aron
e@m
onro
ecc.
edu)
0
1,000,000
2,000,000
3,000,000
4,000,000
5,000,000
6,000,000
7,000,000
8,000,000
1970
1972
1974
1976
1978
1980
1982
1984
1986
1988
1990
1992
1994
1996
1998
2000
2002
2004
2006
2008
2010
2012
2014
*20
15*
2019
*20
24*
Num
ber o
f Stu
dent
s
*Projected enrollments based o� of 2013 enrollments
Figure 2.5: Fall Enrollments at U.S. Two-Year Colleges
AGI Geoscience Workforce Program; Data derived from NCES Digest of Education Statistics, 2014
Two-Year Enrollments
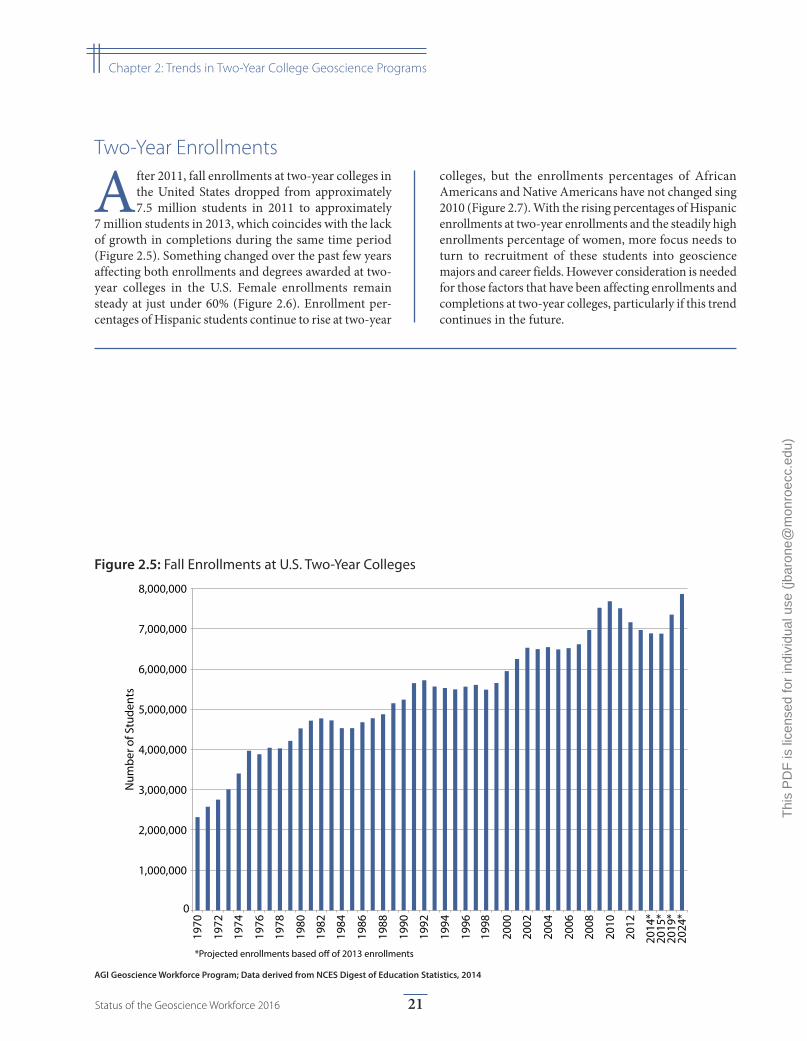
After 2011, fall enrollments at two-year colleges in the United States dropped from approximately 7.5 million students in 2011 to approximately
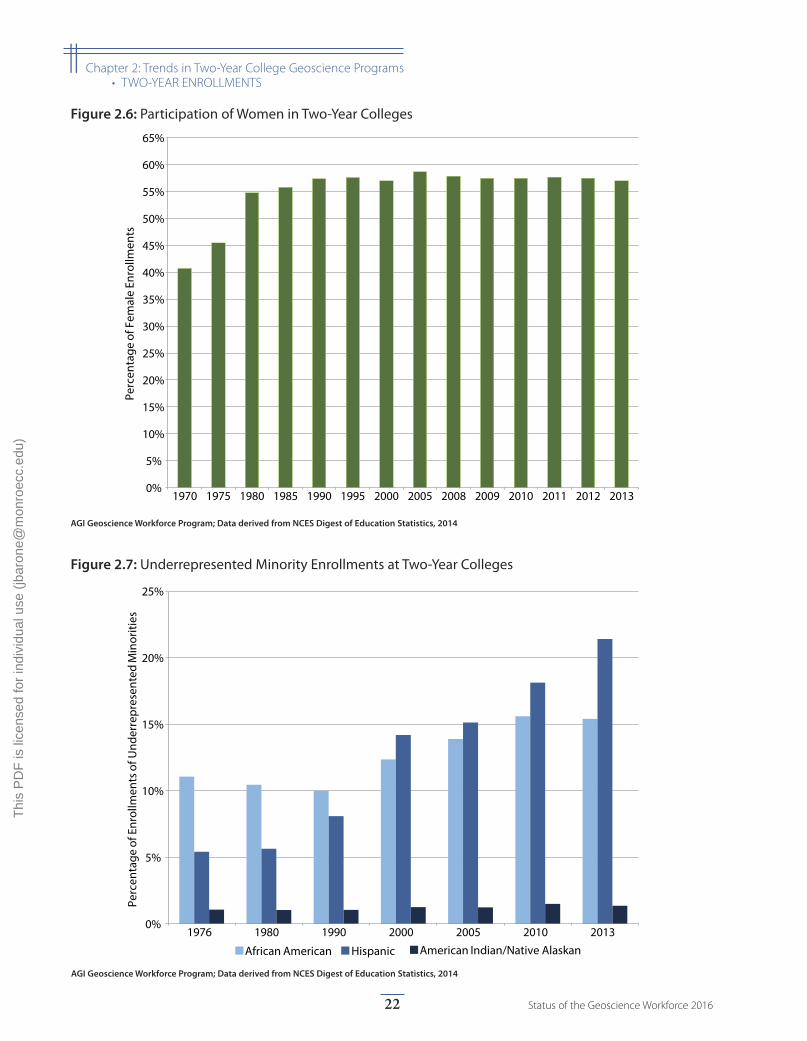
7 million students in 2013, which coincides with the lack of growth in completions during the same time period (Figure 2.5). Something changed over the past few years affecting both enrollments and degrees awarded at two-year colleges in the U.S. Female enrollments remain steady at just under 60% (Figure 2.6). Enrollment per-centages of Hispanic students continue to rise at two-year
colleges, but the enrollments percentages of African Americans and Native Americans have not changed sing 2010 (Figure 2.7). With the rising percentages of Hispanic enrollments at two-year enrollments and the steadily high enrollments percentage of women, more focus needs to turn to recruitment of these students into geoscience majors and career fields. However consideration is needed for those factors that have been affecting enrollments and completions at two-year colleges, particularly if this trend continues in the future.
21Status of the Geoscience Workforce 2016
|| Chapter 2: Trends in Two-Year College Geoscience Programs
Thi
s P
DF
is li
cens
ed fo
r in
divi
dual
use
(jb
aron
e@m
onro
ecc.
edu)
0%
5%
10%
15%
20%
25%
1976 1980 1990 2000 2005 2010 2013
Perc
enta
ge o
f Enr
ollm
ents
of U
nder
repr
esen
ted
Min
oriti
es
African American Hispanic American Indian/Native Alaskan
Figure 2.7: Underrepresented Minority Enrollments at Two-Year Colleges
AGI Geoscience Workforce Program; Data derived from NCES Digest of Education Statistics, 2014
0%
5%
10%
15%
20%
25%
30%
35%
40%
45%
50%
55%
60%
65%
1970 1975 1980 1985 1990 1995 2000 2005 2008 2009 2010 2011 2012 2013
Perc
enta
ge o
f Fem
ale
Enro
llmen
tsFigure 2.6: Participation of Women in Two-Year Colleges
AGI Geoscience Workforce Program; Data derived from NCES Digest of Education Statistics, 2014
22 Status of the Geoscience Workforce 2016
|| Chapter 2: Trends in Two-Year College Geoscience Programs• TWO-YEAR ENROLLMENTS
Thi
s P
DF
is li
cens
ed fo
r in
divi
dual
use
(jb
aron
e@m
onro
ecc.
edu)
1
210
65
4
DC: 2
12
9
2
1
3
22
1 2
2
4
5
1
14
11
6
2
4
2 2
6
4
12
5
3
7
51
1
1
5
41
313
21
15
8 1
1-11 Colleges
12-22 Colleges
23-33 Colleges
34-44 Colleges
45-55 Colleges
56-66 Colleges
1
210
65
4
DC: 2
12
9
2
1
3
22
1 2
2
4
5
1
14
11
6
2
4
2 2
6
4
12
5
3
7
51
1
1
5
41
313
21
15
8 1
1-11 Colleges
12-22 Colleges
23-33 Colleges
34-44 Colleges
45-55 Colleges
56-66 Colleges
Figure 2.8: Number of Geoscience Departments/Programs at Two-Year Colleges by State
AGI Geoscience Workforce Program; Data derived from AGI's Directory of Geoscience Departments database
Geoscience Departments and Faculty
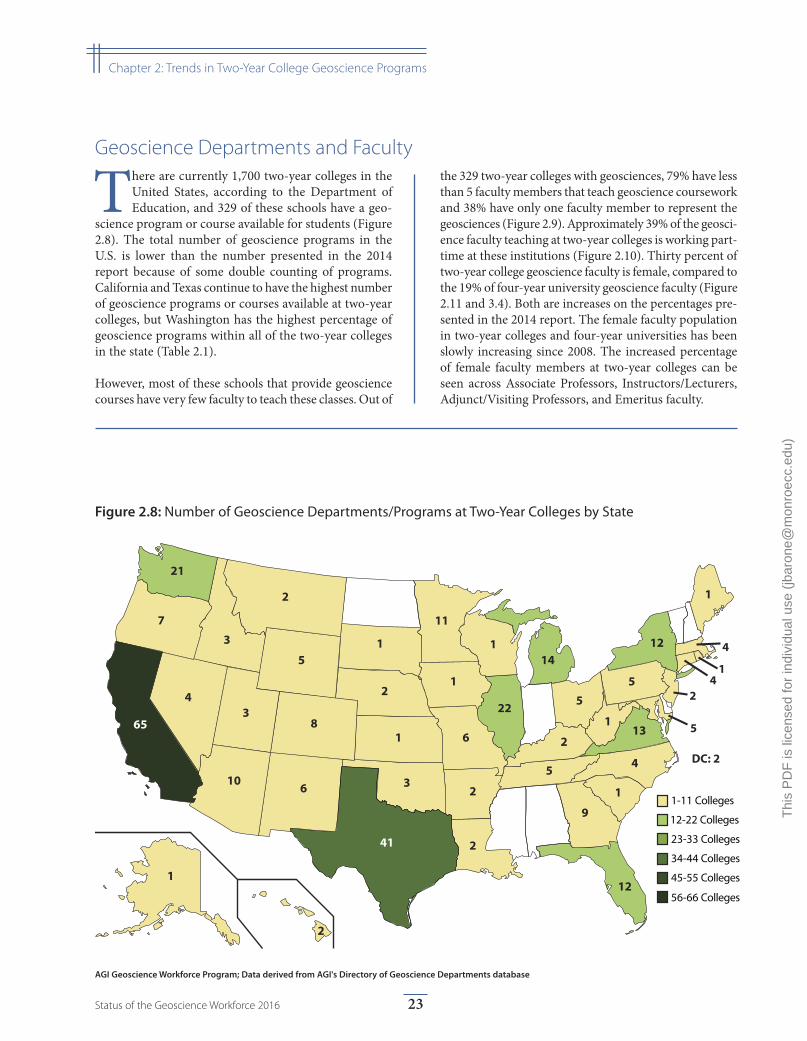
There are currently 1,700 two-year colleges in the United States, according to the Department of Education, and 329 of these schools have a geo-
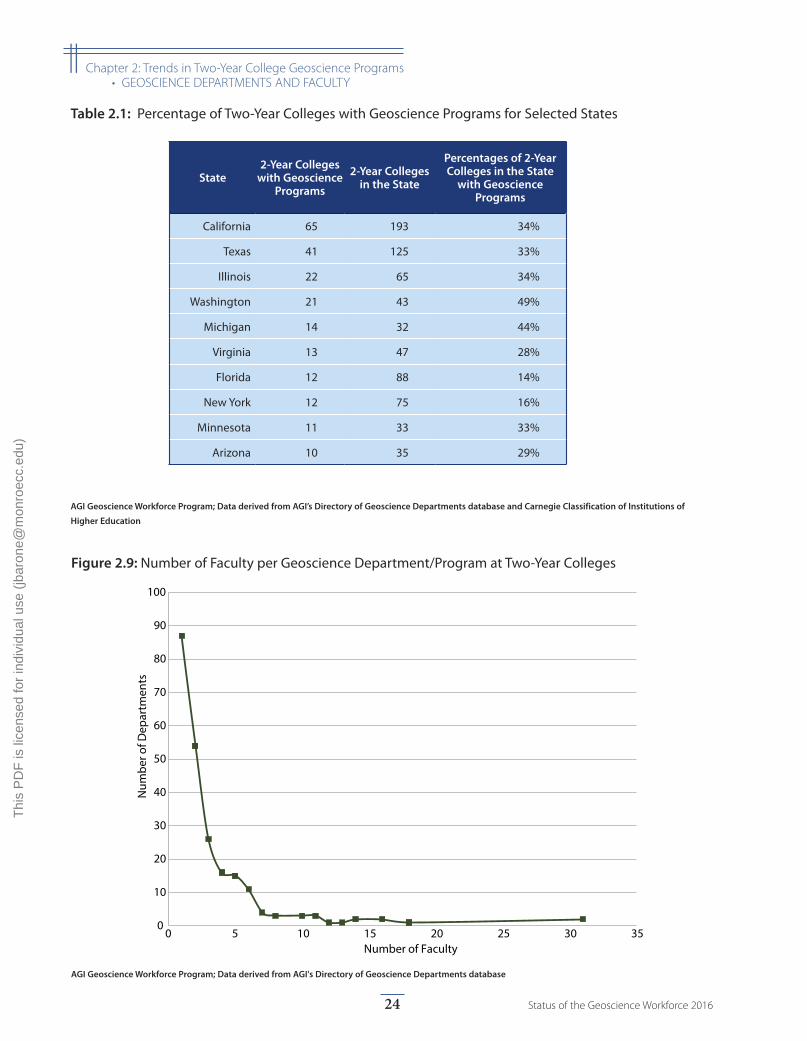
science program or course available for students (Figure 2.8). The total number of geoscience programs in the U.S. is lower than the number presented in the 2014 report because of some double counting of programs. California and Texas continue to have the highest number of geoscience programs or courses available at two-year colleges, but Washington has the highest percentage of geoscience programs within all of the two-year colleges in the state (Table 2.1).
However, most of these schools that provide geoscience courses have very few faculty to teach these classes. Out of
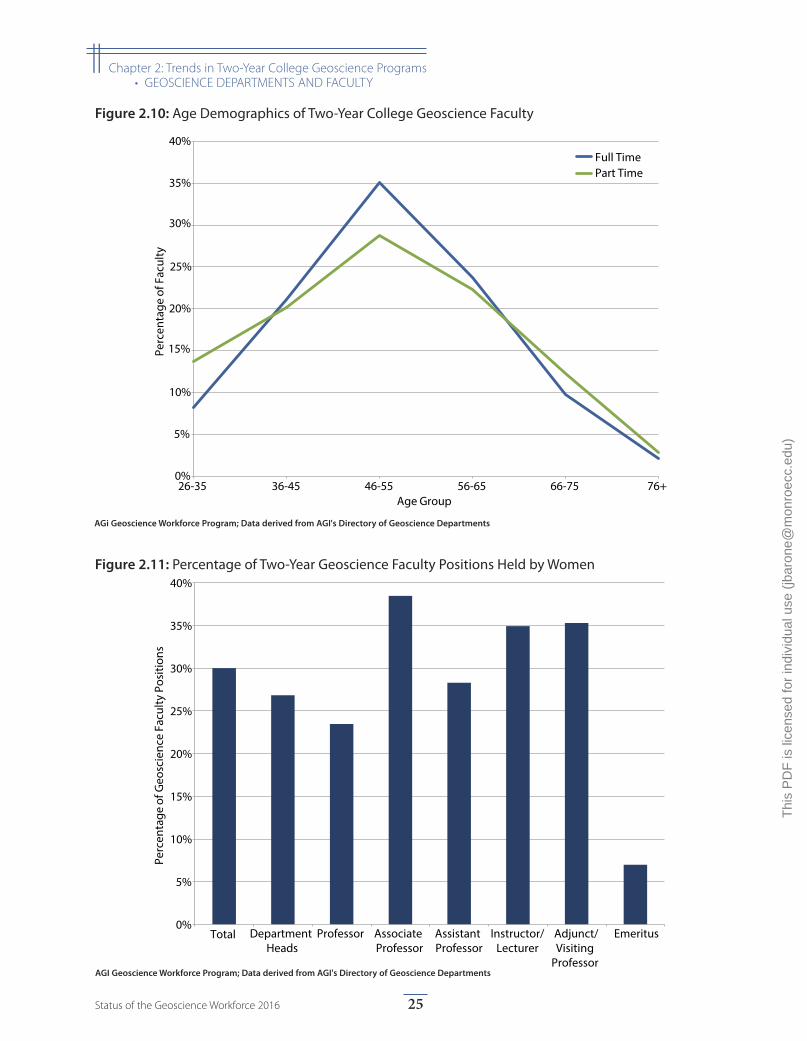
the 329 two-year colleges with geosciences, 79% have less than 5 faculty members that teach geoscience coursework and 38% have only one faculty member to represent the geosciences (Figure 2.9). Approximately 39% of the geosci-ence faculty teaching at two-year colleges is working part-time at these institutions (Figure 2.10). Thirty percent of two-year college geoscience faculty is female, compared to the 19% of four-year university geoscience faculty (Figure 2.11 and 3.4). Both are increases on the percentages pre-sented in the 2014 report. The female faculty population in two-year colleges and four-year universities has been slowly increasing since 2008. The increased percentage of female faculty members at two-year colleges can be seen across Associate Professors, Instructors/Lecturers, Adjunct/Visiting Professors, and Emeritus faculty.
23Status of the Geoscience Workforce 2016
|| Chapter 2: Trends in Two-Year College Geoscience Programs
Thi
s P
DF
is li
cens
ed fo
r in
divi
dual
use
(jb
aron
e@m
onro
ecc.
edu)
State2-Year Colleges
with Geoscience Programs
2-Year Colleges in the State
Percentages of 2-Year Colleges in the State
with Geoscience Programs
California 65 193 34%
Texas 41 125 33%
Illinois 22 65 34%
Washington 21 43 49%
Michigan 14 32 44%
Virginia 13 47 28%
Florida 12 88 14%
New York 12 75 16%
Minnesota 11 33 33%
Arizona 10 35 29%
Table 2.1: Percentage of Two-Year Colleges with Geoscience Programs for Selected States
AGI Geoscience Workforce Program; Data derived from AGI’s Directory of Geoscience Departments database and Carnegie Classification of Institutions of
Higher Education
0
10
20
30
40
50
60
70
80
90
100
0 5 10 15 20 25 30 35
Num
ber o
f Dep
artm
ents
Number of Faculty
Figure 2.9: Number of Faculty per Geoscience Department/Program at Two-Year Colleges
AGI Geoscience Workforce Program; Data derived from AGI's Directory of Geoscience Departments database
24 Status of the Geoscience Workforce 2016
|| Chapter 2: Trends in Two-Year College Geoscience Programs• GEOSCIENCE DEPARTMENTS AND FACULTY
Thi
s P
DF
is li
cens
ed fo
r in
divi
dual
use
(jb
aron
e@m
onro
ecc.
edu)
0%
5%
10%
15%
20%
25%
30%
35%
40%
Total Department Heads
Professor Associate Professor
Assistant Professor
Instructor/Lecturer
Adjunct/Visiting
Professor
Emeritus
Perc
enta
ge o
f Geo
scie
nce
Facu
lty P
ositi
ons
Figure 2.11: Percentage of Two-Year Geoscience Faculty Positions Held by Women
AGI Geoscience Workforce Program; Data derived from AGI's Directory of Geoscience Departments
0%
5%
10%
15%
20%
25%
30%
35%
40%
26-35 36-45 46-55 56-65 66-75 76+
Perc
enta
ge o
f Fac
ulty
Age Group
Full Time Part Time
Figure 2.10: Age Demographics of Two-Year College Geoscience Faculty
AGi Geoscience Workforce Program; Data derived from AGI's Directory of Geoscience Departments
25Status of the Geoscience Workforce 2016
|| Chapter 2: Trends in Two-Year College Geoscience Programs• GEOSCIENCE DEPARTMENTS AND FACULTY
Thi
s P
DF
is li
cens
ed fo
r in
divi
dual
use
(jb
aron
e@m
onro
ecc.
edu)
0%
5%
10%
15%
20%
25%
30%
35%
40%
45%
50%
55%
Computer and Mathematical
Science
Biological, Agricultural and EnvironmentalLife Sciences
Physical and Related Sciences
Social and Related Sciences
Engineering
Perc
enta
ge o
f Deg
ree
Reci
pien
ts
Bachelor’s Master’s Doctorate
Figure 2.12: Four-Year University Graduates by Degree Field Who Attended a Two-Year College, 2013
AGI Geoscience Workforce Program; data derived from NSF's SESTAT 2013 Public Dataset
Geoscience Students
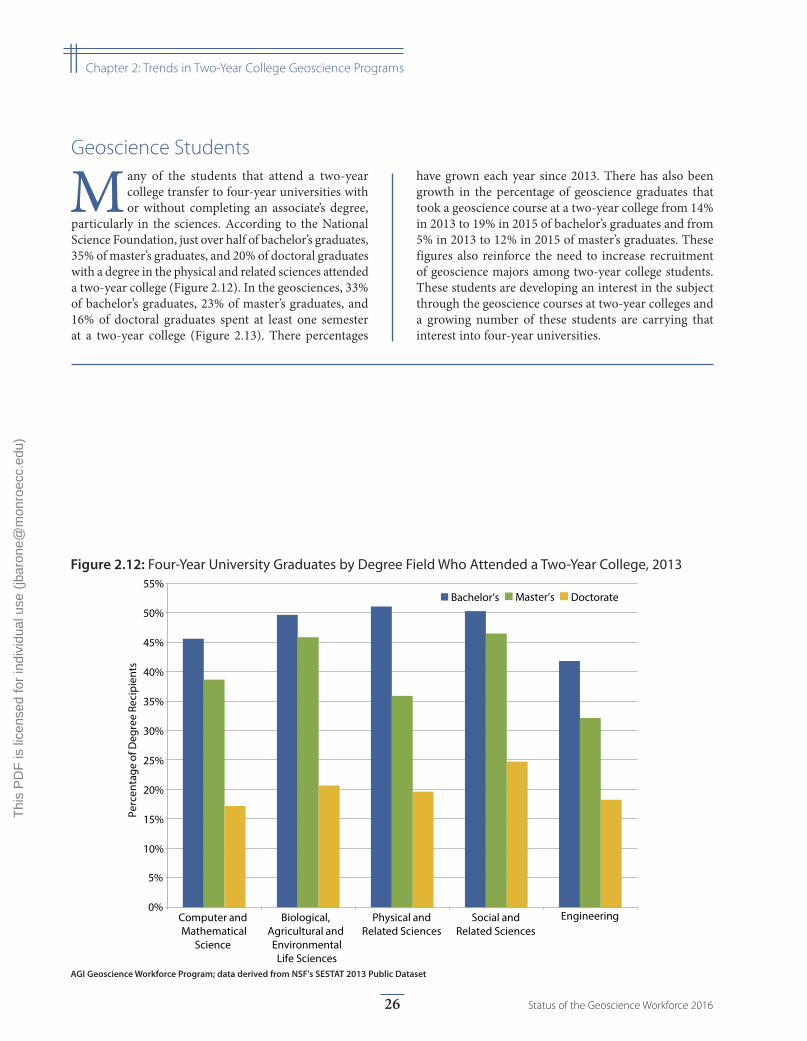
Many of the students that attend a two-year college transfer to four-year universities with or without completing an associate’s degree,
particularly in the sciences. According to the National Science Foundation, just over half of bachelor’s graduates, 35% of master’s graduates, and 20% of doctoral graduates with a degree in the physical and related sciences attended a two-year college (Figure 2.12). In the geosciences, 33% of bachelor’s graduates, 23% of master’s graduates, and 16% of doctoral graduates spent at least one semester at a two-year college (Figure 2.13). There percentages
have grown each year since 2013. There has also been growth in the percentage of geoscience graduates that took a geoscience course at a two-year college from 14% in 2013 to 19% in 2015 of bachelor’s graduates and from 5% in 2013 to 12% in 2015 of master’s graduates. These figures also reinforce the need to increase recruitment of geoscience majors among two-year college students. These students are developing an interest in the subject through the geoscience courses at two-year colleges and a growing number of these students are carrying that interest into four-year universities.
26 Status of the Geoscience Workforce 2016
|| Chapter 2: Trends in Two-Year College Geoscience Programs
Thi
s P
DF
is li
cens
ed fo
r in
divi
dual
use
(jb
aron
e@m
onro
ecc.
edu)
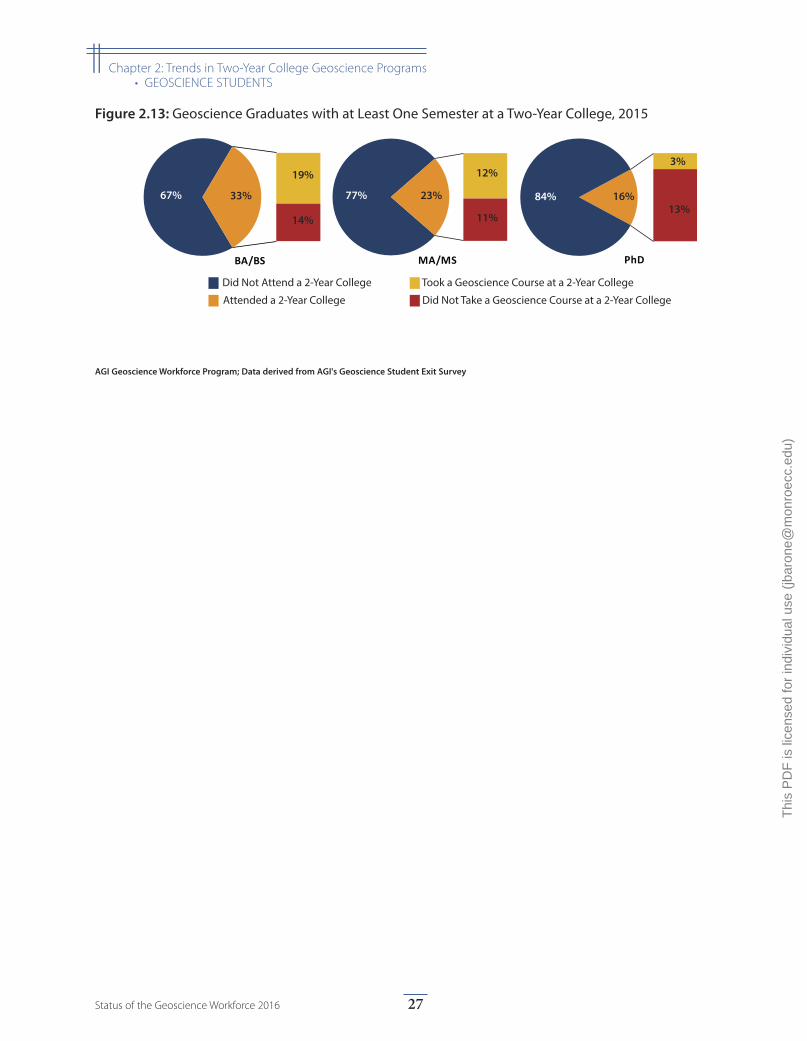
P
Attended a 2-Year College
Did Not Attend a 2-Year College Took a Geoscience Course at a 2-Year College
Did Not Take a Geoscience Course at a 2-Year College
BA/BS MA/MS hD
67%
19%
14%
33% 77%
12%
11%
23% 84%
3%
13%16%
Figure 2.13: Geoscience Graduates with at Least One Semester at a Two-Year College, 2015
AGI Geoscience Workforce Program; Data derived from AGI's Geoscience Student Exit Survey
27Status of the Geoscience Workforce 2016
|| Chapter 2: Trends in Two-Year College Geoscience Programs• GEOSCIENCE STUDENTS
Thi
s P
DF
is li
cens
ed fo
r in
divi
dual
use
(jb
aron
e@m
onro
ecc.
edu)
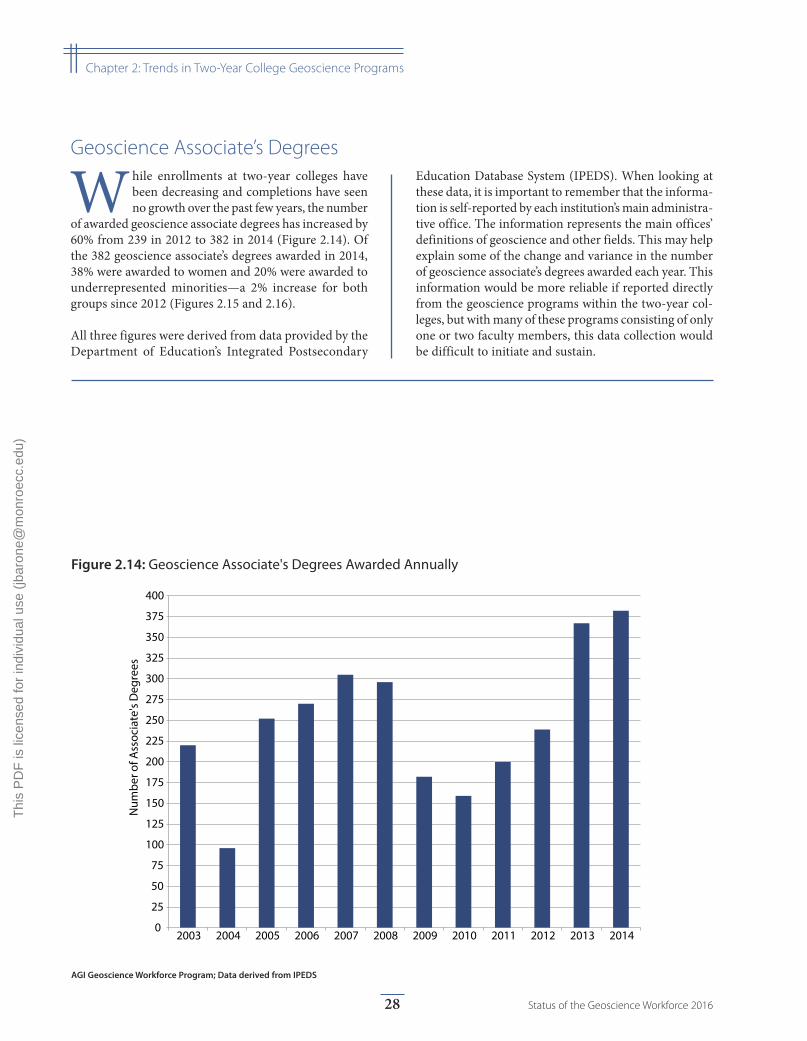
0
25
50
75
100
125
150
175
200
225
250
275
300
325
350
375
400
2003 2004 2005 2006 2007 2008 2009 2010 2011 2012 2013 2014
Num
ber o
f Ass
ocia
te's
Deg
rees
Figure 2.14: Geoscience Associate's Degrees Awarded Annually
AGI Geoscience Workforce Program; Data derived from IPEDS
Geoscience Associate’s Degrees
While enrollments at two-year colleges have been decreasing and completions have seen no growth over the past few years, the number
of awarded geoscience associate degrees has increased by 60% from 239 in 2012 to 382 in 2014 (Figure 2.14). Of the 382 geoscience associate’s degrees awarded in 2014, 38% were awarded to women and 20% were awarded to underrepresented minorities—a 2% increase for both groups since 2012 (Figures 2.15 and 2.16).
All three figures were derived from data provided by the Department of Education’s Integrated Postsecondary
Education Database System (IPEDS). When looking at these data, it is important to remember that the informa-tion is self-reported by each institution’s main administra-tive office. The information represents the main offices’ definitions of geoscience and other fields. This may help explain some of the change and variance in the number of geoscience associate’s degrees awarded each year. This information would be more reliable if reported directly from the geoscience programs within the two-year col-leges, but with many of these programs consisting of only one or two faculty members, this data collection would be difficult to initiate and sustain.
28 Status of the Geoscience Workforce 2016
|| Chapter 2: Trends in Two-Year College Geoscience Programs
Thi
s P
DF
is li
cens
ed fo
r in
divi
dual
use
(jb
aron
e@m
onro
ecc.
edu)
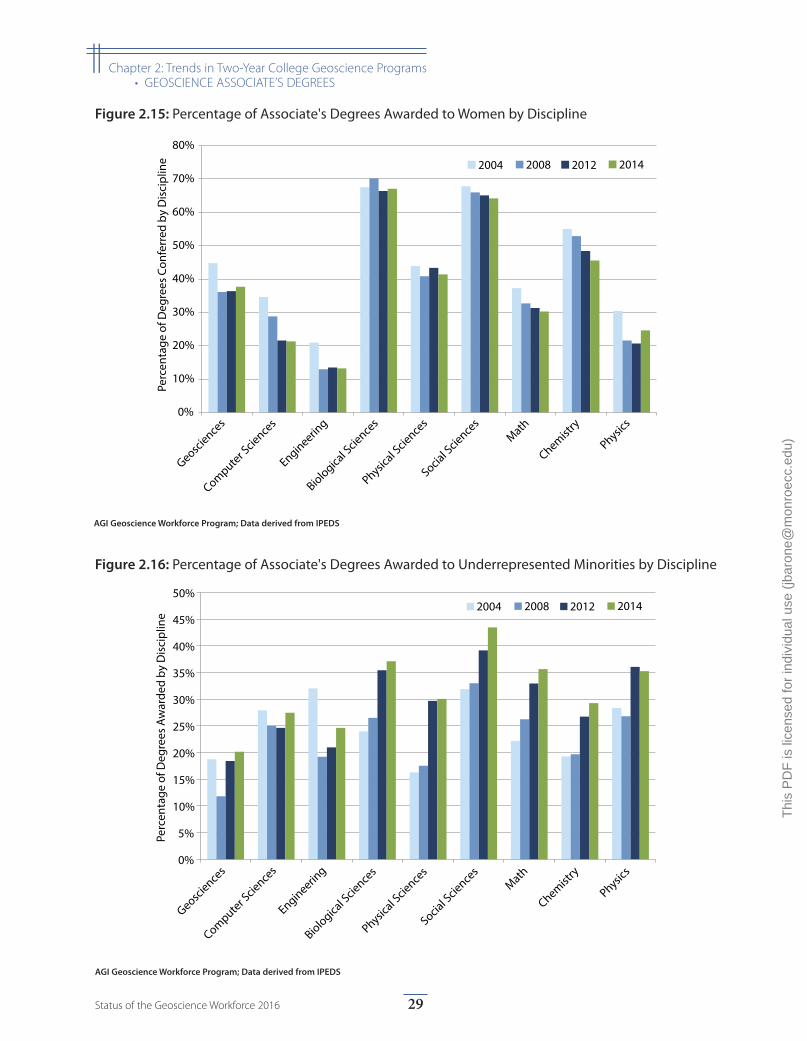
0%
5%
10%
15%
20%
25%
30%
35%
40%
45%
50%
Perc
enta
ge o
f Deg
rees
Aw
arde
d by
Dis
cipl
ine
2004 2008 2012 2014
Geoscience
s
Computer Scie
nces
Engineering
Biological S
cience
s
Physical S
cience
s
Social S
cience
sMath
Chemistry
Physics
Figure 2.16: Percentage of Associate's Degrees Awarded to Underrepresented Minorities by Discipline
AGI Geoscience Workforce Program; Data derived from IPEDS
0%
10%
20%
30%
40%
50%
60%
70%
80%Pe
rcen
tage
of D
egre
es C
onfe
rred
by
Dis
cipl
ine 2004 2008 2012 2014
Geoscience
s
Computer Scie
nces
Engineering
Biological S
cience
s
Physical S
cience
s
Social S
cience
sMath
Chemistry
Physics
Figure 2.15: Percentage of Associate's Degrees Awarded to Women by Discipline
AGI Geoscience Workforce Program; Data derived from IPEDS
29Status of the Geoscience Workforce 2016
|| Chapter 2: Trends in Two-Year College Geoscience Programs• GEOSCIENCE ASSOCIATE’S DEGREES
Thi
s P
DF
is li
cens
ed fo
r in
divi
dual
use
(jb
aron
e@m
onro
ecc.
edu)
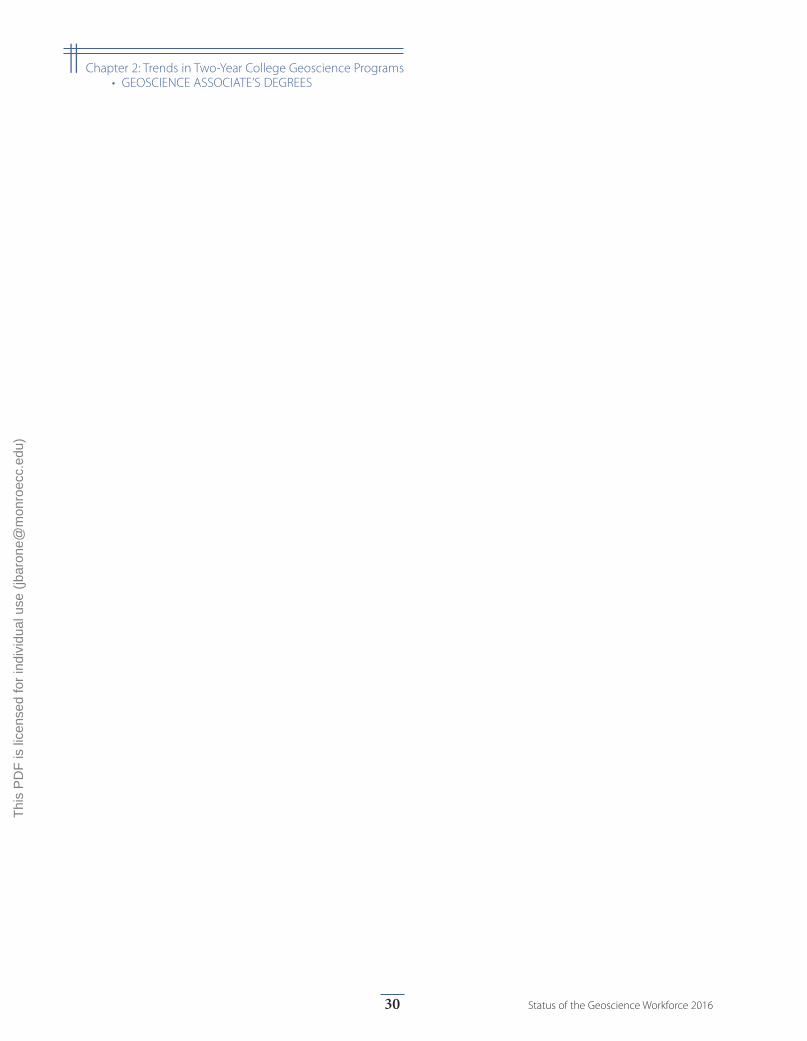
30 Status of the Geoscience Workforce 2016
|| Chapter 2: Trends in Two-Year College Geoscience Programs• GEOSCIENCE ASSOCIATE’S DEGREES
Thi
s P
DF
is li
cens
ed fo
r in
divi
dual
use
(jb
aron
e@m
onro
ecc.
edu)

Chapter 3: Trends in Four-Year Institution Geoscience Programs
A geoscience degree from a four-year institution is essential for developing the necessary knowl-edge and technical skills to be successful in the
workforce as a geoscientist. The master’s degree histori-cally has been considered the degree of employment for private sector jobs in the geosciences, but recently bach-elor recipients are starting to be hired more frequently. Therefore measuring the health of geoscience depart-ments at four-year institutions is essential for tracking the future of the geoscience workforce.
Geoscience faculty at four-year institutions tend to enter tenure-track positions 2-4 years after completing their doctorate, and typically takes approximately 20 years from completion of the doctorate to reach full professor. Since 2013, the number of emeritus faculty has decreased from just over 1,100 faculty members to 1,000 faculty members. Approximately 67% of tenure-track geoscience faculty are above federal retirement age, and 19% of all geoscience faculty are listed as emeritus. The percentages of females in geoscience faculty and researcher positions continue to slowly increase to 19% of the entire geosci-ence workforce at four-year institutions. There has been a steady biennial increase of 1-2% of women in faculty positions since 2008 at the various ranks in the academic workforce, and this trend is expected to continue due to the relatively high percentage of women currently in assistant professor positions.
Over the past few years, four- year institutions have seen little to no growth in enrollments and degrees granted, which hints at some sort of economic or national issue that may be affecting the participation in postsecondary education. The same trend has been seen at two-year colleges as well. However, in the geosciences, undergradu-ate enrollments continue to rise and awarded degrees to bachelors and masters graduates have increased as well. Geoscience departments did not seem to be impacted by the complication affecting overall enrollments and completions in postsecondary education. Instead, histori-cally, geoscience enrollments tend to follow the economic trends of the geosciences, and while the oil and gas indus-try has been experiencing an economic downturn over the past couple of years, the environmental and mining indus-try have grown in their recruitment of recent graduates into employment. Some of the growth in enrollments can be attributed to an increase in the development of online degree programs for the geosciences at four-year institu-tions. It is not yet clear how these programs will affect the supply of graduates to the workforce, and research is needed to consider the impact of these programs.
Enrollments in graduate programs have been hovering around 10,000 students for the past thirty years indicat-ing that these programs have been at capacity for some time now.
Female enrollments in the geosciences appear to have been on the decline since 2003 even while total enroll-ments have increased and the participation of women at four-year institutions is consistently around 57%. Even though there appears to be a decrease in the percentage of women in geoscience degree programs, the actual number of females enrollments has been increasing, just not as fast as male enrollments. Students from underrep-resented minorities are harder to track through enroll-ments; however data collection efforts by AGI and NSF provide a better understanding of the graduation rates of minorities with geoscience degrees. The bachelor’s degree completions of underrepresented minorities in the geosci-ences have been slowly increasing over the past few years reaching approximately 11% in 2015, but this increase can be almost solely attributed to an increase in the participa-tion of Hispanic students in geoscience departments. The geosciences still tend to have the lowest participation rates from underrepresented minorities compared to all science disciplines according to NSF. While there are currently many efforts aimed at increasing the underrepresented population of students on the geosciences, there may also need to be more focus on encouraging women to major in the geosciences. An alternate consideration for the recruitment of diverse populations into the geosci-ences may be through a concerted effort of recruitment of first generation college students. A large majority of geoscience graduates had at least one parent or guardian with a postsecondary degree, while 10-13% of graduates were first generation college students. First generation college students also tend to be from lower socioeconomic categories and could benefit from the help and funding provided for recruitment of new majors.
Nearly every geoscience student participates in a field experience, whether it is field camp, a field course, or a field component during a trip or outing. Field camp attendance reached a peak in number of students partici-pating in 2014 with a decrease in participation in 2015. Field camps seem to be at capacity, but it is still strongly encouraged or required for participation. Field camp access may become a limiting factor for some graduate’s employability. AGI has noted field camps sponsored by departments with open and closed enrollment in the Directory of Geoscience Departments in order to help students locate and participate in field camp.
31Status of the Geoscience Workforce 2016
Thi
s P
DF
is li
cens
ed fo
r in
divi
dual
use
(jb
aron
e@m
onro
ecc.
edu)
Field experiences and research experiences are highly encouraged, or required, activities for geoscience stu-dents at all degree levels, but student internships do not seem to be as emphasized within geosciences programs, as seen by the low participation rates, particularly at the bachelor’s and doctoral degree levels. Approximately 60% of master’s graduates participated in at least one intern-ship, and all students that participate in an internship find the activity very important for their academic and professional development. Discussions with industry representatives have highlighted the need for more stu-dents to gain professional skills through activities, such
as internships, before entering the workforce because that experience is critical to be successful in the geosci-ence workforce.
Much of the data presented in this report on geoscience students at four-year institutions originated from AGI’s Geoscience Student Exit Survey. This study was developed to understand the preparation of students for entering the workforce and their immediate plans after graduation. The annual reports, with more in depth analysis of the results, can be found at http://www.americangeosciences.org/workforce/reports.
32 Status of the Geoscience Workforce 2016
|| Chapter 3: Trends in Four-Year Institution Geoscience Programs
Thi
s P
DF
is li
cens
ed fo
r in
divi
dual
use
(jb
aron
e@m
onro
ecc.
edu)
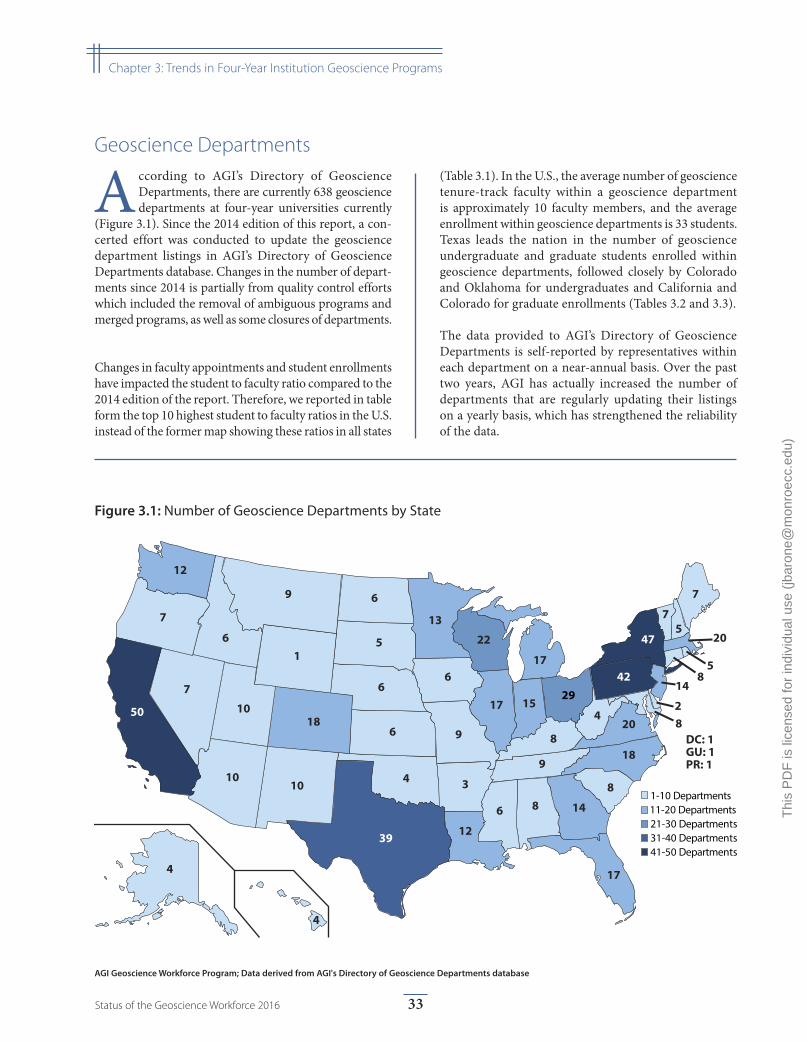
50
47
42
39
29
2022
17
20
18
17
17
1815
14
14
12
13
12
9
10
10
10
8
8
9
8
9
8
8
7
7
6
7
6
6
6
676
5
4
5
4
3
4
5
4
DC: 1
2
1
GU: 1PR: 1
1-10 Departments11-20 Departments21-30 Departments31-40 Departments41-50 Departments
50
47
42
39
29
2022
17
20
18
17
17
1815
14
14
12
13
12
9
10
10
10
8
8
9
8
9
8
8
7
7
6
7
6
6
6
676
5
4
5
4
3
4
5
4
DC: 1
2
1
GU: 1PR: 1
1-10 Departments11-20 Departments21-30 Departments31-40 Departments41-50 Departments
Figure 3.1: Number of Geoscience Departments by State
AGI Geoscience Workforce Program; Data derived from AGI's Directory of Geoscience Departments database
Geoscience Departments
According to AGI’s Directory of Geoscience Departments, there are currently 638 geoscience departments at four-year universities currently
(Figure 3.1). Since the 2014 edition of this report, a con-certed effort was conducted to update the geoscience department listings in AGI’s Directory of Geoscience Departments database. Changes in the number of depart-ments since 2014 is partially from quality control efforts which included the removal of ambiguous programs and merged programs, as well as some closures of departments.
Changes in faculty appointments and student enrollments have impacted the student to faculty ratio compared to the 2014 edition of the report. Therefore, we reported in table form the top 10 highest student to faculty ratios in the U.S. instead of the former map showing these ratios in all states
(Table 3.1). In the U.S., the average number of geoscience tenure-track faculty within a geoscience department is approximately 10 faculty members, and the average enrollment within geoscience departments is 33 students. Texas leads the nation in the number of geoscience undergraduate and graduate students enrolled within geoscience departments, followed closely by Colorado and Oklahoma for undergraduates and California and Colorado for graduate enrollments (Tables 3.2 and 3.3).
The data provided to AGI’s Directory of Geoscience Departments is self-reported by representatives within each department on a near-annual basis. Over the past two years, AGI has actually increased the number of departments that are regularly updating their listings on a yearly basis, which has strengthened the reliability of the data.
33Status of the Geoscience Workforce 2016
|| Chapter 3: Trends in Four-Year Institution Geoscience Programs
Thi
s P
DF
is li
cens
ed fo
r in
divi
dual
use
(jb
aron
e@m
onro
ecc.
edu)
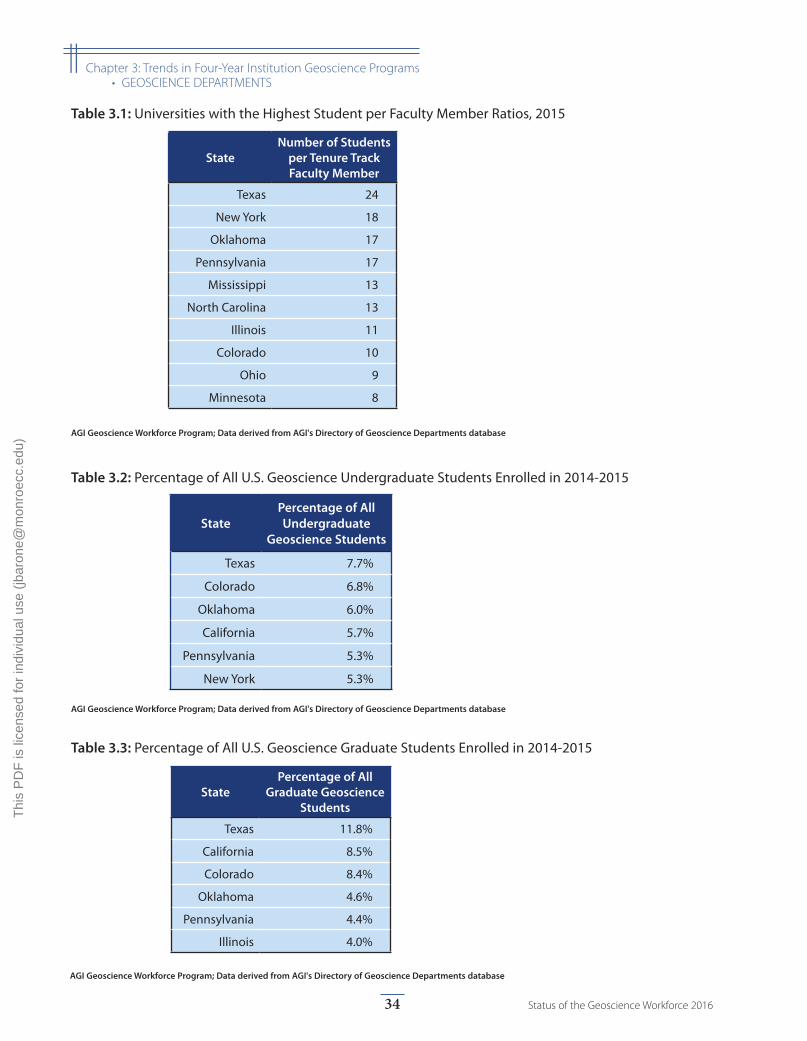
StatePercentage of All Undergraduate
Geoscience Students
Texas 7.7%
Colorado 6.8%
Oklahoma 6.0%
California 5.7%
Pennsylvania 5.3%
New York 5.3%
Table 3.2: Percentage of All U.S. Geoscience Undergraduate Students Enrolled in 2014-2015
AGI Geoscience Workforce Program; Data derived from AGI's Directory of Geoscience Departments database
StateNumber of Students
per Tenure Track Faculty Member
Texas 24
New York 18
Oklahoma 17
Pennsylvania 17
Mississippi 13
North Carolina 13
Illinois 11
Colorado 10
Ohio 9
Minnesota 8
Table 3.1: Universities with the Highest Student per Faculty Member Ratios, 2015
AGI Geoscience Workforce Program; Data derived from AGI's Directory of Geoscience Departments database
StatePercentage of All
Graduate Geoscience Students
Texas 11.8%
California 8.5%
Colorado 8.4%
Oklahoma 4.6%
Pennsylvania 4.4%
Illinois 4.0%
Table 3.3: Percentage of All U.S. Geoscience Graduate Students Enrolled in 2014-2015
AGI Geoscience Workforce Program; Data derived from AGI's Directory of Geoscience Departments database
34 Status of the Geoscience Workforce 2016
|| Chapter 3: Trends in Four-Year Institution Geoscience Programs• GEOSCIENCE DEPARTMENTS
Thi
s P
DF
is li
cens
ed fo
r in
divi
dual
use
(jb
aron
e@m
onro
ecc.
edu)
Geoscience Faculty
In 2015, there were 10,048 geoscience faculty and researchers employed in U.S. geoscience departments at four-year universities, compared to 10,265 in 2014,
10,213 in 2011 and 10,051 in 2008. Approximately 72% of the geoscience faculty is tenured and 15% are untenured but in tenure-track positions (Figure 3.2).
The age distribution of geoscience faculty has shifted to an average age of 58 years old in 2015. The ages of the majority of faculty ranked as professor remained steady at 61-65 years of age since 2014 (Figure 3.3). There was also an increase in the number of assistant professors from 1,125 faculty members in 2013 to 1,142 faculty members in 2015 indicating a small increase in hiring for tenure-track positions at four-year universities over the past two years. The number of emeritus faculty has decreased to 1,000 people, compared to 1,160 people in 2014.
The overall percentage of women in geoscience faculty positions at four-year universities continues to slowly rise from 17% in 2013 to 19% in 2015. This percentage in women geoscience faculty has been consistently increasing since 2008. This increase is also seen among all the dif-ferent ranks given to faculty. The assistant professor and instructor/lecturer positions continue to have the highest percentage of women faculty members (Figure 3.4).
According to AGI’s GeoRef database, over the past several decades, there has been a 128% increase in the number of publications produced in geology, from 161,506 in the 1970’s to 368,885 in the 2000-2013 (Figure 3.5). There have been rapid increases in the number of publications in the environmental geology, quaternary geology, geo-physics, and economic geology subject areas in particular. In the past few decades, economic geology had the high-est number of publications, but recently environmental geology rapidly grew in the past decade to the highest number of publications. Publication rates within journals sponsored by geoscience societies show increases in the number of articles published in the atmospheric sciences, space physics, and climatology in particular (Figure 3.6). However, in 2015, there was a decrease in the annual number of publications in atmospheric sciences published in JGR Atmospheres.
Since 1999, there has been a slight increase in the number of faculty specializing in other geoscience fields, such as the atmospheric sciences, earth science education, and geographic information systems fields (Figure 3.7). Some of these fields within the “other” category may need to be moved out of this category as some of these areas become more popular specializations.
35Status of the Geoscience Workforce 2016
|| Chapter 3: Trends in Four-Year Institution Geoscience Programs
Thi
s P
DF
is li
cens
ed fo
r in
divi
dual
use
(jb
aron
e@m
onro
ecc.
edu)
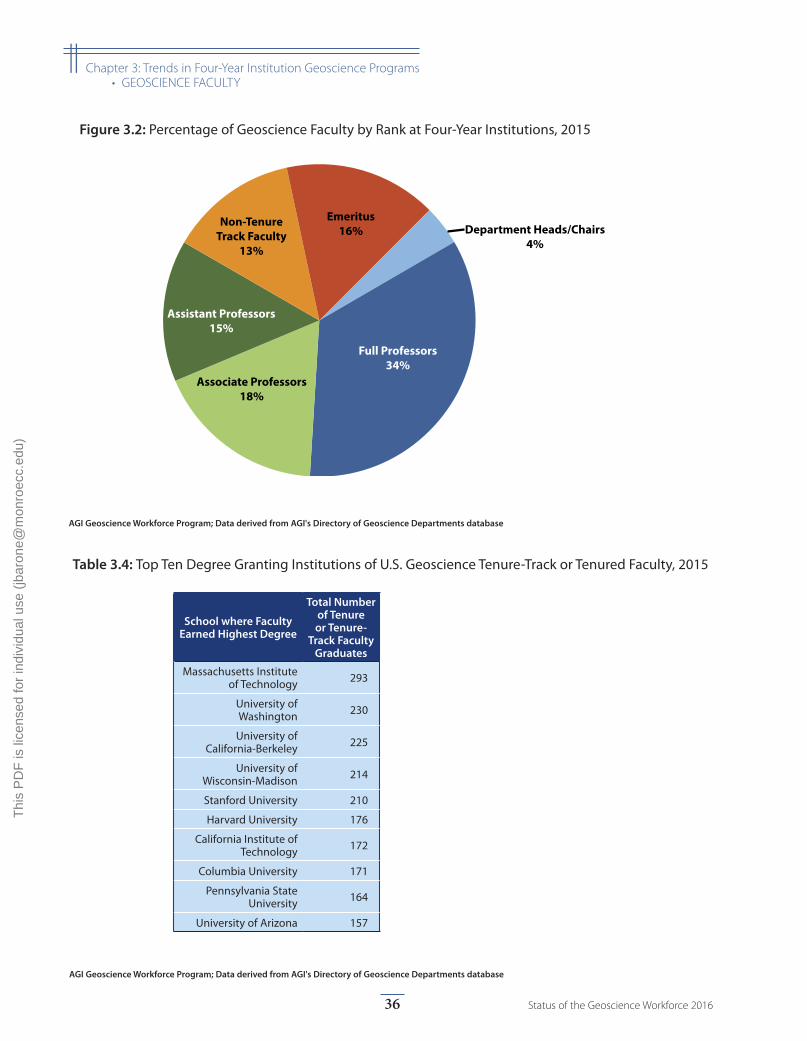
Full Professors34%
Associate Professors18%
Assistant Professors15%
Non-TenureTrack Faculty
13%
Emeritus16% Department Heads/Chairs
4%
Figure 3.2: Percentage of Geoscience Faculty by Rank at Four-Year Institutions, 2015
School where Faculty Earned Highest Degree
Total Number of Tenure or Tenure-
Track Faculty Graduates
Massachusetts Institute of Technology 293
University of Washington 230
University of California-Berkeley 225
University of Wisconsin-Madison 214
Stanford University 210
Harvard University 176
California Institute of Technology 172
Columbia University 171
Pennsylvania State University 164
University of Arizona 157
Table 3.4: Top Ten Degree Granting Institutions of U.S. Geoscience Tenure-Track or Tenured Faculty, 2015
AGI Geoscience Workforce Program; Data derived from AGI's Directory of Geoscience Departments database
AGI Geoscience Workforce Program; Data derived from AGI's Directory of Geoscience Departments database
36 Status of the Geoscience Workforce 2016
|| Chapter 3: Trends in Four-Year Institution Geoscience Programs• GEOSCIENCE FACULTY
Thi
s P
DF
is li
cens
ed fo
r in
divi
dual
use
(jb
aron
e@m
onro
ecc.
edu)
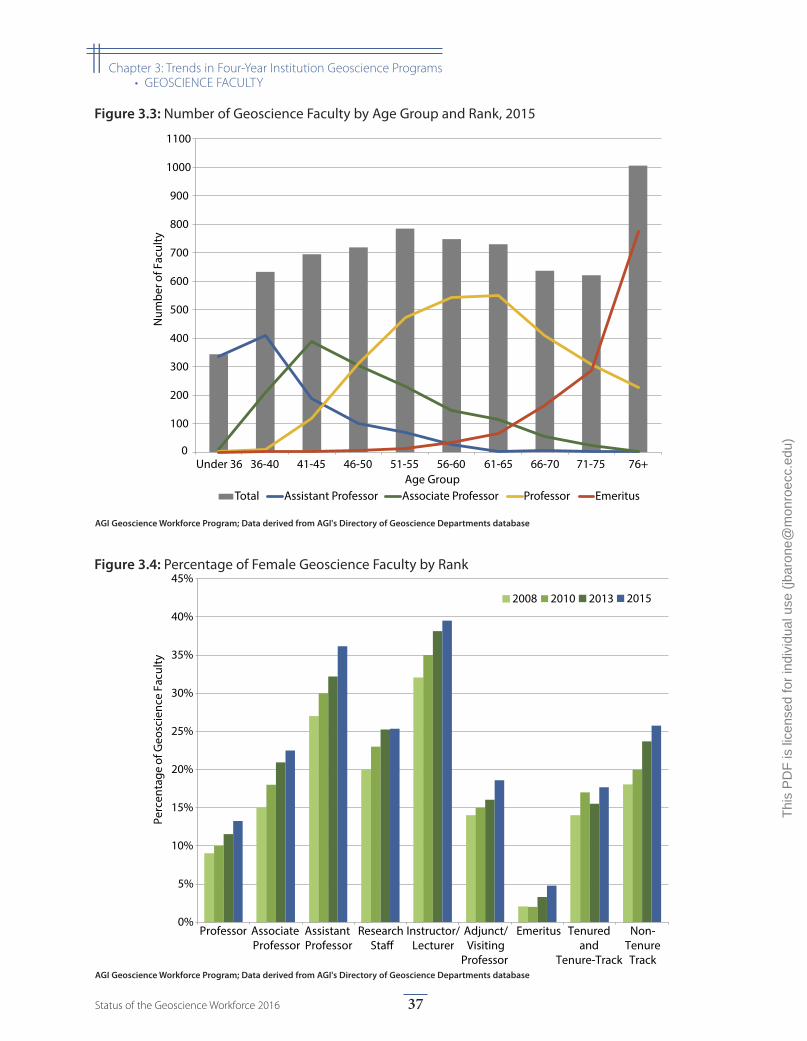
0
100
200
300
400
500
600
700
800
900
1000
1100
Under 36 36-40 41-45 46-50 51-55 56-60 61-65 66-70 71-75 76+
Num
ber o
f Fac
ulty
Age Group
Total Assistant Professor Associate Professor Professor Emeritus
Figure 3.3: Number of Geoscience Faculty by Age Group and Rank, 2015
AGI Geoscience Workforce Program; Data derived from AGI's Directory of Geoscience Departments database
0%
5%
10%
15%
20%
25%
30%
35%
40%
45%
Professor Associate Professor
Assistant Professor
Research Sta�
Instructor/Lecturer
Adjunct/Visiting
Professor
Emeritus Tenured and
Tenure-Track
Non-TenureTrack
Perc
enta
ge o
f Geo
scie
nce
Facu
lty
2008 2010 2013 2015
Figure 3.4: Percentage of Female Geoscience Faculty by Rank
AGI Geoscience Workforce Program; Data derived from AGI's Directory of Geoscience Departments database
37Status of the Geoscience Workforce 2016
|| Chapter 3: Trends in Four-Year Institution Geoscience Programs• GEOSCIENCE FACULTY
Thi
s P
DF
is li
cens
ed fo
r in
divi
dual
use
(jb
aron
e@m
onro
ecc.
edu)
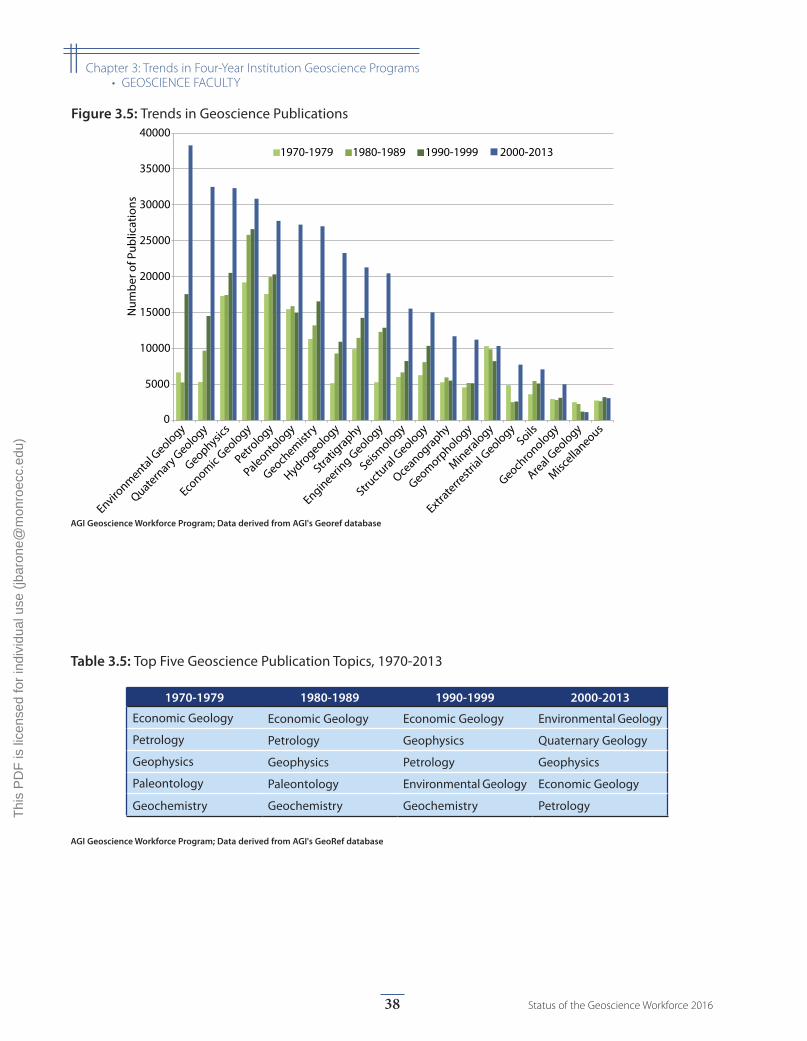
1970-1979 1980-1989 1990-1999 2000-2013
Economic Geology Economic Geology Economic Geology Environmental Geology
Petrology Petrology Geophysics Quaternary Geology
Geophysics Geophysics Petrology Geophysics
Paleontology Paleontology Environmental Geology Economic Geology
Geochemistry Geochemistry Geochemistry Petrology
1970-1979 1980-1989 1990-1999 2000-2013
Economic Geology
Economic Geology
Economic Geology
Environmental Geology
Petrology Petrology Geophysics Quaternary Geology
Geophysics Geophysics Petrology Geophysics
Paleontology Paleontology Environmental Geology
Economic Geology
Geochemistry Geochemistry Geochemistry Petrology
Table 3.5: Top Five Geoscience Publication Topics, 1970-2013
AGI Geoscience Workforce Program; Data derived from AGI's GeoRef database
0
5000
10000
15000
20000
25000
30000
35000
40000N
umbe
r of P
ublic
atio
ns
1970-1979 1980-1989 1990-1999 2000-2013
Environmental G
eology
Quaternary G
eology
Geophysics
Economic
Geology
Petrology
Paleontology
Geochemist
ry
Hydrogeology
Stratig
raphy
Engineering G
eology
Seismology
Structu
ral Geology
Oceanography
Geomorphology
Mineralogy
Extraterre
strial G
eologySoils
Geochro
nology
Areal Geology
Miscella
neous
Figure 3.5: Trends in Geoscience Publications
AGI Geoscience Workforce Program; Data derived from AGI's Georef database
38 Status of the Geoscience Workforce 2016
|| Chapter 3: Trends in Four-Year Institution Geoscience Programs• GEOSCIENCE FACULTY
Thi
s P
DF
is li
cens
ed fo
r in
divi
dual
use
(jb
aron
e@m
onro
ecc.
edu)
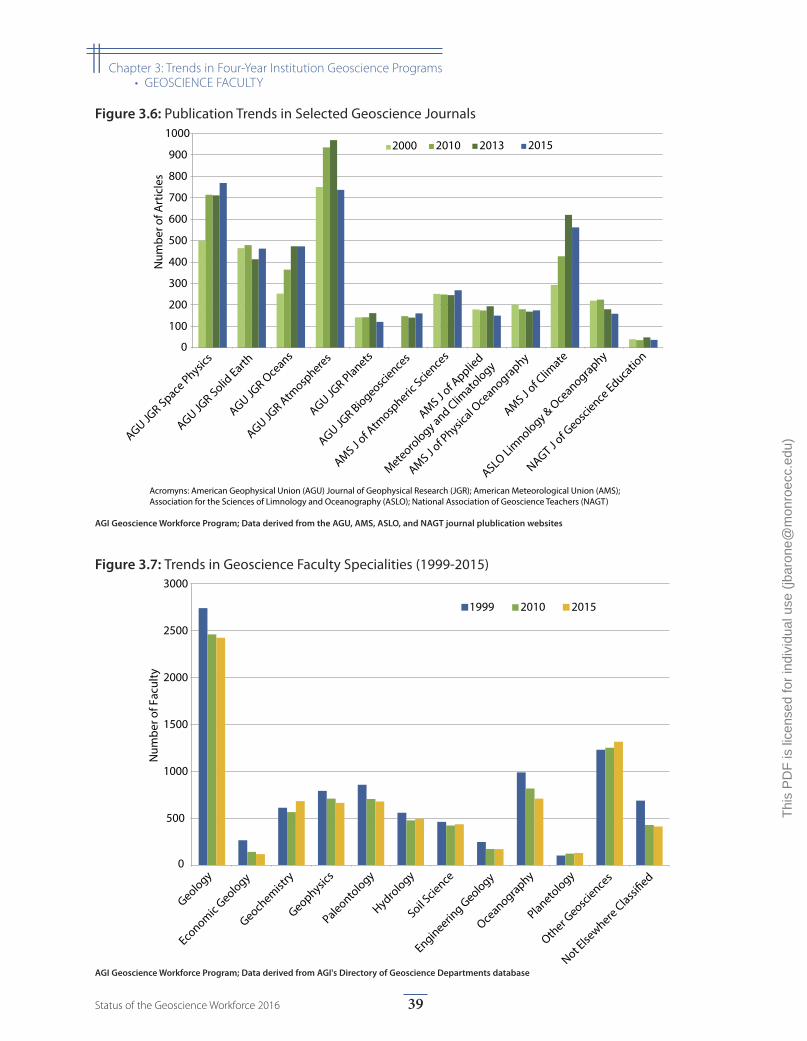
0
500
1000
1500
2000
2500
3000
Geology
Economic
Geology
Geochemist
ry
Geophysics
Paleontology
Hydrology
Soil Scie
nce
Engineering Geology
Oceanography
Planetology
Other G
eoscience
s
Not Else
where Classi�ed
Num
ber o
f Fac
ulty
1999 2010 2015
Figure 3.7: Trends in Geoscience Faculty Specialities (1999-2015)
AGI Geoscience Workforce Program; Data derived from AGI's Directory of Geoscience Departments database
0
100
200
300
400
500
600
700
800
900
1000
AGU JGR Space
Physics
AGU JGR Solid
Earth
AGU JGR O
ceans
AGU JGR Atm
ospheres
AGU JGR Planets
AGU JGR Biogeosci
ences
AMS J of A
tmosp
heric Scie
nces
AMS J of A
pplied
Meteorology and Clim
atology
AMS J of P
hysical O
ceanography
AMS J of C
limate
ASLO Limnology & O
ceanography
NAGT J of G
eoscience
Educatio
n
Num
ber o
f Art
icle
s2000 2010 2013 2015
Acromyns: American Geophysical Union (AGU) Journal of Geophysical Research (JGR); American Meteorological Union (AMS); Association for the Sciences of Limnology and Oceanography (ASLO); National Association of Geoscience Teachers (NAGT)
Figure 3.6: Publication Trends in Selected Geoscience Journals
AGI Geoscience Workforce Program; Data derived from the AGU, AMS, ASLO, and NAGT journal plublication websites
39Status of the Geoscience Workforce 2016
|| Chapter 3: Trends in Four-Year Institution Geoscience Programs• GEOSCIENCE FACULTY
Thi
s P
DF
is li
cens
ed fo
r in
divi
dual
use
(jb
aron
e@m
onro
ecc.
edu)
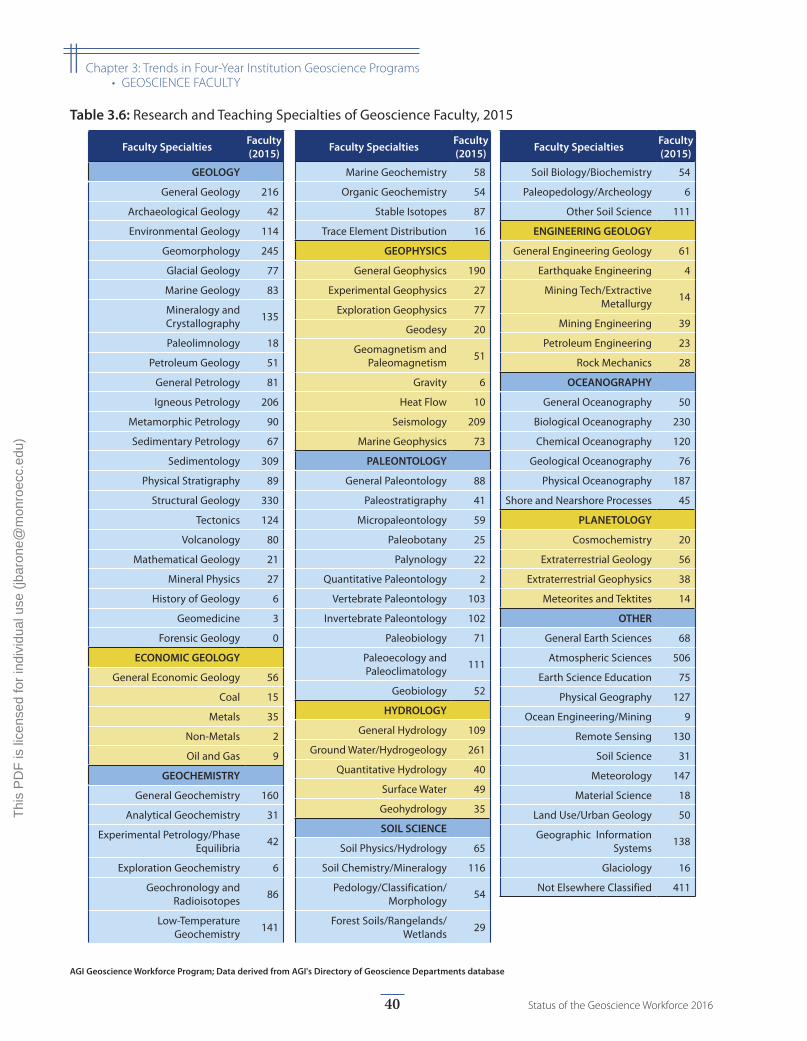
Faculty Specialties Faculty (2015)
GEOLOGY
General Geology 216
Archaeological Geology 42
Environmental Geology 114
Geomorphology 245
Glacial Geology 77
Marine Geology 83
Mineralogy and Crystallography 135
Paleolimnology 18
Petroleum Geology 51
General Petrology 81
Igneous Petrology 206
Metamorphic Petrology 90
Sedimentary Petrology 67
Sedimentology 309
Physical Stratigraphy 89
Structural Geology 330
Tectonics 124
Volcanology 80
Mathematical Geology 21
Mineral Physics 27
History of Geology 6
Geomedicine 3
Forensic Geology 0
ECONOMIC GEOLOGY
General Economic Geology 56
Coal 15
Metals 35
Non-Metals 2
Oil and Gas 9
GEOCHEMISTRY
General Geochemistry 160
Analytical Geochemistry 31
Experimental Petrology/Phase Equilibria 42
Exploration Geochemistry 6
Geochronology and Radioisotopes 86
Low-Temperature Geochemistry 141
Faculty Specialties Faculty (2015)
Marine Geochemistry 58
Organic Geochemistry 54
Stable Isotopes 87
Trace Element Distribution 16
GEOPHYSICS
General Geophysics 190
Experimental Geophysics 27
Exploration Geophysics 77
Geodesy 20
Geomagnetism and Paleomagnetism 51
Gravity 6
Heat Flow 10
Seismology 209
Marine Geophysics 73
PALEONTOLOGY
General Paleontology 88
Paleostratigraphy 41
Micropaleontology 59
Paleobotany 25
Palynology 22
Quantitative Paleontology 2
Vertebrate Paleontology 103
Invertebrate Paleontology 102
Paleobiology 71
Paleoecology and Paleoclimatology 111
Geobiology 52
HYDROLOGY
General Hydrology 109
Ground Water/Hydrogeology 261
Quantitative Hydrology 40
Surface Water 49
Geohydrology 35
SOIL SCIENCE
Soil Physics/Hydrology 65
Soil Chemistry/Mineralogy 116
Pedology/Classification/Morphology 54
Forest Soils/Rangelands/Wetlands 29
Faculty Specialties Faculty (2015)
Soil Biology/Biochemistry 54
Paleopedology/Archeology 6
Other Soil Science 111
ENGINEERING GEOLOGY
General Engineering Geology 61
Earthquake Engineering 4
Mining Tech/Extractive Metallurgy 14
Mining Engineering 39
Petroleum Engineering 23
Rock Mechanics 28
OCEANOGRAPHY
General Oceanography 50
Biological Oceanography 230
Chemical Oceanography 120
Geological Oceanography 76
Physical Oceanography 187
Shore and Nearshore Processes 45
PLANETOLOGY
Cosmochemistry 20
Extraterrestrial Geology 56
Extraterrestrial Geophysics 38
Meteorites and Tektites 14
OTHER
General Earth Sciences 68
Atmospheric Sciences 506
Earth Science Education 75
Physical Geography 127
Ocean Engineering/Mining 9
Remote Sensing 130
Soil Science 31
Meteorology 147
Material Science 18
Land Use/Urban Geology 50
Geographic Information Systems 138
Glaciology 16
Not Elsewhere Classified 411
Table 3.6: Research and Teaching Specialties of Geoscience Faculty, 2015
AGI Geoscience Workforce Program; Data derived from AGI's Directory of Geoscience Departments database
40 Status of the Geoscience Workforce 2016
|| Chapter 3: Trends in Four-Year Institution Geoscience Programs• GEOSCIENCE FACULTY
Thi
s P
DF
is li
cens
ed fo
r in
divi
dual
use
(jb
aron
e@m
onro
ecc.
edu)
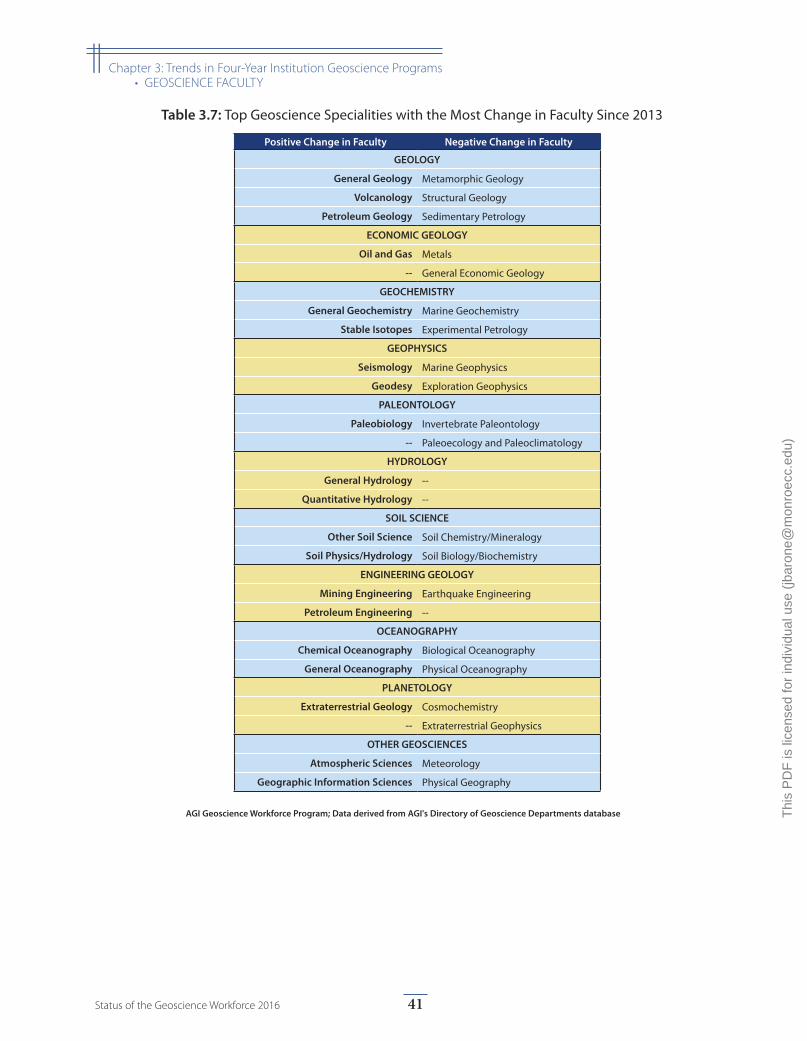
Positive Change in Faculty Negative Change in Faculty
GEOLOGY
General Geology Metamorphic Geology
Volcanology Structural Geology
Petroleum Geology Sedimentary Petrology
ECONOMIC GEOLOGY
Oil and Gas Metals
-- General Economic Geology
GEOCHEMISTRY
General Geochemistry Marine Geochemistry
Stable Isotopes Experimental Petrology
GEOPHYSICS
Seismology Marine Geophysics
Geodesy Exploration Geophysics
PALEONTOLOGY
Paleobiology Invertebrate Paleontology
-- P a l e o e c o l o g y a n d Paleoclimatology
HYDROLOGY
General Hydrology --
Quantitative Hydrology --
SOIL SCIENCE
Other Soil Science Soil Chemistry/Mineralogy
Soil Physics/Hydrology Soil Biology/Biochemistry
ENGINEERING GEOLOGY
Mining Engineering Earthquake Engineering
Petroleum Engineering --
OCEANOGRAPHY
Chemical Oceanography Biological Oceanography
General Oceanography Physical Oceanography
PLANETOLOGY
Extraterrestrial Geology Cosmochemistry
-- Extraterrestrial Geophysics
OTHER GEOSCIENCES
Atmospheric Sciences Meteorology
Geographic Information Sciences Physical Geography
Positive Change in Faculty Negative Change in Faculty
GEOLOGY
General Geology Metamorphic Geology
Volcanology Structural Geology
Petroleum Geology Sedimentary Petrology
ECONOMIC GEOLOGY
Oil and Gas Metals
-- General Economic Geology
GEOCHEMISTRY
General Geochemistry Marine Geochemistry
Stable Isotopes Experimental Petrology
GEOPHYSICS
Seismology Marine Geophysics
Geodesy Exploration Geophysics
PALEONTOLOGY
Paleobiology Invertebrate Paleontology
-- Paleoecology and Paleoclimatology
HYDROLOGY
General Hydrology --
Quantitative Hydrology --
SOIL SCIENCE
Other Soil Science Soil Chemistry/Mineralogy
Soil Physics/Hydrology Soil Biology/Biochemistry
ENGINEERING GEOLOGY
Mining Engineering Earthquake Engineering
Petroleum Engineering --
OCEANOGRAPHY
Chemical Oceanography Biological Oceanography
General Oceanography Physical Oceanography
PLANETOLOGY
Extraterrestrial Geology Cosmochemistry
-- Extraterrestrial Geophysics
OTHER GEOSCIENCES
Atmospheric Sciences Meteorology
Geographic Information Sciences Physical Geography
Table 3.7: Top Geoscience Specialities with the Most Change in Faculty Since 2013
AGI Geoscience Workforce Program; Data derived from AGI's Directory of Geoscience Departments database
41Status of the Geoscience Workforce 2016
|| Chapter 3: Trends in Four-Year Institution Geoscience Programs• GEOSCIENCE FACULTY
Thi
s P
DF
is li
cens
ed fo
r in
divi
dual
use
(jb
aron
e@m
onro
ecc.
edu)
Geoscience University Students
While enrollments at four-year universities increased by 39% between 2001 and 2011 to 13,494,131 students, enrollments changed
very little from 2011 to 2013. This was a similar trend seen in two-year college enrollments, indicating some trend or issue affecting enrollments for postsecondary degrees. While the predicted enrollments at four-year universities trend upwards, this trend may not be accurate because it does not fully take into account the relatively stagnant growth in enrollments over the past few years. Enrollments of female students at four-year universities have hovered at 57% of the total enrollments since 2005. The percentage of women enrolled at four-year uni-versities is about the same as the percentage of women enrolled at two-year colleges. Also as in two-year colleges, the overall percentages of underrepresented minorities enrolled at four-year universities continue to increase. However, the percentage of African Americans enrolled at four-year universities decreased slightly from 14% in 2010 to 13% in 2013.
For the geosciences, undergraduate enrollments were increasing steadily from 2007 to 2015 reaching 31,219 students. While there was a small drop in enrollments in 2013, this general increasing trend in enrollments in 2011 and 2012 go against the near stagnant change in overall enrollments at four-year universities. Whatever is affecting enrollments in postsecondary degrees may not be affecting enrollments into geoscience departments. Graduate enrollments continued to fluctuate around 10,000 students each year. Geoscience degrees awarded for bachelor’s students were trending upward from 2006 -2013, but awarded bachelor’s degrees decreased from 4,146 to 3,629 in 2015. Degrees awarded to master’s stu-dents were at 1,511 in 2012, but from 2013-2015, master’s graduation rates hovered just under 1500. Doctorates awarded hovered between 600-700 students a year, but in 2015, awarded doctorates fell below 600 to 597.
Enrollments in the geosciences among women have continued to decrease, and awarded geoscience degrees to women have fluctuated between 40-45%. The recent increases in enrollments have been largely driven by male students.
Figures 3.14-3.18 show the percentages of science and geoscience degrees awarded to underrepresented minori-ties from three different sources—the National Science Foundation, the Department of Education’s IPEDS database, and AGI’s Geoscience Student Exit Survey. Accurate data on the enrollments and completions of
underrepresented minorities in geoscience degree pro-grams can be difficult to acquire. Figures 3.16-3.18 show the data provided by the Department of Education. Three sources are used because each has slightly differ-ent methods to collect demographic information. The Department of Education IPEDS database contains infor-mation received from the main administrative offices at universities, so their information comes from the forms filled out by the students upon entry into the university and any supplemental data provided by the departments. This can affect the accuracy of the information of race and ethnicity of geoscience graduates, especially since the percentages tend to be fairly low for this group of students. The data collected by the National Science Foundation tends to come from the institutions, much like the Department of Education, and in the case of doctor-ates, the students directly. AGI’s Geoscience Student Exit Survey collects data directly from the recent graduates at the time of their graduation. Also, all three data sets rep-resent data from different years ranging from 2013-2015.
Not surprisingly, the majority of geoscience students are U.S. citizens. Geoscience departments begin to see a larger population of non-permanent residents in gradu-ate programs, particularly doctoral programs, where over a quarter of the graduates are from a different country (Figure 3.19).
Concern has been raised recently about the overall trends of the socioeconomic status of geoscience students, and one way to infer this is through the highest education level of the students’ parents or guardians. In 2015, this ques-tion was added to AGI’s Geoscience Student Exit Survey, and the data is presented in Figure 3.21. In general, most geoscience graduates at all degree levels have at least one parent with a postsecondary degree, and the percentage of graduates with a parent holding a graduate or profes-sional degree increases with the graduate’s degree level. Also, this data indicated 12% of bachelor’s graduates, 10% of master’s graduates, and 13% of doctoral graduates were first generation college students.
While geoscience students at four-year universities are working toward their degrees, nearly 80% of all geosci-ence graduates complete Calculus I, but the percentages of bachelor’s and master’s graduates with experience in higher-level quantitative courses drops dramatically after Calculus II. Students are receiving instruction in chem-istry and physics during their geoscience degrees as well, with 77-90% of graduates at the differing degree-levels taking at least one course in chemistry and approximately
42 Status of the Geoscience Workforce 2016
|| Chapter 3: Trends in Four-Year Institution Geoscience Programs
Thi
s P
DF
is li
cens
ed fo
r in
divi
dual
use
(jb
aron
e@m
onro
ecc.
edu)
90% of all graduates taking calculus or algebra-based physics (Figure 3.22).
In 2015, the majority of graduates at the bachelor’s and master’s degree levels chose to major in the geosciences at some point during their undergraduate education. This trend has also been seen in previous years through AGI’s Geoscience Student Exit Survey, which highlights
the importance of undergraduate geoscience courses as recruitment tools for future majors. Most doctoral graduates in 2015 indicated choosing to major in the geosciences either after receiving an undergraduate degree or during their undergraduate education (Figure 3.23). Figure 3.24 displays the chosen fields for their geoscience degrees in 2015. This figure highlights the varied fields and interests that fall under the geoscience umbrella.
43Status of the Geoscience Workforce 2016
|| Chapter 3: Trends in Four-Year Institution Geoscience Programs• GEOSCIENCE UNIVERSITY STUDENTS
Thi
s P
DF
is li
cens
ed fo
r in
divi
dual
use
(jb
aron
e@m
onro
ecc.
edu)
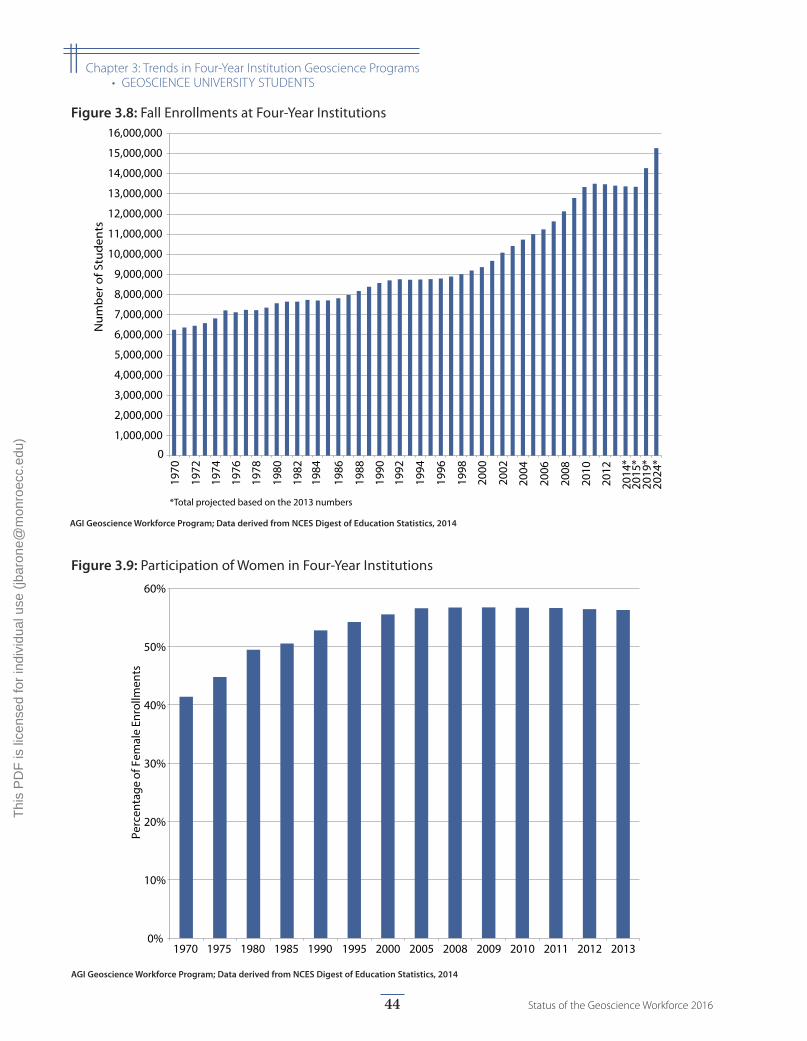
0%
10%
20%
30%
40%
50%
60%
1970 1975 1980 1985 1990 1995 2000 2005 2008 2009 2010 2011 2012 2013
Perc
enta
ge o
f Fem
ale
Enro
llmen
ts
Figure 3.9: Participation of Women in Four-Year Institutions
AGI Geoscience Workforce Program; Data derived from NCES Digest of Education Statistics, 2014
0
1,000,000
2,000,000
3,000,000
4,000,000
5,000,000
6,000,000
7,000,000
8,000,000
9,000,000
10,000,000
11,000,000
12,000,000
13,000,000
14,000,000
15,000,000
16,000,000
1970
1972
1974
1976
1978
1980
1982
1984
1986
1988
1990
1992
1994
1996
1998
2000
2002
2004
2006
2008
2010
2012
2014
*20
15*
2019
*20
24*
Num
ber
of S
tud
ents
*Total projected based on the 2013 numbers
Figure 3.8: Fall Enrollments at Four-Year Institutions
AGI Geoscience Workforce Program; Data derived from NCES Digest of Education Statistics, 2014
44 Status of the Geoscience Workforce 2016
|| Chapter 3: Trends in Four-Year Institution Geoscience Programs• GEOSCIENCE UNIVERSITY STUDENTS
Thi
s P
DF
is li
cens
ed fo
r in
divi
dual
use
(jb
aron
e@m
onro
ecc.
edu)
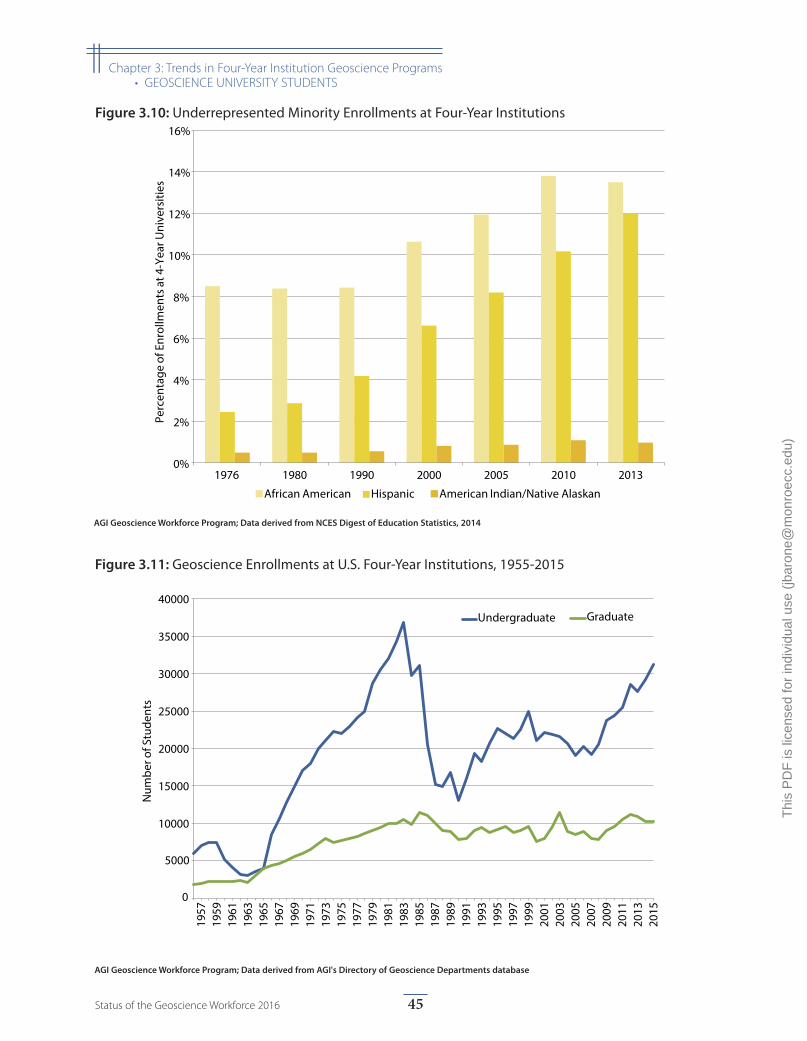
0%
2%
4%
6%
8%
10%
12%
14%
16%
1976 1980 1990 2000 2005 2010 2013
Perc
enta
ge o
f Enr
ollm
ents
at 4
-Yea
r Uni
vers
ities
African American Hispanic American Indian/Native Alaskan
Figure 3.10: Underrepresented Minority Enrollments at Four-Year Institutions
AGI Geoscience Workforce Program; Data derived from NCES Digest of Education Statistics, 2014
0
5000
10000
15000
20000
25000
30000
35000
40000
1957
1959
1961
1963
1965
1967
1969
1971
1973
1975
1977
1979
1981
1983
1985
1987
1989
1991
1993
1995
1997
1999
2001
2003
2005
2007
2009
2011
2013
2015
Num
ber o
f Stu
dent
s
Undergraduate Graduate
Figure 3.11: Geoscience Enrollments at U.S. Four-Year Institutions, 1955-2015
AGI Geoscience Workforce Program; Data derived from AGI's Directory of Geoscience Departments database
45Status of the Geoscience Workforce 2016
|| Chapter 3: Trends in Four-Year Institution Geoscience Programs• GEOSCIENCE UNIVERSITY STUDENTS
Thi
s P
DF
is li
cens
ed fo
r in
divi
dual
use
(jb
aron
e@m
onro
ecc.
edu)
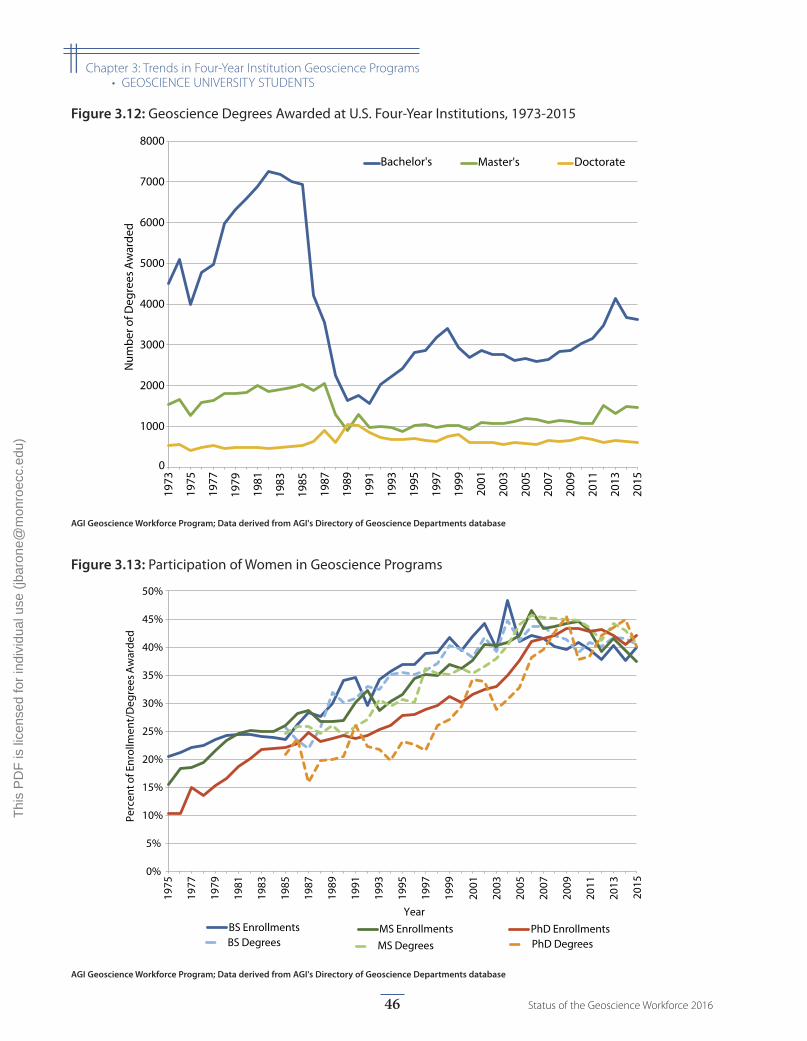
0%
5%
10%
15%
20%
25%
30%
35%
40%
45%
50%
1975
1977
1979
1981
1983
1985
19
87
1989
1991
1993
1995
1997
1999
2001
2003
2005
2007
20
09
2011
2013
2015
Perc
ent o
f Enr
ollm
ent/
Deg
rees
Aw
arde
d
Year
BS EnrollmentsBS Degrees
MS EnrollmentsMS Degrees
PhD EnrollmentsPhD Degrees
Figure 3.13: Participation of Women in Geoscience Programs
AGI Geoscience Workforce Program; Data derived from AGI's Directory of Geoscience Departments database
0
1000
2000
3000
4000
5000
6000
7000
8000
1973
1975
1977
1979
1981
1983
1985
1987
1989
1991
1993
1995
1997
1999
2001
2003
2005
2007
2009
2011
2013
2015
Num
ber o
f Deg
rees
Aw
arde
d
Bachelor's Master's Doctorate
Figure 3.12: Geoscience Degrees Awarded at U.S. Four-Year Institutions, 1973-2015
AGI Geoscience Workforce Program; Data derived from AGI's Directory of Geoscience Departments database
46 Status of the Geoscience Workforce 2016
|| Chapter 3: Trends in Four-Year Institution Geoscience Programs• GEOSCIENCE UNIVERSITY STUDENTS
Thi
s P
DF
is li
cens
ed fo
r in
divi
dual
use
(jb
aron
e@m
onro
ecc.
edu)
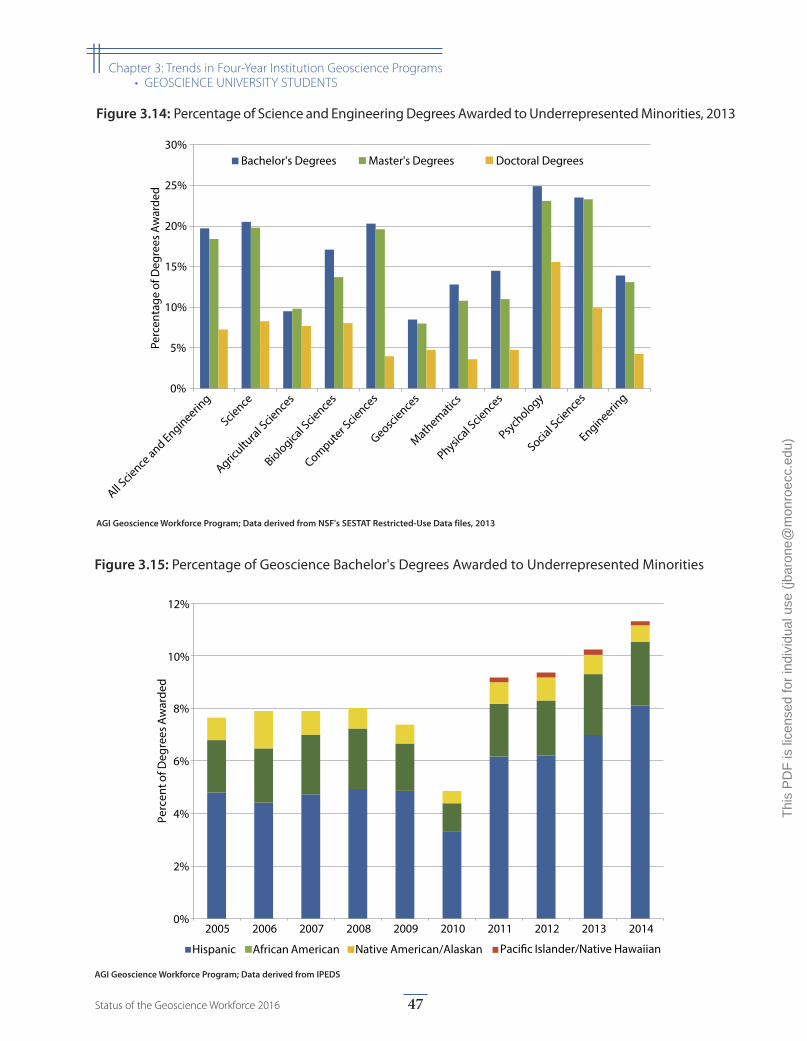
0%
2%
4%
6%
8%
10%
12%
2005 2006 2007 2008 2009 2010 2011 2012 2013 2014
Perc
ent o
f Deg
rees
Aw
arde
d
Hispanic African American Native American/Alaskan Paci�c Islander/Native Hawaiian
Figure 3.15: Percentage of Geoscience Bachelor's Degrees Awarded to Underrepresented Minorities
AGI Geoscience Workforce Program; Data derived from IPEDS
0%
5%
10%
15%
20%
25%
30%Pe
rcen
tage
of D
egre
es A
war
ded
Bachelor's Degrees Master's Degrees Doctoral Degrees
All Scie
nce and Engineerin
g
Science
Agricultu
ral Scie
nces
Biological S
cience
s
Computer Scie
nces
Geoscience
s
Mathematic
s
Physical S
cience
s
Psych
ology
Social S
cience
s
Engineering
Figure 3.14: Percentage of Science and Engineering Degrees Awarded to Underrepresented Minorities, 2013
AGI Geoscience Workforce Program; Data derived from NSF's SESTAT Restricted-Use Data files, 2013
47Status of the Geoscience Workforce 2016
|| Chapter 3: Trends in Four-Year Institution Geoscience Programs• GEOSCIENCE UNIVERSITY STUDENTS
Thi
s P
DF
is li
cens
ed fo
r in
divi
dual
use
(jb
aron
e@m
onro
ecc.
edu)
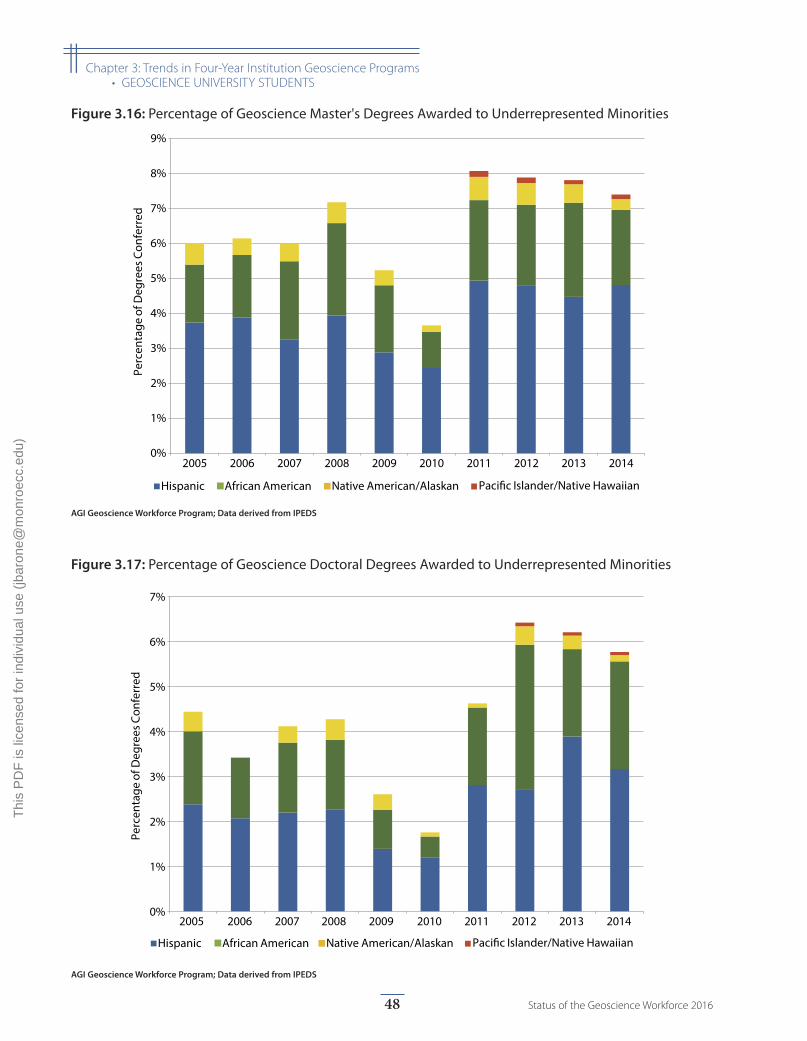
0%
1%
2%
3%
4%
5%
6%
7%
8%
9%
2005 2006 2007 2008 2009 2010 2011 2012 2013 2014
Perc
enta
ge o
f Deg
rees
Con
ferr
ed
Hispanic African American Native American/Alaskan Paci�c Islander/Native Hawaiian
Figure 3.16: Percentage of Geoscience Master's Degrees Awarded to Underrepresented Minorities
AGI Geoscience Workforce Program; Data derived from IPEDS
0%
1%
2%
3%
4%
5%
6%
7%
2005 2006 2007 2008 2009 2010 2011 2012 2013 2014
Perc
enta
ge o
f Deg
rees
Con
ferr
ed
Hispanic African American Native American/Alaskan Paci�c Islander/Native Hawaiian
Figure 3.17: Percentage of Geoscience Doctoral Degrees Awarded to Underrepresented Minorities
AGI Geoscience Workforce Program; Data derived from IPEDS
48 Status of the Geoscience Workforce 2016
|| Chapter 3: Trends in Four-Year Institution Geoscience Programs• GEOSCIENCE UNIVERSITY STUDENTS
Thi
s P
DF
is li
cens
ed fo
r in
divi
dual
use
(jb
aron
e@m
onro
ecc.
edu)
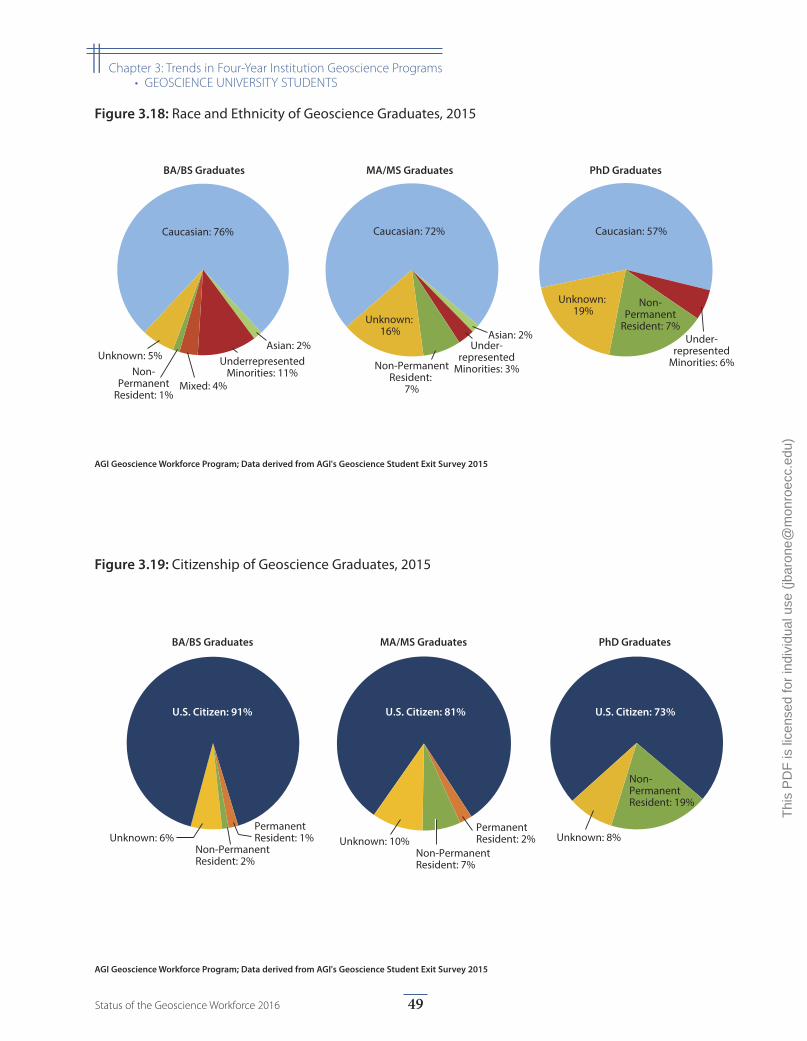
Non-Permanent
Resident: 7%
Caucasian: 57%
Unknown: 19%
Under-represented
Minorities: 6%
Caucasian: 72%
Under-represented
Minorities: 3%
Unknown: 16%
Non-PermanentResident:
7%
Asian: 2%Asian: 2%
Caucasian: 76%
Unknown: 5%
Mixed: 4%
UnderrepresentedMinorities: 11%Non-
PermanentResident: 1%
BA/BS Graduates PhD GraduatesMA/MS Graduates
Figure 3.18: Race and Ethnicity of Geoscience Graduates, 2015
AGI Geoscience Workforce Program; Data derived from AGI's Geoscience Student Exit Survey 2015
U.S. Citizen: 91%
BA/BS Graduates
PermanentResident: 1%
Non-PermanentResident: 2%
Unknown: 6%
U.S. Citizen: 73%
Non-PermanentResident: 19%
Unknown: 8%
PhD Graduates
U.S. Citizen: 81%
MA/MS Graduates
PermanentResident: 2%
Non-PermanentResident: 7%
Unknown: 10%
Figure 3.19: Citizenship of Geoscience Graduates, 2015
AGI Geoscience Workforce Program; Data derived from AGI's Geoscience Student Exit Survey 2015
49Status of the Geoscience Workforce 2016
|| Chapter 3: Trends in Four-Year Institution Geoscience Programs• GEOSCIENCE UNIVERSITY STUDENTS
Thi
s P
DF
is li
cens
ed fo
r in
divi
dual
use
(jb
aron
e@m
onro
ecc.
edu)
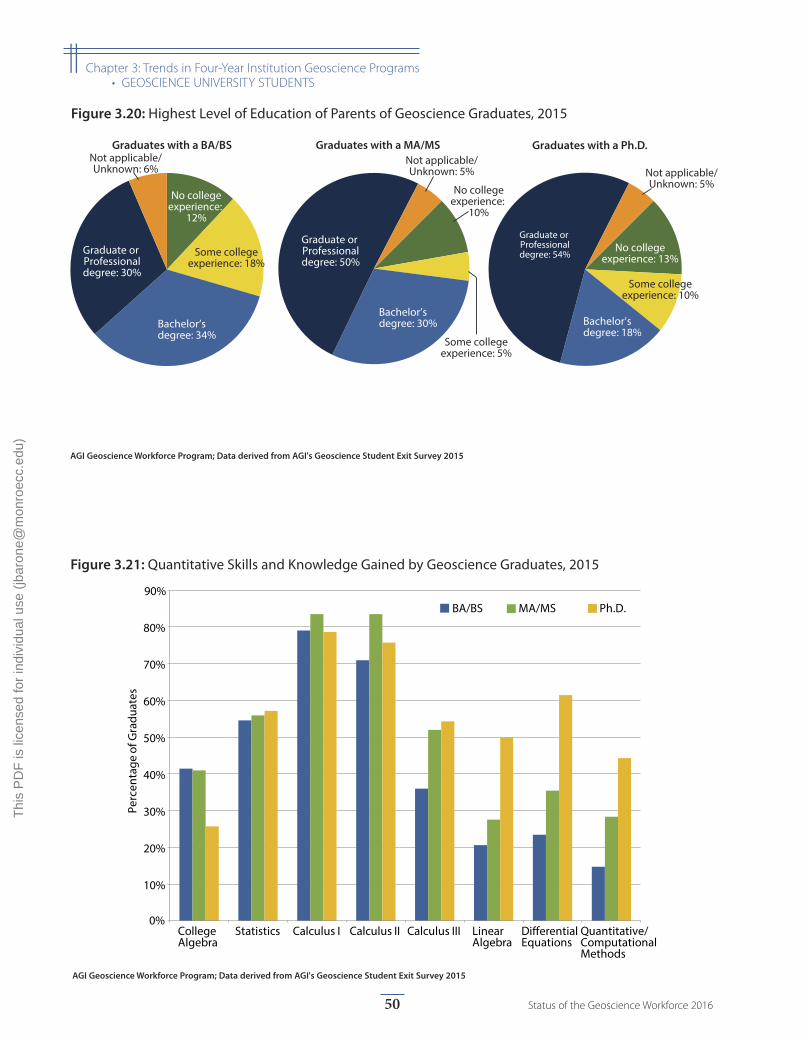
0%
10%
20%
30%
40%
50%
60%
70%
80%
90%
College Algebra
Statistics Calculus I Calculus II Calculus III Linear Algebra
Di�erential Equations
Quantitative/Computational Methods
Perc
enta
ge o
f Gra
duat
es
BA/BS MA/MS Ph.D.
Figure 3.20: Highest Level of Education of Parents of Geoscience Graduates, 2015
AGI Geoscience Workforce Program; Data derived from AGI's Geoscience Student Exit Survey 2015
Bachelor’s degree: 34%
Graduate or Professionaldegree: 30%
Some collegeexperience: 18%
No collegeexperience:
12%
Not applicable/Unknown: 6%
Graduates with a BA/BS
Bachelor’s degree: 30%
Graduate or Professionaldegree: 50%
Some collegeexperience: 5%
No collegeexperience:
10%
Not applicable/Unknown: 5%
Graduates with a MA/MS
Bachelor’s degree: 18%
Some collegeexperience: 10%
No collegeexperience: 13%
Not applicable/Unknown: 5%
Graduates with a Ph.D.
Graduate or Professionaldegree: 54%
Figure 3.21: Quantitative Skills and Knowledge Gained by Geoscience Graduates, 2015
AGI Geoscience Workforce Program; Data derived from AGI's Geoscience Student Exit Survey 2015
50 Status of the Geoscience Workforce 2016
|| Chapter 3: Trends in Four-Year Institution Geoscience Programs• GEOSCIENCE UNIVERSITY STUDENTS
Thi
s P
DF
is li
cens
ed fo
r in
divi
dual
use
(jb
aron
e@m
onro
ecc.
edu)
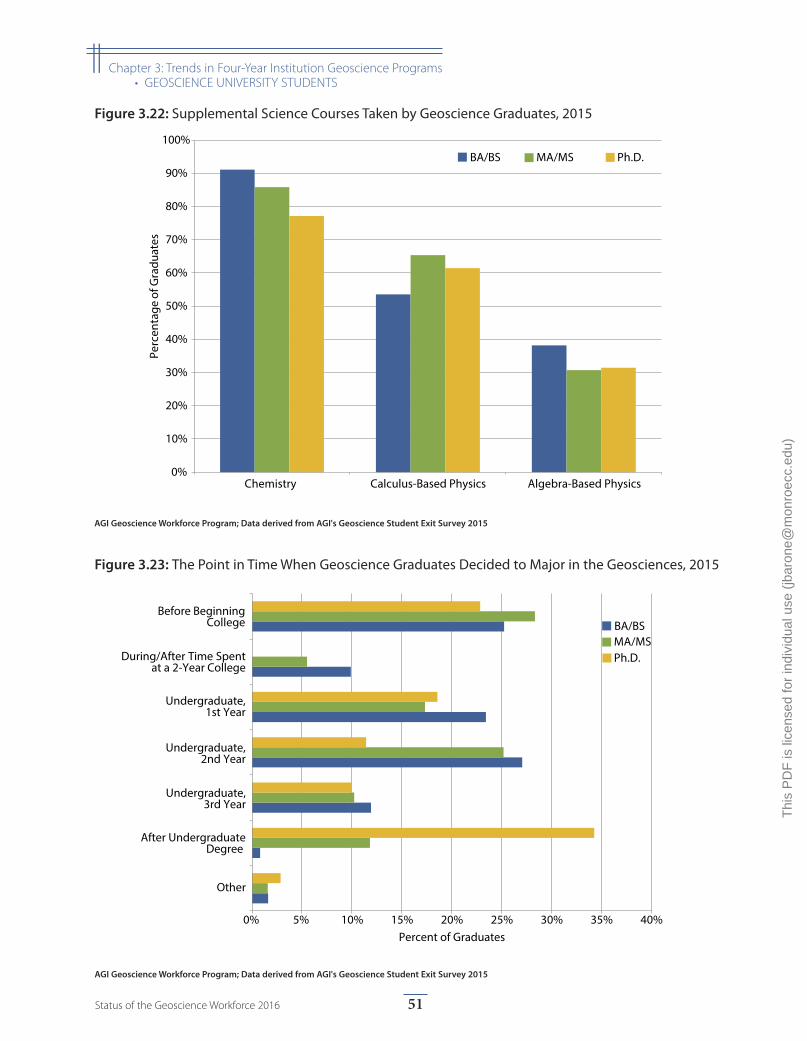
0%
10%
20%
30%
40%
50%
60%
70%
80%
90%
100%
Chemistry Calculus-Based Physics Algebra-Based Physics
Perc
enta
ge o
f Gra
duat
esBA/BS MA/MS Ph.D.
0% 5% 10% 15% 20% 25% 30% 35% 40%
Other
After UndergraduateDegree
Undergraduate,3rd Year
Undergraduate,2nd Year
Undergraduate,1st Year
During/After Time Spentat a 2-Year College
Before BeginningCollege
Percent of Graduates
BA/BSMA/MSPh.D.
Figure 3.22: Supplemental Science Courses Taken by Geoscience Graduates, 2015
Figure 3.23: The Point in Time When Geoscience Graduates Decided to Major in the Geosciences, 2015
AGI Geoscience Workforce Program; Data derived from AGI's Geoscience Student Exit Survey 2015
AGI Geoscience Workforce Program; Data derived from AGI's Geoscience Student Exit Survey 2015
51Status of the Geoscience Workforce 2016
|| Chapter 3: Trends in Four-Year Institution Geoscience Programs• GEOSCIENCE UNIVERSITY STUDENTS
Thi
s P
DF
is li
cens
ed fo
r in
divi
dual
use
(jb
aron
e@m
onro
ecc.
edu)
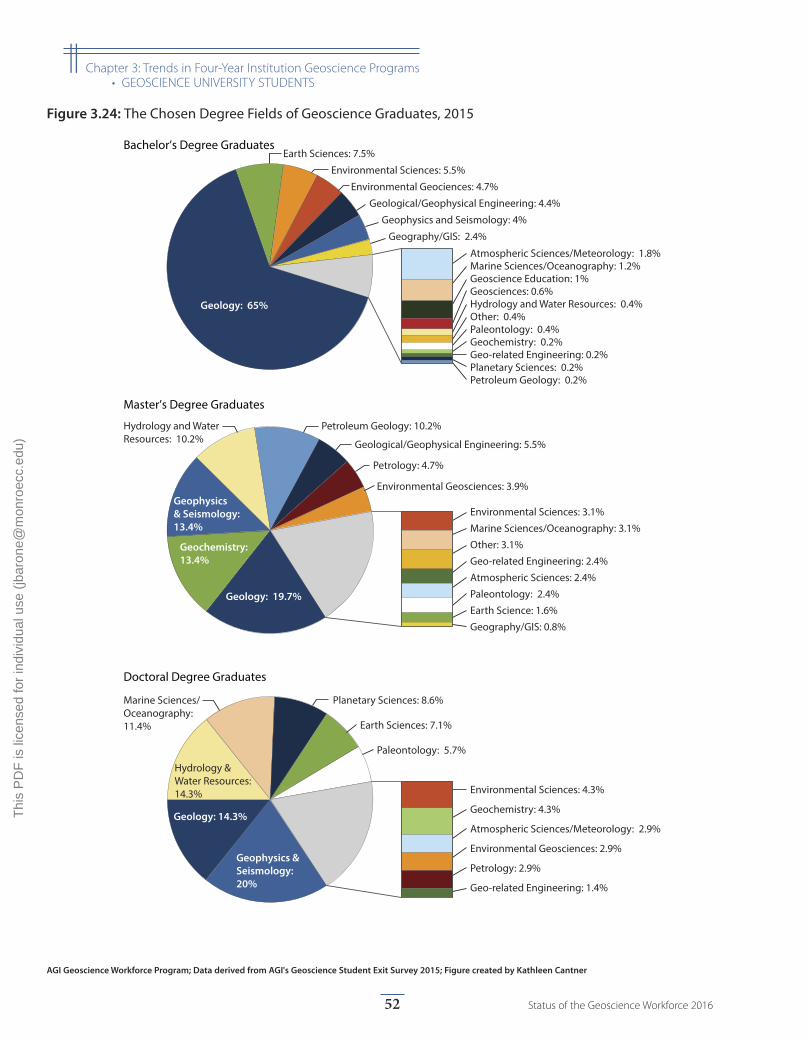
Marine Sciences/Oceanography: 11.4%
Geology: 14.3%
Earth Sciences: 7.1%
Environmental Sciences: 4.3%
Geochemistry: 4.3%
Hydrology & Water Resources: 14.3%
Atmospheric Sciences/Meteorology: 2.9%
Planetary Sciences: 8.6%
Petrology: 2.9%
Environmental Geosciences: 2.9%
Geo-related Engineering: 1.4%
Geophysics & Seismology: 20%
Paleontology: 5.7%
Geology: 19.7%
Geochemistry: 13.4%
Geophysics & Seismology: 13.4%
Hydrology and Water Resources: 10.2%
Petroleum Geology: 10.2%
Geological/Geophysical Engineering: 5.5%
Earth Science: 1.6%
Geo-related Engineering: 2.4%
Atmospheric Sciences: 2.4%
Environmental Sciences: 3.1%
Marine Sciences/Oceanography: 3.1%
Petrology: 4.7%
Environmental Geosciences: 3.9%
Other: 3.1%
Paleontology: 2.4%
Geography/GIS: 0.8%
Geo-related Engineering: 0.2%
Atmospheric Sciences/Meteorology: 1.8%
Hydrology and Water Resources: 0.4%
Petroleum Geology: 0.2%Planetary Sciences: 0.2%
Other: 0.4%Paleontology: 0.4%Geochemistry: 0.2%
Geography/GIS: 2.4%
Geoscience Education: 1%Geosciences: 0.6%
Marine Sciences/Oceanography: 1.2%
Geophysics and Seismology: 4%
Geological/Geophysical Engineering: 4.4%
Environmental Sciences: 5.5%
Earth Sciences: 7.5%
Environmental Geociences: 4.7%
Geology: 65%
Doctoral Degree Graduates
Master’s Degree Graduates
Bachelor’s Degree Graduates
Figure 3.24: The Chosen Degree Fields of Geoscience Graduates, 2015
AGI Geoscience Workforce Program; Data derived from AGI's Geoscience Student Exit Survey 2015; Figure created by Kathleen Cantner
52 Status of the Geoscience Workforce 2016
|| Chapter 3: Trends in Four-Year Institution Geoscience Programs• GEOSCIENCE UNIVERSITY STUDENTS
Thi
s P
DF
is li
cens
ed fo
r in
divi
dual
use
(jb
aron
e@m
onro
ecc.
edu)
Co-Curricular Activities
Field camp attendance hit a high of 3,237 student participants in 2014, but the attendance dropped in 2015 to 2,867 students (Figure 3.25). If this trend
continues, then either the available field camps have reached their annual capacity or the cost of attending field camp may be prohibiting participation among students. Most states in the United States either have at least one field camp held within the state or at least one department that hosts a field camp in a different location outside of the state (Figure 3.27). International field camps are also becoming popular for departments to host with 12 differ-ent international destinations recently visited by geosci-ence students. If a geoscience student did not participate in a field camp, then it is likely that student participated in at least one field course and/or one field experience before graduating (Figure 3.28 and 3.29). Recently, AGI’s Directory of Geoscience Departments has been document-ing those departments that have a field camp with open or closed enrollment in order to help students find a program to apply to for a summer field camp.
Research experiences were not as common as field expe-riences, particularly among bachelor’s graduates, with 26% completing their degree without participating in a faculty-directed or individual research project (Figure 3.30). Among those students that participated in indi-vidual research projects, there are clear differences in how the research was conducted between undergraduate and graduate students. Specifically, graduate students
participate in literature-based research and computer-based research more often than undergraduates (Figure 3.31). However, research methods can differ in different geoscience fields. Approximately 91% of master’s gradu-ates do participate in individual research projects while working towards their degree, at least 5,183 students pub-lished their master’s theses in the 2000’s (Figure 3.32). For doctoral dissertations, GeoRef reported 10,301 published during the 2000’s (Figure 3.33).
Internships should be considered key experiences nec-essary for anyone considering entering the geoscience workforce because they are recognized by many indus-tries as a good recruitment tool for future employees. Internships can also help students develop many of the needed professional skills, such as effective communica-tion, collaboration, and networking, which may not be as easily gained through their education program. Therefore it is surprising that in 2015, 64% of bachelor’s graduates, 40% of master’s graduates, and 57% of doctoral graduates did not participate in an internship while working towards their degree. This trend has been seen over the past few years, so AGI’s Geoscience Student Exit Survey added questions about the search for internship opportunities. Largely, master’s graduates recognize the importance of these opportunities because they tend to submit multiple applications and use any resources available to them to find these opportunities, whereas internships do not appear to be a priority among bachelor’s graduates.
53Status of the Geoscience Workforce 2016
|| Chapter 3: Trends in Four-Year Institution Geoscience Programs
Thi
s P
DF
is li
cens
ed fo
r in
divi
dual
use
(jb
aron
e@m
onro
ecc.
edu)
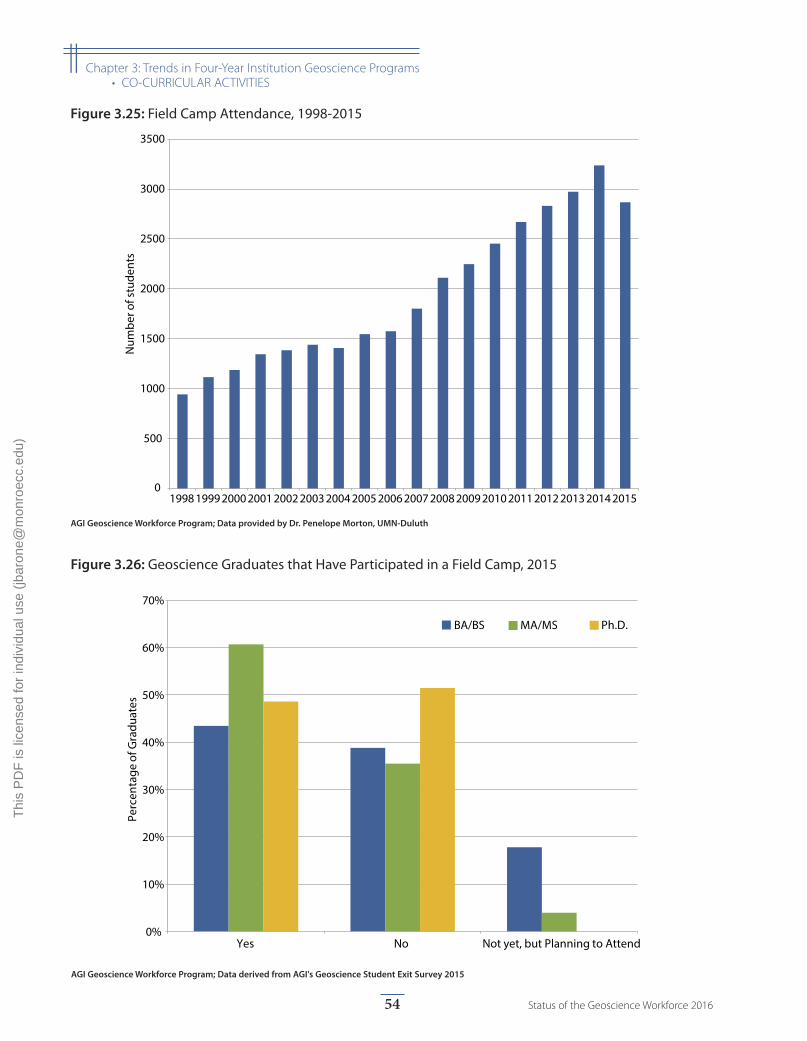
0
500
1000
1500
2000
2500
3000
3500
1998 1999 2000 2001 2002 2003 2004 2005 2006 2007 2008 2009 2010 2011 2012 2013 2014 2015
Num
ber o
f stu
dent
sFigure 3.25: Field Camp Attendance, 1998-2015
AGI Geoscience Workforce Program; Data provided by Dr. Penelope Morton, UMN-Duluth
0%
10%
20%
30%
40%
50%
60%
70%
Yes No Not yet, but Planning to Attend
Perc
enta
ge o
f Gra
duat
es
BA/BS MA/MS Ph.D.
Figure 3.26: Geoscience Graduates that Have Participated in a Field Camp, 2015
AGI Geoscience Workforce Program; Data derived from AGI's Geoscience Student Exit Survey 2015
54 Status of the Geoscience Workforce 2016
|| Chapter 3: Trends in Four-Year Institution Geoscience Programs• CO-CURRICULAR ACTIVITIES
Thi
s P
DF
is li
cens
ed fo
r in
divi
dual
use
(jb
aron
e@m
onro
ecc.
edu)
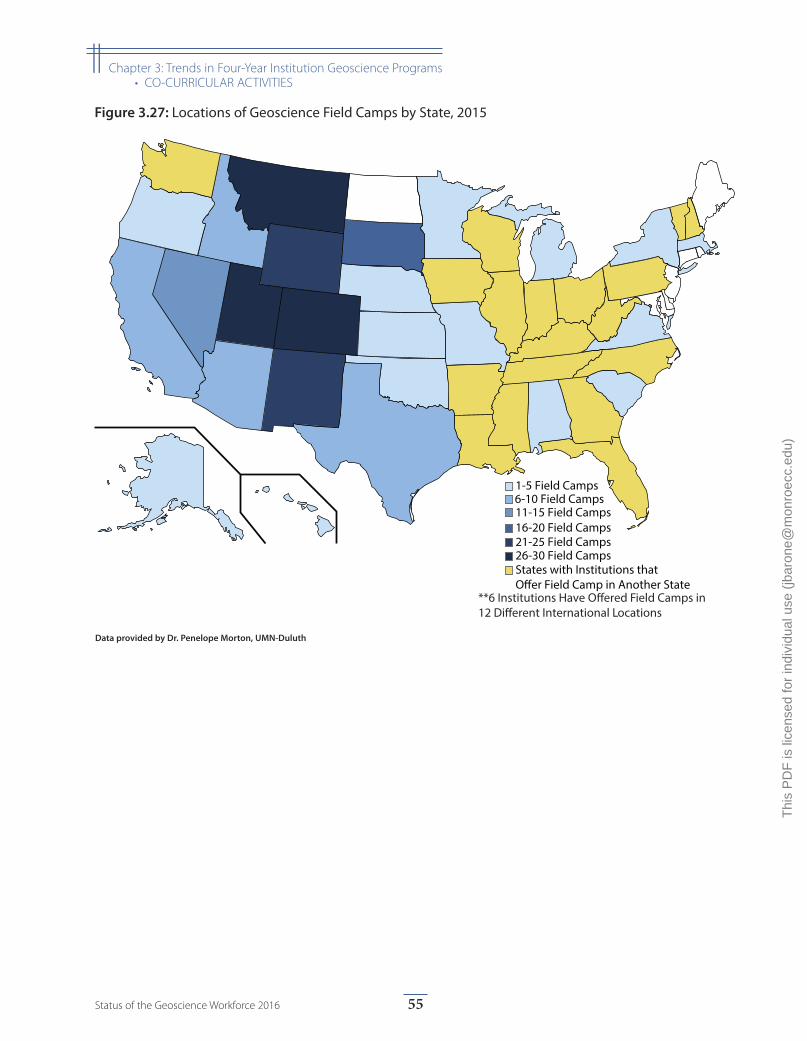
1-5 Field Camps6-10 Field Camps11-15 Field Camps16-20 Field Camps21-25 Field Camps26-30 Field CampsStates with Institutions that O�er Field Camp in Another State
**6 Institutions Have O�ered Field Camps in 12 Di�erent International Locations
Figure 3.27: Locations of Geoscience Field Camps by State, 2015
Data provided by Dr. Penelope Morton, UMN-Duluth
55Status of the Geoscience Workforce 2016
|| Chapter 3: Trends in Four-Year Institution Geoscience Programs• CO-CURRICULAR ACTIVITIES
Thi
s P
DF
is li
cens
ed fo
r in
divi
dual
use
(jb
aron
e@m
onro
ecc.
edu)
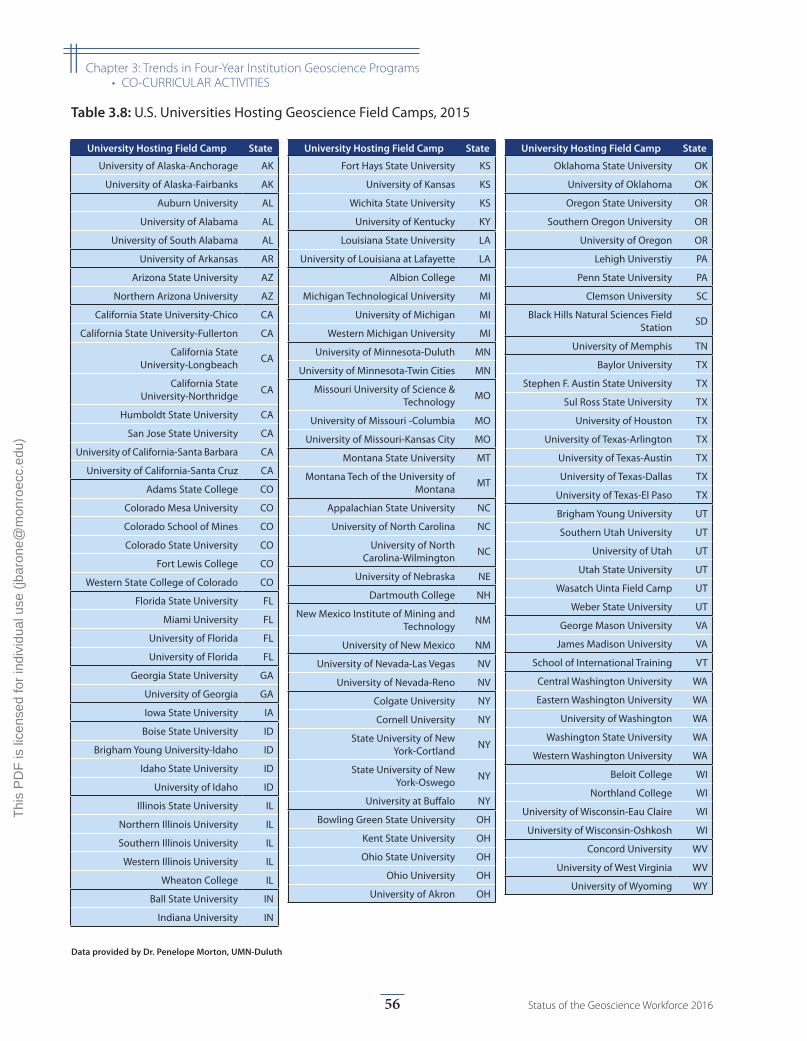
University Hosting Field Camp State
University of Alaska-Anchorage AK
University of Alaska-Fairbanks AK
Auburn University AL
University of Alabama AL
University of South Alabama AL
University of Arkansas AR
Arizona State University AZ
Northern Arizona University AZ
California State University-Chico CA
California State University-Fullerton CA
California State University-Longbeach CA
California State University-Northridge CA
Humboldt State University CA
San Jose State University CA
University of California-Santa Barbara CA
University of California-Santa Cruz CA
Adams State College CO
Colorado Mesa University CO
Colorado School of Mines CO
Colorado State University CO
Fort Lewis College CO
Western State College of Colorado CO
Florida State University FL
Miami University FL
University of Florida FL
University of Florida FL
Georgia State University GA
University of Georgia GA
Iowa State University IA
Boise State University ID
Brigham Young University-Idaho ID
Idaho State University ID
University of Idaho ID
Illinois State University IL
Northern Illinois University IL
Southern Illinois University IL
Western Illinois University IL
Wheaton College IL
Ball State University IN
Indiana University IN
University Hosting Field Camp State
Fort Hays State University KS
University of Kansas KS
Wichita State University KS
University of Kentucky KY
Louisiana State University LA
University of Louisiana at Lafayette LA
Albion College MI
Michigan Technological University MI
University of Michigan MI
Western Michigan University MI
University of Minnesota-Duluth MN
University of Minnesota-Twin Cities MN
Missouri University of Science & Technology MO
University of Missouri -Columbia MO
University of Missouri-Kansas City MO
Montana State University MT
Montana Tech of the University of Montana MT
Appalachian State University NC
University of North Carolina NC
University of North Carolina-Wilmington NC
University of Nebraska NE
Dartmouth College NH
New Mexico Institute of Mining and Technology NM
University of New Mexico NM
University of Nevada-Las Vegas NV
University of Nevada-Reno NV
Colgate University NY
Cornell University NY
State University of New York-Cortland NY
State University of New York-Oswego NY
University at Buffalo NY
Bowling Green State University OH
Kent State University OH
Ohio State University OH
Ohio University OH
University of Akron OH
University Hosting Field Camp State
Oklahoma State University OK
University of Oklahoma OK
Oregon State University OR
Southern Oregon University OR
University of Oregon OR
Lehigh Universtiy PA
Penn State University PA
Clemson University SC
Black Hills Natural Sciences Field Station SD
University of Memphis TN
Baylor University TX
Stephen F. Austin State University TX
Sul Ross State University TX
University of Houston TX
University of Texas-Arlington TX
University of Texas-Austin TX
University of Texas-Dallas TX
University of Texas-El Paso TX
Brigham Young University UT
Southern Utah University UT
University of Utah UT
Utah State University UT
Wasatch Uinta Field Camp UT
Weber State University UT
George Mason University VA
James Madison University VA
School of International Training VT
Central Washington University WA
Eastern Washington University WA
University of Washington WA
Washington State University WA
Western Washington University WA
Beloit College WI
Northland College WI
University of Wisconsin-Eau Claire WI
University of Wisconsin-Oshkosh WI
Concord University WV
University of West Virginia WV
University of Wyoming WY
Table 3.8: U.S. Universities Hosting Geoscience Field Camps, 2015
Data provided by Dr. Penelope Morton, UMN-Duluth
56 Status of the Geoscience Workforce 2016
|| Chapter 3: Trends in Four-Year Institution Geoscience Programs• CO-CURRICULAR ACTIVITIES
Thi
s P
DF
is li
cens
ed fo
r in
divi
dual
use
(jb
aron
e@m
onro
ecc.
edu)
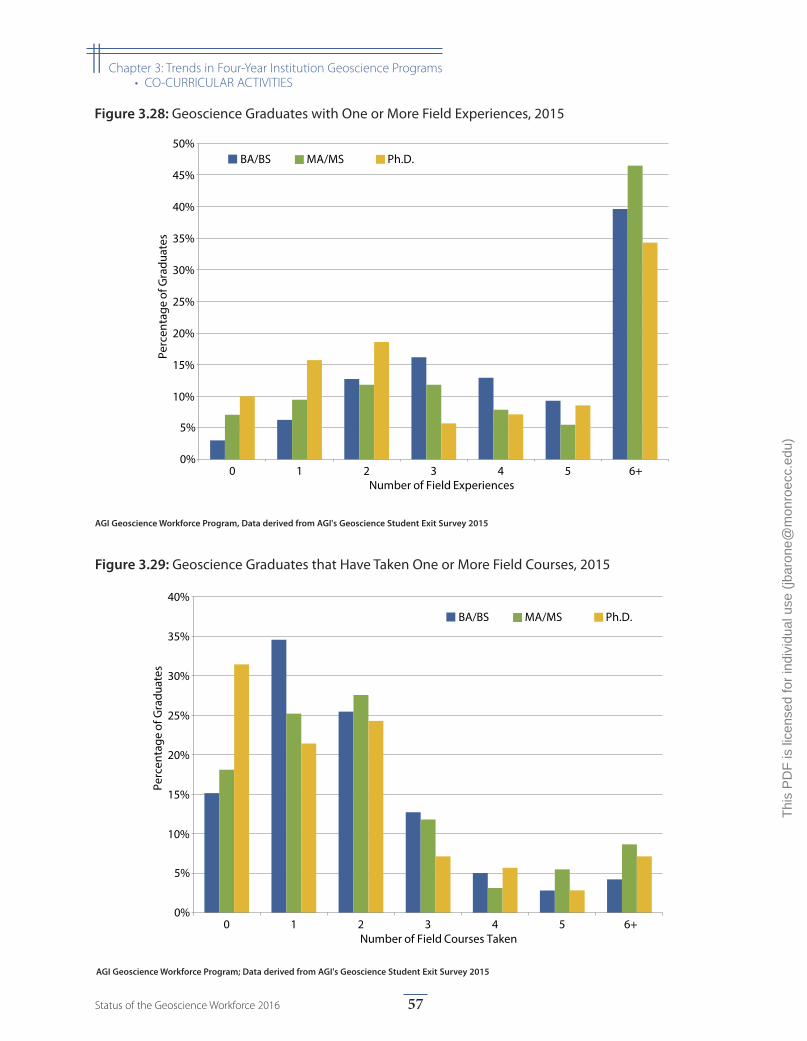
0%
5%
10%
15%
20%
25%
30%
35%
40%
0 1 2 3 4 5 6+
Perc
enta
ge o
f Gra
duat
es
Number of Field Courses Taken
BA/BS MA/MS Ph.D.
Figure 3.29: Geoscience Graduates that Have Taken One or More Field Courses, 2015
AGI Geoscience Workforce Program; Data derived from AGI's Geoscience Student Exit Survey 2015
0%
5%
10%
15%
20%
25%
30%
35%
40%
45%
50%
0 1 2 3 4 5 6+
Perc
enta
ge o
f Gra
duat
es
Number of Field Experiences
BA/BS MA/MS Ph.D.
Figure 3.28: Geoscience Graduates with One or More Field Experiences, 2015
AGI Geoscience Workforce Program, Data derived from AGI's Geoscience Student Exit Survey 2015
57Status of the Geoscience Workforce 2016
|| Chapter 3: Trends in Four-Year Institution Geoscience Programs• CO-CURRICULAR ACTIVITIES
Thi
s P
DF
is li
cens
ed fo
r in
divi
dual
use
(jb
aron
e@m
onro
ecc.
edu)
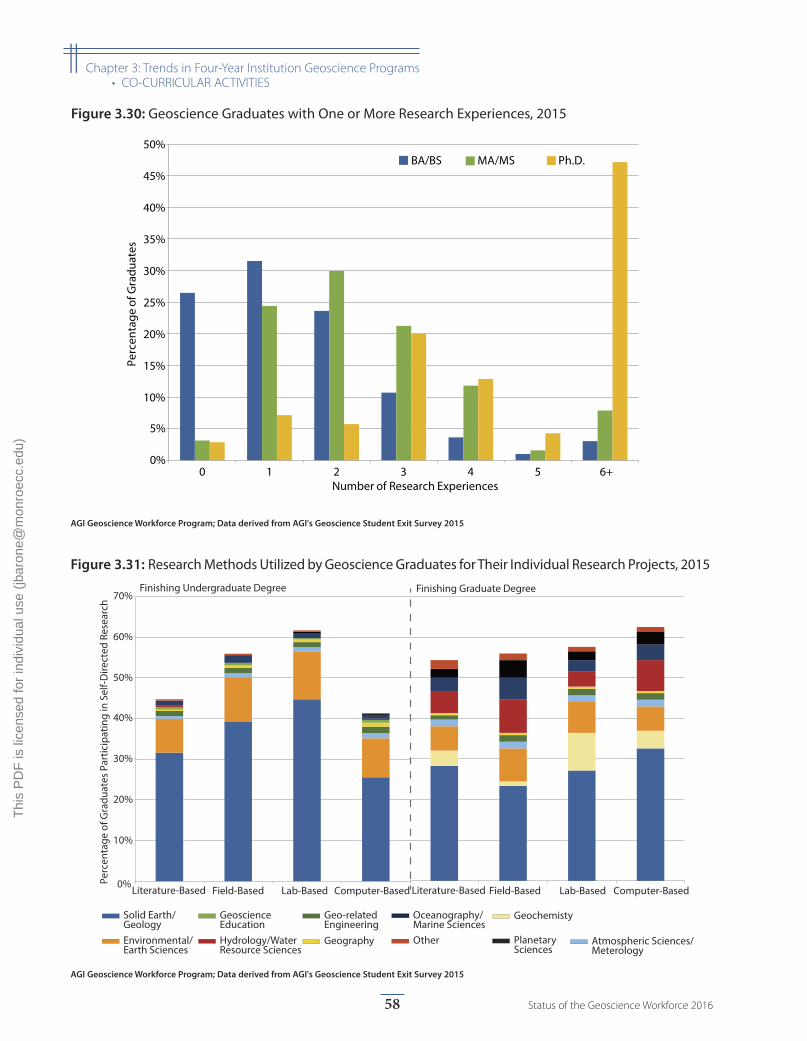
Other
Solid Earth/Geology
Geo-related Engineering
Environmental/Earth Sciences
Oceanography/Marine Sciences
Geography Atmospheric Sciences/Meterology
Geoscience EducationHydrology/WaterResource Sciences
Planetary Sciences
Geochemisty
Perc
enta
ge o
f Gra
duat
es P
artic
ipat
ing
in S
elf-D
irect
ed R
esea
rch
Finishing Undergraduate Degree
0%
10%
20%
30%
40%
50%
60%
70%
Literature-Based Field-Based Lab-Based Computer-Based Literature-Based Field-Based Lab-Based Computer-Based
Finishing Graduate Degree
Figure 3.30: Geoscience Graduates with One or More Research Experiences, 2015
AGI Geoscience Workforce Program; Data derived from AGI's Geoscience Student Exit Survey 2015
Figure 3.31: Research Methods Utilized by Geoscience Graduates for Their Individual Research Projects, 2015
AGI Geoscience Workforce Program; Data derived from AGI's Geoscience Student Exit Survey 2015
0%
5%
10%
15%
20%
25%
30%
35%
40%
45%
50%
0 1 2 3 4 5 6+
Perc
enta
ge o
f Gra
duat
es
Number of Research Experiences
BA/BS MA/MS Ph.D.
58 Status of the Geoscience Workforce 2016
|| Chapter 3: Trends in Four-Year Institution Geoscience Programs• CO-CURRICULAR ACTIVITIES
Thi
s P
DF
is li
cens
ed fo
r in
divi
dual
use
(jb
aron
e@m
onro
ecc.
edu)
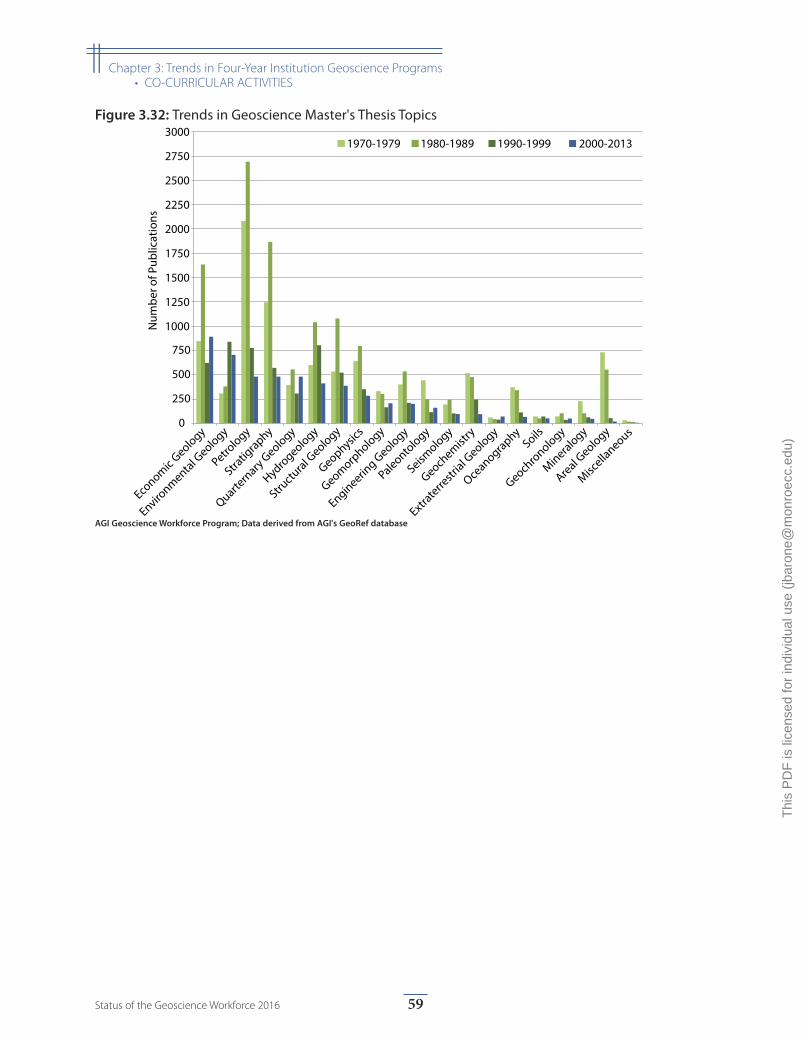
0
250
500
750
1000
1250
1500
1750
2000
2250
2500
2750
3000
Num
ber o
f Pub
licat
ions
1970-1979 1980-1989 1990-1999 2000-2013
Environmental G
eology
Engineering G
eology
Hydrogeology
Geophysics
Quartern
ary Geology
Economic
Geology
Petrology
Paleontology
Stratig
raphy
Geochemist
ry
Extraterre
strial G
eology
Geomorphology
Soils
Structu
ral Geology
Oceanography
Seismology
Mineralogy
Geochro
nology
Areal Geology
Miscella
neous
Figure 3.32: Trends in Geoscience Master's Thesis Topics
AGI Geoscience Workforce Program; Data derived from AGI's GeoRef database
59Status of the Geoscience Workforce 2016
|| Chapter 3: Trends in Four-Year Institution Geoscience Programs• CO-CURRICULAR ACTIVITIES
Thi
s P
DF
is li
cens
ed fo
r in
divi
dual
use
(jb
aron
e@m
onro
ecc.
edu)
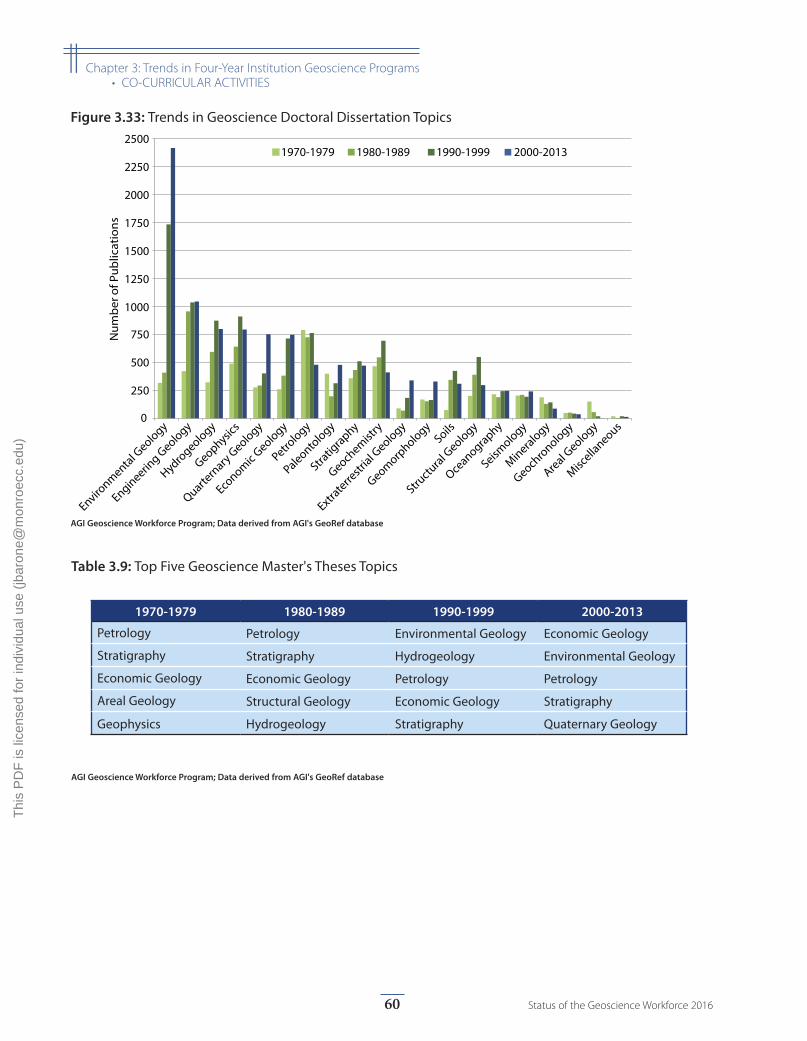
1970-1979 1980-1989 1990-1999 2000-2013
Petrology Petrology Environmental Geology Economic Geology
Stratigraphy Stratigraphy Hydrogeology Environmental Geology
Economic Geology Economic Geology Petrology Petrology
Areal Geology Structural Geology Economic Geology Stratigraphy
Geophysics Hydrogeology Stratigraphy Quaternary Geology
1970-1979 1980-1989 1990-1999 2000-2013
Petrology Petrology Environmental Geology
Economic Geology
Stratigraphy Stratigraphy Hydrogeology Environmental Geology
Economic Geology
Economic Geology Petrology Petrology
Areal Geology Structural Geology
Economic Geology Stratigraphy
Geophysics Hydrogeology Stratigraphy Quaternary Geology
Table 3.9: Top Five Geoscience Master's Theses Topics
AGI Geoscience Workforce Program; Data derived from AGI's GeoRef database
0
250
500
750
1000
1250
1500
1750
2000
2250
2500
Num
ber o
f Pub
licat
ions
1970-1979 1980-1989 1990-1999 2000-2013
Environmental G
eology
Engineering G
eology
Hydrogeology
Geophysics
Quartern
ary Geology
Economic
Geology
Petrology
Paleontology
Stratig
raphy
Geochemist
ry
Extraterre
strial G
eology
Geomorphology
Soils
Structu
ral Geology
Oceanography
Seismology
Mineralogy
Geochro
nology
Areal Geology
Miscella
neous
Figure 3.33: Trends in Geoscience Doctoral Dissertation Topics
AGI Geoscience Workforce Program; Data derived from AGI's GeoRef database
60 Status of the Geoscience Workforce 2016
|| Chapter 3: Trends in Four-Year Institution Geoscience Programs• CO-CURRICULAR ACTIVITIES
Thi
s P
DF
is li
cens
ed fo
r in
divi
dual
use
(jb
aron
e@m
onro
ecc.
edu)
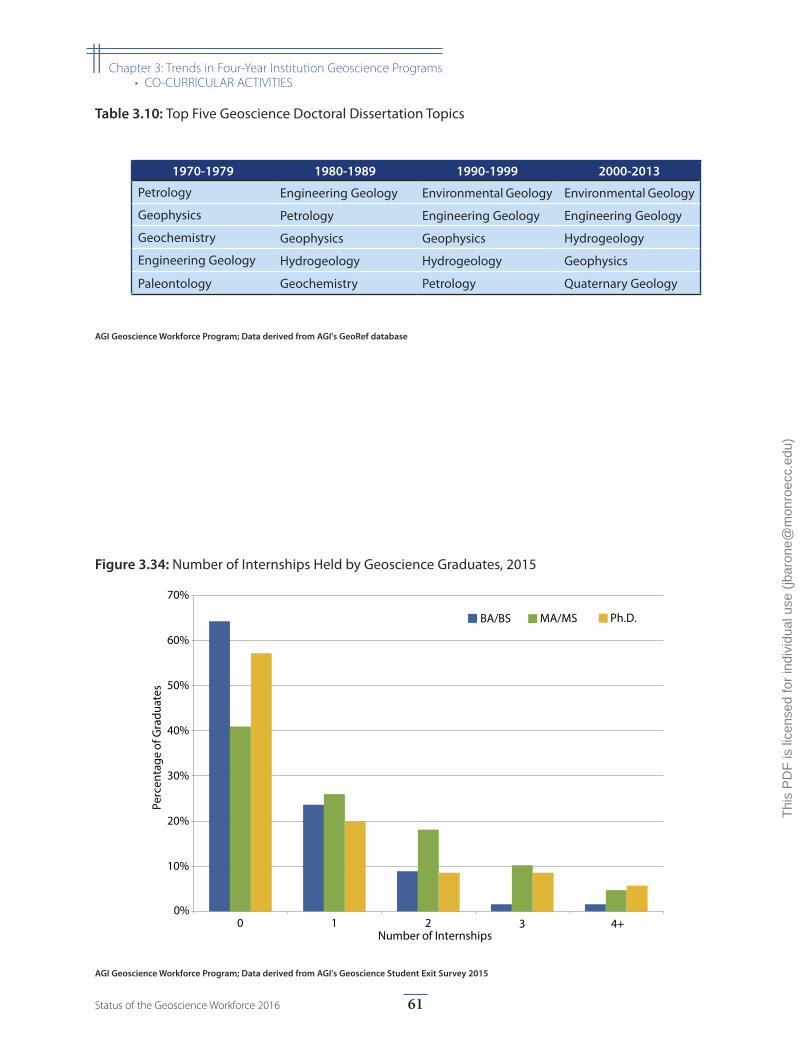
0%
10%
20%
30%
40%
50%
60%
70%
0 1 2 3 4+
Perc
enta
ge o
f Gra
duat
es
Number of Internships
BA/BS MA/MS Ph.D.
Figure 3.34: Number of Internships Held by Geoscience Graduates, 2015
AGI Geoscience Workforce Program; Data derived from AGI's Geoscience Student Exit Survey 2015
1970-1979 1980-1989 1990-1999 2000-2013
Petrology Engineering Geology Environmental Geology Environmental Geology
Geophysics Petrology Engineering Geology Engineering Geology
Geochemistry Geophysics Geophysics Hydrogeology
Engineering Geology Hydrogeology Hydrogeology Geophysics
Paleontology Geochemistry Petrology Quaternary Geology
1970-1979 1980-1989 1990-1999 2000-2013
Petrology Engineering Geology
Environmental Geology
Environmental Geology
Geophysics Petrology Engineering Geology
Engineering Geology
Geochemistry Geophysics Geophysics Hydrogeology
Engineering Geology Hydrogeology Hydrogeology Geophysics
Paleontology Geochemistry Petrology Quaternary Geology
Table 3.10: Top Five Geoscience Doctoral Dissertation Topics
AGI Geoscience Workforce Program; Data derived from AGI's GeoRef database
61Status of the Geoscience Workforce 2016
|| Chapter 3: Trends in Four-Year Institution Geoscience Programs• CO-CURRICULAR ACTIVITIES
Thi
s P
DF
is li
cens
ed fo
r in
divi
dual
use
(jb
aron
e@m
onro
ecc.
edu)
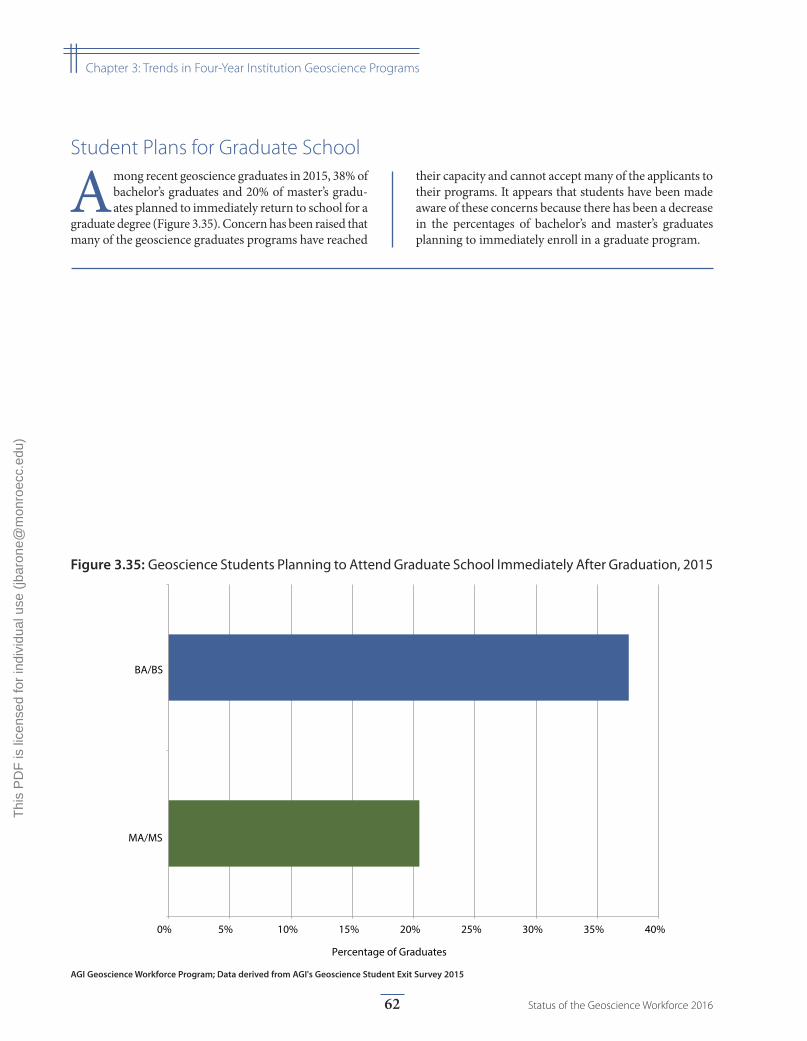
0% 5% 10% 15% 20% 25% 30% 35% 40%
Percentage of Graduates
MA/MS
BA/BS
Figure 3.35: Geoscience Students Planning to Attend Graduate School Immediately After Graduation, 2015
AGI Geoscience Workforce Program; Data derived from AGI's Geoscience Student Exit Survey 2015
Student Plans for Graduate School
Among recent geoscience graduates in 2015, 38% of bachelor’s graduates and 20% of master’s gradu-ates planned to immediately return to school for a
graduate degree (Figure 3.35). Concern has been raised that many of the geoscience graduates programs have reached
their capacity and cannot accept many of the applicants to their programs. It appears that students have been made aware of these concerns because there has been a decrease in the percentages of bachelor’s and master’s graduates planning to immediately enroll in a graduate program.
62 Status of the Geoscience Workforce 2016
|| Chapter 3: Trends in Four-Year Institution Geoscience Programs
Thi
s P
DF
is li
cens
ed fo
r in
divi
dual
use
(jb
aron
e@m
onro
ecc.
edu)
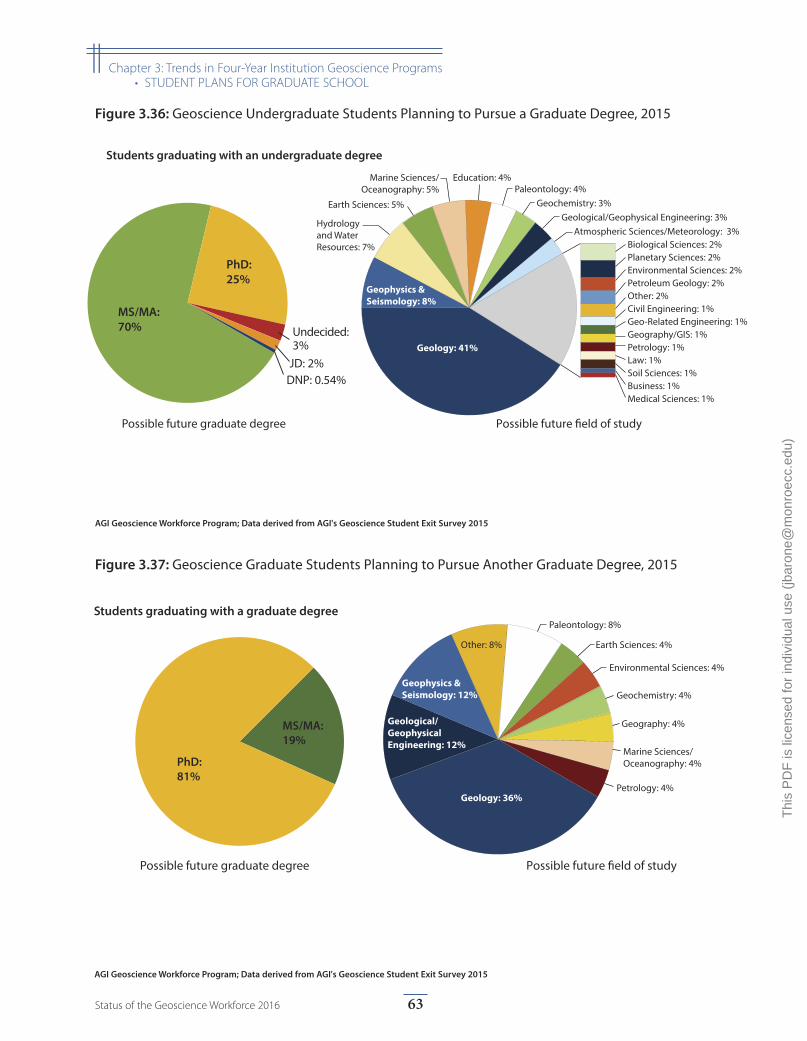
MS/MA: 19%
PhD: 81%
Possible future graduate degree Possible future �eld of study
Geology: 36%
Other: 8%
Paleontology: 8%
Earth Sciences: 4%
Marine Sciences/Oceanography: 4%
Geophysics &Seismology: 12%
Geological/GeophysicalEngineering: 12%
Environmental Sciences: 4%
Geochemistry: 4%
Geography: 4%
Petrology: 4%
Students graduating with a graduate degree
Figure 3.37: Geoscience Graduate Students Planning to Pursue Another Graduate Degree, 2015
AGI Geoscience Workforce Program; Data derived from AGI's Geoscience Student Exit Survey 2015
MS/MA: 70%
PhD: 25%
Possible future graduate degree
Undecided:3%
JD: 2%DNP: 0.54%
Possible future �eld of study
Biological Sciences: 2%
Geology: 41%
Geophysics & Seismology: 8%
Planetary Sciences: 2%Environmental Sciences: 2%Petroleum Geology: 2%Other: 2%Civil Engineering: 1%Geo-Related Engineering: 1%Geography/GIS: 1%
Law: 1%Petrology: 1%
Soil Sciences: 1%Business: 1%Medical Sciences: 1%
Hydrology and Water Resources: 7%
Atmospheric Sciences/Meteorology: 3%
Education: 4%Paleontology: 4%
Geochemistry: 3%
Marine Sciences/Oceanography: 5%
Geological/Geophysical Engineering: 3%Earth Sciences: 5%
Students graduating with an undergraduate degree
Figure 3.36: Geoscience Undergraduate Students Planning to Pursue a Graduate Degree, 2015
AGI Geoscience Workforce Program; Data derived from AGI's Geoscience Student Exit Survey 2015
63Status of the Geoscience Workforce 2016
|| Chapter 3: Trends in Four-Year Institution Geoscience Programs• STUDENT PLANS FOR GRADUATE SCHOOL
Thi
s P
DF
is li
cens
ed fo
r in
divi
dual
use
(jb
aron
e@m
onro
ecc.
edu)
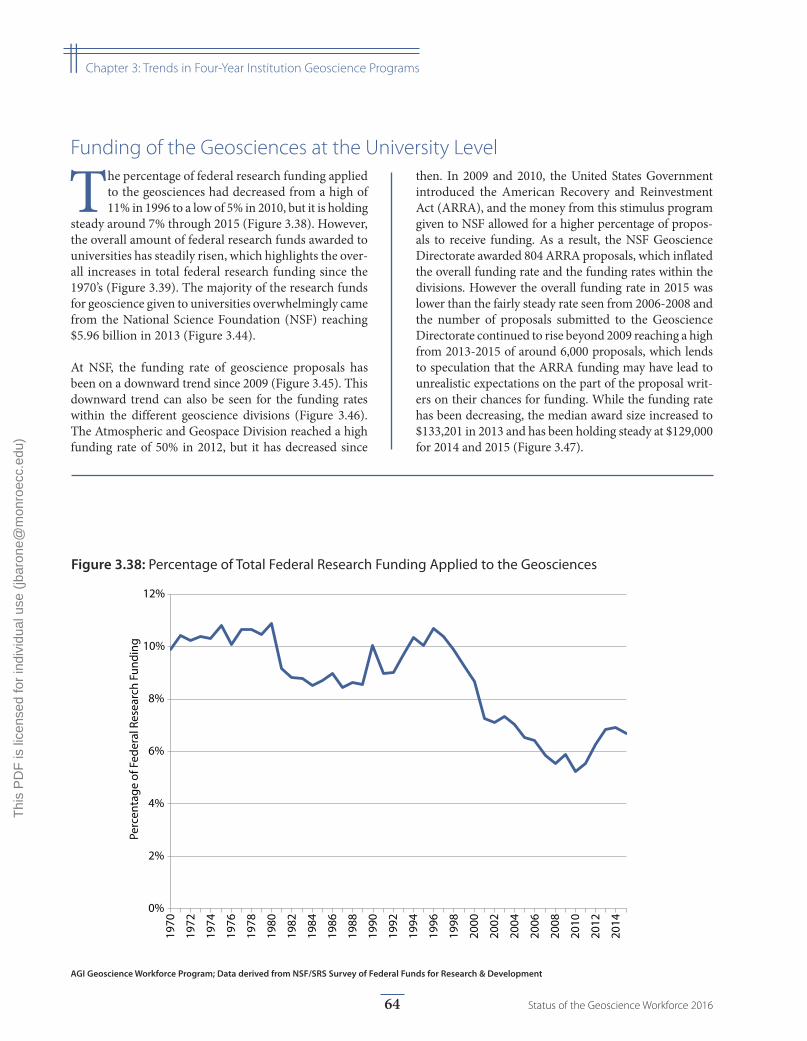
0%
2%
4%
6%
8%
10%
12%
1970
1972
1974
1976
1978
1980
1982
1984
1986
1988
1990
1992
1994
1996
1998
2000
2002
2004
2006
2008
2010
2012
2014
Perc
enta
ge o
f Fed
eral
Res
earc
h Fu
ndin
g
Figure 3.38: Percentage of Total Federal Research Funding Applied to the Geosciences
AGI Geoscience Workforce Program; Data derived from NSF/SRS Survey of Federal Funds for Research & Development
Funding of the Geosciences at the University Level
The percentage of federal research funding applied to the geosciences had decreased from a high of 11% in 1996 to a low of 5% in 2010, but it is holding
steady around 7% through 2015 (Figure 3.38). However, the overall amount of federal research funds awarded to universities has steadily risen, which highlights the over-all increases in total federal research funding since the 1970’s (Figure 3.39). The majority of the research funds for geoscience given to universities overwhelmingly came from the National Science Foundation (NSF) reaching $5.96 billion in 2013 (Figure 3.44).
At NSF, the funding rate of geoscience proposals has been on a downward trend since 2009 (Figure 3.45). This downward trend can also be seen for the funding rates within the different geoscience divisions (Figure 3.46). The Atmospheric and Geospace Division reached a high funding rate of 50% in 2012, but it has decreased since
then. In 2009 and 2010, the United States Government introduced the American Recovery and Reinvestment Act (ARRA), and the money from this stimulus program given to NSF allowed for a higher percentage of propos-als to receive funding. As a result, the NSF Geoscience Directorate awarded 804 ARRA proposals, which inflated the overall funding rate and the funding rates within the divisions. However the overall funding rate in 2015 was lower than the fairly steady rate seen from 2006-2008 and the number of proposals submitted to the Geoscience Directorate continued to rise beyond 2009 reaching a high from 2013-2015 of around 6,000 proposals, which lends to speculation that the ARRA funding may have lead to unrealistic expectations on the part of the proposal writ-ers on their chances for funding. While the funding rate has been decreasing, the median award size increased to $133,201 in 2013 and has been holding steady at $129,000 for 2014 and 2015 (Figure 3.47).
64 Status of the Geoscience Workforce 2016
|| Chapter 3: Trends in Four-Year Institution Geoscience Programs
Thi
s P
DF
is li
cens
ed fo
r in
divi
dual
use
(jb
aron
e@m
onro
ecc.
edu)
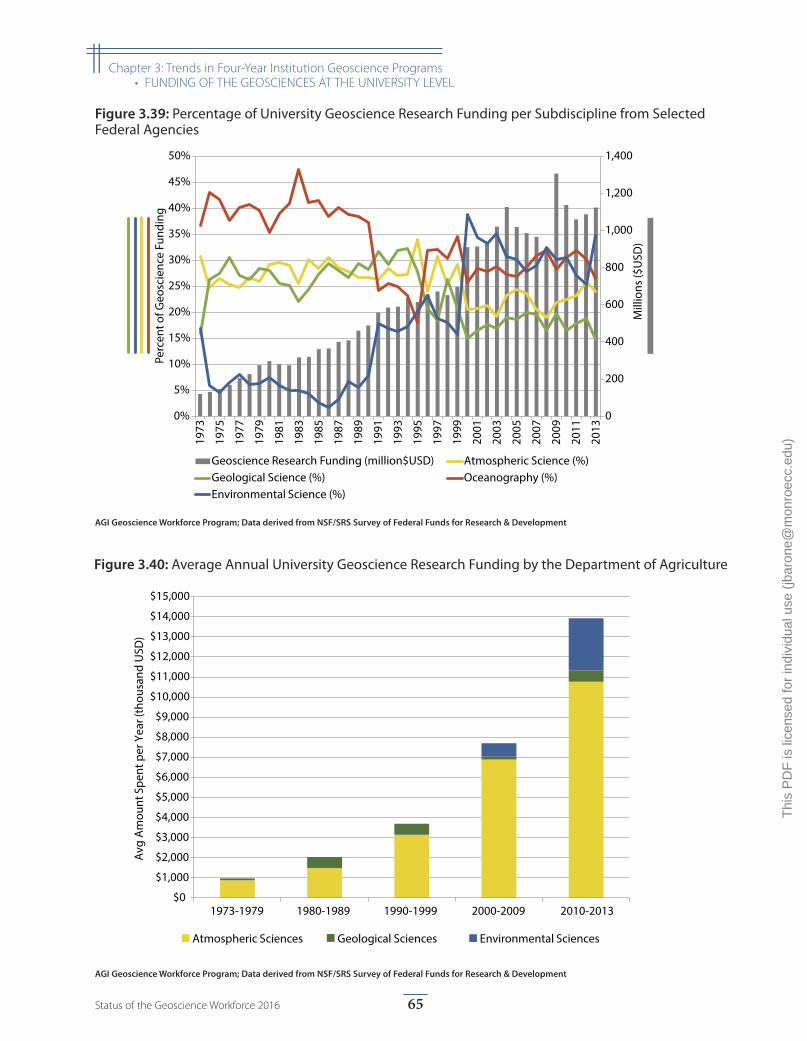
$0
$1,000
$2,000
$3,000
$4,000
$5,000
$6,000
$7,000
$8,000
$9,000
$10,000
$11,000
$12,000
$13,000
$14,000
$15,000
1973-1979 1980-1989 1990-1999 2000-2009 2010-2013
Avg
Am
ount
Spe
nt p
er Y
ear (
thou
sand
USD
)
Atmospheric Sciences Geological Sciences Environmental Sciences
Figure 3.40: Average Annual University Geoscience Research Funding by the Department of Agriculture
AGI Geoscience Workforce Program; Data derived from NSF/SRS Survey of Federal Funds for Research & Development
0
200
400
600
800
1,000
1,200
1,400
0%
5%
10%
15%
20%
25%
30%
35%
40%
45%
50%
1973
1975
1977
1979
1981
1983
1985
1987
1989
1991
1993
1995
1997
1999
2001
2003
2005
2007
2009
2011
2013
Mill
ions
($U
SD)
Perc
ent o
f Geo
scie
nce
Fund
ing
Geoscience Research Funding (million$USD) Atmospheric Science (%)Geological Science (%) Oceanography (%)Environmental Science (%)
Figure 3.39: Percentage of University Geoscience Research Funding per Subdiscipline from Selected Federal Agencies
AGI Geoscience Workforce Program; Data derived from NSF/SRS Survey of Federal Funds for Research & Development
65Status of the Geoscience Workforce 2016
|| Chapter 3: Trends in Four-Year Institution Geoscience Programs• FUNDING OF THE GEOSCIENCES AT THE UNIVERSITY LEVEL
Thi
s P
DF
is li
cens
ed fo
r in
divi
dual
use
(jb
aron
e@m
onro
ecc.
edu)
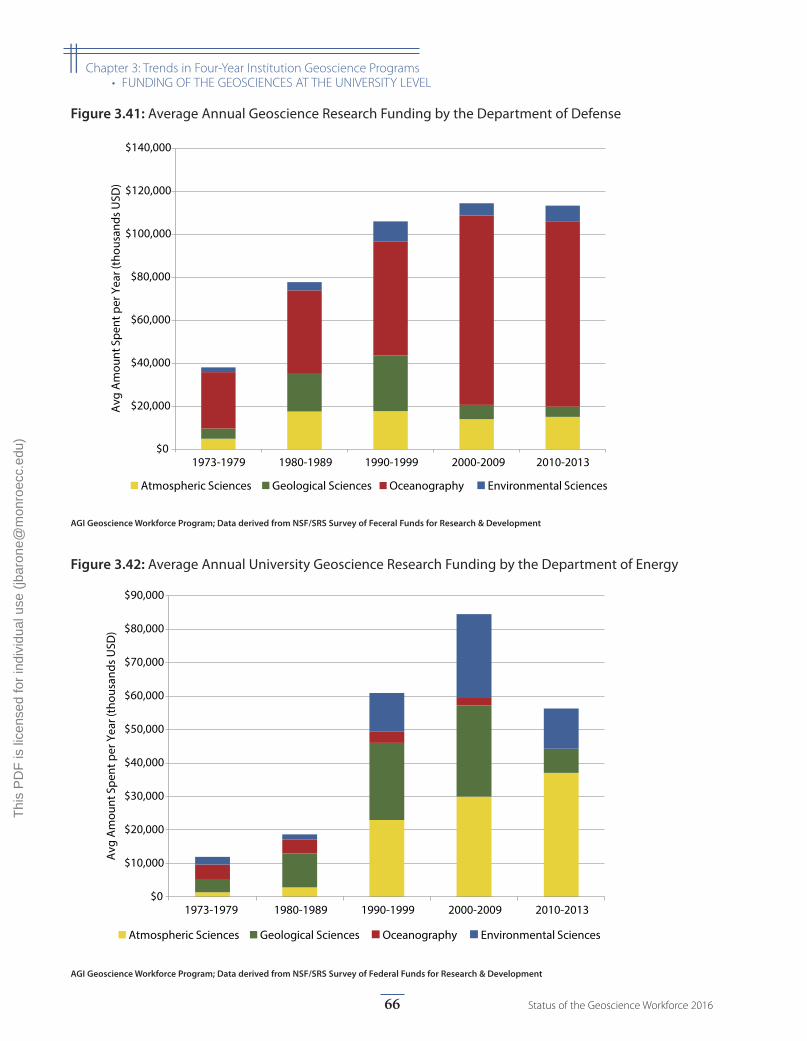
$0
$10,000
$20,000
$30,000
$40,000
$50,000
$60,000
$70,000
$80,000
$90,000
1973-1979 1980-1989 1990-1999 2000-2009 2010-2013
Avg
Am
ount
Spe
nt p
er Y
ear (
thou
sand
s U
SD)
Atmospheric Sciences Geological Sciences Oceanography Environmental Sciences
Figure 3.42: Average Annual University Geoscience Research Funding by the Department of Energy
AGI Geoscience Workforce Program; Data derived from NSF/SRS Survey of Federal Funds for Research & Development
$0
$20,000
$40,000
$60,000
$80,000
$100,000
$120,000
$140,000
1973-1979 1980-1989 1990-1999 2000-2009 2010-2013
Avg
Am
ount
Spe
nt p
er Y
ear (
thou
sand
s U
SD)
Atmospheric Sciences Geological Sciences Oceanography Environmental Sciences
Figure 3.41: Average Annual Geoscience Research Funding by the Department of Defense
AGI Geoscience Workforce Program; Data derived from NSF/SRS Survey of Feceral Funds for Research & Development
66 Status of the Geoscience Workforce 2016
|| Chapter 3: Trends in Four-Year Institution Geoscience Programs• FUNDING OF THE GEOSCIENCES AT THE UNIVERSITY LEVEL
Thi
s P
DF
is li
cens
ed fo
r in
divi
dual
use
(jb
aron
e@m
onro
ecc.
edu)
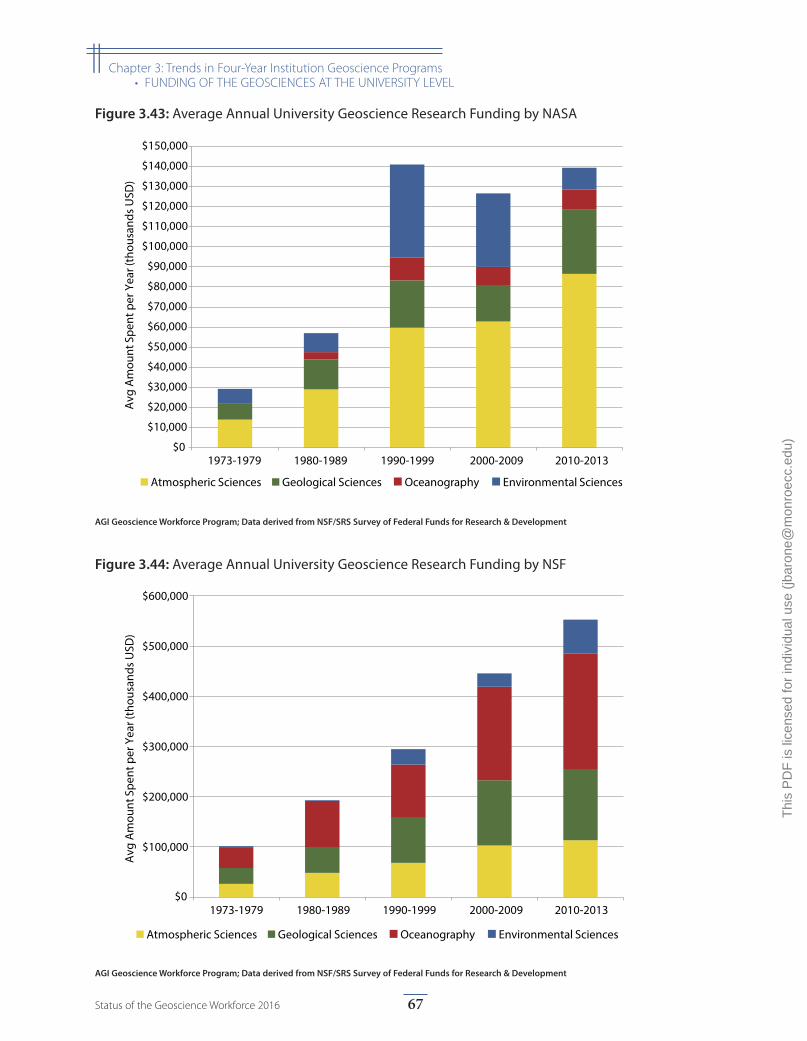
$0
$100,000
$200,000
$300,000
$400,000
$500,000
$600,000
1973-1979 1980-1989 1990-1999 2000-2009 2010-2013
Avg
Am
ount
Spe
nt p
er Y
ear (
thou
sand
s U
SD)
Atmospheric Sciences Geological Sciences Oceanography Environmental Sciences
Figure 3.44: Average Annual University Geoscience Research Funding by NSF
AGI Geoscience Workforce Program; Data derived from NSF/SRS Survey of Federal Funds for Research & Development
$0
$10,000
$20,000
$30,000
$40,000
$50,000
$60,000
$70,000
$80,000
$90,000
$100,000
$110,000
$120,000
$130,000
$140,000
$150,000
1973-1979 1980-1989 1990-1999 2000-2009 2010-2013
Avg
Am
ount
Spe
nt p
er Y
ear (
thou
sand
s U
SD)
Atmospheric Sciences Geological Sciences Oceanography Environmental Sciences
Figure 3.43: Average Annual University Geoscience Research Funding by NASA
AGI Geoscience Workforce Program; Data derived from NSF/SRS Survey of Federal Funds for Research & Development
67Status of the Geoscience Workforce 2016
|| Chapter 3: Trends in Four-Year Institution Geoscience Programs• FUNDING OF THE GEOSCIENCES AT THE UNIVERSITY LEVEL
Thi
s P
DF
is li
cens
ed fo
r in
divi
dual
use
(jb
aron
e@m
onro
ecc.
edu)

0%
5%
10%
15%
20%
25%
30%
35%
40%
45%
50%
55%
2006 2007 2008 2009 2010 2011 2012 2013 2014 2015
Fund
ing
Rate
All Geosciences (GEO) Atmospheric and Geospace Sciences (AGS)Earth Sciences (EAR) Ocean Sciences (OCE) Polar Programs (PLR)
Figure 3.46: Funding Rates of Geoscience Proposals at NSF by GEO Division
AGI Geoscience Workforce Program; Data derived from NSF's BIIS Funding Trends database
0%
5%
10%
15%
20%
25%
30%
35%
40%
45%
50%
0
1000
2000
3000
4000
5000
6000
7000
2006 2007 2008 2009 2010 2011 2012 2013 2014 2015
Fund
ing
Rate
Num
ber o
f Pro
posa
ls o
r Aw
ards
Number of Proposals Number of Awards Funding Rate (%)
Figure 3.45: Funding of Geoscience Proposals at NSF
AGI Geoscience Workforce Program; Data derived from NSF's BIIS Funding Trends database
68 Status of the Geoscience Workforce 2016
|| Chapter 3: Trends in Four-Year Institution Geoscience Programs• FUNDING OF THE GEOSCIENCES AT THE UNIVERSITY LEVEL
Thi
s P
DF
is li
cens
ed fo
r in
divi
dual
use
(jb
aron
e@m
onro
ecc.
edu)
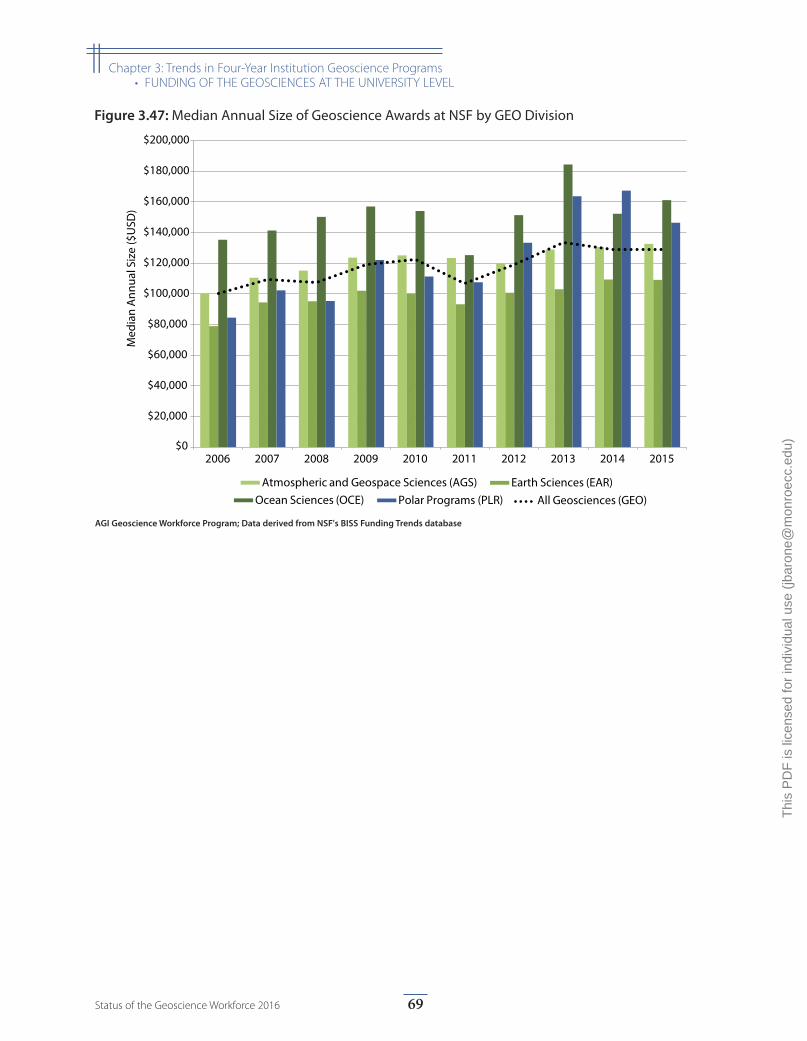
$0
$20,000
$40,000
$60,000
$80,000
$100,000
$120,000
$140,000
$160,000
$180,000
$200,000
2006 2007 2008 2009 2010 2011 2012 2013 2014 2015
Med
ian
Ann
ual S
ize
($U
SD)
Earth Sciences (EAR)Atmospheric and Geospace Sciences (AGS)Ocean Sciences (OCE) Polar Programs (PLR) All Geosciences (GEO)
Figure 3.47: Median Annual Size of Geoscience Awards at NSF by GEO Division
AGI Geoscience Workforce Program; Data derived from NSF's BISS Funding Trends database
69Status of the Geoscience Workforce 2016
|| Chapter 3: Trends in Four-Year Institution Geoscience Programs• FUNDING OF THE GEOSCIENCES AT THE UNIVERSITY LEVEL
Thi
s P
DF
is li
cens
ed fo
r in
divi
dual
use
(jb
aron
e@m
onro
ecc.
edu)
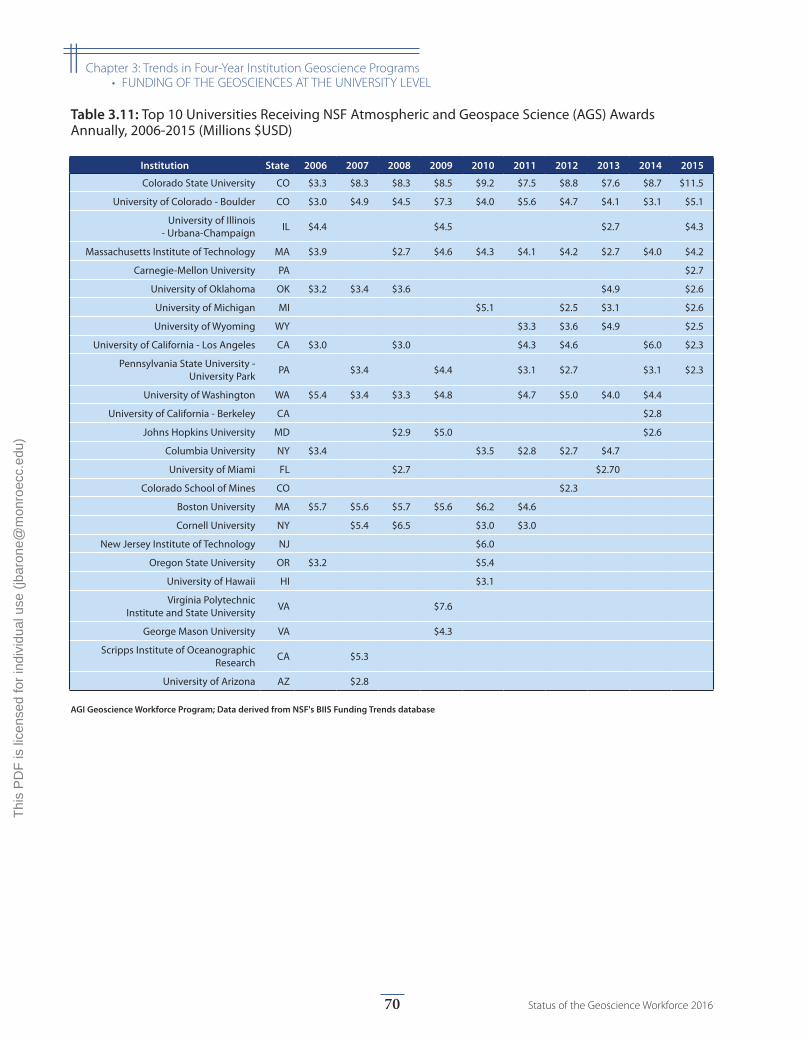
Institution State 2006 2007 2008 2009 2010 2011 2012 2013 2014 2015
Colorado State University CO $3.3 $8.3 $8.3 $8.5 $9.2 $7.5 $8.8 $7.6 $8.7 $11.5
University of Colorado - Boulder CO $3.0 $4.9 $4.5 $7.3 $4.0 $5.6 $4.7 $4.1 $3.1 $5.1
University of Illinois - Urbana-Champaign IL $4.4 $4.5 $2.7 $4.3
Massachusetts Institute of Technology MA $3.9 $2.7 $4.6 $4.3 $4.1 $4.2 $2.7 $4.0 $4.2
Carnegie-Mellon University PA $2.7
University of Oklahoma OK $3.2 $3.4 $3.6 $4.9 $2.6
University of Michigan MI $5.1 $2.5 $3.1 $2.6
University of Wyoming WY $3.3 $3.6 $4.9 $2.5
University of California - Los Angeles CA $3.0 $3.0 $4.3 $4.6 $6.0 $2.3
Pennsylvania State University - University Park PA $3.4 $4.4 $3.1 $2.7 $3.1 $2.3
University of Washington WA $5.4 $3.4 $3.3 $4.8 $4.7 $5.0 $4.0 $4.4
University of California - Berkeley CA $2.8
Johns Hopkins University MD $2.9 $5.0 $2.6
Columbia University NY $3.4 $3.5 $2.8 $2.7 $4.7
University of Miami FL $2.7 $2.70
Colorado School of Mines CO $2.3
Boston University MA $5.7 $5.6 $5.7 $5.6 $6.2 $4.6
Cornell University NY $5.4 $6.5 $3.0 $3.0
New Jersey Institute of Technology NJ $6.0
Oregon State University OR $3.2 $5.4
University of Hawaii HI $3.1
Virginia Polytechnic Institute and State University VA $7.6
George Mason University VA $4.3
Scripps Institute of Oceanographic Research CA $5.3
University of Arizona AZ $2.8
Table 3.11: Top 10 Universities Receiving NSF Atmospheric and Geospace Science (AGS) Awards Annually, 2006-2015 (Millions $USD)
AGI Geoscience Workforce Program; Data derived from NSF's BIIS Funding Trends database
70 Status of the Geoscience Workforce 2016
|| Chapter 3: Trends in Four-Year Institution Geoscience Programs• FUNDING OF THE GEOSCIENCES AT THE UNIVERSITY LEVEL
Thi
s P
DF
is li
cens
ed fo
r in
divi
dual
use
(jb
aron
e@m
onro
ecc.
edu)
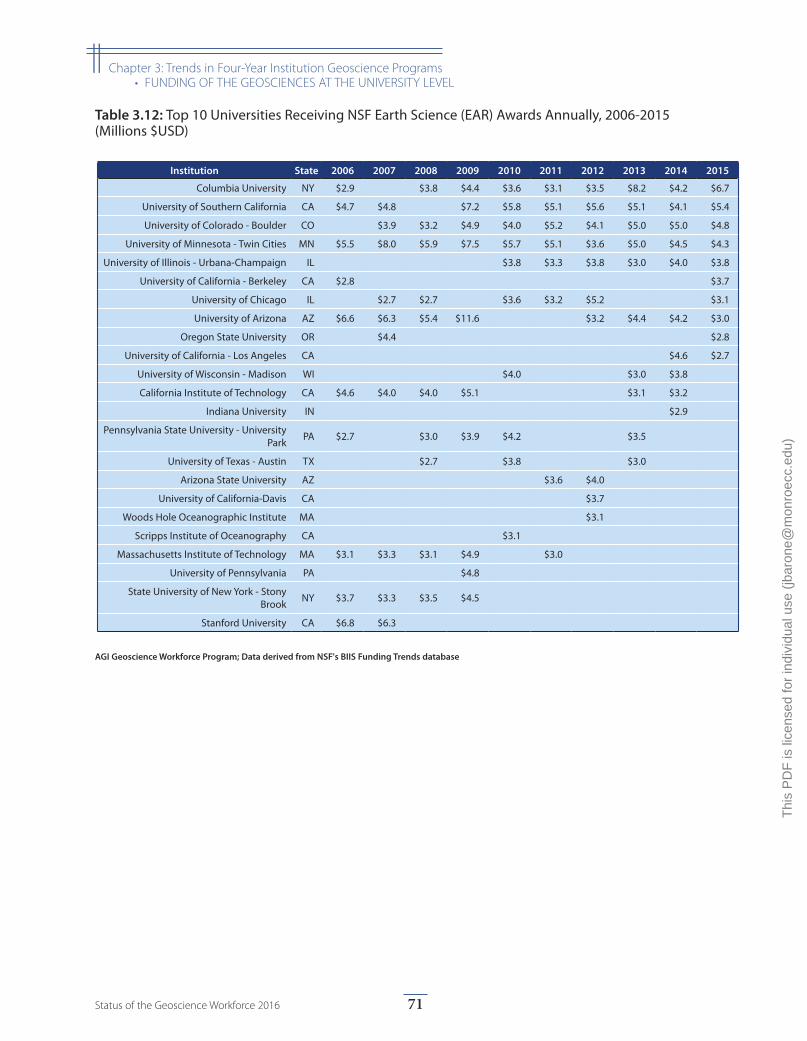
Institution State 2006 2007 2008 2009 2010 2011 2012 2013 2014 2015
Columbia University NY $2.9 $3.8 $4.4 $3.6 $3.1 $3.5 $8.2 $4.2 $6.7
University of Southern California CA $4.7 $4.8 $7.2 $5.8 $5.1 $5.6 $5.1 $4.1 $5.4
University of Colorado - Boulder CO $3.9 $3.2 $4.9 $4.0 $5.2 $4.1 $5.0 $5.0 $4.8
University of Minnesota - Twin Cities MN $5.5 $8.0 $5.9 $7.5 $5.7 $5.1 $3.6 $5.0 $4.5 $4.3
University of Illinois - Urbana-Champaign IL $3.8 $3.3 $3.8 $3.0 $4.0 $3.8
University of California - Berkeley CA $2.8 $3.7
University of Chicago IL $2.7 $2.7 $3.6 $3.2 $5.2 $3.1
University of Arizona AZ $6.6 $6.3 $5.4 $11.6 $3.2 $4.4 $4.2 $3.0
Oregon State University OR $4.4 $2.8
University of California - Los Angeles CA $4.6 $2.7
University of Wisconsin - Madison WI $4.0 $3.0 $3.8
California Institute of Technology CA $4.6 $4.0 $4.0 $5.1 $3.1 $3.2
Indiana University IN $2.9
Pennsylvania State University - University Park PA $2.7 $3.0 $3.9 $4.2 $3.5
University of Texas - Austin TX $2.7 $3.8 $3.0
Arizona State University AZ $3.6 $4.0
University of California-Davis CA $3.7
Woods Hole Oceanographic Institute MA $3.1
Scripps Institute of Oceanography CA $3.1
Massachusetts Institute of Technology MA $3.1 $3.3 $3.1 $4.9 $3.0
University of Pennsylvania PA $4.8
State University of New York - Stony Brook NY $3.7 $3.3 $3.5 $4.5
Stanford University CA $6.8 $6.3
Table 3.12: Top 10 Universities Receiving NSF Earth Science (EAR) Awards Annually, 2006-2015 (Millions $USD)
AGI Geoscience Workforce Program; Data derived from NSF's BIIS Funding Trends database
71Status of the Geoscience Workforce 2016
|| Chapter 3: Trends in Four-Year Institution Geoscience Programs• FUNDING OF THE GEOSCIENCES AT THE UNIVERSITY LEVEL
Thi
s P
DF
is li
cens
ed fo
r in
divi
dual
use
(jb
aron
e@m
onro
ecc.
edu)
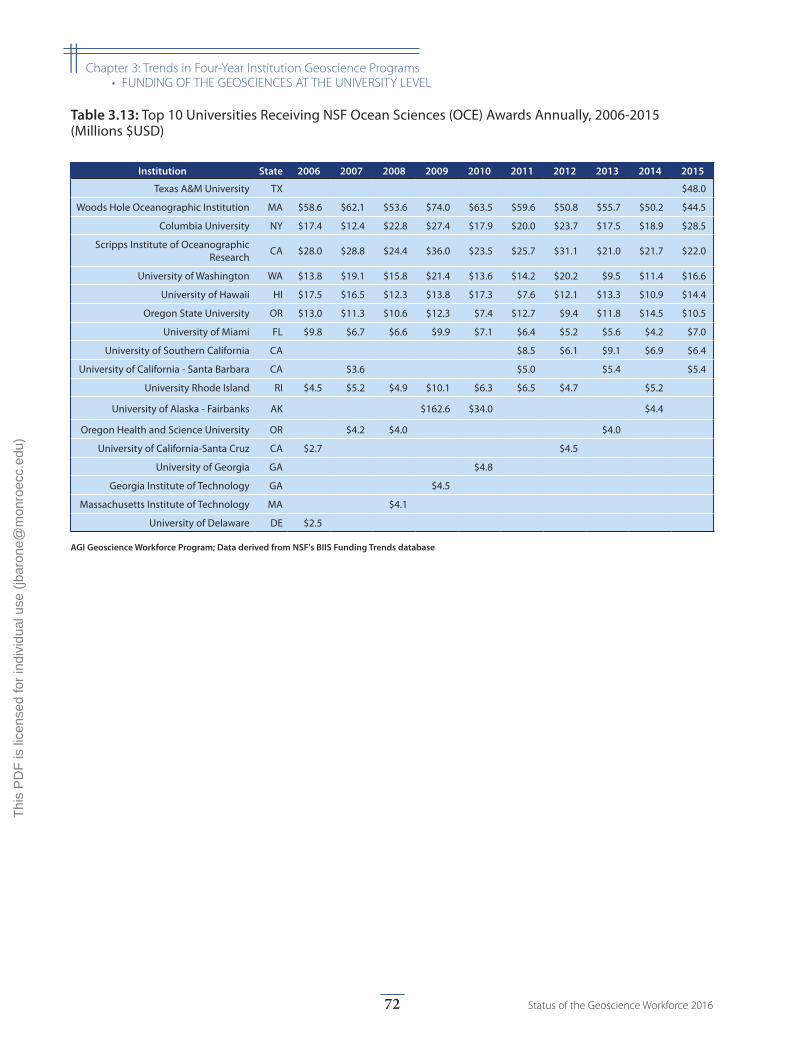
Institution State 2006 2007 2008 2009 2010 2011 2012 2013 2014 2015
Texas A&M University TX $48.0
Woods Hole Oceanographic Institution MA $58.6 $62.1 $53.6 $74.0 $63.5 $59.6 $50.8 $55.7 $50.2 $44.5
Columbia University NY $17.4 $12.4 $22.8 $27.4 $17.9 $20.0 $23.7 $17.5 $18.9 $28.5
Scripps Institute of Oceanographic Research CA $28.0 $28.8 $24.4 $36.0 $23.5 $25.7 $31.1 $21.0 $21.7 $22.0
University of Washington WA $13.8 $19.1 $15.8 $21.4 $13.6 $14.2 $20.2 $9.5 $11.4 $16.6
University of Hawaii HI $17.5 $16.5 $12.3 $13.8 $17.3 $7.6 $12.1 $13.3 $10.9 $14.4
Oregon State University OR $13.0 $11.3 $10.6 $12.3 $7.4 $12.7 $9.4 $11.8 $14.5 $10.5
University of Miami FL $9.8 $6.7 $6.6 $9.9 $7.1 $6.4 $5.2 $5.6 $4.2 $7.0
University of Southern California CA $8.5 $6.1 $9.1 $6.9 $6.4
University of California - Santa Barbara CA $3.6 $5.0 $5.4 $5.4
University Rhode Island RI $4.5 $5.2 $4.9 $10.1 $6.3 $6.5 $4.7 $5.2
University of Alaska - Fairbanks AK $162.6 $34.0 $4.4
Oregon Health and Science University OR $4.2 $4.0 $4.0
University of California-Santa Cruz CA $2.7 $4.5
University of Georgia GA $4.8
Georgia Institute of Technology GA $4.5
Massachusetts Institute of Technology MA $4.1
University of Delaware DE $2.5
Table 3.13: Top 10 Universities Receiving NSF Ocean Sciences (OCE) Awards Annually, 2006-2015 (Millions $USD)
AGI Geoscience Workforce Program; Data derived from NSF's BIIS Funding Trends database
72 Status of the Geoscience Workforce 2016
|| Chapter 3: Trends in Four-Year Institution Geoscience Programs• FUNDING OF THE GEOSCIENCES AT THE UNIVERSITY LEVEL
Thi
s P
DF
is li
cens
ed fo
r in
divi
dual
use
(jb
aron
e@m
onro
ecc.
edu)
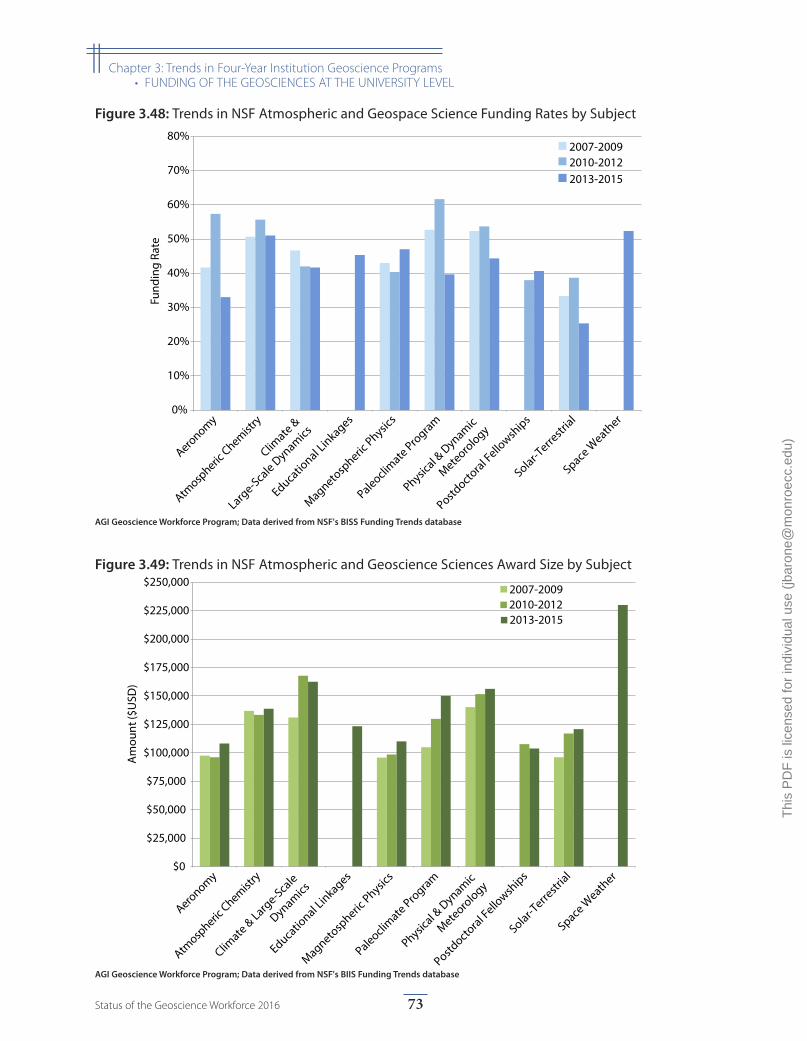
$0
$25,000
$50,000
$75,000
$100,000
$125,000
$150,000
$175,000
$200,000
$225,000
$250,000
Aeronomy
Atmosp
heric Chemist
ry
Climate & Larg
e-Scale
Dynamics
Educational L
inkages
Magnetosp
heric Physic
s
Paleoclimate Pro
gram
Physical &
Dynamic
Meteorology
Postdocto
ral Fello
wships
Solar-Terre
strial
Space Weath
er
Am
ount
($U
SD)
2007-20092010-20122013-2015
Figure 3.49: Trends in NSF Atmospheric and Geoscience Sciences Award Size by Subject
AGI Geoscience Workforce Program; Data derived from NSF's BIIS Funding Trends database
0%
10%
20%
30%
40%
50%
60%
70%
80%
Fund
ing
Rate
2007-20092010-20122013-2015
Aeronomy
Atmosp
heric Chemist
ry
Climate &
Large-Scale D
ynamics
Educational L
inkages
Magnetosp
heric Physic
s
Paleoclimate Pro
gram
Physical &
Dynamic
Meteorology
Postdocto
ral Fello
wships
Solar-Terre
strial
Space Weath
er
Figure 3.48: Trends in NSF Atmospheric and Geospace Science Funding Rates by Subject
AGI Geoscience Workforce Program; Data derived from NSF's BISS Funding Trends database
73Status of the Geoscience Workforce 2016
|| Chapter 3: Trends in Four-Year Institution Geoscience Programs• FUNDING OF THE GEOSCIENCES AT THE UNIVERSITY LEVEL
Thi
s P
DF
is li
cens
ed fo
r in
divi
dual
use
(jb
aron
e@m
onro
ecc.
edu)
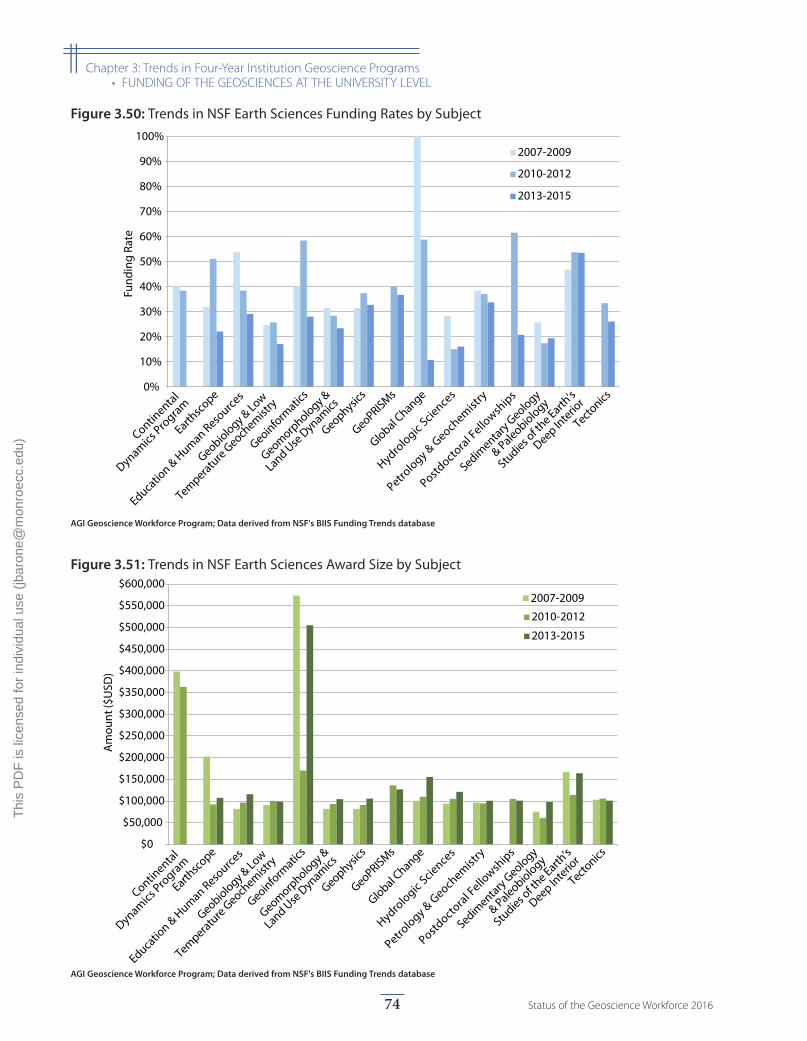
$0
$50,000
$100,000
$150,000
$200,000
$250,000
$300,000
$350,000
$400,000
$450,000
$500,000
$550,000
$600,000
Am
ount
($U
SD)
2007-2009
2010-2012
2013-2015
Continental
Dynamics Pro
gram
Earthsco
pe
Educatio
n & Human Reso
urces
Geobiology & Low
Temperature Geoch
emistry
Geoinformatic
s
Geomorphology &
Land Use D
ynamics
Geophysics
GeoPRISMs
Global Change
Hydrologic Sciences
Petrology & G
eochemistry
Postdocto
ral Fello
wships
Sedimentary Geology
& Paleobiology
Studies o
f the Earth
’s
Deep Interio
r
Tectonics
Figure 3.51: Trends in NSF Earth Sciences Award Size by Subject
AGI Geoscience Workforce Program; Data derived from NSF's BIIS Funding Trends database
0%
10%
20%
30%
40%
50%
60%
70%
80%
90%
100%Fu
ndin
g Ra
te
2007-2009
2010-2012
2013-2015
Continental
Dynamics Pro
gram
Earthsco
pe
Educatio
n & Human Reso
urces
Geobiology & Low
Temperature Geoch
emistry
Geoinformatic
s
Geomorphology &
Land Use D
ynamics
Geophysics
GeoPRISMs
Global Change
Hydrologic Sciences
Petrology & G
eochemistry
Postdocto
ral Fello
wships
Sedimentary Geology
& Paleobiology
Studies o
f the Earth
’s
Deep Interio
r
Tectonics
Figure 3.50: Trends in NSF Earth Sciences Funding Rates by Subject
AGI Geoscience Workforce Program; Data derived from NSF's BIIS Funding Trends database
74 Status of the Geoscience Workforce 2016
|| Chapter 3: Trends in Four-Year Institution Geoscience Programs• FUNDING OF THE GEOSCIENCES AT THE UNIVERSITY LEVEL
Thi
s P
DF
is li
cens
ed fo
r in
divi
dual
use
(jb
aron
e@m
onro
ecc.
edu)
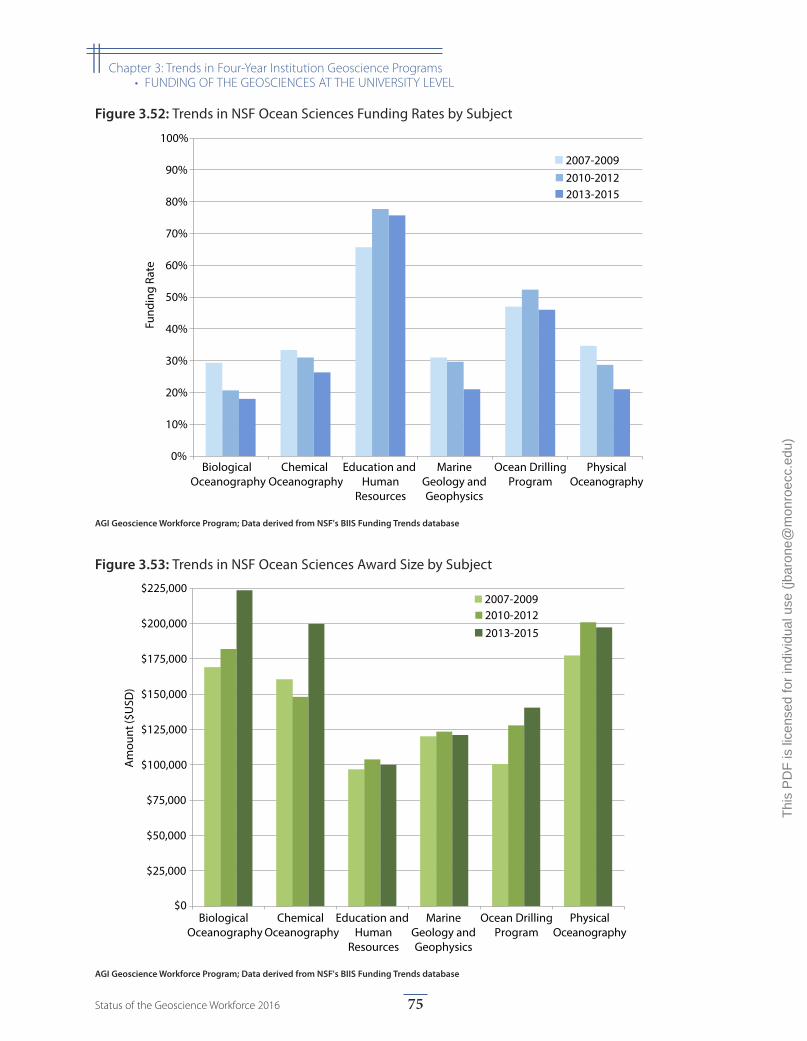
$0
$25,000
$50,000
$75,000
$100,000
$125,000
$150,000
$175,000
$200,000
$225,000
Biological Oceanography
Chemical Oceanography
Education and Human
Resources
MarineGeology andGeophysics
Ocean DrillingProgram
PhysicalOceanography
Am
ount
($U
SD)
2007-20092010-20122013-2015
Figure 3.53: Trends in NSF Ocean Sciences Award Size by Subject
AGI Geoscience Workforce Program; Data derived from NSF's BIIS Funding Trends database
0%
10%
20%
30%
40%
50%
60%
70%
80%
90%
100%Fu
ndin
g Ra
te 2007-20092010-20122013-2015
Biological Oceanography
Chemical Oceanography
Education and Human
Resources
MarineGeology andGeophysics
Ocean DrillingProgram
PhysicalOceanography
Figure 3.52: Trends in NSF Ocean Sciences Funding Rates by Subject
AGI Geoscience Workforce Program; Data derived from NSF's BIIS Funding Trends database
75Status of the Geoscience Workforce 2016
|| Chapter 3: Trends in Four-Year Institution Geoscience Programs• FUNDING OF THE GEOSCIENCES AT THE UNIVERSITY LEVEL
Thi
s P
DF
is li
cens
ed fo
r in
divi
dual
use
(jb
aron
e@m
onro
ecc.
edu)
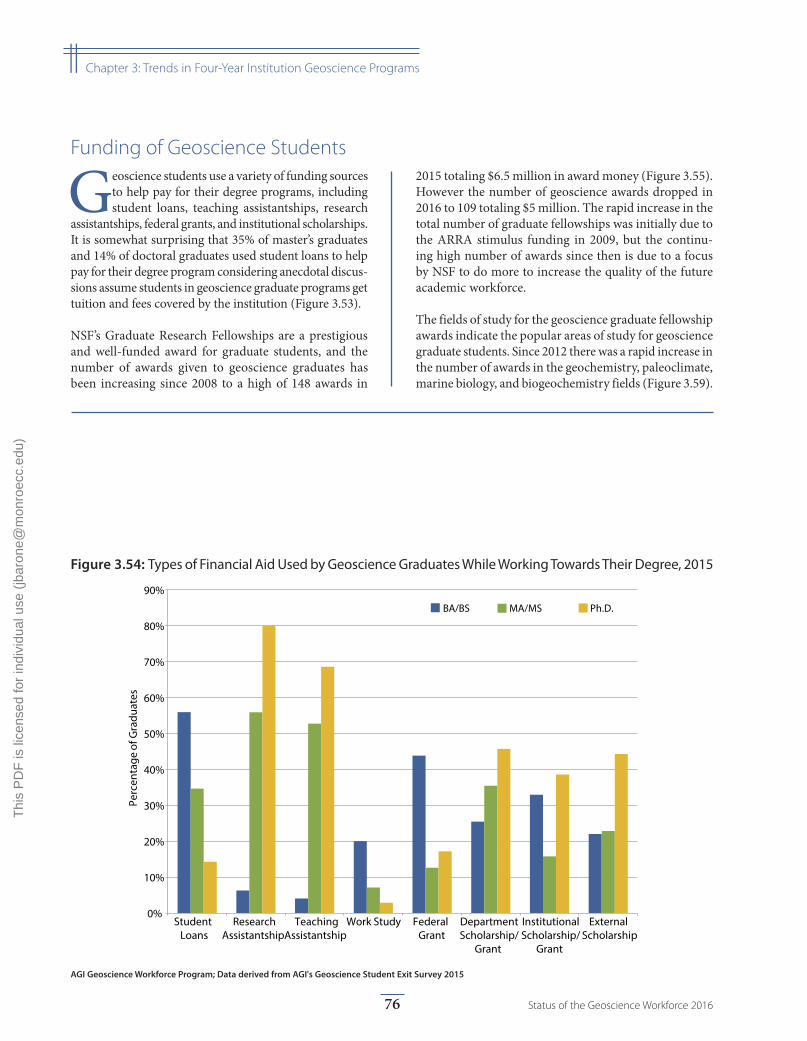
0%
10%
20%
30%
40%
50%
60%
70%
80%
90%
Student Loans
ResearchAssistantship
TeachingAssistantship
Work Study Federal Grant
DepartmentScholarship/
Grant
InstitutionalScholarship/
Grant
External Scholarship
Perc
enta
ge o
f Gra
duat
es
BA/BS MA/MS Ph.D.
Figure 3.54: Types of Financial Aid Used by Geoscience Graduates While Working Towards Their Degree, 2015
AGI Geoscience Workforce Program; Data derived from AGI's Geoscience Student Exit Survey 2015
Funding of Geoscience Students
Geoscience students use a variety of funding sources to help pay for their degree programs, including student loans, teaching assistantships, research
assistantships, federal grants, and institutional scholarships. It is somewhat surprising that 35% of master’s graduates and 14% of doctoral graduates used student loans to help pay for their degree program considering anecdotal discus-sions assume students in geoscience graduate programs get tuition and fees covered by the institution (Figure 3.53).
NSF’s Graduate Research Fellowships are a prestigious and well-funded award for graduate students, and the number of awards given to geoscience graduates has been increasing since 2008 to a high of 148 awards in
2015 totaling $6.5 million in award money (Figure 3.55). However the number of geoscience awards dropped in 2016 to 109 totaling $5 million. The rapid increase in the total number of graduate fellowships was initially due to the ARRA stimulus funding in 2009, but the continu-ing high number of awards since then is due to a focus by NSF to do more to increase the quality of the future academic workforce.
The fields of study for the geoscience graduate fellowship awards indicate the popular areas of study for geoscience graduate students. Since 2012 there was a rapid increase in the number of awards in the geochemistry, paleoclimate, marine biology, and biogeochemistry fields (Figure 3.59).
76 Status of the Geoscience Workforce 2016
|| Chapter 3: Trends in Four-Year Institution Geoscience Programs
Thi
s P
DF
is li
cens
ed fo
r in
divi
dual
use
(jb
aron
e@m
onro
ecc.
edu)
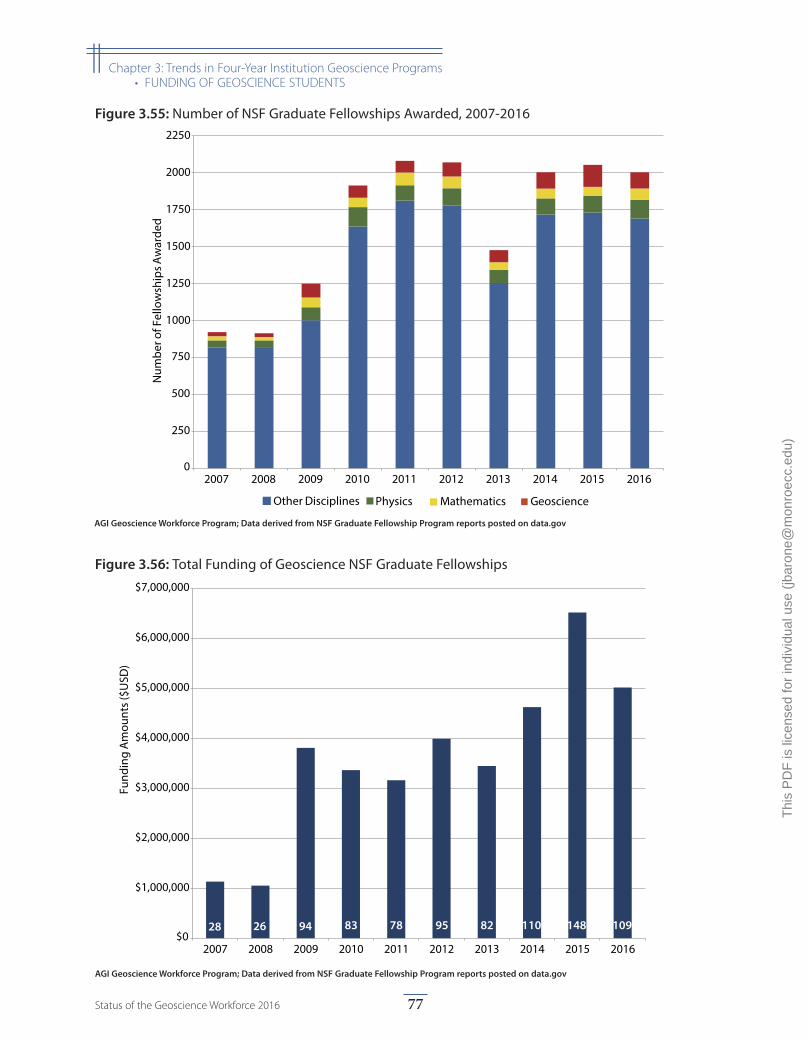
$0
$1,000,000
$2,000,000
$3,000,000
$4,000,000
$5,000,000
$6,000,000
$7,000,000
2007 2008 2009 2010 2011 2012 2013 2014 2015 2016
Fund
ing
Am
ount
s ($U
SD)
28 26 94 83 78 95 82 110 148 109
Figure 3.56: Total Funding of Geoscience NSF Graduate Fellowships
AGI Geoscience Workforce Program; Data derived from NSF Graduate Fellowship Program reports posted on data.gov
0
250
500
750
1000
1250
1500
1750
2000
2250
2007 2008 2009 2010 2011 2012 2013 2014 2015 2016
Num
ber o
f Fel
low
ship
s Aw
arde
d
Other Disciplines Physics Mathematics Geoscience
Figure 3.55: Number of NSF Graduate Fellowships Awarded, 2007-2016
AGI Geoscience Workforce Program; Data derived from NSF Graduate Fellowship Program reports posted on data.gov
77Status of the Geoscience Workforce 2016
|| Chapter 3: Trends in Four-Year Institution Geoscience Programs• FUNDING OF GEOSCIENCE STUDENTS
Thi
s P
DF
is li
cens
ed fo
r in
divi
dual
use
(jb
aron
e@m
onro
ecc.
edu)
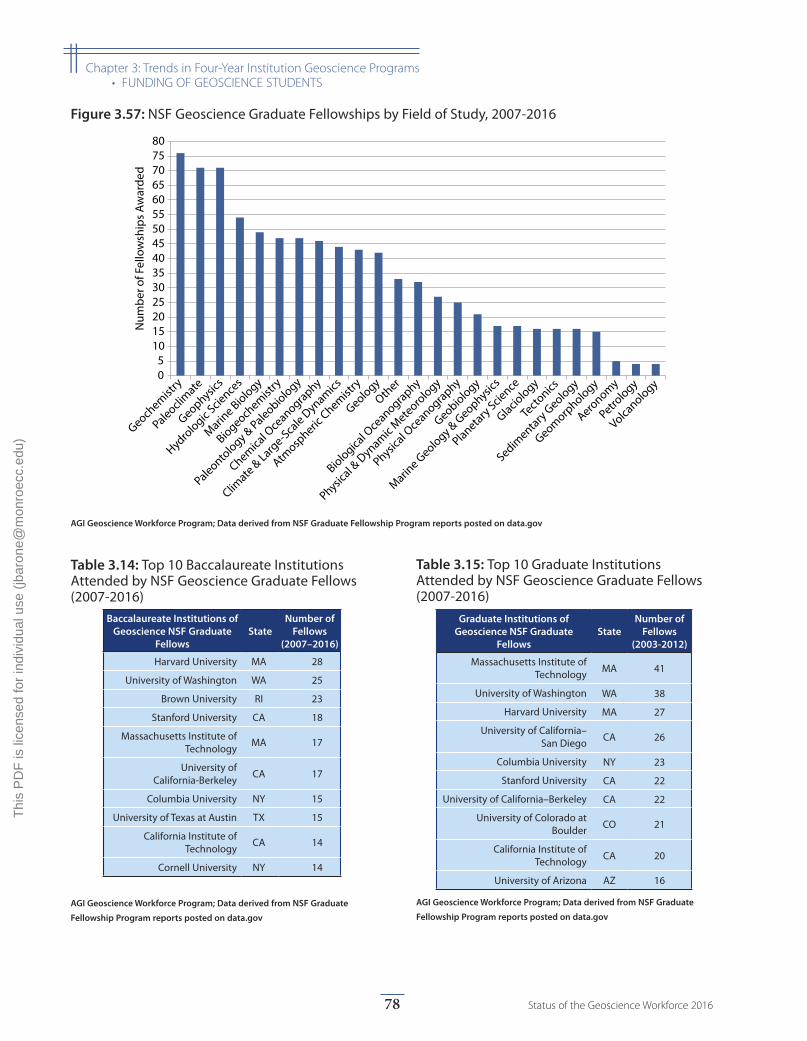
Baccalaureate Institutions of Geoscience NSF Graduate
FellowsState
Number of Fellows
(2007–2016)
Harvard University MA 28
University of Washington WA 25
Brown University RI 23
Stanford University CA 18
Massachusetts Institute of Technology MA 17
University of California-Berkeley CA 17
Columbia University NY 15
University of Texas at Austin TX 15
California Institute of Technology CA 14
Cornell University NY 14
Table 3.14: Top 10 Baccalaureate Institutions Attended by NSF Geoscience Graduate Fellows (2007-2016)
AGI Geoscience Workforce Program; Data derived from NSF Graduate
Fellowship Program reports posted on data.gov
Graduate Institutions of Geoscience NSF Graduate Fellows State Number of Fellows
(2007-2016)
University of Washington WA 44
University of California-San Diego CA 42
Massachusetts Institute of Technology MA 41
Columbia University NY 34
University of California-Berkeley CA 34
California Institute of Technology CA 28
Harvard University MA 27
University of Colorado at Boulder CO 25
Stanford University CA 24
University of Arizona AZ 24
Graduate Institutions of Geoscience NSF Graduate
FellowsState
Number of Fellows
(2003-2012)
Massachusetts Institute of Technology MA 41
University of Washington WA 38
Harvard University MA 27
University of California–San Diego CA 26
Columbia University NY 23
Stanford University CA 22
University of California–Berkeley CA 22
University of Colorado at Boulder CO 21
California Institute of Technology CA 20
University of Arizona AZ 16
Table 3.15: Top 10 Graduate Institutions Attended by NSF Geoscience Graduate Fellows (2007-2016)
AGI Geoscience Workforce Program; Data derived from NSF Graduate
Fellowship Program reports posted on data.gov
0 5
10 15 20 25 30 35 40 45 50 55 60 65 70 75 80
Num
ber o
f Fel
low
ship
s Aw
arde
d
Volcanology
Petrology
Aeronomy
Geomorphology
Sedimentary G
eology
Tecto
nics
Glaciology
Planetary Science
Marine G
eology & Geophysic
s
Geobiology
Physical O
ceanography
Physical &
Dynamic
Meteorology
Biological O
ceanographyOth
er
Geology
Atmosp
heric Chemist
ry
Climate & Larg
e-Scale D
ynamics
Chemical O
ceanography
Paleontology & Paleobiology
Biogeochemist
ry
Marine Biology
Hydrologic
Science
s
Geophysics
Paleoclimate
Geochemist
ry
Figure 3.57: NSF Geoscience Graduate Fellowships by Field of Study, 2007-2016
AGI Geoscience Workforce Program; Data derived from NSF Graduate Fellowship Program reports posted on data.gov
78 Status of the Geoscience Workforce 2016
|| Chapter 3: Trends in Four-Year Institution Geoscience Programs• FUNDING OF GEOSCIENCE STUDENTS
Thi
s P
DF
is li
cens
ed fo
r in
divi
dual
use
(jb
aron
e@m
onro
ecc.
edu)
Chapter 4: Trends in Geoscience Employment — Examining Student Transitions and Workforce Dynamics
When discussing current and projected employ-ment needs for the geosciences, the two major critical issues that face the geoscience work-
force are the rate at which new talent transitions into geoscience professions and the rapid loss of experienced talent as they retire. Over the last several years, the improved employment prospects for geoscientists has spurred increase enrollments and awarded degrees within geoscience programs.
According to the Bureau of Labor Statistics (BLS), there were a total of 324,411 geoscience jobs in 2014, and this number is expected to increase by 10% by 2024 to a total of 355,862 jobs. Approximately, 156,000 geosci-entists are expected to retire by 2024, but over the next decade, approximately 58,000 students will be graduat-ing with their bachelor’s, master’s, or doctoral degrees in the geosciences and entering the geoscience workforce. Therefore, assuming minimal non-retirement attrition from the geoscience workforce, there is expected to be a deficit of approximately 90,000 geoscientists by 2024—a decrease from the previously predicted 135,000 geoscien-tists deficit. The projections based on the 2014 employ-ment numbers present a smaller percentage increase in geoscience jobs over the next decade compared to the projections presented in 2012. Some of this can be attributed to changes in the oil and gas industry. The projected increase in jobs for petroleum engineers for the 2014-2024 time period was less than projected increase presented for the 2012-2022 time period. This decrease in the deficit of geoscience jobs can also be attributed to continued increases in enrollments and degrees awarded at the bachelor’s and master’s degree levels.
Over the past couple of years, there has been a steady downturn in the oil and gas industry, which has led to an increase in layoffs and a shifting in needs assessed within the industry. However, through discussions with industry representatives and through data collected by AGI, it appears that most of the layoffs occurred for mid-career and late-career employees. The industry is still hiring
recent graduates at similar rates as in previous years, particularly among master’s graduates. The environmental industry appears to be hiring more bachelor’s graduates in 2015 than any other industry. Growth in the environ-mental industry can also be seen in the data provided by the Bureau of Labor Statistics through increases in employment in the environmental scientist and environ-mental engineer occupations. With multiple years of AGI’s Exit Survey data, the connections between the various degree fields within the geosciences to industries hiring these graduates are becoming clearer and highlighting the diversity of career options for geoscience graduates.
While some industries and companies are working to bridge the future gap in the geoscience workforce, the federal and mining workforce are predicted to have nega-tive growth in employment over the next decade with a decrease of 6% of mining jobs and 8% in federal jobs according to the Bureau of Labor Statistics. However, at least for the mining industry, this prediction of job loss might change as the industry conditions improve. The National Mining Association reported an increase in young geoscientists entering the mining industry and in support activities for mining and oil and gas, and economic indices have shown growth in the yield and value of minerals from U.S. mines. For some minerals, the number of mines in the U.S. has also increased.
Future research at AGI will be focused on tracking the early career geoscientists as they work to establish a per-manent career. Careers are typically established five to seven years after completing a terminal degree. During this five year period, one can typically experience changes in personal, professional, and economic issues that will impact their workforce trajectory and lead to changes in jobs and/or industries. AGI plans to measure these changes in order to look at workforce skills development, compare entry-level positions with permanent positions, identify the various industries and organizations that hire geoscience graduates, and measure the attrition rate of early-career geoscientists from the geoscience workforce.
79Status of the Geoscience Workforce 2016
Thi
s P
DF
is li
cens
ed fo
r in
divi
dual
use
(jb
aron
e@m
onro
ecc.
edu)

0%
10%
20%
30%
40%
50%
60%
70%
Accepted a position in the geosciences
Seeking employment in the geosciences
Not seeking employment in the geosciences
Perc
enta
ge o
f Gra
duat
es
BA/BS MA/MS Ph.D.
Figure 4.1: Geoscience Graduates Seeking or Have Accepted a Position within the Geosciences, 2015
AGI Geoscience Workforce Program; Data derived from AGI's Geoscience Student Exit Survey 2015
Early Career Workforce
Among geoscience graduates in 2015, 10% of bachelor’s graduates, 40% of master’s graduates, and 59% of doctoral graduates have obtained a
job within the geosciences at graduation, and 51% of bachelor’s graduates, 40% of master’s graduates, and 39% of doctoral graduates are still looking for a job in the geosciences (Figure 4.1). This was the first year since starting AGI’s Geoscience Student Exit Survey that an industry other than the oil and gas industry hired the highest percentage of bachelor’s graduates (Figure 4.2). Approximately 40% of bachelor’s graduates found a job in the environmental services industry, which was a 19% increase from 2013. The percentage of doctoral graduates hired by the oil and gas industry also decreased from 22% in 2013 to 15% in 2015. There is a decrease in master’s graduates hired by the oil and gas industry between 2013 and 2015, but the oil and gas industry remains as the major hiring industry for this degree level. As the survey response rate increases and hiring rates change, different industries have appeared as options for students’ right out of college, such as the non-profit industry, finance, and information services.
The starting salaries for graduates with geoscience degrees varies widely from less than $30,000 to more than $120,000; however, clear salary ranges can be seen for each degree level, with master’s graduates tending to have the highest starting salaries (Figure 4.4). Geosciences graduates largely used their personal contacts, internet job searches, and faculty referrals to find these jobs, and 48% of master’s graduates that found a job utilized campus recruiting events and job fairs very successfully (Figure 4.7).
The circular figure displays the connection between the degree fields of recent geoscience graduates from 2013-2015 (in color) to the industries where these geoscientists found their first job after graduation (in gray) (Figure 4.8). The size of the bars along the out edge of the circle represents the number of recent graduates that pursued a particular degree field and entered a particular industry. Each colored, inner ribbon connects a particular degree field with a job in a particular industry. This visualization shows the variety of industries available to graduates with a geoscience degree, as well as the complexity of the work-force and knowledge needed in the distinct industries.
80 Status of the Geoscience Workforce 2016
|| Chapter 4: Trends in Geoscience Employment — Examining Student Transitions and Workforce Dynamics
Thi
s P
DF
is li
cens
ed fo
r in
divi
dual
use
(jb
aron
e@m
onro
ecc.
edu)
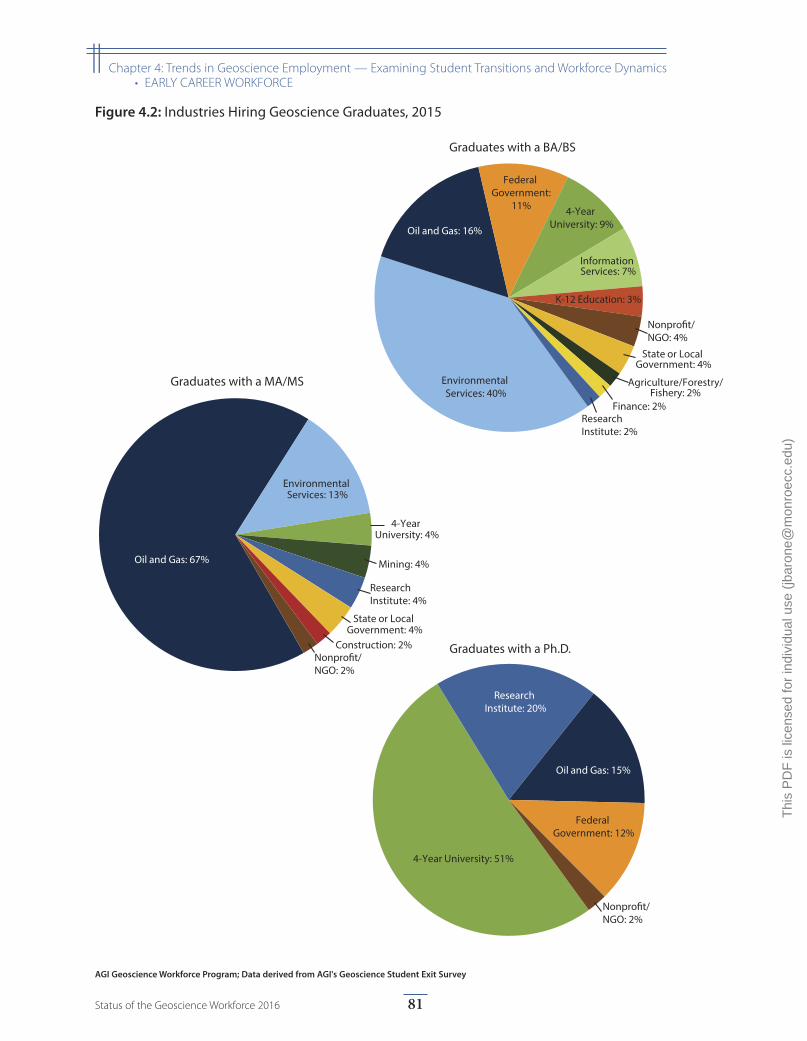
Oil and Gas: 16%
Environmental Services: 40%
4-Year University: 9%
K-12 Education: 3%
Federal Government:
11%
Nonpro�t/NGO: 4%
ResearchInstitute: 2%
Information Services: 7%
Agriculture/Forestry/Fishery: 2%
State or Local Government: 4%
Finance: 2%
Graduates with a BA/BS
Oil and Gas: 67%
Environmental Services: 13%
State or Local Government: 4%
4-Year University: 4%
Research Institute: 4%
Mining: 4%
Construction: 2%Nonpro�t/NGO: 2%
Graduates with a MA/MS
4-Year University: 51%
Oil and Gas: 15%
Research Institute: 20%
Federal Government: 12%
Nonpro�t/NGO: 2%
Graduates with a Ph.D.
Figure 4.2: Industries Hiring Geoscience Graduates, 2015
AGI Geoscience Workforce Program; Data derived from AGI's Geoscience Student Exit Survey
81Status of the Geoscience Workforce 2016
|| Chapter 4: Trends in Geoscience Employment — Examining Student Transitions and Workforce Dynamics• EARLY CAREER WORKFORCE
Thi
s P
DF
is li
cens
ed fo
r in
divi
dual
use
(jb
aron
e@m
onro
ecc.
edu)
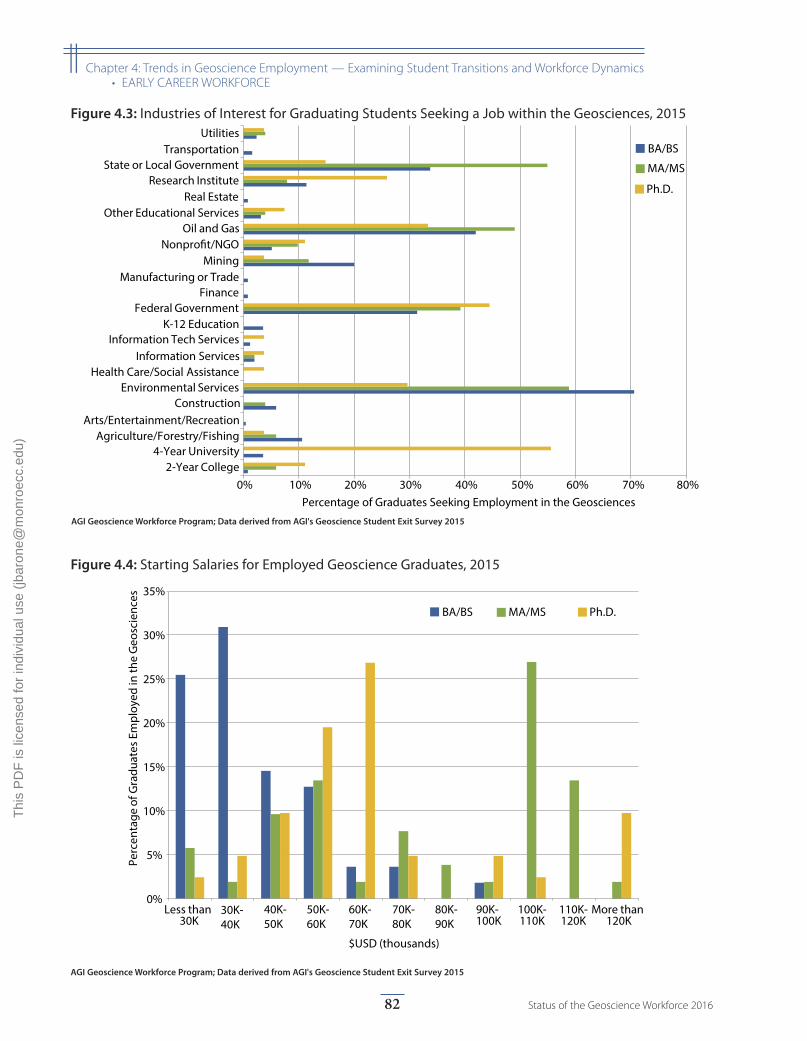
0%
5%
10%
15%
20%
25%
30%
35%
Perc
enta
ge o
f Gra
duat
es E
mpl
oyed
in th
e G
eosc
ienc
es
$USD (thousands)
Less than
30K30K-40K
40K-50K
50K-60K
60K-70K
70K-80K
80K-90K
90K-100K
100K-110K
110K-120K
More than 120K
BA/BS MA/MS Ph.D.
Figure 4.4: Starting Salaries for Employed Geoscience Graduates, 2015
AGI Geoscience Workforce Program; Data derived from AGI's Geoscience Student Exit Survey 2015
0% 10% 20% 30% 40% 50% 60% 70% 80%
Health Care/Social AssistanceInformation Services
Finance
Real Estate
Percentage of Graduates Seeking Employment in the Geosciences
Research InstituteState or Local Government
TransportationUtilities
2-Year College4-Year University
Agriculture/Forestry/FishingArts/Entertainment/Recreation
ConstructionEnvironmental Services
Information Tech ServicesK-12 Education
Federal Government
Manufacturing or TradeMining
Nonpro�t/NGOOil and Gas
Other Educational Services
BA/BS
MA/MS
Ph.D.
Figure 4.3: Industries of Interest for Graduating Students Seeking a Job within the Geosciences, 2015
AGI Geoscience Workforce Program; Data derived from AGI's Geoscience Student Exit Survey 2015
82 Status of the Geoscience Workforce 2016
|| Chapter 4: Trends in Geoscience Employment — Examining Student Transitions and Workforce Dynamics• EARLY CAREER WORKFORCE
Thi
s P
DF
is li
cens
ed fo
r in
divi
dual
use
(jb
aron
e@m
onro
ecc.
edu)
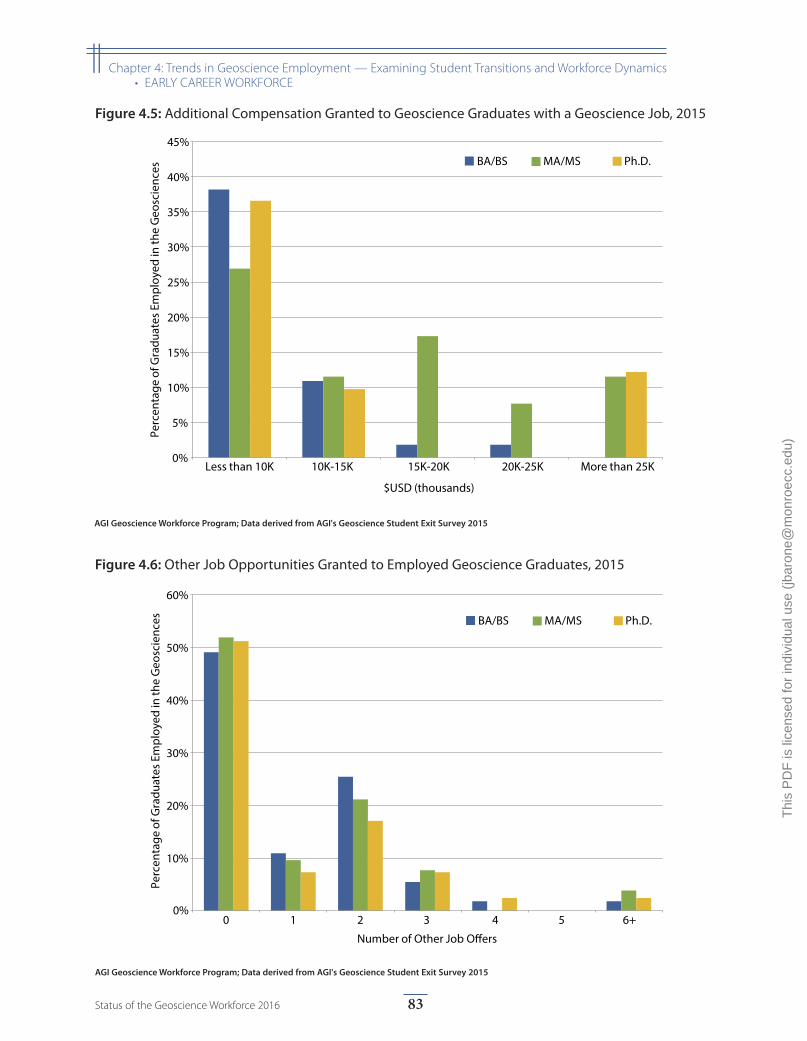
0%
5%
10%
15%
20%
25%
30%
35%
40%
45%Pe
rcen
tage
of G
radu
ates
Em
ploy
ed in
the
Geo
scie
nces
Less than 10K 10K-15K 15K-20K 20K-25K More than 25K
$USD (thousands)
BA/BS MA/MS Ph.D.
Figure 4.5: Additional Compensation Granted to Geoscience Graduates with a Geoscience Job, 2015
AGI Geoscience Workforce Program; Data derived from AGI's Geoscience Student Exit Survey 2015
0%
10%
20%
30%
40%
50%
60%
0 1 2 3 4 5 6+
Perc
enta
ge o
f Gra
duat
es E
mpl
oyed
in th
e G
eosc
ienc
es
Number of Other Job O�ers
BA/BS MA/MS Ph.D.
Figure 4.6: Other Job Opportunities Granted to Employed Geoscience Graduates, 2015
AGI Geoscience Workforce Program; Data derived from AGI's Geoscience Student Exit Survey 2015
83Status of the Geoscience Workforce 2016
|| Chapter 4: Trends in Geoscience Employment — Examining Student Transitions and Workforce Dynamics• EARLY CAREER WORKFORCE
Thi
s P
DF
is li
cens
ed fo
r in
divi
dual
use
(jb
aron
e@m
onro
ecc.
edu)
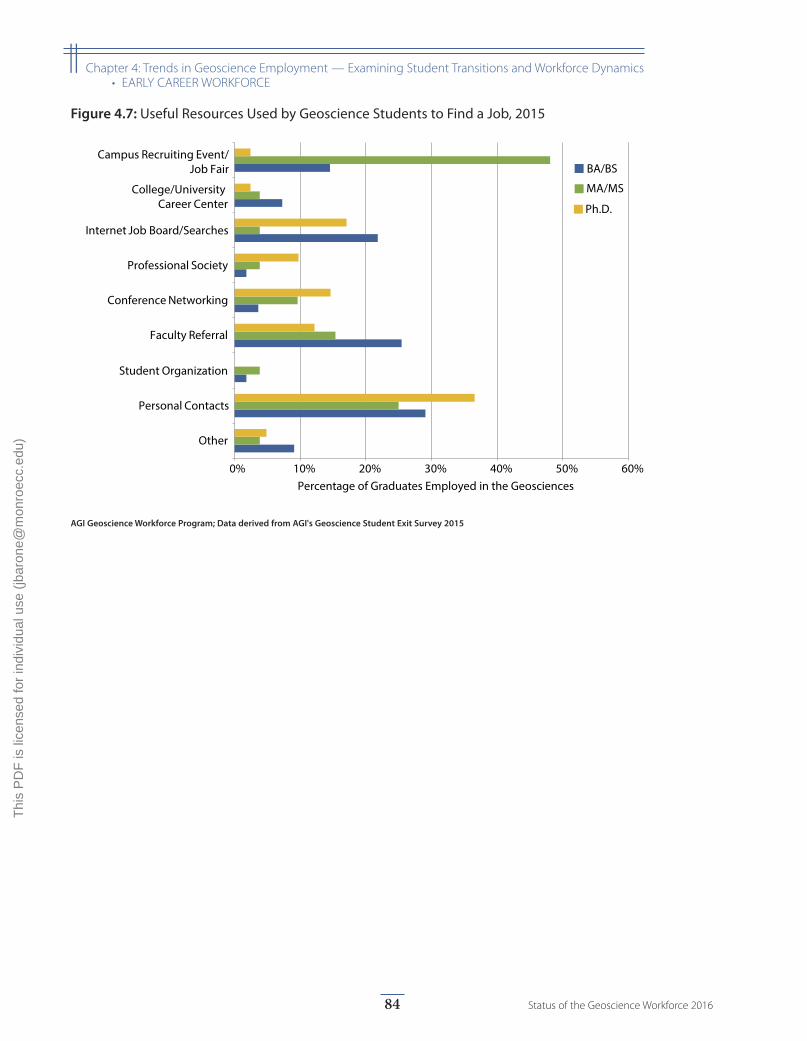
0% 10% 20% 30% 40% 50% 60%Percentage of Graduates Employed in the Geosciences
Other
Personal Contacts
Student Organization
Faculty Referral
Conference Networking
Professional Society
Internet Job Board/Searches
College/University Career Center
Campus Recruiting Event/Job Fair BA/BS
MA/MS
Ph.D.
Figure 4.7: Useful Resources Used by Geoscience Students to Find a Job, 2015
AGI Geoscience Workforce Program; Data derived from AGI's Geoscience Student Exit Survey 2015
84 Status of the Geoscience Workforce 2016
|| Chapter 4: Trends in Geoscience Employment — Examining Student Transitions and Workforce Dynamics• EARLY CAREER WORKFORCE
Thi
s P
DF
is li
cens
ed fo
r in
divi
dual
use
(jb
aron
e@m
onro
ecc.
edu)
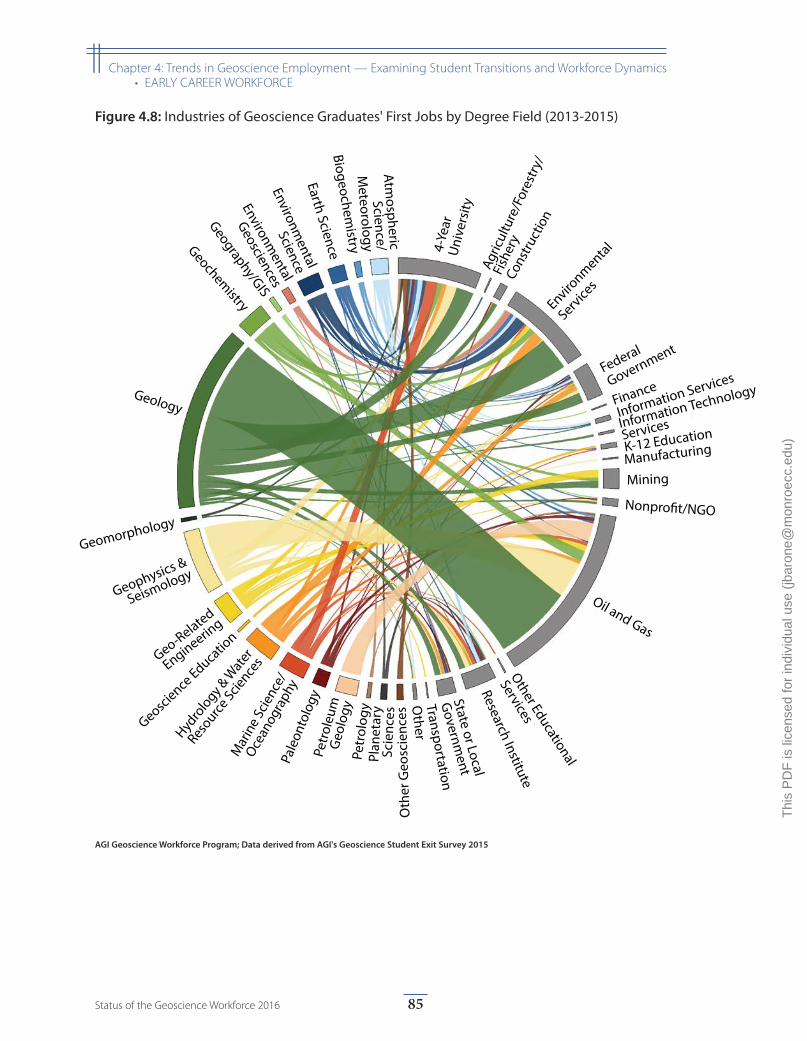
4-Ye
ar
Uni
vers
ity
Cons
truct
ion
Environmental
Services
Federal
Government
Information Technology
Services
K-12 Education
Manufacturing
Mining
Nonpro�t/NGO
Oil and Gas
Other Educational
Services
Research Institute
State or Local
Governm
ent
Transportation
Other
Atmospheric Science/
Meteorology
Biogeochemistry
Earth Science
Environmental
Science
Environmental
Geosciences
Geochemistry
Geology
Geomorphology
Geophysics &
Seismology
Geo-Related
Engineering
Geoscience Educatio
n
Hydro
logy &
Wat
er
Resource
Science
s
Mar
ine
Scie
nce/
Ocean
ogra
phy
Pale
onto
logy
Petr
oleu
m G
eolo
gy
Oth
er G
eosc
ienc
es
Geography/GIS
Petr
olog
yPl
anet
ary
Scie
nces
Information Services
Finance
Agric
ultu
re/F
ores
try/
Fish
ery
Figure 4.8: Industries of Geoscience Graduates' First Jobs by Degree Field (2013-2015)
AGI Geoscience Workforce Program; Data derived from AGI's Geoscience Student Exit Survey 2015
85Status of the Geoscience Workforce 2016
|| Chapter 4: Trends in Geoscience Employment — Examining Student Transitions and Workforce Dynamics• EARLY CAREER WORKFORCE
Thi
s P
DF
is li
cens
ed fo
r in
divi
dual
use
(jb
aron
e@m
onro
ecc.
edu)
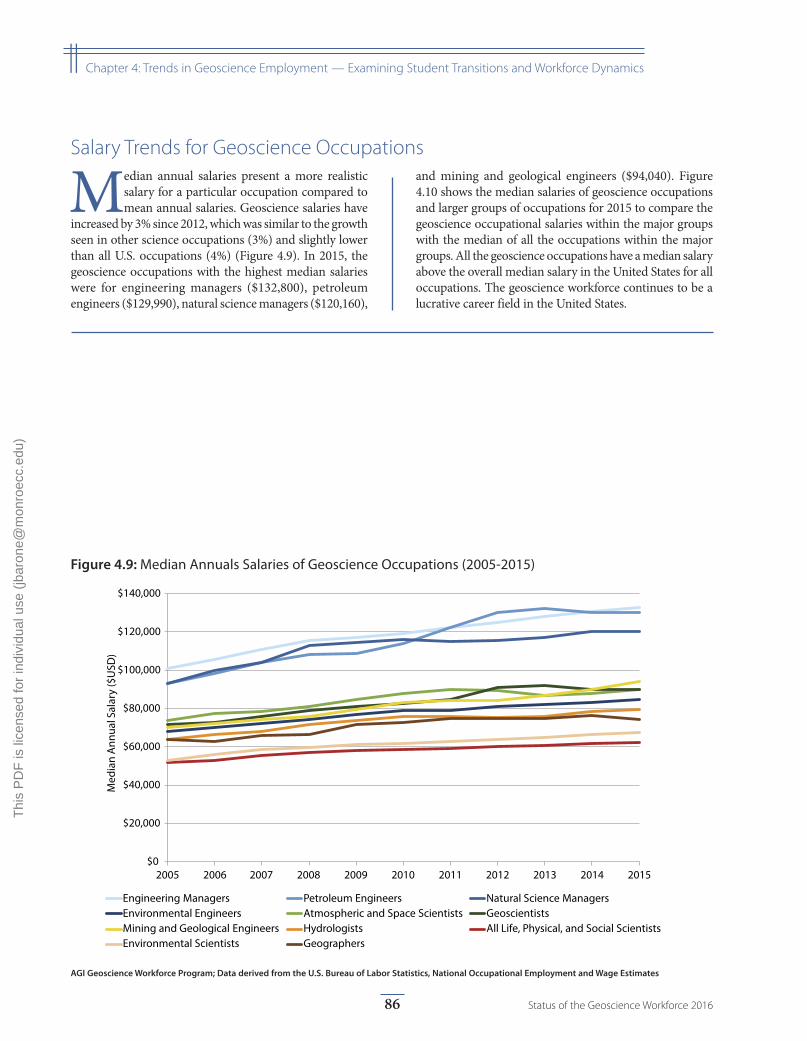
$0
$20,000
$40,000
$60,000
$80,000
$100,000
$120,000
$140,000
2005 2006 2007 2008 2009 2010 2011 2012 2013 2014 2015
Med
ian
Ann
ual S
alar
y ($
USD
)
Engineering Managers Petroleum Engineers Natural Science ManagersEnvironmental Engineers Atmospheric and Space Scientists GeoscientistsMining and Geological Engineers Hydrologists All Life, Physical, and Social ScientistsEnvironmental Scientists Geographers
Figure 4.9: Median Annuals Salaries of Geoscience Occupations (2005-2015)
AGI Geoscience Workforce Program; Data derived from the U.S. Bureau of Labor Statistics, National Occupational Employment and Wage Estimates
Salary Trends for Geoscience Occupations
Median annual salaries present a more realistic salary for a particular occupation compared to mean annual salaries. Geoscience salaries have
increased by 3% since 2012, which was similar to the growth seen in other science occupations (3%) and slightly lower than all U.S. occupations (4%) (Figure 4.9). In 2015, the geoscience occupations with the highest median salaries were for engineering managers ($132,800), petroleum engineers ($129,990), natural science managers ($120,160),
and mining and geological engineers ($94,040). Figure 4.10 shows the median salaries of geoscience occupations and larger groups of occupations for 2015 to compare the geoscience occupational salaries within the major groups with the median of all the occupations within the major groups. All the geoscience occupations have a median salary above the overall median salary in the United States for all occupations. The geoscience workforce continues to be a lucrative career field in the United States.
86 Status of the Geoscience Workforce 2016
|| Chapter 4: Trends in Geoscience Employment — Examining Student Transitions and Workforce Dynamics
Thi
s P
DF
is li
cens
ed fo
r in
divi
dual
use
(jb
aron
e@m
onro
ecc.
edu)
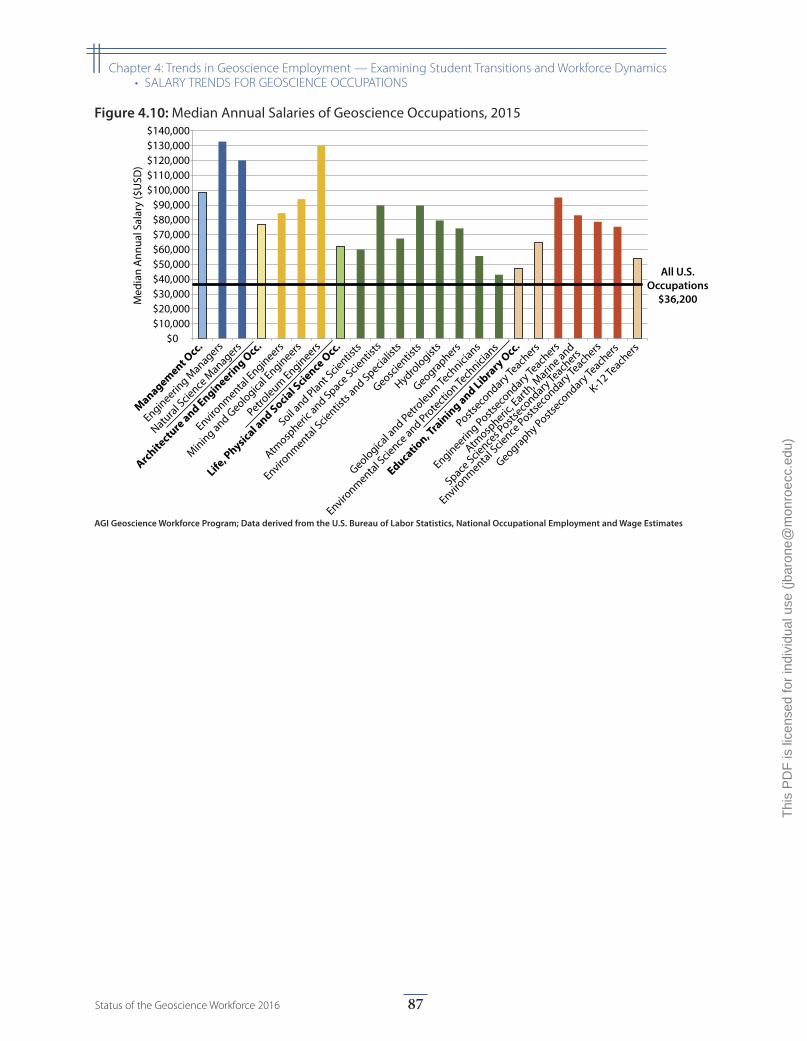
$0 $10,000 $20,000 $30,000 $40,000 $50,000 $60,000 $70,000 $80,000 $90,000
$100,000 $110,000 $120,000 $130,000 $140,000
Med
ian
Ann
ual S
alar
y ($
USD
)
Management Occ.
Engineering M
anagers
Natural S
cience
Managers
Architectu
re and Engineerin
g Occ.
Environmental E
ngineers
Mining and Geologica
l Engineers
Petroleum Engineers
Life, P
hysical and Social S
cience Occ.
Soil and Plant S
cientis
ts
Atmosp
heric and Space
Scientis
ts
Environmental S
cientis
ts and Specia
lists
Geoscientis
ts
Hydrologist
s
Geographers
Geological a
nd Petroleum Te
chnici
ans
Environmental S
cience
and Protectio
n Tech
nicians
Education, T
raining and Libra
ry O
cc.
Postseco
ndary Teach
ers
Engineering Posts
econdary Te
achers
Atmosp
heric, E
arth, M
arine and
Space Scie
nces P
ostseco
ndary Teach
ers
Environmental S
cience
Postseco
ndary Teach
ers
Geography Postseco
ndary Teach
ers
K-12 Teach
ers
All U.S.Occupations
$36,200
Figure 4.10: Median Annual Salaries of Geoscience Occupations, 2015
AGI Geoscience Workforce Program; Data derived from the U.S. Bureau of Labor Statistics, National Occupational Employment and Wage Estimates
87Status of the Geoscience Workforce 2016
|| Chapter 4: Trends in Geoscience Employment — Examining Student Transitions and Workforce Dynamics• SALARY TRENDS FOR GEOSCIENCE OCCUPATIONS
Thi
s P
DF
is li
cens
ed fo
r in
divi
dual
use
(jb
aron
e@m
onro
ecc.
edu)
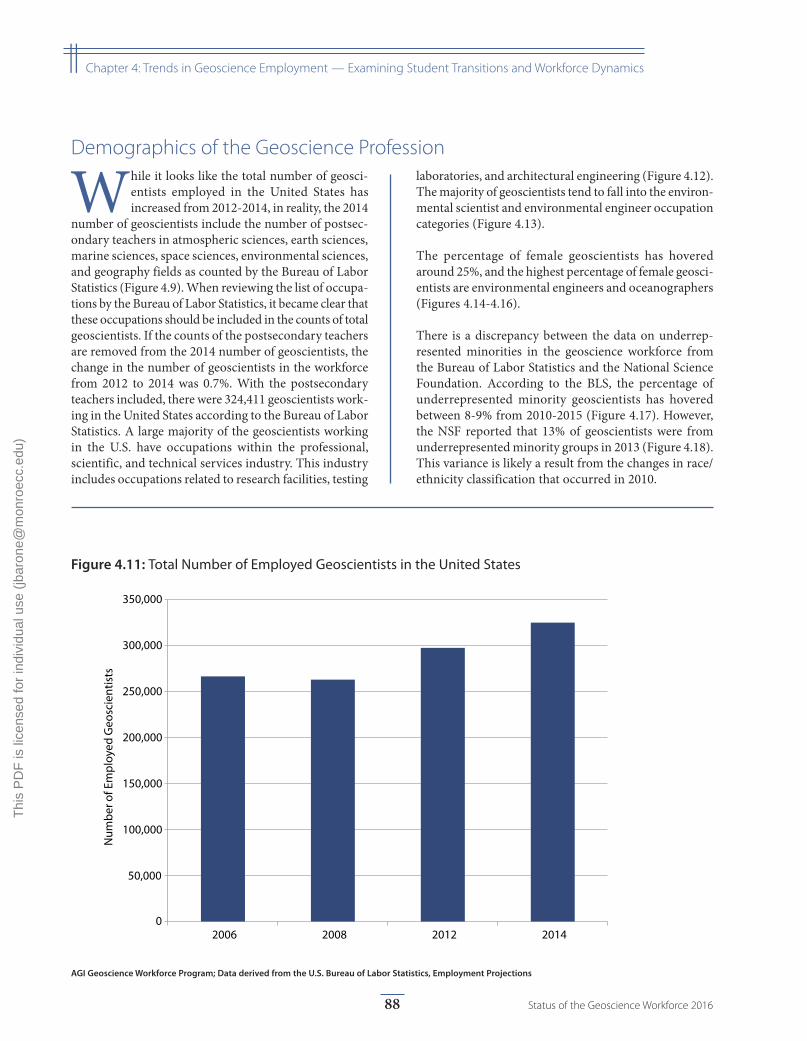
0
50,000
100,000
150,000
200,000
250,000
300,000
350,000
2006 2008 2012 2014
Num
ber o
f Em
ploy
ed G
eosc
ient
ists
Figure 4.11: Total Number of Employed Geoscientists in the United States
AGI Geoscience Workforce Program; Data derived from the U.S. Bureau of Labor Statistics, Employment Projections
Demographics of the Geoscience Profession
While it looks like the total number of geosci-entists employed in the United States has increased from 2012-2014, in reality, the 2014
number of geoscientists include the number of postsec-ondary teachers in atmospheric sciences, earth sciences, marine sciences, space sciences, environmental sciences, and geography fields as counted by the Bureau of Labor Statistics (Figure 4.9). When reviewing the list of occupa-tions by the Bureau of Labor Statistics, it became clear that these occupations should be included in the counts of total geoscientists. If the counts of the postsecondary teachers are removed from the 2014 number of geoscientists, the change in the number of geoscientists in the workforce from 2012 to 2014 was 0.7%. With the postsecondary teachers included, there were 324,411 geoscientists work-ing in the United States according to the Bureau of Labor Statistics. A large majority of the geoscientists working in the U.S. have occupations within the professional, scientific, and technical services industry. This industry includes occupations related to research facilities, testing
laboratories, and architectural engineering (Figure 4.12). The majority of geoscientists tend to fall into the environ-mental scientist and environmental engineer occupation categories (Figure 4.13).
The percentage of female geoscientists has hovered around 25%, and the highest percentage of female geosci-entists are environmental engineers and oceanographers (Figures 4.14-4.16).
There is a discrepancy between the data on underrep-resented minorities in the geoscience workforce from the Bureau of Labor Statistics and the National Science Foundation. According to the BLS, the percentage of underrepresented minority geoscientists has hovered between 8-9% from 2010-2015 (Figure 4.17). However, the NSF reported that 13% of geoscientists were from underrepresented minority groups in 2013 (Figure 4.18). This variance is likely a result from the changes in race/ethnicity classification that occurred in 2010.
88 Status of the Geoscience Workforce 2016
|| Chapter 4: Trends in Geoscience Employment — Examining Student Transitions and Workforce Dynamics
Thi
s P
DF
is li
cens
ed fo
r in
divi
dual
use
(jb
aron
e@m
onro
ecc.
edu)
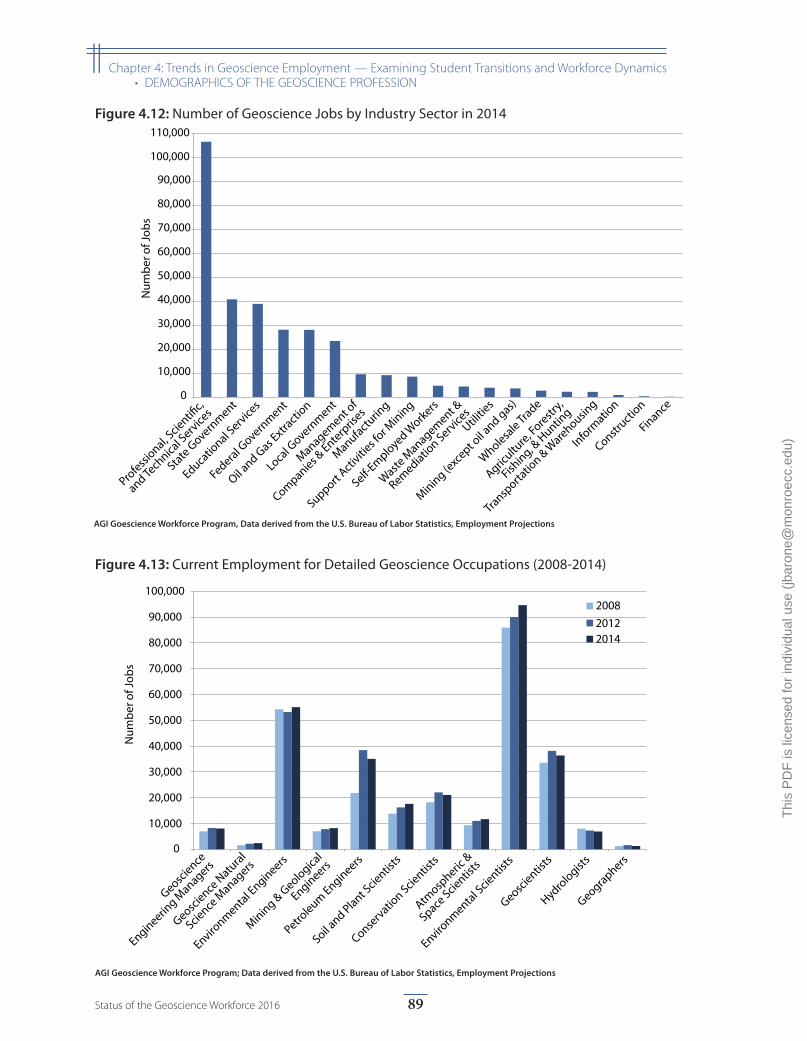
0
10,000
20,000
30,000
40,000
50,000
60,000
70,000
80,000
90,000
100,000
110,000N
umbe
r of J
obs
Professi
onal, Scie
nti�c,
and Tech
nical S
ervices
State Govern
ment
Educatio
nal Service
s
Federal Govern
ment
Oil and G
as Extra
ction
Local G
overnment
Management of
Companies & Enterp
rises
Manufacturin
g
Support Activ
ities f
or Mining
Self-Employed W
orkers
Waste M
anagement &
Remediation Service
sUtili
ties
Mining (exc
ept oil a
nd gas)
Wholesale Trade
Agricultu
re, Forestr
y,
Fishing, &
Huntin
g
Transporta
tion & W
arehousing
Informatio
n
Constructio
n
Finance
0
10,000
20,000
30,000
40,000
50,000
60,000
70,000
80,000
90,000
100,000
Num
ber o
f Job
s
200820122014
Geoscience
Engineering M
anagers
Geoscience
Natu
ral
Science
Managers
Environmental E
ngineers
Mining & Geologica
l
Engineers
Petroleum Engineers
Soil and Plant S
cientis
ts
Conservatio
n Scientis
ts
Atmosp
heric &
Space Scie
ntists
Environmental S
cientis
ts
Geoscientis
ts
Hydrologist
s
Geographers
Figure 4.12: Number of Geoscience Jobs by Industry Sector in 2014
Figure 4.13: Current Employment for Detailed Geoscience Occupations (2008-2014)
AGI Goescience Workforce Program, Data derived from the U.S. Bureau of Labor Statistics, Employment Projections
AGI Geoscience Workforce Program; Data derived from the U.S. Bureau of Labor Statistics, Employment Projections
89Status of the Geoscience Workforce 2016
|| Chapter 4: Trends in Geoscience Employment — Examining Student Transitions and Workforce Dynamics• DEMOGRAPHICS OF THE GEOSCIENCE PROFESSION
Thi
s P
DF
is li
cens
ed fo
r in
divi
dual
use
(jb
aron
e@m
onro
ecc.
edu)
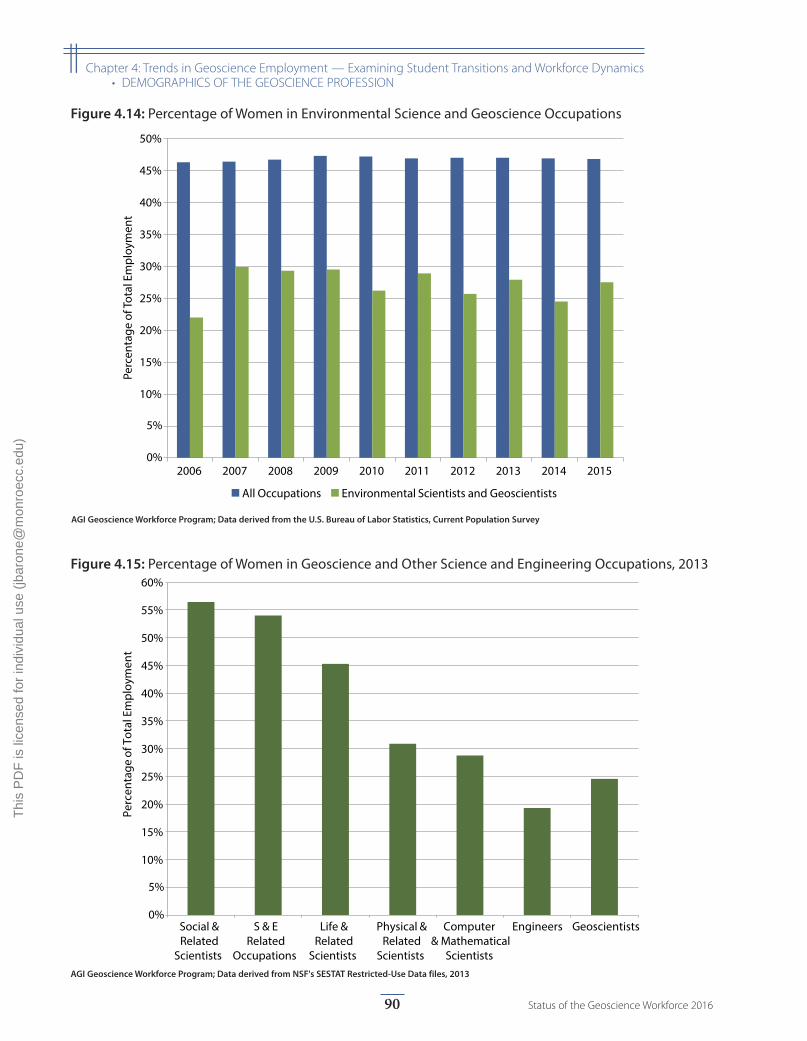
0%
5%
10%
15%
20%
25%
30%
35%
40%
45%
50%
55%
60%
Social &Related
Scientists
S & ERelated
Occupations
Life &Related
Scientists
Physical &Related
Scientists
Computer & Mathematical
Scientists
Engineers Geoscientists
Perc
enta
ge o
f Tot
al E
mpl
oym
ent
Figure 4.15: Percentage of Women in Geoscience and Other Science and Engineering Occupations, 2013
AGI Geoscience Workforce Program; Data derived from NSF's SESTAT Restricted-Use Data files, 2013
0%
5%
10%
15%
20%
25%
30%
35%
40%
45%
50%
2006 2007 2008 2009 2010 2011 2012 2013 2014 2015
Perc
enta
ge o
f Tot
al E
mpl
oym
ent
All Occupations Environmental Scientists and Geoscientists
Figure 4.14: Percentage of Women in Environmental Science and Geoscience Occupations
AGI Geoscience Workforce Program; Data derived from the U.S. Bureau of Labor Statistics, Current Population Survey
90 Status of the Geoscience Workforce 2016
|| Chapter 4: Trends in Geoscience Employment — Examining Student Transitions and Workforce Dynamics• DEMOGRAPHICS OF THE GEOSCIENCE PROFESSION
Thi
s P
DF
is li
cens
ed fo
r in
divi
dual
use
(jb
aron
e@m
onro
ecc.
edu)
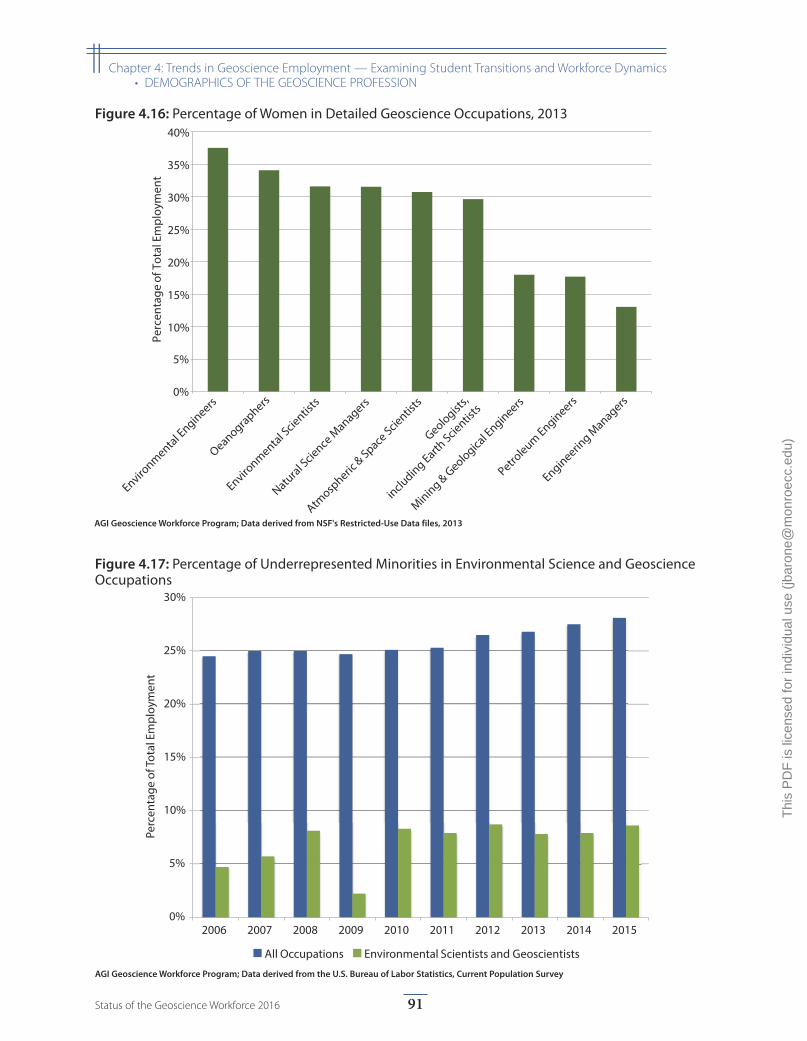
0%
5%
10%
15%
20%
25%
30%
2006 2007 2008 2009 2010 2011 2012 2013 2014 2015
Perc
enta
ge o
f Tot
al E
mpl
oym
ent
All Occupations Environmental Scientists and Geoscientists
Figure 4.17: Percentage of Underrepresented Minorities in Environmental Science and Geoscience Occupations
AGI Geoscience Workforce Program; Data derived from the U.S. Bureau of Labor Statistics, Current Population Survey
0%
5%
10%
15%
20%
25%
30%
35%
40%
Environmental E
ngineers
Oeanographers
Environmental S
cientists
Natural S
cience Managers
Atmosp
heric & Space
Scientis
ts
Geologists,
including Earth
Scientis
ts
Mining & Geologica
l Engineers
Petroleum Engineers
Engineering M
anagers
Perc
enta
ge o
f Tot
al E
mpl
oym
ent
Figure 4.16: Percentage of Women in Detailed Geoscience Occupations, 2013
AGI Geoscience Workforce Program; Data derived from NSF's Restricted-Use Data files, 2013
91Status of the Geoscience Workforce 2016
|| Chapter 4: Trends in Geoscience Employment — Examining Student Transitions and Workforce Dynamics• DEMOGRAPHICS OF THE GEOSCIENCE PROFESSION
Thi
s P
DF
is li
cens
ed fo
r in
divi
dual
use
(jb
aron
e@m
onro
ecc.
edu)
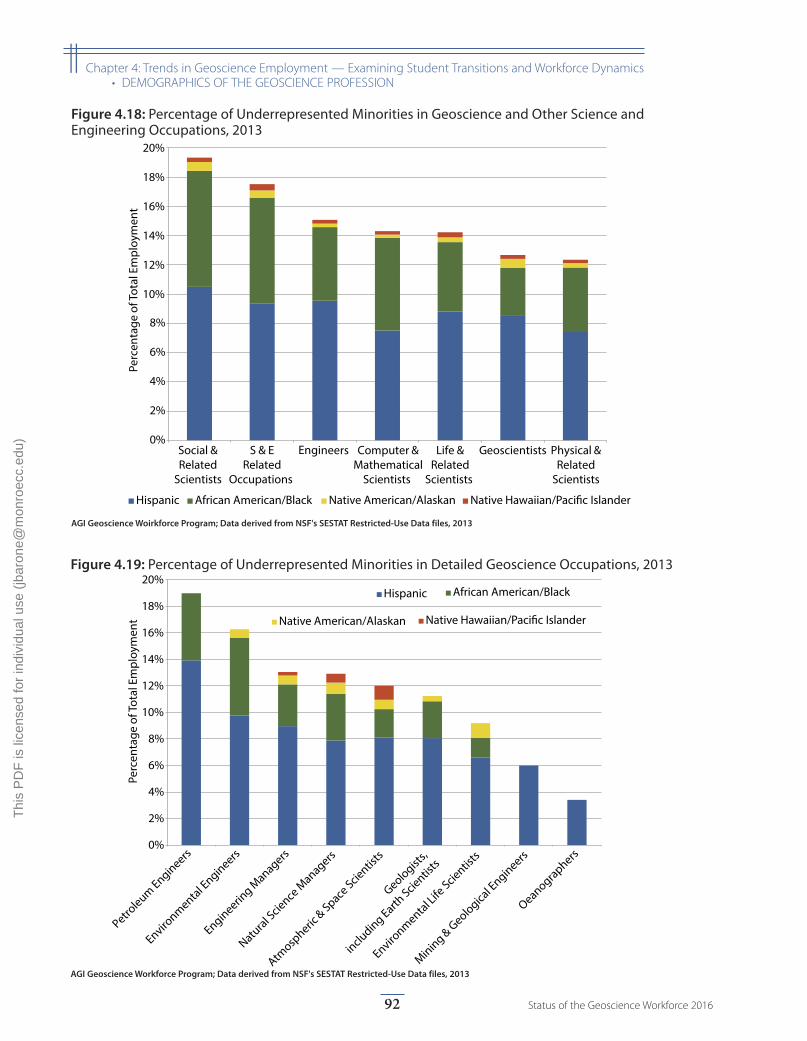
0%
2%
4%
6%
8%
10%
12%
14%
16%
18%
20%
Petroleum Engineers
Environmental E
ngineers
Engineering M
anagers
Natural S
cience Managers
Atmosp
heric & Space
Scientis
ts
Geologists,
including Earth
Scientis
ts
Environmental L
ife Scie
ntists
Mining & Geologica
l Engineers
Oeanographers
Hispanic African American/Black
Native American/Alaskan Native Hawaiian/Paci�c Islander
Perc
enta
ge o
f Tot
al E
mpl
oym
ent
Figure 4.19: Percentage of Underrepresented Minorities in Detailed Geoscience Occupations, 2013
AGI Geoscience Workforce Program; Data derived from NSF's SESTAT Restricted-Use Data files, 2013
0%
2%
4%
6%
8%
10%
12%
14%
16%
18%
20%
Social &Related
Scientists
S & ERelated
Occupations
Engineers Computer &Mathematical
Scientists
Life &Related
Scientists
Geoscientists Physical &Related
Scientists
Hispanic African American/Black Native American/Alaskan Native Hawaiian/Paci�c Islander
Perc
enta
ge o
f Tot
al E
mpl
oym
ent
Figure 4.18: Percentage of Underrepresented Minorities in Geoscience and Other Science and Engineering Occupations, 2013
AGI Geoscience Woirkforce Program; Data derived from NSF's SESTAT Restricted-Use Data files, 2013
92 Status of the Geoscience Workforce 2016
|| Chapter 4: Trends in Geoscience Employment — Examining Student Transitions and Workforce Dynamics• DEMOGRAPHICS OF THE GEOSCIENCE PROFESSION
Thi
s P
DF
is li
cens
ed fo
r in
divi
dual
use
(jb
aron
e@m
onro
ecc.
edu)
Workforce Age Demographics
The age distribution of the members of professional societies, such as the American Association of Petroleum Geologists, the Society of Economic
Geologists, the Society of Exploration Geophysicists, and the National Groundwater Association, provide a good representation of the general age distribution of the traditional geoscience workforce. Figures 4.20 and 4.21 present the same data, but Figure 4.20 displays the society membership percentage for their members that are 30 and under. Many geoscience professional societies are actively trying to engage with students and increase their student membership, and they appear to be successful in this effort. When the student membership data is ignored, the majority of the traditional geoscience workforce is in their late 50’s, except the majority of the hydrologists tend to be in their late 40’s (Figure 4.17). The high percentages seen for the age group 31-40 may still have some artifact of student memberships, but it is also high because it covers 10 years, whereas most of the age groups cover geoscientists in 5 year groups.
The age distributions of geoscientists in the federal gov-ernment are trending towards retirement age without clear signs of future replacements for the aging workforce (Figures 4.22-4.30). In fact, the overall employment of geoscientists in the federal government has decreased by 9% since 2009.
The model predicting the supply and demand of employ-ees in the petroleum industry was updated taking into account recent data AGI has collected showing the influx of new graduates into the petroleum industry in 2015. Because AGI believes that most departments are at capacity with student enrollments, a realistic one percent growth in geoscience graduate students entering the petroleum industry was used to represent the current
and future workforce, compared to the demand that will develop as the current workforce reaches retirement. With these changes to the model, it appears the petroleum industry has been working to bridge the future gap in the workforce that may appear as the majority of the work-force reaches retirement age (Figure 4.31). It is important to note that this model assumes that the majority of new graduates that enter the petroleum industry remain within the industry for a full career, which may not be the case. This model also does not take into account the recent layoffs in the oil and gas industry. The total cur-rent workforce line may be a bit lower and growth of the industry may change the shape of the predicted demand.
According to the National Mining Association, the mining industry continues to have had an influx of young geosci-entists for all mining (except oil and gas extraction) and for support activities for mining and oil and gas (Figure 4.32 and 4.33). This is in agreement with workforce dis-cussions with the mining industry. This industry seems to be a growing area of the geoscience workforce recently.
Between 2009 and 2015, there has been minimal change in the percentage distribution of faculty by rank with changes only covering a percentage point or two (Figure 4.34). Between 2013 and 2015 there has been a slight shift in the age distribution of assistant and associate professors to slightly younger in 2015, but the other ranks appear to have similar age distributions (Figure 4.35). There appears to be small hiring gains with 28 more assistant professors in 2015 than in 2013. Progress of tenure-track faculty moves steadily through the ranks to reach full professor between the ages of 46-50 on average. However, full professors tend to work later in their career creat-ing a crossover in the population of full professors and emeritus in their 70’s.
93Status of the Geoscience Workforce 2016
|| Chapter 4: Trends in Geoscience Employment — Examining Student Transitions and Workforce Dynamics
Thi
s P
DF
is li
cens
ed fo
r in
divi
dual
use
(jb
aron
e@m
onro
ecc.
edu)
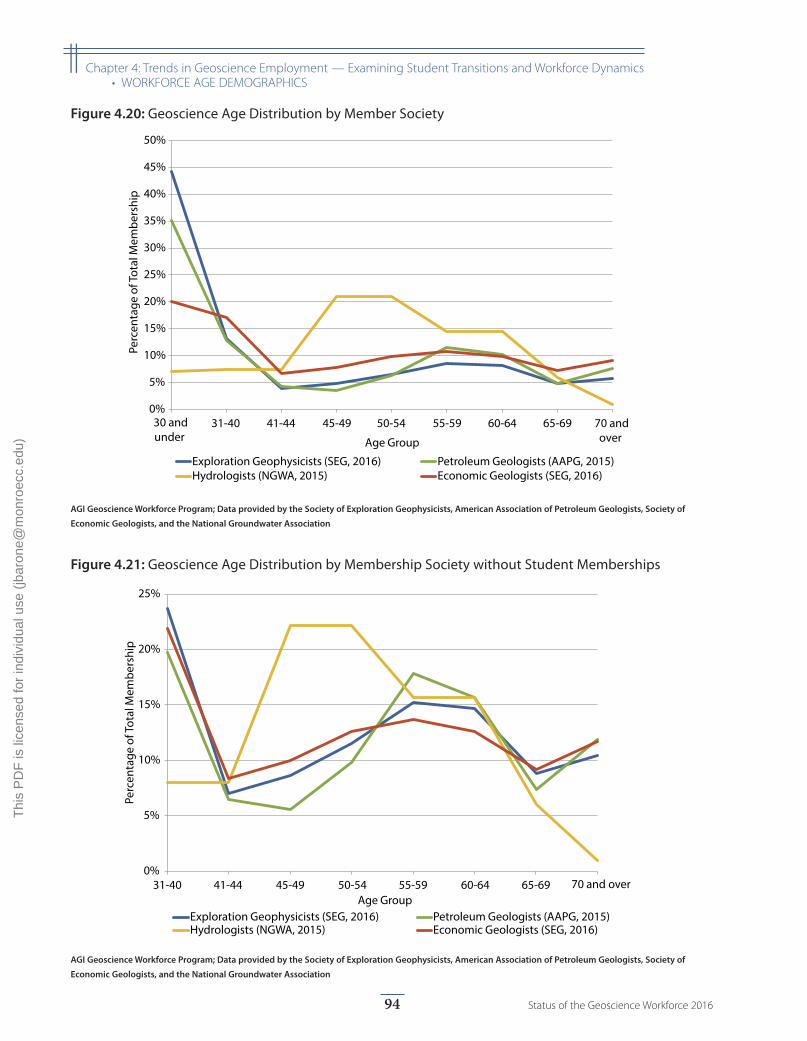
0%
5%
10%
15%
20%
25%
31-40 41-44 45-49 50-54 55-59 60-64 65-69 70 and over
Perc
enta
ge o
f Tot
al M
embe
rshi
p
Age Group Exploration Geophysicists (SEG, 2016) Petroleum Geologists (AAPG, 2015)Hydrologists (NGWA, 2015) Economic Geologists (SEG, 2016)
Figure 4.21: Geoscience Age Distribution by Membership Society without Student Memberships
AGI Geoscience Workforce Program; Data provided by the Society of Exploration Geophysicists, American Association of Petroleum Geologists, Society of
Economic Geologists, and the National Groundwater Association
0%
5%
10%
15%
20%
25%
30%
35%
40%
45%
50%
30 andunder
31-40 41-44 45-49 50-54 55-59 60-64 65-69 70 andover
Perc
enta
ge o
f Tot
al M
embe
rshi
p
Age Group
Exploration Geophysicists (SEG, 2016) Petroleum Geologists (AAPG, 2015)Hydrologists (NGWA, 2015) Economic Geologists (SEG, 2016)
Figure 4.20: Geoscience Age Distribution by Member Society
AGI Geoscience Workforce Program; Data provided by the Society of Exploration Geophysicists, American Association of Petroleum Geologists, Society of
Economic Geologists, and the National Groundwater Association
94 Status of the Geoscience Workforce 2016
|| Chapter 4: Trends in Geoscience Employment — Examining Student Transitions and Workforce Dynamics• WORKFORCE AGE DEMOGRAPHICS
Thi
s P
DF
is li
cens
ed fo
r in
divi
dual
use
(jb
aron
e@m
onro
ecc.
edu)
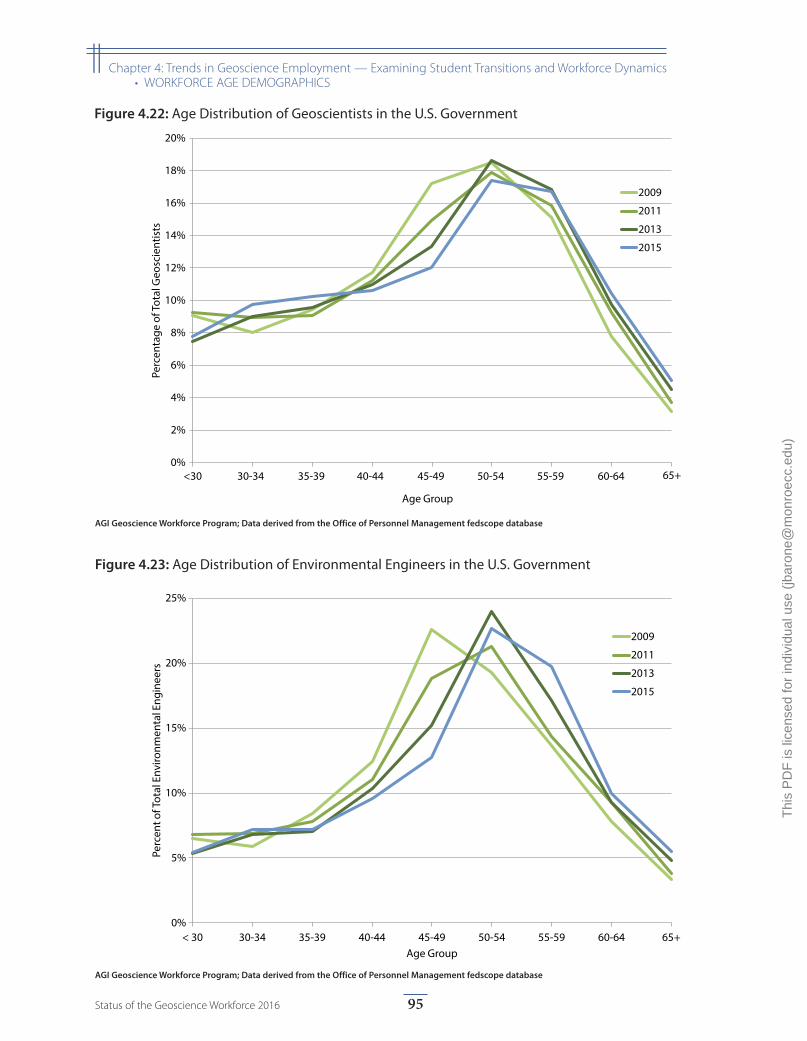
0%
5%
10%
15%
20%
25%
< 30 30-34 35-39 40-44 45-49 50-54 55-59 60-64 65+
Perc
ent o
f Tot
al E
nviro
nmen
tal E
ngin
eers
Age Group
2009
2011
2013
2015
Figure 4.23: Age Distribution of Environmental Engineers in the U.S. Government
AGI Geoscience Workforce Program; Data derived from the Office of Personnel Management fedscope database
0%
2%
4%
6%
8%
10%
12%
14%
16%
18%
20%
<30 30-34 35-39 40-44 45-49 50-54 55-59 60-64 65+
Perc
enta
ge o
f Tot
al G
eosc
ient
ists
Age Group
2009
2011
2013
2015
Figure 4.22: Age Distribution of Geoscientists in the U.S. Government
AGI Geoscience Workforce Program; Data derived from the Office of Personnel Management fedscope database
95Status of the Geoscience Workforce 2016
|| Chapter 4: Trends in Geoscience Employment — Examining Student Transitions and Workforce Dynamics• WORKFORCE AGE DEMOGRAPHICS
Thi
s P
DF
is li
cens
ed fo
r in
divi
dual
use
(jb
aron
e@m
onro
ecc.
edu)
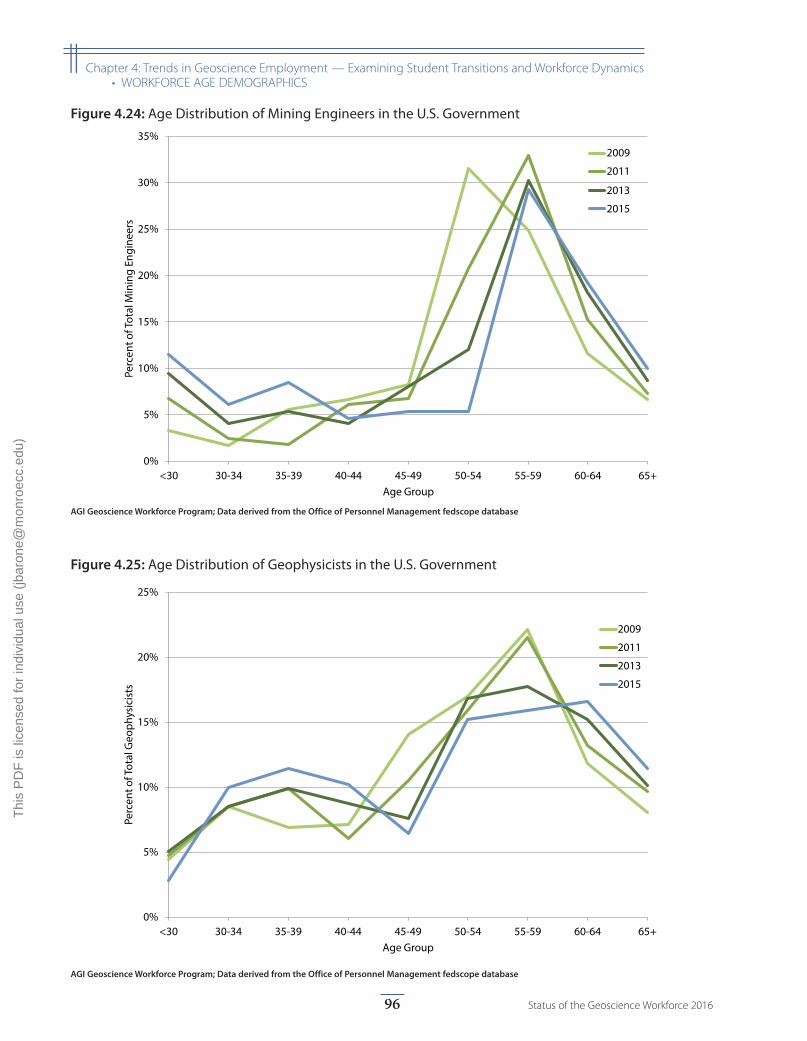
0%
5%
10%
15%
20%
25%
<30 30-34 35-39 40-44 45-49 50-54 55-59 60-64 65+
Perc
ent o
f Tot
al G
eoph
ysic
ists
Age Group
2009
2011
2013
2015
Figure 4.25: Age Distribution of Geophysicists in the U.S. Government
AGI Geoscience Workforce Program; Data derived from the Office of Personnel Management fedscope database
0%
5%
10%
15%
20%
25%
30%
35%
<30 30-34 35-39 40-44 45-49 50-54 55-59 60-64 65+
Perc
ent o
f Tot
al M
inin
g En
gine
ers
Age Group
2009
2011
2013
2015
Figure 4.24: Age Distribution of Mining Engineers in the U.S. Government
AGI Geoscience Workforce Program; Data derived from the Office of Personnel Management fedscope database
96 Status of the Geoscience Workforce 2016
|| Chapter 4: Trends in Geoscience Employment — Examining Student Transitions and Workforce Dynamics• WORKFORCE AGE DEMOGRAPHICS
Thi
s P
DF
is li
cens
ed fo
r in
divi
dual
use
(jb
aron
e@m
onro
ecc.
edu)
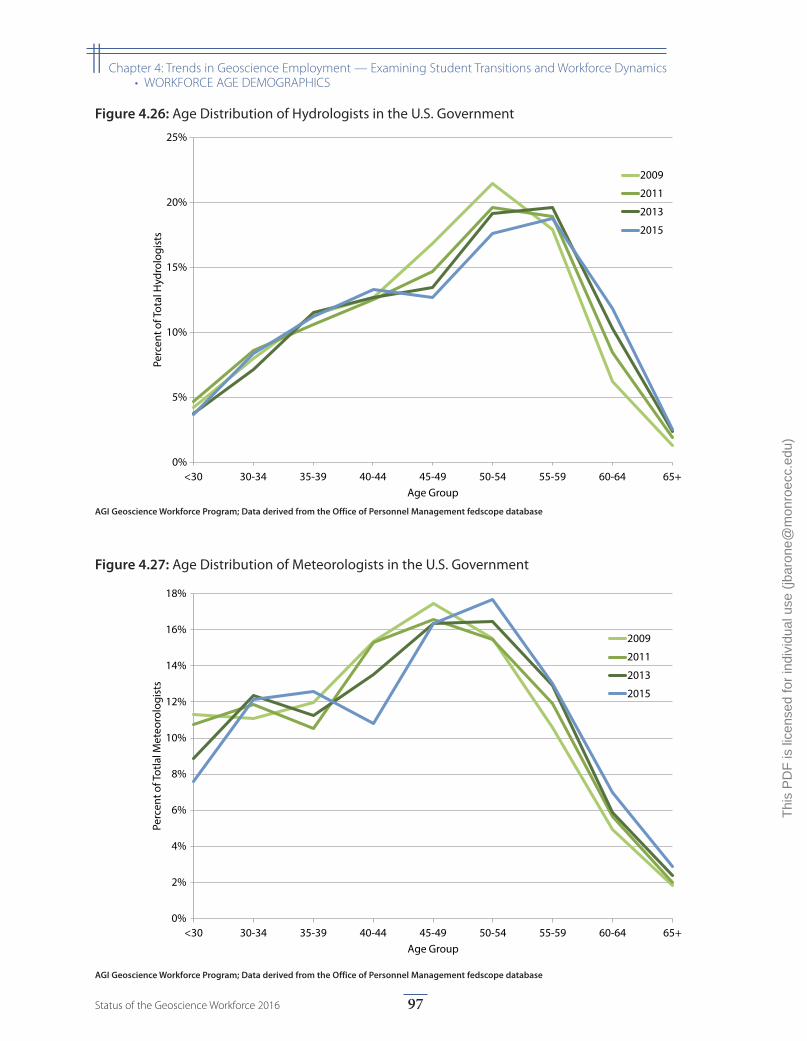
0%
2%
4%
6%
8%
10%
12%
14%
16%
18%
<30 30-34 35-39 40-44 45-49 50-54 55-59 60-64 65+
Perc
ent o
f Tot
lal M
eteo
rolo
gist
s
Age Group
2009
2011
2013
2015
Figure 4.27: Age Distribution of Meteorologists in the U.S. Government
AGI Geoscience Workforce Program; Data derived from the Office of Personnel Management fedscope database
0%
5%
10%
15%
20%
25%
<30 30-34 35-39 40-44 45-49 50-54 55-59 60-64 65+
Perc
ent o
f Tot
al H
ydro
logi
sts
Age Group
2009
2011
2013
2015
Figure 4.26: Age Distribution of Hydrologists in the U.S. Government
AGI Geoscience Workforce Program; Data derived from the Office of Personnel Management fedscope database
97Status of the Geoscience Workforce 2016
|| Chapter 4: Trends in Geoscience Employment — Examining Student Transitions and Workforce Dynamics• WORKFORCE AGE DEMOGRAPHICS
Thi
s P
DF
is li
cens
ed fo
r in
divi
dual
use
(jb
aron
e@m
onro
ecc.
edu)
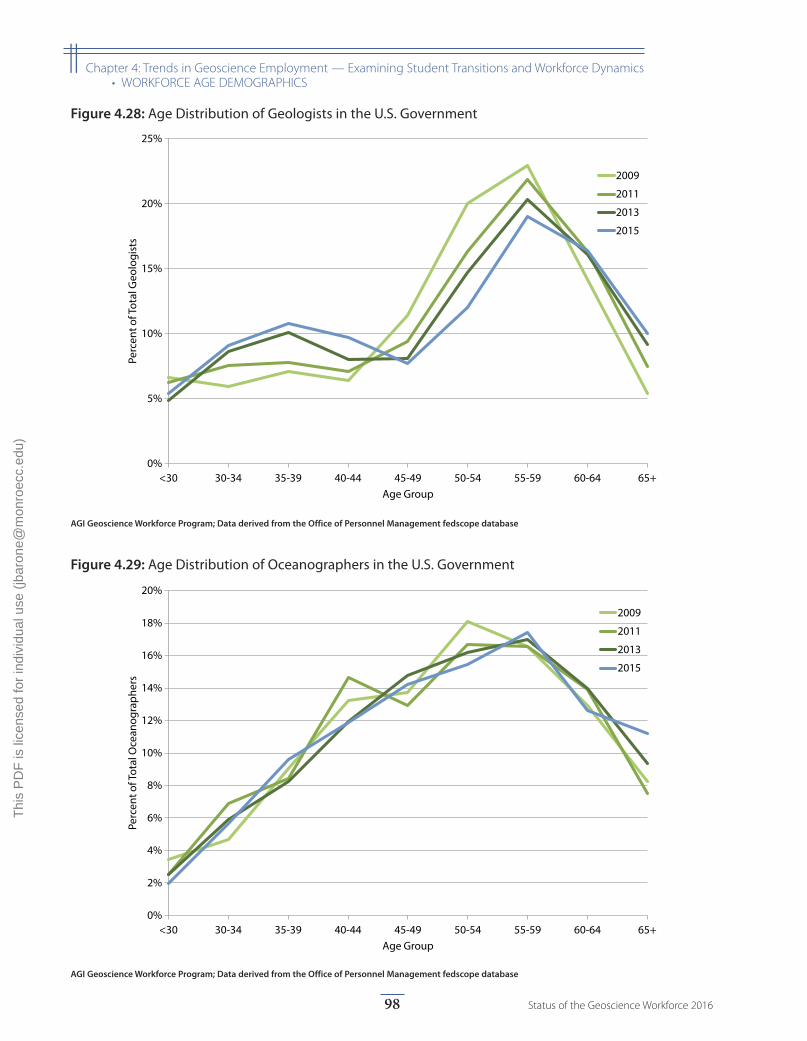
0%
2%
4%
6%
8%
10%
12%
14%
16%
18%
20%
<30 30-34 35-39 40-44 45-49 50-54 55-59 60-64 65+
Perc
ent o
f Tot
al O
cean
ogra
pher
s
Age Group
2009
2011
2013
2015
Figure 4.29: Age Distribution of Oceanographers in the U.S. Government
AGI Geoscience Workforce Program; Data derived from the Office of Personnel Management fedscope database
0%
5%
10%
15%
20%
25%
<30 30-34 35-39 40-44 45-49 50-54 55-59 60-64 65+
Perc
ent o
f Tot
al G
eolo
gist
s
Age Group
2009
2011
2013
2015
Figure 4.28: Age Distribution of Geologists in the U.S. Government
AGI Geoscience Workforce Program; Data derived from the Office of Personnel Management fedscope database
98 Status of the Geoscience Workforce 2016
|| Chapter 4: Trends in Geoscience Employment — Examining Student Transitions and Workforce Dynamics• WORKFORCE AGE DEMOGRAPHICS
Thi
s P
DF
is li
cens
ed fo
r in
divi
dual
use
(jb
aron
e@m
onro
ecc.
edu)
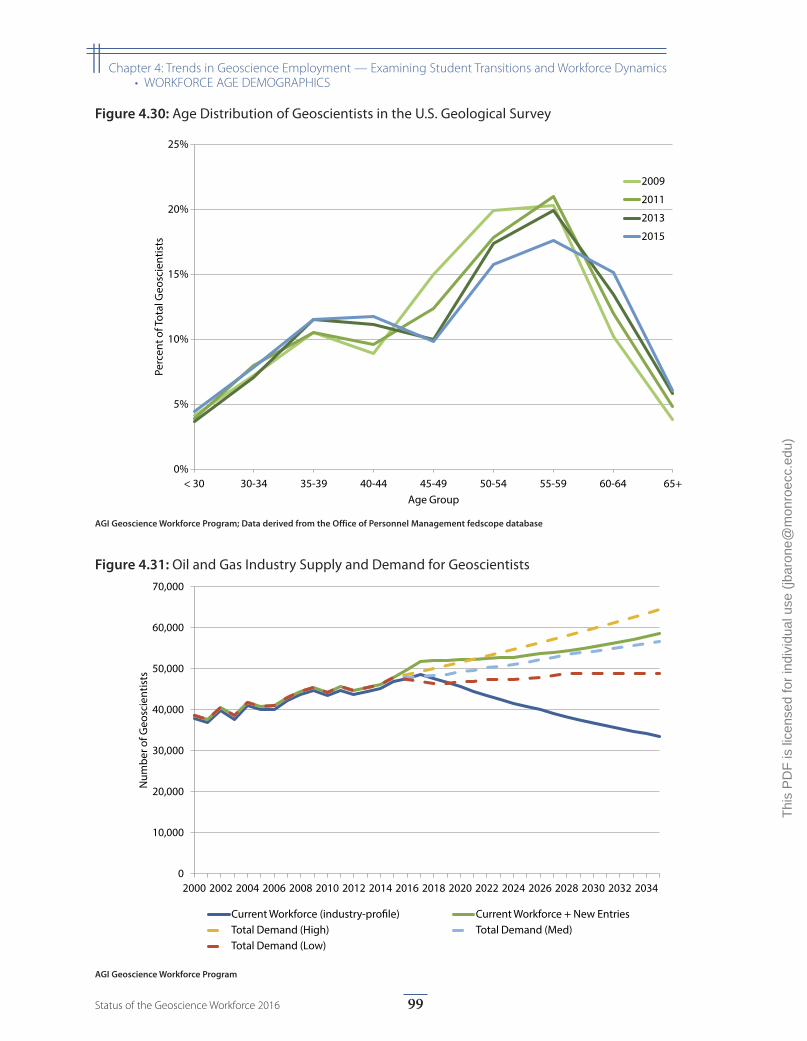
0
10,000
20,000
30,000
40,000
50,000
60,000
70,000
2000 2002 2004 2006 2008 2010 2012 2014 2016 2018 2020 2022 2024 2026 2028 2030 2032 2034
Num
ber o
f Geo
scie
ntis
ts
Current Workforce (industry-pro�le) Current Workforce + New Entries Total Demand (High) Total Demand (Med) Total Demand (Low)
Figure 4.31: Oil and Gas Industry Supply and Demand for Geoscientists
AGI Geoscience Workforce Program
0%
5%
10%
15%
20%
25%
< 30 30-34 35-39 40-44 45-49 50-54 55-59 60-64 65+
Perc
ent o
f Tot
al G
eosc
ient
ists
Age Group
2009
2011
2013
2015
Figure 4.30: Age Distribution of Geoscientists in the U.S. Geological Survey
AGI Geoscience Workforce Program; Data derived from the Office of Personnel Management fedscope database
99Status of the Geoscience Workforce 2016
|| Chapter 4: Trends in Geoscience Employment — Examining Student Transitions and Workforce Dynamics• WORKFORCE AGE DEMOGRAPHICS
Thi
s P
DF
is li
cens
ed fo
r in
divi
dual
use
(jb
aron
e@m
onro
ecc.
edu)
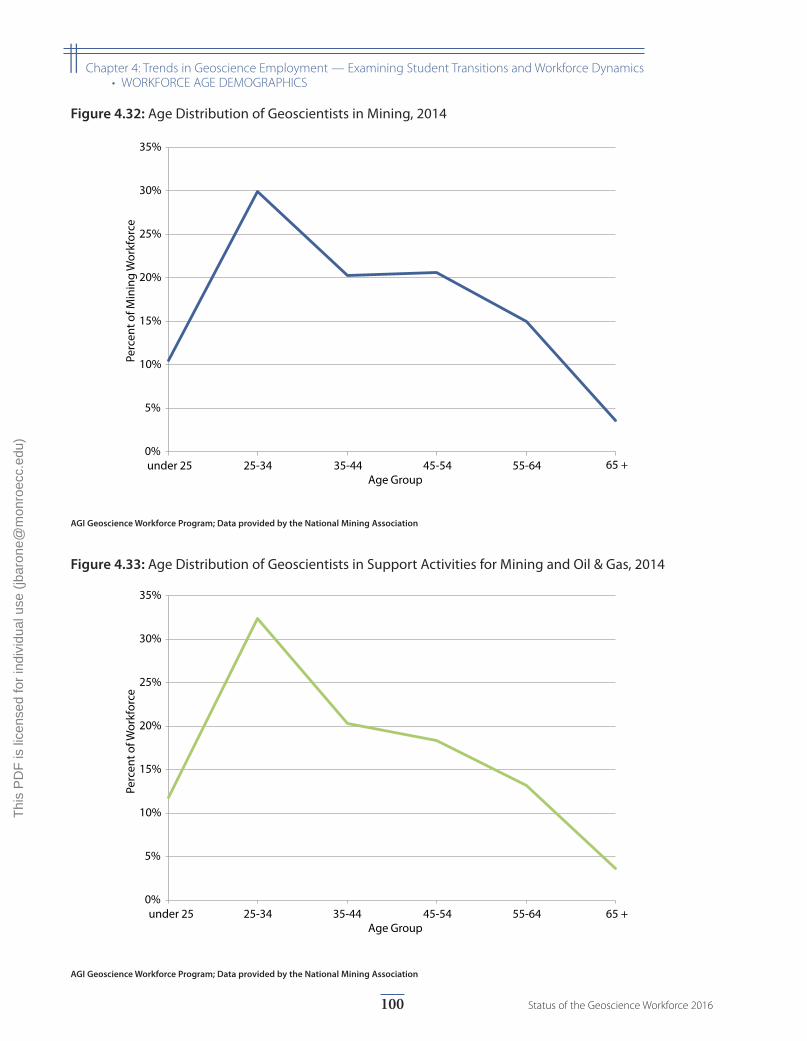
0%
5%
10%
15%
20%
25%
30%
35%
under 25 25-34 35-44 45-54 55-64 65 +
Perc
ent o
f Wor
kfor
ce
Age Group
Figure 4.33: Age Distribution of Geoscientists in Support Activities for Mining and Oil & Gas, 2014
AGI Geoscience Workforce Program; Data provided by the National Mining Association
0%
5%
10%
15%
20%
25%
30%
35%
under 25 25-34 35-44 45-54 55-64 65 +
Perc
ent o
f Min
ing
Wor
kfor
ce
Age Group
Figure 4.32: Age Distribution of Geoscientists in Mining, 2014
AGI Geoscience Workforce Program; Data provided by the National Mining Association
100 Status of the Geoscience Workforce 2016
|| Chapter 4: Trends in Geoscience Employment — Examining Student Transitions and Workforce Dynamics• WORKFORCE AGE DEMOGRAPHICS
Thi
s P
DF
is li
cens
ed fo
r in
divi
dual
use
(jb
aron
e@m
onro
ecc.
edu)
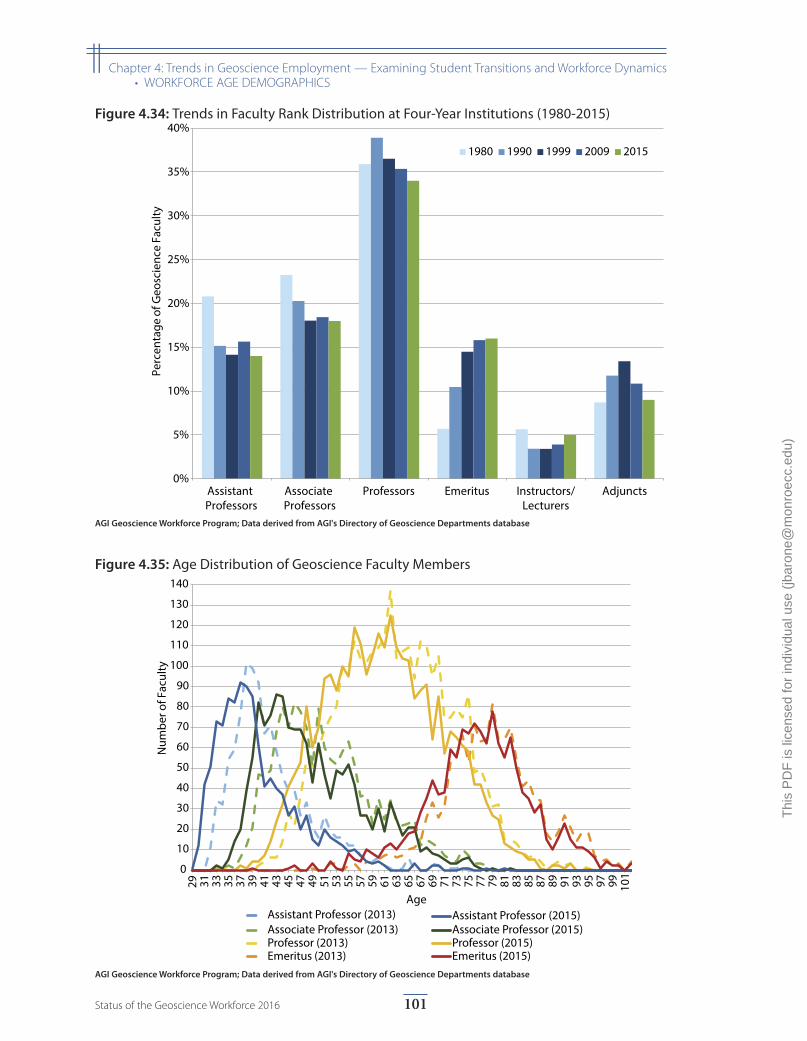
0
10
20
30
40
50
60
70
80
90
100
110
120
130
140
29 31 33 35 37 39 41 43 45 47 49 51 53 55 57 59 61 63 65 67 69 71 73 75 77 79 81 83 85 87 89 91 93 95 97 99 101
Num
ber o
f Fac
ulty
Age
Professor (2013)
Associate Professor (2013)
Assistant Professor (2013)
Emeritus (2013)
Professor (2015)
Associate Professor (2015)Assistant Professor (2015)
Emeritus (2015)
Figure 4.35: Age Distribution of Geoscience Faculty Members
AGI Geoscience Workforce Program; Data derived from AGI's Directory of Geoscience Departments database
0%
5%
10%
15%
20%
25%
30%
35%
40%
Assistant Professors
Associate Professors
Professors Emeritus Instructors/Lecturers
Adjuncts
Perc
enta
ge o
f Geo
scie
nce
Facu
lty1980 1990 1999 2009 2015
Figure 4.34: Trends in Faculty Rank Distribution at Four-Year Institutions (1980-2015)
AGI Geoscience Workforce Program; Data derived from AGI's Directory of Geoscience Departments database
101Status of the Geoscience Workforce 2016
|| Chapter 4: Trends in Geoscience Employment — Examining Student Transitions and Workforce Dynamics• WORKFORCE AGE DEMOGRAPHICS
Thi
s P
DF
is li
cens
ed fo
r in
divi
dual
use
(jb
aron
e@m
onro
ecc.
edu)
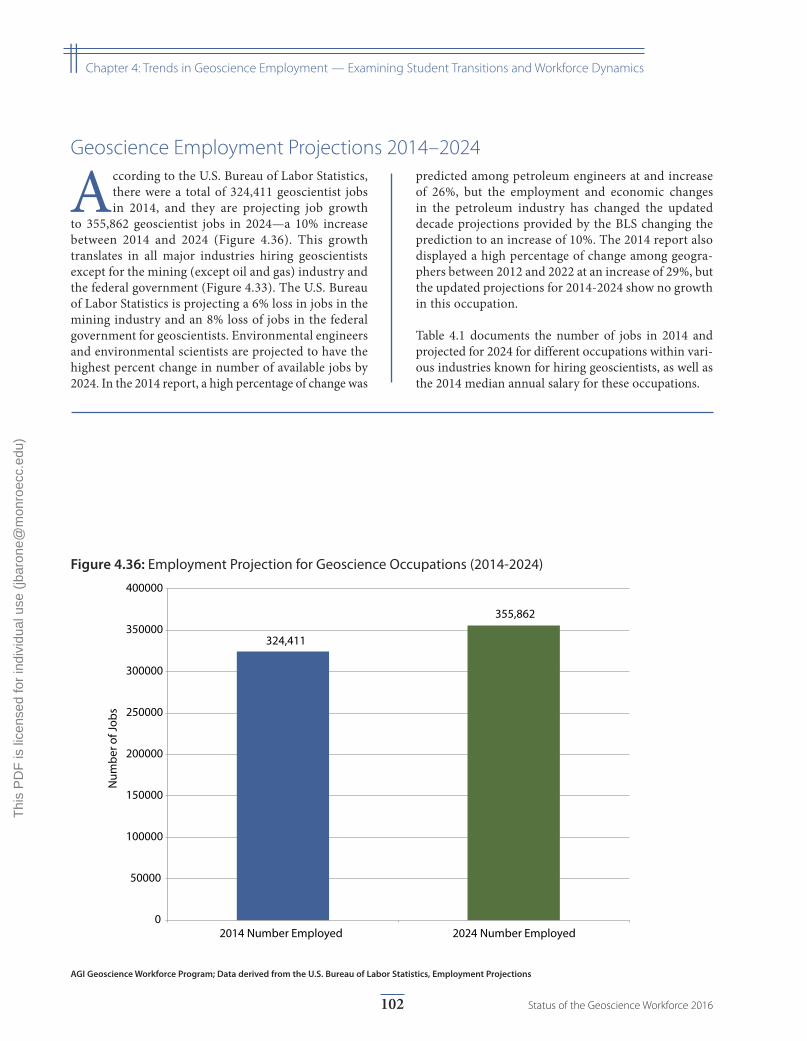
324,411
355,862
0
50000
100000
150000
200000
250000
300000
350000
400000
2014 Number Employed 2024 Number Employed
Num
ber o
f Job
s
Figure 4.36: Employment Projection for Geoscience Occupations (2014-2024)
AGI Geoscience Workforce Program; Data derived from the U.S. Bureau of Labor Statistics, Employment Projections
Geoscience Employment Projections 2014–2024
According to the U.S. Bureau of Labor Statistics, there were a total of 324,411 geoscientist jobs in 2014, and they are projecting job growth
to 355,862 geoscientist jobs in 2024—a 10% increase between 2014 and 2024 (Figure 4.36). This growth translates in all major industries hiring geoscientists except for the mining (except oil and gas) industry and the federal government (Figure 4.33). The U.S. Bureau of Labor Statistics is projecting a 6% loss in jobs in the mining industry and an 8% loss of jobs in the federal government for geoscientists. Environmental engineers and environmental scientists are projected to have the highest percent change in number of available jobs by 2024. In the 2014 report, a high percentage of change was
predicted among petroleum engineers at and increase of 26%, but the employment and economic changes in the petroleum industry has changed the updated decade projections provided by the BLS changing the prediction to an increase of 10%. The 2014 report also displayed a high percentage of change among geogra-phers between 2012 and 2022 at an increase of 29%, but the updated projections for 2014-2024 show no growth in this occupation.
Table 4.1 documents the number of jobs in 2014 and projected for 2024 for different occupations within vari-ous industries known for hiring geoscientists, as well as the 2014 median annual salary for these occupations.
102 Status of the Geoscience Workforce 2016
|| Chapter 4: Trends in Geoscience Employment — Examining Student Transitions and Workforce Dynamics
Thi
s P
DF
is li
cens
ed fo
r in
divi
dual
use
(jb
aron
e@m
onro
ecc.
edu)
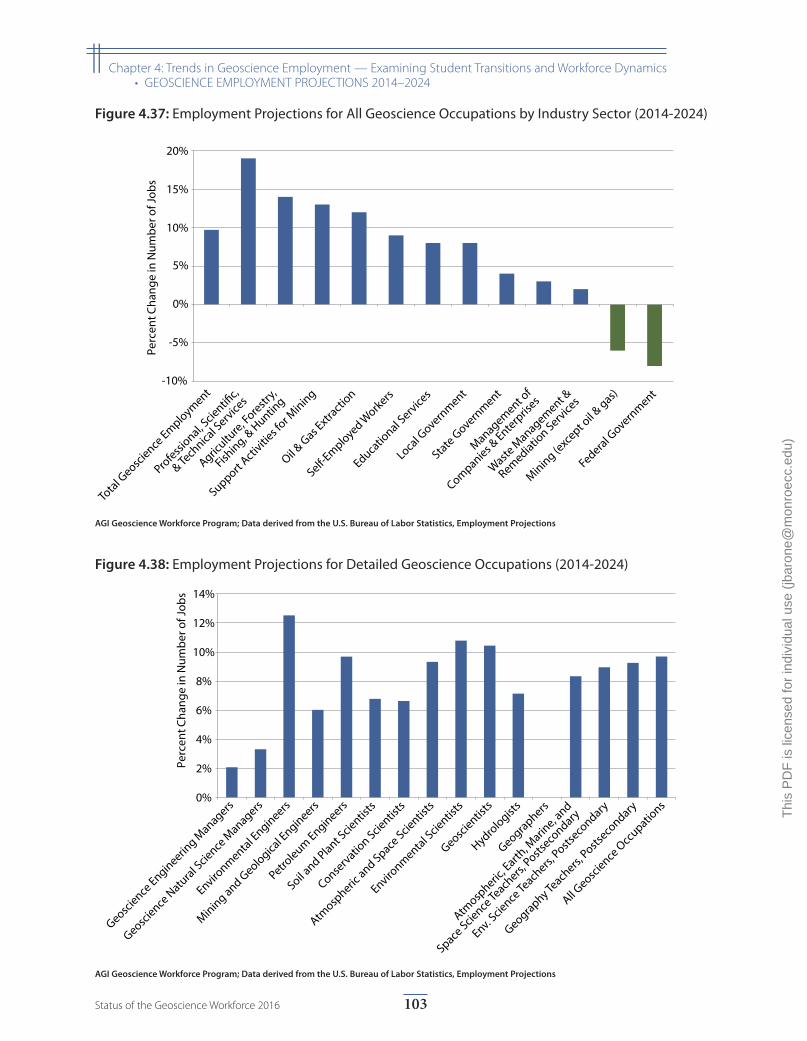
0%
2%
4%
6%
8%
10%
12%
14%
Perc
ent C
hang
e in
Num
ber o
f Job
s
Geoscience
Engineering M
anagers
Geoscience
Natu
ral Scie
nce M
anagers
Environmental E
ngineers
Mining and Geologica
l Engineers
Petroleum Engineers
Soil and Plant S
cientis
ts
Conservatio
n Scientis
ts
Atmosp
heric and Space
Scientis
ts
Environmental S
cientis
ts
Geoscientis
ts
Hydrologist
s
Geographers
Atmosp
heric, E
arth, M
arine, a
nd
Space Scie
nce Te
achers,
Postseco
ndary
Env. Scie
nce Te
achers,
Postseco
ndary
Geography Teach
ers, Posts
econdary
All Geosci
ence O
ccupatio
ns
Figure 4.38: Employment Projections for Detailed Geoscience Occupations (2014-2024)
AGI Geoscience Workforce Program; Data derived from the U.S. Bureau of Labor Statistics, Employment Projections
-10%
-5%
0%
5%
10%
15%
20%Pe
rcen
t Cha
nge
in N
umbe
r of J
obs
Total G
eoscience
Employment
Professi
onal, Scie
nti�c,
& Tech
nical S
ervices
Agricultu
re, Forestr
y,
Fishing, &
Huntin
g
Support Activ
ities f
or Mining
Oil & G
as Extra
ction
Self-Employed W
orkers
Educatio
nal Service
s
Local G
overnment
State Govern
ment
Management of
Companies & Enterp
rises
Waste M
anagement &
Remediation Service
s
Mining (exc
ept oil &
gas)
Federal Govern
ment
Figure 4.37: Employment Projections for All Geoscience Occupations by Industry Sector (2014-2024)
AGI Geoscience Workforce Program; Data derived from the U.S. Bureau of Labor Statistics, Employment Projections
103Status of the Geoscience Workforce 2016
|| Chapter 4: Trends in Geoscience Employment — Examining Student Transitions and Workforce Dynamics• GEOSCIENCE EMPLOYMENT PROJECTIONS 2014–2024
Thi
s P
DF
is li
cens
ed fo
r in
divi
dual
use
(jb
aron
e@m
onro
ecc.
edu)
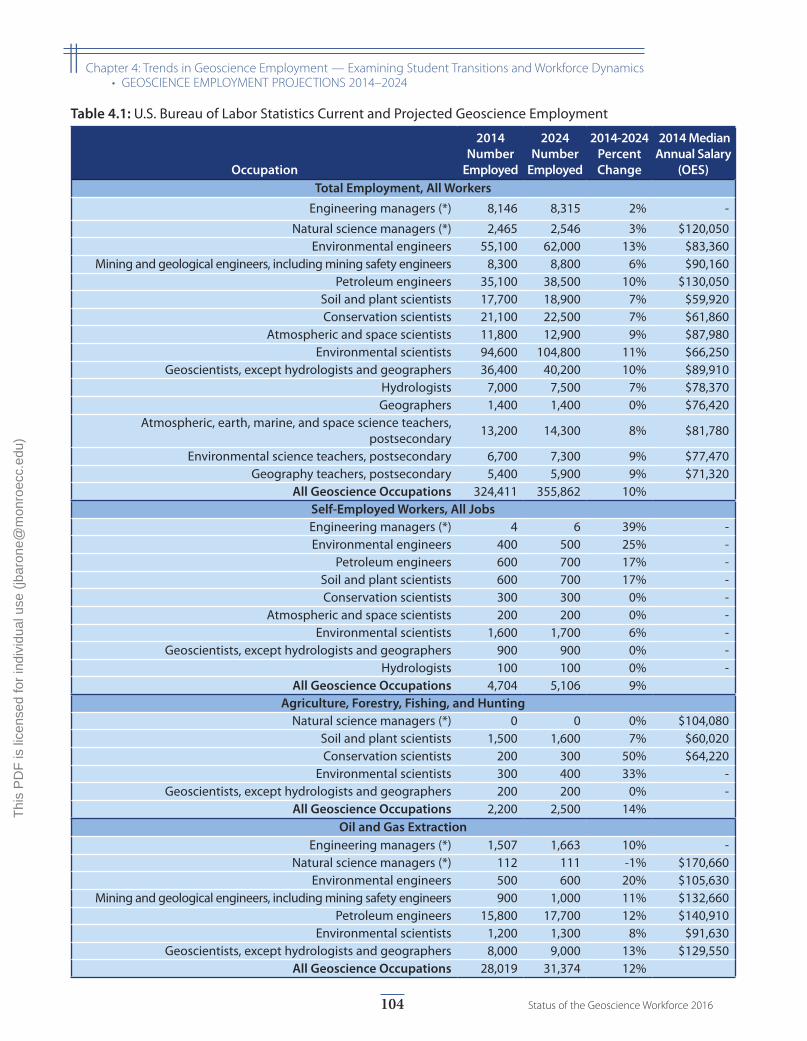
Table 4.1: U.S. Bureau of Labor Statistics Current and Projected Geoscience Employment
Occupation
2014 Number
Employed
2024 Number
Employed
2014-2024 Percent Change
2014 Median Annual Salary
(OES) Total Employment, All Workers
Engineering managers (*) 8,146 8,315 2% -
Natural science managers (*) 2,465 2,546 3% $120,050Environmental engineers 55,100 62,000 13% $83,360
Mining and geological engineers, including mining safety engineers 8,300 8,800 6% $90,160 Petroleum engineers 35,100 38,500 10% $130,050
Soil and plant scientists 17,700 18,900 7% $59,920 Conservation scientists 21,100 22,500 7% $61,860
Atmospheric and space scientists 11,800 12,900 9% $87,980 Environmental scientists 94,600 104,800 11% $66,250
Geoscientists, except hydrologists and geographers 36,400 40,200 10% $89,910 Hydrologists 7,000 7,500 7% $78,370 Geographers 1,400 1,400 0% $76,420
Atmospheric, earth, marine, and space science teachers, postsecondary 13,200 14,300 8% $81,780
Environmental science teachers, postsecondary 6,700 7,300 9% $77,470Geography teachers, postsecondary 5,400 5,900 9% $71,320
All Geoscience Occupations 324,411 355,862 10%Self-Employed Workers, All JobsEngineering managers (*) 4 6 39% -Environmental engineers 400 500 25% -
Petroleum engineers 600 700 17% -Soil and plant scientists 600 700 17% -Conservation scientists 300 300 0% -
Atmospheric and space scientists 200 200 0% -Environmental scientists 1,600 1,700 6% -
Geoscientists, except hydrologists and geographers 900 900 0% -Hydrologists 100 100 0% -
All Geoscience Occupations 4,704 5,106 9%Agriculture, Forestry, Fishing, and Hunting
Natural science managers (*) 0 0 0% $104,080Soil and plant scientists 1,500 1,600 7% $60,020Conservation scientists 200 300 50% $64,220
Environmental scientists 300 400 33% -Geoscientists, except hydrologists and geographers 200 200 0% -
All Geoscience Occupations 2,200 2,500 14%Oil and Gas Extraction
Engineering managers (*) 1,507 1,663 10% -Natural science managers (*) 112 111 -1% $170,660
Environmental engineers 500 600 20% $105,630 Mining and geological engineers, including mining safety engineers 900 1,000 11% $132,660
Petroleum engineers 15,800 17,700 12% $140,910 Environmental scientists 1,200 1,300 8% $91,630
Geoscientists, except hydrologists and geographers 8,000 9,000 13% $129,550 All Geoscience Occupations 28,019 31,374 12%
104 Status of the Geoscience Workforce 2016
|| Chapter 4: Trends in Geoscience Employment — Examining Student Transitions and Workforce Dynamics• GEOSCIENCE EMPLOYMENT PROJECTIONS 2014–2024
Thi
s P
DF
is li
cens
ed fo
r in
divi
dual
use
(jb
aron
e@m
onro
ecc.
edu)
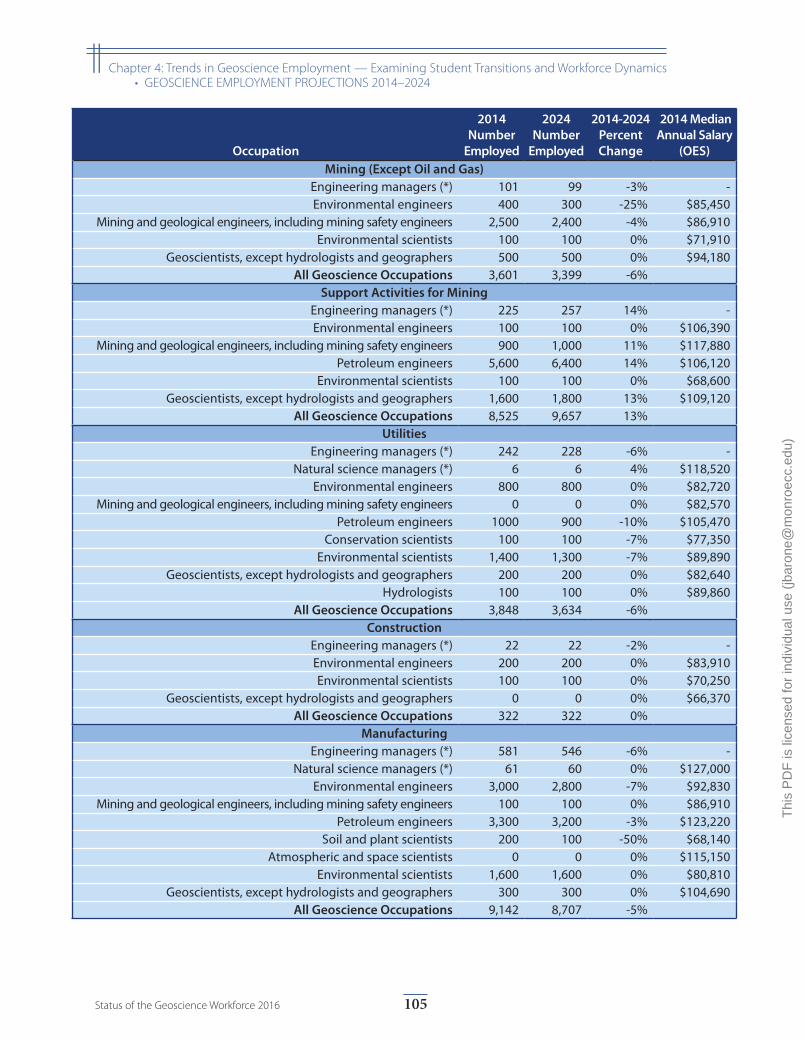
Occupation
2014 Number
Employed
2024 Number
Employed
2014-2024 Percent Change
2014 Median Annual Salary
(OES) Mining (Except Oil and Gas)
Engineering managers (*) 101 99 -3% -Environmental engineers 400 300 -25% $85,450
Mining and geological engineers, including mining safety engineers 2,500 2,400 -4% $86,910Environmental scientists 100 100 0% $71,910
Geoscientists, except hydrologists and geographers 500 500 0% $94,180 All Geoscience Occupations 3,601 3,399 -6%
Support Activities for MiningEngineering managers (*) 225 257 14% -Environmental engineers 100 100 0% $106,390
Mining and geological engineers, including mining safety engineers 900 1,000 11% $117,880 Petroleum engineers 5,600 6,400 14% $106,120
Environmental scientists 100 100 0% $68,600 Geoscientists, except hydrologists and geographers 1,600 1,800 13% $109,120
All Geoscience Occupations 8,525 9,657 13%Utilities
Engineering managers (*) 242 228 -6% -Natural science managers (*) 6 6 4% $118,520
Environmental engineers 800 800 0% $82,720 Mining and geological engineers, including mining safety engineers 0 0 0% $82,570
Petroleum engineers 1000 900 -10% $105,470 Conservation scientists 100 100 -7% $77,350
Environmental scientists 1,400 1,300 -7% $89,890 Geoscientists, except hydrologists and geographers 200 200 0% $82,640
Hydrologists 100 100 0% $89,860 All Geoscience Occupations 3,848 3,634 -6%
ConstructionEngineering managers (*) 22 22 -2% -Environmental engineers 200 200 0% $83,910Environmental scientists 100 100 0% $70,250
Geoscientists, except hydrologists and geographers 0 0 0% $66,370All Geoscience Occupations 322 322 0%
ManufacturingEngineering managers (*) 581 546 -6% -
Natural science managers (*) 61 60 0% $127,000Environmental engineers 3,000 2,800 -7% $92,830
Mining and geological engineers, including mining safety engineers 100 100 0% $86,910Petroleum engineers 3,300 3,200 -3% $123,220
Soil and plant scientists 200 100 -50% $68,140Atmospheric and space scientists 0 0 0% $115,150
Environmental scientists 1,600 1,600 0% $80,810Geoscientists, except hydrologists and geographers 300 300 0% $104,690
All Geoscience Occupations 9,142 8,707 -5%
105Status of the Geoscience Workforce 2016
|| Chapter 4: Trends in Geoscience Employment — Examining Student Transitions and Workforce Dynamics• GEOSCIENCE EMPLOYMENT PROJECTIONS 2014–2024
Thi
s P
DF
is li
cens
ed fo
r in
divi
dual
use
(jb
aron
e@m
onro
ecc.
edu)
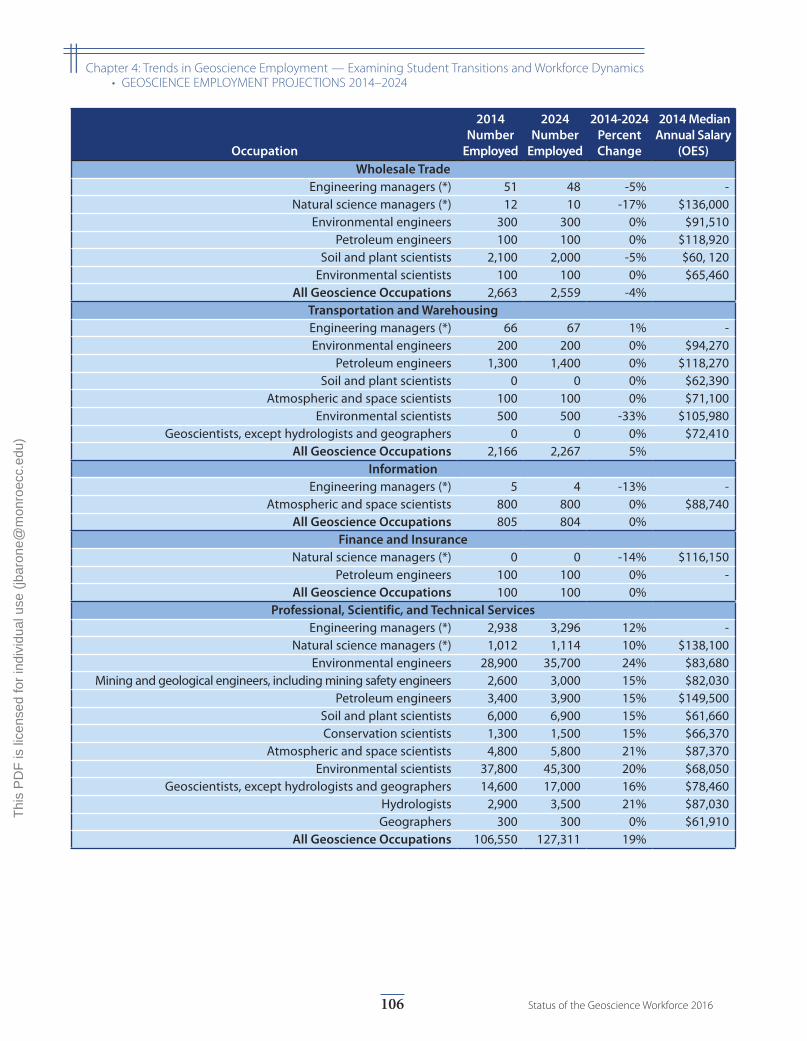
Occupation
2014 Number
Employed
2024 Number
Employed
2014-2024 Percent Change
2014 Median Annual Salary
(OES) Wholesale Trade
Engineering managers (*) 51 48 -5% -Natural science managers (*) 12 10 -17% $136,000
Environmental engineers 300 300 0% $91,510 Petroleum engineers 100 100 0% $118,920
Soil and plant scientists 2,100 2,000 -5% $60, 120 Environmental scientists 100 100 0% $65,460
All Geoscience Occupations 2,663 2,559 -4%Transportation and WarehousingEngineering managers (*) 66 67 1% -Environmental engineers 200 200 0% $94,270
Petroleum engineers 1,300 1,400 0% $118,270Soil and plant scientists 0 0 0% $62,390
Atmospheric and space scientists 100 100 0% $71,100Environmental scientists 500 500 -33% $105,980
Geoscientists, except hydrologists and geographers 0 0 0% $72,410All Geoscience Occupations 2,166 2,267 5%
InformationEngineering managers (*) 5 4 -13% -
Atmospheric and space scientists 800 800 0% $88,740 All Geoscience Occupations 805 804 0%
Finance and InsuranceNatural science managers (*) 0 0 -14% $116,150
Petroleum engineers 100 100 0% -All Geoscience Occupations 100 100 0%
Professional, Scientific, and Technical ServicesEngineering managers (*) 2,938 3,296 12% -
Natural science managers (*) 1,012 1,114 10% $138,100Environmental engineers 28,900 35,700 24% $83,680
Mining and geological engineers, including mining safety engineers 2,600 3,000 15% $82,030Petroleum engineers 3,400 3,900 15% $149,500
Soil and plant scientists 6,000 6,900 15% $61,660Conservation scientists 1,300 1,500 15% $66,370
Atmospheric and space scientists 4,800 5,800 21% $87,370 Environmental scientists 37,800 45,300 20% $68,050
Geoscientists, except hydrologists and geographers 14,600 17,000 16% $78,460 Hydrologists 2,900 3,500 21% $87,030 Geographers 300 300 0% $61,910
All Geoscience Occupations 106,550 127,311 19%
106 Status of the Geoscience Workforce 2016
|| Chapter 4: Trends in Geoscience Employment — Examining Student Transitions and Workforce Dynamics• GEOSCIENCE EMPLOYMENT PROJECTIONS 2014–2024
Thi
s P
DF
is li
cens
ed fo
r in
divi
dual
use
(jb
aron
e@m
onro
ecc.
edu)
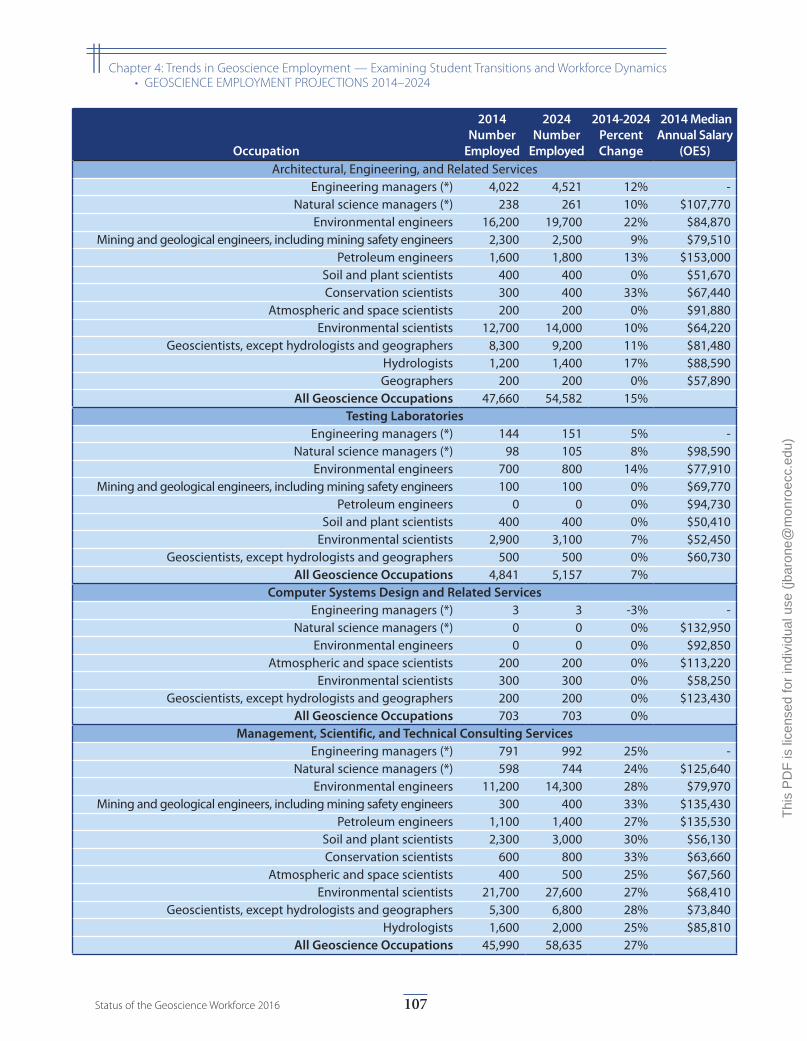
Occupation
2014 Number
Employed
2024 Number
Employed
2014-2024 Percent Change
2014 Median Annual Salary
(OES) Architectural, Engineering, and Related Services
Engineering managers (*) 4,022 4,521 12% -Natural science managers (*) 238 261 10% $107,770
Environmental engineers 16,200 19,700 22% $84,870 Mining and geological engineers, including mining safety engineers 2,300 2,500 9% $79,510
Petroleum engineers 1,600 1,800 13% $153,000Soil and plant scientists 400 400 0% $51,670 Conservation scientists 300 400 33% $67,440
Atmospheric and space scientists 200 200 0% $91,880 Environmental scientists 12,700 14,000 10% $64,220
Geoscientists, except hydrologists and geographers 8,300 9,200 11% $81,480 Hydrologists 1,200 1,400 17% $88,590 Geographers 200 200 0% $57,890
All Geoscience Occupations 47,660 54,582 15%Testing Laboratories
Engineering managers (*) 144 151 5% -Natural science managers (*) 98 105 8% $98,590
Environmental engineers 700 800 14% $77,910 Mining and geological engineers, including mining safety engineers 100 100 0% $69,770
Petroleum engineers 0 0 0% $94,730 Soil and plant scientists 400 400 0% $50,410
Environmental scientists 2,900 3,100 7% $52,450 Geoscientists, except hydrologists and geographers 500 500 0% $60,730
All Geoscience Occupations 4,841 5,157 7%Computer Systems Design and Related Services
Engineering managers (*) 3 3 -3% -Natural science managers (*) 0 0 0% $132,950
Environmental engineers 0 0 0% $92,850Atmospheric and space scientists 200 200 0% $113,220
Environmental scientists 300 300 0% $58,250 Geoscientists, except hydrologists and geographers 200 200 0% $123,430
All Geoscience Occupations 703 703 0%Management, Scientific, and Technical Consulting Services
Engineering managers (*) 791 992 25% -Natural science managers (*) 598 744 24% $125,640
Environmental engineers 11,200 14,300 28% $79,970 Mining and geological engineers, including mining safety engineers 300 400 33% $135,430
Petroleum engineers 1,100 1,400 27% $135,530 Soil and plant scientists 2,300 3,000 30% $56,130 Conservation scientists 600 800 33% $63,660
Atmospheric and space scientists 400 500 25% $67,560 Environmental scientists 21,700 27,600 27% $68,410
Geoscientists, except hydrologists and geographers 5,300 6,800 28% $73,840 Hydrologists 1,600 2,000 25% $85,810
All Geoscience Occupations 45,990 58,635 27%
107Status of the Geoscience Workforce 2016
|| Chapter 4: Trends in Geoscience Employment — Examining Student Transitions and Workforce Dynamics• GEOSCIENCE EMPLOYMENT PROJECTIONS 2014–2024
Thi
s P
DF
is li
cens
ed fo
r in
divi
dual
use
(jb
aron
e@m
onro
ecc.
edu)
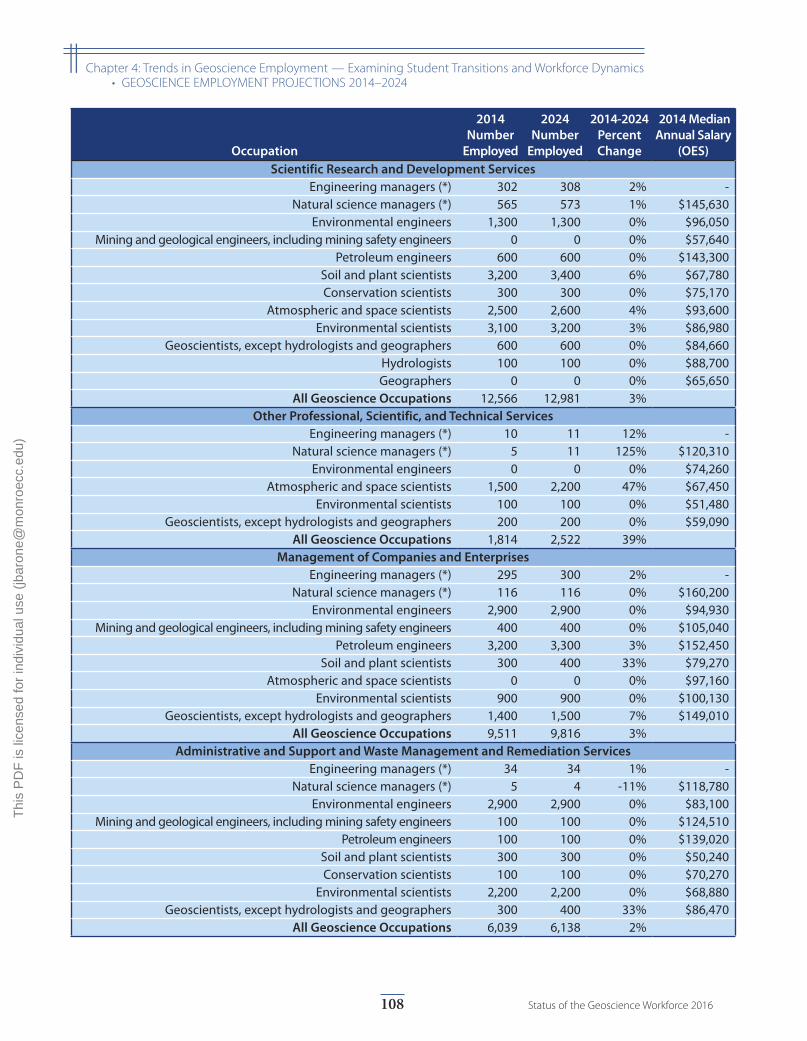
Occupation
2014 Number
Employed
2024 Number
Employed
2014-2024 Percent Change
2014 Median Annual Salary
(OES) Scientific Research and Development Services
Engineering managers (*) 302 308 2% -Natural science managers (*) 565 573 1% $145,630
Environmental engineers 1,300 1,300 0% $96,050 Mining and geological engineers, including mining safety engineers 0 0 0% $57,640
Petroleum engineers 600 600 0% $143,300 Soil and plant scientists 3,200 3,400 6% $67,780 Conservation scientists 300 300 0% $75,170
Atmospheric and space scientists 2,500 2,600 4% $93,600 Environmental scientists 3,100 3,200 3% $86,980
Geoscientists, except hydrologists and geographers 600 600 0% $84,660 Hydrologists 100 100 0% $88,700 Geographers 0 0 0% $65,650
All Geoscience Occupations 12,566 12,981 3%Other Professional, Scientific, and Technical Services
Engineering managers (*) 10 11 12% -Natural science managers (*) 5 11 125% $120,310
Environmental engineers 0 0 0% $74,260 Atmospheric and space scientists 1,500 2,200 47% $67,450
Environmental scientists 100 100 0% $51,480Geoscientists, except hydrologists and geographers 200 200 0% $59,090
All Geoscience Occupations 1,814 2,522 39%Management of Companies and Enterprises
Engineering managers (*) 295 300 2% -Natural science managers (*) 116 116 0% $160,200
Environmental engineers 2,900 2,900 0% $94,930Mining and geological engineers, including mining safety engineers 400 400 0% $105,040
Petroleum engineers 3,200 3,300 3% $152,450Soil and plant scientists 300 400 33% $79,270
Atmospheric and space scientists 0 0 0% $97,160 Environmental scientists 900 900 0% $100,130
Geoscientists, except hydrologists and geographers 1,400 1,500 7% $149,010 All Geoscience Occupations 9,511 9,816 3%
Administrative and Support and Waste Management and Remediation ServicesEngineering managers (*) 34 34 1% -
Natural science managers (*) 5 4 -11% $118,780 Environmental engineers 2,900 2,900 0% $83,100
Mining and geological engineers, including mining safety engineers 100 100 0% $124,510 Petroleum engineers 100 100 0% $139,020
Soil and plant scientists 300 300 0% $50,240 Conservation scientists 100 100 0% $70,270
Environmental scientists 2,200 2,200 0% $68,880 Geoscientists, except hydrologists and geographers 300 400 33% $86,470
All Geoscience Occupations 6,039 6,138 2%
108 Status of the Geoscience Workforce 2016
|| Chapter 4: Trends in Geoscience Employment — Examining Student Transitions and Workforce Dynamics• GEOSCIENCE EMPLOYMENT PROJECTIONS 2014–2024
Thi
s P
DF
is li
cens
ed fo
r in
divi
dual
use
(jb
aron
e@m
onro
ecc.
edu)
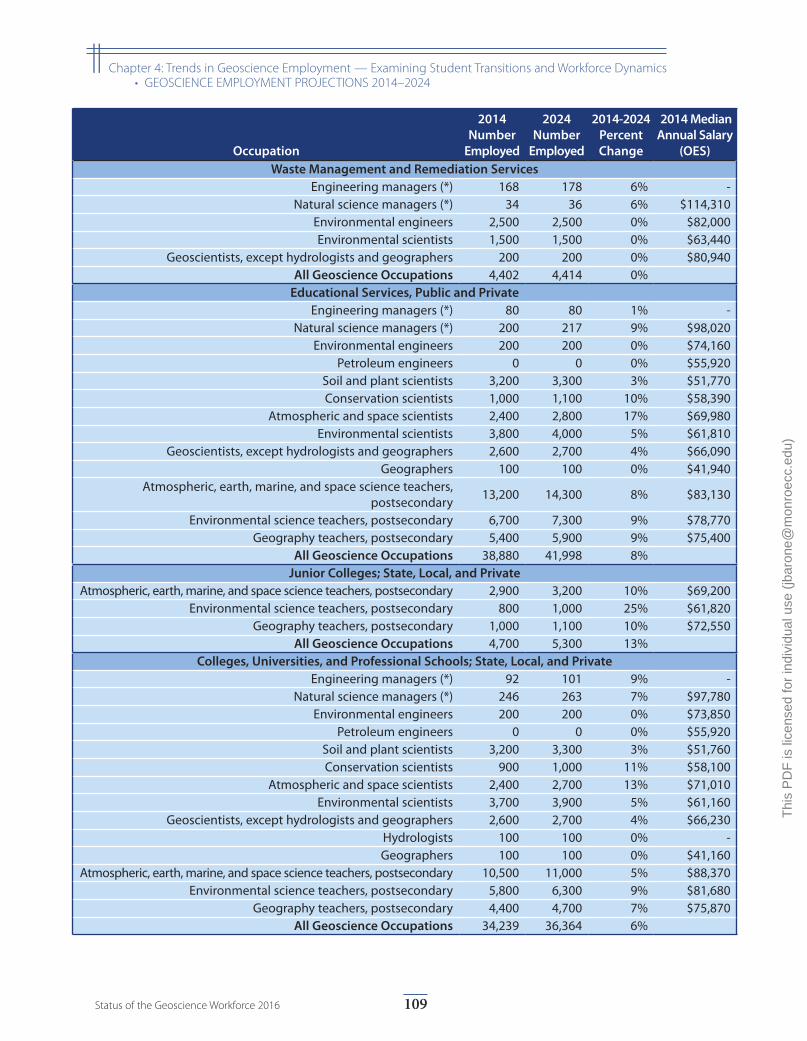
Occupation
2014 Number
Employed
2024 Number
Employed
2014-2024 Percent Change
2014 Median Annual Salary
(OES) Waste Management and Remediation Services
Engineering managers (*) 168 178 6% -Natural science managers (*) 34 36 6% $114,310
Environmental engineers 2,500 2,500 0% $82,000 Environmental scientists 1,500 1,500 0% $63,440
Geoscientists, except hydrologists and geographers 200 200 0% $80,940All Geoscience Occupations 4,402 4,414 0%
Educational Services, Public and PrivateEngineering managers (*) 80 80 1% -
Natural science managers (*) 200 217 9% $98,020Environmental engineers 200 200 0% $74,160
Petroleum engineers 0 0 0% $55,920Soil and plant scientists 3,200 3,300 3% $51,770Conservation scientists 1,000 1,100 10% $58,390
Atmospheric and space scientists 2,400 2,800 17% $69,980Environmental scientists 3,800 4,000 5% $61,810
Geoscientists, except hydrologists and geographers 2,600 2,700 4% $66,090Geographers 100 100 0% $41,940
Atmospheric, earth, marine, and space science teachers, postsecondary 13,200 14,300 8% $83,130
Environmental science teachers, postsecondary 6,700 7,300 9% $78,770Geography teachers, postsecondary 5,400 5,900 9% $75,400
All Geoscience Occupations 38,880 41,998 8%Junior Colleges; State, Local, and Private
Atmospheric, earth, marine, and space science teachers, postsecondary 2,900 3,200 10% $69,200Environmental science teachers, postsecondary 800 1,000 25% $61,820
Geography teachers, postsecondary 1,000 1,100 10% $72,550All Geoscience Occupations 4,700 5,300 13%
Colleges, Universities, and Professional Schools; State, Local, and PrivateEngineering managers (*) 92 101 9% -
Natural science managers (*) 246 263 7% $97,780Environmental engineers 200 200 0% $73,850
Petroleum engineers 0 0 0% $55,920Soil and plant scientists 3,200 3,300 3% $51,760Conservation scientists 900 1,000 11% $58,100
Atmospheric and space scientists 2,400 2,700 13% $71,010Environmental scientists 3,700 3,900 5% $61,160
Geoscientists, except hydrologists and geographers 2,600 2,700 4% $66,230Hydrologists 100 100 0% -Geographers 100 100 0% $41,160
Atmospheric, earth, marine, and space science teachers, postsecondary 10,500 11,000 5% $88,370Environmental science teachers, postsecondary 5,800 6,300 9% $81,680
Geography teachers, postsecondary 4,400 4,700 7% $75,870All Geoscience Occupations 34,239 36,364 6%
109Status of the Geoscience Workforce 2016
|| Chapter 4: Trends in Geoscience Employment — Examining Student Transitions and Workforce Dynamics• GEOSCIENCE EMPLOYMENT PROJECTIONS 2014–2024
Thi
s P
DF
is li
cens
ed fo
r in
divi
dual
use
(jb
aron
e@m
onro
ecc.
edu)
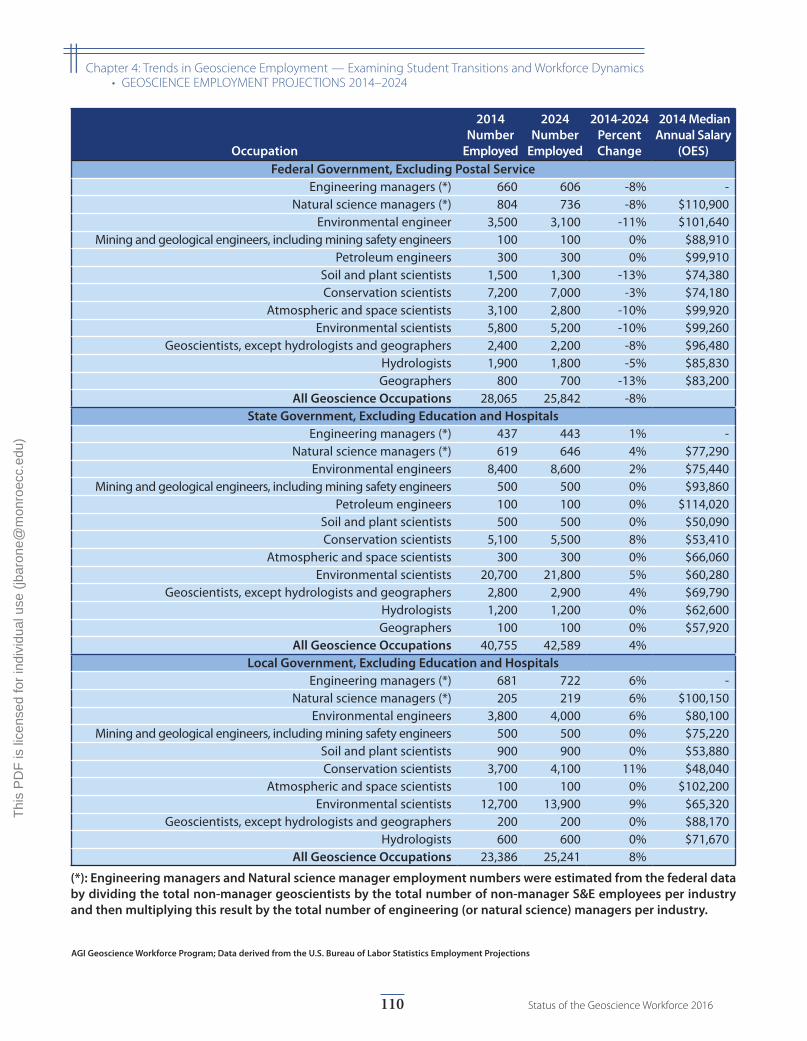
Occupation
2014 Number
Employed
2024 Number
Employed
2014-2024 Percent Change
2014 Median Annual Salary
(OES) Federal Government, Excluding Postal Service
Engineering managers (*) 660 606 -8% -Natural science managers (*) 804 736 -8% $110,900
Environmental engineer 3,500 3,100 -11% $101,640Mining and geological engineers, including mining safety engineers 100 100 0% $88,910
Petroleum engineers 300 300 0% $99,910Soil and plant scientists 1,500 1,300 -13% $74,380 Conservation scientists 7,200 7,000 -3% $74,180
Atmospheric and space scientists 3,100 2,800 -10% $99,920 Environmental scientists 5,800 5,200 -10% $99,260
Geoscientists, except hydrologists and geographers 2,400 2,200 -8% $96,480 Hydrologists 1,900 1,800 -5% $85,830 Geographers 800 700 -13% $83,200
All Geoscience Occupations 28,065 25,842 -8%State Government, Excluding Education and Hospitals
Engineering managers (*) 437 443 1% -Natural science managers (*) 619 646 4% $77,290
Environmental engineers 8,400 8,600 2% $75,440 Mining and geological engineers, including mining safety engineers 500 500 0% $93,860
Petroleum engineers 100 100 0% $114,020 Soil and plant scientists 500 500 0% $50,090 Conservation scientists 5,100 5,500 8% $53,410
Atmospheric and space scientists 300 300 0% $66,060 Environmental scientists 20,700 21,800 5% $60,280
Geoscientists, except hydrologists and geographers 2,800 2,900 4% $69,790 Hydrologists 1,200 1,200 0% $62,600 Geographers 100 100 0% $57,920
All Geoscience Occupations 40,755 42,589 4%Local Government, Excluding Education and Hospitals
Engineering managers (*) 681 722 6% -Natural science managers (*) 205 219 6% $100,150
Environmental engineers 3,800 4,000 6% $80,100 Mining and geological engineers, including mining safety engineers 500 500 0% $75,220
Soil and plant scientists 900 900 0% $53,880 Conservation scientists 3,700 4,100 11% $48,040
Atmospheric and space scientists 100 100 0% $102,200Environmental scientists 12,700 13,900 9% $65,320
Geoscientists, except hydrologists and geographers 200 200 0% $88,170Hydrologists 600 600 0% $71,670
All Geoscience Occupations 23,386 25,241 8%
(*): Engineering managers and Natural science manager employment numbers were estimated from the federal data by dividing the total non-manager geoscientists by the total number of non-manager S&E employees per industry and then multiplying this result by the total number of engineering (or natural science) managers per industry.
AGI Geoscience Workforce Program; Data derived from the U.S. Bureau of Labor Statistics Employment Projections
110 Status of the Geoscience Workforce 2016
|| Chapter 4: Trends in Geoscience Employment — Examining Student Transitions and Workforce Dynamics• GEOSCIENCE EMPLOYMENT PROJECTIONS 2014–2024
Thi
s P
DF
is li
cens
ed fo
r in
divi
dual
use
(jb
aron
e@m
onro
ecc.
edu)
Chapter 5: Trends in Economic Metrics and Drivers of the Geoscience Workforce
Tracking the economic metrics related to the geosci-ence workforce can indicate potential changes in the supply and demand for the future workforce,
which in turn impacts students finishing geoscience degrees at four-year universities. Therefore, this chapter looks at the changes in federal funding for geoscience research, economic metrics in the petroleum and min-ing industries, and the contribution of geoscience to the overall U.S. gross domestic product.
The percentage of federal research funding awarded to geoscience research declined over the years from 13% in 1970 to 7% in 2015, but the total dollar amount of federal geoscience research funding has increased steadily to $4 billion in 2013. However, the difference between the amount spent on applied compared to basic research has increased with approximately 2% more of the research funds spent on basic research from 2013-2015. This increase in spending for basic research can be attributed to an increase in the funding for basic research in the atmospheric sciences.
This report clearly shows the economic downturn in the oil and gas industry starting at the end of 2014. The price of oil, the gross domestic product contributed by
geoscientists in the oil and gas industry, and number of working oil rigs show a rapid decline over the past couple of years. At the end of 2015, the United States was operat-ing 36% of the drilling rigs in the world compared to 52% at the height of the industry in 2014, and this downturn has affected all areas of the industry with decreases in the number of land rigs, off-shore rigs, crude oil rigs, and natural gas rigs.
Since the economic recession in the United States in 2009, the U.S. non-fuel mines yielding metal ore and industrial minerals have seen an increase in the material handled by these mines, as well as the value of these yields.
All major employment sectors that directly hire geosci-entists currently make up approximately 0.52% of the total U.S. economy equaling $91 billion of the U.S. gross domestic product. This is a decrease of approximately $9 billion due to the economic downturn in the oil and gas industry. The projected GDP contributed by geoscientists in the oil and gas industry in 2024 is approximately $51 billion, which is $2 billion less than the contributed GDP by geoscientists in this industry in 2012. However, this projection will change if there is a strong bounce back for the U.S. oil and gas industry in the next few years.
111Status of the Geoscience Workforce 2016
Thi
s P
DF
is li
cens
ed fo
r in
divi
dual
use
(jb
aron
e@m
onro
ecc.
edu)
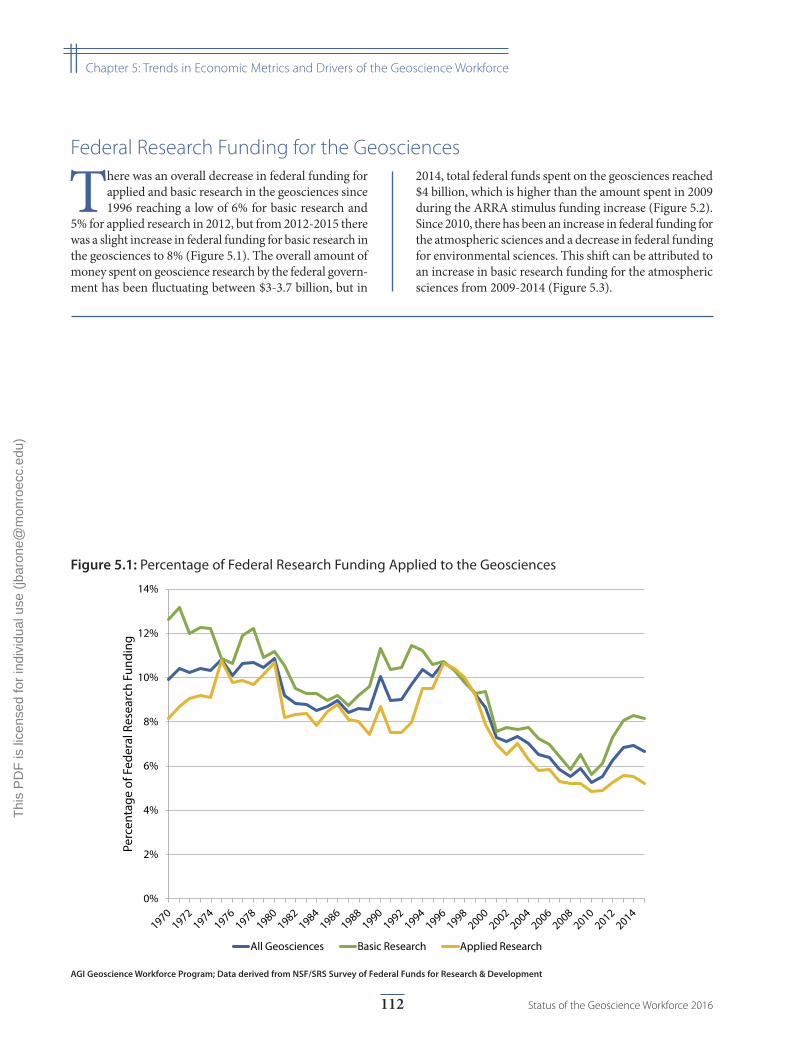
0%
2%
4%
6%
8%
10%
12%
14%
Perc
enta
ge o
f Fed
eral
Res
earc
h Fu
ndin
g
All Geosciences Basic Research Applied Research
Figure 5.1: Percentage of Federal Research Funding Applied to the Geosciences
AGI Geoscience Workforce Program; Data derived from NSF/SRS Survey of Federal Funds for Research & Development
Federal Research Funding for the Geosciences
There was an overall decrease in federal funding for applied and basic research in the geosciences since 1996 reaching a low of 6% for basic research and
5% for applied research in 2012, but from 2012-2015 there was a slight increase in federal funding for basic research in the geosciences to 8% (Figure 5.1). The overall amount of money spent on geoscience research by the federal govern-ment has been fluctuating between $3-3.7 billion, but in
2014, total federal funds spent on the geosciences reached $4 billion, which is higher than the amount spent in 2009 during the ARRA stimulus funding increase (Figure 5.2). Since 2010, there has been an increase in federal funding for the atmospheric sciences and a decrease in federal funding for environmental sciences. This shift can be attributed to an increase in basic research funding for the atmospheric sciences from 2009-2014 (Figure 5.3).
112 Status of the Geoscience Workforce 2016
|| Chapter 5: Trends in Economic Metrics and Drivers of the Geoscience Workforce
Thi
s P
DF
is li
cens
ed fo
r in
divi
dual
use
(jb
aron
e@m
onro
ecc.
edu)
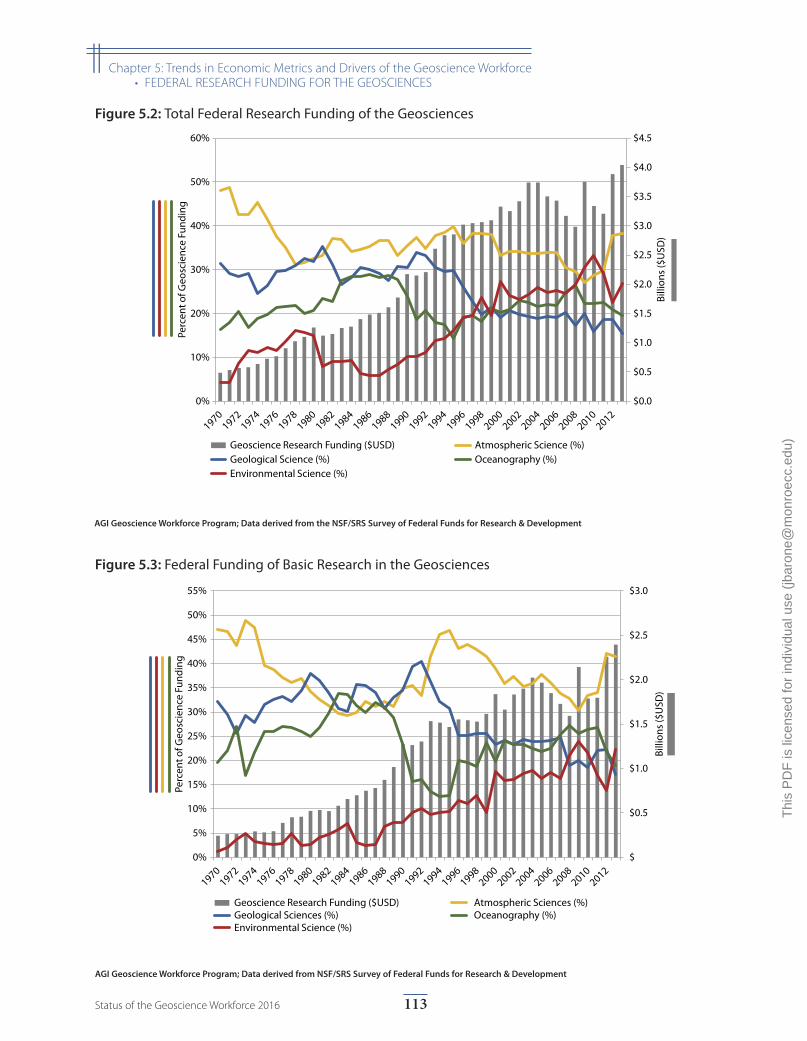
$
$0.5
$1.0
$1.5
$2.0
$2.5
$3.0
0%
5%
10%
15%
20%
25%
30%
35%
40%
45%
50%
55%
Billi
ons (
$USD
)
Perc
ent o
f Geo
scie
nce
Fund
ing
Geoscience Research Funding ($USD) Atmospheric Sciences (%) Geological Sciences (%) Oceanography (%) Environmental Science (%)
Figure 5.3: Federal Funding of Basic Research in the Geosciences
AGI Geoscience Workforce Program; Data derived from NSF/SRS Survey of Federal Funds for Research & Development
$0.0
$0.5
$1.0
$1.5
$2.0
$2.5
$3.0
$3.5
$4.0
$4.5
0%
10%
20%
30%
40%
50%
60%
Billi
ons (
$USD
)
Perc
ent o
f Geo
scie
nce
Fund
ing
Geoscience Research Funding ($USD) Atmospheric Science (%) Geological Science (%) Oceanography (%) Environmental Science (%)
Figure 5.2: Total Federal Research Funding of the Geosciences
AGI Geoscience Workforce Program; Data derived from the NSF/SRS Survey of Federal Funds for Research & Development
113Status of the Geoscience Workforce 2016
|| Chapter 5: Trends in Economic Metrics and Drivers of the Geoscience Workforce• FEDERAL RESEARCH FUNDING FOR THE GEOSCIENCES
Thi
s P
DF
is li
cens
ed fo
r in
divi
dual
use
(jb
aron
e@m
onro
ecc.
edu)
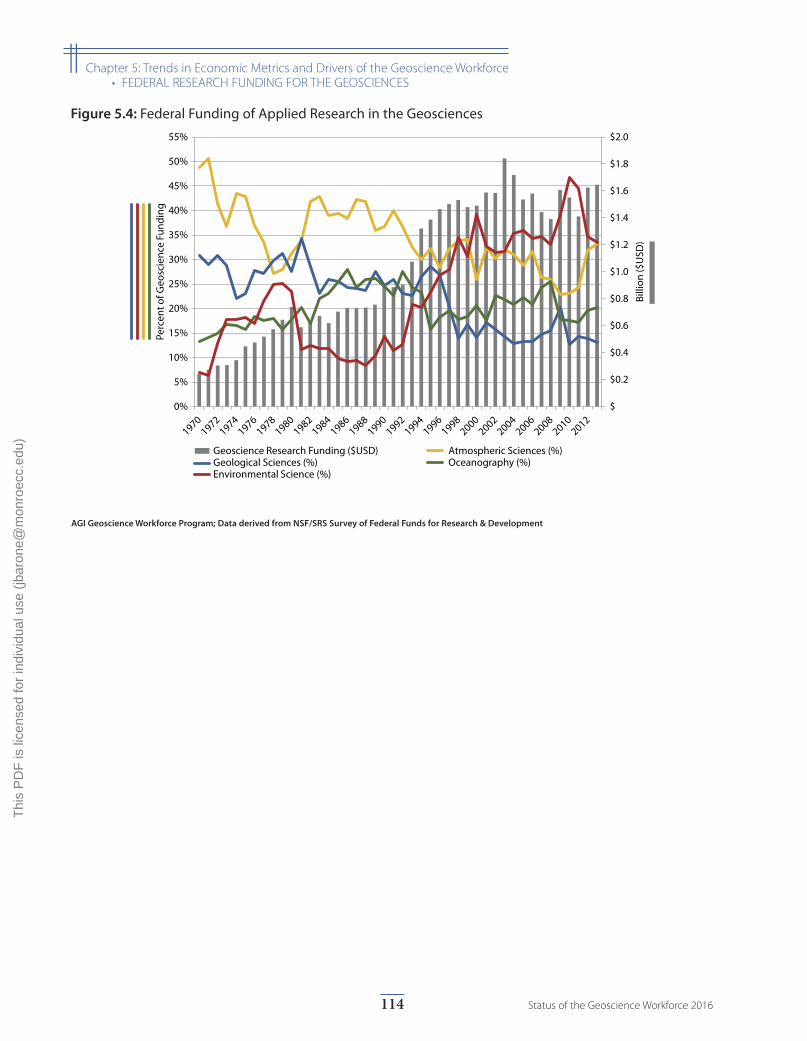
$
$0.2
$0.4
$0.6
$0.8
$1.0
$1.2
$1.4
$1.6
$1.8
$2.0
0%
5%
10%
15%
20%
25%
30%
35%
40%
45%
50%
55%
Billi
on ($
USD
)
Perc
ent o
f Geo
scie
nce
Fund
ing
Geoscience Research Funding ($USD) Atmospheric Sciences (%) Geological Sciences (%) Oceanography (%) Environmental Science (%)
Figure 5.4: Federal Funding of Applied Research in the Geosciences
AGI Geoscience Workforce Program; Data derived from NSF/SRS Survey of Federal Funds for Research & Development
114 Status of the Geoscience Workforce 2016
|| Chapter 5: Trends in Economic Metrics and Drivers of the Geoscience Workforce• FEDERAL RESEARCH FUNDING FOR THE GEOSCIENCES
Thi
s P
DF
is li
cens
ed fo
r in
divi
dual
use
(jb
aron
e@m
onro
ecc.
edu)
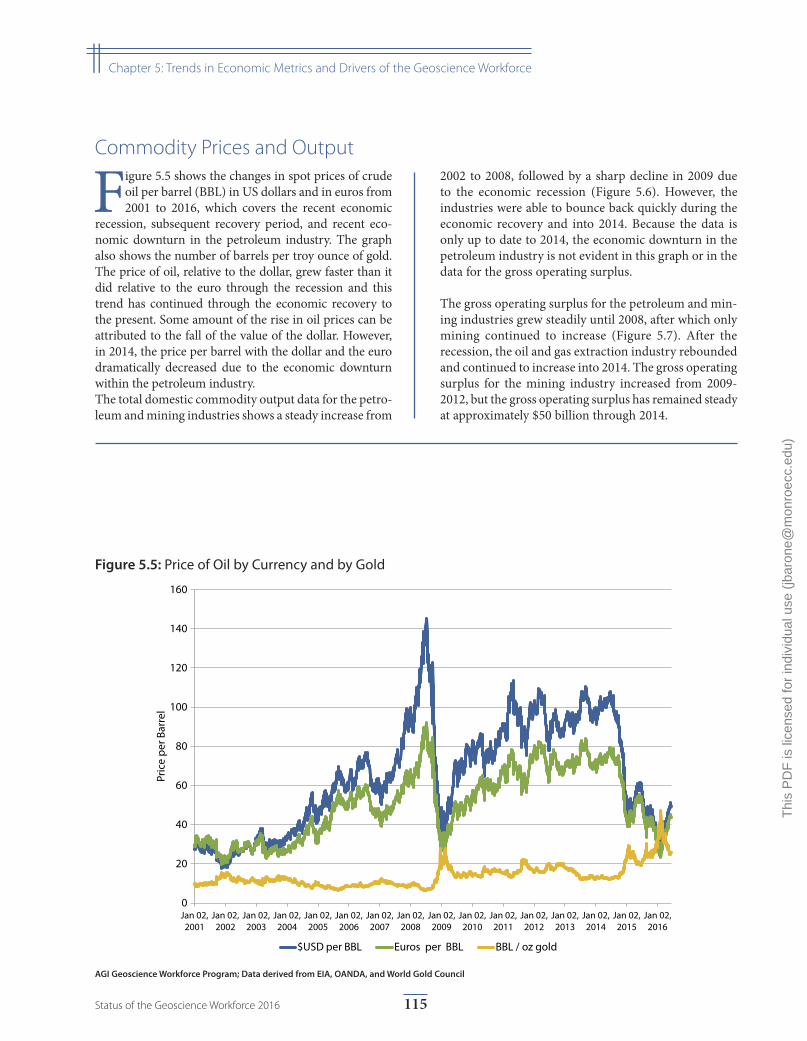
0
20
40
60
80
100
120
140
160
Jan 02, 2001
Jan 02, 2002
Jan 02, 2003
Jan 02, 2004
Jan 02, 2005
Jan 02, 2006
Jan 02, 2007
Jan 02, 2008
Jan 02, 2009
Jan 02, 2010
Jan 02, 2011
Jan 02, 2012
Jan 02, 2013
Jan 02, 2014
Jan 02, 2015
Jan 02, 2016
Pric
e pe
r Bar
rel
$USD per BBL Euros per BBL BBL / oz gold
Figure 5.5: Price of Oil by Currency and by Gold
AGI Geoscience Workforce Program; Data derived from EIA, OANDA, and World Gold Council
Commodity Prices and Output
Figure 5.5 shows the changes in spot prices of crude oil per barrel (BBL) in US dollars and in euros from 2001 to 2016, which covers the recent economic
recession, subsequent recovery period, and recent eco-nomic downturn in the petroleum industry. The graph also shows the number of barrels per troy ounce of gold. The price of oil, relative to the dollar, grew faster than it did relative to the euro through the recession and this trend has continued through the economic recovery to the present. Some amount of the rise in oil prices can be attributed to the fall of the value of the dollar. However, in 2014, the price per barrel with the dollar and the euro dramatically decreased due to the economic downturn within the petroleum industry.The total domestic commodity output data for the petro-leum and mining industries shows a steady increase from
2002 to 2008, followed by a sharp decline in 2009 due to the economic recession (Figure 5.6). However, the industries were able to bounce back quickly during the economic recovery and into 2014. Because the data is only up to date to 2014, the economic downturn in the petroleum industry is not evident in this graph or in the data for the gross operating surplus.
The gross operating surplus for the petroleum and min-ing industries grew steadily until 2008, after which only mining continued to increase (Figure 5.7). After the recession, the oil and gas extraction industry rebounded and continued to increase into 2014. The gross operating surplus for the mining industry increased from 2009-2012, but the gross operating surplus has remained steady at approximately $50 billion through 2014.
115Status of the Geoscience Workforce 2016
|| Chapter 5: Trends in Economic Metrics and Drivers of the Geoscience Workforce
Thi
s P
DF
is li
cens
ed fo
r in
divi
dual
use
(jb
aron
e@m
onro
ecc.
edu)
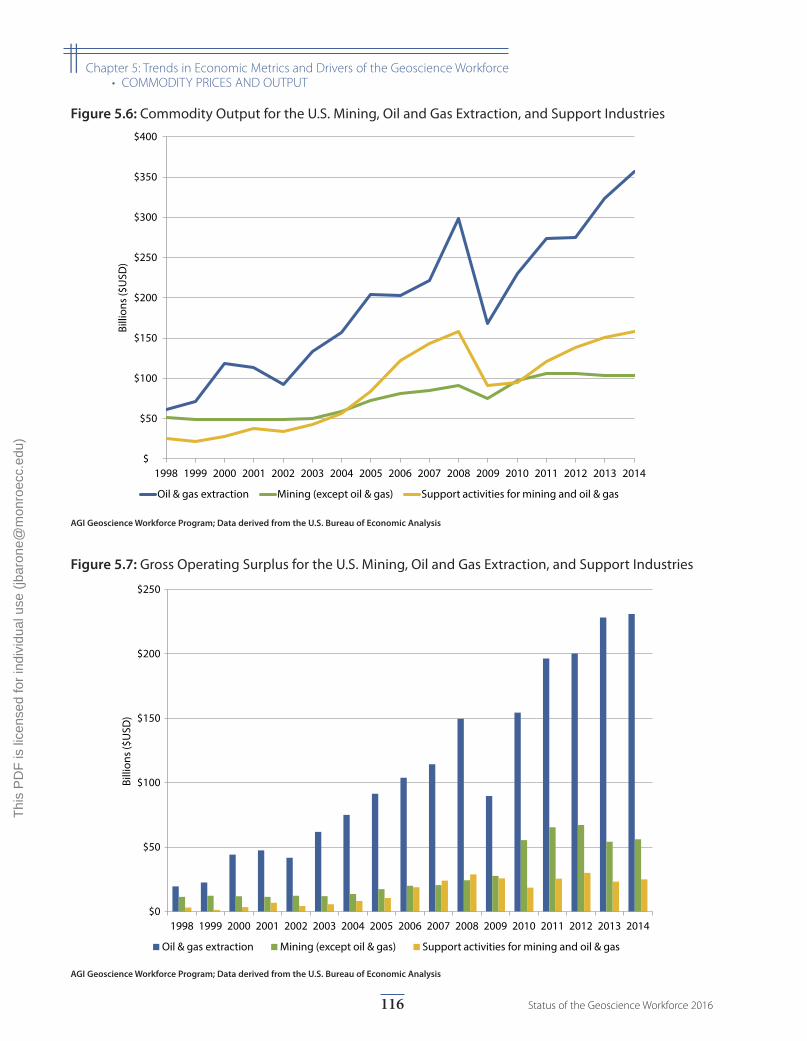
$0
$50
$100
$150
$200
$250
1998 1999 2000 2001 2002 2003 2004 2005 2006 2007 2008 2009 2010 2011 2012 2013 2014
Billi
ons (
$USD
)
Oil & gas extraction Mining (except oil & gas) Support activities for mining and oil & gas
Figure 5.7: Gross Operating Surplus for the U.S. Mining, Oil and Gas Extraction, and Support Industries
AGI Geoscience Workforce Program; Data derived from the U.S. Bureau of Economic Analysis
$
$50
$100
$150
$200
$250
$300
$350
$400
1998 1999 2000 2001 2002 2003 2004 2005 2006 2007 2008 2009 2010 2011 2012 2013 2014
Billi
ons (
$USD
)
Oil & gas extraction Mining (except oil & gas) Support activities for mining and oil & gas
Figure 5.6: Commodity Output for the U.S. Mining, Oil and Gas Extraction, and Support Industries
AGI Geoscience Workforce Program; Data derived from the U.S. Bureau of Economic Analysis
116 Status of the Geoscience Workforce 2016
|| Chapter 5: Trends in Economic Metrics and Drivers of the Geoscience Workforce• COMMODITY PRICES AND OUTPUT
Thi
s P
DF
is li
cens
ed fo
r in
divi
dual
use
(jb
aron
e@m
onro
ecc.
edu)
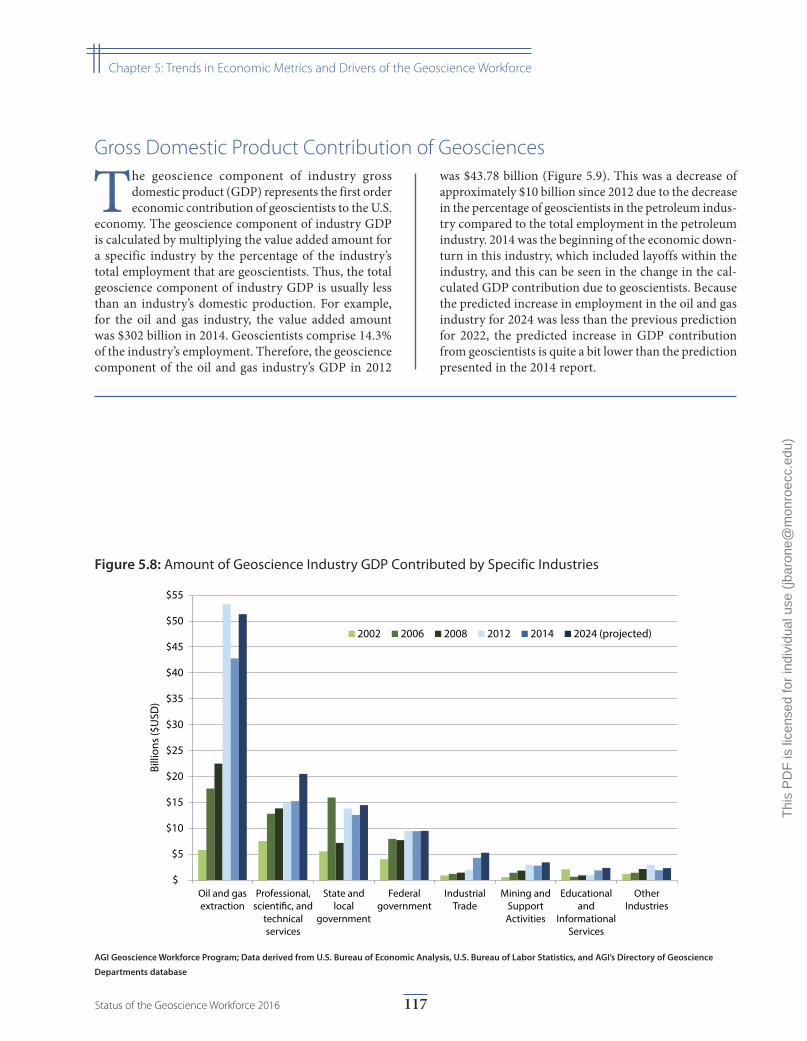
$
$5
$10
$15
$20
$25
$30
$35
$40
$45
$50
$55
Oil and gas extraction
Professional, scienti�c, and
technical services
State and local
government
Federal government
Industrial Trade
Mining and Support Activities
Educational and
Informational Services
Other Industries
Billi
ons (
$USD
)
2002 2006 2008 2012 2014 2024 (projected)
Figure 5.8: Amount of Geoscience Industry GDP Contributed by Specific Industries
AGI Geoscience Workforce Program; Data derived from U.S. Bureau of Economic Analysis, U.S. Bureau of Labor Statistics, and AGI’s Directory of Geoscience
Departments database
Gross Domestic Product Contribution of Geosciences
The geoscience component of industry gross domestic product (GDP) represents the first order economic contribution of geoscientists to the U.S.
economy. The geoscience component of industry GDP is calculated by multiplying the value added amount for a specific industry by the percentage of the industry’s total employment that are geoscientists. Thus, the total geoscience component of industry GDP is usually less than an industry’s domestic production. For example, for the oil and gas industry, the value added amount was $302 billion in 2014. Geoscientists comprise 14.3% of the industry’s employment. Therefore, the geoscience component of the oil and gas industry’s GDP in 2012
was $43.78 billion (Figure 5.9). This was a decrease of approximately $10 billion since 2012 due to the decrease in the percentage of geoscientists in the petroleum indus-try compared to the total employment in the petroleum industry. 2014 was the beginning of the economic down-turn in this industry, which included layoffs within the industry, and this can be seen in the change in the cal-culated GDP contribution due to geoscientists. Because the predicted increase in employment in the oil and gas industry for 2024 was less than the previous prediction for 2022, the predicted increase in GDP contribution from geoscientists is quite a bit lower than the prediction presented in the 2014 report.
117Status of the Geoscience Workforce 2016
|| Chapter 5: Trends in Economic Metrics and Drivers of the Geoscience Workforce
Thi
s P
DF
is li
cens
ed fo
r in
divi
dual
use
(jb
aron
e@m
onro
ecc.
edu)
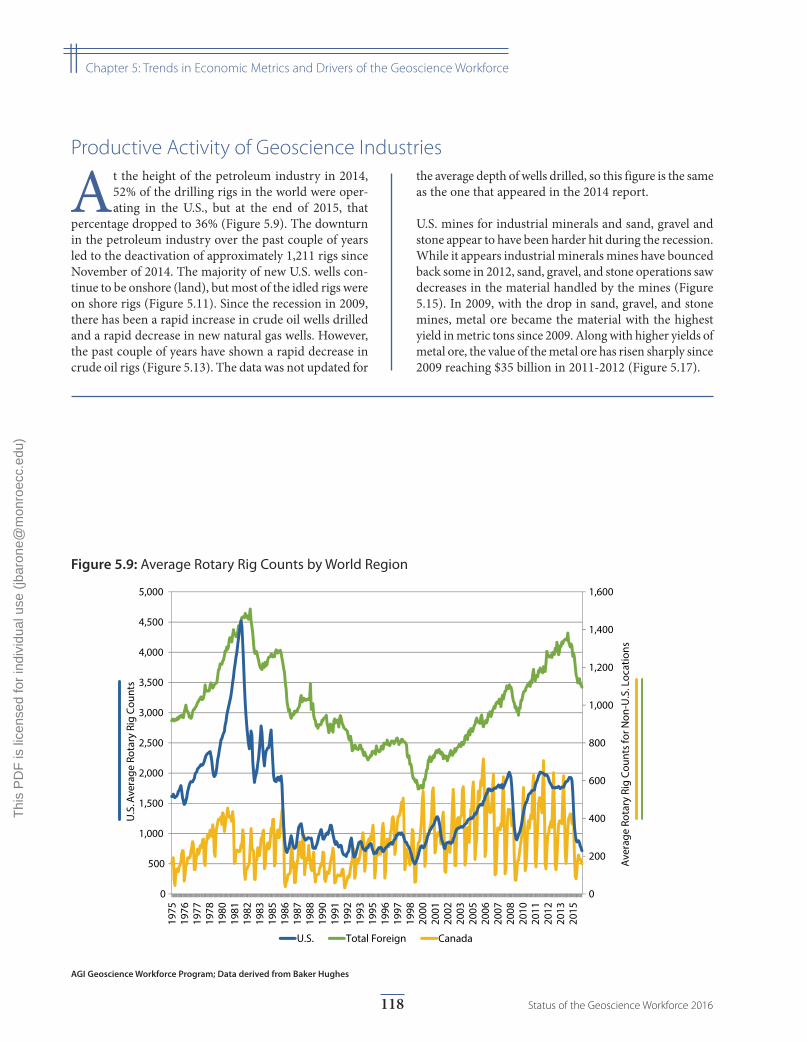
0
200
400
600
800
1,000
1,200
1,400
1,600
0
500
1,000
1,500
2,000
2,500
3,000
3,500
4,000
4,500
5,000
1975
1976
1977
1978
1980
1981
1982
1983
1985
1986
1987
1988
1990
1991
1992
1993
1995
1996
1997
1998
2000
2001
2002
2003
2005
2006
2007
2008
2010
2011
2012
2013
2015
Aver
age
Rota
ry R
ig C
ount
s for
Non
-U.S
. Loc
atio
ns
U.S
. Ave
rage
Rot
ary
Rig
Coun
ts
U.S. Total Foreign Canada
Figure 5.9: Average Rotary Rig Counts by World Region
AGI Geoscience Workforce Program; Data derived from Baker Hughes
Productive Activity of Geoscience Industries
At the height of the petroleum industry in 2014, 52% of the drilling rigs in the world were oper-ating in the U.S., but at the end of 2015, that
percentage dropped to 36% (Figure 5.9). The downturn in the petroleum industry over the past couple of years led to the deactivation of approximately 1,211 rigs since November of 2014. The majority of new U.S. wells con-tinue to be onshore (land), but most of the idled rigs were on shore rigs (Figure 5.11). Since the recession in 2009, there has been a rapid increase in crude oil wells drilled and a rapid decrease in new natural gas wells. However, the past couple of years have shown a rapid decrease in crude oil rigs (Figure 5.13). The data was not updated for
the average depth of wells drilled, so this figure is the same as the one that appeared in the 2014 report.
U.S. mines for industrial minerals and sand, gravel and stone appear to have been harder hit during the recession. While it appears industrial minerals mines have bounced back some in 2012, sand, gravel, and stone operations saw decreases in the material handled by the mines (Figure 5.15). In 2009, with the drop in sand, gravel, and stone mines, metal ore became the material with the highest yield in metric tons since 2009. Along with higher yields of metal ore, the value of the metal ore has risen sharply since 2009 reaching $35 billion in 2011-2012 (Figure 5.17).
118 Status of the Geoscience Workforce 2016
|| Chapter 5: Trends in Economic Metrics and Drivers of the Geoscience Workforce
Thi
s P
DF
is li
cens
ed fo
r in
divi
dual
use
(jb
aron
e@m
onro
ecc.
edu)
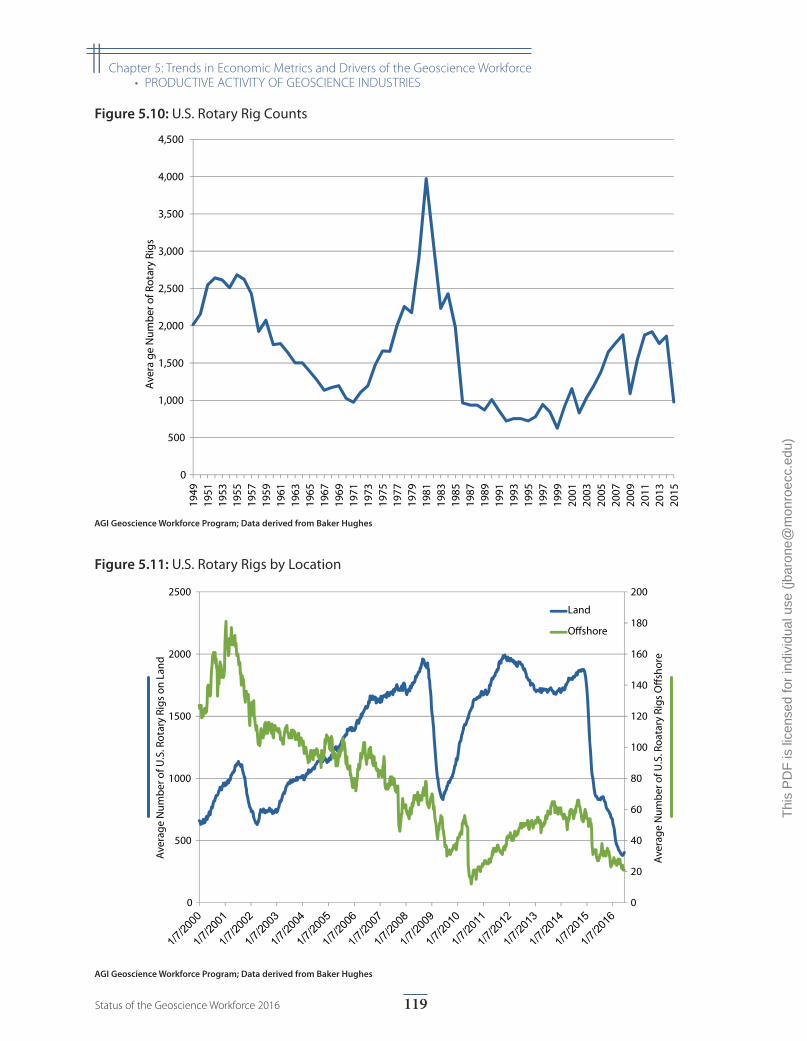
0
20
40
60
80
100
120
140
160
180
200
0
500
1000
1500
2000
2500
Aver
age
Num
ber o
f U.S
. Roa
tary
Rig
s O
�sho
re
Aver
age
Num
ber o
f U.S
. Rot
ary
Rigs
on
Land
Land
O�shore
Figure 5.11: U.S. Rotary Rigs by Location
AGI Geoscience Workforce Program; Data derived from Baker Hughes
0
500
1,000
1,500
2,000
2,500
3,000
3,500
4,000
4,500
1949
1951
1953
1955
1957
1959
1961
1963
1965
1967
1969
1971
1973
1975
1977
1979
1981
1983
1985
1987
1989
1991
1993
1995
1997
1999
2001
2003
2005
2007
2009
2011
2013
2015
Aver
a ge
Num
ber o
f Rot
ary
Rigs
Figure 5.10: U.S. Rotary Rig Counts
AGI Geoscience Workforce Program; Data derived from Baker Hughes
119Status of the Geoscience Workforce 2016
|| Chapter 5: Trends in Economic Metrics and Drivers of the Geoscience Workforce• PRODUCTIVE ACTIVITY OF GEOSCIENCE INDUSTRIES
Thi
s P
DF
is li
cens
ed fo
r in
divi
dual
use
(jb
aron
e@m
onro
ecc.
edu)
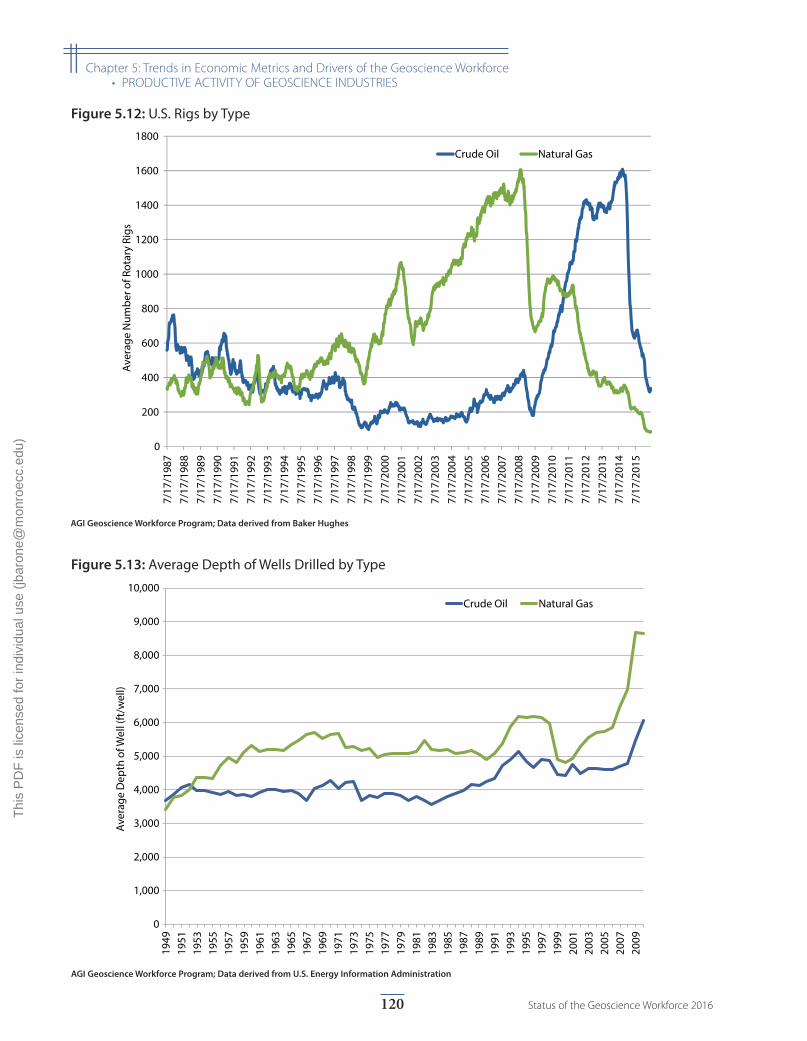
0
1,000
2,000
3,000
4,000
5,000
6,000
7,000
8,000
9,000
10,000
1949
19
51
1953
19
55
1957
19
59
1961
19
63
1965
19
67
1969
19
71
1973
19
75
1977
19
79
1981
19
83
1985
19
87
1989
19
91
1993
19
95
1997
19
99
2001
20
03
2005
20
07
2009
Aver
age
Dep
th o
f Wel
l (ft
/wel
l)
Crude Oil Natural Gas
Figure 5.13: Average Depth of Wells Drilled by Type
AGI Geoscience Workforce Program; Data derived from U.S. Energy Information Administration
0
200
400
600
800
1000
1200
1400
1600
1800
7/17
/198
77/
17/1
988
7/17
/198
97/
17/1
990
7/17
/199
17/
17/1
992
7/17
/199
37/
17/1
994
7/17
/199
57/
17/1
996
7/17
/199
77/
17/1
998
7/17
/199
97/
17/2
000
7/17
/200
17/
17/2
002
7/17
/200
37/
17/2
004
7/17
/200
57/
17/2
006
7/17
/200
77/
17/2
008
7/17
/200
97/
17/2
010
7/17
/201
17/
17/2
012
7/17
/201
37/
17/2
014
7/17
/201
5
Aver
age
Num
ber o
f Rot
ary
Rigs
Crude Oil Natural Gas
Figure 5.12: U.S. Rigs by Type
AGI Geoscience Workforce Program; Data derived from Baker Hughes
120 Status of the Geoscience Workforce 2016
|| Chapter 5: Trends in Economic Metrics and Drivers of the Geoscience Workforce• PRODUCTIVE ACTIVITY OF GEOSCIENCE INDUSTRIES
Thi
s P
DF
is li
cens
ed fo
r in
divi
dual
use
(jb
aron
e@m
onro
ecc.
edu)
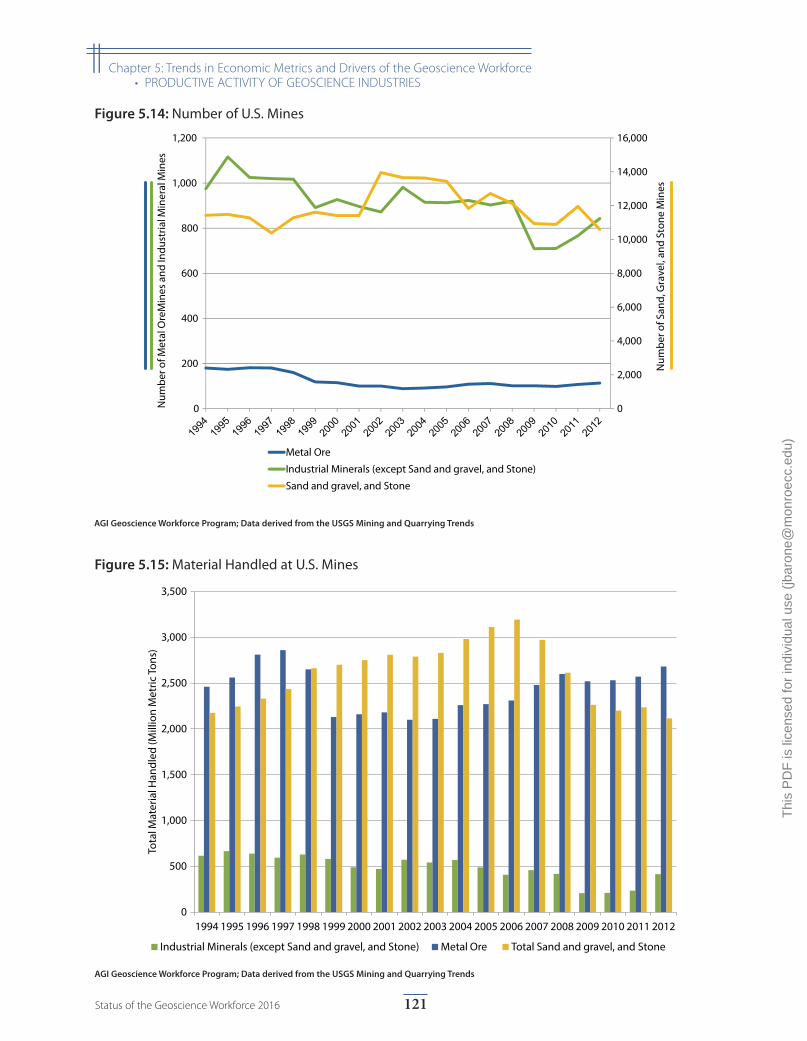
0
500
1,000
1,500
2,000
2,500
3,000
3,500
1994 1995 1996 1997 1998 1999 2000 2001 2002 2003 2004 2005 2006 2007 2008 2009 2010 2011 2012
Tota
l Mat
eria
l Han
dled
(Mill
ion
Met
ric To
ns)
Industrial Minerals (except Sand and gravel, and Stone) Metal Ore Total Sand and gravel, and Stone
Figure 5.15: Material Handled at U.S. Mines
AGI Geoscience Workforce Program; Data derived from the USGS Mining and Quarrying Trends
0
2,000
4,000
6,000
8,000
10,000
12,000
14,000
16,000
0
200
400
600
800
1,000
1,200
Num
ber o
f San
d, G
rave
l, an
d St
one
Min
es
Num
ber o
f Met
al O
reM
ines
and
Indu
stria
l Min
eral
Min
es
Metal Ore
Industrial Minerals (except Sand and gravel, and Stone)
Sand and gravel, and Stone
Figure 5.14: Number of U.S. Mines
AGI Geoscience Workforce Program; Data derived from the USGS Mining and Quarrying Trends
121Status of the Geoscience Workforce 2016
|| Chapter 5: Trends in Economic Metrics and Drivers of the Geoscience Workforce• PRODUCTIVE ACTIVITY OF GEOSCIENCE INDUSTRIES
Thi
s P
DF
is li
cens
ed fo
r in
divi
dual
use
(jb
aron
e@m
onro
ecc.
edu)
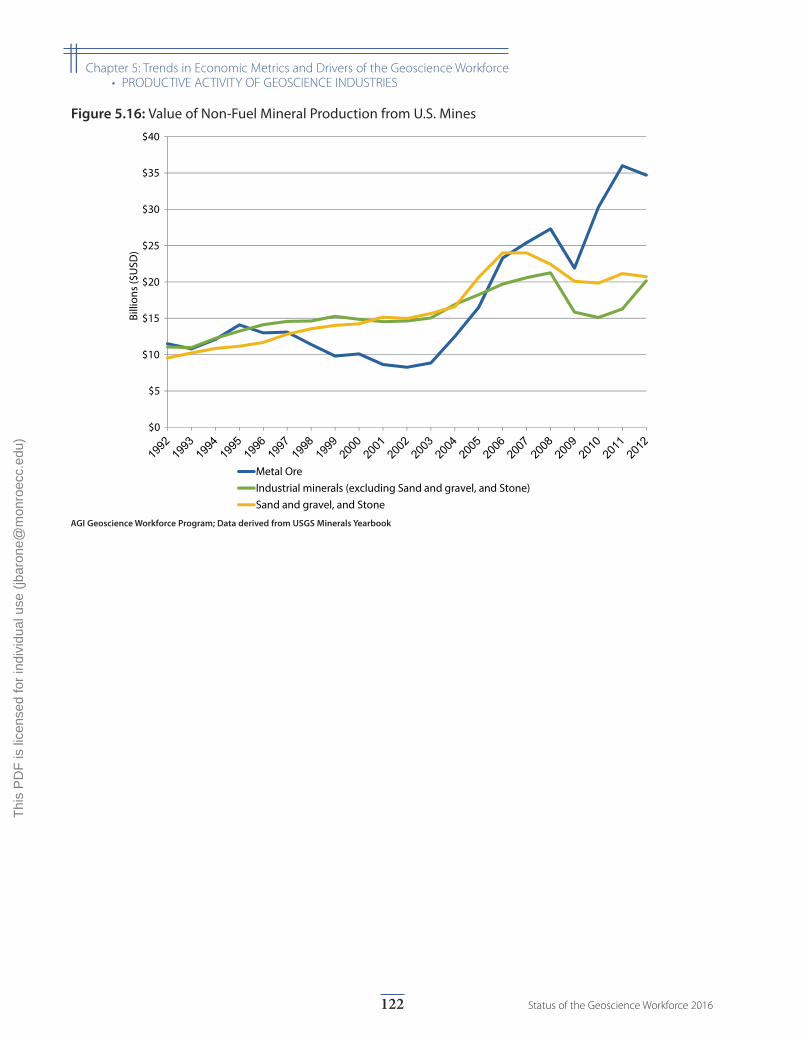
$0
$5
$10
$15
$20
$25
$30
$35
$40Bi
llion
s ($U
SD)
Metal OreIndustrial minerals (excluding Sand and gravel, and Stone)Sand and gravel, and Stone
Figure 5.16: Value of Non-Fuel Mineral Production from U.S. Mines
AGI Geoscience Workforce Program; Data derived from USGS Minerals Yearbook
122 Status of the Geoscience Workforce 2016
|| Chapter 5: Trends in Economic Metrics and Drivers of the Geoscience Workforce• PRODUCTIVE ACTIVITY OF GEOSCIENCE INDUSTRIES
Thi
s P
DF
is li
cens
ed fo
r in
divi
dual
use
(jb
aron
e@m
onro
ecc.
edu)
Appendix A: Defining the Geosciences
Given its complexity, the geoscience occupation is difficult to define under existing nomenclature. This is the result of varied educational pathways
geoscientists pursue and because of the different indus-tries in which geoscientists work. Additionally, each federal data source (U.S. Bureau of Labor Statistics, U.S. Census Bureau, National Center for Education Statistics, National Science Foundation, U.S. Bureau of Economic Analysis, Office of Personnel Management), professional society, and industry classifies geoscientists differently depending on the intent of data collection (national occupational trends, science and engineering trends, education vs. occupation, internal classification codes, etc.), the characteristics of the population surveyed, and the focus of the organization.
U.S. federal policy and funding is partially determined by the economic activity and employment trends of a given profession. Accurate measurement and analysis of the geoscience profession are central to successful decisions that support a robust geoscience profession in the U.S.
Unfortunately, the geosciences are not consistently defined across the myriad of data sources collected and used by federal government and professional societies. In many cases, the issues of definition are related to splitting of disciplines. In some cases, they are archaic artifacts of early labor policy and, in other, represent a lack of domain knowledge in the agencies setting the definitions. Though many federal agencies are attempt-ing to improve their classification approach, the current diversity of definitions will continue for the foreseeable future. Unfortunately, the public statistics from this data are used by counselors and individuals seeking career
options, and the current state of geoscience workforce data tend to severely under-represents the size of the profession and the breadth of opportunities.
To address this issue, AGI has established a working defi-nition for the geoscience profession in order to improve comparability of data across sources and time periods, which is laid out in this section.
Many federal data sources use the Classification Instructional Programs (CIP) codes to classify educa-tional programs, the Standard Occupational Classification (SOC) codes to classify occupations, and the North American Industry Classification System (NAICS) to classify industries. In this appendix we report how each data source defines a geoscientist. The CIP codes are managed by the U.S. Department of Education’s National Center for Education Statistics. The SOC codes were developed by the U.S. Office of Management and Budget and are managed by the Standard Occupational Classification Revision Policy Committee. This committee consists of representatives from the U.S. Bureau of Labor Statistics, the U.S. Bureau of Census, the U.S. Department of Labor (Employment and Training Administration), the Office of Personnel Management, the Defense Manpower Data Center, the National Science Foundation, the National Occupational Information Coordinating Committee, and the Office of Management and Budget. The NAICS was developed under the guidance of the Office of Management and Budget by the U.S. Economic Classification Policy Committee, Statistics Canada, and Mexico’s Instituto Nacional de Estadistica, Geografia e Informatica in order to allow for economic comparisons between North American countries.
123Status of the Geoscience Workforce 2016
Thi
s P
DF
is li
cens
ed fo
r in
divi
dual
use
(jb
aron
e@m
onro
ecc.
edu)
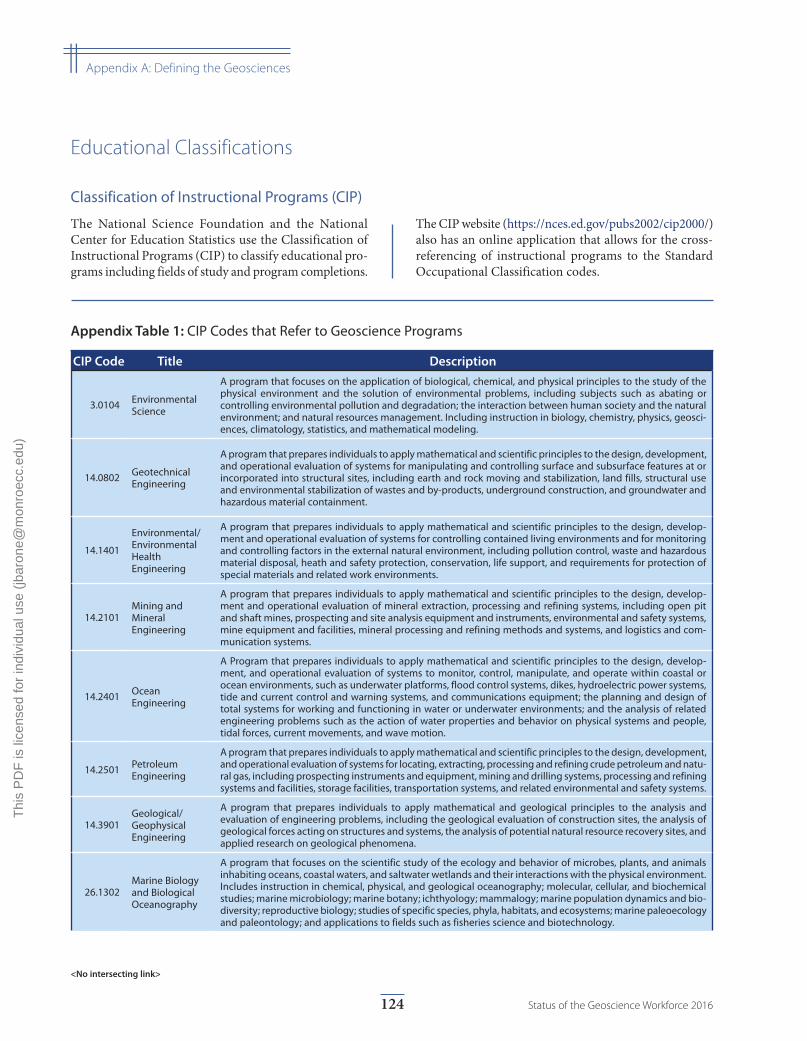
Figure 6.11: <No intersecting link>
<No intersecting link>
Appendix Table 1: CIP Codes that Refer to Geoscience Programs
Educational Classifications
Classification of Instructional Programs (CIP)
The National Science Foundation and the National Center for Education Statistics use the Classification of Instructional Programs (CIP) to classify educational pro-grams including fields of study and program completions.
The CIP website (https://nces.ed.gov/pubs2002/cip2000/) also has an online application that allows for the cross-referencing of instructional programs to the Standard Occupational Classification codes.
CIP Code Title Description
3.0104 Environmental Science
A program that focuses on the application of biological, chemical, and physical principles to the study of the physical environment and the solution of environmental problems, including subjects such as abating or controlling environmental pollution and degradation; the interaction between human society and the natural environment; and natural resources management. Including instruction in biology, chemistry, physics, geosci-ences, climatology, statistics, and mathematical modeling.
14.0802 Geotechnical Engineering
A program that prepares individuals to apply mathematical and scientific principles to the design, development, and operational evaluation of systems for manipulating and controlling surface and subsurface features at or incorporated into structural sites, including earth and rock moving and stabilization, land fills, structural use and environmental stabilization of wastes and by-products, underground construction, and groundwater and hazardous material containment.
14.1401
Environmental/Environmental Health Engineering
A program that prepares individuals to apply mathematical and scientific principles to the design, develop-ment and operational evaluation of systems for controlling contained living environments and for monitoring and controlling factors in the external natural environment, including pollution control, waste and hazardous material disposal, heath and safety protection, conservation, life support, and requirements for protection of special materials and related work environments.
14.2101Mining and Mineral Engineering
A program that prepares individuals to apply mathematical and scientific principles to the design, develop-ment and operational evaluation of mineral extraction, processing and refining systems, including open pit and shaft mines, prospecting and site analysis equipment and instruments, environmental and safety systems, mine equipment and facilities, mineral processing and refining methods and systems, and logistics and com-munication systems.
14.2401 Ocean Engineering
A Program that prepares individuals to apply mathematical and scientific principles to the design, develop-ment, and operational evaluation of systems to monitor, control, manipulate, and operate within coastal or ocean environments, such as underwater platforms, flood control systems, dikes, hydroelectric power systems, tide and current control and warning systems, and communications equipment; the planning and design of total systems for working and functioning in water or underwater environments; and the analysis of related engineering problems such as the action of water properties and behavior on physical systems and people, tidal forces, current movements, and wave motion.
14.2501 Petroleum Engineering
A program that prepares individuals to apply mathematical and scientific principles to the design, development, and operational evaluation of systems for locating, extracting, processing and refining crude petroleum and natu-ral gas, including prospecting instruments and equipment, mining and drilling systems, processing and refining systems and facilities, storage facilities, transportation systems, and related environmental and safety systems.
14.3901Geological/Geophysical Engineering
A program that prepares individuals to apply mathematical and geological principles to the analysis and evaluation of engineering problems, including the geological evaluation of construction sites, the analysis of geological forces acting on structures and systems, the analysis of potential natural resource recovery sites, and applied research on geological phenomena.
26.1302Marine Biology and Biological Oceanography
A program that focuses on the scientific study of the ecology and behavior of microbes, plants, and animals inhabiting oceans, coastal waters, and saltwater wetlands and their interactions with the physical environment. Includes instruction in chemical, physical, and geological oceanography; molecular, cellular, and biochemical studies; marine microbiology; marine botany; ichthyology; mammalogy; marine population dynamics and bio-diversity; reproductive biology; studies of specific species, phyla, habitats, and ecosystems; marine paleoecology and paleontology; and applications to fields such as fisheries science and biotechnology.
124 Status of the Geoscience Workforce 2016
|| Appendix A: Defining the Geosciences
Thi
s P
DF
is li
cens
ed fo
r in
divi
dual
use
(jb
aron
e@m
onro
ecc.
edu)
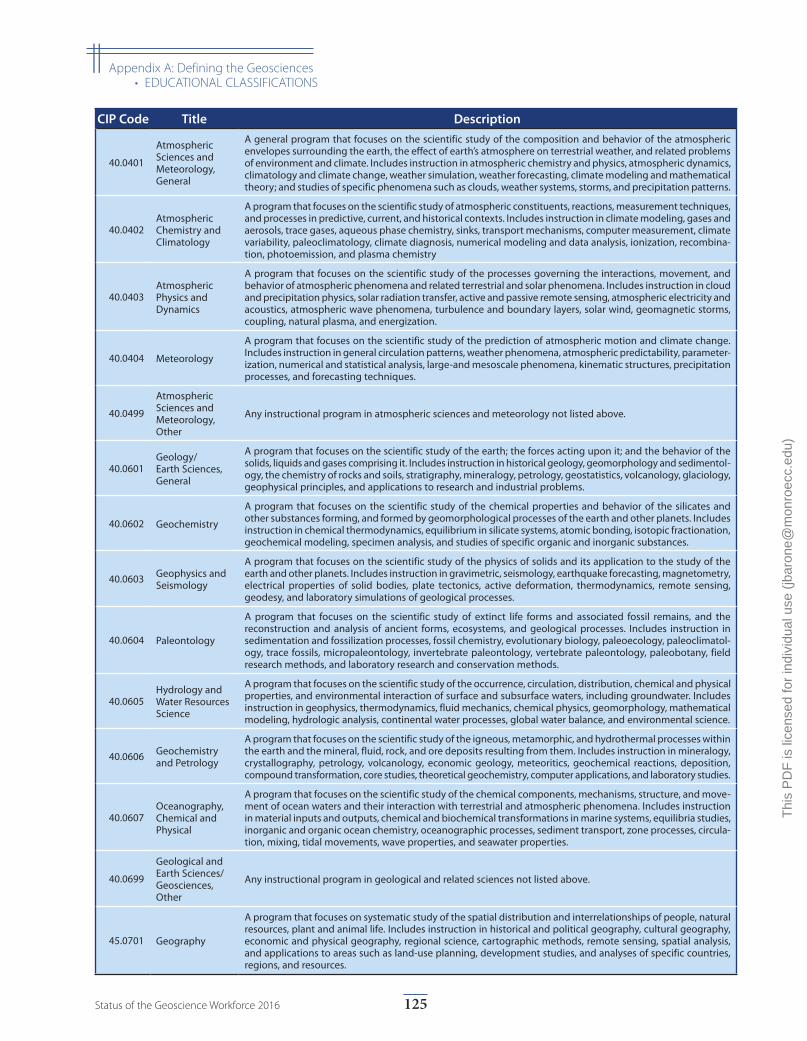
CIP Code Title Description
40.0401
Atmospheric Sciences and Meteorology, General
A general program that focuses on the scientific study of the composition and behavior of the atmospheric envelopes surrounding the earth, the effect of earth’s atmosphere on terrestrial weather, and related problems of environment and climate. Includes instruction in atmospheric chemistry and physics, atmospheric dynamics, climatology and climate change, weather simulation, weather forecasting, climate modeling and mathematical theory; and studies of specific phenomena such as clouds, weather systems, storms, and precipitation patterns.
40.0402Atmospheric Chemistry and Climatology
A program that focuses on the scientific study of atmospheric constituents, reactions, measurement techniques, and processes in predictive, current, and historical contexts. Includes instruction in climate modeling, gases and aerosols, trace gases, aqueous phase chemistry, sinks, transport mechanisms, computer measurement, climate variability, paleoclimatology, climate diagnosis, numerical modeling and data analysis, ionization, recombina-tion, photoemission, and plasma chemistry
40.0403Atmospheric Physics and Dynamics
A program that focuses on the scientific study of the processes governing the interactions, movement, and behavior of atmospheric phenomena and related terrestrial and solar phenomena. Includes instruction in cloud and precipitation physics, solar radiation transfer, active and passive remote sensing, atmospheric electricity and acoustics, atmospheric wave phenomena, turbulence and boundary layers, solar wind, geomagnetic storms, coupling, natural plasma, and energization.
40.0404 Meteorology
A program that focuses on the scientific study of the prediction of atmospheric motion and climate change. Includes instruction in general circulation patterns, weather phenomena, atmospheric predictability, parameter-ization, numerical and statistical analysis, large-and mesoscale phenomena, kinematic structures, precipitation processes, and forecasting techniques.
40.0499
Atmospheric Sciences and Meteorology, Other
Any instructional program in atmospheric sciences and meteorology not listed above.
40.0601Geology/Earth Sciences, General
A program that focuses on the scientific study of the earth; the forces acting upon it; and the behavior of the solids, liquids and gases comprising it. Includes instruction in historical geology, geomorphology and sedimentol-ogy, the chemistry of rocks and soils, stratigraphy, mineralogy, petrology, geostatistics, volcanology, glaciology, geophysical principles, and applications to research and industrial problems.
40.0602 Geochemistry
A program that focuses on the scientific study of the chemical properties and behavior of the silicates and other substances forming, and formed by geomorphological processes of the earth and other planets. Includes instruction in chemical thermodynamics, equilibrium in silicate systems, atomic bonding, isotopic fractionation, geochemical modeling, specimen analysis, and studies of specific organic and inorganic substances.
40.0603 Geophysics and Seismology
A program that focuses on the scientific study of the physics of solids and its application to the study of the earth and other planets. Includes instruction in gravimetric, seismology, earthquake forecasting, magnetometry, electrical properties of solid bodies, plate tectonics, active deformation, thermodynamics, remote sensing, geodesy, and laboratory simulations of geological processes.
40.0604 Paleontology
A program that focuses on the scientific study of extinct life forms and associated fossil remains, and the reconstruction and analysis of ancient forms, ecosystems, and geological processes. Includes instruction in sedimentation and fossilization processes, fossil chemistry, evolutionary biology, paleoecology, paleoclimatol-ogy, trace fossils, micropaleontology, invertebrate paleontology, vertebrate paleontology, paleobotany, field research methods, and laboratory research and conservation methods.
40.0605Hydrology and Water Resources Science
A program that focuses on the scientific study of the occurrence, circulation, distribution, chemical and physical properties, and environmental interaction of surface and subsurface waters, including groundwater. Includes instruction in geophysics, thermodynamics, fluid mechanics, chemical physics, geomorphology, mathematical modeling, hydrologic analysis, continental water processes, global water balance, and environmental science.
40.0606 Geochemistry and Petrology
A program that focuses on the scientific study of the igneous, metamorphic, and hydrothermal processes within the earth and the mineral, fluid, rock, and ore deposits resulting from them. Includes instruction in mineralogy, crystallography, petrology, volcanology, economic geology, meteoritics, geochemical reactions, deposition, compound transformation, core studies, theoretical geochemistry, computer applications, and laboratory studies.
40.0607Oceanography, Chemical and Physical
A program that focuses on the scientific study of the chemical components, mechanisms, structure, and move-ment of ocean waters and their interaction with terrestrial and atmospheric phenomena. Includes instruction in material inputs and outputs, chemical and biochemical transformations in marine systems, equilibria studies, inorganic and organic ocean chemistry, oceanographic processes, sediment transport, zone processes, circula-tion, mixing, tidal movements, wave properties, and seawater properties.
40.0699
Geological and Earth Sciences/Geosciences, Other
Any instructional program in geological and related sciences not listed above.
45.0701 Geography
A program that focuses on systematic study of the spatial distribution and interrelationships of people, natural resources, plant and animal life. Includes instruction in historical and political geography, cultural geography, economic and physical geography, regional science, cartographic methods, remote sensing, spatial analysis, and applications to areas such as land-use planning, development studies, and analyses of specific countries, regions, and resources.
125Status of the Geoscience Workforce 2016
|| Appendix A: Defining the Geosciences• EDUCATIONAL CLASSIFICATIONS
Thi
s P
DF
is li
cens
ed fo
r in
divi
dual
use
(jb
aron
e@m
onro
ecc.
edu)
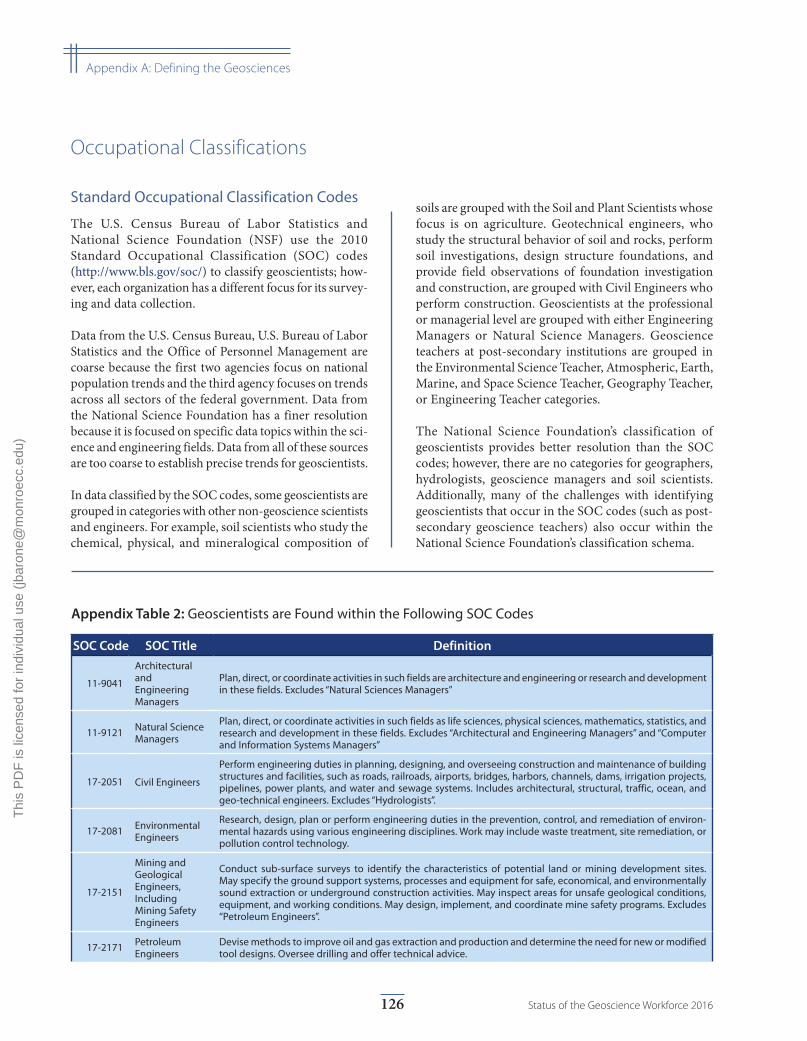
Appendix Table 2: Geoscientists are Found within the Following SOC Codes
SOC Code SOC Title Definition
11-9041
Architectural and Engineering Managers
Plan, direct, or coordinate activities in such fields are architecture and engineering or research and development in these fields. Excludes “Natural Sciences Managers”
11-9121 Natural Science Managers
Plan, direct, or coordinate activities in such fields as life sciences, physical sciences, mathematics, statistics, and research and development in these fields. Excludes “Architectural and Engineering Managers” and “Computer and Information Systems Managers”
17-2051 Civil Engineers
Perform engineering duties in planning, designing, and overseeing construction and maintenance of building structures and facilities, such as roads, railroads, airports, bridges, harbors, channels, dams, irrigation projects, pipelines, power plants, and water and sewage systems. Includes architectural, structural, traffic, ocean, and geo-technical engineers. Excludes “Hydrologists”.
17-2081 Environmental Engineers
Research, design, plan or perform engineering duties in the prevention, control, and remediation of environ-mental hazards using various engineering disciplines. Work may include waste treatment, site remediation, or pollution control technology.
17-2151
Mining and Geological Engineers, Including Mining Safety Engineers
Conduct sub-surface surveys to identify the characteristics of potential land or mining development sites. May specify the ground support systems, processes and equipment for safe, economical, and environmentally sound extraction or underground construction activities. May inspect areas for unsafe geological conditions, equipment, and working conditions. May design, implement, and coordinate mine safety programs. Excludes “Petroleum Engineers”.
17-2171 Petroleum Engineers
Devise methods to improve oil and gas extraction and production and determine the need for new or modified tool designs. Oversee drilling and offer technical advice.
Occupational Classifications
Standard Occupational Classification Codes
The U.S. Census Bureau of Labor Statistics and National Science Foundation (NSF) use the 2010 Standard Occupational Classification (SOC) codes (http://www.bls.gov/soc/) to classify geoscientists; how-ever, each organization has a different focus for its survey-ing and data collection.
Data from the U.S. Census Bureau, U.S. Bureau of Labor Statistics and the Office of Personnel Management are coarse because the first two agencies focus on national population trends and the third agency focuses on trends across all sectors of the federal government. Data from the National Science Foundation has a finer resolution because it is focused on specific data topics within the sci-ence and engineering fields. Data from all of these sources are too coarse to establish precise trends for geoscientists.
In data classified by the SOC codes, some geoscientists are grouped in categories with other non-geoscience scientists and engineers. For example, soil scientists who study the chemical, physical, and mineralogical composition of
soils are grouped with the Soil and Plant Scientists whose focus is on agriculture. Geotechnical engineers, who study the structural behavior of soil and rocks, perform soil investigations, design structure foundations, and provide field observations of foundation investigation and construction, are grouped with Civil Engineers who perform construction. Geoscientists at the professional or managerial level are grouped with either Engineering Managers or Natural Science Managers. Geoscience teachers at post-secondary institutions are grouped in the Environmental Science Teacher, Atmospheric, Earth, Marine, and Space Science Teacher, Geography Teacher, or Engineering Teacher categories.
The National Science Foundation’s classification of geoscientists provides better resolution than the SOC codes; however, there are no categories for geographers, hydrologists, geoscience managers and soil scientists. Additionally, many of the challenges with identifying geoscientists that occur in the SOC codes (such as post-secondary geoscience teachers) also occur within the National Science Foundation’s classification schema.
126 Status of the Geoscience Workforce 2016
|| Appendix A: Defining the Geosciences
Thi
s P
DF
is li
cens
ed fo
r in
divi
dual
use
(jb
aron
e@m
onro
ecc.
edu)
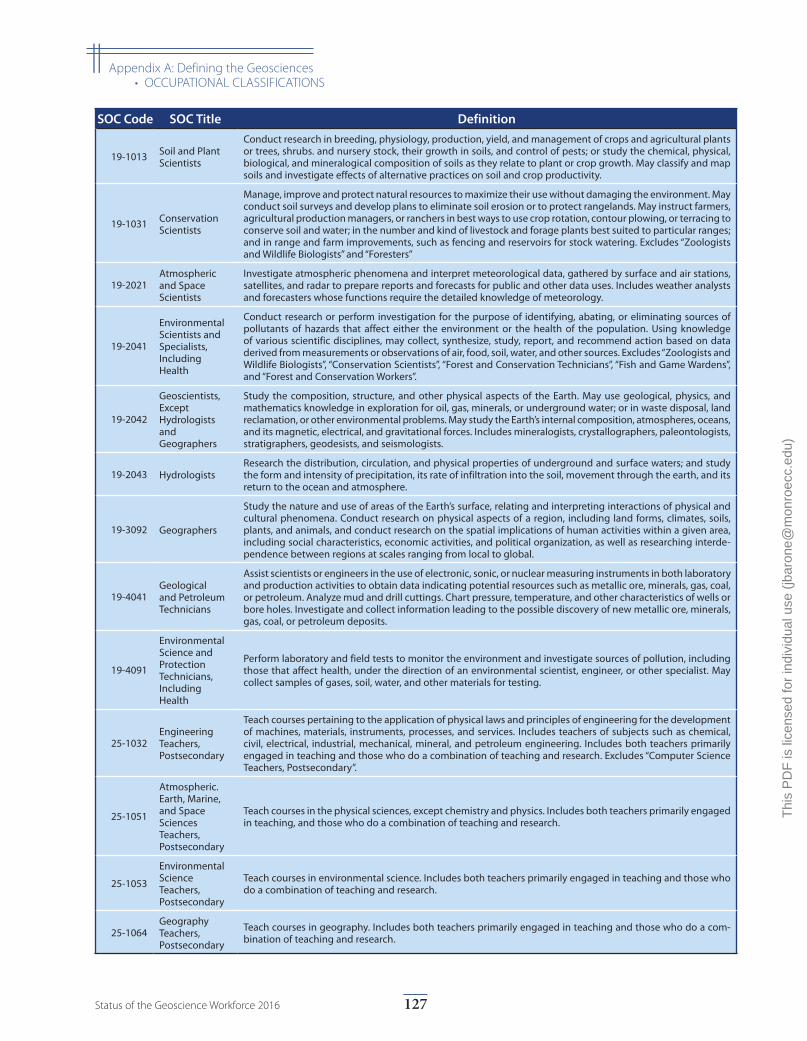
SOC Code SOC Title Definition
19-1013 Soil and Plant Scientists
Conduct research in breeding, physiology, production, yield, and management of crops and agricultural plants or trees, shrubs. and nursery stock, their growth in soils, and control of pests; or study the chemical, physical, biological, and mineralogical composition of soils as they relate to plant or crop growth. May classify and map soils and investigate effects of alternative practices on soil and crop productivity.
19-1031 Conservation Scientists
Manage, improve and protect natural resources to maximize their use without damaging the environment. May conduct soil surveys and develop plans to eliminate soil erosion or to protect rangelands. May instruct farmers, agricultural production managers, or ranchers in best ways to use crop rotation, contour plowing, or terracing to conserve soil and water; in the number and kind of livestock and forage plants best suited to particular ranges; and in range and farm improvements, such as fencing and reservoirs for stock watering. Excludes “Zoologists and Wildlife Biologists” and “Foresters”
19-2021Atmospheric and Space Scientists
Investigate atmospheric phenomena and interpret meteorological data, gathered by surface and air stations, satellites, and radar to prepare reports and forecasts for public and other data uses. Includes weather analysts and forecasters whose functions require the detailed knowledge of meteorology.
19-2041
Environmental Scientists and Specialists, Including Health
Conduct research or perform investigation for the purpose of identifying, abating, or eliminating sources of pollutants of hazards that affect either the environment or the health of the population. Using knowledge of various scientific disciplines, may collect, synthesize, study, report, and recommend action based on data derived from measurements or observations of air, food, soil, water, and other sources. Excludes “Zoologists and Wildlife Biologists”, “Conservation Scientists”, “Forest and Conservation Technicians”, “Fish and Game Wardens”, and “Forest and Conservation Workers”.
19-2042
Geoscientists, Except Hydrologists and Geographers
Study the composition, structure, and other physical aspects of the Earth. May use geological, physics, and mathematics knowledge in exploration for oil, gas, minerals, or underground water; or in waste disposal, land reclamation, or other environmental problems. May study the Earth’s internal composition, atmospheres, oceans, and its magnetic, electrical, and gravitational forces. Includes mineralogists, crystallographers, paleontologists, stratigraphers, geodesists, and seismologists.
19-2043 HydrologistsResearch the distribution, circulation, and physical properties of underground and surface waters; and study the form and intensity of precipitation, its rate of infiltration into the soil, movement through the earth, and its return to the ocean and atmosphere.
19-3092 Geographers
Study the nature and use of areas of the Earth’s surface, relating and interpreting interactions of physical and cultural phenomena. Conduct research on physical aspects of a region, including land forms, climates, soils, plants, and animals, and conduct research on the spatial implications of human activities within a given area, including social characteristics, economic activities, and political organization, as well as researching interde-pendence between regions at scales ranging from local to global.
19-4041Geological and Petroleum Technicians
Assist scientists or engineers in the use of electronic, sonic, or nuclear measuring instruments in both laboratory and production activities to obtain data indicating potential resources such as metallic ore, minerals, gas, coal, or petroleum. Analyze mud and drill cuttings. Chart pressure, temperature, and other characteristics of wells or bore holes. Investigate and collect information leading to the possible discovery of new metallic ore, minerals, gas, coal, or petroleum deposits.
19-4091
Environmental Science and Protection Technicians, Including Health
Perform laboratory and field tests to monitor the environment and investigate sources of pollution, including those that affect health, under the direction of an environmental scientist, engineer, or other specialist. May collect samples of gases, soil, water, and other materials for testing.
25-1032Engineering Teachers, Postsecondary
Teach courses pertaining to the application of physical laws and principles of engineering for the development of machines, materials, instruments, processes, and services. Includes teachers of subjects such as chemical, civil, electrical, industrial, mechanical, mineral, and petroleum engineering. Includes both teachers primarily engaged in teaching and those who do a combination of teaching and research. Excludes “Computer Science Teachers, Postsecondary”.
25-1051
Atmospheric. Earth, Marine, and Space Sciences Teachers, Postsecondary
Teach courses in the physical sciences, except chemistry and physics. Includes both teachers primarily engaged in teaching, and those who do a combination of teaching and research.
25-1053
Environmental Science Teachers, Postsecondary
Teach courses in environmental science. Includes both teachers primarily engaged in teaching and those who do a combination of teaching and research.
25-1064Geography Teachers, Postsecondary
Teach courses in geography. Includes both teachers primarily engaged in teaching and those who do a com-bination of teaching and research.
127Status of the Geoscience Workforce 2016
|| Appendix A: Defining the Geosciences• OCCUPATIONAL CLASSIFICATIONS
Thi
s P
DF
is li
cens
ed fo
r in
divi
dual
use
(jb
aron
e@m
onro
ecc.
edu)
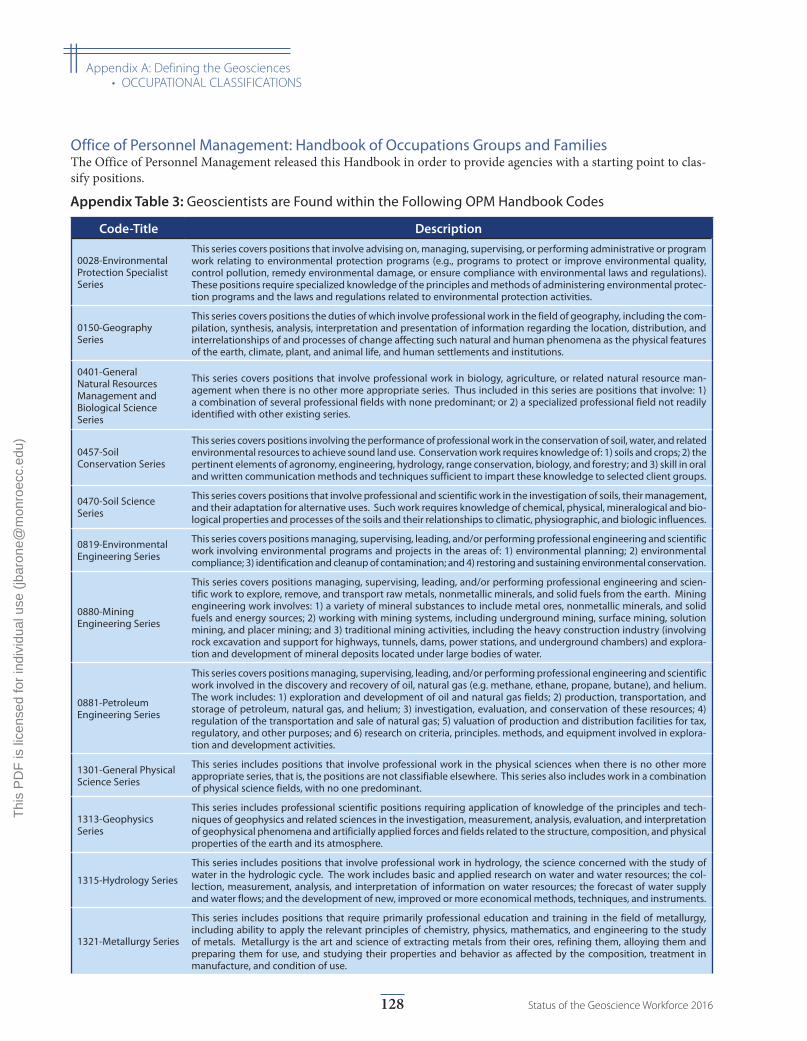
Appendix Table 3: Geoscientists are Found within the Following OPM Handbook Codes
Code-Title Description
0028-Environmental Protection Specialist Series
This series covers positions that involve advising on, managing, supervising, or performing administrative or program work relating to environmental protection programs (e.g., programs to protect or improve environmental quality, control pollution, remedy environmental damage, or ensure compliance with environmental laws and regulations). These positions require specialized knowledge of the principles and methods of administering environmental protec-tion programs and the laws and regulations related to environmental protection activities.
0150-Geography Series
This series covers positions the duties of which involve professional work in the field of geography, including the com-pilation, synthesis, analysis, interpretation and presentation of information regarding the location, distribution, and interrelationships of and processes of change affecting such natural and human phenomena as the physical features of the earth, climate, plant, and animal life, and human settlements and institutions.
0401-General Natural Resources Management and Biological Science Series
This series covers positions that involve professional work in biology, agriculture, or related natural resource man-agement when there is no other more appropriate series. Thus included in this series are positions that involve: 1) a combination of several professional fields with none predominant; or 2) a specialized professional field not readily identified with other existing series.
0457-Soil Conservation Series
This series covers positions involving the performance of professional work in the conservation of soil, water, and related environmental resources to achieve sound land use. Conservation work requires knowledge of: 1) soils and crops; 2) the pertinent elements of agronomy, engineering, hydrology, range conservation, biology, and forestry; and 3) skill in oral and written communication methods and techniques sufficient to impart these knowledge to selected client groups.
0470-Soil Science Series
This series covers positions that involve professional and scientific work in the investigation of soils, their management, and their adaptation for alternative uses. Such work requires knowledge of chemical, physical, mineralogical and bio-logical properties and processes of the soils and their relationships to climatic, physiographic, and biologic influences.
0819-Environmental Engineering Series
This series covers positions managing, supervising, leading, and/or performing professional engineering and scientific work involving environmental programs and projects in the areas of: 1) environmental planning; 2) environmental compliance; 3) identification and cleanup of contamination; and 4) restoring and sustaining environmental conservation.
0880-Mining Engineering Series
This series covers positions managing, supervising, leading, and/or performing professional engineering and scien-tific work to explore, remove, and transport raw metals, nonmetallic minerals, and solid fuels from the earth. Mining engineering work involves: 1) a variety of mineral substances to include metal ores, nonmetallic minerals, and solid fuels and energy sources; 2) working with mining systems, including underground mining, surface mining, solution mining, and placer mining; and 3) traditional mining activities, including the heavy construction industry (involving rock excavation and support for highways, tunnels, dams, power stations, and underground chambers) and explora-tion and development of mineral deposits located under large bodies of water.
0881-Petroleum Engineering Series
This series covers positions managing, supervising, leading, and/or performing professional engineering and scientific work involved in the discovery and recovery of oil, natural gas (e.g. methane, ethane, propane, butane), and helium. The work includes: 1) exploration and development of oil and natural gas fields; 2) production, transportation, and storage of petroleum, natural gas, and helium; 3) investigation, evaluation, and conservation of these resources; 4) regulation of the transportation and sale of natural gas; 5) valuation of production and distribution facilities for tax, regulatory, and other purposes; and 6) research on criteria, principles. methods, and equipment involved in explora-tion and development activities.
1301-General Physical Science Series
This series includes positions that involve professional work in the physical sciences when there is no other more appropriate series, that is, the positions are not classifiable elsewhere. This series also includes work in a combination of physical science fields, with no one predominant.
1313-Geophysics Series
This series includes professional scientific positions requiring application of knowledge of the principles and tech-niques of geophysics and related sciences in the investigation, measurement, analysis, evaluation, and interpretation of geophysical phenomena and artificially applied forces and fields related to the structure, composition, and physical properties of the earth and its atmosphere.
1315-Hydrology Series
This series includes positions that involve professional work in hydrology, the science concerned with the study of water in the hydrologic cycle. The work includes basic and applied research on water and water resources; the col-lection, measurement, analysis, and interpretation of information on water resources; the forecast of water supply and water flows; and the development of new, improved or more economical methods, techniques, and instruments.
1321-Metallurgy Series
This series includes positions that require primarily professional education and training in the field of metallurgy, including ability to apply the relevant principles of chemistry, physics, mathematics, and engineering to the study of metals. Metallurgy is the art and science of extracting metals from their ores, refining them, alloying them and preparing them for use, and studying their properties and behavior as affected by the composition, treatment in manufacture, and condition of use.
Office of Personnel Management: Handbook of Occupations Groups and FamiliesThe Office of Personnel Management released this Handbook in order to provide agencies with a starting point to clas-sify positions.
128 Status of the Geoscience Workforce 2016
|| Appendix A: Defining the Geosciences• OCCUPATIONAL CLASSIFICATIONS
Thi
s P
DF
is li
cens
ed fo
r in
divi
dual
use
(jb
aron
e@m
onro
ecc.
edu)
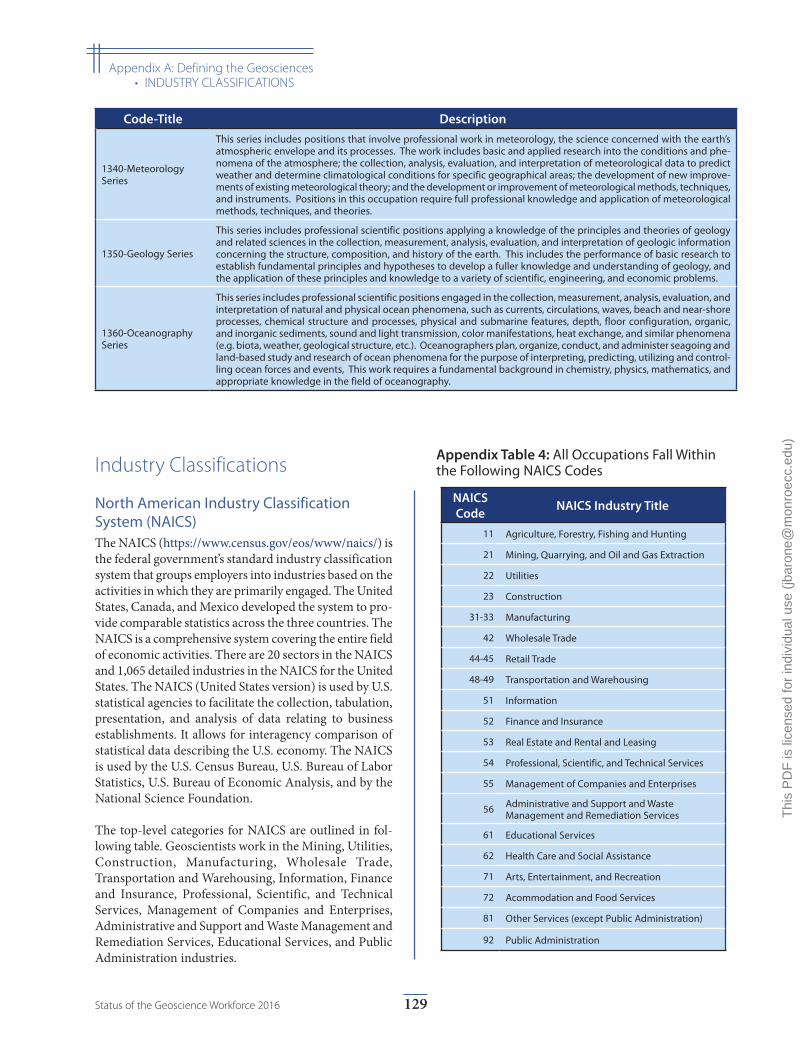
NAICS Code NAICS Industry Title
11 Agriculture, Forestry, Fishing and Hunting
21 Mining, Quarrying, and Oil and Gas Extraction
22 Utilities
23 Construction
31-33 Manufacturing
42 Wholesale Trade
44-45 Retail Trade
48-49 Transportation and Warehousing
51 Information
52 Finance and Insurance
53 Real Estate and Rental and Leasing
54 Professional, Scientific, and Technical Services
55 Management of Companies and Enterprises
56 Administrative and Support and Waste Management and Remediation Services
61 Educational Services
62 Health Care and Social Assistance
71 Arts, Entertainment, and Recreation
72 Acommodation and Food Services
81 Other Services (except Public Administration)
92 Public Administration
Appendix Table 4: All Occupations Fall Within the Following NAICS CodesIndustry Classifications
North American Industry Classification System (NAICS)The NAICS (https://www.census.gov/eos/www/naics/) is the federal government’s standard industry classification system that groups employers into industries based on the activities in which they are primarily engaged. The United States, Canada, and Mexico developed the system to pro-vide comparable statistics across the three countries. The NAICS is a comprehensive system covering the entire field of economic activities. There are 20 sectors in the NAICS and 1,065 detailed industries in the NAICS for the United States. The NAICS (United States version) is used by U.S. statistical agencies to facilitate the collection, tabulation, presentation, and analysis of data relating to business establishments. It allows for interagency comparison of statistical data describing the U.S. economy. The NAICS is used by the U.S. Census Bureau, U.S. Bureau of Labor Statistics, U.S. Bureau of Economic Analysis, and by the National Science Foundation.
The top-level categories for NAICS are outlined in fol-lowing table. Geoscientists work in the Mining, Utilities, Construction, Manufacturing, Wholesale Trade, Transportation and Warehousing, Information, Finance and Insurance, Professional, Scientific, and Technical Services, Management of Companies and Enterprises, Administrative and Support and Waste Management and Remediation Services, Educational Services, and Public Administration industries.
Code-Title Description
1340-Meteorology Series
This series includes positions that involve professional work in meteorology, the science concerned with the earth’s atmospheric envelope and its processes. The work includes basic and applied research into the conditions and phe-nomena of the atmosphere; the collection, analysis, evaluation, and interpretation of meteorological data to predict weather and determine climatological conditions for specific geographical areas; the development of new improve-ments of existing meteorological theory; and the development or improvement of meteorological methods, techniques, and instruments. Positions in this occupation require full professional knowledge and application of meteorological methods, techniques, and theories.
1350-Geology Series
This series includes professional scientific positions applying a knowledge of the principles and theories of geology and related sciences in the collection, measurement, analysis, evaluation, and interpretation of geologic information concerning the structure, composition, and history of the earth. This includes the performance of basic research to establish fundamental principles and hypotheses to develop a fuller knowledge and understanding of geology, and the application of these principles and knowledge to a variety of scientific, engineering, and economic problems.
1360-Oceanography Series
This series includes professional scientific positions engaged in the collection, measurement, analysis, evaluation, and interpretation of natural and physical ocean phenomena, such as currents, circulations, waves, beach and near-shore processes, chemical structure and processes, physical and submarine features, depth, floor configuration, organic, and inorganic sediments, sound and light transmission, color manifestations, heat exchange, and similar phenomena (e.g. biota, weather, geological structure, etc.). Oceanographers plan, organize, conduct, and administer seagoing and land-based study and research of ocean phenomena for the purpose of interpreting, predicting, utilizing and control-ling ocean forces and events, This work requires a fundamental background in chemistry, physics, mathematics, and appropriate knowledge in the field of oceanography.
129Status of the Geoscience Workforce 2016
|| Appendix A: Defining the Geosciences• INDUSTRY CLASSIFICATIONS
Thi
s P
DF
is li
cens
ed fo
r in
divi
dual
use
(jb
aron
e@m
onro
ecc.
edu)
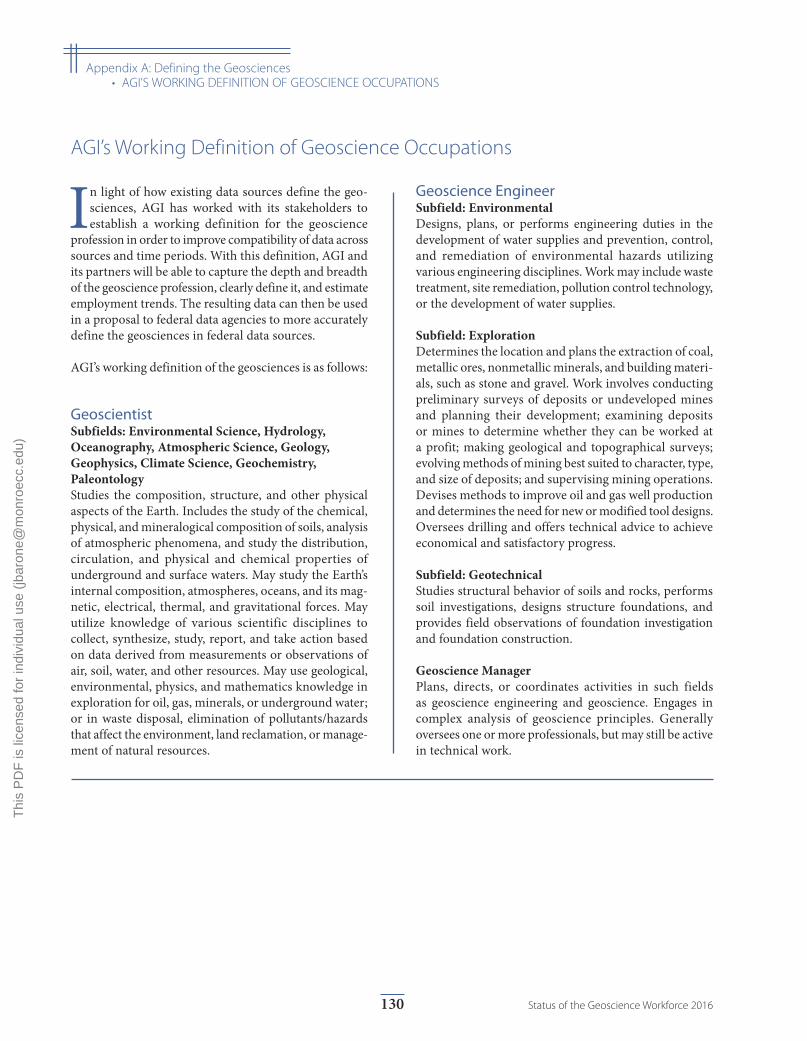
AGI’s Working Definition of Geoscience Occupations
In light of how existing data sources define the geo-sciences, AGI has worked with its stakeholders to establish a working definition for the geoscience
profession in order to improve compatibility of data across sources and time periods. With this definition, AGI and its partners will be able to capture the depth and breadth of the geoscience profession, clearly define it, and estimate employment trends. The resulting data can then be used in a proposal to federal data agencies to more accurately define the geosciences in federal data sources.
AGI’s working definition of the geosciences is as follows:
GeoscientistSubfields: Environmental Science, Hydrology, Oceanography, Atmospheric Science, Geology, Geophysics, Climate Science, Geochemistry, PaleontologyStudies the composition, structure, and other physical aspects of the Earth. Includes the study of the chemical, physical, and mineralogical composition of soils, analysis of atmospheric phenomena, and study the distribution, circulation, and physical and chemical properties of underground and surface waters. May study the Earth’s internal composition, atmospheres, oceans, and its mag-netic, electrical, thermal, and gravitational forces. May utilize knowledge of various scientific disciplines to collect, synthesize, study, report, and take action based on data derived from measurements or observations of air, soil, water, and other resources. May use geological, environmental, physics, and mathematics knowledge in exploration for oil, gas, minerals, or underground water; or in waste disposal, elimination of pollutants/hazards that affect the environment, land reclamation, or manage-ment of natural resources.
Geoscience EngineerSubfield: EnvironmentalDesigns, plans, or performs engineering duties in the development of water supplies and prevention, control, and remediation of environmental hazards utilizing various engineering disciplines. Work may include waste treatment, site remediation, pollution control technology, or the development of water supplies.
Subfield: ExplorationDetermines the location and plans the extraction of coal, metallic ores, nonmetallic minerals, and building materi-als, such as stone and gravel. Work involves conducting preliminary surveys of deposits or undeveloped mines and planning their development; examining deposits or mines to determine whether they can be worked at a profit; making geological and topographical surveys; evolving methods of mining best suited to character, type, and size of deposits; and supervising mining operations. Devises methods to improve oil and gas well production and determines the need for new or modified tool designs. Oversees drilling and offers technical advice to achieve economical and satisfactory progress.
Subfield: GeotechnicalStudies structural behavior of soils and rocks, performs soil investigations, designs structure foundations, and provides field observations of foundation investigation and foundation construction.
Geoscience ManagerPlans, directs, or coordinates activities in such fields as geoscience engineering and geoscience. Engages in complex analysis of geoscience principles. Generally oversees one or more professionals, but may still be active in technical work.
130 Status of the Geoscience Workforce 2016
|| Appendix A: Defining the Geosciences• AGI’S WORKING DEFINITION OF GEOSCIENCE OCCUPATIONS
Thi
s P
DF
is li
cens
ed fo
r in
divi
dual
use
(jb
aron
e@m
onro
ecc.
edu)
Appendix B: Data Sources
AGI Data Sources:
GeoRefAGI’s GeoRef database contains over 4 million references to geoscience journal articles, books, maps, conference papers, reports and theses. GeoRef includes all geoscience publications that pertain only to surface and sub-surface processes. Publications pertaining to atmospheric and space sciences are excluded.
AGI’s Directory of Geoscience Departments DatabaseAGI’s Workforce Program has been collecting basic demographic information annually about all the geosci-ence programs at two-year and four-year institutions worldwide, along with other geoscience organizations and agencies for nearly 50 years, creating an extensive database. This database is used for the AGI publication, the Directory of Geoscience Departments, and for cur-rent data on the health of geoscience departments in the U.S. and abroad.
AGI’s Geoscience Student Exit SurveyAGI collects data from students graduating with their bachelor’s, master’s, and doctoral geoscience degrees in order to ascertain their educational background, degree information, co-curricular experiences, and immediate future plans after graduation. Some of the data are pre-sented within this report. For more information about this study and to see more of the most recent data, please visit http://www.americangeosciences.org/workforce/exit-survey.
Other Public Sources:
American Geophysical Union publications: http://agupubs.onlinelibrary.wiley.com/
American Meteorological Society publications: http://journals.ametsoc.org/
Association for the Sciences of Limnology and Oceanography publication: http://www.aslo.org/lo/toc/index.html
ACT: https://www.act.org/
Baker Hughes: http://www.bakerhughes.com/
College Board: https://www.collegeboard.org/
Energy Information Administration: http://www.eia.gov/
National Association of Geoscience Teachers publication: http://nagt.org/nagt/jge/index.html
National Science Foundation’s Budget Internet Information Systems: http://dellweb.bfa.nsf.gov/starth.asp
National Science Foundation’s National Center for Science and Engineering Statistics: http://www.nsf.gov/statistics/
U.S. Bureau of Economic Analysis: http://www.bea.gov/
U.S. Bureau of Labor Statistics: http://www.bls.gov
U.S. Census Bureau: https://www.census.gov/
U.S. Department of Education’s Integrated Postsecondary Education Database: http://nces.ed.gov/ipeds/
U.S. Department of Education’s National Center of Education Statistics: http://nces.ed.gov/
U.S. Geological Survey: http://www.usgs.gov
U.S. Government’s Open Data Site: http://www.data.gov/
U.S. Office of Personnel Management: http://www.opm.gov/
World Gold Council: http://www.gold.org/
131Status of the Geoscience Workforce 2016
Thi
s P
DF
is li
cens
ed fo
r in
divi
dual
use
(jb
aron
e@m
onro
ecc.
edu)
American Geosciences Institute4220 King Street, Alexandria, VA 22302-1507, U.S.A. phone: 703-379-2480; www.americangeosciences.org
AGI Geoscience Workforce Program www.americangeosciences.org/workforce
Thi
s P
DF
is li
cens
ed fo
r in
divi
dual
use
(jb
aron
e@m
onro
ecc.
edu)


