Steam Reforming Technology Demonstration for Conversion of Hanford LAW Tank Waste and LAW Recycle Waste into a Leach Resistant Alkali Aluminosilicate Waste Form - 9354
Vishal Vora, Arlin Olson, Brad Mason, Brent Evans, and Kevin Ryan
Department of Energy, EM-21, Forrestal Bldg., Washington D.C.
The views and opinions of the authors expressed herein do not necessarily state or reflect those of the United States Government or any agency thereof.
ABSTRACT
As part of the Advanced Remediation Technologies (ART) Program, the Department of Energy (DOE) chose to demonstrate the capabilities of the THOR® Steam Reforming process as a potential means to treat and prepare the Hanford Low Activity Waste (LAW) and Low Activity Waste Recycle (LAWR) waste steams for disposal.
The Hanford LAW and LAWR waste streams will contain listed and characteristic hazardous waste constituents as well as underlying hazardous constituents that, under federal and state regulations, preclude the wastes from land disposal without treatment. An Engineering Scale Technology Demonstration (ESTD) utilizing the mineralization flowsheet of the THOR® process was successfully completed in May 2008 at the Hazen Research facility in Golden, CO, using Hanford LAW and LAWR waste simulants. The Hanford LAW simulant composition was determined by DOE to represent the anticipated stream that would be processed by the Waste Treatment and Immobilization Plant (WTP) LAW melters. The Hanford LAWR stream is based on the anticipated combination of the submerged bed scrubber, the wet electrostatic precipitator, and the caustic scrubber effluents from the WTP LAW melter facility when it is operational.
The ESTD clearly demonstrated the capability of the THOR® steam reforming process to reliably convert the LAW and LAWR simulants into mineralized solid products in a safe and efficient manner. Gaseous emissions were found to be within regulatory limits for both LAW and LAWR, with the exception of a 1 microgram/dscm exceedence for low volatile metals. The leach performance of the THOR® process granular product was superior to the Environmental Assessment (EA) and LAW glass standards for sodium and silicon. Normalized release rates for rhenium (used as a surrogate for technetium) and cesium were much less than that of sodium in the EA and LAW glass standards. Based on data from manual off-gas sampling intervals, cesium and rhenium were captured in the mineralized product with system removal efficiencies of 99.999% and 99.998% respectively. The overall product retention for iodine from the LAW simulant was greater than 94%.
Upon completion of ESTD testing, the production of final monolith products from the mineralized LAW and LAWR products are being demonstrated on a laboratory scale. Work is still pending to show that these products meet all Hanford Integrated Disposal Facility (IDF) waste acceptance criteria.
INTRODUCTION
The THOR® process has been shown in previous test programs to effectively convert several types of liquid radioactive waste simulants into solid products. That product may be a water-soluble carbonate matrix or an insoluble mineralized matrix, depending on the process additives used. As part of the Advanced Remediation Technologies (ART) program, the Department of Energy chose to demonstrate the capabilities of the THOR® process as a potential means to treat and prepare the Hanford LAW and LAW Recycle (LAWR) wastes for disposal at the Integrated Disposal Facility (IDF).
Numerous pilot plant and engineering scale tests have been conducted over the last several years that have shown the THOR® process technology capable of processing high nitrate, liquid waste simulants into a solid waste form. An engineering scale test for treating Hanford LAW using the THOR® process technology was first performed in 2004 at the DOE’s Science and Technology Research Center (STAR) facility under direction of the Idaho National Engineering and Environmental Laboratory [1].
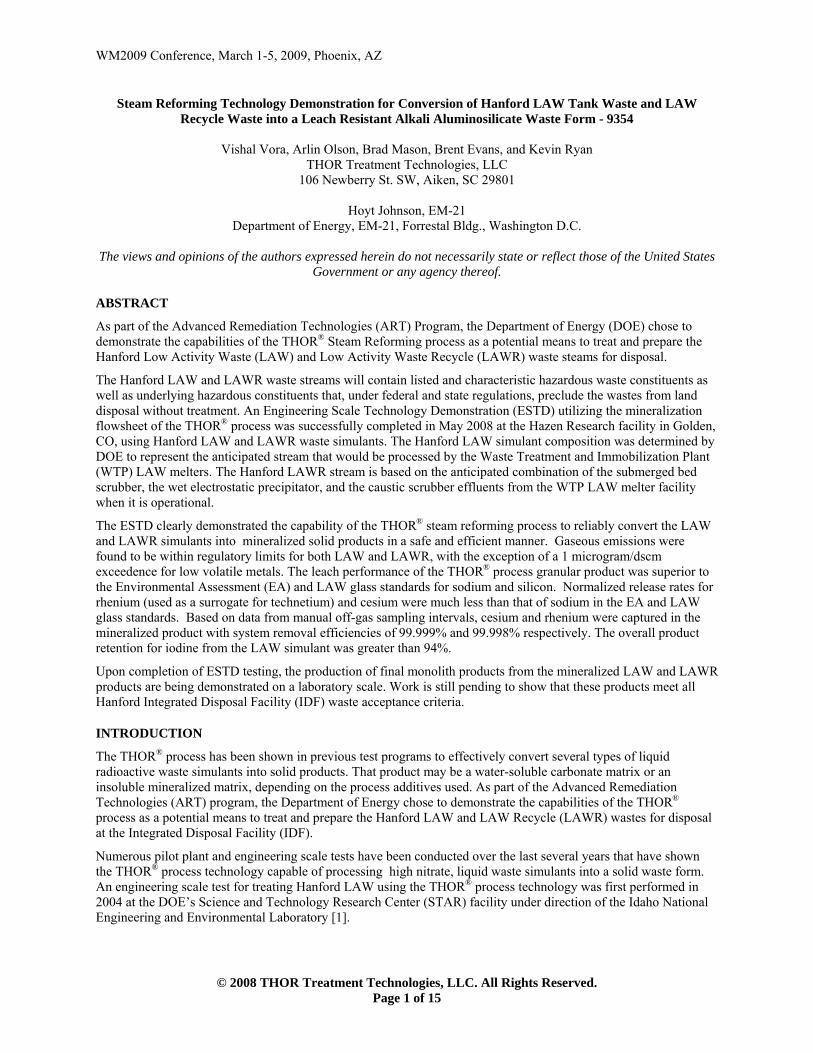
Following the successful completion of the STAR center pilot scale test program the Engineering Scale Technology Demonstration (ESTD) unit was built and operated at the Hazen Research facility to demonstrate the integrated THOR® process and gather necessary technical data for the design and construction of full-scale process systems. The ESTD is an engineering scale system that includes all unit operations present in a full-scale unit except the final product packaging equipment. The process flow diagram for the ESTD is shown in Figure 1. This paper provides a summary of the ESTD pilot plant work that was completed in 2008 to demonstrate the production of leach-resistant alkali aluminosilicate waste forms from Hanford LAW and LAWR simulants.
THOR® MINERALIZING PROCESS OVERVIEW
The THOR® mineralizing steam reforming process destroys nitrates, nitrites, and organic materials present in the waste feed and produces a dry, leach-resistant alkali aluminosilicate mineral product containing the radionuclides, alkali metals, sulfates, halides, and non-volatile heavy metals present in the ART feed [1,2,3,4,5,6,7,8 and 9]. The process converts nitrates and nitrites directly to nitrogen gas. Any organic material is converted to carbon dioxide and water vapor in the steam reformers by a combination of steam reforming and oxidizing reactions. The THOR® mineralizing process flow diagram for treatment of Hanford LAW and LAW Recycle is provided in Figure 1.
The LAW feed, slurried with an aluminosilicate clay, is introduced into the first steam reformer, the Denitration and Mineralization Reformer (DMR). The bed particles in the steam reformer are fluidized by introduction of near ambient pressure superheated steam. In the DMR, liquids are evaporated; the vast majority of organics, nitrates and nitrites are destroyed; and the reactive chemicals in the waste feed are converted into a granular mineralized waste product. The second reformer, the Carbon Reduction Reformer (CRR), serves to further reduce any NOX gases from the first reformer and oxidize residual organics to carbon dioxide and water vapor. The gases (mainly carbon dioxide, nitrogen, and water vapor) from the process are filtered through high-efficiency sintered metal filters, HEPA filters, and a mercury adsorber. They are then vented to the atmosphere through a monitored stack. The THOR® final waste product, an alkali aluninosilicate, exhibits leach resistant characteristics equal to or better than EA glass, as indicated by PCT and TCLP analyses
PROCESS CHEMISTRY
The DMR waste feed is atomized into a fluidized bed consisting of granular mineral solids at 943 K to 1,073 K (670 °C to 800 °C). This bed is fluidized with near ambient pressure superheated steam and a small amount of oxygen. The feed droplets coat the bed particles and are instantly dried. The large active surface of dried nitrates readily reacts with hot carbon reductant particles, carbon monoxide and hydrogen gases, and the reduced metal and metal oxide particles in the fluidized bed. This reducing environment results in the near complete destruction of nitrates and nitrites, with only trace levels remaining in the solid product. These species are converted directly to nitrogen gas, with very low levels of NOX produced.
Several of the possible reaction mechanisms whereby nitrites and nitrates are converted to nitrogen gas are shown below:
NO3 + 2C → NO + 2CO (Eq 1) NO3 + C → NO2 + CO (Eq 2) 2NO3 + 4C → N2 + 2CO + 2CO2 (Eq 3)
Granular carbon is added directly to the DMR bed. A portion of this carbon oxidizes to produce necessary process energy. It also serves as the reductant which facilitates the above reactions. Carbon reacts with the fluidizing steam and water in the feed to produce H2 and CO via the water gas reaction:
C + H2O → CO + H2 (Eq 8)
The CO reacts further via the water gas shift reaction to produce additional H2:
CO + H2O → CO2 + H2 (Eq 9)
The non-volatile constituents in the waste feed are converted into highly leach resistant forms by reaction with the aluminosilicate clay additive. The mineral species formed are principally alkali aluminosilicates, also referred to as
feldspathoid mineral species. These contain unique cage-like structures that retain anions and radionuclides ionically bonded to the aluminosilicate structure and to sodium. These minerals also incorporate other ions elsewhere in their molecular structures. Examples of these minerals are nepheline, nosean, and sodalite, as shown below [10, 11]:
The granular solid products are removed from the DMR either at the bottom or as smaller particles elutriated with the process gas stream at the top of the unit.
Any organics in the DMR feed are initially volatized and steam reformed into carbon dioxide, carbon monoxide, hydrogen, and a small quantity of light hydrocarbons, with methane being the main constituent:
CxHy + xH2O → xCO + (x+y/2) H2 (Eq 13)
CxHy + (2x-y/2)H2 → xCH4 (Eq 14) CO + H2O → CO2 + H2 (Eq 15)
The process gases exiting the DMR consist mostly of steam, N2 (from process reactions, instrument purges, and fluidizing gases), CO, CO2, and 0.5% to 4% H2. There are also low levels of NOX, acid gases, and short chained organics.
The volatile hydrocarbons and the carbon monoxide and hydrogen gases generated in the DMR are further steam reformed in the lower portion of the second stage steam reformer, the Carbon Reduction Reformer (CRR), and then oxidized to carbon dioxide and water vapor by addition of oxygen to the fluidizing gases in the upper portion of the CRR:
CO + H2O → CO2 + H2 (Eq 16)
2CO + O2 → 2 CO2 (Eq 17) 2H2 + O2 → 2 H2O (Eq 18)
PILOT PLANT EQUIPMENT
The ESTD at Hazen Research incorporates all of the process unit operations of a production-scale facility into an integrated system. See Figure 1 for a simplified process flow diagram of the pilot plant. An overview description of the major equipment items is provided below.
Liquid Simulant Preparation and Feed System
The ART simulant feed is made-up using reagent chemicals in T-100. It is transferred in batches to one of the two T-101 Waste Feed Tanks. If applicable for a specific test, a heavy metals simulant is added to the Waste Feed Tanks. The ART simulant is metered into the DMR via a rotary lobe or progressing cavity feed pump and the flow rate is monitored by a magnetic type mass flow meter. The simulant is injected into the DMR by one of two specially designed atomizing feed nozzles.
While feeding LAW simulant, a principal organic hazardous constituent (POHC) is injected into the DMR feed line between the Waste Feed Tanks and the atomizing nozzles during selected LAW tests to determine the Destructive Removal Efficiency (DRE) of the POHC in the process. The POHC used for this process was benzene, conservatively chosen to represent the organics present in the actual LAW. No POHC was added while feeding LAWR simulant.
WM2009 Conference, March 1-5, 2009, Phoenix, AZ
Figure 1. Process flow diagram for the Pilot Plant LAW and LAWR Mineralizing Tests conducted at Hazen Research.
The DMR (T-200) is a fluidized bed vessel designed to operate in an autothermal steam reforming mode to evaporate water; reduce nitrates to nitrogen; volatilize and reform organics; convert alkali and alkaline earth metals into non-agglomerating solid products; and capture sulfur, fluoride, chloride, and phosphate compounds in the solid product. Non-volatile heavy metals, other metals, and the non-radioactive radionuclide surrogates (i.e. rhenium iodine, and cesium) were also captured in the solid product.
The bottom section for the DMR contained ports for the fluidizing nozzles, solids removal auger, and auxiliary FG nozzle. The DMR has a conical bottom equipped with a product removal auger. Just below the auger is a nitrogen jet used to transfer product material to the Product Receiver (PR). The bed media is fluidized with superheated steam via a distributor located near the bottom of the vessel. A mixture of oxygen and nitrogen is metered into the DMR bed via three injectors located above the superheated steam fluidizing gas distributor. ART surrogate is fed horizontally into the DMR through one of the two feed nozzles located several inches above the fluidizing gas distributor. Bed temperatures are monitored via several thermocouples inserted into the vessel above, below, and in the active bed region. Process pressures and differential pressures are monitored via nitrogen purged pressure taps located throughout the vessel. Granular carbon is fed to the DMR via a calibrated vibratory feeder and nitrogen impulsed “shot pot” that forces the carbon into the active bed region.
High Temperature Filter (HTF) and Product Receiver (PR)
The process gas from the DMR flows to the HTF. It captures any small sized DMR mineral product solids carried over in the process gas stream. The HTF is equipped with candlestick filters, made of either of sintered metal or silicon carbide. The filters are automatically back-pulsed with nitrogen during operation to remove built-up filter cake, based on the differential pressure across the filters.
The HTF was bypassed during the scoping runs but was on-line during the production runs. The solids that accumulated in the HTF were drained from the bottom of the vessel and transferred into a drum via an auger.
Product solids are removed from the bottom of the DMR by the auger and are pneumatically transferred to the PR via a nitrogen jet. The PR is fitted with four sintered metal candlestick filters similar to those used in the HTF. The off-gas from the PR is vented to the freeboard region of the DMR. Product solids are drained from the bottom of the PR into 19 liter (5 gallon) collection containers.
Carbon Reduction Reformer (CRR)
The process gases flow from the HTF to the fluidizing gas inlet distributors of the CRR located near the bottom of the vessel. The CRR is a refractory lined vessel. It has a conical bottom equipped with a valve through which bed material can be removed, although material is typically removed only at the end of an operating period, since solid product does not accumulate in the CRR bed. Oxygen diluted with nitrogen is injected into the CRR in the upper bed region The bed region between the inlet distributors and this oxygen injection level operates in a reducing mode to enhance overall process NOX destruction, while the bed region above operates in an oxidizing mode to convert residual CO, H2, and volatile hydrocarbons to CO2 and water. Higher in the CRR, additional oxygen is injected to control the process outlet gas oxygen concentration, which in turns keeps the process off-gas carbon monoxide concentration low. The CRR operates at approximately 1,223 K (950 °C). The CRR’s semi-permanent bed media is composed of alumina.
Ports are provided in the CRR vessel for introduction of autothermal gas (ATG), continuous injection of propylene glycol fuel, supplemental granular carbon fuel, or emergency water. Granular carbon is fed to the CRR via a calibrated vibratory feeder and nitrogen impulsed “shot pot” similar to those used for the DMR. Propylene glycol is fed by a metering pump.
Off-gas Cooler (OGC)
The process gas from the CRR passes through the OGC in a down flow direction. The OGC vessel is provided with an atomizing water sprayer at the top. The water spray quickly cools the hot process gases to
approximately 443 K to 463 K ( 170 °C to 190 °C). The off-gas from the OGC flows to the Off-Gas Filter.
Off-Gas Filter (OGF)
The off-gases exiting the OGC contain small quantities of particulate solids of attrited media elutriated from the CRR. The OGF removes the particulates from the off-gas stream. It is fitted with sixteen ceramic filter elements rated for at least 523 K ( 250 °C). An automated instrument air pulse-back manifold was provided to clean the filter elements with the filters on-line. A differential pressure instrument, with sensing ports in the vessel and in the off-gas line downstream of the vessel, is used to sense the pressure drop across the filters and automatically actuate the pulse-back function.
The OGF was provided with a product draining auger system during the scoping runs that cooled and purged the filtered solids and conveyed them into a drum located on a platform scale. It was provided with a system similar to that used for the PR during the production runs when the HTF was on-line.
Off-gas Blowers
Two Off-gas Blowers (OGBs) provided airflow and process vacuum for the DMR, HTF, CRR, and the downstream off-gas treatment equipment. The OGBs maintained all systems downstream of the CRR under negative pressure.
Process and System Off-gas Measurement
Process and system off-gas streams are continuously monitored at three locations. The first measurement point is just downstream of the HTF. Here the Continuous Process Monitoring System (CPMS) monitors the filtered DMR process gas stream for H2, O2, CO, CO2, total hydrocarbons (THC), NO, NO2, and total NOX. The H2 concentration is a key parameter for operational control of the DMR. It is used to control the carbon concentration in the DMR bed and hence the reducing environment in the DMR, which in turn is essential to NOx emission control. The second measurement point is just downstream of the CRR, where the O2 concentration in the process gas leaving the CRR is monitored. This is important to ensure that there is adequate O2 in this stream so that CO levels are low in the final off-gas. No other gas species are monitored at this point. The final measurement point is at the stack where the Continuous Emissions Monitoring System (CEMS) monitors for O2, CO, CO2, THC, NO, NO2, total NOX, and SO2.
In addition to the continuous monitoring, manual samples are obtained from ports in the stack. These samples are pulled by an independent subcontractor in accordance with formal EPA methods. Analytes of interest included volatile metals, low volatility metals (As and Cr), semi-volatile metals (Cd and Pb), radionuclide surrogates (Cs, I, and Re [for Tc]), HCl + Cl2, particulate matter, dioxins/furans, PCBs, volatile organic compounds (VOCs), semi-volatile organic compound (SVOCs), and total organics. The manual gas samples obtained were analyzed by another independent subcontractor in accordance with EPA methods.
Process Data Acquisition and Control System (DACS)
Process electronic data are obtained and process control is provided by the DACS. The DACS uses programmable automation controllers for control and data acquisition. The system architecture is a combination of LabVIEW software, FieldPoint controllers, and interface modules1. LabVIEW software is utilized to monitor and control process operation from human-machine interfaces running on personal computers in the control room. All of the key process parameters are automatically controlled by the DACS. These include the DMR and CRR temperatures, the DMR fluidizing gas flowrate, the DMR liquid feed rate, the carbon feed rates to the DMR and CRR, and the HTF and OGF filter blowback timers.
1 LabVIEW and FieldPoint are products of National Instruments, Inc.
Following construction of the pilot plant, basic checkout and functional tests were performed to verify safety and operability of the process equipment. When these tests were completed, a readiness review was conducted to verify the integrated pilot plant was ready for operation.
The pilot plant testing program consisted of three operational phases: (1) Scoping Tests, (2) LAW Production Tests, and (3) LAW Recycle Production Tests. The scoping tests were designed to demonstrate basic system operability and verify acceptable ranges for process operating parameters. The production tests were designed to demonstrate long-term operability of the integrated process, confirm process chemistry and mass balances, establish key operating parameters for the production-scale facility, obtain data to confirm design parameters, obtain product data to verify which constituents were captured in the final waste form, and gather off-gas emissions data to support the environmental permitting process.
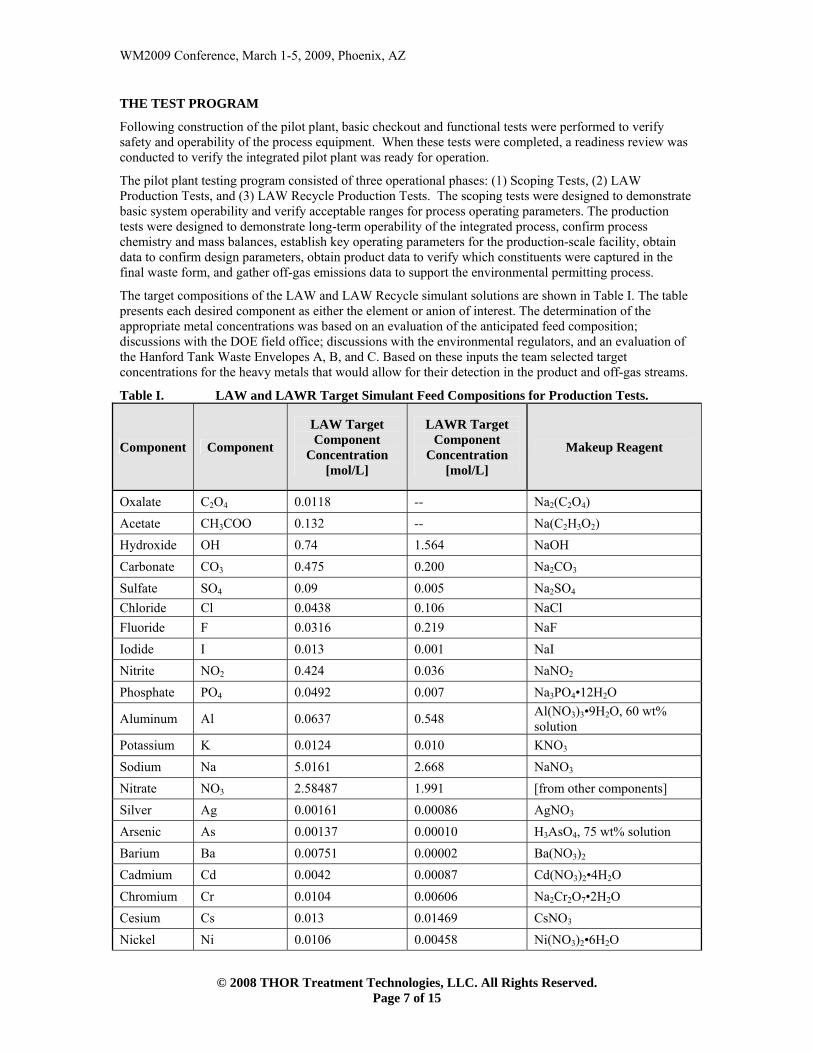
The target compositions of the LAW and LAW Recycle simulant solutions are shown in Table I. The table presents each desired component as either the element or anion of interest. The determination of the appropriate metal concentrations was based on an evaluation of the anticipated feed composition; discussions with the DOE field office; discussions with the environmental regulators, and an evaluation of the Hanford Tank Waste Envelopes A, B, and C. Based on these inputs the team selected target concentrations for the heavy metals that would allow for their detection in the product and off-gas streams.
Table I. LAW and LAWR Target Simulant Feed Compositions for Production Tests.
Component Component
LAW Target Component
Concentration [mol/L]
LAWR Target Component
Concentration [mol/L]
Makeup Reagent
Oxalate C2O4 0.0118 -- Na2(C2O4)
Acetate CH3COO 0.132 -- Na(C2H3O2)
Hydroxide OH 0.74 1.564 NaOH
Carbonate CO3 0.475 0.200 Na2CO3
Sulfate SO4 0.09 0.005 Na2SO4
Chloride Cl 0.0438 0.106 NaCl
Fluoride F 0.0316 0.219 NaF
Iodide I 0.013 0.001 NaI
Nitrite NO2 0.424 0.036 NaNO2
Phosphate PO4 0.0492 0.007 Na3PO4•12H2O
Aluminum Al 0.0637 0.548 Al(NO3)3•9H2O, 60 wt% solution
Potassium K 0.0124 0.010 KNO3
Sodium Na 5.0161 2.668 NaNO3
Nitrate NO3 2.58487 1.991 [from other components]
Silver Ag 0.00161 0.00086 AgNO3
Arsenic As 0.00137 0.00010 H3AsO4, 75 wt% solution
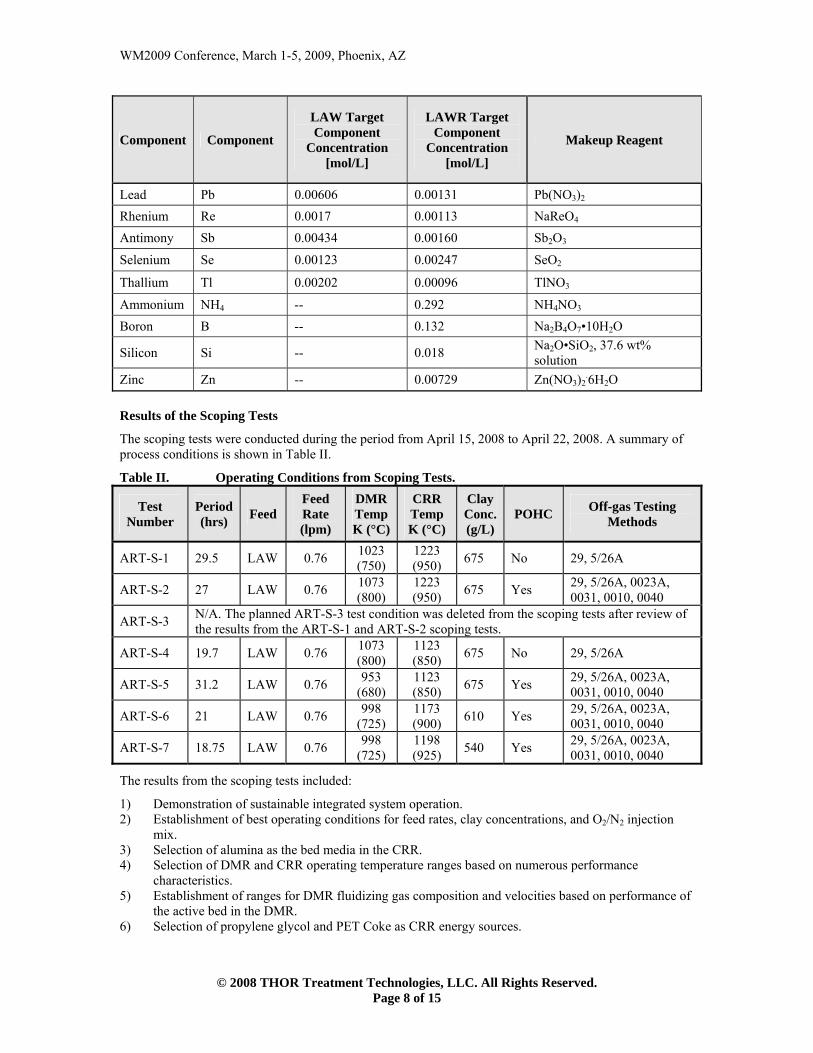
The scoping tests were conducted during the period from April 15, 2008 to April 22, 2008. A summary of process conditions is shown in Table II.
Table II. Operating Conditions from Scoping Tests.
Test Number
Period (hrs)
Feed Feed Rate (lpm)
DMR Temp K (°C)
CRR Temp K (°C)
Clay Conc. (g/L)
POHC Off-gas Testing
Methods
ART-S-1 29.5 LAW 0.76 1023 (750)
1223 (950)
675 No 29, 5/26A
ART-S-2 27 LAW 0.76 1073 (800)
1223 (950)
675 Yes 29, 5/26A, 0023A, 0031, 0010, 0040
ART-S-3 N/A. The planned ART-S-3 test condition was deleted from the scoping tests after review of the results from the ART-S-1 and ART-S-2 scoping tests.
ART-S-4 19.7 LAW 0.76 1073 (800)
1123 (850)
675 No 29, 5/26A
ART-S-5 31.2 LAW 0.76 953
(680) 1123 (850)
675 Yes 29, 5/26A, 0023A, 0031, 0010, 0040
ART-S-6 21 LAW 0.76 998
(725) 1173 (900)
610 Yes 29, 5/26A, 0023A, 0031, 0010, 0040
ART-S-7 18.75 LAW 0.76 998
(725) 1198 (925)
540 Yes 29, 5/26A, 0023A, 0031, 0010, 0040
The results from the scoping tests included:
1) Demonstration of sustainable integrated system operation. 2) Establishment of best operating conditions for feed rates, clay concentrations, and O2/N2 injection
mix. 3) Selection of alumina as the bed media in the CRR. 4) Selection of DMR and CRR operating temperature ranges based on numerous performance
characteristics. 5) Establishment of ranges for DMR fluidizing gas composition and velocities based on performance of
the active bed in the DMR. 6) Selection of propylene glycol and PET Coke as CRR energy sources.
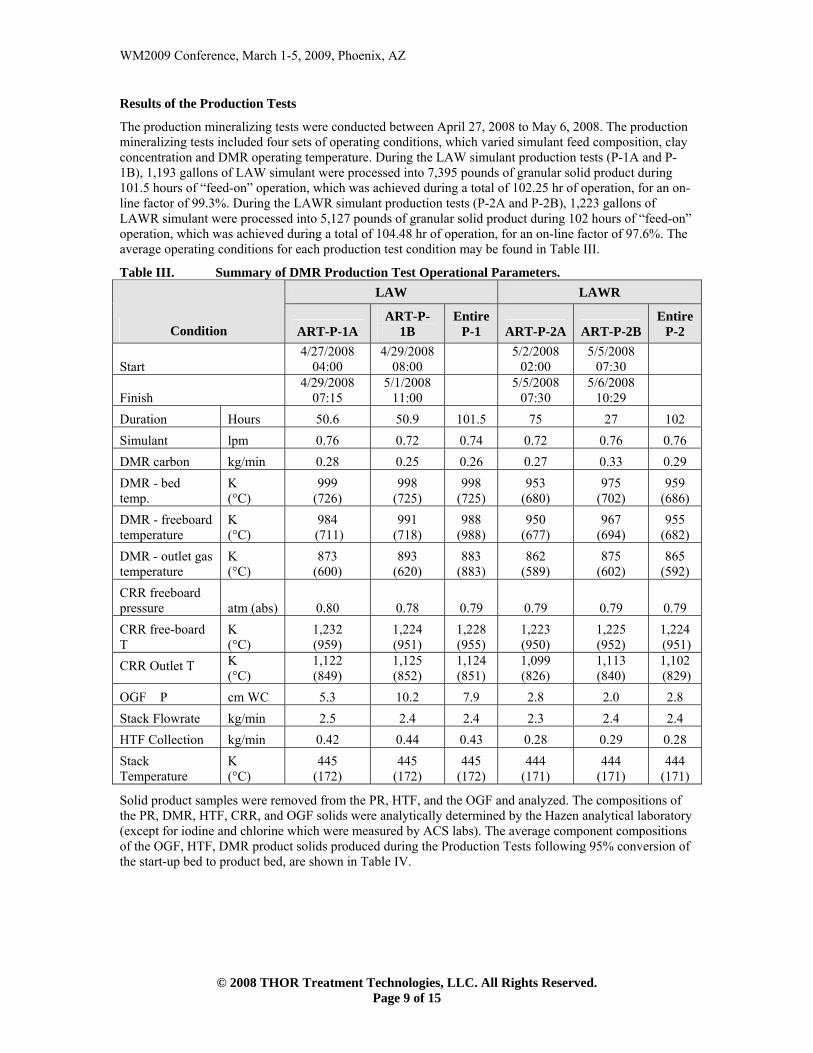
The production mineralizing tests were conducted between April 27, 2008 to May 6, 2008. The production mineralizing tests included four sets of operating conditions, which varied simulant feed composition, clay concentration and DMR operating temperature. During the LAW simulant production tests (P-1A and P-1B), 1,193 gallons of LAW simulant were processed into 7,395 pounds of granular solid product during 101.5 hours of “feed-on” operation, which was achieved during a total of 102.25 hr of operation, for an on-line factor of 99.3%. During the LAWR simulant production tests (P-2A and P-2B), 1,223 gallons of LAWR simulant were processed into 5,127 pounds of granular solid product during 102 hours of “feed-on” operation, which was achieved during a total of 104.48 hr of operation, for an on-line factor of 97.6%. The average operating conditions for each production test condition may be found in Table III.
Table III. Summary of DMR Production Test Operational Parameters.
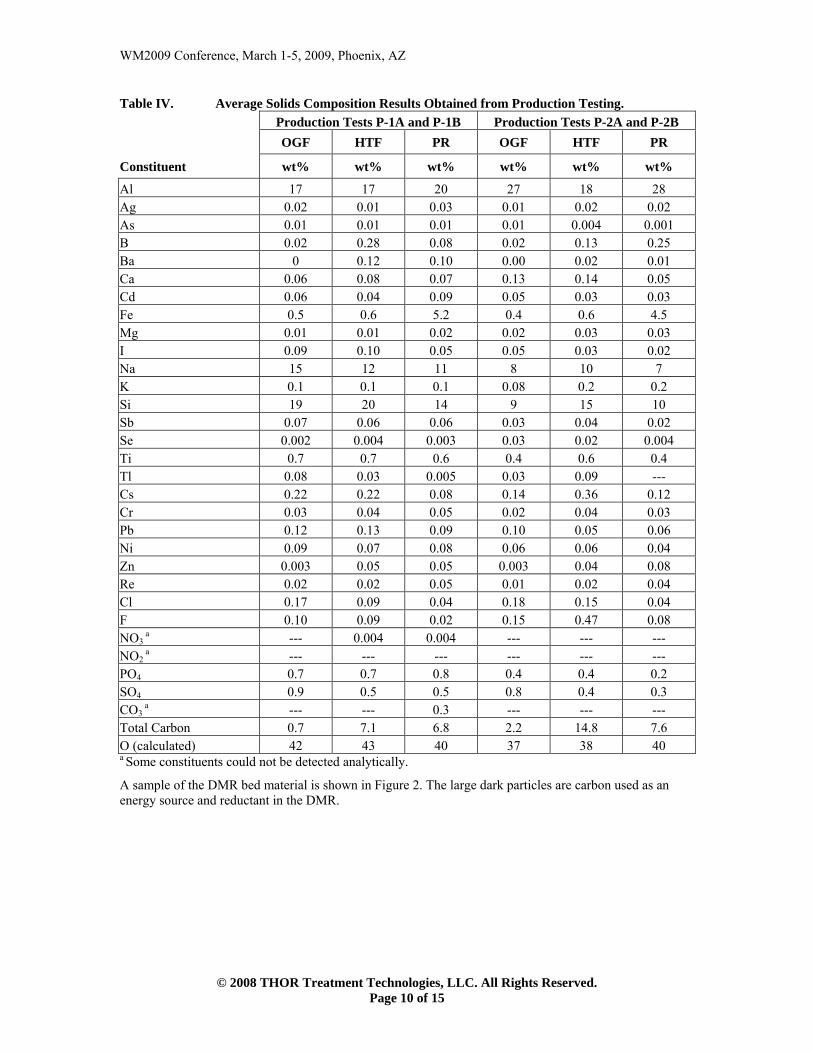
Solid product samples were removed from the PR, HTF, and the OGF and analyzed. The compositions of the PR, DMR, HTF, CRR, and OGF solids were analytically determined by the Hazen analytical laboratory (except for iodine and chlorine which were measured by ACS labs). The average component compositions of the OGF, HTF, DMR product solids produced during the Production Tests following 95% conversion of the start-up bed to product bed, are shown in Table IV.
a --- --- 0.3 --- --- --- Total Carbon 0.7 7.1 6.8 2.2 14.8 7.6 O (calculated) 42 43 40 37 38 40 a Some constituents could not be detected analytically.
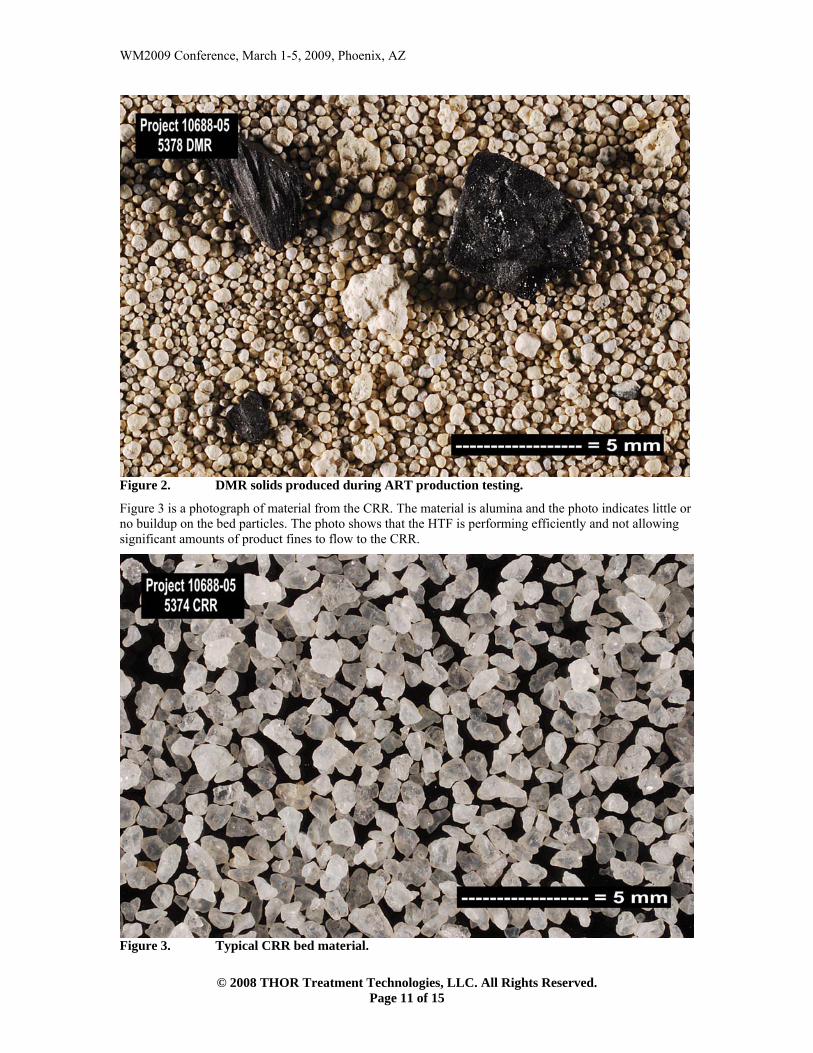
A sample of the DMR bed material is shown in Figure 2. The large dark particles are carbon used as an energy source and reductant in the DMR.
Figure 2. DMR solids produced during ART production testing.
Figure 3 is a photograph of material from the CRR. The material is alumina and the photo indicates little or no buildup on the bed particles. The photo shows that the HTF is performing efficiently and not allowing significant amounts of product fines to flow to the CRR.
The initial component composition analyses and PCT tests (ASTM 1285) have been completed by Savannah River Nuclear Solutions (SRNS) on the granular product. Each constituent’s release rate is consistent over the range of operating conditions and quantity of additive.
Table V. Average PCT Test Constituent Release Data for LAW and LAW Recycle Steam Reforming Process Products.
Test Condition Normalized Release (g/m2) – PCT Test Results
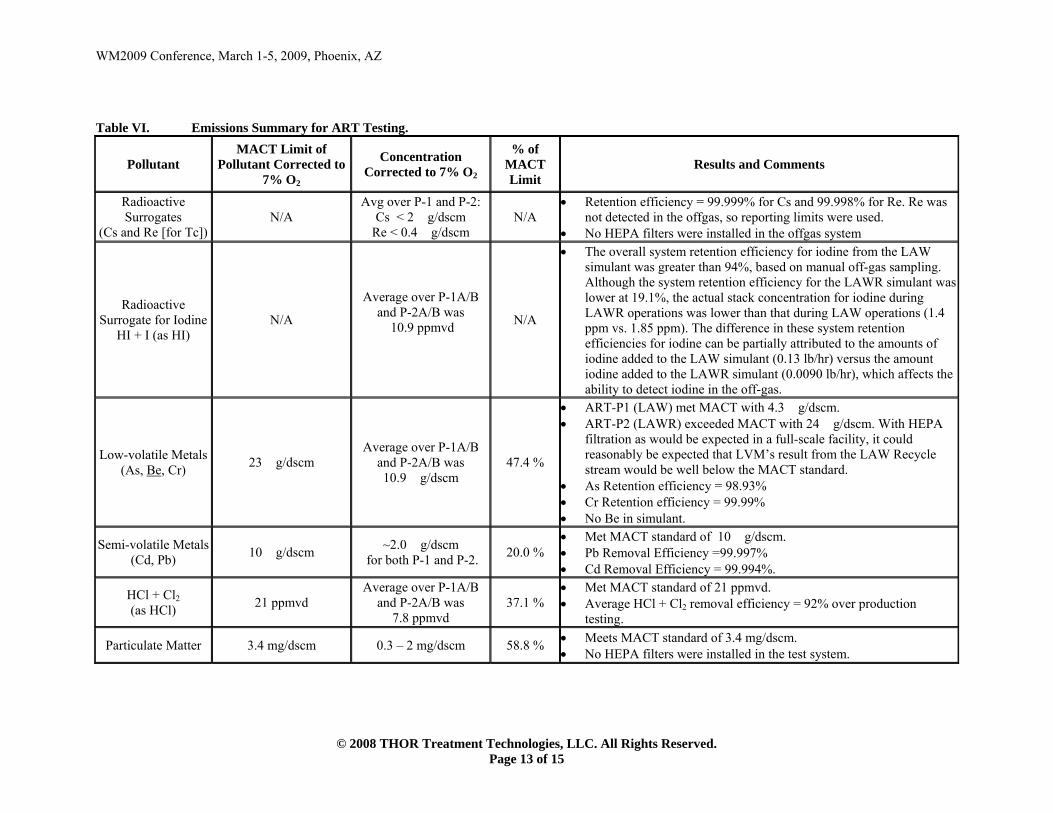
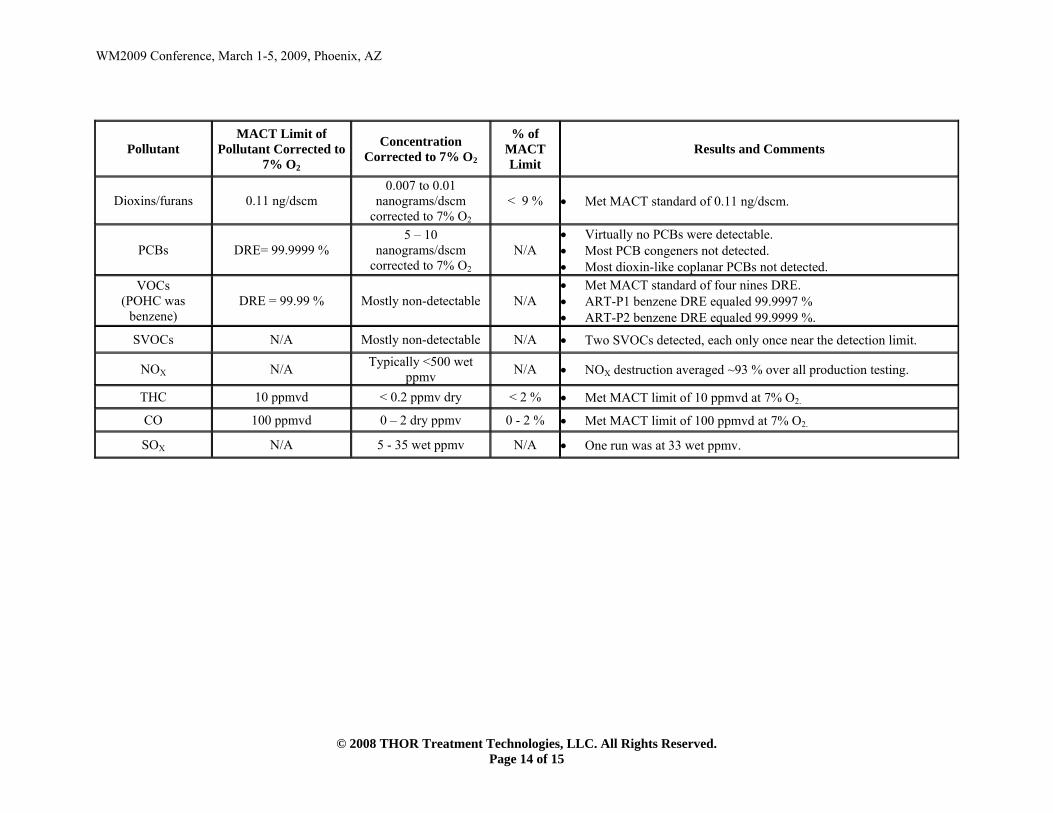
For both test phases, gaseous grab samples were obtained from the stack using formal EPA methods. Analysis of off-gas data collected from the CEMS and the EPA protocol grab samples during production testing indicates that a production-scale process would meet all applicable environmental discharge limits. These include Maximum Achievable Control Technology (MACT) limits for metals, HCl/Cl2, particulate matter, dioxins/furans, VOC’s, SVOC’s, THC, and CO, as well as the site discharge limits for NOX and SOX. A summary of the emissions data from ART testing is shown in Table VI.
WM2009 Conference, March 1-5, 2009, Phoenix, AZ
Table VI. Emissions Summary for ART Testing.
Pollutant MACT Limit of
Pollutant Corrected to 7% O2
Concentration Corrected to 7% O2
% of MACT Limit
Results and Comments
Radioactive Surrogates
(Cs and Re [for Tc]) N/A
Avg over P-1 and P-2: Cs < 2 �g/dscm
Re < 0.4 �g/dscm N/A
Retention efficiency = 99.999% for Cs and 99.998% for Re. Re was not detected in the offgas, so reporting limits were used.
No HEPA filters were installed in the offgas system
Radioactive Surrogate for Iodine
HI + I (as HI) N/A
Average over P-1A/B and P-2A/B was
10.9 ppmvd
N/A
The overall system retention efficiency for iodine from the LAW simulant was greater than 94%, based on manual off-gas sampling. Although the system retention efficiency for the LAWR simulant was lower at 19.1%, the actual stack concentration for iodine during LAWR operations was lower than that during LAW operations (1.4 ppm vs. 1.85 ppm). The difference in these system retention efficiencies for iodine can be partially attributed to the amounts of iodine added to the LAW simulant (0.13 lb/hr) versus the amount iodine added to the LAWR simulant (0.0090 lb/hr), which affects the ability to detect iodine in the off-gas.
Low-volatile Metals (As, Be, Cr)
23 �g/dscm Average over P-1A/B
and P-2A/B was 10.9 �g/dscm
47.4 %
ART-P1 (LAW) met MACT with 4.3 �g/dscm. ART-P2 (LAWR) exceeded MACT with 24 �g/dscm. With HEPA
filtration as would be expected in a full-scale facility, it could reasonably be expected that LVM’s result from the LAW Recycle stream would be well below the MACT standard.
As Retention efficiency = 98.93% Cr Retention efficiency = 99.99% No Be in simulant.
Semi-volatile Metals (Cd, Pb)
10 �g/dscm ~2.0 �g/dscm
for both P-1 and P-2. 20.0 %
Met MACT standard of 10 �g/dscm. Pb Removal Efficiency =99.997% Cd Removal Efficiency = 99.994%.
HCl + Cl2 (as HCl)
21 ppmvd Average over P-1A/B
and P-2A/B was 7.8 ppmvd
37.1 % Met MACT standard of 21 ppmvd. Average HCl + Cl2 removal efficiency = 92% over production
testing.
Particulate Matter 3.4 mg/dscm 0.3 – 2 mg/dscm 58.8 % Meets MACT standard of 3.4 mg/dscm. No HEPA filters were installed in the test system.
N/A Virtually no PCBs were detectable. Most PCB congeners not detected. Most dioxin-like coplanar PCBs not detected.
VOCs (POHC was
benzene) DRE = 99.99 % Mostly non-detectable N/A
Met MACT standard of four nines DRE. ART-P1 benzene DRE equaled 99.9997 % ART-P2 benzene DRE equaled 99.9999 %.
SVOCs N/A Mostly non-detectable N/A Two SVOCs detected, each only once near the detection limit.
NOX N/A Typically <500 wet
ppmv N/A NOX destruction averaged ~93 % over all production testing.
THC 10 ppmvd < 0.2 ppmv dry < 2 % Met MACT limit of 10 ppmvd at 7% O2.
CO 100 ppmvd 0 – 2 dry ppmv 0 - 2 % Met MACT limit of 100 ppmvd at 7% O2.
SOX N/A 5 - 35 wet ppmv N/A One run was at 33 wet ppmv.
WM2009 Conference, March 1-5, 2009, Phoenix, AZ
CONCLUSION
The ESTD demonstrated the capability of the integrated THOR® steam reforming process to convert Hanford LAW and LAW Recycle simulants in a variety of formulations, including heavy metals, and organic contaminants, into solid mineral products in a safe, efficient, robust, and sustainable manner. Gaseous emissions from the process were found to be within regulatory limits, with the only exceedence being 1 �g/dscm on LVM during the LAW Recycle test. With HEPA filtration that would be present in a full-scale facility, it could reasonably be expected that LVMs resulting from the LAW Recycle stream would be well below the MACT standard.
REFERENCES
1 A. L. OLSON, N. R. SOELBERG, D. W. MARSHALL, G. L. ANDERSON, “Fluidized Bed Steam Reforming of Hanford LAW Using THORsm Mineralizing Technology,” INEEL/EXT, 04, 02492, Idaho National Engineering and Environmental Laboratory, November 2004
2 C. M. JANTZEN, “Engineering Study of the Hanford Low Activity Waste (LAW) Steam Reforming Process (U),” WSRC, TR, 2002, 00317, Rev. 0, Savannah River Technology Center, July 12, 2002.
3 D. W. MARSHALL, N. R. SOELBERG, K. M. SHABER, “THOR® Bench, Scale Steam Reforming Demonstration,” INEEL/EXT, 03, 00437, Idaho National Engineering and Environmental Laboratory, May 2003. (Phase 1 Report )
4 B. P. MCGRAIL, et al., “Initial Suitability Evaluation of Steam, Reformed Low Activity Waste for Direct Land Disposal,” PNWD, 3288, WTP, RPT, 097, Rev. 0, Battelle, Pacific Northwest Division, January 2003.
5 B. P. MCGRAIL, “Laboratory Testing of Bulk Vitrified and Steam, Reformed Low, Activity Forms to Support a Preliminary Assessment for an Integrated Disposal Facility,” PNNL, 14414, Pacific Northwest National Laboratory, September 2003.
6 F. M. MANN, “Risk Assessment Supporting the Decision on the Initial Selection of Supplemental ILAW Technologies,” RPP, 17675, Rev. 0, CH2MHILL Hanford Group, Inc., September 29, 2003.
7 C. M. JANTZEN, “Characterization and Performance of Fluidized Bed Steam Reforming (FBSR) Product as a Final Waste Form (U),” WSRC, MS, 2003, 00595, Revision 0, Savannah River National Laboratory.
8 B. P. MCGRAIL, D. H. BACON, R. J. SERNE, K. M. KRUPKA, R. J. PUIGH, R. KHALEEL, AND S. FINFROCK, “Risk Assessment Supporting the Decision on the Initial Selection of Supplemental ILAW Technologies”, F. M. Mann, CH2M Hill Hanford Group, Inc., Pacific Northwest National Laboratory and Fluor Federal Services, Inc., RPP, 17675, Rev. 0, September 2003.
9 “Pilot Plant Report for Treating Sodium-Bearing Waste Surrogates—Carbonate Flowsheet”, Idaho Cleanup Project, Integrated Waste Treatment Unit, Project Number 28276, Document Number RT-ESTD-PMR-001, Revision 0, Idaho Cleanup Project, THOR Treatment Technologies and Washington Group International, October 2006.
10 JANTZEN, C.M., Characterization and Performance of Fluidized Bed Steam Reforming (FBSR) Product as a Final Waste Form, WSRC-MS-2003-00595, Rev. 0, Environmental Issues and Waste Management Technologies IX, J.D. Vienna and D.R. Spearing (Eds.); Ceramic Transactions 155, 319-329, 2004.
11 BURKETT, P.R., J.C. MARRA, J.M PARIEZS, and C.M. JANTZEN, Evaluation of Fluidized Bed Steam Reforming (FBSR) Technology for Sodium-Bearing Wastes from Idaho and Hanford Using the Bench-Top Steam Reformer (BSR) (U), WSRC-TR-2004-00560, Rev 0, February 2005.


![Oxidative Steam Reforming of Bioethanol over …...as a support in the ethanol steam-reforming reactions [17]. Rh, Ru and Abstract Oxidative steam reforming of ethanol for hydrogen](https://static.documents.pub/doc/80x56/5e780744e9502758d52e3186/oxidative-steam-reforming-of-bioethanol-over-as-a-support-in-the-ethanol-steam-reforming.jpg)


